Article

Enhanced Uptake and Phototoxicity of C60@albumin Hybrids by Folate Bioconjugation

Dipartimento di Chimica “Giacomo Ciamician”, Alma Mater Studiorum-Università di Bologna, Via Francesco Selmi 2, 40126 Bologna, Italy
*
Authors to whom correspondence should be addressed.
Nanomaterials 2022, 12(19), 3501; https://doi.org/10.3390/nano12193501
Submission received: 24 August 2022 / Revised: 23 September 2022 / Accepted: 28 September 2022 / Published: 6 October 2022
(This article belongs to the Special Issue Nanomaterials in Biological Systems: Opportunities and Challenges)

Abstract

:
Fullerenes are considered excellent photosensitizers, being highly suitable for photodynamic therapy (PDT). A lack of water solubility and low biocompatibility are, in many instances, still hampering the full exploitation of their potential in nanomedicine. Here, we used human serum albumin (HSA) to disperse fullerenes by binding up to five fullerene cages inside the hydrophobic cavities. Albumin was bioconjugated with folic acid to specifically address the folate receptors that are usually overexpressed in several solid tumors. Concurrently, tetramethylrhodamine isothiocyanate, TRITC, a tag for imaging, was conjugated to C60@HSA in order to build an effective phototheranostic platform. The in vitro experiments demonstrated that: (i) HSA disperses C60 molecules in a physiological environment, (ii) HSA, upon C60 binding, maintains its biological identity and biocompatibility, (iii) the C60@HSA complex shows a significant visible-light-induced production of reactive oxygen species, and (iv) folate bioconjugation improves both the internalization and the PDT-induced phototoxicity of the C60@HSA complex in HeLa cells.

1. Introduction

Fullerenes have attracted much attention as potential PDT photosensitizers for use as antimicrobial and anticancer therapies [1,2,3,4,5]. Compared with the photosensitizers commonly used in PDT [6,7], fullerenes have several advantages that include:
(i) A higher photostability and lower photobleaching than conventional dyes;
(ii) An ability to generate reactive oxygen species (ROS) following both type I and type II photophysical mechanisms, while conventional dyes primarily follow the type II process;
(iii) A high efficacy of ROS production, with a quantum yield of 1O2 generation that is close to unity.
However, the use of fullerenes in PDT still has significant practical limitations due to the lack of water solubility and their low biocompatibility [1,2,3,4,5]. Another key component of the efficacious use of fullerenes in PDT is their monomolecular dispersion in solution. Indeed, aggregation is a well-known element that causes fullerenes to be inactive as photosensitizers [8,9,10]. The characteristics of the fullerene dispersion affect its photophysical and photochemical properties at the molecular level [11]. The crucial intermediate 3C60*, which produces ROS, interacting with the ground state of molecular oxygen, is extremely environment-sensitive [8,9,10,11]. Aggregation significantly quenches or shortens the lifespan of the long-lived triplet excited state, which lowers the efficiency of the ROS generation [11]. In addition, aggregation phenomena also decrease the surface area of C60 that comes into contact with oxygen and actively produces ROS [8,9,10,11].
Supramolecular hosts can be used to efficiently disperse fullerenes in aqueous media without any modification of their molecular structures. In particular, fullerenes can be dispersed as single molecules in physiological contexts, avoiding aggregation, by using biomolecules [4], such as proteins and peptides [12,13,14,15,16,17,18,19,20,21]. Proteins play a role similar to that of “Trojan Horses” [22], since they (i) can disperse fullerenes, hiding the cages inside their cavities, and (ii) regulate their cellular uptake, maintaining their biological identity.
Albumins are ideal protein carriers for therapeutic agents and photosensitizers because of their unique properties, such as biocompatibility, biodegradability, their absence of toxicity, non-immunogenicity and long blood circulation [23,24,25,26,27,28]. Human serum albumin (HSA) is a single-chain protein with a molecular weight of 66.7 kDa, composed of 585 amino acids [23,24,25,26,27,28]. HSA is water-soluble and is the most abundant protein in human blood plasma, with a half-life of approximately 21 days [23,24,25,26,27,28]. HSA is the natural carrier of hydrophobic molecules in the blood. Albumins have already demonstrated their ability to interact with fullerene derivatives [29,30,31,32,33,34,35,36,37,38,39,40,41,42,43,44]. HSA exhibits passive tumor targeting due to its enhanced permeability and retention (EPR) effect. As a result of the leaky vasculature and lack of lymphatic drainage in tumor tissues, HSA can extravasate and accumulate in the tumor tissue, reaching high intratumor concentrations [23,24,25,26,27,28]. Additionally, two albumin-binding proteins, gp60 (a 60 kDa albumin-binding glycoprotein) and the albumin-binding protein SPARC (secreted protein acidic and rich in cysteine), also facilitate the absorption and retention of albumin in cancer cells via active targeting [23,24,25,26,27,28]. Albumin can also be functionalized using targeting ligands to specifically address the overexpressed receptors on the surface of cancer cells, i.e., EGFR [45], folate receptors (FR) [46] or interleukin-13 alpha 2 receptor (IL13Rα2) [47]. In particular, folate receptors are glycoproteins (35–40 kDa), which are widely overexpressed on the surfaces of numerous cancer cells, such as the ovarian, triple-negative breast and lung [46,48]. As a result, the folate receptors represent a natural choice for the development of cancer-targeted delivery systems [46,48].
Here, we demonstrated that HSA can bind and monomolecularly disperse C60 in physiological conditions. The resulting C60@HSA complex is strongly photoactive, producing large numbers of ROS (following both type I and type II photophysical mechanisms) when exposed to visible light. In addition, since the protein platform offers a variety of chemical groups for functionalization, the performance of the C60@HSA biohybrids can also be improved by attaching i) folate molecules to selectively target the folate receptors, enhancing cellular uptake, or ii) imaging tags, such as TRITC, to build phototheranostic platforms [20,26,49]. The PDT-killing activity of C60@HSA, and especially that of C60@HSA-folate, can be observed in HeLa cells upon light irradiation, while the hybrids are completely biocompatible in dark conditions.

2. Materials and Methods

2.1. Synthesis and Characterization of the Biohybrids

2.1.1. Materials

Human serum albumin (HSA) (Cat. No. A3782), folic acid (FA) (Cat. No. F7876), N-hydroxysulfosuccinimide sodium salt (NHS) (Cat. No. 56485), N-(3-dimethylaminopropyl)-N′-ethylcarbodiimide hydrochloride (EDC), 10-Acetyl-3,7-dihydroxyphenoxazine (Amplex Red) (Cat. No. 90101), type VI-A peroxidase from horseradish lyophilized powder (HRP) (Cat. no. P6782), hydrogen peroxide solution 30% (w/w) (Cat. No. 31642-M), 9,10-anthracenediylbis (methylene) dimalonic acid (ABMDMA) (Cat. No. 75068), deuterium oxide (Cat. No. 151882-100G), tetramethylrhodamine isothiocyanate mixed isomers (TRITC, Cat. No. 87918), Amicon Ultra centrifugal filters (MWCO 30 kDa, Millipore UFC503024) (Cat. No. Z677892-24EA), dimethyl sulfoxide (DMSO) (Cat. No. 472301), sodium chloride (Cat. No. S9888-M), potassium phosphate monobasic (Cat. No. P0662-M), sodium phosphate dibasic (Cat. No. S0876), potassium chloride (Cat. No. P3911M), sodium bicarbonate (Cat. No. 31437-M), sodium carbonate (Cat. No. 223530) and MWCO 14 kDa dialysis tubing cellulose membrane (Cat. No. D9652) were purchased from Sigma Aldrich (Merck). Milli-Q water was used for the preparation of all the aqueous solutions.

2.1.2. C60@HSA Synthesis and Purification

A total of 33 mg of HSA was dissolved in 5 mL of PBS. A total of 7.2 mg of C60 powder was added, and the solution was sonicated for two hours in an ice bath at 45% of the maximum amplitude with a tip sonicator Hielscher Ultrasonic Processor UP200St, equipped with a sonotrode S26d7. To remove the insoluble C60 aggregates, the resulting turbid brown mixture was centrifugated for 10 min at 10,000 rpm at room temperature, and the orange/yellow supernatant was collected. The recovered solution was then extensively dialyzed against 400 mL of PBS three times using cellulose membrane dialysis tubes with a 14 kDa cut-off.

2.1.3. Amplex Red Assay for Peroxides Quantification

The ability to generate peroxides in solution upon irradiation with visible light was evaluated using an Amplex Red fluorometric assay. HRP catalyzes the reaction between the colorless nonfluorescent Amplex Red and peroxides to form the colored and fluorescent resorufin. A total of 10 μL of Amplex Red 50 mM in DMSO was added to 1 mL of phosphate buffer of 50 mM, pH 7.4. Then, 10 μL of HRP of 0.4 mg/mL in PBS was added to the Amplex Red solution to obtain the final working solution. A total of 90 μL of the solutions under investigation, in phosphate buffer saline of 50 mM, pH 7.4, was irradiated for 10 min with visible light on 96-well microtiter plates (cold white LED, Valex, 30 W lamp at a distance of 30 cm from the plate, irradiation power density on the cell plate = 2.4 mW/cm2, measured with the photo-radiometer Delta Ohm LP 471 RAD). A total of 10 μL of Amplex Red working solution was added to each sample (and to the corresponding references, kept in the dark) immediately after irradiation. After 30 min of incubation at room temperature, the fluorescence of the samples was recorded at 590 nm, using 560 nm as the excitation wavelength. A calibration curve generated using standard solutions of H2O2 was used to convert the fluorescence signal to the peroxide concentration generated upon irradiation. Fluorescence measurements were carried out using a Perkin Elmer EnSpire® (Waltham, MA, USA) Multimode Plate Reader.

2.1.4. The 1O2 NIR Fluorometric Detection

Singlet oxygen emission spectra were recorded with an Edinburgh FLS920 spectrofluorometer equipped with a Ge detector for emissions in the NIR spectral region. The sample buffer was exchanged for deuterated PBS (prepared in D2O) using Amicon Ultra-0.5 centrifugal filter units (MWCO 30 kDa) for three cycles, restoring the initial volume of the samples. Emissions were recorded in the 1100–1500 nm spectral range in aerobic conditions, with an excitation wavelength of 514 nm. A correction of the emission spectra for the detector sensitivity was performed.

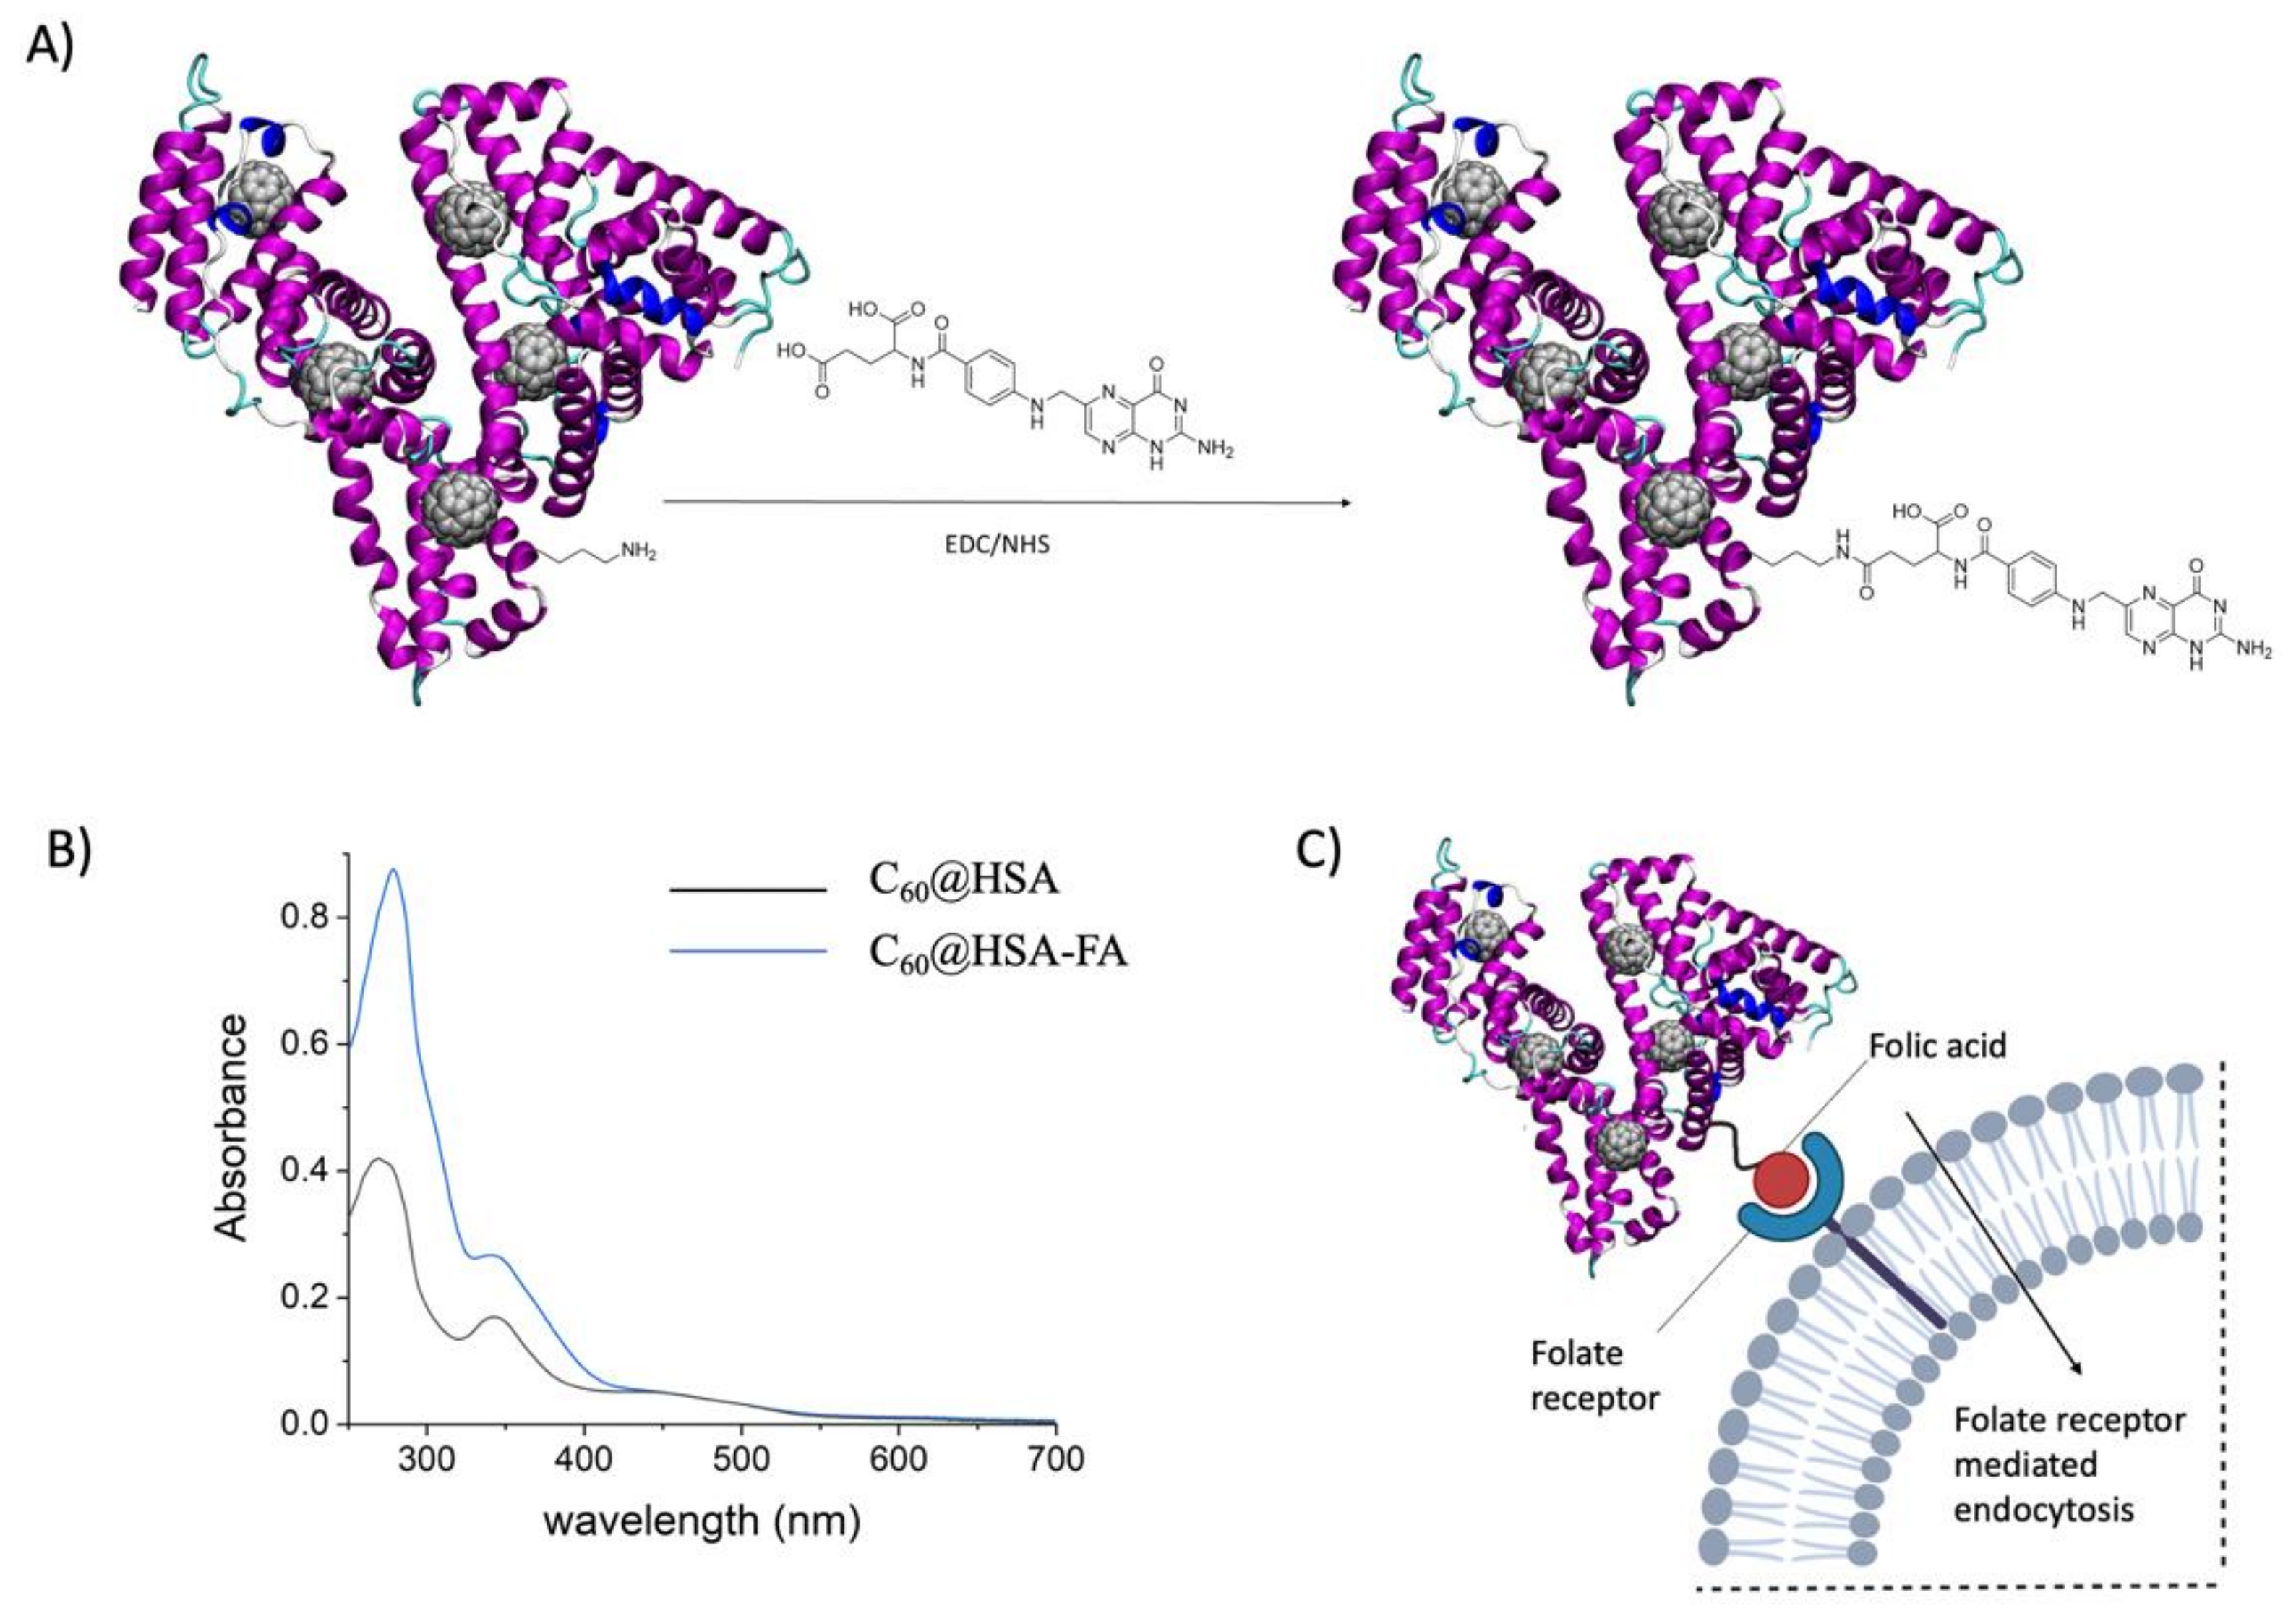
2.1.5. C60@HSA-FA Synthesis and Purification

A total of 5 mg of folic acid was dissolved in 0.5 mL of DMSO. The solution was mixed with vortex for one hour until complete dissolution was achieved. A total of 6 mg of EDC and 2 mg of NHS were then added. The solution was mixed for a further 5 h in the dark. A total of 200 μL of this solution was added dropwise to the C60@HSA solution under vigorous stirring (1000 rpm). At the end of the addition, the solution was kept under moderate stirring overnight in the dark. The day after, the solution was filtered with a 200 nm RC syringe filter. The solution was then dialyzed against 400 mL of PBS to remove unconjugated folate molecules and reaction coproducts. The dialysis cycles were stopped when no trace of folate was observed in the UV–Vis spectra of the dialysis waters.

2.1.6. C60@HSA-FA-TRITC Synthesis and Purification

TRITC was dissolved in DMSO to obtain a 5 mM stock solution. A total of 20 μL of this solution was then added dropwise to 380 μL of the C60@HSA and C60@HSA-FA solutions (both 50 μM in 100 mM sodium carbonate buffer, pH 9). The mixture was then incubated overnight at 25 °C under continuous shaking at 700 rpm (ThermoMixer HC, S8012-0000; STARLAB, Hamburg, Germany). To remove the unconjugated TRITC, the bioconjugates were dialyzed using 10 mM sodium carbonate buffer (pH 9) and using a cellulose membrane. The UV–Vis spectra of the dialysate were obtained to monitor the purification process. To remove the alkaline buffer, the last dialysis cycle was performed against PBS.

2.1.7. Characterization of the HSA Bioconjugates

The absorption spectra were recorded using a Cary60 UV–Vis spectrophotometer (Agilent).
Mass spectra were acquired using ACQUITY UPLC equipped with a BEH300 C4 column (2.5 µm, 4.6 × 150 mm, Waters Corporation, Milford, Worcester, MA, USA) and coupled with an ESI-QTOF mass spectrometer (Waters Corporation, Milford, Worcester, MA, USA). The concentration of the protein bioconjugates was 100 μM. The samples were injected at a flow rate of 0.2 mL/min and eluted by a gradient elution (phase A: 0.1% formic acid in H2O, phase B: 0.1% formic acid in ACN; 0 min 80%A 20%B, 30 min 30%A 70%B, 31 min 80%A 20%B, 50 min 80%A 20%B; column temperature 40 °C). Positive-ion ESI mass spectra were acquired using a capillary voltage of 3 kV, a sample cone of 50 V and a desolvation gas flow of 800 l/h. The source and desolvation temperatures were 150 and 350 °C, respectively. All spectra were acquired in the range of m/z 50–2000. Raw data were background-subtracted and deconvoluted using Unidec software in the range of m/z 1000–2000.
Agarose gel electrophoresis was performed using an Owl Easycast B-Series Horizontal Gel Systems Model B2. The electrophoresis was performed using a 0.5 cm thick 1% agarose gel. PBS was used as the sample buffer and Tris-glycine at pH 7.4 was used as the running buffer. A total of 15 μg of protein conjugates, containing 20% v/v of glycerol, were loaded into each well. The run was performed by applying a potential of 100 V.
Dynamic light scattering (DLS) measurements were performed using a Malvern Instruments DLS ZetaSizer Nano-ZS. DLS measurements were carried out using a concentration of the protein bioconjugates of 5μM in PBS at room temperature.
The stability of the bioconjugates was evaluated over 3 h (the incubation time used for the in vitro experiments) at 37 °C in PBS by UV–Vis measurements following the absorbance of the fullerene diagnostic band at 341 nm. The concentration of all the protein bioconjugates was 5 μM.

2.2. Computational Details

2.2.1. Docking

The crystal structure of HSA (PDB ID: 1N5U) was downloaded from the Protein Data Bank (PDB) and used for the docking calculations. Docking models were obtained using the PatchDock algorithm, which computes the shape complementarity between two entities (ligand and receptor), minimizing the number of steric clashes. PatchDock (i) assigns concave, convex or flat patches to the ligand and receptor surfaces; (ii) matches concave–convex/flat–flat and generates a set of candidate transformations; and (iii) ranks the different poses, using a scoring function that takes in account the shape complementarity and the atomic desolvation energy of the complex (the most important terms in the case of fullerenes). The first 15 docking poses were selected for the minimization, equilibration and MD trajectory production stage. Using these 15 MD trajectories, the binding affinity was calculated using the MM/GBSA protocol, and the best five binding sites were determined.

2.2.2. Minimization and MD Simulations

The Amber ff14SB force field was used to model the HSA. THe C60 carbon atoms were modelled as uncharged Lennard-Jones particles using sp2 carbon parameters taken from the GAFF force field. A total of 500 steps of steepest descent minimization, followed by an additional 9500 steps of conjugate gradient minimization, were performed with PMEMD for the 15 selected poses. The minimized structures were used as starting points for the equilibration process. Periodic boundary conditions (PBC) and the particle mesh Ewald summation were used throughout (with a cut-off radius of 10.0 Å). H-atoms were considered using the SHAKE algorithm and a time step of 2 fs was applied in all the MD runs. The MD simulations were carried out using an explicit solvent (TIP3P water model). Sodium counterions were included to precisely neutralize the charge of the system. Then, we applied 10 ns of heating to 298 K using an NPT ensemble and temperature coupling according to Andersen in order to equilibrate the system. This was followed by 100 ns of the MD trajectories. Snapshot structures were saved into individual trajectory files every 1000 time steps, i.e., every 2 ps of the molecular dynamics.

2.2.3. Molecular Mechanics/Generalized Born Surface Area (MM/GBSA) Analysis

A total of 1000 frames were extracted from the MD simulations and used for the MM/GBSA analysis. An infinite cut-off was used for all the interactions. The electrostatic contribution to the solvation free energy was calculated using the generalized Born (GB) model, as implemented in MMPBSA.py. The nonpolar contribution to the solvation free energy was determined using solvent-accessible, surface-area-dependent terms.

2.3. Cellular Experiments

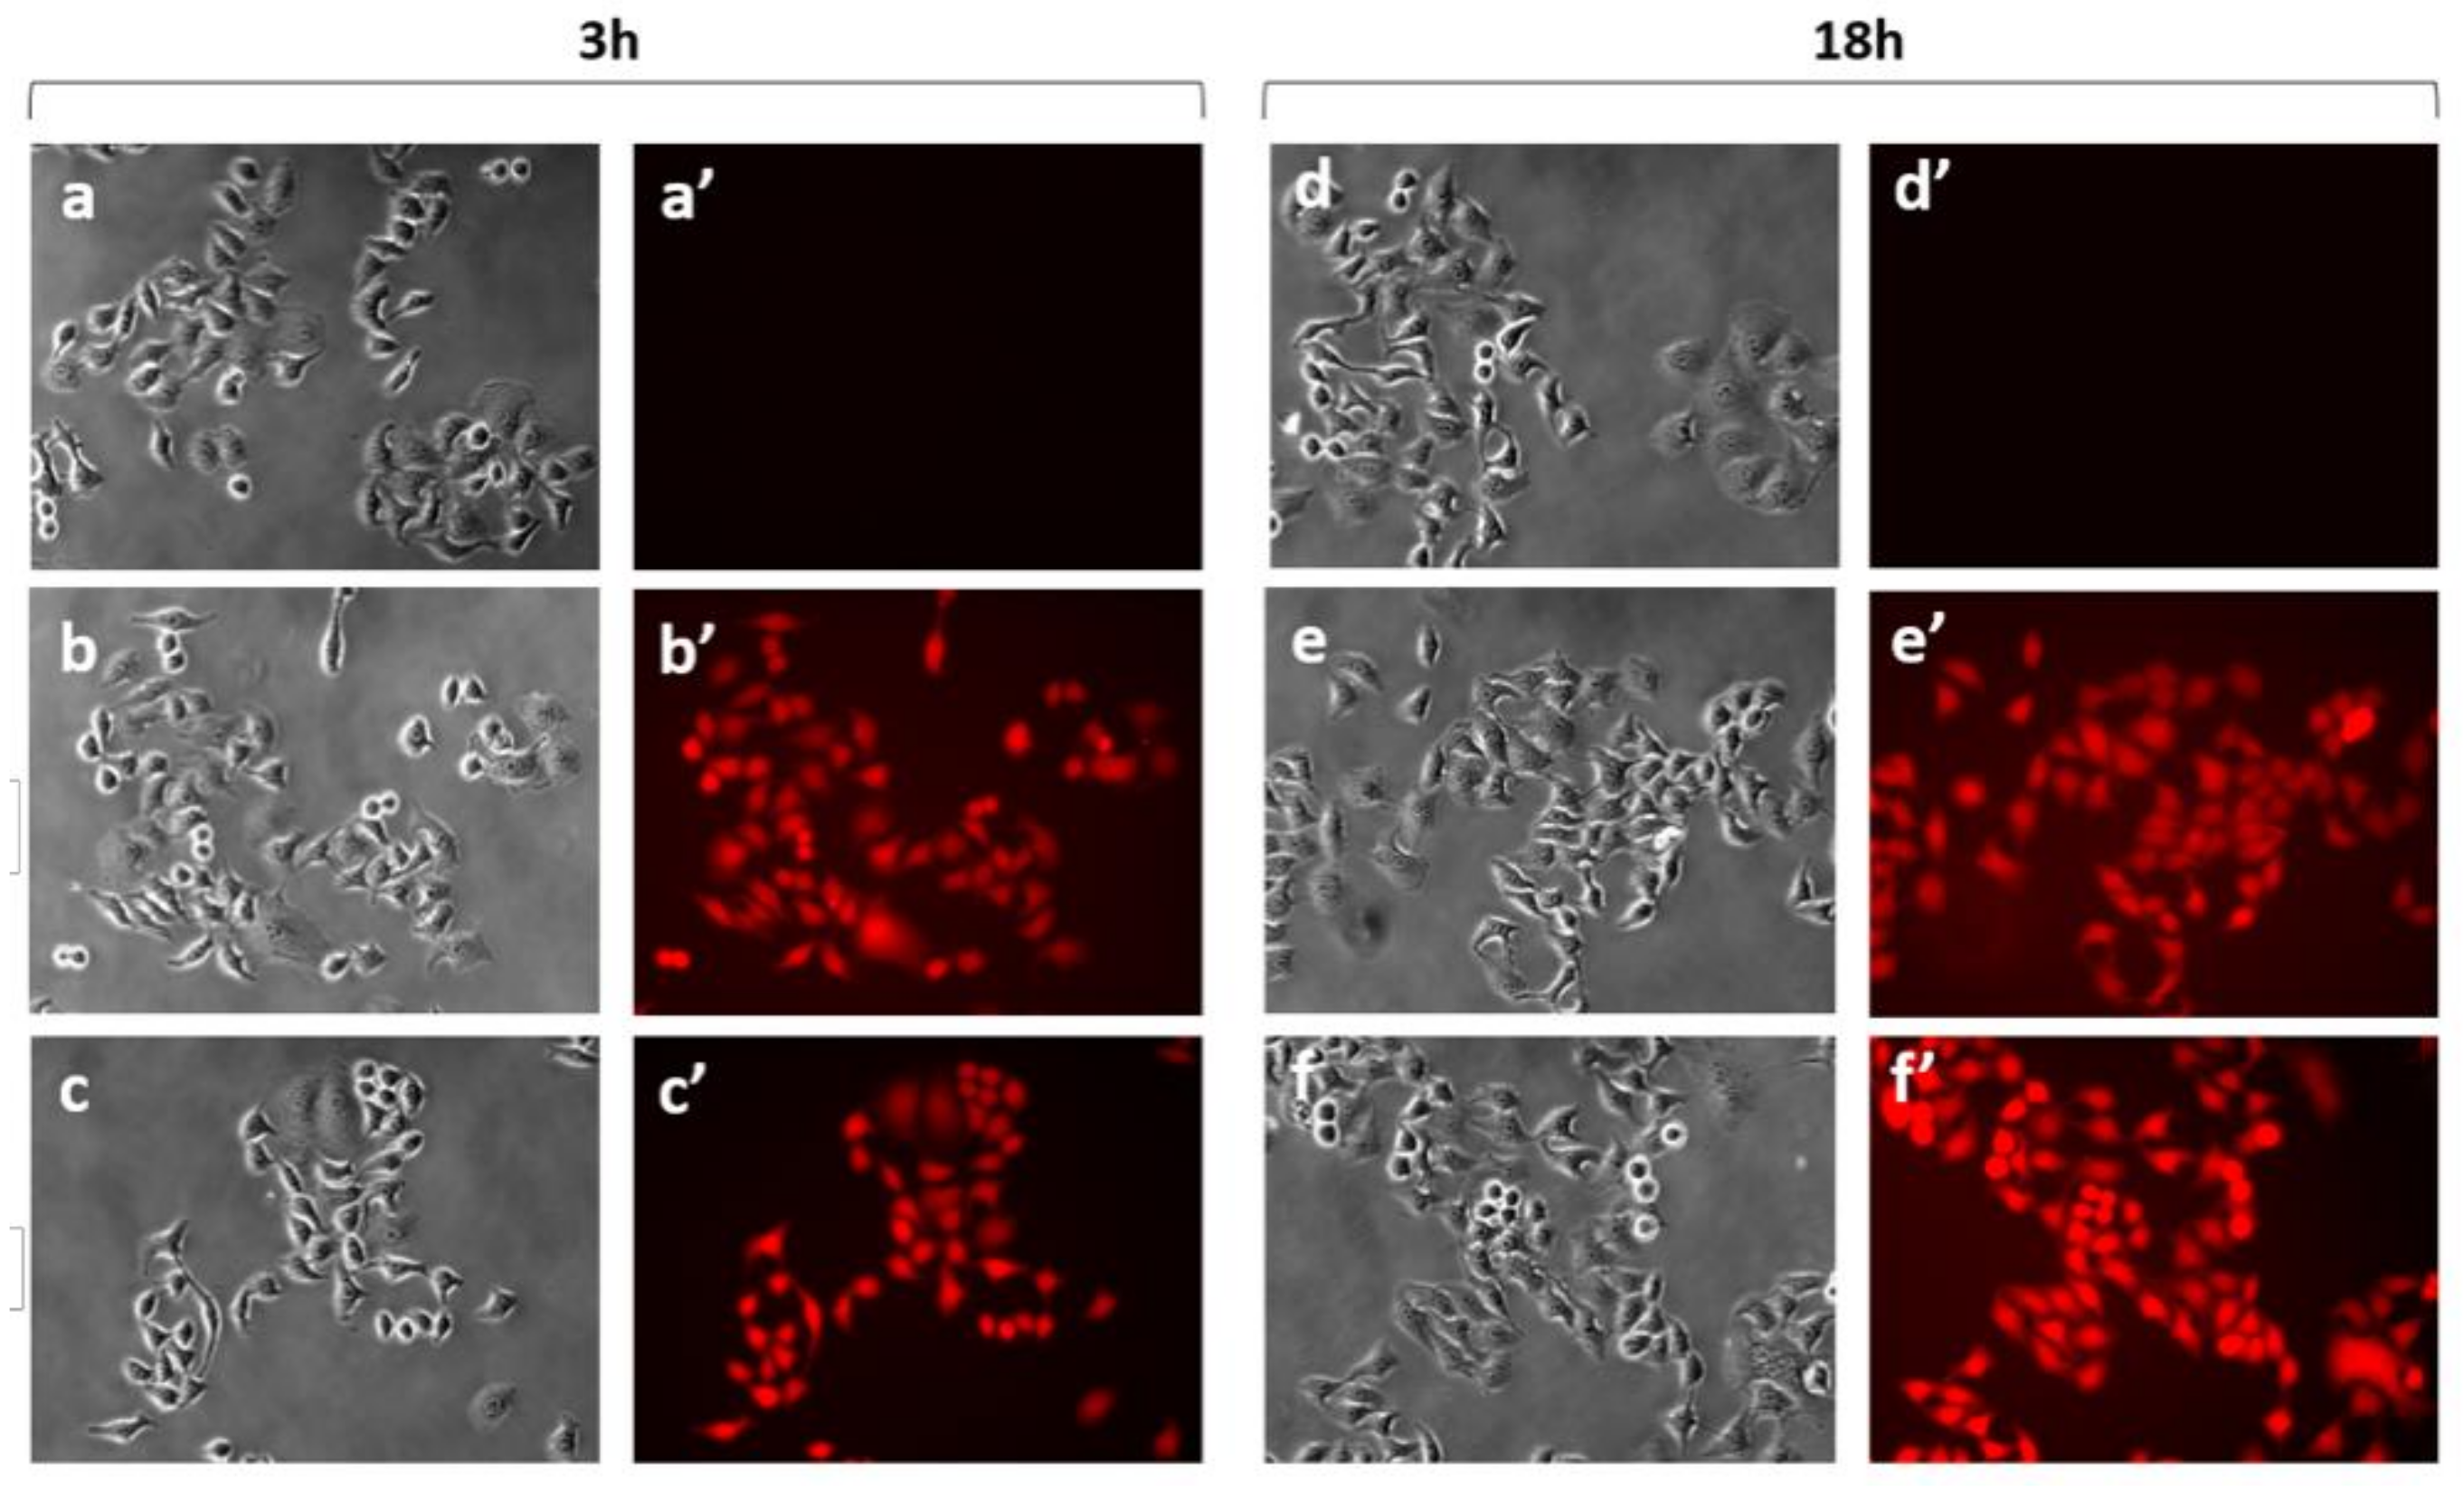
2.3.1. Internalization Studies of C60@HSA-TRITC and C60@HSA-FA-TRITC

HeLa cells (ATCC reference number: CCL-2) were cultured at 37 °C and in 5% CO2 in DMEM (Dulbecco’s Modified Eagle Medium; ThermoFisher Scientific, Waltham, MA, USA, 21969035) supplemented with 10% fetal bovine serum (South America), 2 mM L-glutamine, 50 U/mL penicillin and 50 µg/mL streptomycin. For the C60@HSA-TRITC and C60@HSA-FA-TRITC internalization experiments, 50.000 HeLa cells were plated on each 3.5 cm-diameter Petri dish and grown overnight in the incubator, and the cell density was evaluated as previously reported [50]. The day after the cell plating, the growing medium was substituted for a fresh one, supplemented with 3.5 µM C60@HSA-TRITC and C60@HSA-FA-TRITC. For the control samples (i.e., HeLa cells not incubated with any C60@HSA derivatives), the growing medium was replaced with a fresh one without further supplementation. After 3 and 18 h of incubation with the C60@HSA-TRITC and C60@HSA-FA-TRITC, the medium was discharged, and the samples were washed with PBS supplemented with calcium and magnesium (ThermoFisher product number: 14040091) and measured in the presence of Hanks Balanced Salt Solution (HBSS; Sigma Aldrich product number H8264). Each sample was washed just before the acquisition of the fluorescence and phase contrast data. For each sample, 3 fields of view with a 20× magnification were used for both the phase contrast and fluorescence (Nikon Texas Red HYQ cubic filter (λ excitation = 532–587 nm, λ emission = 608–683 nm)) images, for which a Nikon Eclipse Ti inverted microscope was employed. The internalization of the C60@HSA derivatives was quantified by determining the average pixel intensity of the manually selected region of interests (ROIs) in each fluorescence image using Fiji (ImageJ) software [51]. The ROIs were drawn by contouring the region of each cell in a fluorescence image using a phase contrast image as the reference. For each image, the basal mean fluorescence was determined as the average of 3 ROIs drawn in the regions of the image with no cells, while the mean basal fluorescence was subtracted to obtain the mean fluorescence value of each cell ROI. The statistical analysis was performed with Origin 2019b software by two-tailed t-test analysis (considering populations with different variances) and ANOVA two-way analysis.

2.3.2. Cytotoxicity and Photodynamic Activity of C60@HSA and C60@HSA-FA

The photodynamic activity of C60@HSA and C60@HSA-FA was evaluated on HeLa cells, which were plated at a density of 2·104 cells per well on 48-well plates. Incubation for 3 h (37 °C, 5% CO2) in dark conditions was performed using different concentrations of C60@HSA and C60@HSA-FA. Before light treatment, the cells were washed using PBS. Samples were irradiated for 10 min with a white light source kept at a distance of 30 cm from the cell-plate. The irradiation power density of the cell plate was 2.4 mW/cm2 (measured with the photo-radiometer Delta Ohm LP 471 RAD). In parallel, the control samples were left in the same environmental conditions but in the absence of any exposure to light (i.e., dark conditions). After 24 h of further incubation, upon photo-irradiation, the cell viability was quantified by MTT assay.

3. Results and Discussion

C60@HSA was synthesized by adding C60 powder to a HSA solution contained in an Eppendorf tube. The solution was ultrasonicated and centrifuged to remove the excess C60. A brown solution was obtained by collecting the supernatant. C60 is totally insoluble in water. The UV–Vis spectrum of the solution (Figure 1A) clearly showed the diagnostic band of the fullerene, centered at 341 nm, indicating its presence in the water solution and proving the formation of the C60@HSA complex.
The electrophoretic characterization of C60@HSA clearly confirmed the encapsulation of C60 in the protein (Figure S2). Considering the initial HSA concentration and the molar extinction coefficients of C60 (see SI for the determination of the binding stoichiometry), an average number of 4.3 fullerene molecules were identified, which were bound to a single HSA. This stoichiometry is not surprising, since albumin has seven hydrophobic fatty acid binding sites (FA1–FA7). Using a docking methodology used to recognize the sites of interaction between proteins and carbon nanomaterials [52,53,54,55,56,57,58,59,60], we docked C60 in the HSA crystal structure to identify the most probable C60 binding site in the HSA. We identified 15 possible C60 binding sites (see Figure S3). Starting with these poses, MD simulations were carried out, followed by MM/GBSA analysis of the trajectories, to obtain the binding energy of C60 in these pockets. The five most probable binding sites (Figure 1B) were identified: the Sudlow site 1 (FA7), the heme binding pocket (FA1), the albumin-binding side FA6, the Sudlow site 2 (FA3,4) and the albumin-binding side FA5. The fullerene cage consistently showed a strong shape complementarity with these HSA pockets (Figures S4–S8). Fullerene binding requires the existence of a hydrophobic cavity in the protein in order to accommodate the fullerene cage. A direct consequence is that van der Waals interactions are the most crucial term for the recognition and binding of C60 to HSA. Nonpolar solvation (the hydrophobic effect) assists with the binding, while polar solvation typically works against it. The contribution of each amino acid to the binding is determined by the decomposition analysis (fingerprint analysis) of the overall binding energy (see Figures S2–S6). The amino acids with the largest binding contributions are aromatic amino acids (Tyr 138, Tyr150, Tyr161, His 242), characterized by π-π interactions with C60 [61], followed by hydrophobic amino acids (Leu238, Leu327, Leu347, Pro384, Leu387, Ile388, Ile513, Leu516, Val555), interacting with the fullerene cage via vdW and the hydrophobic effect [61], and charged amino acids (Glu141, Lys351), interacting with C60 via surfactant-like interactions [61].
ROS formation in biological samples can be evaluated using different bioanalytical approaches [62,63]. Two different pathways exist for the production of ROS upon light absorption by C60 (See Scheme S1 in SI). When irradiated with the appropriate wavelength, C60 is excited to singlet excited states (Sn). An intersystem crossing (ISC), which is formally forbidden, although, in C60, the quantum yield is close to the unit, leads C60 to a T1 excited state (3C60*). This state is characterized by a long lifespan, and its interaction with O2 can generate reactive oxygen species (ROS) through two alternative pathways.
In the type I mechanism (electron transfer mechanism), 3C60* acquires a hydrogen atom or an electron to form a radical, which further reacts with water or molecular oxygen, leading to the production of different ROS, such as superoxide anions, hydroxyl radicals, and hydrogen peroxide.
In the type II mechanism (energy transfer mechanism), an energy transfer between 3C60* and molecular oxygen occurs, forming a highly reactive singlet oxygen excited state (1O2).
We used the Amplex Red assay to measure the generation of peroxides upon irradiation with visible light (Figure 2A) [64,65,66] to determine if type I mechanism is active. The number of peroxides produced is proportional to the C60@HSA concentration. The lack of a plateau in the formation of peroxides when the C60 concentration increases, as is frequently observed in the case of aggregation phenomena, confirms the monomolecular dispersion of the C60 molecules in the solution. The C60@HSA hybrids produce peroxides only when exposed to visible light, as was confirmed by control experiments using the same C60@HSA solutions, which were kept in the dark (Figure 2A).
The ability of C60@HSA to produce singlet oxygen (1O2) in aqueous media upon visible light irradiation was also demonstrated by measuring the near-IR emission of 1O2 centered at 1270 nm (Figure 2B) [65], indicating that the type II mechanism is also active.
These data clearly demonstrate that the C60@HSA complex follows both the type I and type II photophysical mechanisms of ROS production.
The protein platform can be functionalized using targeting ligands for an effective drug delivery and to target specifically overexpressed receptors. Folic acid (FA) is one of the best options for the targeted killing of cancer cells. Due to the high folate demand, the folate receptor alpha (FRα), a membrane-bound protein, is extensively expressed on the surfaces of many human cancer cells. In contrast, the expression of FRα is minimal in normal cells. FA is recognized by FRα even when it is covalently attached to a biomolecule or a nanoparticle [67,68,69,70]. The decoration of albumins [67,68] and albumin nanoparticles with folate is a common strategy for targeting FRα [69,70], which enables an enhanced targeted delivery to FRα-overexpressing cancer cells through FRα-mediated endocytosis (Figure 3).
We conjugated folic acid (FA) on the surfaces of the C60@HSA complexes via an EDC/NHS cross-coupling reaction between the carboxylic acid moiety of the folic acid and the amine groups of HSA (Figure 3A).
Normalizing the UV–Vis spectra of C60@HSA and C60@HSA-FA (Figure 3B) at 450 nm (where only absorption by C60 occurs), it is possible to estimate the number of FA molecules conjugated per HSA, considering their absorbance at 363 nm. Based on the molar extinction coefficient, at 363 nm of FA (6197 M−1cm−1) [71], an average of 7 FA molecules is conjugated to each C60@HSA complex. The mass spectra of the C60@HSA-FA prove the successful completion of the bioconjugation process (Figure S10).
HSA contains 59 lysine residues and 1 terminal amine group. Therefore, there are 60 amine groups that have potential as modification sites. Because we exploited only seven sites for the FA bioconjugation on average, the opportunity to also conjugate imaging tags to the targeted protein platform, in order to create a real phototheranostic platform, remained. We decided to conjugate tetramethylrhodamine isothiocyanate (TRITC) to the C60@HSA-FA complex. The isothiocyanate reactive group of the dye reacts with the amine groups of HSA, forming thiourea bond linkages (Figure 4A). Considering the molar extinction coefficients of TRITC at 554 nm, equating to 95,000 M−1cm−1, approximately 2.5 TRITC molecules are conjugated to C60@HSA/C60@HSA-FA (Figure 4B).
Exploiting the fluorescent properties of TRITC, the effective conjugation of the dye to C60@HSA-FA can be detected by agarose gel electrophoresis (Figure S12).
We therefore armed HSA with C60 molecules (C60@HSA), applied the C60@HSA complex to the cancer cells by folate conjugation (C60@HSA-FA) and provided the system with imaging properties by linking TRITC to the protein (C60@HSA-FA-TRITC). The result was an effective phototheranostic platform (Figure 4C).
The DLS analysis of the bioconjugates (Figure S13) demonstrated that the presence of the hydrophobic fullerenes induces the oligomerization of HSA. We already observed this phenomenon when lysozyme was used as the dispersing agent for C70 [20]. Proteins tend to cover the exposed part of the bound fullerenes, which is strongly hydrophobic, with their hydrophobic patches inducing non-covalent oligomerization processes. In addition, it is well-known that HSA has a strong tendency to form well-defined, non-covalent aggregates [72], such as dimers, tetramers or higher oligomers. DLS sets the size of the HSA as ~7 nm, corresponding to the monomeric structure of the protein, while providing a well-defined size of ~14 nm for C60@HSA. The dimension of the aggregate reflects the formation of a dimer [72,73]. Agarose gel electrophoresis confirmed that the oligomerization process is non-covalent (Figure S12). The conjugation of folate and TRITC to the C60@HSA causes, as expected, an increase in the hydrodynamic radius of the oligomers (~20 nm for C60@HSA-FA and ~23 nm for C60@HSA-FA-TRITC). Measurements of the stability (Figure S14) of the C60@HSA, C60@HSA-FA and C60@HSA-FS-TRITC complexes over time, in physiologically relevant conditions (PBS), showed that the encapsulation of C60 in HSA solves the problem of the poor stability of C60 in a saline environment. Such a problem is present, for instance, when C60 is dispersed with γ-cyclodextrins or is in the form of nanoparticles (nC60) that rapidly precipitate as soon as NaCl is added [74].
To assess the uptake and the PDT performances of C60@HSA and C60@HSA-FA, HeLa cells were selected, since they overexpress folic acid receptors on their surfaces [75]. The internalization of C60@HSA-TRITC and C60@HSA-FA-TRITC by HeLa cells was quantitatively evaluated by employing the fluorescence signals of the TRITC molecules. Representative phase contrast and fluorescence images of the HeLa cells following incubation with HSA derivatives are shown in Figure 5.
The HeLa cells incubated with both C60@HSA-TRITC and C60@HSA-FA-TRITC showed cytoplasmatic red fluorescence after 3 h of incubation, demonstrating that the internalization of C60@HSA took place both in the presence and in the absence of folate derivatization. Control experiments performed on the HeLa cells, which were not incubated with any C60@HSA-TRITC derivatives, did not reveal any relevant fluorescence signals.
The quantification of the mean fluorescence intensity of each cell after 3 and 18 h of incubation is reported in Figure 6.
The significance of the fluorescence increase was tested through the t-test and ANOVA analysis (Figure 6 and Table S1, see the Materials and Methods section for details on the statistical analysis). Both the t-test and ANOVA statistical analysis showed that folate significantly increases the fluorescence signals after both 3 and 18 h of incubation. These results proved that folate increases the internalization of C60@HSA derivatives by Hela cells. It is important that the increase in the internalization of C60@HSA after 3 h of incubation was also maintained after a longer incubation time (18 h). Folate promotes both the early and late internalization of C60@HSA derivatives, without any relevant activation of the cell clearance mechanisms that could induce a lower C60@HSA concentration in the cell cytoplasm over a longer timescale.
Based on the results of the internalization experiments, we studied the photoinduced killing activity of C60@HSA and C60@HSA-FA against the HeLa cells. Cell viability curves obtained by incubating the cells with a concentration of HSA derivatives in the range of 0.1–5 µM are reported in Figure 7. No dark toxicity was observed for C60@HSA and C60@HSA-FA across the whole range of concentrations. This aspect is crucial, because the use of HSA to disperse C60 overcomes the two most important limitations on the use of fullerenes in nanomedicine: the lack of water solubility and their low biocompatibility.
On the contrary, upon irradiation, the presence of C60@HSA and C60@HSA-FA caused a marked reduction in the viability of the HeLa cells in a dose-dependent manner. In agreement with the uptake studies, showing a higher internalization of HSA due to folate derivatization, it appears that (i) the photokilling activity of C60@HSA-FA occurs at a lower concentration of the hybrids, and (ii) the PDT efficiency of C60@HSA-FA is approximately twice that of C60@HSA.
Our results confirmed that the bioconjugation of targeting moieties (FAs) on the protein platform increases the cellular uptake of the adduct through a ligand-receptor-based mechanism.

4. Conclusions

The use of HSA to disperse C60 bypasses the two most important limitations that have hampered the full exploitation of fullerene in nanomedicine, namely, the lack of water solubility and low biocompatibility.
The resulting C60@HSA complex shows a significant visible-light-induced production of ROS, following both type I and type II photophysical mechanisms.
Exploiting the C60@HSA platform, which offers different chemical groups for chemical functionalization, the performances of the C60@HSA biohybrids were improved by coupling with:
(i) Folate molecules to target selectively folate receptors which, in turn, enhances the cellular uptake of the adduct by the cancer cells and promotes the internalization of the fullerene;
(ii) TRITC molecules to provide imaging properties to the adduct.
In the in vitro experiments, using HeLa cells, a cell line that overexpress folic acid receptors on the surfaces, it was shown that folate bioconjugation enhances both the internalization and the PDT-induced phototoxicity of the C60@HSA complex.
The C60@HSA platform can be additionally improved by using, for example, light-harvesting antennae in order to enhance the ROS production [76,77,78] and to extend the PDT activity of the fullerene further into the red/NIR [76,77,78,79], or by attaching other imaging tags to create targeted multimodal theranostic platforms [80].

Supplementary Materials

The following supporting information can be downloaded at: https://www.mdpi.com/article/10.3390/nano12193501/s1, Figure S1: Normalized UV-visible spectrum of C60 in toluene; Figures S2: Agarose gel electrophoresis of HSA and C60@HSA; Figure S3: Possible binding site of C60 in HSA; Figures S4-S8: Interaction between HSA and C60 bound in the binding sites 1–5; Scheme S1: Jablonski’s diagram showing Type I and type II mechanism of ROS generation. Figure S9: Normalized UV-visible spectrum of FA in PBS; Figure S10: Mass spectra of HSA before and after conjugation with FA; Figure S11: Normalized UV-visible spectrum of TRITC in PBS; Figure S12: Agarose gel electrophoresis of HSA, C60@HSA, C60@HSA-FA and C60@HSA-FA-TRITC. Figure S13: Particle number size distribution of HSA, C60@HSA, C60@HSA-FA and C60@HSA; Figure S14: Evolution of the stability of C60@HSA, C60@HSA-FA and C60@HSA as a function of time, in PBS; Table S1: ANOVA two-way analysis. Scheme S1. Jablonski’s diagram showing Type I and type II mechanism of ROS generation.

Author Contributions

Conceptualization, M.C.; methodology, A.C., M.M., E.J.M. and M.D.G.; formal analysis, A.C., M.M., E.J.M. and M.D.G.; investigation, A.M., G.M., A.S. and T.D.M.; resources, M.C. and S.R.; data curation, A.C., M.M., E.J.M. and M.D.G.; writing—review and editing, all authors; supervision, F.Z., S.R. and M.C.; funding acquisition, M.C. All authors have read and agreed to the published version of the manuscript.

Funding

The research leading to these results received funding from AIRC under the MFAG 2019 ID. 22894 project (P.I.: M.C.). M.D.G. was supported by a FIRC-AIRC fellowship, Italy (id. 22318). E.J.M. was supported by the Fondazione Umberto Veronesi, “Post-doctoral Fellowships 2022”.

Data Availability Statement

All data in this study can be requested from the corresponding authors ([email protected], S.R.; [email protected], M.D.G.; and [email protected], M.C.).

Conflicts of Interest

The authors declare no conflict of interest.

References

  1. Markovic, Z.; Todorovic-Markovic, B.; Kleut, D.; Nikolic, N.; Vranjes-Djuric, S.; Misirkic, M.; Vucicevic, L.; Janjetovic, K.; Isakovic, A.; Harhaji, L.; et al. The mechanism of cell-damaging reactive oxygen generation by colloidal fullerenes. Biomaterials 2007, 28, 5437–5448. [Google Scholar] [CrossRef] [PubMed]
  2. Markovic, Z.; Trajkovic, V. Biomedical potential of the reactive oxygen species generation and quenching by fullerenes (C60). Biomaterials 2008, 29, 3561–3573. [Google Scholar] [CrossRef] [PubMed]
  3. Sharma, S.K.; Chiang, L.Y.; Hamblin, M.R. Photodynamic therapy with fullerenes in vivo: Reality or a dream? Nanomedicine 2011, 6, 1813–1825. [Google Scholar] [CrossRef] [PubMed] [Green Version]
  4. Antoku, D.; Sugikawa, K.; Ikeda, A. Photodynamic Activity of Fullerene Derivatives Solubilized in Water by Natural-Product-Based Solubilizing Agents. Chem.—A Eur. J. 2019, 25, 1854–1865. [Google Scholar] [CrossRef]
  5. Hamblin, M.R. Fullerenes as photosensitizers in photodynamic therapy: Pros and cons. Photochem. Photobiol. Sci. 2018, 17, 1515–1533. [Google Scholar] [CrossRef]
  6. Ormond, A.B.; Freeman, H.S. Dye sensitizers for photodynamic therapy. Materials 2013, 6, 817–840. [Google Scholar] [CrossRef] [Green Version]
  7. Lan, M.; Zhao, S.; Liu, W.; Lee, C.S.; Zhang, W.; Wang, P. Photosensitizers for Photodynamic Therapy. Adv. Healthc. Mater. 2019, 8, 1900132. [Google Scholar] [CrossRef]
  8. Hotze, E.M.; Labille, J.; Alvarez, P.; Wiesner, M.R. Mechanisms of photochemistry and reactive oxygen production by fullerene suspensions in water. Environ. Sci. Technol. 2008, 42, 4175–4180. [Google Scholar] [CrossRef]
  9. Zhao, B.; He, Y.-Y.; Chignell, C.F.; Yin, J.-J.; Andley, U.; Roberts, J.E. Difference in Phototoxicity of Cyclodextrin Complexed Fullerene [(γ-CyD)2/C60] and Its Aggregated Derivatives toward Human Lens Epithelial Cells. Chem. Res. Toxicol. 2009, 22, 660–667. [Google Scholar] [CrossRef] [Green Version]
  10. Chae, S.R.; Badireddy, A.R.; Farner Budarz, J.; Lin, S.; Xiao, Y.; Therezien, M.; Wiesner, M.R. Heterogeneities in fullerene nanoparticle aggregates affecting reactivity, bioactivity, and transport. ACS Nano 2010, 4, 5011–5018. [Google Scholar] [CrossRef]
  11. Guldi, D.M.; Prato, M. Excited-state properties of C60 fullerene derivatives. Acc. Chem. Res. 2000, 33, 695–703. [Google Scholar] [CrossRef]
  12. Calvaresi, M.; Arnesano, F.; Bonacchi, S.; Bottoni, A.; Calò, V.; Conte, S.; Falini, G.; Fermani, S.; Losacco, M.; Montalti, M.; et al. C60@Lysozyme: Direct observation by nuclear magnetic resonance of a 1:1 fullerene protein adduct. ACS Nano 2014, 8, 1871–1877. [Google Scholar] [CrossRef]
  13. Di Giosia, M.; Bomans, P.H.H.; Bottoni, A.; Cantelli, A.; Falini, G.; Franchi, P.; Guarracino, G.; Friedrich, H.; Lucarini, M.; Paolucci, F.; et al. Proteins as supramolecular hosts for C60: A true solution of C60 in water. Nanoscale 2018, 10, 9908–9916. [Google Scholar] [CrossRef] [PubMed] [Green Version]
  14. Soldà, A.; Cantelli, A.; Di Giosia, M.; Montalti, M.; Zerbetto, F.; Rapino, S.; Calvaresi, M. C60@lysozyme: A new photosensitizing agent for photodynamic therapy. J. Mater. Chem. B 2017, 5, 6608–6615. [Google Scholar] [CrossRef] [PubMed]
  15. Di Giosia, M.; Nicolini, F.; Ferrazzano, L.; Soldà, A.; Valle, F.; Cantelli, A.; Marforio, T.D.; Bottoni, A.; Zerbetto, F.; Montalti, M.; et al. Stable and Biocompatible Monodispersion of C 60 in Water by Peptides. Bioconjug. Chem. 2019, 30, 808–814. [Google Scholar] [CrossRef] [PubMed]
  16. Kim, K.-H.; Ko, D.-K.; Kim, Y.-T.; Kim, N.H.; Paul, J.; Zhang, S.-Q.; Murray, C.B.; Acharya, R.; DeGrado, W.F.; Kim, Y.H.; et al. Protein-directed self-assembly of a fullerene crystal. Nat. Commun. 2016, 7, 11429. [Google Scholar] [CrossRef] [Green Version]
  17. Vance, S.J.; Desai, V.; Smith, B.O.; Kennedy, M.W.; Cooper, A. Aqueous solubilization of C60 fullerene by natural protein surfactants, latherin and ranaspumin-2. Biophys. Chem. 2016, 214–215, 27–32. [Google Scholar]
  18. Di Giosia, M.; Valle, F.; Cantelli, A.; Bottoni, A.; Zerbetto, F.; Calvaresi, M. C60 bioconjugation with proteins: Towards a palette of carriers for all pH ranges. Materials 2018, 11, 691. [Google Scholar] [CrossRef] [Green Version]
  19. Liutkus, M.; López-Andarias, A.; Mejías, S.H.; López-Andarias, J.; Gil-Carton, D.; Feixas, F.; Osuna, S.; Matsuda, W.; Sakurai, T.; Seki, S.; et al. Protein-directed crystalline 2D fullerene assemblies. Nanoscale 2020, 12, 3614–3622. [Google Scholar] [CrossRef] [Green Version]
  20. Di Giosia, M.; Soldà, A.; Seeger, M.; Cantelli, A.; Arnesano, F.; Nardella, M.I.; Mangini, V.; Valle, F.; Montalti, M.; Zerbetto, F.; et al. A Bio-Conjugated Fullerene as a Subcellular-Targeted and Multifaceted Phototheranostic Agent. Adv. Funct. Mater. 2021, 31, 2101527. [Google Scholar] [CrossRef]
  21. Di Costanzo, L.; Geremia, S. Atomic details of carbon-based nanomolecules interacting with proteins. Molecules 2020, 25, 3555. [Google Scholar] [CrossRef] [PubMed]
  22. Di Giosia, M.; Zerbetto, F.; Calvaresi, M. Incorporation of Molecular Nanoparticles Inside Proteins: The Trojan Horse Approach in Theranostics. Accounts Mater. Res. 2021, 2, 594–605. [Google Scholar] [CrossRef]
  23. Kratz, F. A clinical update of using albumin as a drug vehicle—A commentary. J. Control. Release 2014, 190, 331–336. [Google Scholar] [CrossRef] [PubMed]
  24. Hoogenboezem, E.N.; Duvall, C.L. Harnessing albumin as a carrier for cancer therapies. Adv. Drug Deliv. Rev. 2018, 130, 73–89. [Google Scholar] [CrossRef] [PubMed]
  25. Chen, Q.; Liu, Z. Albumin Carriers for Cancer Theranostics: A Conventional Platform with New Promise. Adv. Mater. 2016, 28, 10557–10566. [Google Scholar] [CrossRef]
  26. Cantelli, A.; Malferrari, M.; Soldà, A.; Simonetti, G.; Forni, S.; Toscanella, E.; Mattioli, E.J.; Zerbetto, F.; Zanelli, A.; Di Giosia, M.; et al. Human Serum Albumin–Oligothiophene Bioconjugate: A Phototheranostic Platform for Localized Killing of Cancer Cells by Precise Light Activation. JACS Au 2021, 1, 925–935. [Google Scholar] [CrossRef]
  27. Tao, C.; Chuah, Y.J.; Xu, C.; Wang, D.A. Albumin conjugates and assemblies as versatile bio-functional additives and carriers for biomedical applications. J. Mater. Chem. B 2019, 7, 357–367. [Google Scholar] [CrossRef]
  28. Teixeira, S.; Carvalho, M.A.; Castanheira, E.M.S. Functionalized Liposome and Albumin-Based Systems as Carriers for Poorly Water-Soluble Anticancer Drugs: An Updated Review. Biomedicines 2022, 10, 486. [Google Scholar] [CrossRef]
  29. Rozhkov, S.P.; Goryunov, A.S.; Sukhanova, G.A.; Borisova, A.G.; Rozhkova, N.N.; Andrievsky, G.V. Protein interaction with hydrated C60 fullerene in aqueous solutions. Biochem. Biophys. Res. Commun. 2003, 303, 562–566. [Google Scholar] [CrossRef]
  30. Belgorodsky, B.; Fadeev, L.; Ittah, V.; Benyamini, H.; Zelner, S.; Huppert, D.; Kotlyar, A.B.; Gozin, M. Formation and Characterization of Stable Human Serum Albumin−Tris-malonic Acid [C60]Fullerene Complex. Bioconjug. Chem. 2005, 16, 1058–1062. [Google Scholar] [CrossRef]
  31. Zhen, M.; Zheng, J.; Ye, L.; Li, S.; Jin, C.; Li, K.; Qiu, D.; Han, H.; Shu, C.; Yang, Y.; et al. Maximizing the relaxivity of Gd-complex by synergistic effect of HSA and carboxylfullerene. ACS Appl. Mater. Interfaces 2012, 4, 3724–3729. [Google Scholar] [CrossRef] [PubMed]
  32. Giełdoń, A.; Witt, M.M.; Gajewicz, A.; Puzyn, T. Rapid insight into C60 influence on biological functions of proteins. Struct. Chem. 2017, 28, 1775–1788. [Google Scholar] [CrossRef] [Green Version]
  33. Li, J.; Jiang, L.; Zhu, X. Computational studies of the binding mechanisms of fullerenes to human serum albumin. J. Mol. Model. 2015, 21, 177. [Google Scholar] [CrossRef] [PubMed]
  34. Leonis, G.; Avramopoulos, A.; Papavasileiou, K.D.; Reis, H.; Steinbrecher, T.; Papadopoulos, M.G. A Comprehensive Computational Study of the Interaction between Human Serum Albumin and Fullerenes. J. Phys. Chem. B 2015, 119, 14971–14985. [Google Scholar] [CrossRef] [PubMed]
  35. Krumkacheva, O.A.; Timofeev, I.O.; Politanskaya, L.V.; Polienko, Y.F.; Tretyakov, E.V.; Rogozhnikova, O.Y.; Trukhin, D.V.; Tormyshev, V.M.; Chubarov, A.S.; Bagryanskaya, E.G.; et al. Triplet Fullerenes as Prospective Spin Labels for Nanoscale Distance Measurements by Pulsed Dipolar EPR Spectroscopy. Angew. Chemie 2019, 131, 13405–13409. [Google Scholar] [CrossRef]
  36. Serda, M.; Szewczyk, G.; Krzysztyńska-Kuleta, O.; Korzuch, J.; Dulski, M.; Musioł, R.; Sarna, T. Developing [60]Fullerene Nanomaterials for Better Photodynamic Treatment of Non-Melanoma Skin Cancers. ACS Biomater. Sci. Eng. 2020, 6, 5930–5940. [Google Scholar] [CrossRef]
  37. Zhang, X.; Shu, C.; Xie, L.; Wang, C.; Zhang, Y.; Xiang, J.; Li, L.; Tang, Y. Protein Conformation Changes Induced by a Novel Organophosphate-Containing Water-Soluble Derivative of a C60 Fullerene Nanoparticle. J. Phys. Chem. C 2007, 111, 14327–14333. [Google Scholar] [CrossRef]
  38. Belgorodsky, B.; Fadeev, L.; Kolsenik, J.; Gozin, M. Formation of a soluble stable complex between pristine C 60-fullerene and a native blood protein. ChemBioChem 2006, 7, 1783–1789. [Google Scholar] [CrossRef]
  39. Benyamini, H.; Shulman-Peleg, A.; Wolfson, H.J.; Belgorodsky, B.; Fadeev, L.; Gozin, M. Interaction of C60-Fullerene and Carboxyfullerene with Proteins: Docking and Binding Site Alignment. Bioconjugate Chem. 2006, 17, 378–386. [Google Scholar] [CrossRef]
  40. Zhang, M.F.; Xu, Z.Q.; Ge, Y.S.; Jiang, F.L.; Liu, Y. Binding of fullerol to human serum albumin: Spectroscopic and electrochemical approach. J. Photochem. Photobiol. B Biol. 2012, 108, 34–43. [Google Scholar] [CrossRef]
  41. Qu, X.; Komatsu, T.; Sato, T.; Glatter, O.; Horinouchi, H.; Kobayashi, K.; Tsuchida, E. Structure, Photophysical Property, and Cytotoxicity of Human Serum Albumin Complexed with Tris(dicarboxymethylene)[60]fullerene. Bioconjug. Chem. 2008, 19, 1556–1560. [Google Scholar] [CrossRef] [PubMed]
  42. Abdulmalik, A.; Hibah, A.; Zainy, B.M.; Makoto, A.; Daisuke, I.; Masaki, O.; Kaneto, U.; Fumitoshi, H. Preparation of soluble stable C60/human serum albumin nanoparticles via cyclodextrin complexation and their reactive oxygen production characteristics. Life Sci. 2013, 93, 277–282. [Google Scholar] [CrossRef]
  43. Li, S.; Zhao, X.; Mo, Y.; Cummings, P.T.; Heller, W.T. Human serum albumin interactions with C60 fullerene studied by spectroscopy, small-angle neutron scattering, and molecular dynamics simulations. J. Nanoparticle Res. 2013, 15, 1769. [Google Scholar] [CrossRef]
  44. Song, M.; Liu, S.; Yin, J.; Wang, H. Interaction of human serum album and C 60 aggregates in solution. Int. J. Mol. Sci. 2011, 12, 4964–4974. [Google Scholar] [CrossRef] [PubMed] [Green Version]
  45. Ulfo, L.; Costantini, P.E.; Di Giosia, M.; Danielli, A.; Calvaresi, M. EGFR-Targeted Photodynamic Therapy. Pharmaceutics 2022, 14, 241. [Google Scholar] [CrossRef]
  46. Fernández, M.; Javaid, F.; Chudasama, V. Advances in targeting the folate receptor in the treatment/imaging of cancers. Chem. Sci. 2018, 9, 790–810. [Google Scholar] [CrossRef] [Green Version]
  47. Kang, Y.J.; Holley, C.K.; Abidian, M.R.; Madhankumar, A.B.; Connor, J.; Majd, S. Tumor Targeted Delivery of an Anti-Cancer Therapeutic: An In Vitro and In Vivo Evaluation. Adv. Healthc. Mater. 2021, 10, 2001207. [Google Scholar] [CrossRef]
  48. Scaranti, M.; Cojocaru, E.; Banerjee, S.; Banerji, U. Exploiting the folate receptor α in oncology. Nat. Rev. Clin. Oncol. 2020, 17, 349–359. [Google Scholar] [CrossRef]
  49. Zhou, J.; Li, J.; Ding, X.; Liu, J.; Luo, Z.; Liu, Y.; Ran, Q.; Cai, K. Multifunctional Fe2O3@PPy-PEG nanocomposite for combination cancer therapy with MR imaging. Nanotechnology 2015, 26, 425101. [Google Scholar] [CrossRef]
  50. Bartolini, L.; Malferrari, M.; Lugli, F.; Zerbetto, F.; Paolucci, F.; Pelicci, P.G.; Albonetti, C.; Rapino, S. Interaction of Single Cells with 2D Organic Monolayers: A Scanning Electrochemical Microscopy Study. ChemElectroChem 2018, 5, 2975–2981. [Google Scholar] [CrossRef]
  51. Schneider, C.A.; Rasband, W.S.; Eliceiri, K.W. NIH Image to ImageJ: 25 years of image analysis. Nat. Methods 2012, 9, 671–675. [Google Scholar] [CrossRef]
  52. Calvaresi, M.; Zerbetto, F. Baiting proteins with C60. ACS Nano 2010, 4, 2283–2299. [Google Scholar] [CrossRef]
  53. Calvaresi, M.; Zerbetto, F. Fullerene sorting proteins. Nanoscale 2011, 3, 2873–2881. [Google Scholar] [CrossRef]
  54. Ahmed, L.; Rasulev, B.; Kar, S.; Krupa, P.; Mozolewska, M.A.; Leszczynski, J. Inhibitors or toxins? Large library target-specific screening of fullerene-based nanoparticles for drug design purpose. Nanoscale 2017, 9, 10263–10276. [Google Scholar] [CrossRef]
  55. Calvaresi, M.; Furini, S.; Domene, C.; Bottoni, A.; Zerbetto, F. Blocking the passage: C60 geometrically clogs K+ channels. ACS Nano 2015, 9, 4827–4834. [Google Scholar] [CrossRef] [Green Version]
  56. Di Giosia, M.; Marforio, T.D.; Cantelli, A.; Valle, F.; Zerbetto, F.; Su, Q.; Wang, H.; Calvaresi, M. Inhibition of α-chymotrypsin by pristine single-wall carbon nanotubes: Clogging up the active site. J. Colloid Interface Sci. 2020, 571, 174–184. [Google Scholar] [CrossRef]
  57. Bologna, F.; Mattioli, E.J.; Bottoni, A.; Zerbetto, F.; Calvaresi, M. Interactions between Endohedral Metallofullerenes and Proteins: The Gd@C 60 –Lysozyme Model. ACS Omega 2018, 3, 13782–13789. [Google Scholar] [CrossRef] [Green Version]
  58. Di Giosia, M.; Valle, F.; Cantelli, A.; Bottoni, A.; Zerbetto, F.; Fasoli, E.; Calvaresi, M. High-throughput virtual screening to rationally design protein—Carbon nanotube interactions. Identification and preparation of stable water dispersions of protein—Carbon nanotube hybrids and efficient design of new functional materials. Carbon N. Y. 2019, 147, 70–82. [Google Scholar] [CrossRef]
  59. Berto, M.; Di Giosia, M.; Giordani, M.; Sensi, M.; Valle, F.; Alessandrini, A.; Menozzi, C.; Cantelli, A.; Gazzadi, G.C.; Zerbetto, F.; et al. Green Fabrication of (6,5)Carbon Nanotube/Protein Transistor Endowed with Specific Recognition. Adv. Electron. Mater. 2021, 7, 2001114. [Google Scholar] [CrossRef]
  60. Marforio, T.D.; Mattioli, E.J.; Zerbetto, F.; Calvaresi, M. Fullerenes against COVID-19: Repurposing C60 and C70 to Clog the Active Site of SARS-CoV-2 Protease. Molecules 2022, 27, 1916. [Google Scholar] [CrossRef] [PubMed]
  61. Marforio, T.D.; Calza, A.; Mattioli, E.J.; Zerbetto, F.; Calvaresi, M. Dissecting the supramolecular dispersion of fullerenes by proteins/peptides: Amino acid ranking and driving forces for binding to c60. Int. J. Mol. Sci. 2021, 22, 11567. [Google Scholar] [CrossRef]
  62. Dikalov, S.I.; Harrison, D.G. Methods for Detection of Mitochondrial and Cellular Reactive Oxygen Species. Antioxid. Redox Signal. 2012, 20, 372–382. [Google Scholar] [CrossRef] [Green Version]
  63. Malferrari, M.; Ghelli, A.; Roggiani, F.; Valenti, G.; Paolucci, F.; Rugolo, M.; Rapino, S. Reactive Oxygen Species Produced by Mutated Mitochondrial Respiratory Chains of Entire Cells Monitored Using Modified Microelectrodes. ChemElectroChem 2018, 6, 627–633. [Google Scholar] [CrossRef] [Green Version]
  64. Cantelli, A.; Piro, F.; Pecchini, P.; Di Giosia, M.; Danielli, A.; Calvaresi, M. Concanavalin A-Rose Bengal bioconjugate for targeted Gram-negative antimicrobial photodynamic therapy. J. Photochem. Photobiol. B Biol. 2020, 206, 111852. [Google Scholar] [CrossRef]
  65. Bortot, B.; Apollonio, M.; Baj, G.; Andolfi, L.; Zupin, L.; Crovella, S.; di Giosia, M.; Cantelli, A.; Saporetti, R.; Ulfo, L.; et al. Advanced photodynamic therapy with an engineered M13 phage targeting EGFR: Mitochondrial localization and autophagy induction in ovarian cancer cell lines. Free Radic. Biol. Med. 2022, 179, 242–251. [Google Scholar] [CrossRef]
  66. Ulfo, L.; Cantelli, A.; Petrosino, A.; Costantini, P.E.; Nigro, M.; Starinieri, F.; Turrini, E.; Zadran, S.K.; Zuccheri, G.; Saporetti, R.; et al. Orthogonal nanoarchitectonics of M13 phage for receptor targeted anticancer photodynamic therapy. Nanoscale 2022, 14, 632–641. [Google Scholar] [CrossRef]
  67. Butzbach, K.; Rasse-Suriani, F.A.O.; Gonzalez, M.M.; Cabrerizo, F.M.; Epe, B. Albumin–Folate Conjugates for Drug-targeting in Photodynamic Therapy. Photochem. Photobiol. 2016, 92, 611–619. [Google Scholar] [CrossRef]
  68. Dosio, F.; Arpicco, S.; Stella, B.; Brusa, P.; Cattel, L. Folate-mediated targeting of albumin conjugates of paclitaxel obtained through a heterogeneous phase system. Int. J. Pharm. 2009, 382, 117–123. [Google Scholar] [CrossRef]
  69. Dubey, R.D.; Alam, N.; Saneja, A.; Khare, V.; Kumar, A.; Vaidh, S.; Mahajan, G.; Sharma, P.R.; Singh, S.K.; Mondhe, D.M.; et al. Development and evaluation of folate functionalized albumin nanoparticles for targeted delivery of gemcitabine. Int. J. Pharm. 2015, 492, 80–91. [Google Scholar] [CrossRef]
  70. Akbarian, A.; Ebtekar, M.; Pakravan, N.; Hassan, Z.M. Folate receptor alpha targeted delivery of artemether to breast cancer cells with folate-decorated human serum albumin nanoparticles. Int. J. Biol. Macromol. 2020, 152, 90–101. [Google Scholar] [CrossRef]
  71. Kranz, D.M.; Patrick, T.A.; Brigle, K.E.; Spinella, M.J.; Roy, E.J. Conjugates of folate and anti-T-cell-receptor antibodies specifically target folate-receptor-positive tumor cells for lysis. Proc. Natl. Acad. Sci. USA 1995, 92, 9057–9061. [Google Scholar] [CrossRef] [PubMed]
  72. Chubarov, A.; Spitsyna, A.; Krumkacheva, O.; Mitin, D.; Suvorov, D.; Tormyshev, V.; Fedin, M.; Bowman, M.K.; Bagryanskaya, E. Reversible dimerization of human serum albumin. Molecules 2021, 26, 108. [Google Scholar] [CrossRef] [PubMed]
  73. Babcock, J.J.; Brancaleon, L. Bovine serum albumin oligomers in the E- and B-forms at low protein concentration and ionic strength. Int. J. Biol. Macromol. 2013, 53, 42–53. [Google Scholar] [CrossRef] [PubMed] [Green Version]
  74. Deguchi, S.; Alargova, R.G.; Tsujii, K. Stable dispersions of fullerenes, C60 and C70, in water. Preparation and characterization. Langmuir 2001, 17, 6013–6017. [Google Scholar] [CrossRef]
  75. Bellotti, E.; Cascone, M.G.; Barbani, N.; Rossin, D.; Rastaldo, R.; Giachino, C.; Cristallini, C. Targeting cancer cells overexpressing folate receptors with new terpolymer-based nanocapsules: Toward a novel targeted dna delivery system for cancer therapy. Biomedicines 2021, 9, 1275. [Google Scholar] [CrossRef]
  76. Shimada, R.; Hino, S.; Yamana, K.; Kawasaki, R.; Konishi, T.; Ikeda, A. Improvement of Photodynamic Activity by a Stable System Consisting of a C60 Derivative and Photoantenna in Liposomes. ACS Med. Chem. Lett. 2022, 13, 641–647. [Google Scholar] [CrossRef]
  77. Kawasaki, R.; Antoku, D.; Ohdake, R.; Sugikawa, K.; Ikeda, A. Bacterial elimination via the photodynamic activity of a fullerene/light-harvesting antenna molecule assembled system integrated into liposome membranes. Nanoscale Adv. 2020, 2, 4395–4399. [Google Scholar] [CrossRef]
  78. Antoku, D.; Satake, S.; Mae, T.; Sugikawa, K.; Funabashi, H.; Kuroda, A.; Ikeda, A. Improvement of Photodynamic Activity of Lipid–Membrane-Incorporated Fullerene Derivative by Combination with a Photo-Antenna Molecule. Chem.—A Eur. J. 2018, 24, 7335–7339. [Google Scholar] [CrossRef] [Green Version]
  79. Liu, J.; Şen Karaman, D.; Zhang, J.; Rosenholm, J.M.; Guo, X.; Cai, K. NIR light-activated dual-modality cancer therapy mediated by photochemical internalization of porous nanocarriers with tethered lipid bilayers. J. Mater. Chem. B 2017, 5, 8289–8298. [Google Scholar] [CrossRef]
  80. Lee, S.Y.; Jeon, S.I.; Jung, S.; Chung, I.J.; Ahn, C.H. Targeted multimodal imaging modalities. Adv. Drug Deliv. Rev. 2014, 76, 60–78. [Google Scholar] [CrossRef]
Figure 1. (A) UV–visible spectra of C60@HSA (black line) and HSA (red line) in PBS. In Figure S1, the UV–visible spectrum of C60 in toluene is depicted. (B) The most probable fullerene binding pocket in HSA, identified by a docking algorithm followed by molecular dynamics simulations.
Nanomaterials 12 03501 g001
Figure 2. (A) Generation of peroxides during visible light irradiation (red histograms) and in the dark (black histograms) using different concentrations of C60@HSA. (B) Emission spectra of singlet oxygen generated upon the excitation of C60@HSA.
Nanomaterials 12 03501 g002
Figure 3. (A) Bioconjugation of folic acid to C60@HSA. (B) UV–visible spectra of C60@HSA (black line) and C60@HS-FA (blue line) in PBS. In Figure S9, the UV–visible spectrum of FA in PBS. (C) Folate-receptor-mediated endocytosis.
Nanomaterials 12 03501 g003
Figure 4. (A) Bioconjugation of TRITC to C60@HSA/C60@HSA-FA. (B) UV–visible spectra of C60@HSA-TRITC (black line) and C60@HSA-FA-TRITC (blue line) in PBS. In Figure S11, the UV–visible spectrum of TRITC in PBS. (C) Creation of an C60@HSA-based theranostic platform by protein conjugation of the targeting agents (FA) and imaging tags (TRITC).
Nanomaterials 12 03501 g004
Figure 5. Representative phase contrast (af) and TRITC fluorescence (a′f′) images measured on the control HeLa samples after 3 h (a,a′) and 18 h (d,d′); HeLa cells incubated with C60@HSA-TRITC after 3 h (b,b′) and 18 h (e,e′); C60@HSA-FA-TRITC after 3 h (c,c′) and 18 h (f,f′).
Nanomaterials 12 03501 g005
Figure 6. Average mean cell fluorescence signals after 3 h (orange) and 18 h (red) of incubation, determined for single HeLa cells using the fluorescence images (see Materials and Methods for details on the acquisition parameters and on the signal treatment); error bars are standard deviations. For C60@HSA-TRITC and C60@HSA-FA-TRITC and the HeLa control samples, the following numbers of ROIs were considered: C60@HSA-TRITC, n = 171; C60@HSA-FA-TRITC, n = 144; HeLa, n = 102. Statistical significance was evaluated with a two-tailed t-test using different variances in the populations (***, p < 0.001).
Nanomaterials 12 03501 g006
Figure 7. Phototoxicity of C60@HSA and C60@HSA-FA in the 0.1–5 µM range. Percentage of cell viability for irradiated and not irradiated HeLa cells incubated with C60@HSA and C60@HSA-FA. C60@HSA: irradiated, orange squares; not irradiated, electric blue squares. C60@HSA-FA: irradiated, red triangles; not irradiated, dark blue triangles. Each value represents the average ± 1 standard deviation of at least 2 independent measures.
Nanomaterials 12 03501 g007
Publisher’s Note: MDPI stays neutral with regard to jurisdictional claims in published maps and institutional affiliations.

