3D Printed Composite Scaffolds of GelMA and Hydroxyapatite Nanopowders Doped with Mg/Zn Ions to Evaluate the Expression of Genes and Proteins of Osteogenic Markers

 ,
,  , ,
, ,  , ,
, , 

 , and
, and 
Abstract
:1. Introduction
- -
- improved antibacterial and anti-inflammatory activity [25].
- -
- in the structure of calcium phosphates, they have shown to induce bone formation and mineralization around the implant, also inducing a decrease in the inflammatory response [26].
- -
- decrease bone resorption due to inhibition of osteoclast [27].
- -
- are of crucial importance in several biological roles, such as the regulation of enzymatic activity [23].
- -
- plays an important role in the integrity of the cytoskeleton, through the synthesis of proteins and nucleic acids, by regulating the transport of calcium ions by activating phagocytosis.
- -
- can regulate cell compartments, such as improving cell adhesion and stimulating cell differentiation.
- -
- stimulates bone formation and healing by promoting neovascularization.
- -
- inhibits the function of osteoclasts and promotes the activity of osteoblasts [29].
2. Materials and Methods
2.1. Materials
2.1.1. Materials for the Obtaining of HA Ceramic Nanopowders Substituted with Magnesium and Zinc
2.1.2. Materials for Methacrylate Gelatin Synthesis
2.1.3. Materials for the Determination of Biological Properties
2.2. Methods
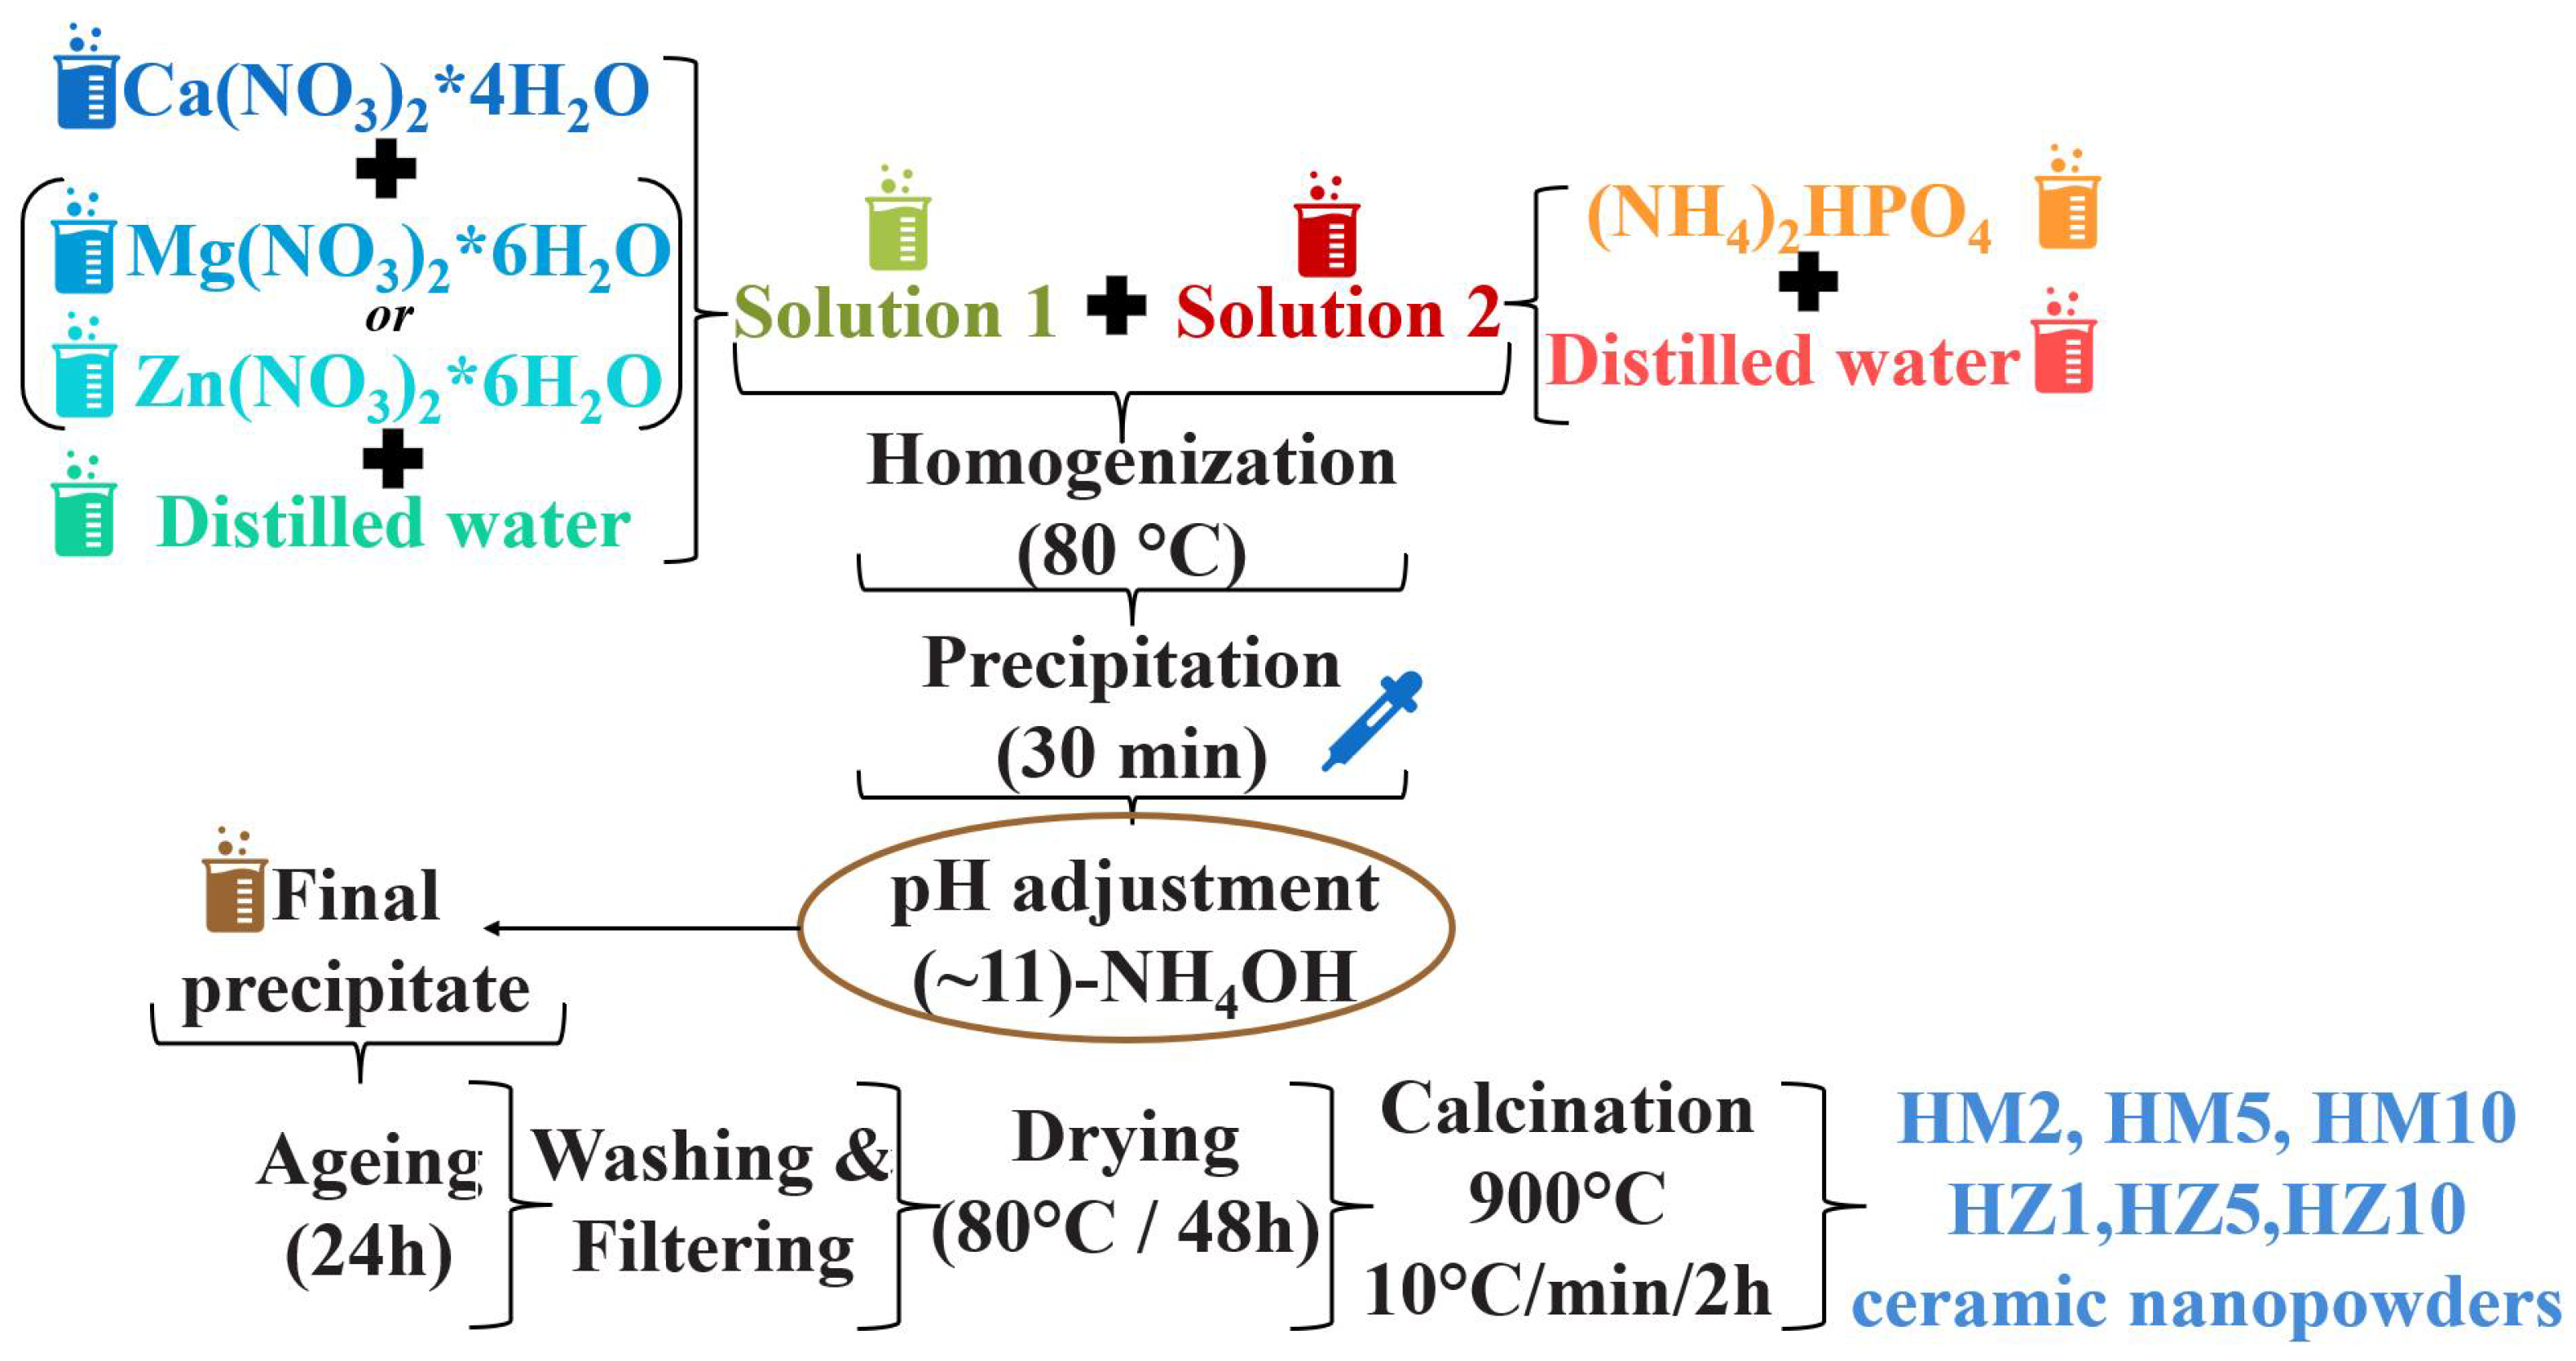
2.2.1. Synthesis of Hydroxyapatite Nanopowders
2.2.2. Synthesis of GelMA
2.2.3. Synthesis of Composite Materials
2.3. Characterization Techniques
2.3.1. X-ray Diffraction (XRD)
2.3.2. Brunauer–Emmett–Teller (BET)
2.3.3. Laser Diffraction Granulometer
2.3.4. Scanning Electron Microscopy SEM
2.3.5. FTIR Spectrometry
2.3.6. Printability
2.3.7. Swelling Degree and Degradability of the 3D Printed Hydrogel Based on GelMA
2.3.8. Micro-Computer Tomography (µ-CT)
2.3.9. Mechanical Properties of 3D-Printed Scaffolds
- G’—the storage modulus
- R—represents the gas constant
- T—the temperature at which G’ was measured (298.15 K).
2.3.10. Nanoindentation
2.3.11. In Vitro Biocompatibility Evaluation of 3D Scaffolds
2.3.12. Osteogenic Gene and Protein Expression Evaluation
2.3.13. Statistical Analysis
3. Results and Discussion
3.1. Characterization of Ceramic Powders
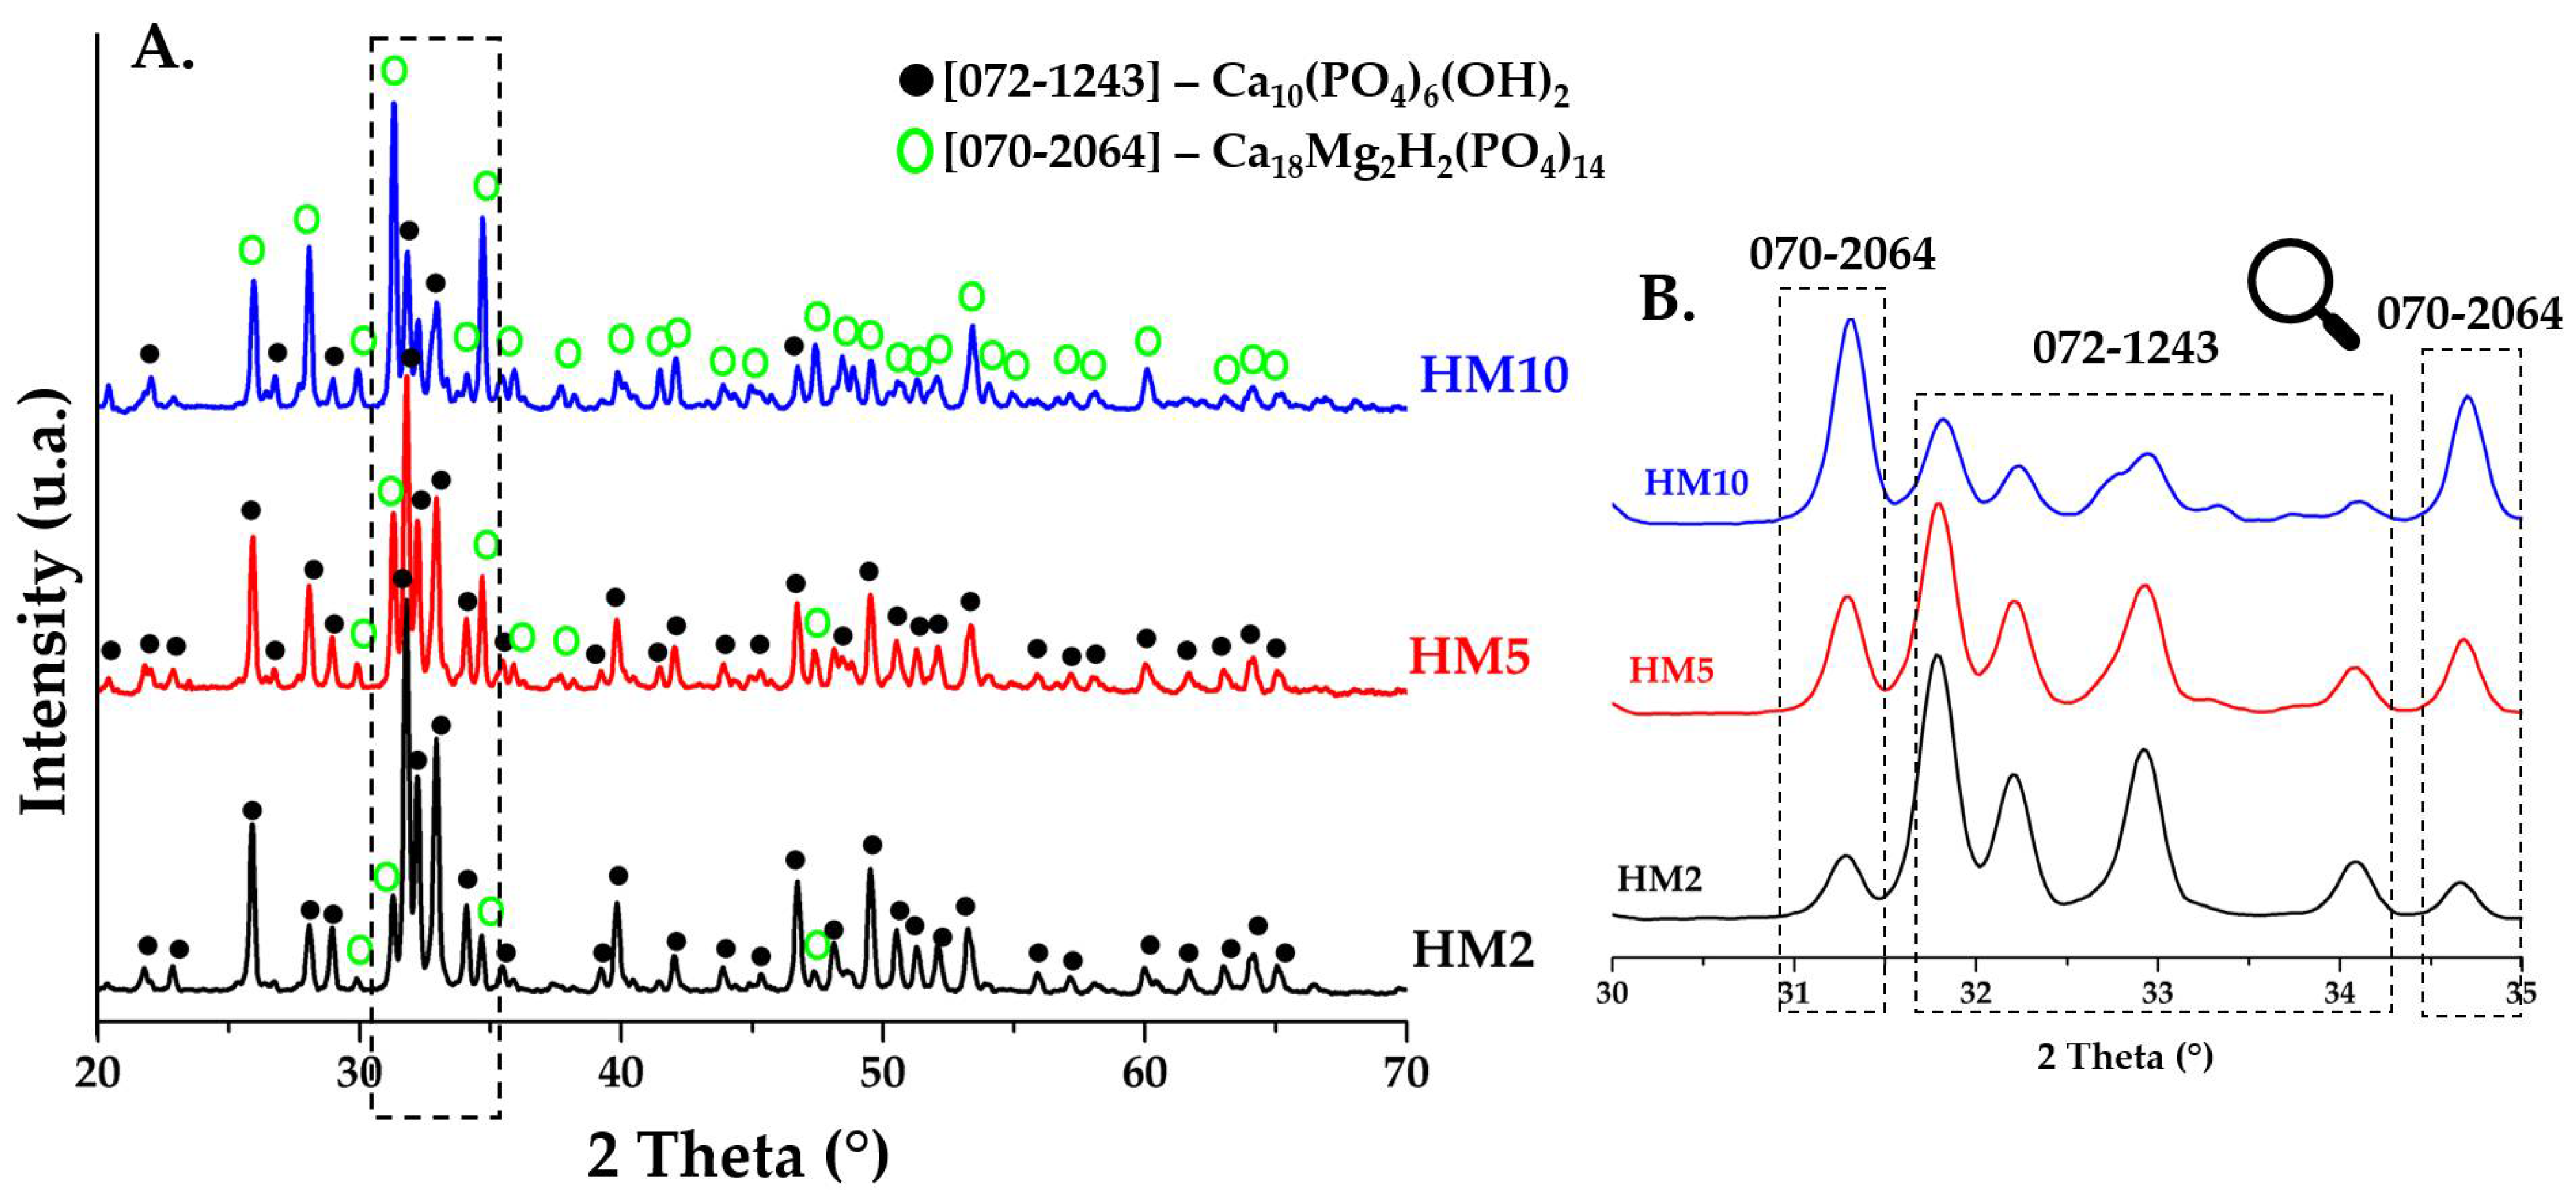
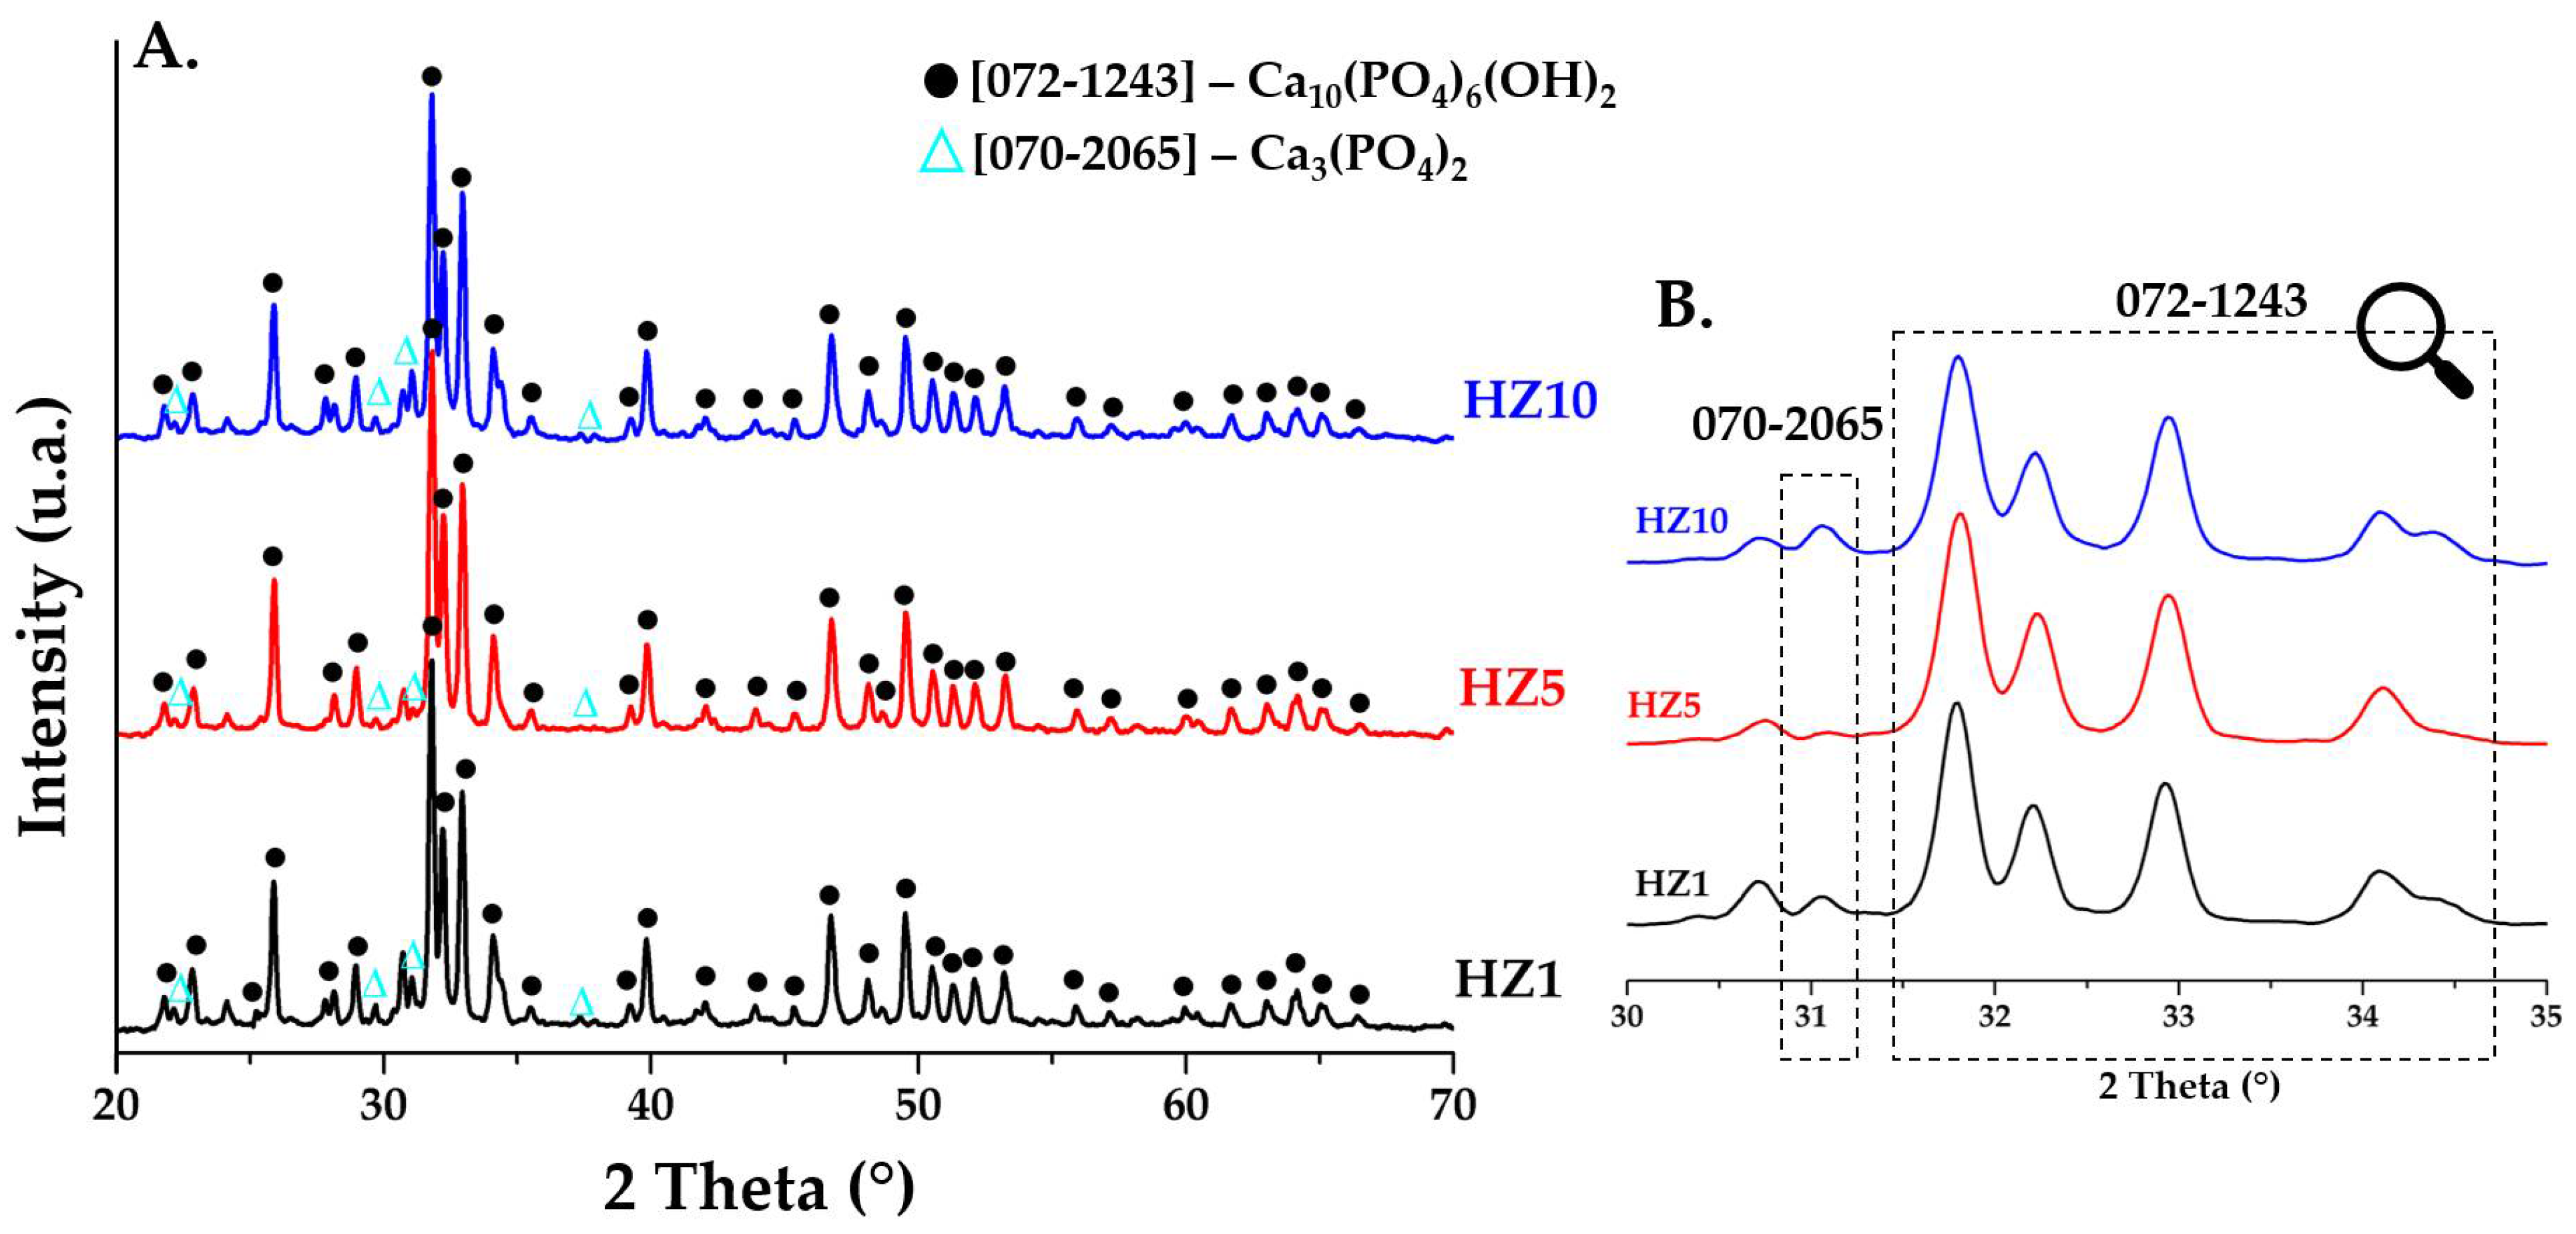
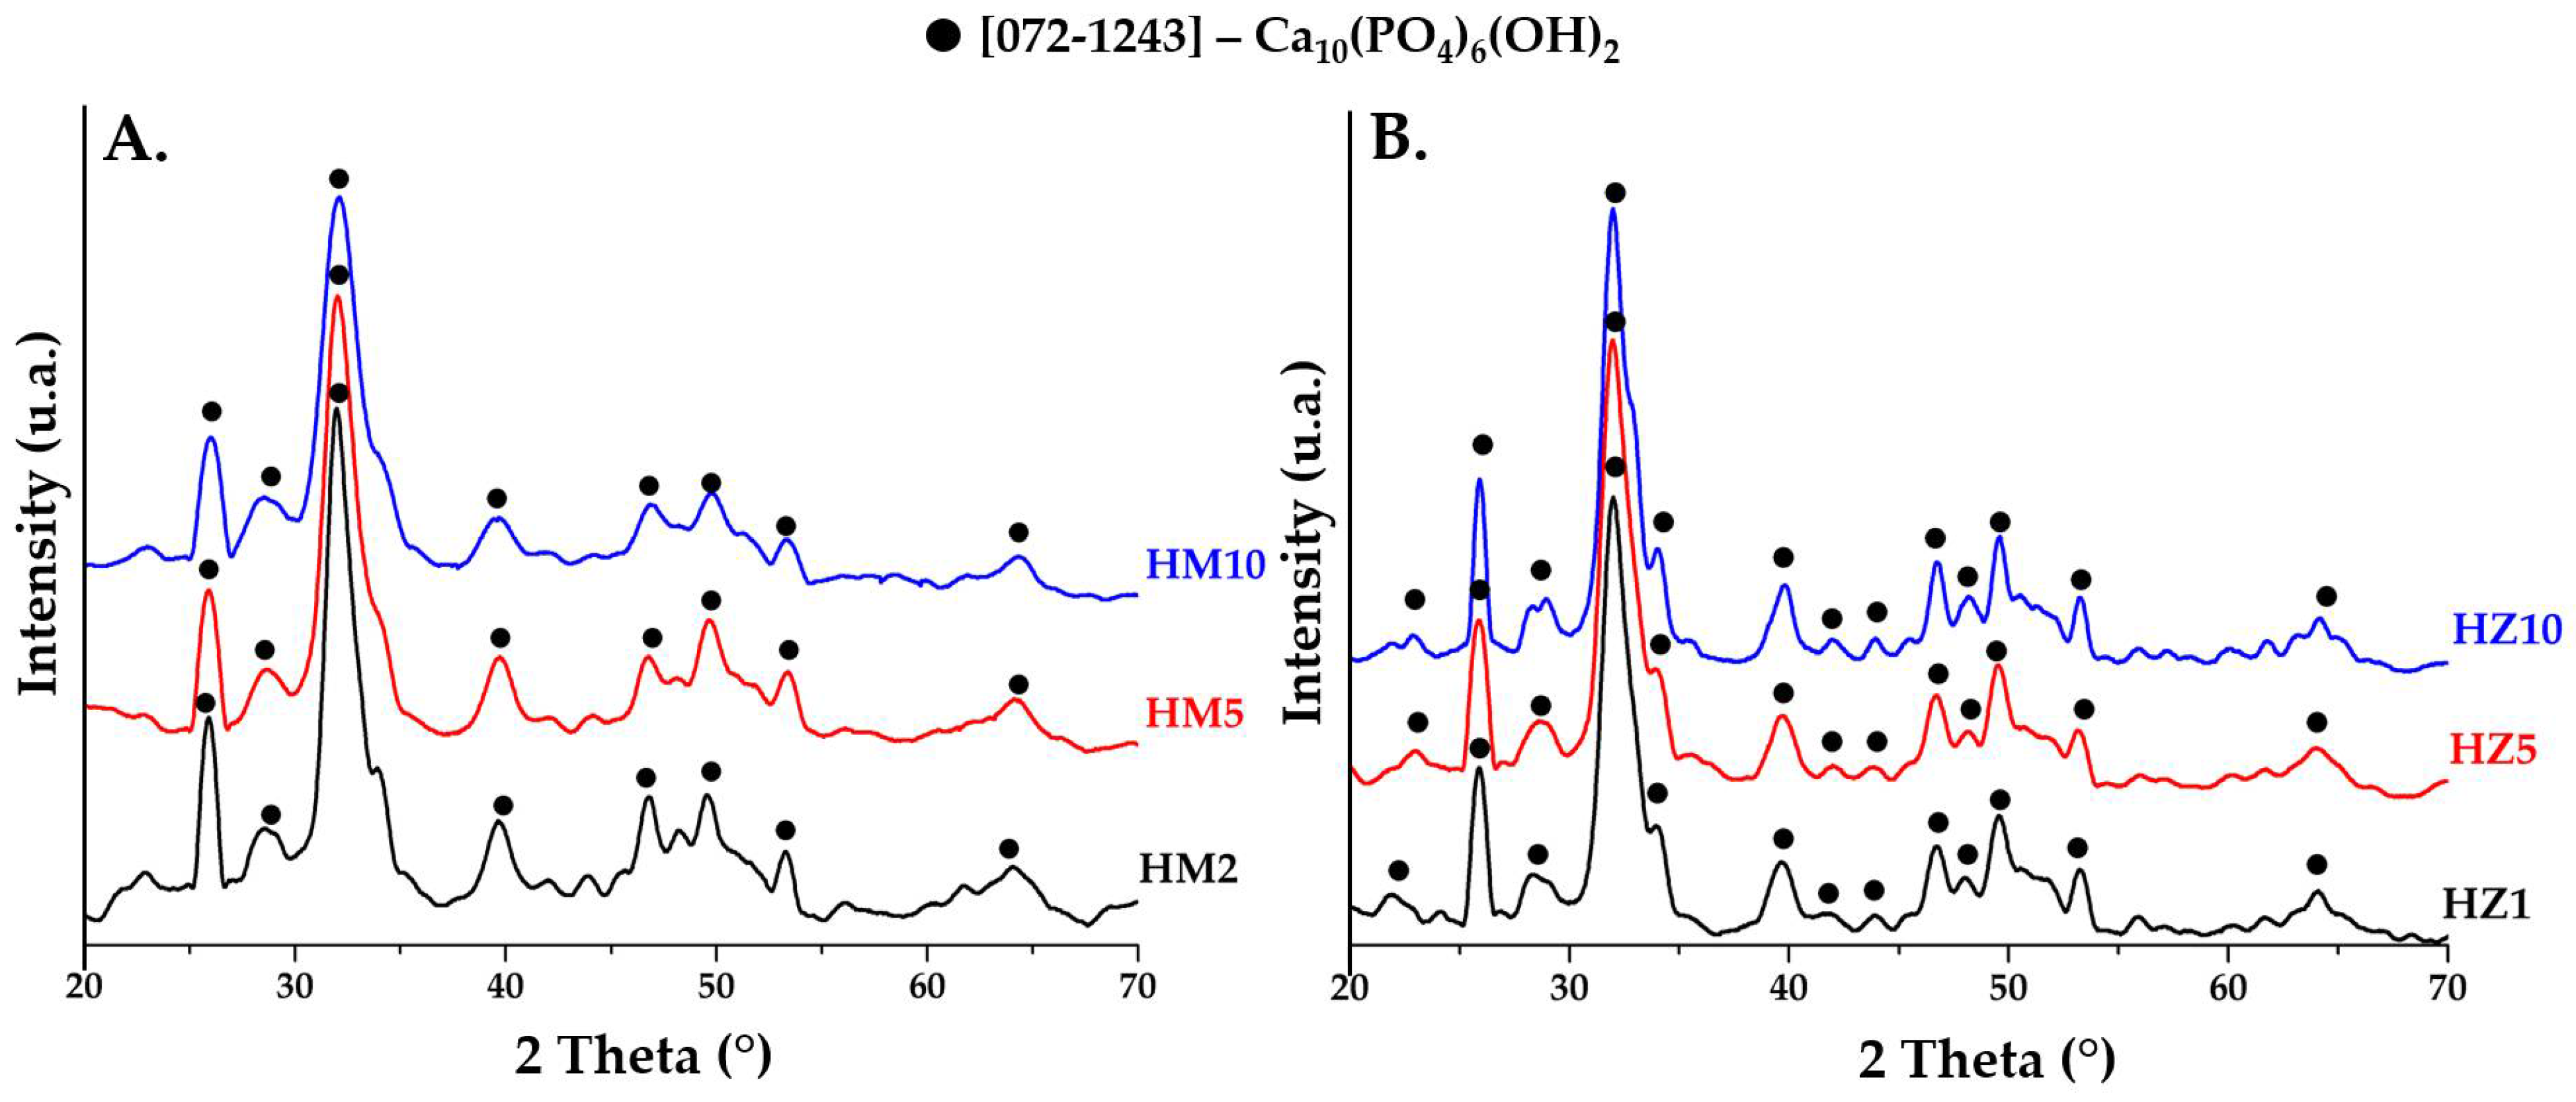
3.1.1. X-ray Diffraction (XRD)
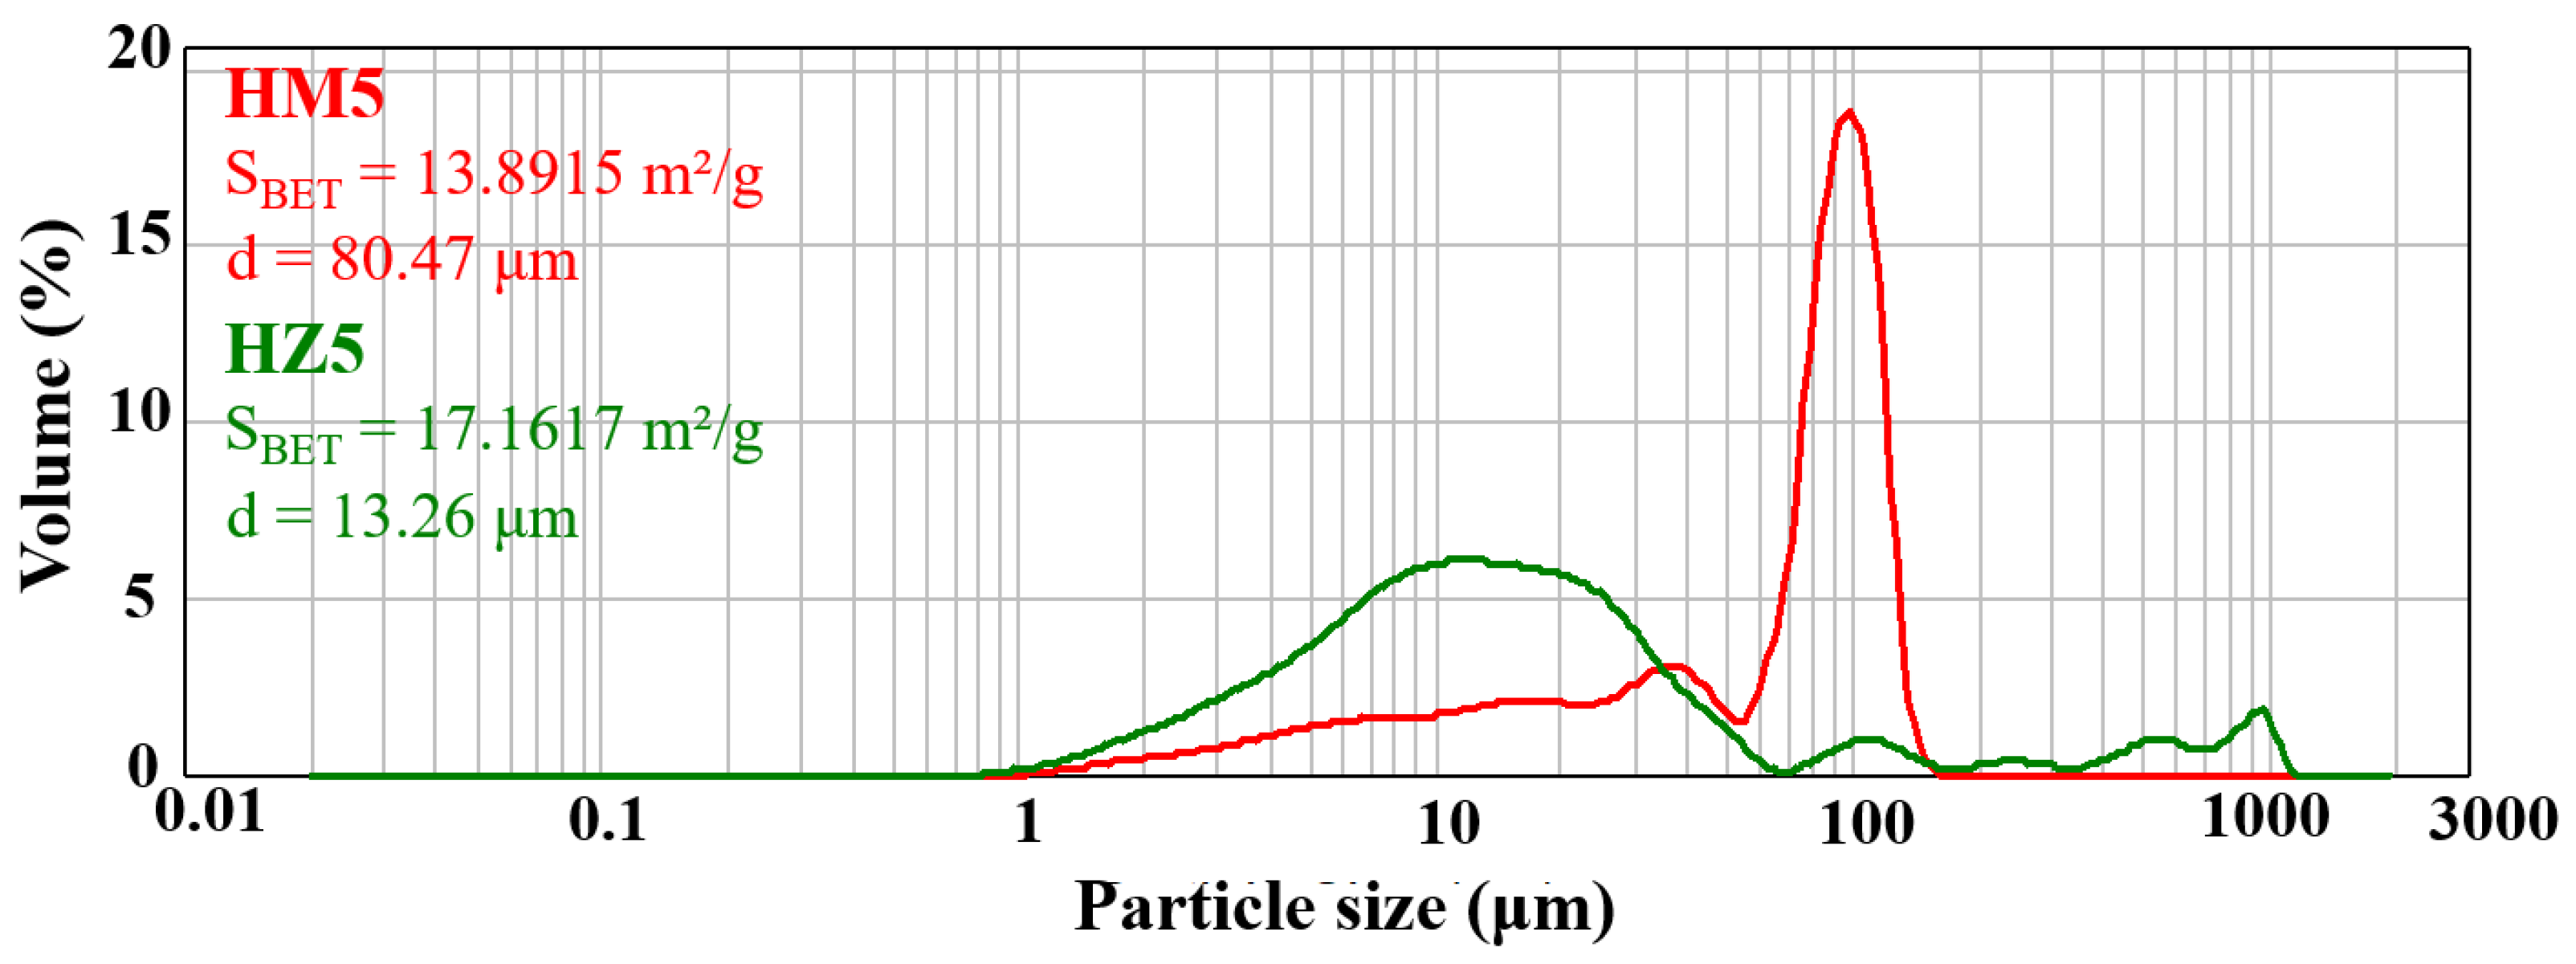
3.1.2. Laser Granulometry
3.2. Characterization of Composite Materials
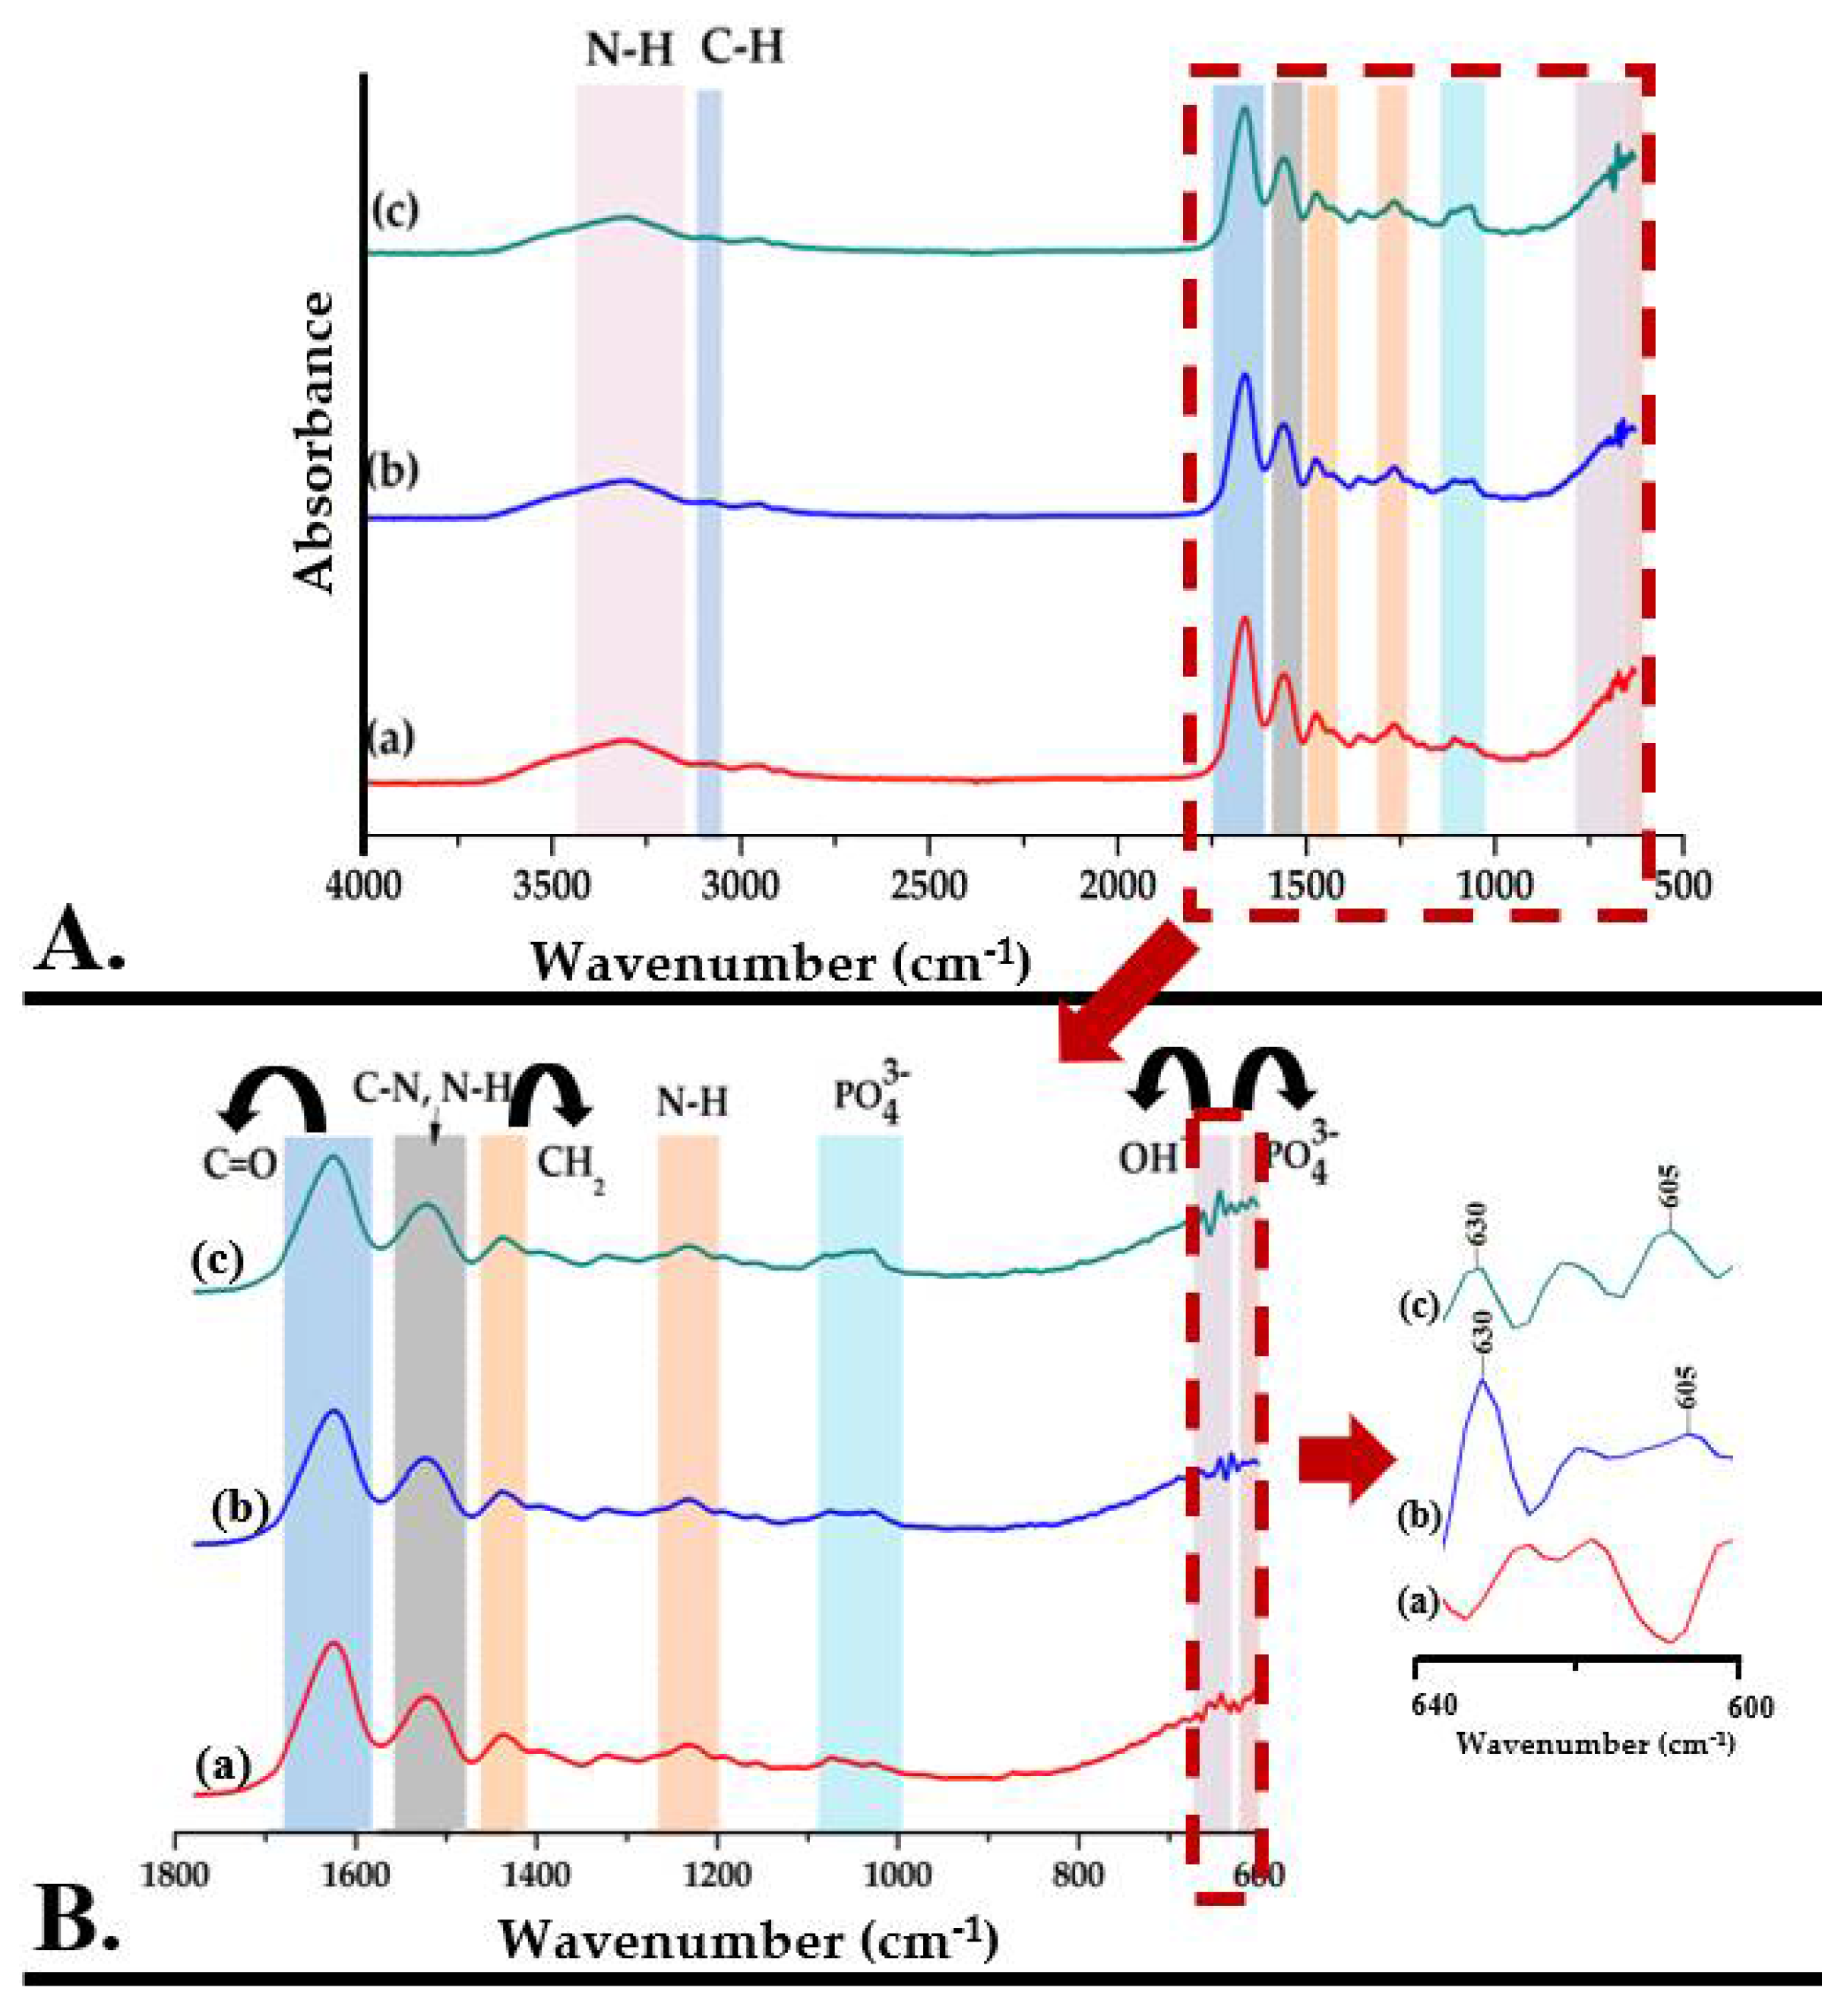
3.2.1. Fourier Transform Infrared Spectroscopy (FTIR)
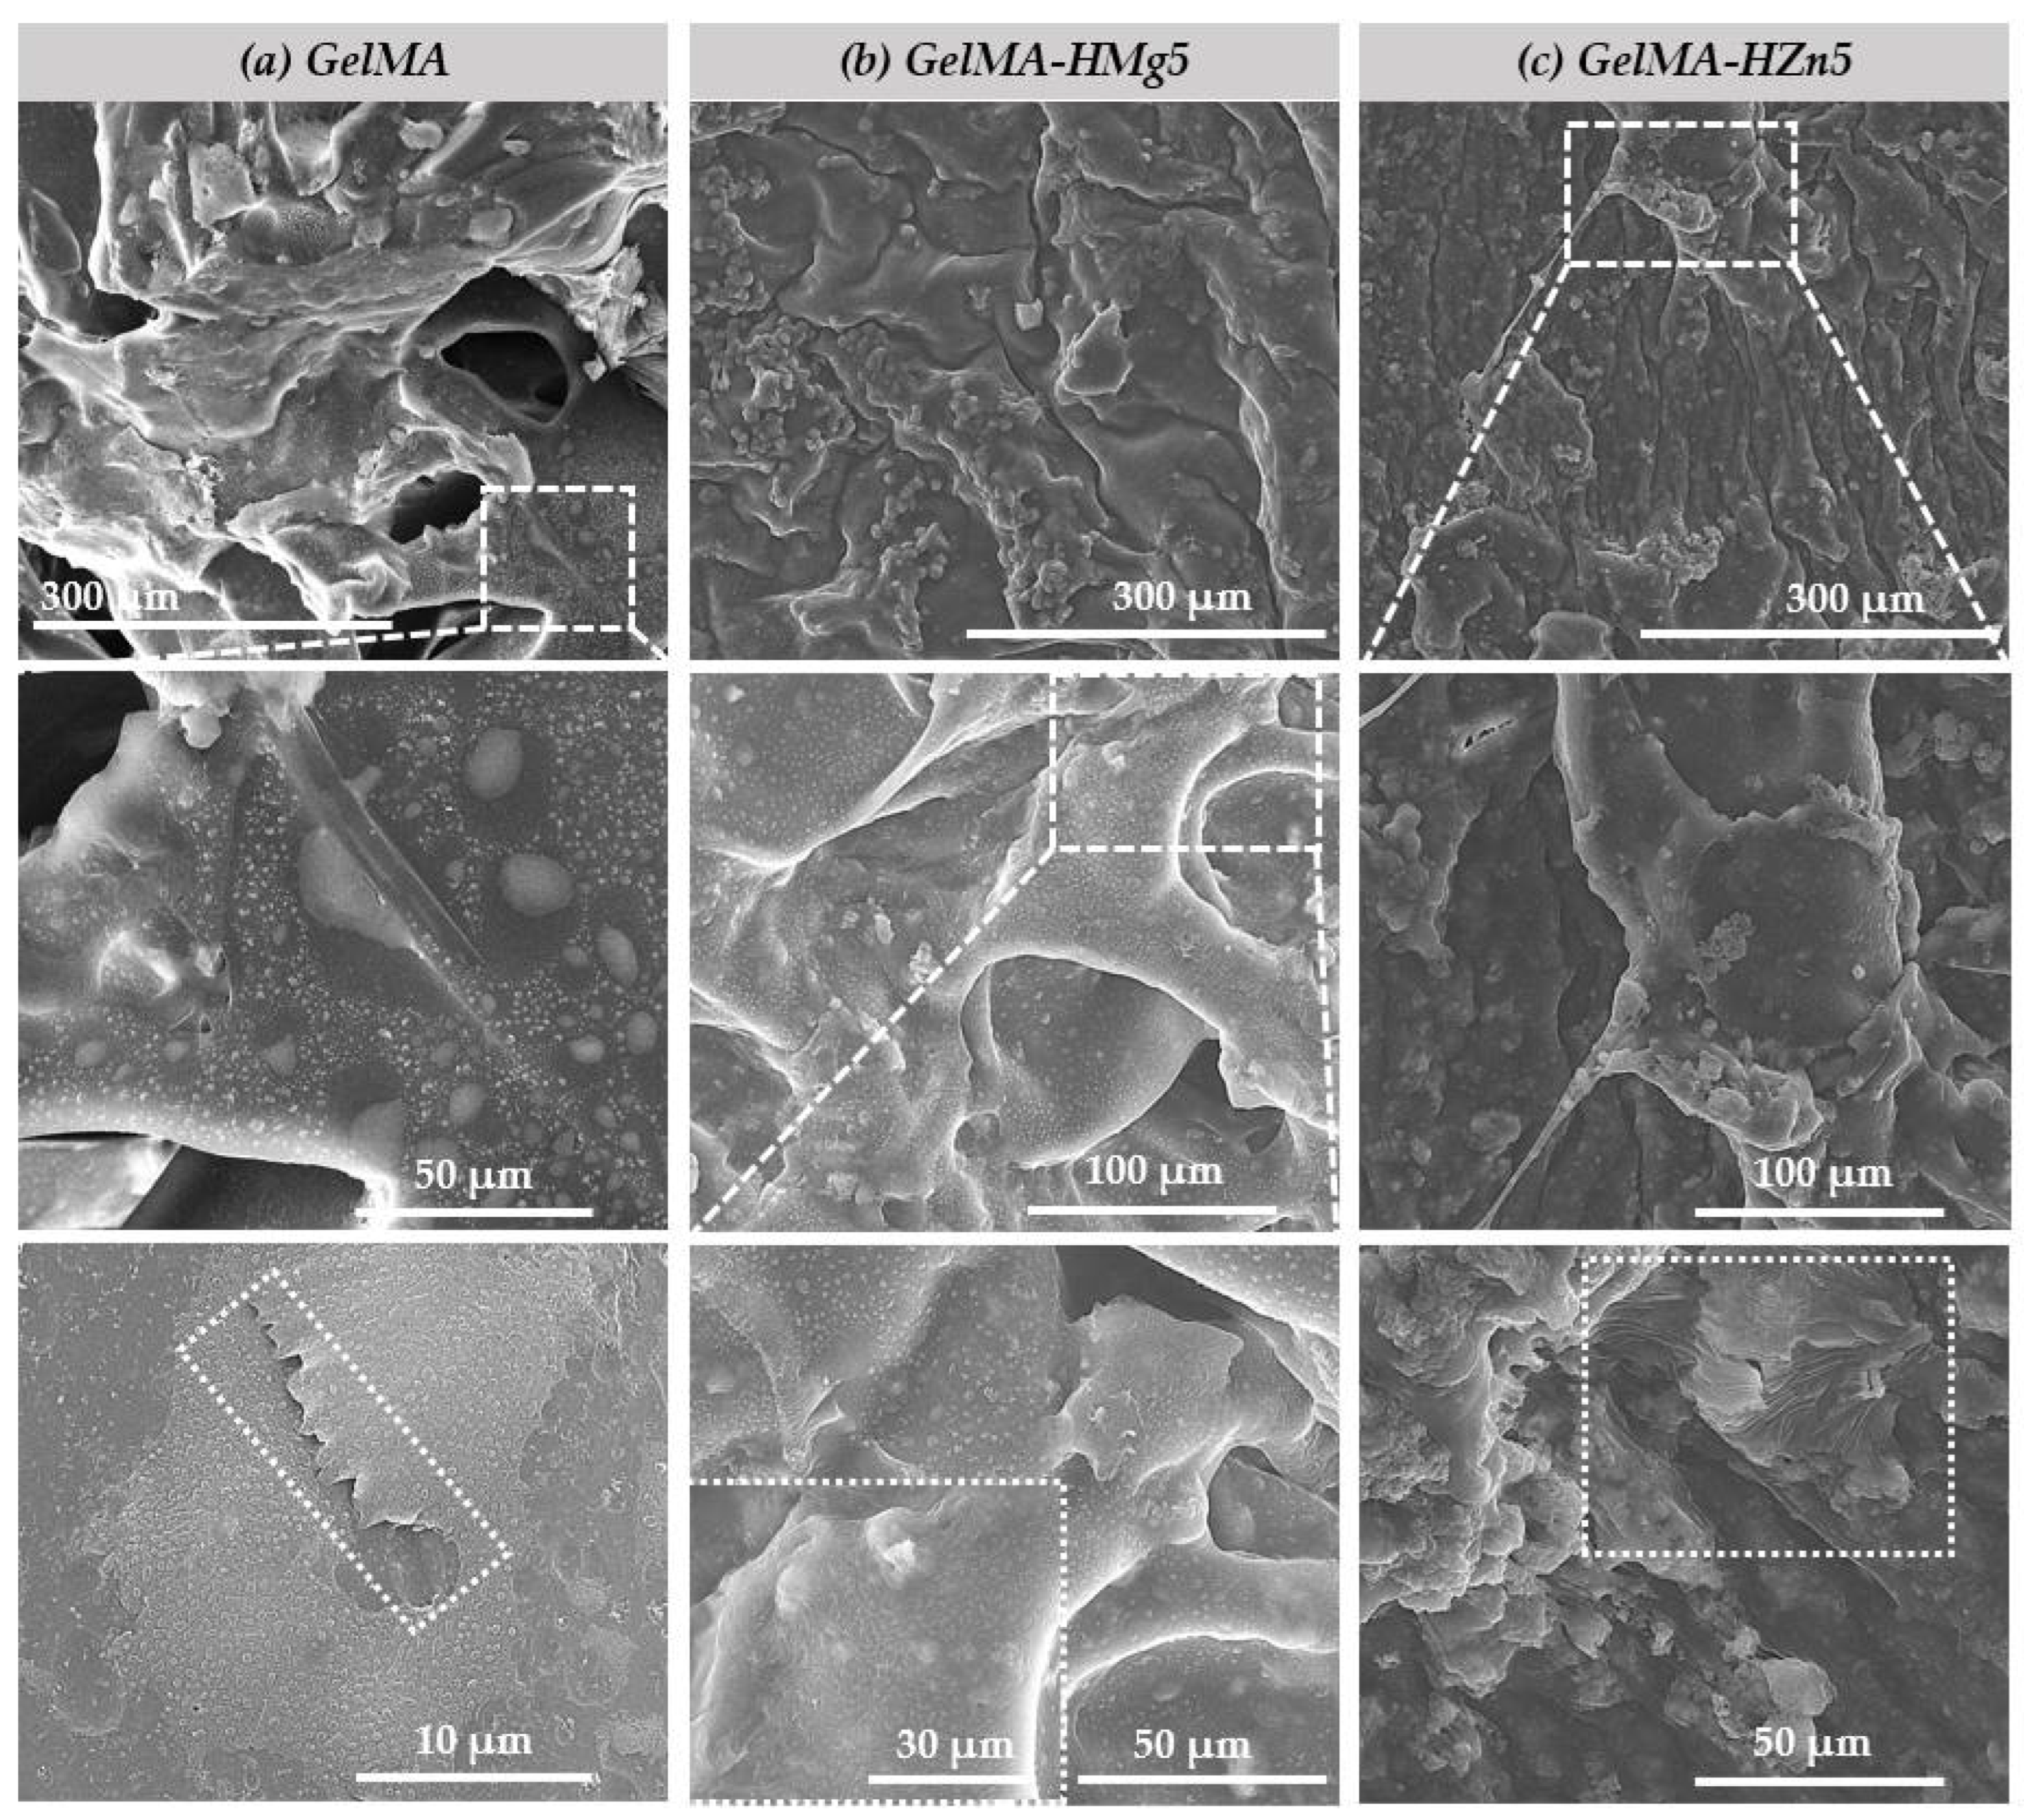
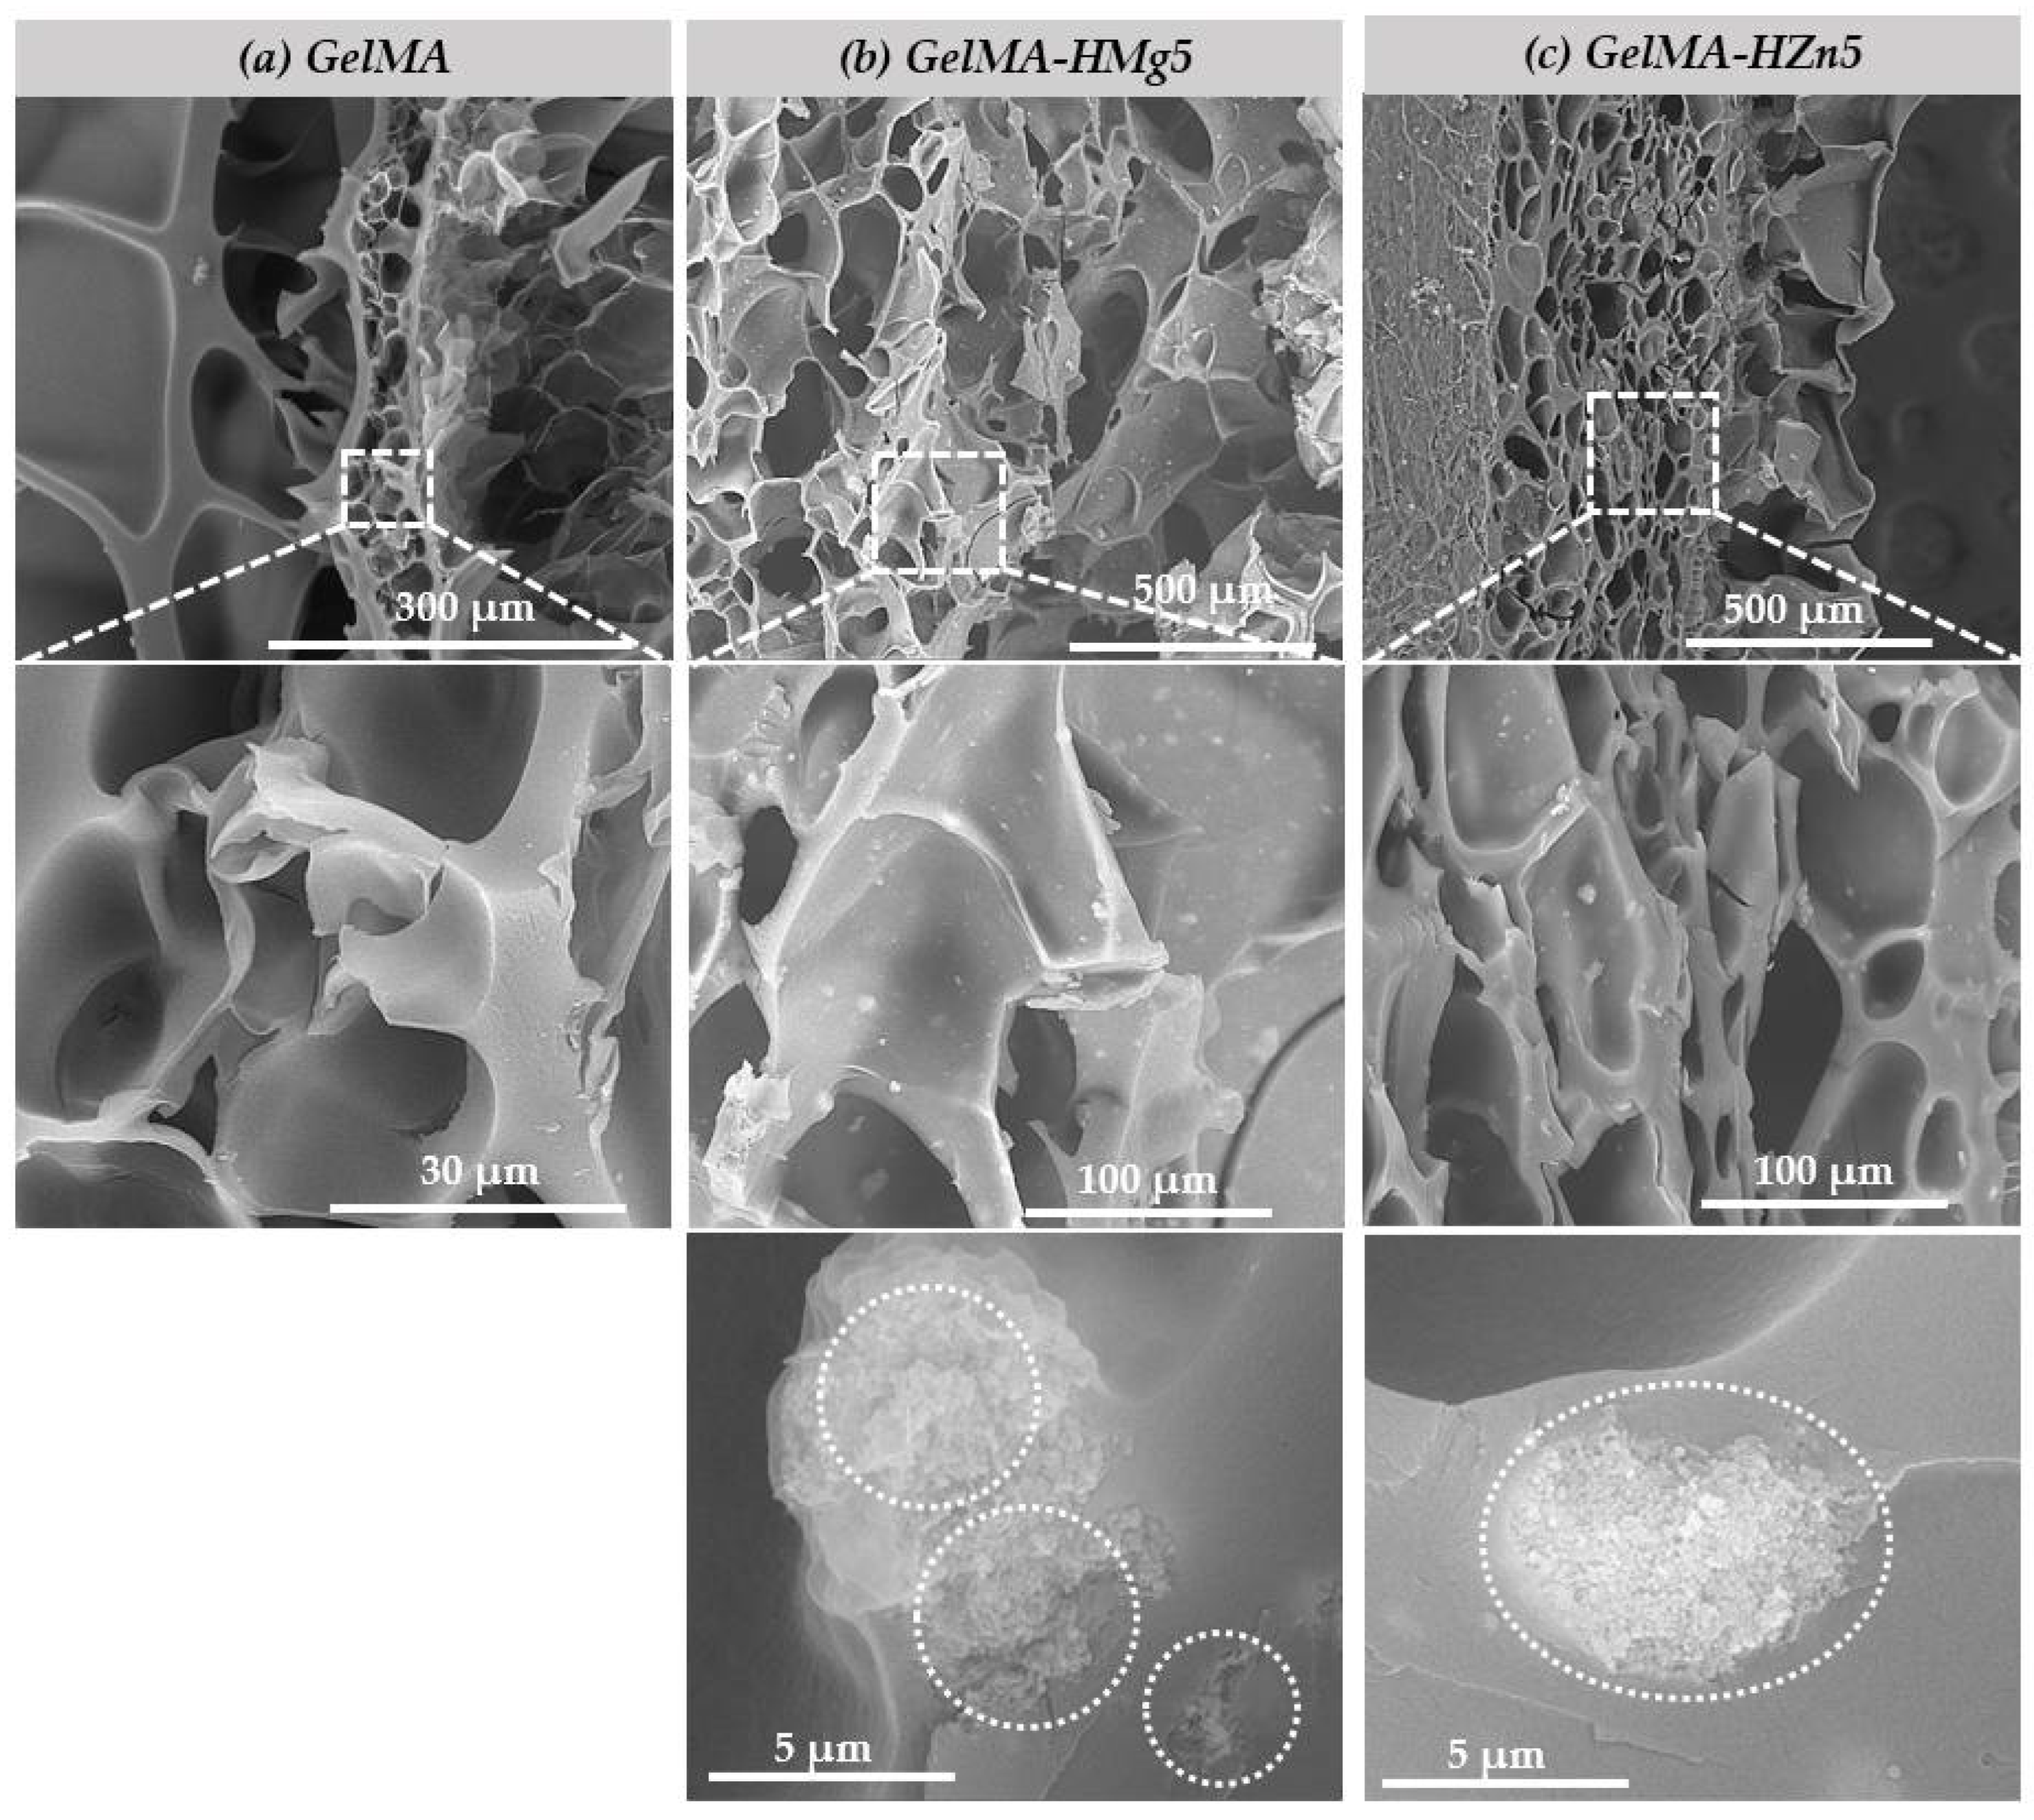
3.2.2. Scanning Electron Microscopy (SEM)
3.3. Characterization of the 3D Printed Hydrogel Scaffolds 20%GelMA-3%HAP-Mg, 25%GelMA-3%HAP-Mg, 35%GelMA-3%HAP-Mg, 20%GelMA-3%HAP-Zn, 25%GelMA-3%HAP-Zn, and 35%GelMA-3%HAP-Zn
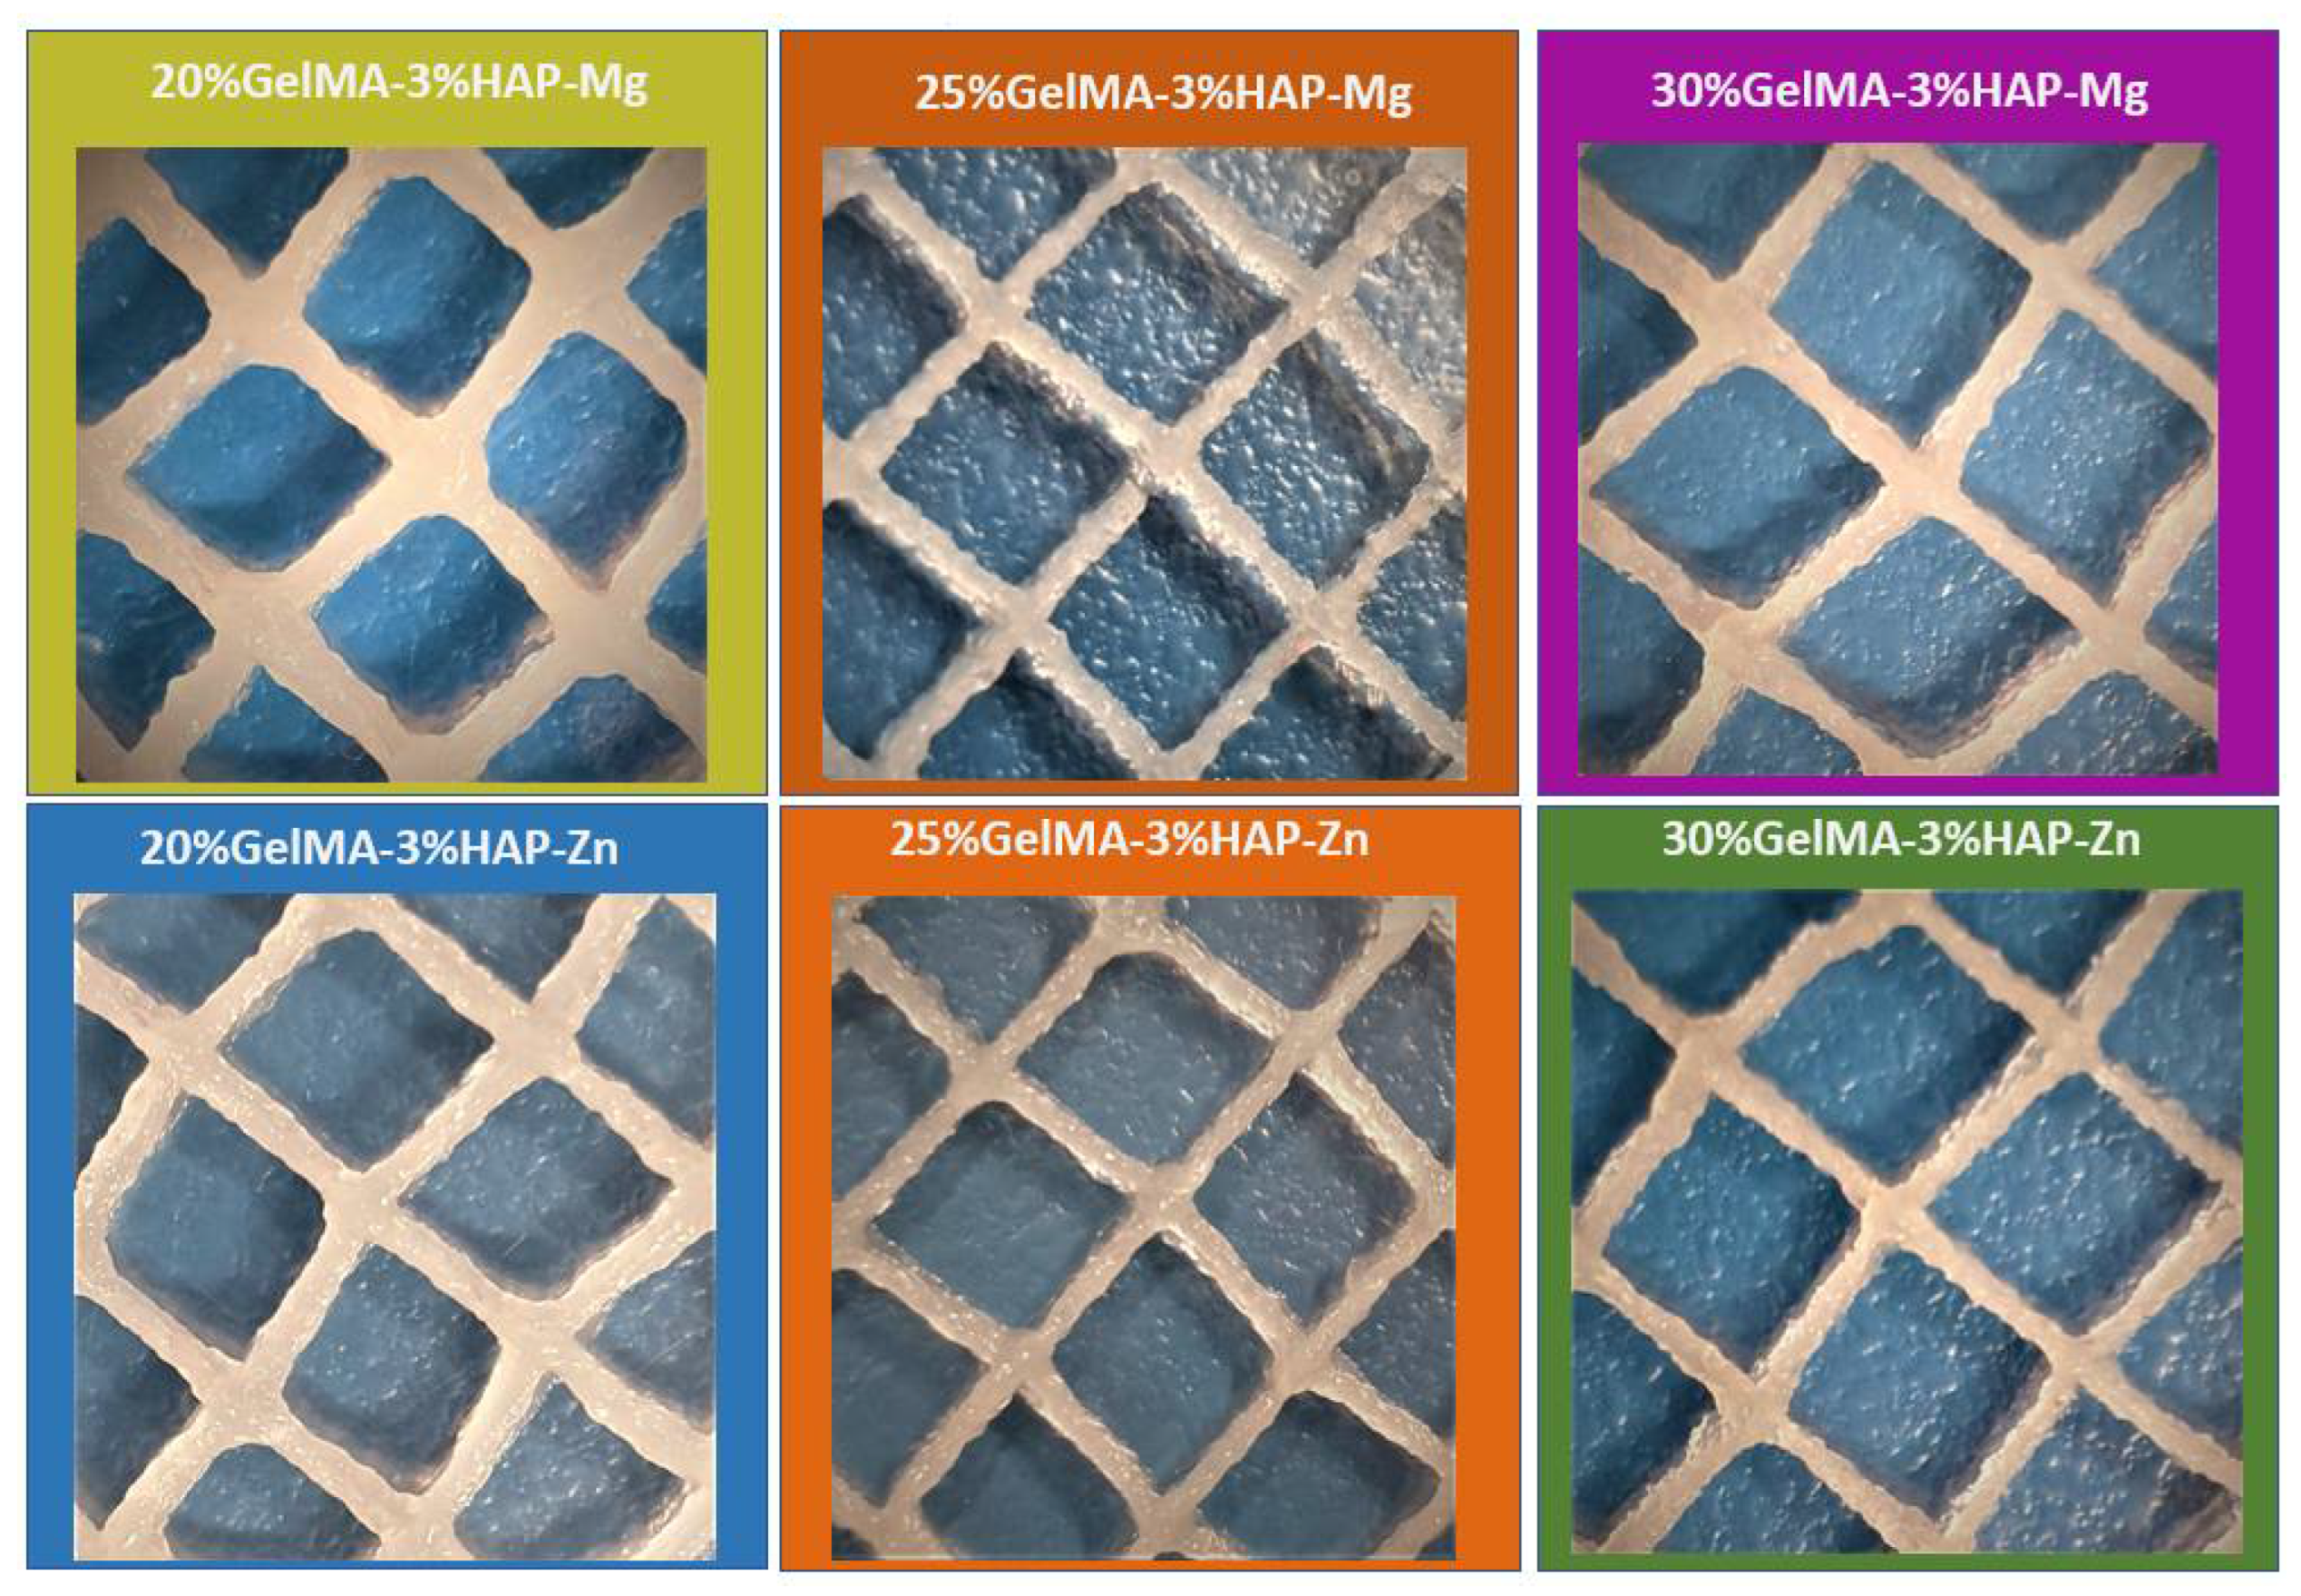
3.3.1. Printability
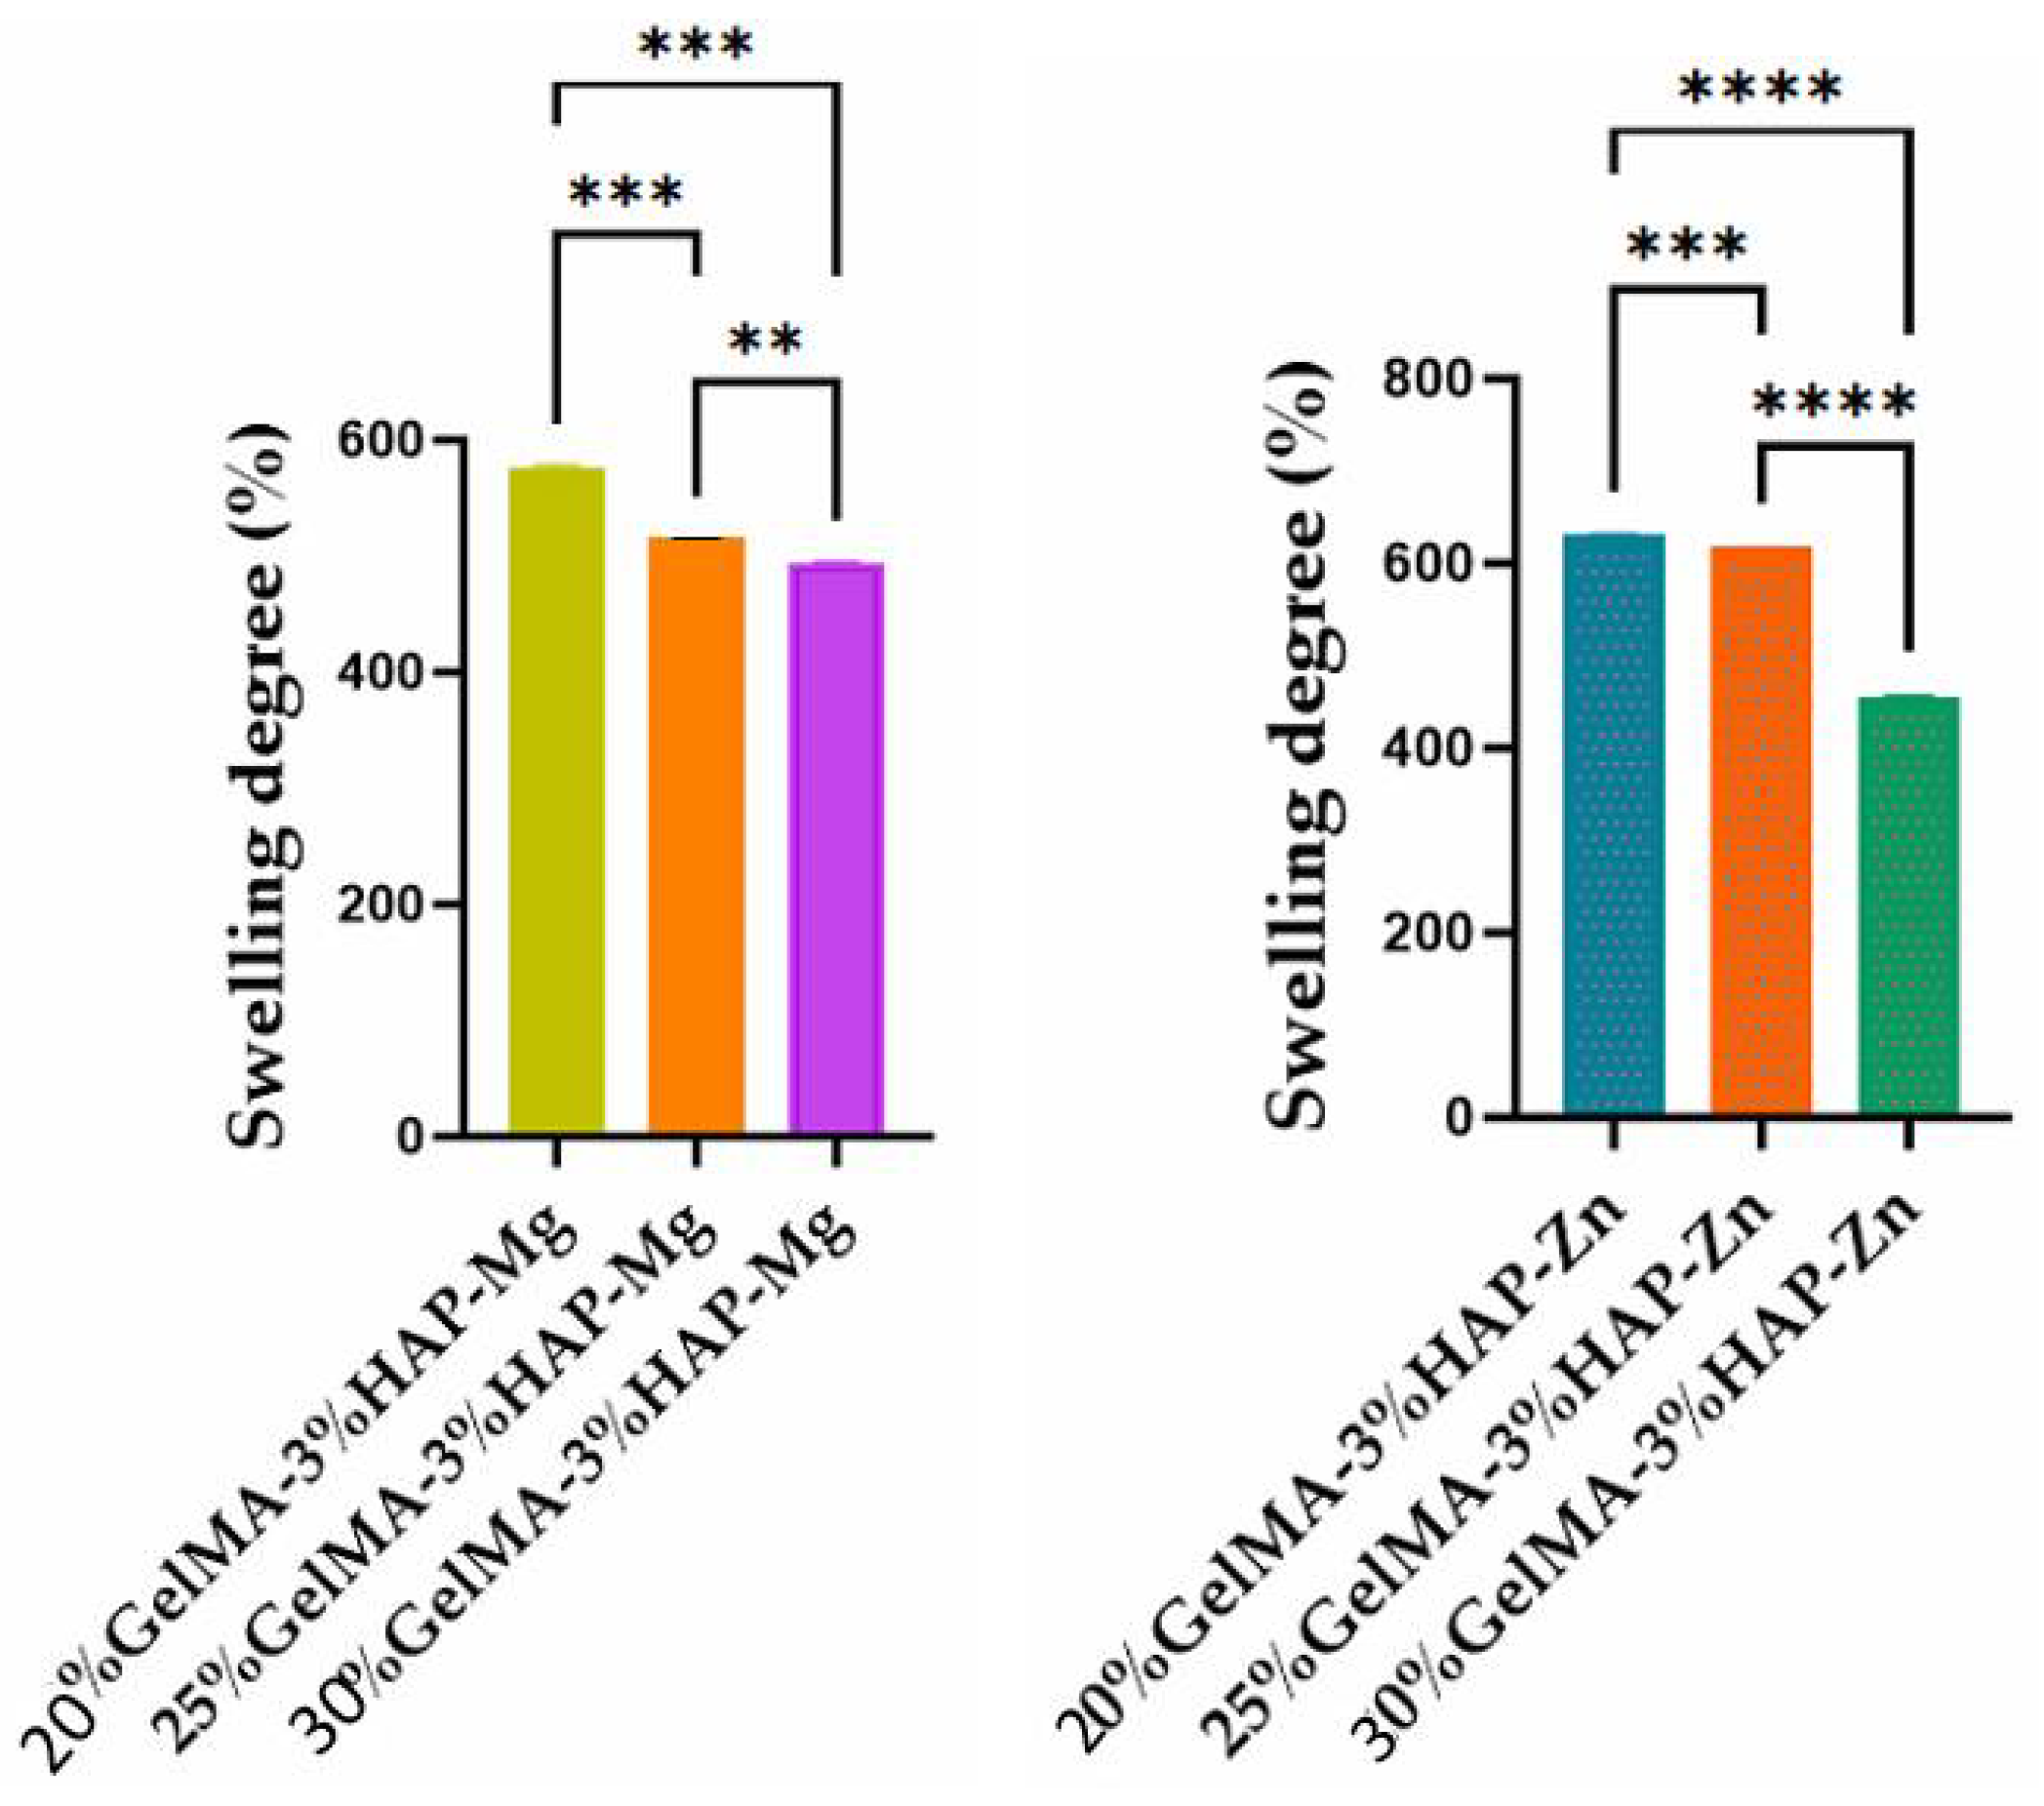
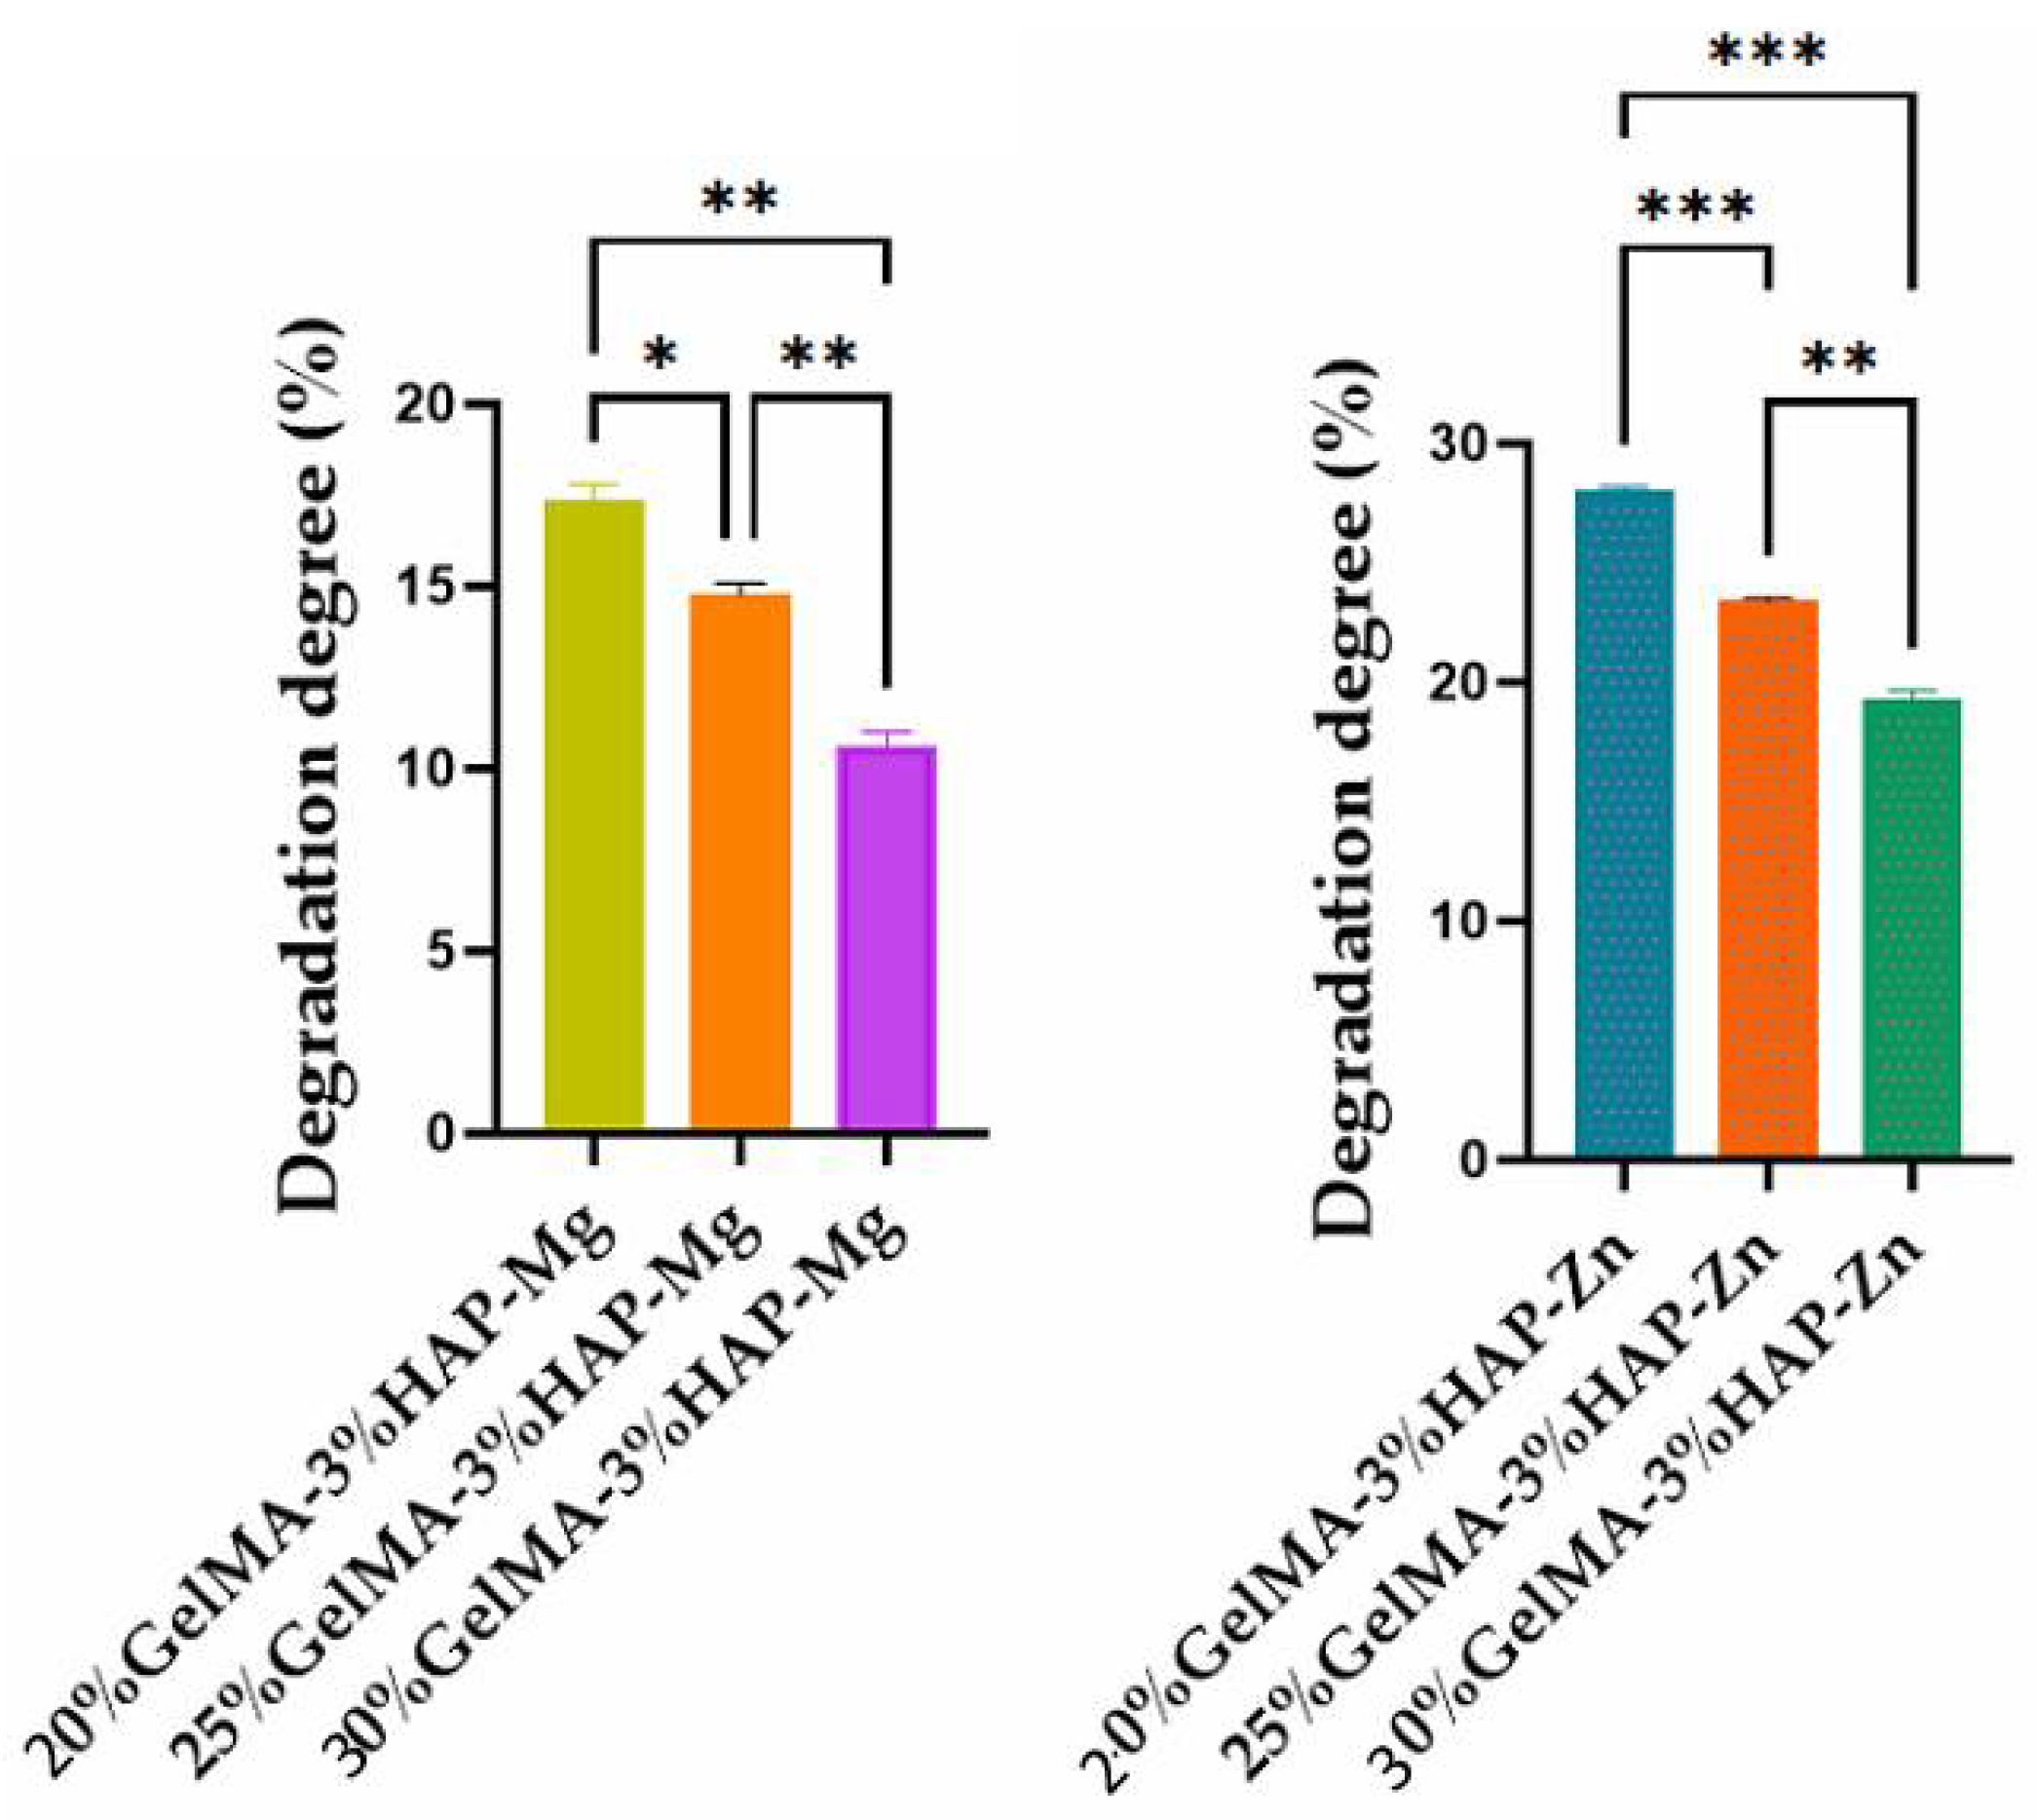
3.3.2. Swelling Degree and Degradability of the 3D-Printed Bio-Inks Based on GelMA with Different Reinforcer Agents
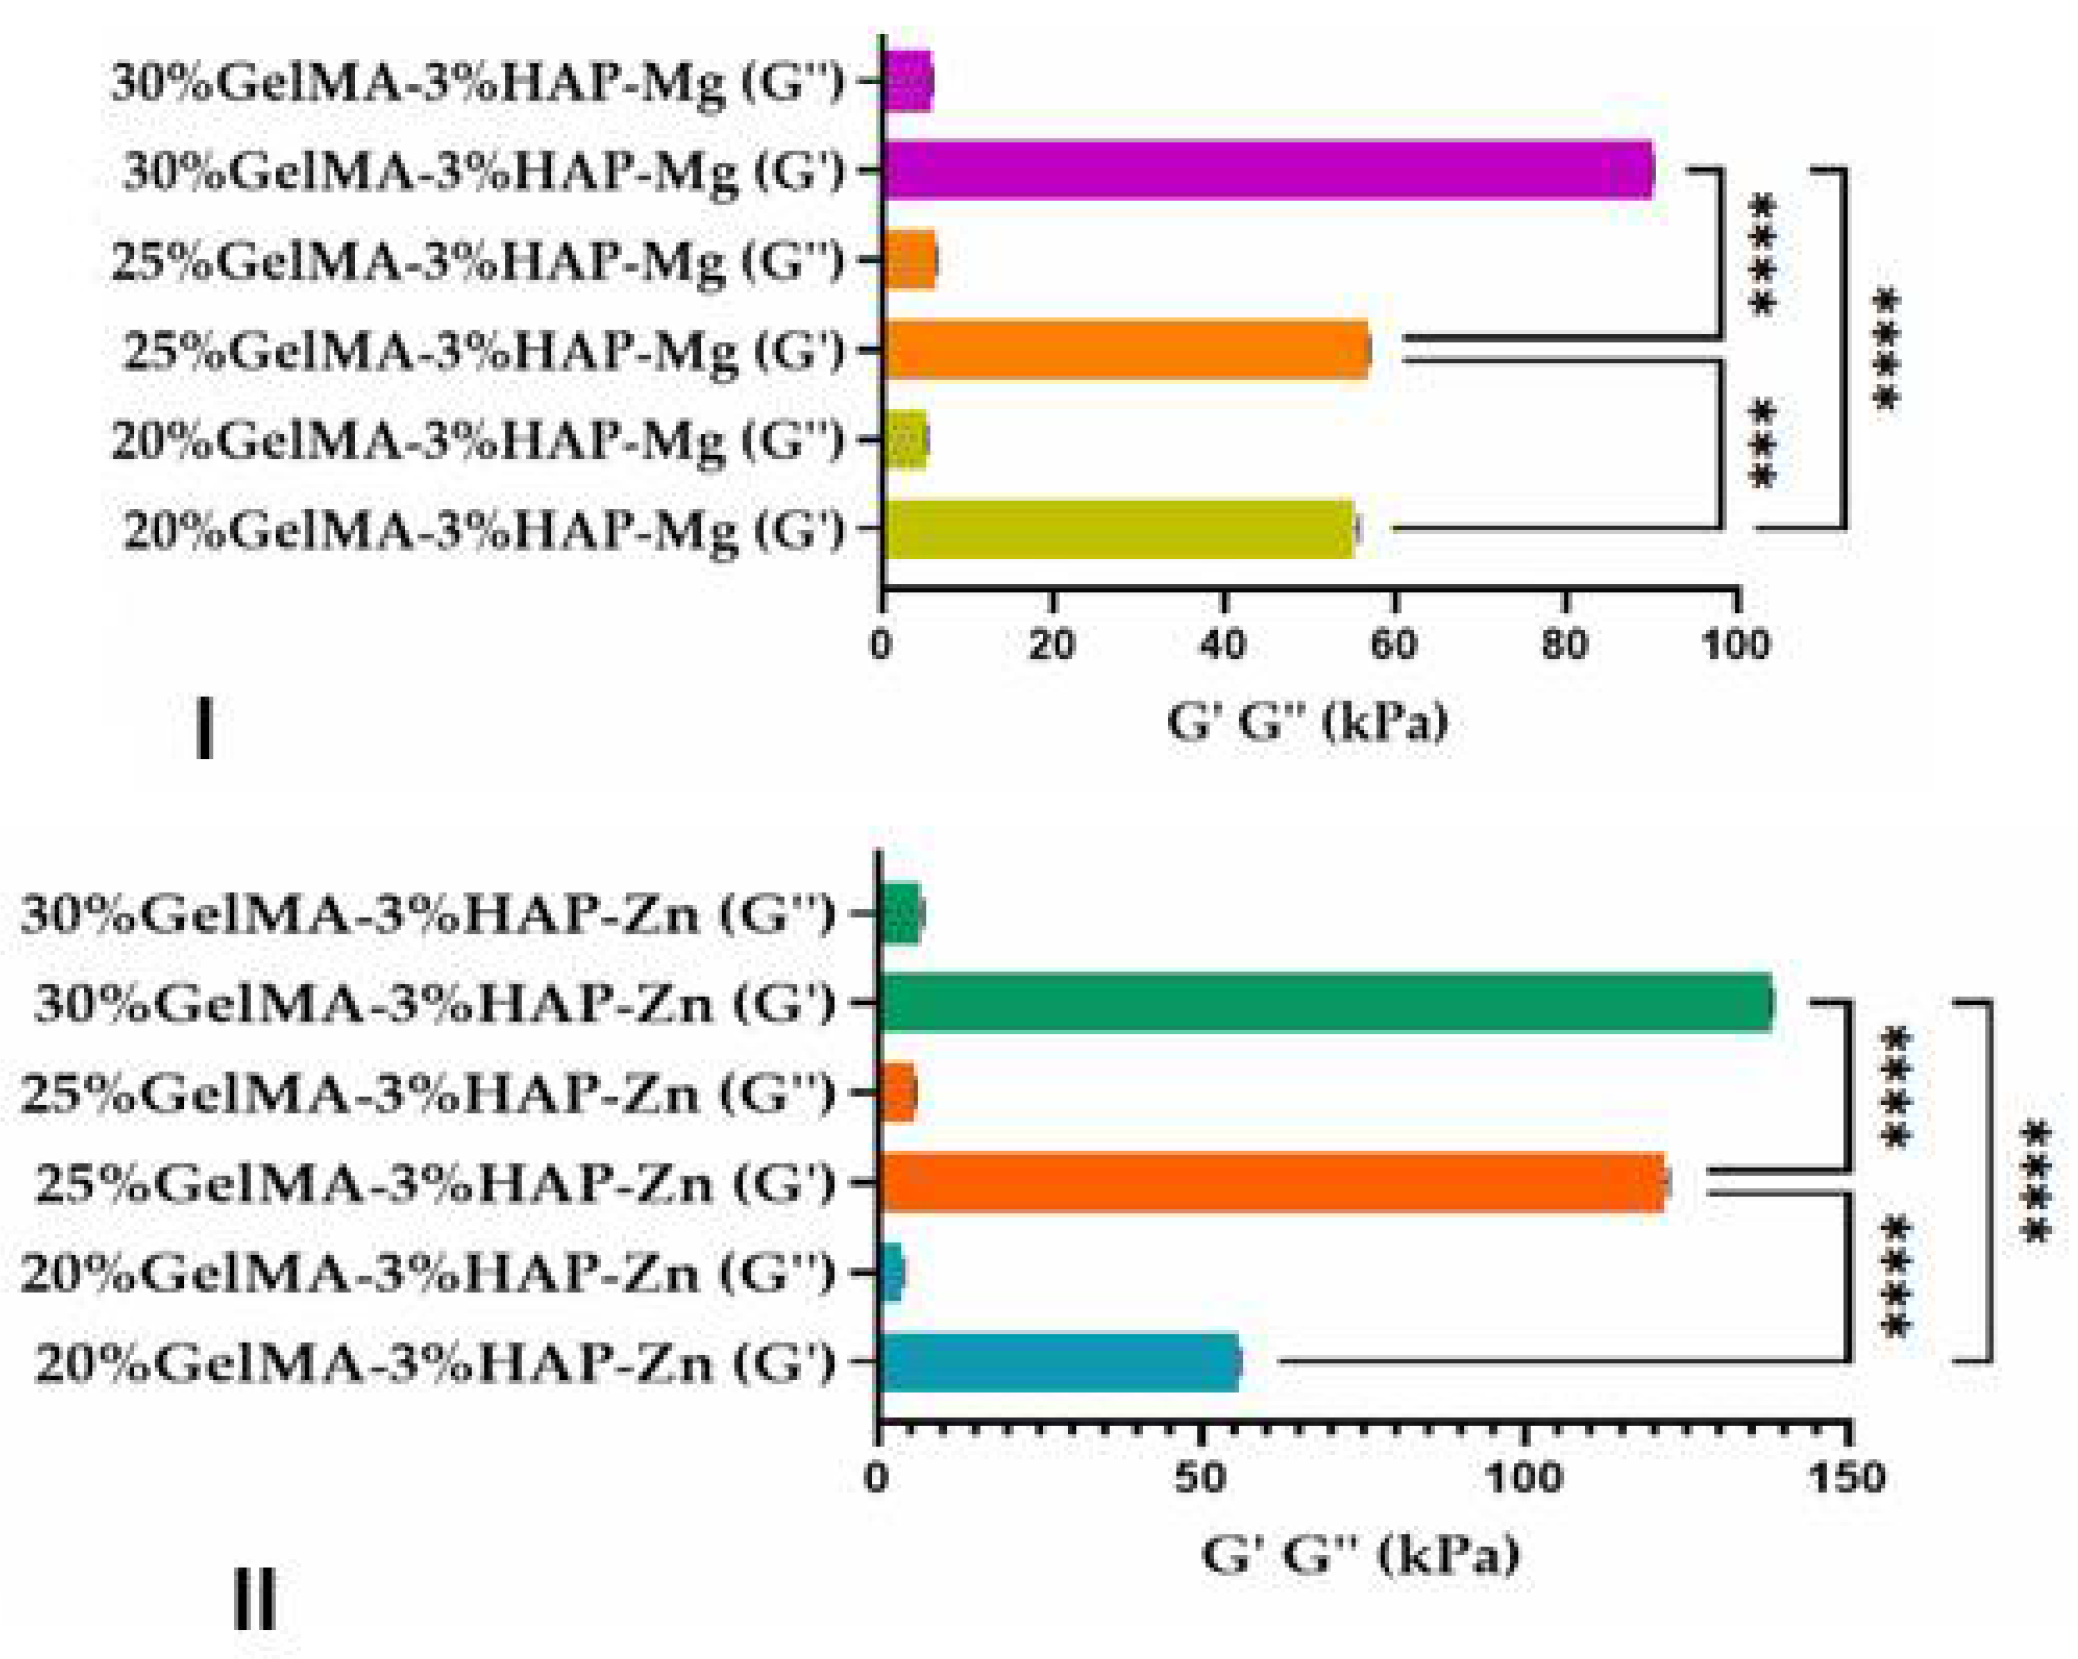
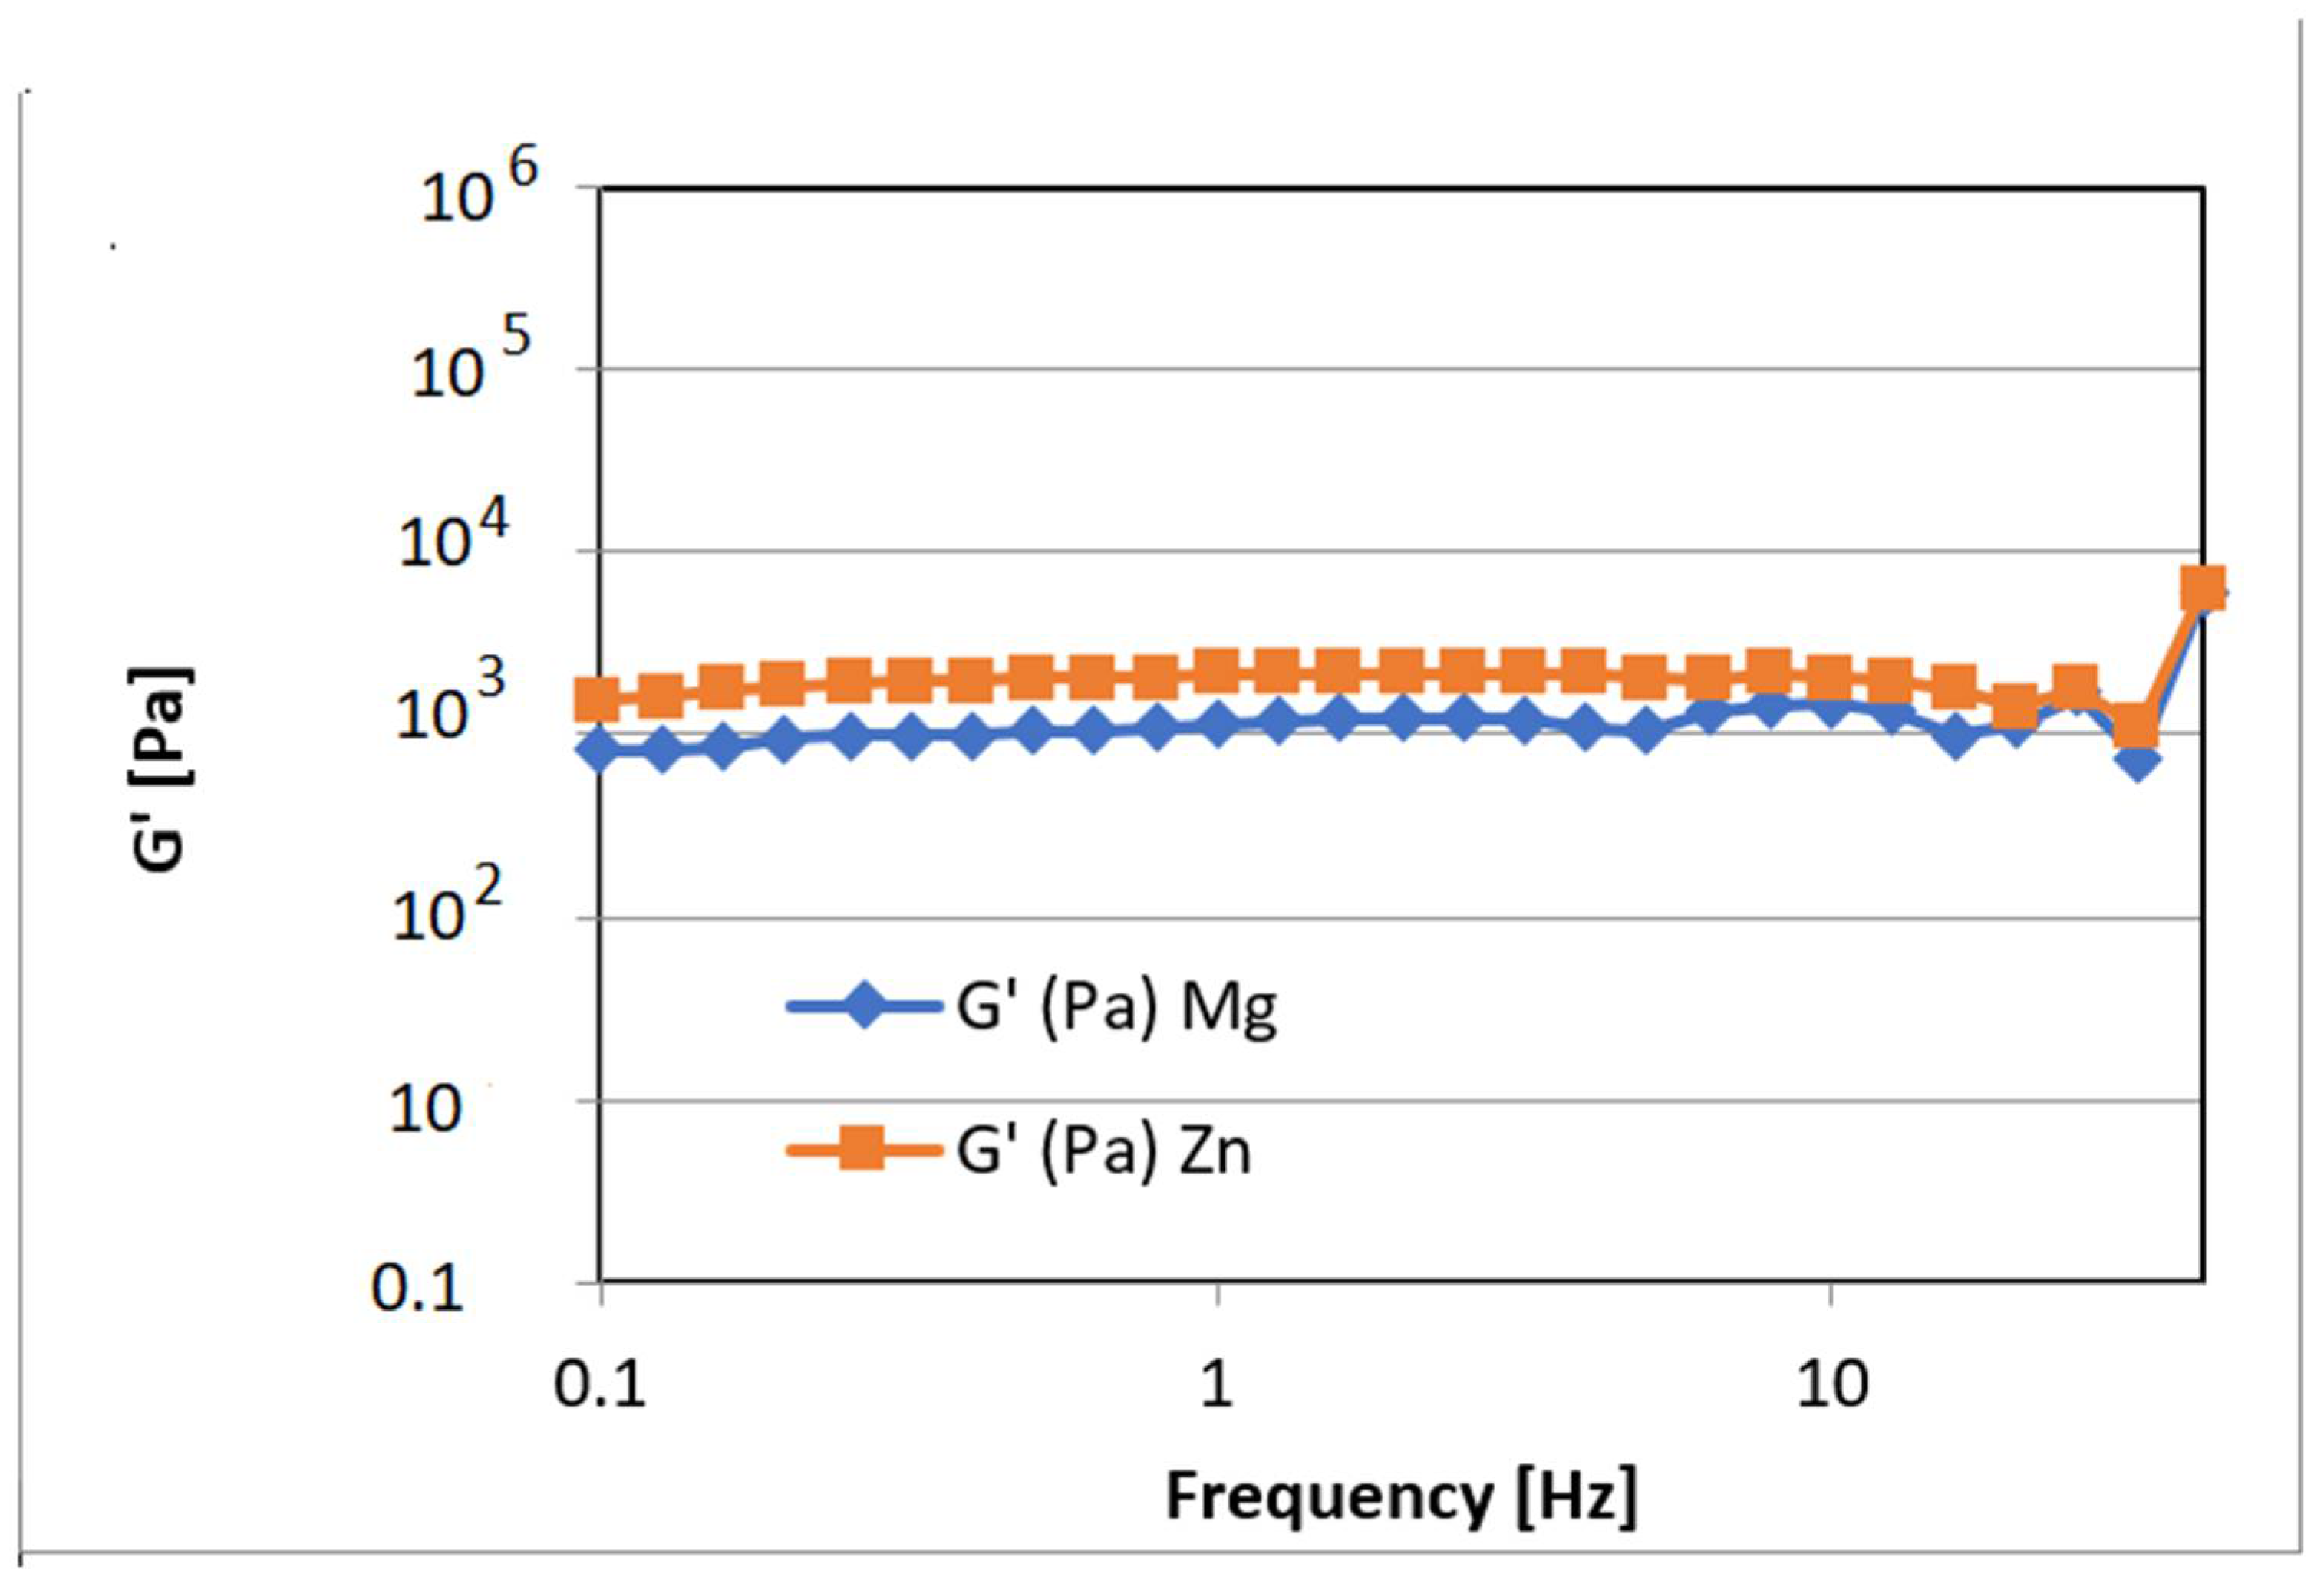
3.3.3. Mechanical Properties of the 3D-Printed Scaffolds
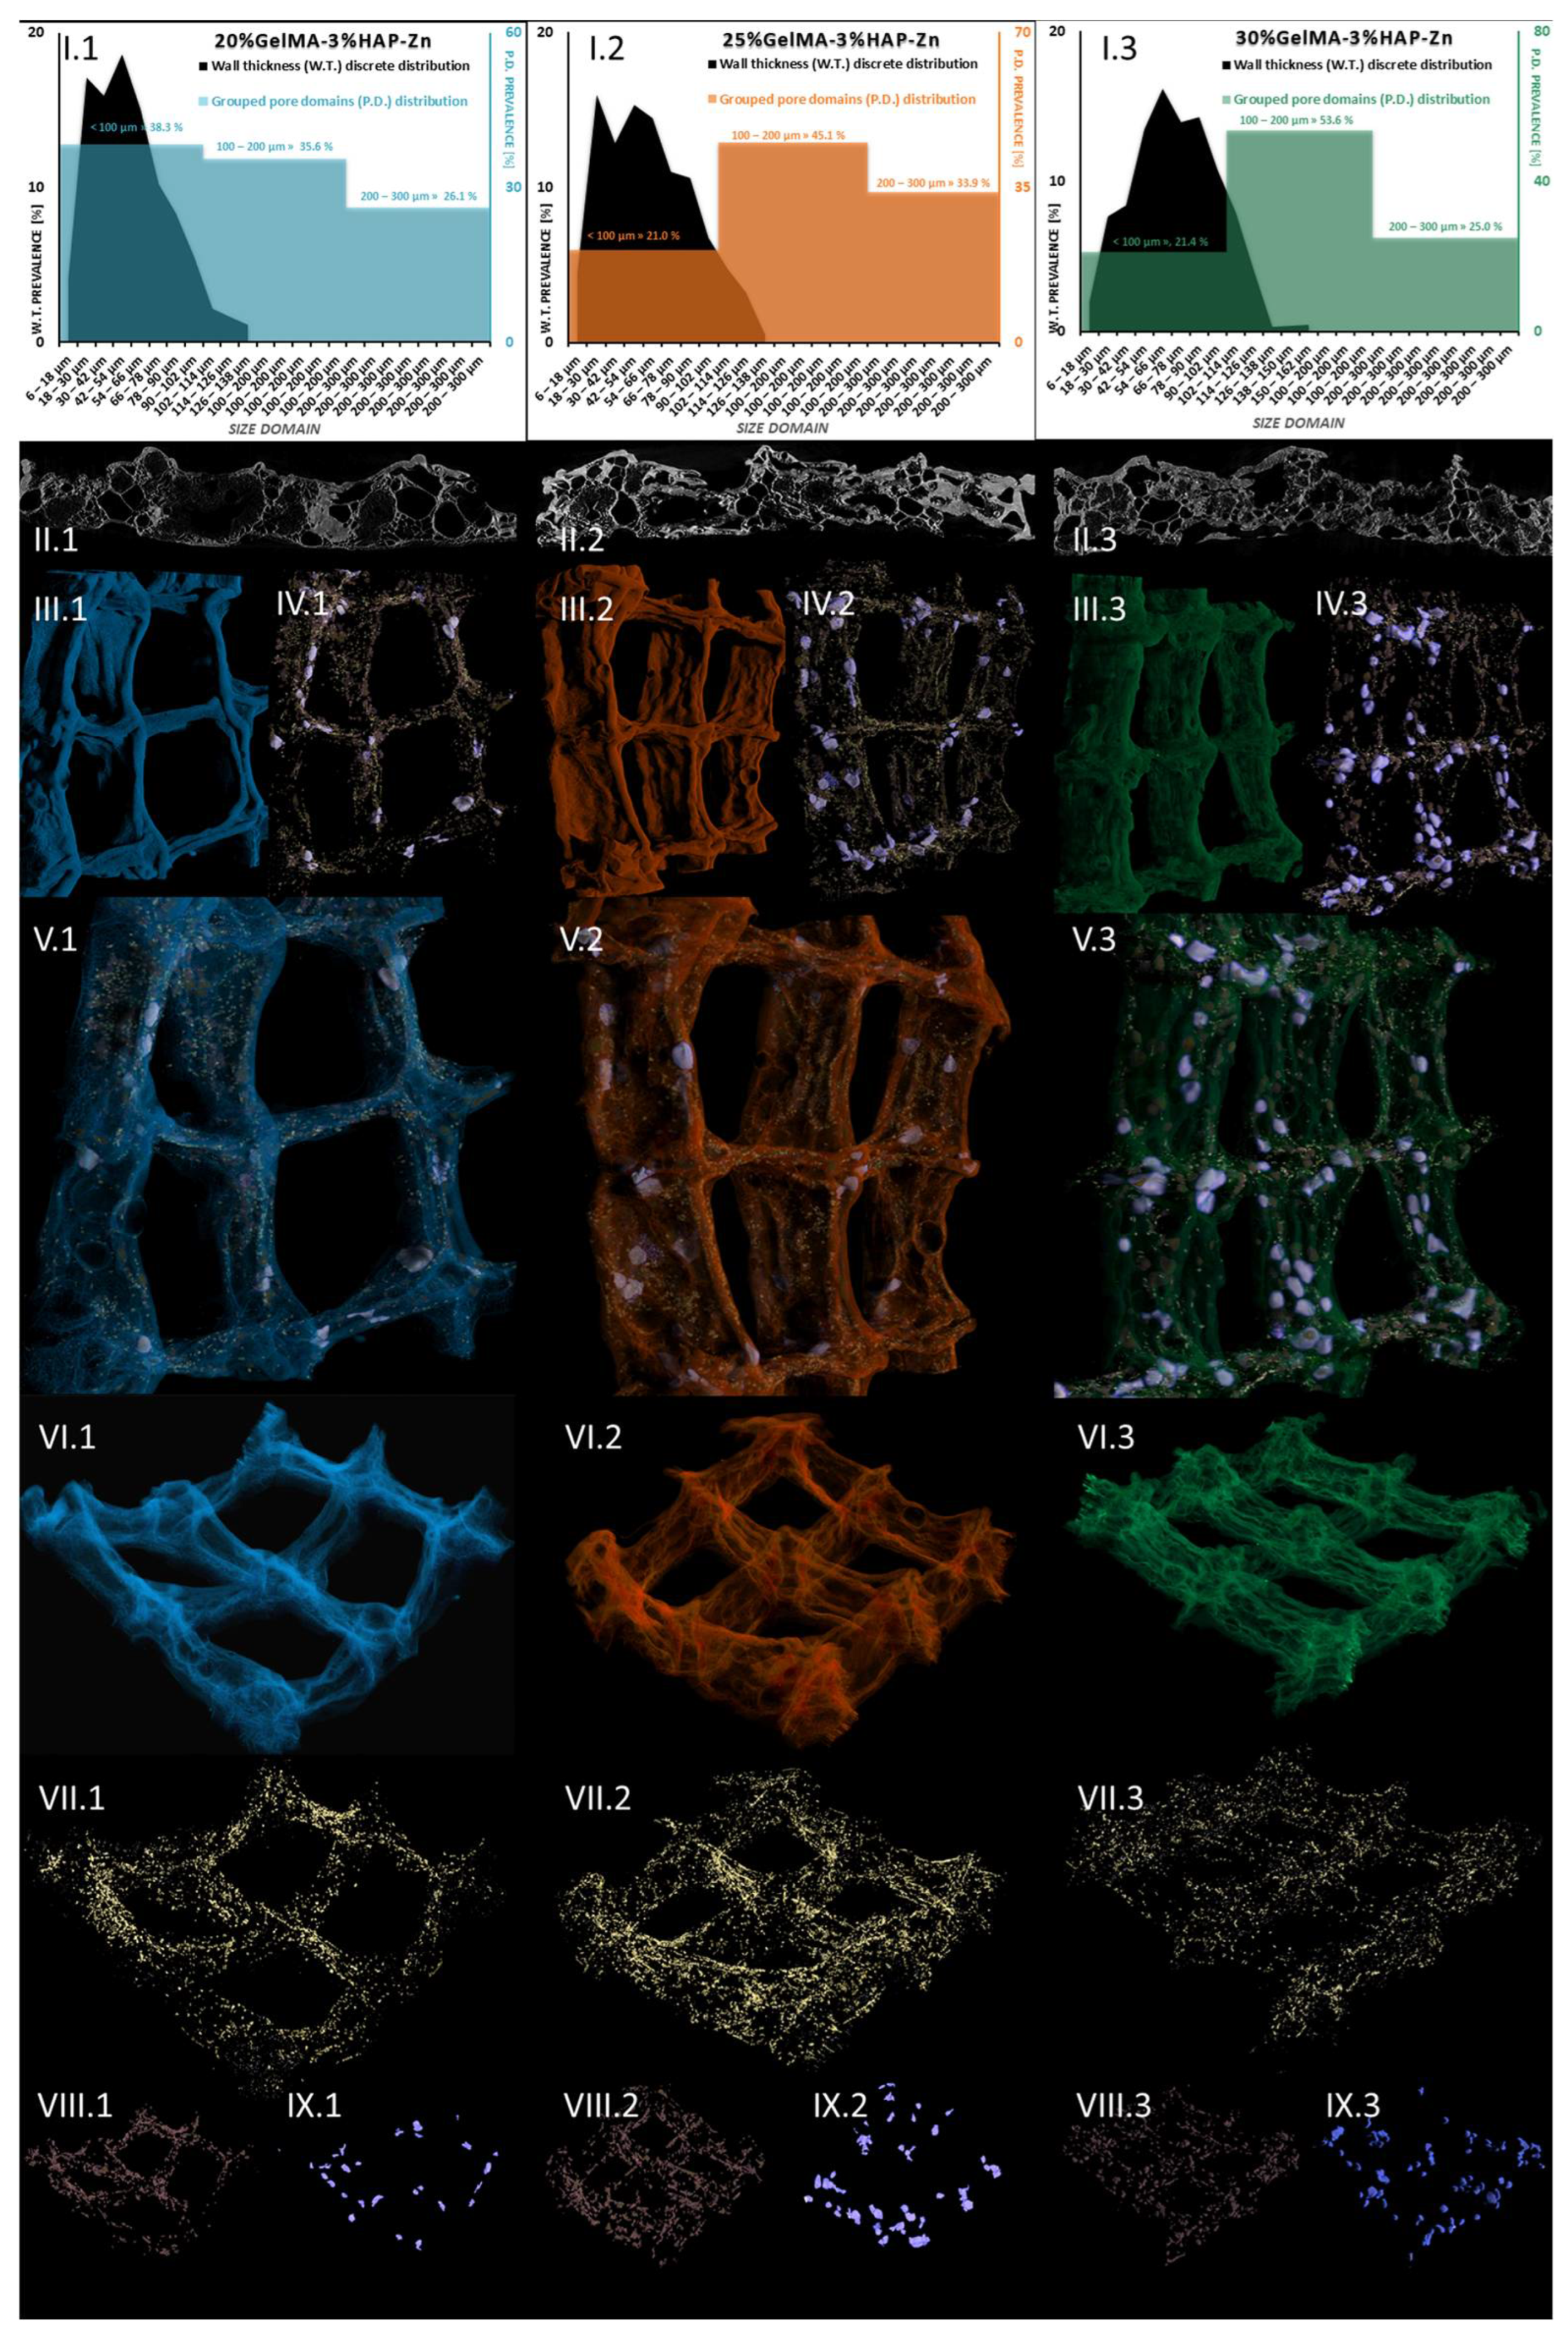
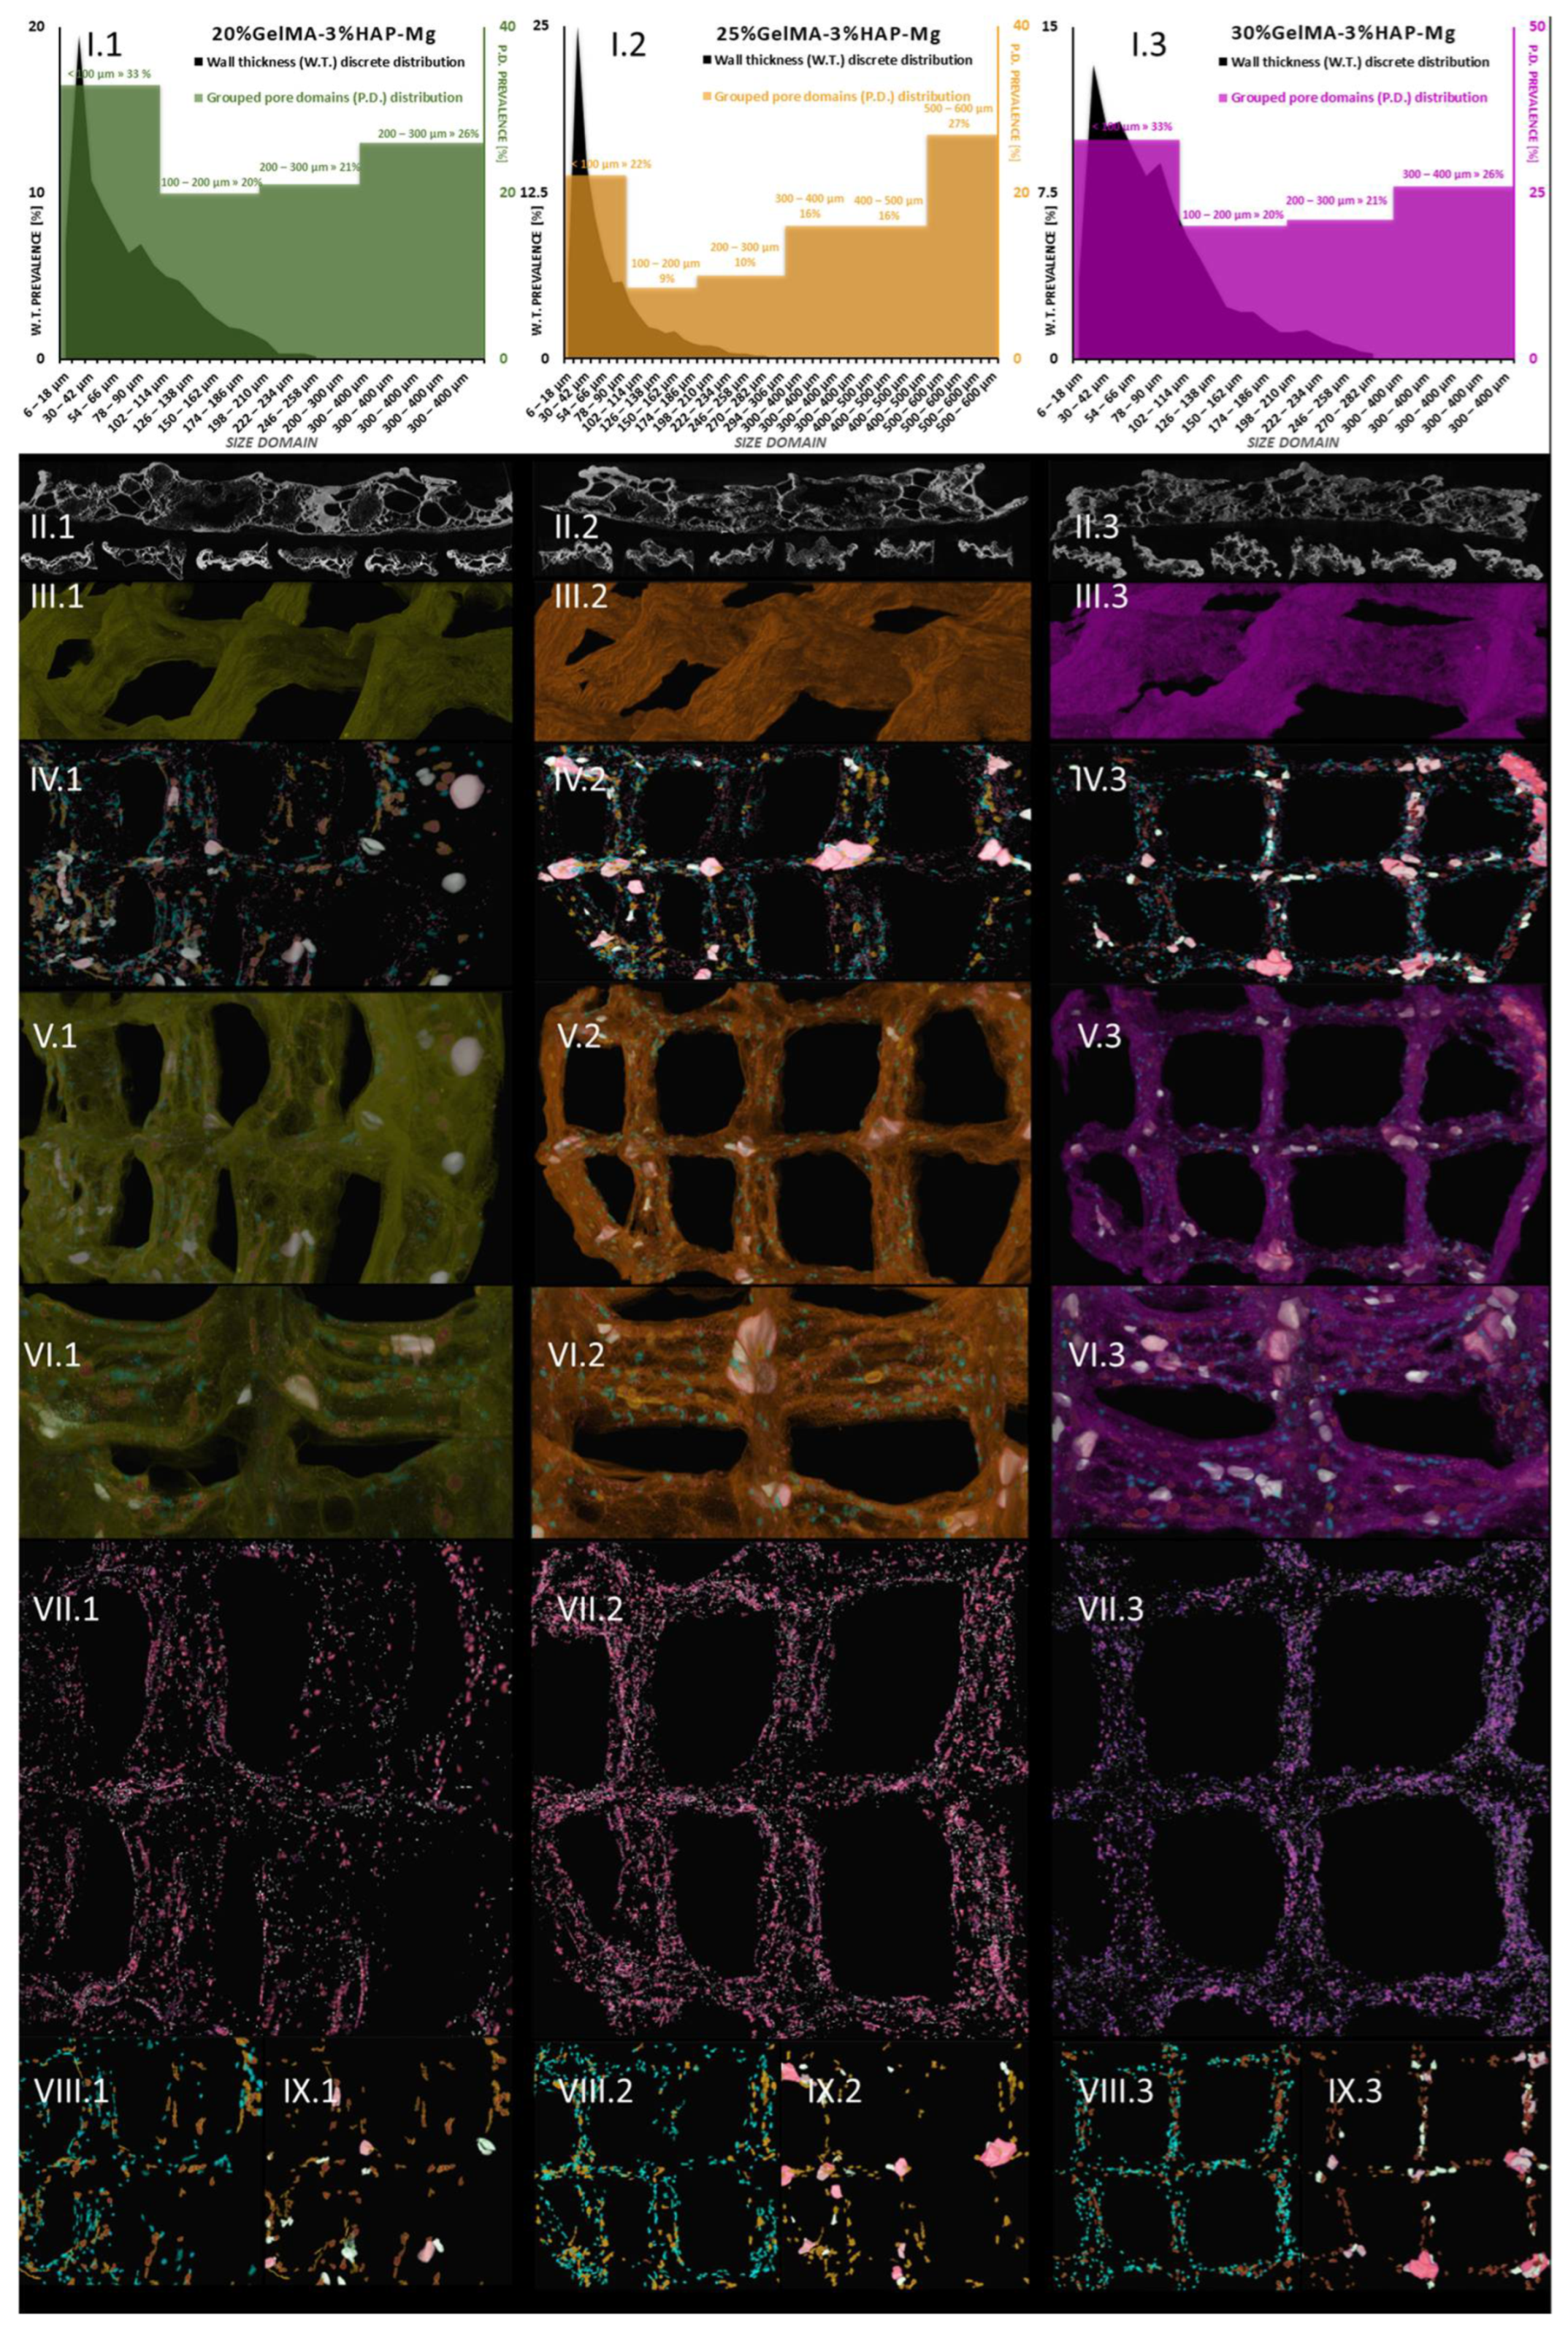
3.3.4. Micro-Computer Tomography (µCT)
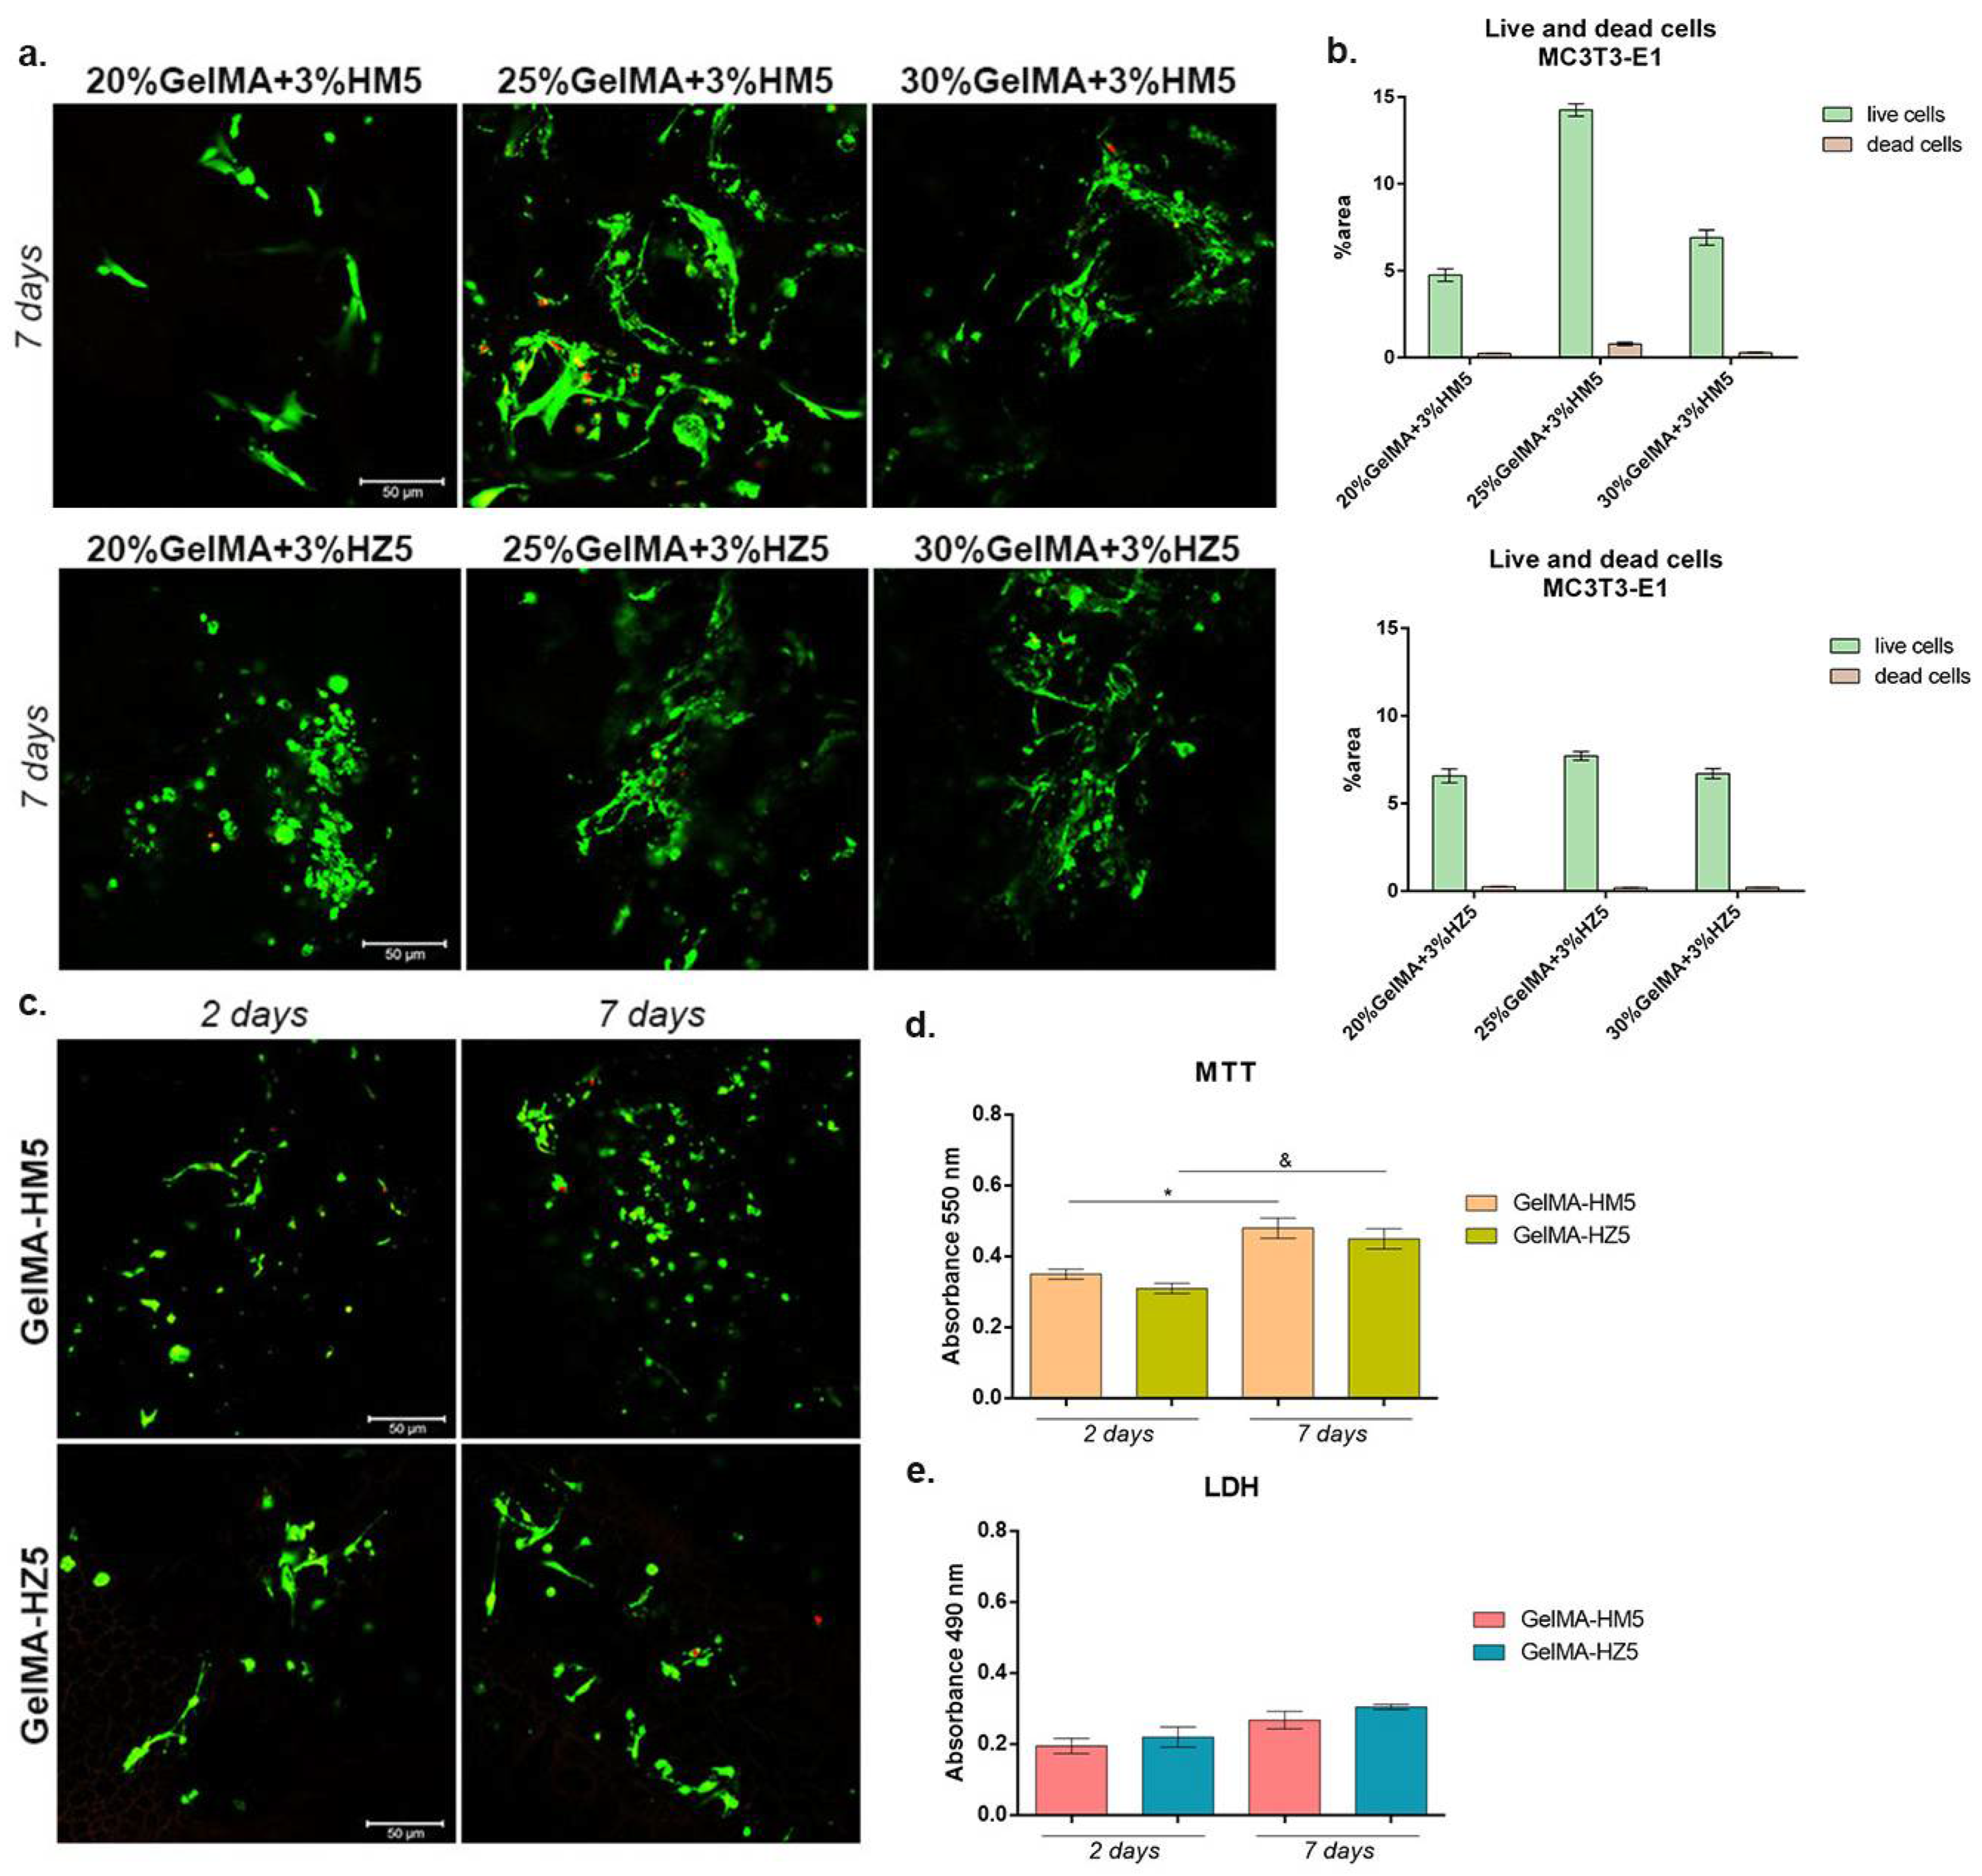
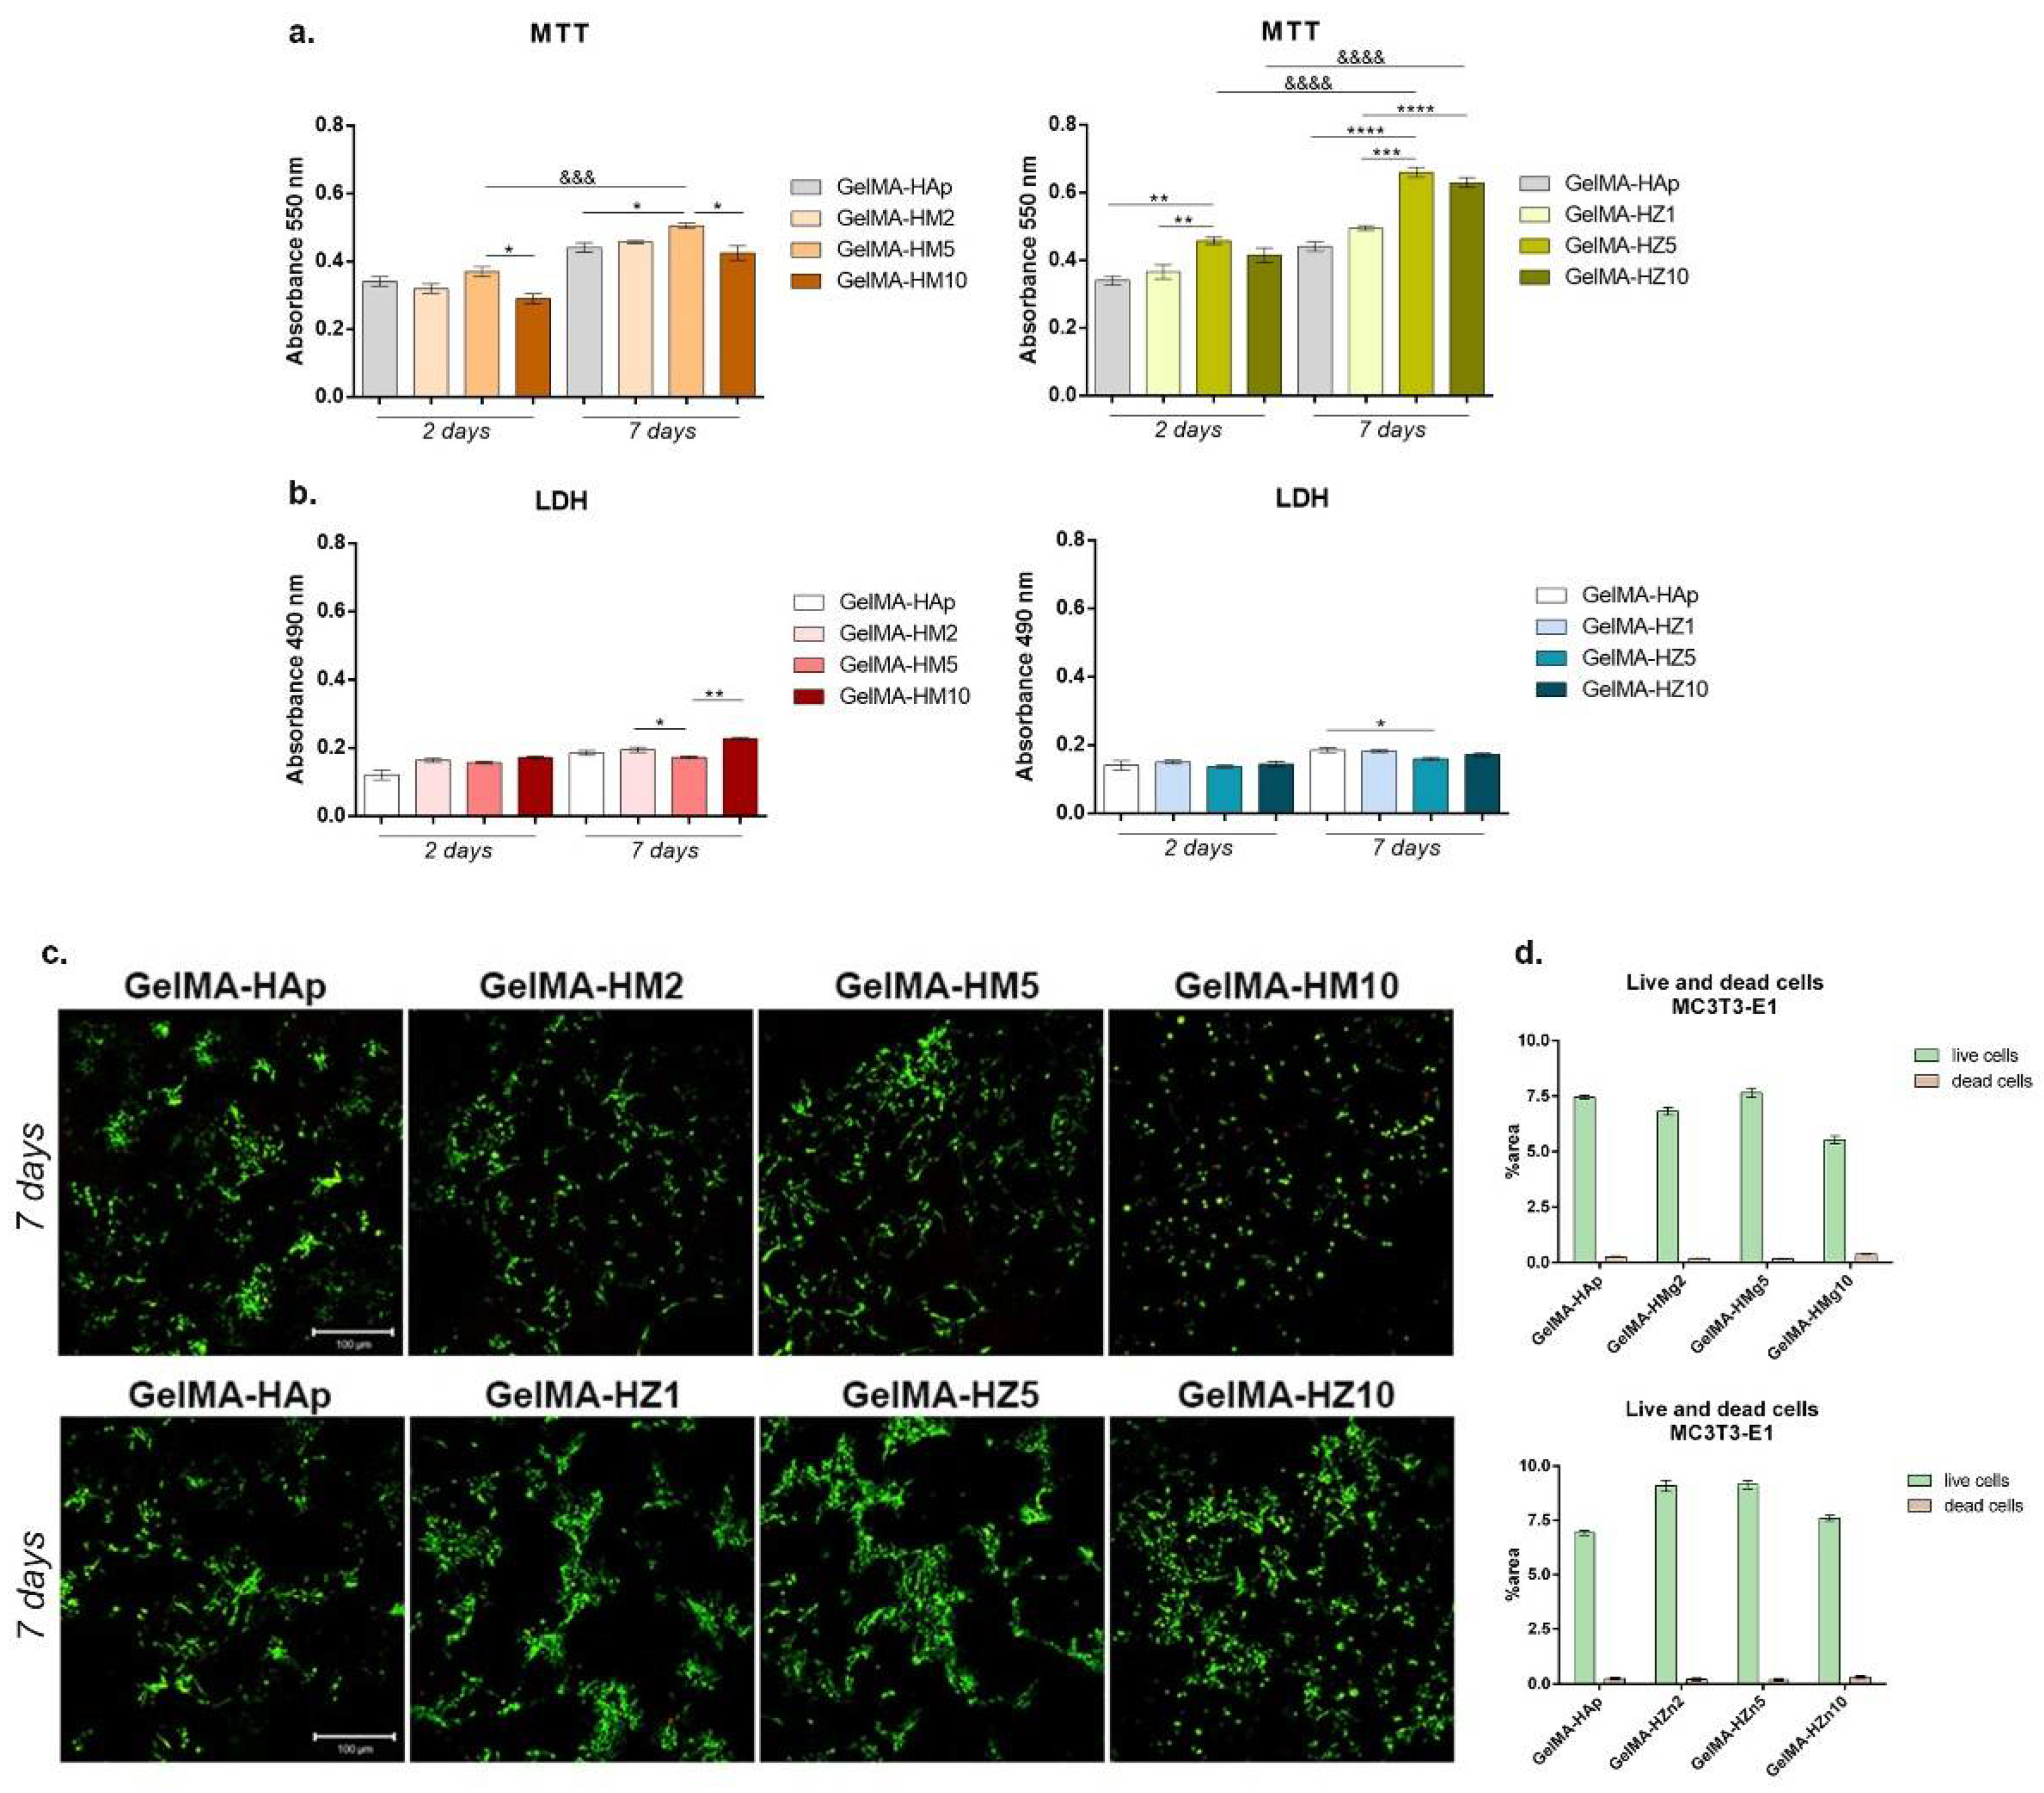
3.3.5. Biocompatibility Evaluation of the 3D Scaffolds
- Cell viability
- Materials’ cytotoxicity
- Live/dead fluorescence microscopy
3.3.6. Evaluation of Cellular Reaction on the Printed Scaffolds
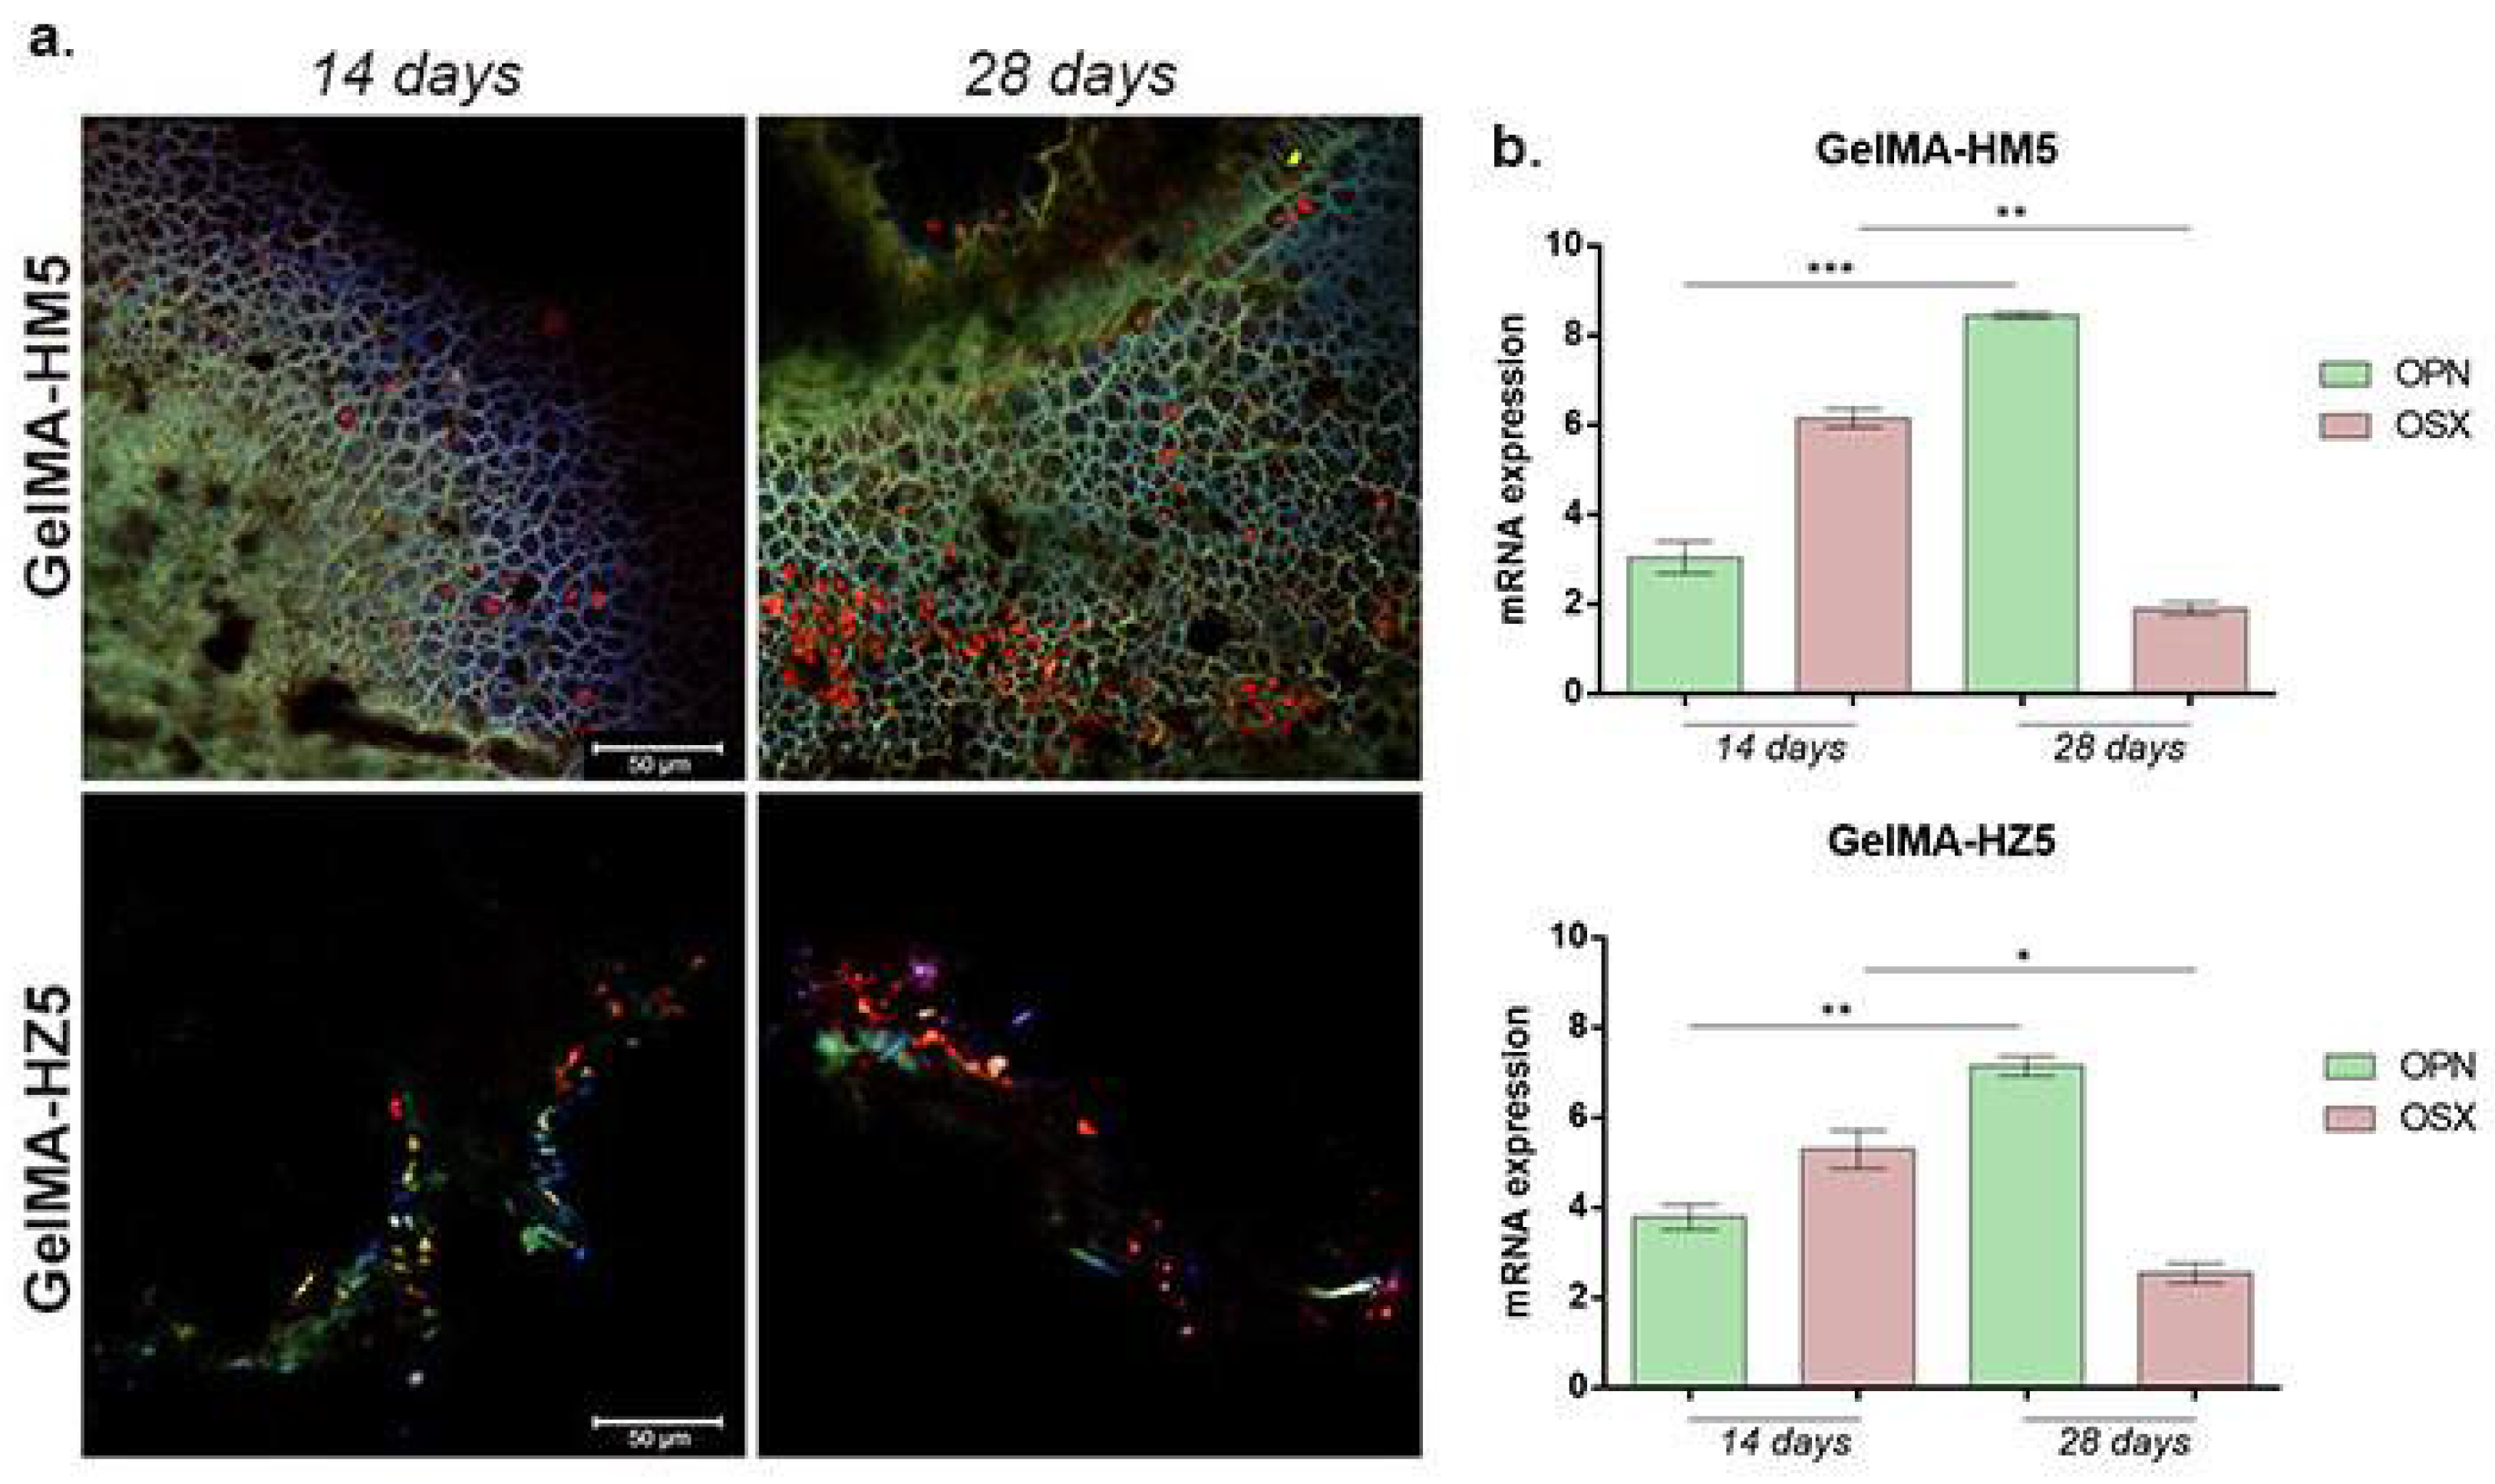
3.3.7. Osteogenic Differentiation Supported by GelMA-HM5 and GelMA-HZ5 Printed Scaffolds
4. Conclusions
Author Contributions
Funding
Data Availability Statement
Acknowledgments
Conflicts of Interest
References
- McGovern, J.A.; Griffin, M.; Hutmacher, D.W. Animal models for bone tissue engineering and modelling disease. Dis. Models Mech. 2018, 11, dmm033084. [Google Scholar] [CrossRef] [PubMed]
- Tang, G.; Tan, Z.; Zeng, W.; Wang, X.; Shi, C.; Liu, Y.; Ye, X. Recent advances of chitosan-based injectable hydrogels for bone and dental tissue regeneration. Front. Bioeng. Biotechnol. 2020, 8, 587658. [Google Scholar] [CrossRef] [PubMed]
- Black, C.R.; Goriainov, V.; Gibbs, D.; Kanczler, J.; Tare, R.S.; Oreffo, R.O. Bone tissue engineering. Curr. Mol. Biol. Rep. 2015, 1, 132–140. [Google Scholar] [CrossRef] [PubMed]
- Yue, S.; He, H.; Li, B.; Hou, T. Hydrogel as a biomaterial for bone tissue engineering: A review. Nanomaterials 2020, 10, 1511. [Google Scholar] [CrossRef] [PubMed]
- Bai, X.; Gao, M.; Syed, S.; Zhuang, J.; Xu, X.; Zhang, X.Q. Bioactive hydrogels for bone regeneration. Bioact. Mater. 2018, 3, 401–417. [Google Scholar] [CrossRef]
- Koons, G.L.; Diba, M.; Mikos, A.G. Materials design for bone-tissue engineering. Nat. Rev. Mater. 2020, 5, 584–603. [Google Scholar] [CrossRef]
- Chocholata, P.; Kulda, V.; Babuska, V. Fabrication of scaffolds for bone-tissue regeneration. Materials 2019, 12, 568. [Google Scholar] [CrossRef]
- Amini, A.R.; Laurencin, C.T.; Nukavarapu, S.P. Bone tissue engineering: Recent advances and challenges. Crit. Rev. Biomed. Eng. 2012, 40, 363–408. [Google Scholar] [CrossRef]
- Bahraminasab, M. Challenges on optimization of 3D-printed bone scaffolds. BioMedical Eng. OnLine 2020, 19, 1–33. [Google Scholar] [CrossRef]
- Heo, D.N.; Castro, N.J.; Lee, S.J.; Noh, H.; Zhu, W.; Zhang, L.G. Enhanced bone tissue regeneration using a 3D printed microstructure incorporated with a hybrid nano hydrogel. Nanoscale 2017, 9, 5055–5062. [Google Scholar] [CrossRef]
- Zhang, Y.; Li, Z.; Guan, J.; Mao, Y.; Zhou, P. Hydrogel: A potential therapeutic material for bone tissue engineering. AIP Adv. 2021, 11, 010701. [Google Scholar] [CrossRef]
- Scaglione, S.; Giannoni, P.; Bianchini, P.; Sandri, M.; Marotta, R.; Firpo, G.; Quarto, R. Order versus Disorder: In vivo bone formation within osteoconductive scaffolds. Sci. Rep. 2012, 2, 1–6. [Google Scholar] [CrossRef] [PubMed]
- Chimene, D.; Kaunas, R.; Gaharwar, A.K. Hydrogel bioink reinforcement for additive manufacturing: A focused review of emerging strategies. Adv. Mater. 2020, 32, 1902026. [Google Scholar] [CrossRef] [PubMed]
- Olăreț, E.; Bălănucă, B.; Onaș, A.M.; Ghițman, J.; Iovu, H.; Stancu, I.C.; Serafim, A. Double-Cross-Linked Networks Based on Methacryloyl Mucin. Polymers 2021, 13, 1706. [Google Scholar] [CrossRef] [PubMed]
- Wang, C.; Huang, W.; Zhou, Y.; He, L.; He, Z.; Chen, Z.; Wang, M. 3D printing of bone tissue engineering scaffolds. Bioact. Mater. 2020, 5, 82–91. [Google Scholar] [CrossRef]
- Chronopoulou, L.; Cacciotti, I.; Amalfitano, A.; Di Nitto, A.; D’Arienzo, V.; Nocca, G.; Palocci, C. Biosynthesis of innovative calcium phosphate/hydrogel composites: Physicochemical and biological characterization. Nanotechnology 2021, 32, 095102. [Google Scholar] [CrossRef]
- Hossan, M.J.; Gafur, M.A.; Kadir, M.R.; Karim, M.M. Preparation and Characterization of Gelatin-Hydroxyapatite Composite for Bone Tissue Engineering. Int. J. Eng. Technol. 2014, 14, 113–122. [Google Scholar]
- Ofudje, E.A.; Adeogun, A.I.; Idowu, M.A.; Kareem, S.O. Synthesis and characterization of Zn-Doped hydroxyapatite: Scaffold application, antibacterial and bioactivity studies. Heliyon 2019, 5, e01716. [Google Scholar] [CrossRef]
- Batool, S.; Liaqat, U.; Hussain, Z.; Sohail, M. Synthesis, Characterization and Process Optimization of Bone Whitlockite. Nanomaterials 2020, 10, 1856. [Google Scholar] [CrossRef]
- Popa, C.L.; Deniaud, A.; Michaud-Soret, I.; Guégan, R.; Motelica-Heino, M.; Predoi, D. Structural and Biological Assessment of Zinc Doped Hydroxyapatite Nanoparticles. J. Nanomater. 2016, 1–10. [Google Scholar] [CrossRef]
- Alioui, H.; Bouras, O.; Bollinger, J.C. Toward an efficient antibacterial agent: Zn- and Mg-doped hydroxyapatite nanopowders. J. Environ. Sci. Health Part A 2019, 54, 315–327. [Google Scholar] [CrossRef]
- Sprio, S.; Dapporto, M.; Preti, L.; Mazzoni, E.; Iaquinta, M.R.; Martini, F.; Tognon, M.; Pugno, N.M.; Restivo, E.; Visai, L.; et al. Enhancement of the Biological and Mechanical Performances of Sintered Hydroxyapatite by Multiple Ions Doping. Front. Mater. 2020, 7, 1–18. [Google Scholar] [CrossRef]
- Uysal, I.; Yilmaz, B.; Evis, Z. Zn-doped hydroxyapatite in biomedical applications. J. Aust. Ceram. Soc. 2021, 57, 869–897. [Google Scholar] [CrossRef]
- Moseke, C.; Alramadan, Y.A. Electrophoretic deposition of zinc-doped hydroxyapatite coatings on titanium: Deposition kinetics and coating morphology. Int. J. Surf. Sci. Eng. 2019, 13, 201–219. [Google Scholar] [CrossRef]
- Predoi, D.; Iconaru, S.L.; Predoi, M.V.; Buton, N.; Motelica-Heino, M. Zinc Doped Hydroxyapatite Thin Films Prepared by Sol–Gel Spin Coating Procedure. Coatings 2019, 9, 156. [Google Scholar] [CrossRef]
- Popa, C.L.; Bartha, C.M.; Albu, M.; Guégan, R.; Motelica-Heino, M.; Chifiriuc, C.M.; Bleotu, C.; Badea, M.L.; Antohe, S. Synthesis, Characterization and Cytotoxicity Evaluation on Zinc Doped Hydroxyapatite in Collagen Matrix. Dig. J. Nanomater. Biostructures 2015, 10, 681–691. [Google Scholar]
- Yedekci, Y.; Gedik, E.; Evis, Z.; Dogan, L.; Ozyigit, G.; Gurkaynak, M. Radiosensitization induced by zinc-doped hydroxyapatite nanoparticles in breast cancer cells. Int. J. Appl. Ceram. Technol. 2021, 18, 563–572. [Google Scholar] [CrossRef]
- Kargozar, S.; Milan, P.B.; Amoupour, M.; Kermani, F.; Gorgani, S.; Nazarnezhad, S.; Hooshmand, S.; Baino, F. Osteogenic Potential of Magnesium (Mg)-Doped Multicomponent Bioactive Glass: In Vitro and In Vivo Animal Studies. Materials 2022, 15, 318. [Google Scholar] [CrossRef]
- Zhang, X.; Huang, P.; Jiang, H.; Zhang, M.; Yu, F.; Dong, X.; Wang, L.; Chen, Y.; Zhang, W.; Qi, Y.; et al. A novel magnesium ion-incorporating dual-crosslinked hydrogel to improve bone scaffold-mediated osteogenesis and angiogenesis. Mater. Sci. Eng. C 2021, 121, 111868. [Google Scholar] [CrossRef]
- Landi, E.; Guizzardi, S.; Papa, E.; Galli, C. Mg,Sr-Cosubstituted Hydroxyapatite with Improved Structural Properties. Appl. Sci. 2021, 11, 4930. [Google Scholar] [CrossRef]
- Batool, S.; Liaqat, U.; Babar, B.; Hussain, Z. Bone whitlockite: Synthesis, applications, and future prospects. J. Korean Ceram. Soc. 2021, 58, 530–547. [Google Scholar] [CrossRef]
- Jang, H.L.; Lee, H.K.; Jin, K.; Ahn, H.Y.; Lee, H.E.; Nam, K.T. Phase transformation from hydroxyapatite to the secondary bone mineral, whitlockite. J. Mater. Chem. B 2021, 3, 1342–1349. [Google Scholar] [CrossRef] [PubMed]
- Baskaran, T.; Mohammad, N.F.; Saleh, S.S.M.; Nasir, N.F.M.; Mohd Daud, F.D. Synthesis Methods of Doped Hydroxyapatite: A Brief Review, International Conference on Biomedical Engineering. J. Phys. Conf. Ser. 2021, 2071, 012008. [Google Scholar] [CrossRef]
- Iglesias-Mejuto, A.; García-González, C.A. 3D-printed alginate-hydroxyapatite aerogel scaffolds for bone tissue engineering. Mater. Sci. Eng. C 2021, 131, 112525. [Google Scholar] [CrossRef] [PubMed]
- Leu Alexa, R.; Iovu, H.; Ghitman, J.; Serafim, A.; Stavarache, C.; Marin, M.M.; Ianchis, R. 3D-printed gelatin methacryloyl-based scaffolds with potential application in tissue engineering. Polymers 2021, 13, 727. [Google Scholar] [CrossRef]
- Boga, J.C.; Miguel, S.P.; de Melo-Diogo, D.; Mendonça, A.G.; Louro, R.O.; Correia, I.J. In vitro characterization of 3D printed scaffolds aimed at bone tissue regeneration. Colloids Surf. B Biointerfaces 2018, 165, 207–218. [Google Scholar] [CrossRef]
- Leu Alexa, R.; Cucuruz, A.; Ghițulică, C.-D.; Voicu, G.; Stamat, L.-R.; Dinescu, S.; Vlasceanu, G.M.; Stavarache, C.; Ianchis, R.; Iovu, H.; et al. 3D Printable Composite Biomaterials Based on GelMA and Hydroxyapatite Powders Doped with Cerium Ions for Bone Tissue Regeneration. Int. J. Mol. Sci. 2022, 23, 1841. [Google Scholar] [CrossRef]
- Leu Alexa, R.; Iovu, H.; Trica, B.; Zaharia, C.; Serafim, S.; Alexandrescu, E.; Radu, I.C.; Vlasceanu, G.; Preda, S.; Ninciuleanu, C.M.; et al. Assessment of Naturally Sourced Mineral Clays for the 3D Printing of Biopolymer-Based Nanocomposite Inks. Nanomaterials 2021, 11, 703. [Google Scholar] [CrossRef]
- Holzwarth, U.; Gibson, N. The Scherrer equation versus the Debye-Scherrer equation. Nat. Nanotechnol. 2011, 6, 534. [Google Scholar] [CrossRef]
- Ghitulica, C.D.; Damian-Buda, A.I.; Cucuruz, A.; Voicu, G. Synthesis and Characterization of ZnO(MgO)-CaO-SiO2-P2O5 Bioglass Obtained by Sol-Gel Method in Presence of Surfactant Agent. Gels 2021, 7, 187. [Google Scholar] [CrossRef]
- Fischer, M.; Maitz, M.F.; Werner, C. Hemocompatibility of Biomaterials for Clinical Applications: Blood-Biomaterials Interactions; Woodhead Publishing: Sawston, UK, 2018; pp. 163–190. ISBN 978-0-08-100497-5. [Google Scholar]
- Azami, M.; Samadikuchaksaraei, A.; Poursamar, S.A. Synthesis and characterization of a laminated hydroxyapatite/gelatin nanocomposite scaffold with controlled pore structure for bone tissue engineering. Int. J. Artif. Organs 2010, 33, 86–95. [Google Scholar] [CrossRef] [PubMed]
- Bauer, L.; Antunovi´c, M.; Rogina, A.; Ivankovi´c, M.; Ivankovic, H. Bone-mimetic porous hydroxyapatite/whitlockite scaffolds: Preparation, characterization and interactions with human mesenchymal stem cells. J. Mater. Sci. 2020, 56, 3947–3969. [Google Scholar] [CrossRef]
- Zuo, Y.; Liu, X.; Wei, D.; Sun, J.; Xiao, W.; Zhao, H.; Guo, L.; Wei, Q.; Fan, H.; Zhang, X. Photo-cross-linkable methacrylated gelatin and hydroxyapatite hybrid hydrogel for modularly engineering biomimetic osteon. ACS Appl. Mater. Interfaces 2015, 7, 10386–10394. [Google Scholar] [CrossRef]
- Bupphathong, S.; Quiroz, C.; Huang, W.; Chung, P.-F.; Tao, H.-Y.; Lin, C.-H. Gelatin Methacrylate Hydrogel for Tissue Engineering Applications—A Review on Material Modifications. Pharmaceuticals 2022, 15, 171. [Google Scholar] [CrossRef] [PubMed]
- Su, J.J.; Lin, C.H.; Chen, H.; Lee, S.Y.; Lin, Y.M. Biofabrication of Cell-Laden Gelatin Methacryloyl Hydrogels with Incorporation of Silanized Hydroxyapatite by Visible Light Projection. Polymers 2021, 13, 2354. [Google Scholar] [CrossRef] [PubMed]
- Lavenus, S.; Ricquier, J.C.; Louarn, G.; Layrolle, P. Cell interaction with nanopatterned surface of implants. Nanomedicine 2010, 5, 937–947. [Google Scholar] [CrossRef]
- Abbasi, N.; Hamlet, S.; Love, R.M.; Nguyen, N. Porous scaffolds for bone regeneration. J. Sci. Adv. Mater. Devices 2020, 5, 1–9. [Google Scholar] [CrossRef]
- Murphy, C.M.; O’Brien, F.J. Understanding the effect of mean pore size on cell activity in collagen-glycosaminoglycan scaffolds. Cell Adhes. Migr. 2010, 4, 377–381. [Google Scholar] [CrossRef]
- Zhang, K.; Fan, Y.; Dunne, N.; Li, X. Effect of microporosity on scaffolds for bone tissue engineering. Regen. Biomater. 2018, 5, 115–124. [Google Scholar] [CrossRef]


| Samples | Crystallite Size—D (nm) |
|---|---|
| HM2 | 42.59 |
| HM5 | 44.13 |
| HM10 | 45.71 |
| HZ1 | 45.12 |
| HZ5 | 41.53 |
| HZ10 | 41.95 |
| Wavenumbers (cm−1) | Assignment | Mod of Vibration | Type of Bomd |
|---|---|---|---|
| 3200–3400 | the amide A band | stretching vibration | N-H bond |
| 3069 | the amide B band | stretching vibration | C-H bond |
| 1640 | the amide I | - | C=O bond |
| 1536 | the amide II | stretching and deformation vibration | C-N and N-H bond |
| 1241 | the amide III | deformation vibration | N-H bond |
| Sample | Object Surface [µm2] | Object Surface/ Volume [µm−1] | Porosity [%] | Medium Wall Thickness [µm] | Medium Pore Diameter [µm] | |
|---|---|---|---|---|---|---|
| Total | Closed | |||||
| 20%GelMA-3%HAP-Zn | 3.95 × 10⁹ | 7.37 × 10⁻² | 57.4 | 1.24 | 54 | 99 |
| 25%GelMA-3%HAP-Zn | 2.26 × 10⁹ | 6.12 × 10⁻² | 57.0 | 2.47 | 57 | 116 |
| 30%GelMA-3%HAP-Zn | 2.88 × 10⁹ | 5.07 × 10⁻² | 59.1 | 2.16 | 82 | 142 |
| 20%GelMA-3%HAP-Mg | 3.48 × 10⁹ | 6.56 × 10⁻² | 74.8 | 1.39 | 72 | 169 |
| 25%GelMA-3%HAP-Mg | 5.46 × 10⁹ | 6.86 × 10⁻² | 72.9 | 1.02 | 77 | 178 |
| 30%GelMA-3%HAP-Mg | 4.27 × 10⁹ | 5.14 × 10⁻² | 70.9 | 2.34 | 84 | 174 |
Publisher’s Note: MDPI stays neutral with regard to jurisdictional claims in published maps and institutional affiliations. |
© 2022 by the authors. Licensee MDPI, Basel, Switzerland. This article is an open access article distributed under the terms and conditions of the Creative Commons Attribution (CC BY) license (https://creativecommons.org/licenses/by/4.0/).
Share and Cite
Leu Alexa, R.; Cucuruz, A.; Ghițulică, C.-D.; Voicu, G.; Stamat, L.-R.; Dinescu, S.; Vlasceanu, G.M.; Iovu, H.; Serafim, A.; Ianchis, R.; et al. 3D Printed Composite Scaffolds of GelMA and Hydroxyapatite Nanopowders Doped with Mg/Zn Ions to Evaluate the Expression of Genes and Proteins of Osteogenic Markers. Nanomaterials 2022, 12, 3420. https://doi.org/10.3390/nano12193420
Leu Alexa R, Cucuruz A, Ghițulică C-D, Voicu G, Stamat L-R, Dinescu S, Vlasceanu GM, Iovu H, Serafim A, Ianchis R, et al. 3D Printed Composite Scaffolds of GelMA and Hydroxyapatite Nanopowders Doped with Mg/Zn Ions to Evaluate the Expression of Genes and Proteins of Osteogenic Markers. Nanomaterials. 2022; 12(19):3420. https://doi.org/10.3390/nano12193420
Chicago/Turabian StyleLeu Alexa, Rebeca, Andreia Cucuruz, Cristina-Daniela Ghițulică, Georgeta Voicu, Liliana-Roxana Stamat (Balahura), Sorina Dinescu, George Mihail Vlasceanu, Horia Iovu, Andrada Serafim, Raluca Ianchis, and et al. 2022. "3D Printed Composite Scaffolds of GelMA and Hydroxyapatite Nanopowders Doped with Mg/Zn Ions to Evaluate the Expression of Genes and Proteins of Osteogenic Markers" Nanomaterials 12, no. 19: 3420. https://doi.org/10.3390/nano12193420
APA StyleLeu Alexa, R., Cucuruz, A., Ghițulică, C.-D., Voicu, G., Stamat, L.-R., Dinescu, S., Vlasceanu, G. M., Iovu, H., Serafim, A., Ianchis, R., Ciocan, L.-T., & Costache, M. (2022). 3D Printed Composite Scaffolds of GelMA and Hydroxyapatite Nanopowders Doped with Mg/Zn Ions to Evaluate the Expression of Genes and Proteins of Osteogenic Markers. Nanomaterials, 12(19), 3420. https://doi.org/10.3390/nano12193420