
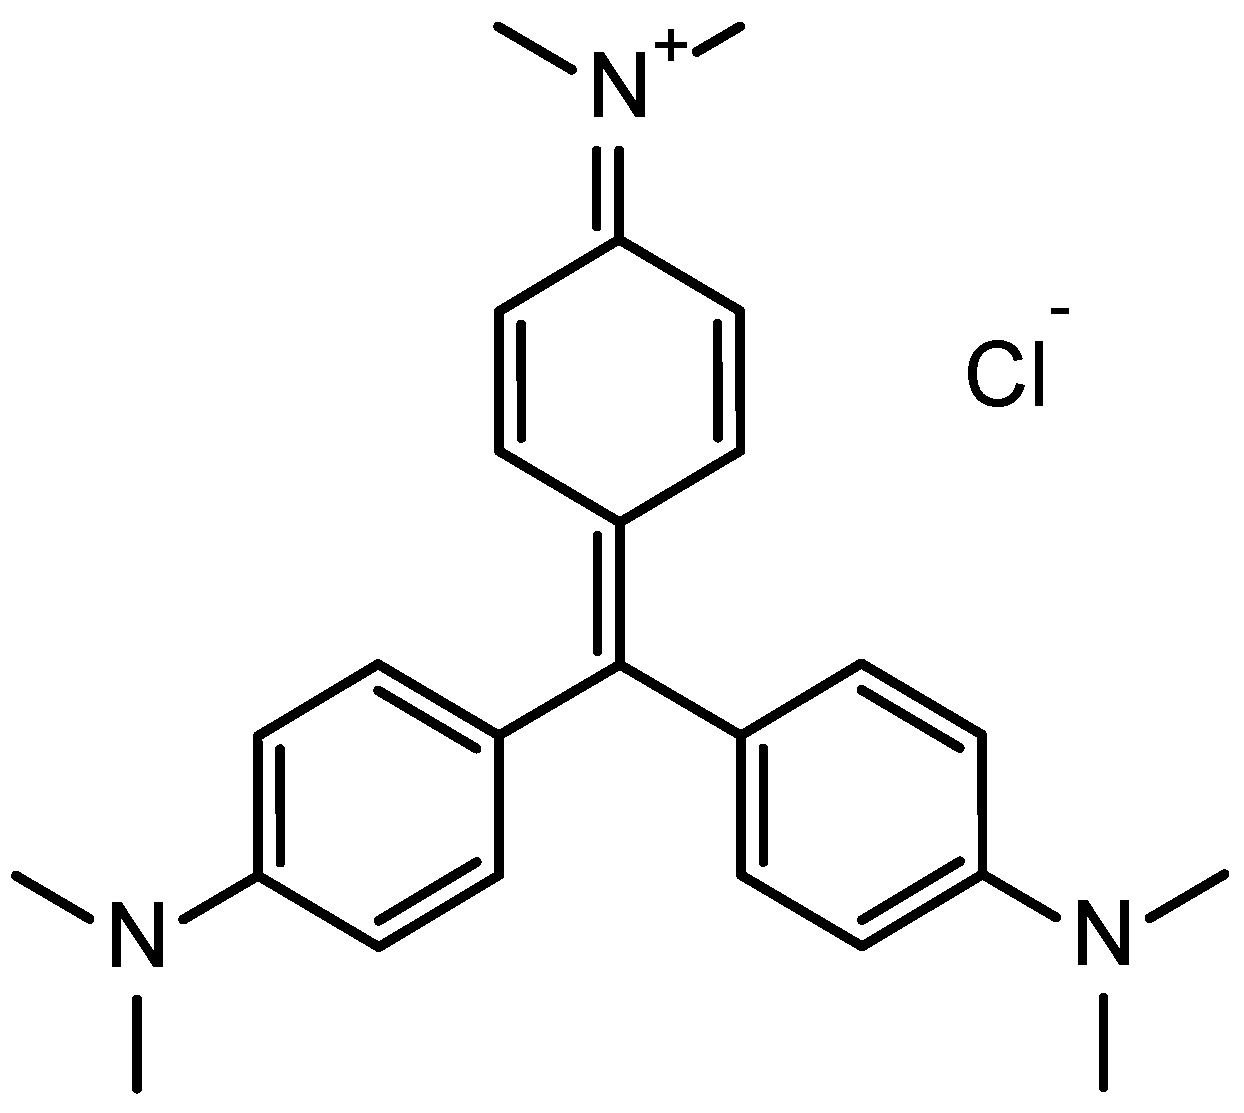
Activated Carbon/ZnFe2O4 Nanocomposite Adsorbent for Efficient Removal of Crystal Violet Cationic Dye from Aqueous Solutions

 ,
,  and
and
Abstract
1. Introduction
2. Materials and Methods
2.1. Materials
2.2. Synthesis of ZnFe2O4
2.3. Preparation of AC/ZnFe2O4 (ZFAC) Nanocomposite
2.4. Characterization
2.5. Adsorption Experiments
2.6. Desorption Experiments
2.7. Adsorption Modeling
2.7.1. Adsorption Isotherms
2.7.2. Adsorption Thermodynamic
2.7.3. Adsorption Kinetics
3. Results
3.1. Structural Characterization
3.1.1. FTIR Analysis
3.1.2. XRD Analysis
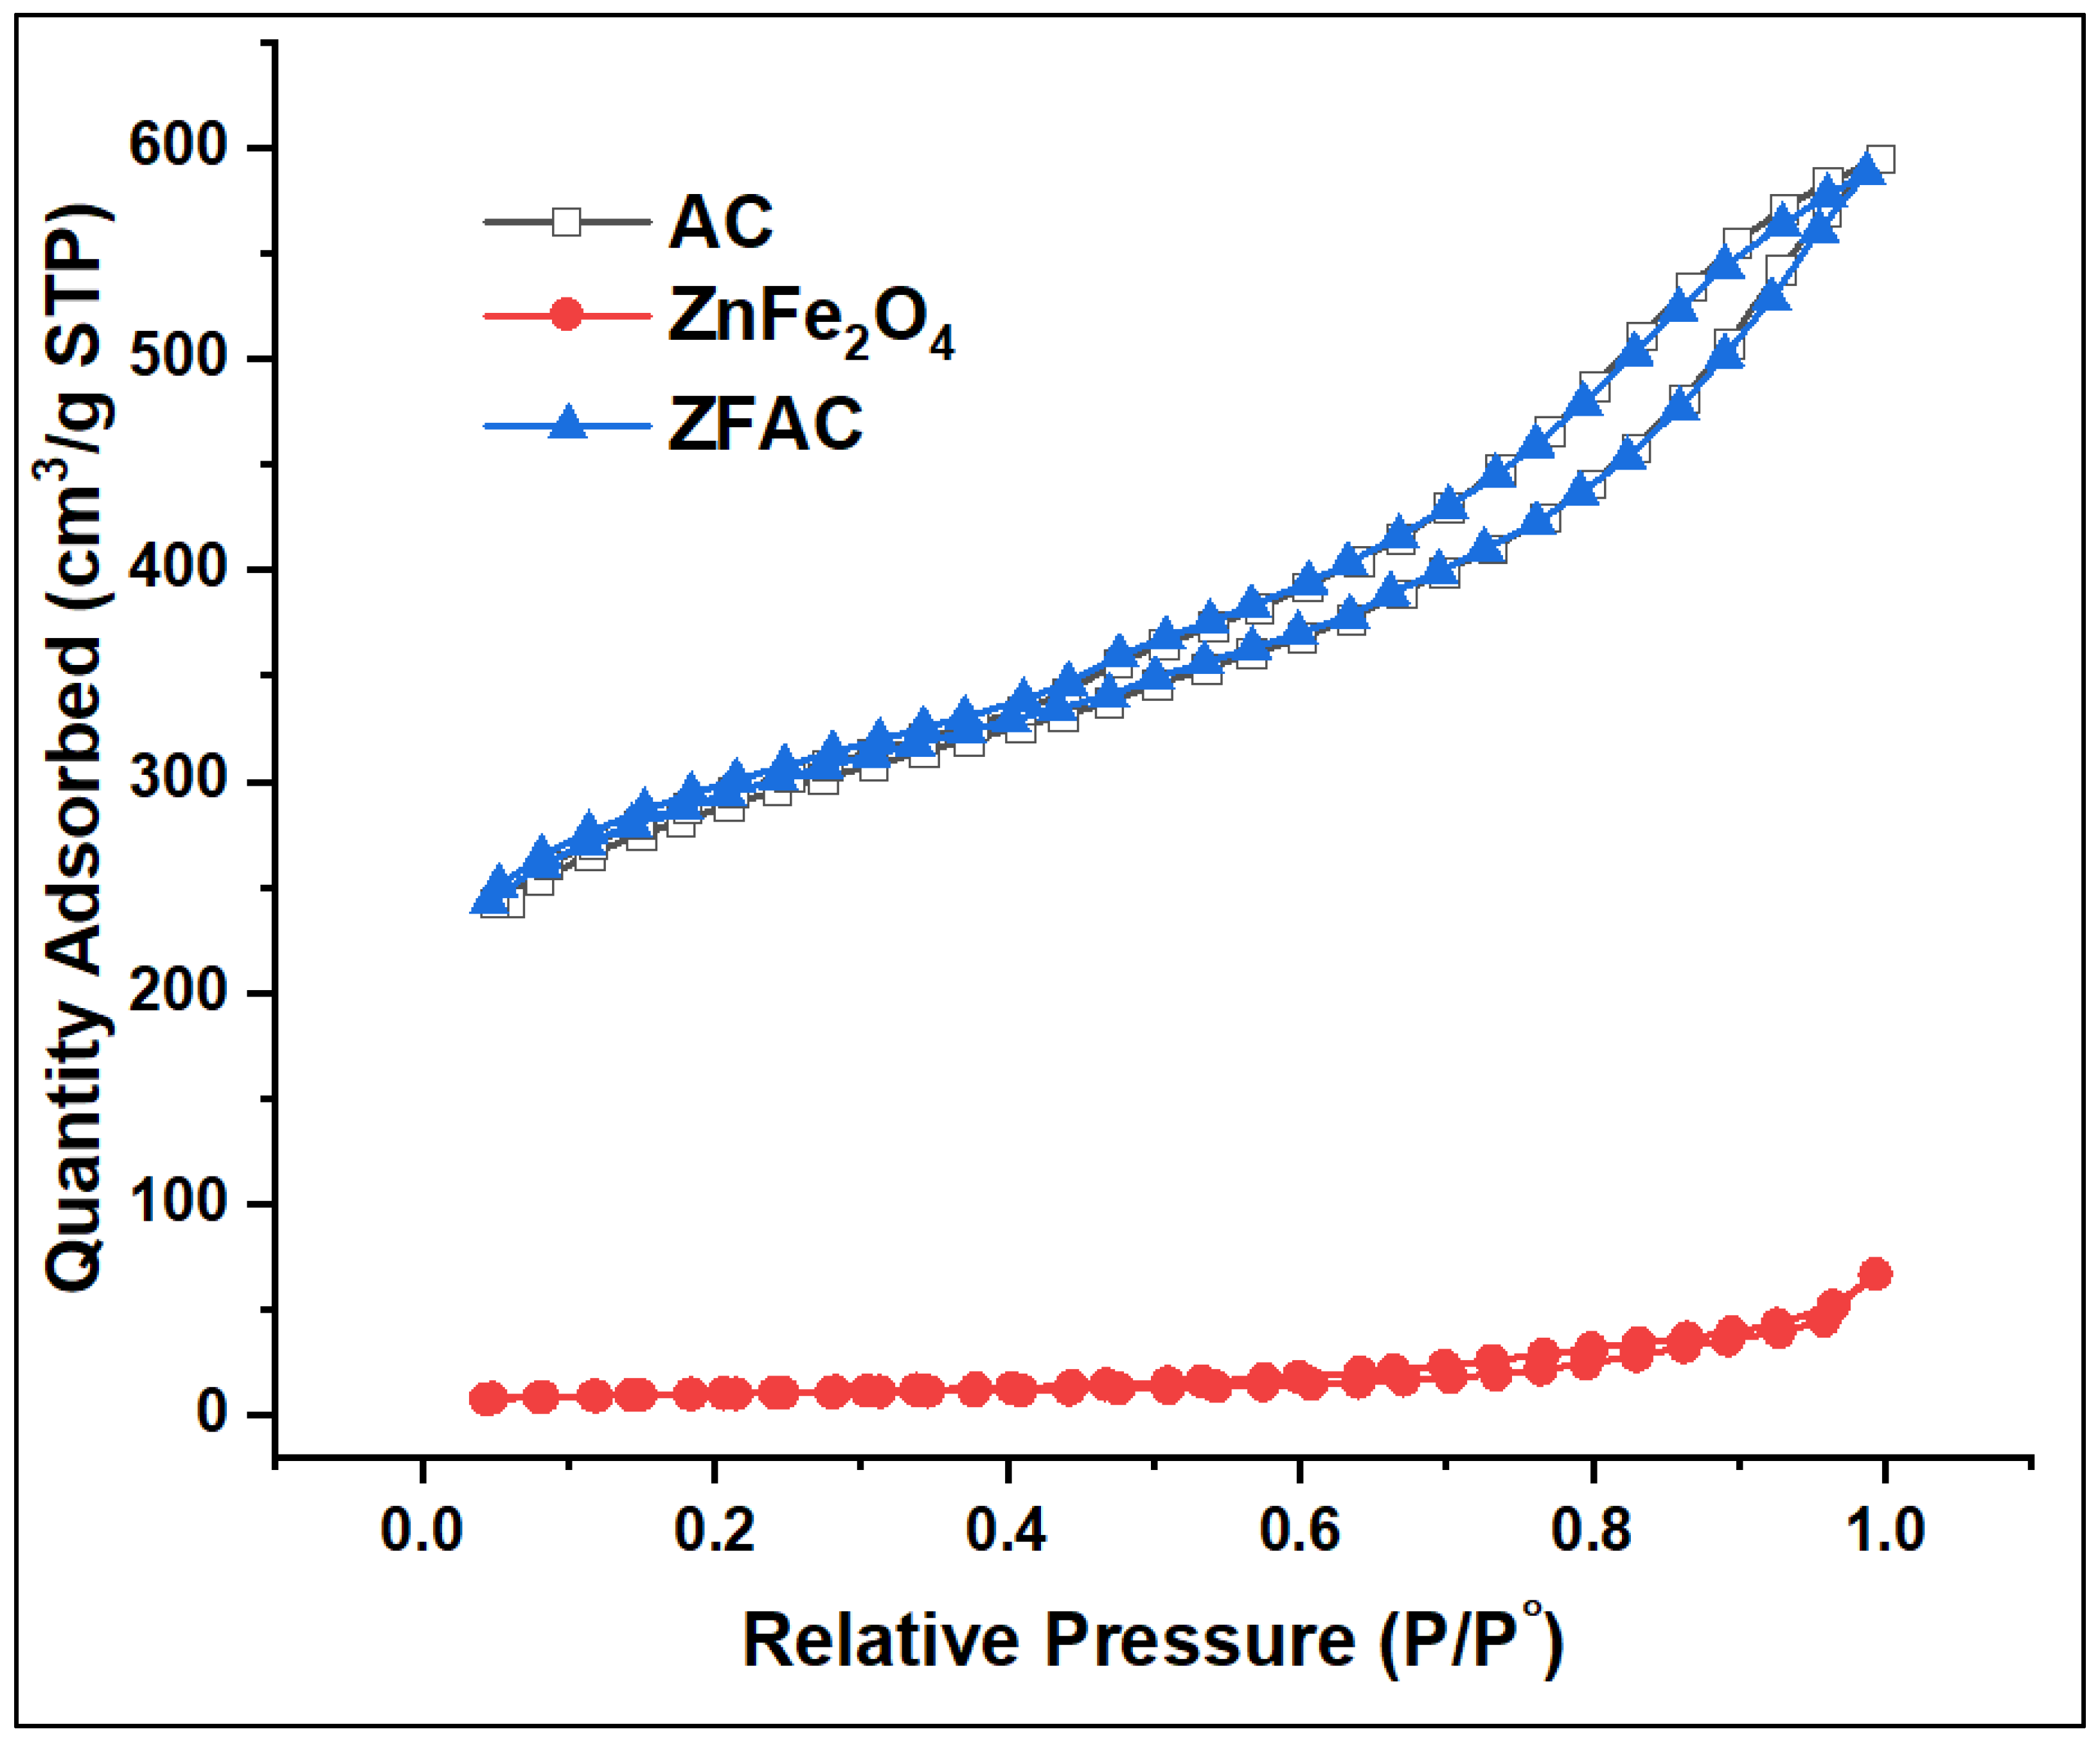
3.1.3. BET Analysis
3.1.4. SEM Analysis
3.1.5. TEM Analysis
3.1.6. TGA Analysis
3.2. Batch Adsorption Study
3.2.1. Pre-Evaluation of Prepared Adsorbents
3.2.2. Effect of pHPZC and pH
3.2.3. Effect of Adsorbent Dosage
3.2.4. Adsorption Isotherms
3.2.5. Adsorption Thermodynamics
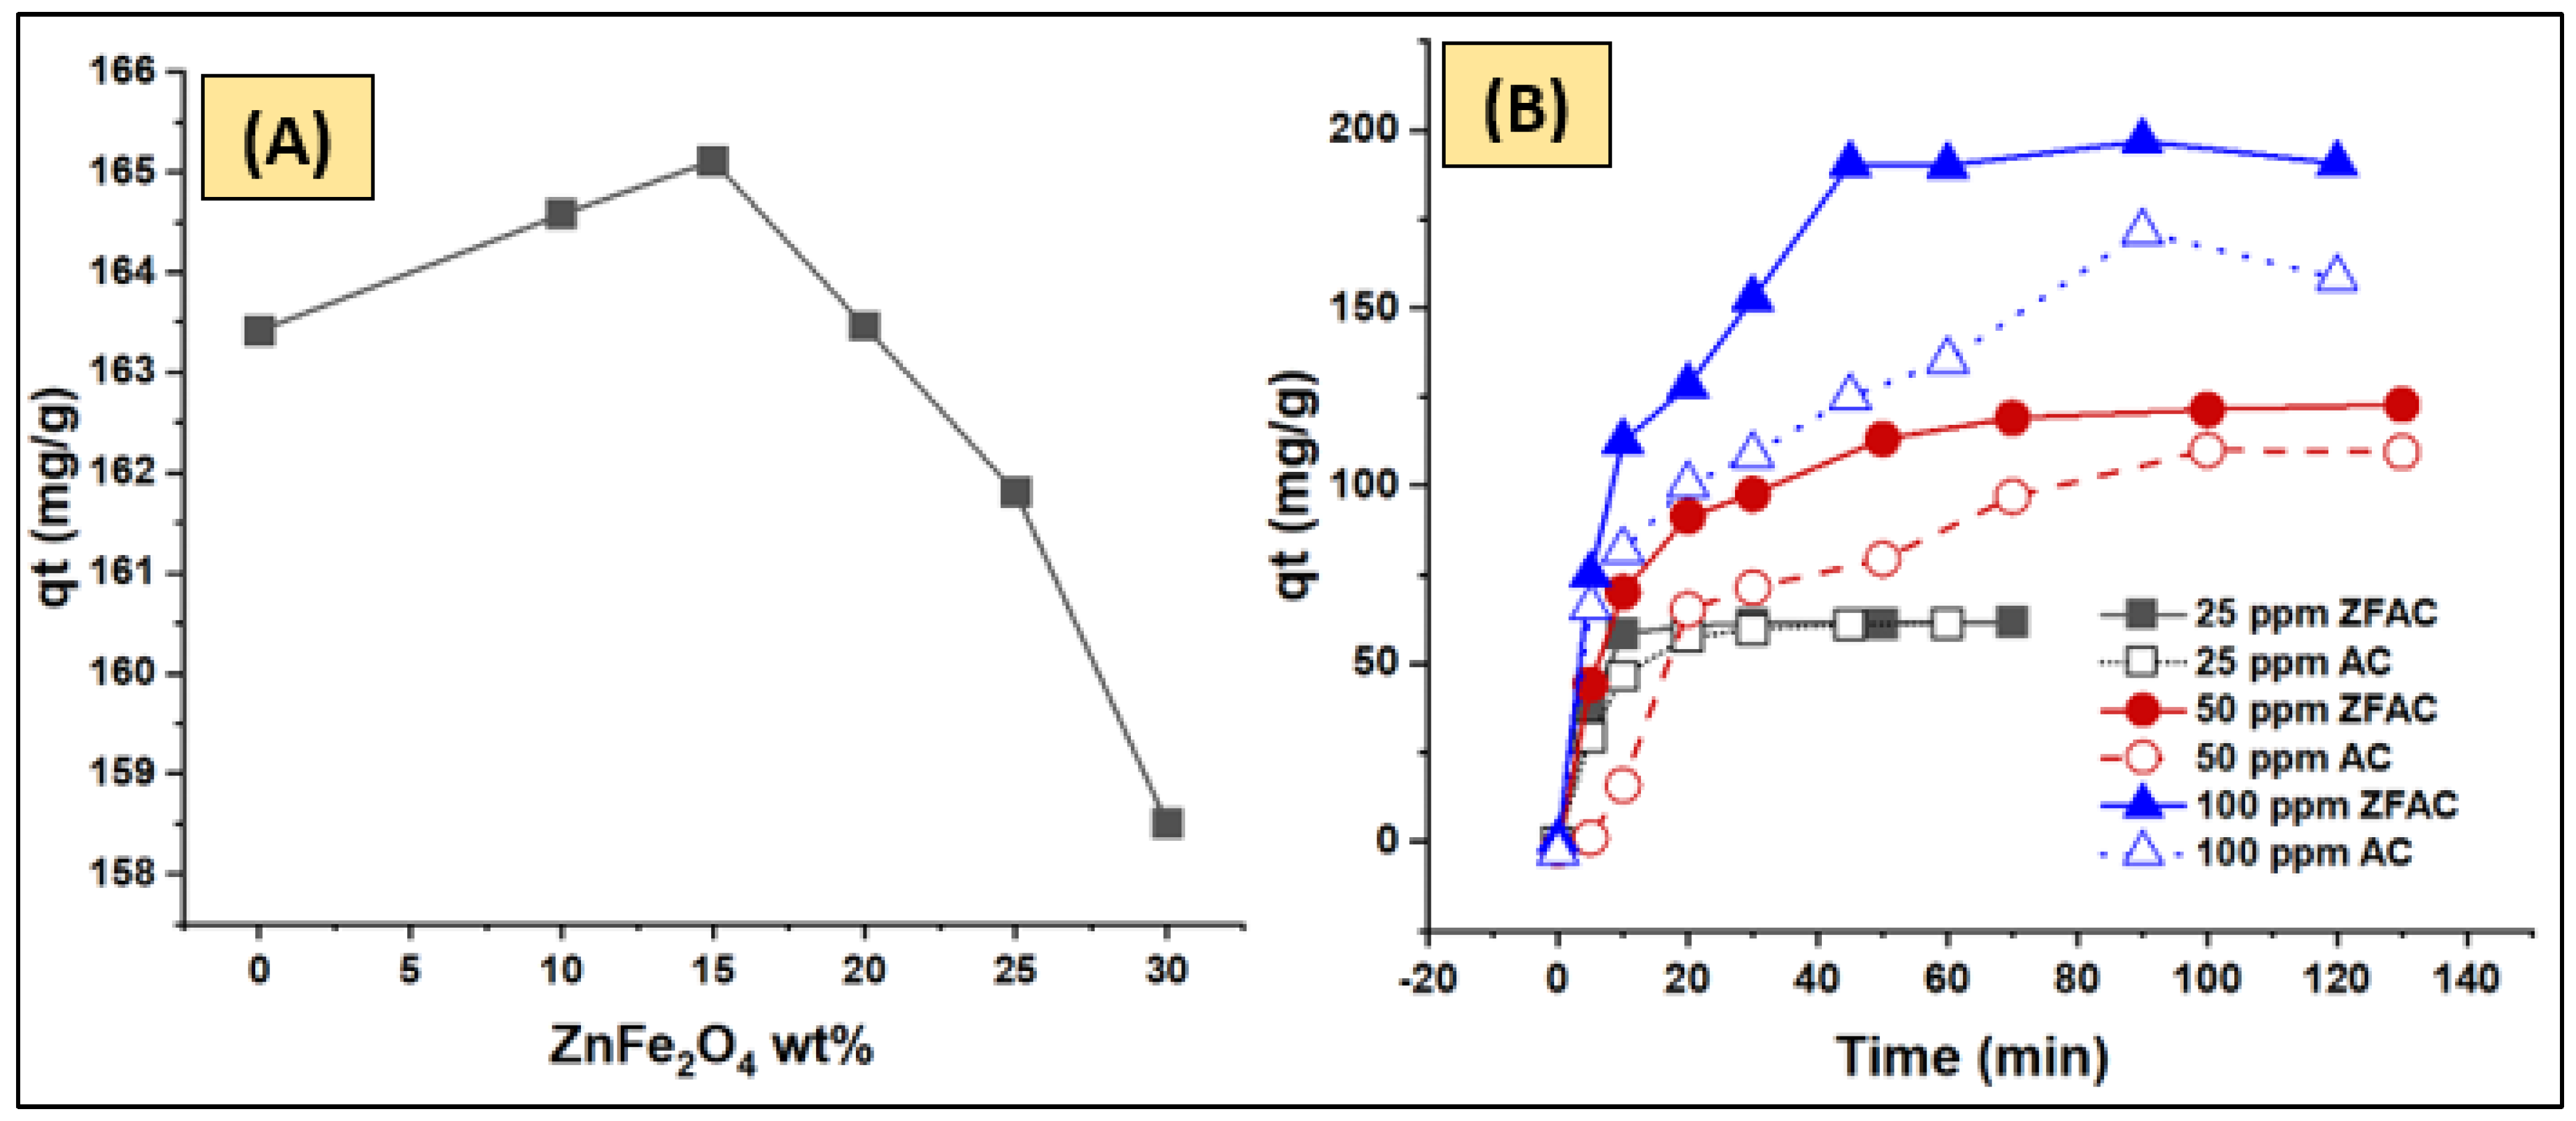
3.2.6. Kinetic Study—Contact Time of Various CV Concentrations
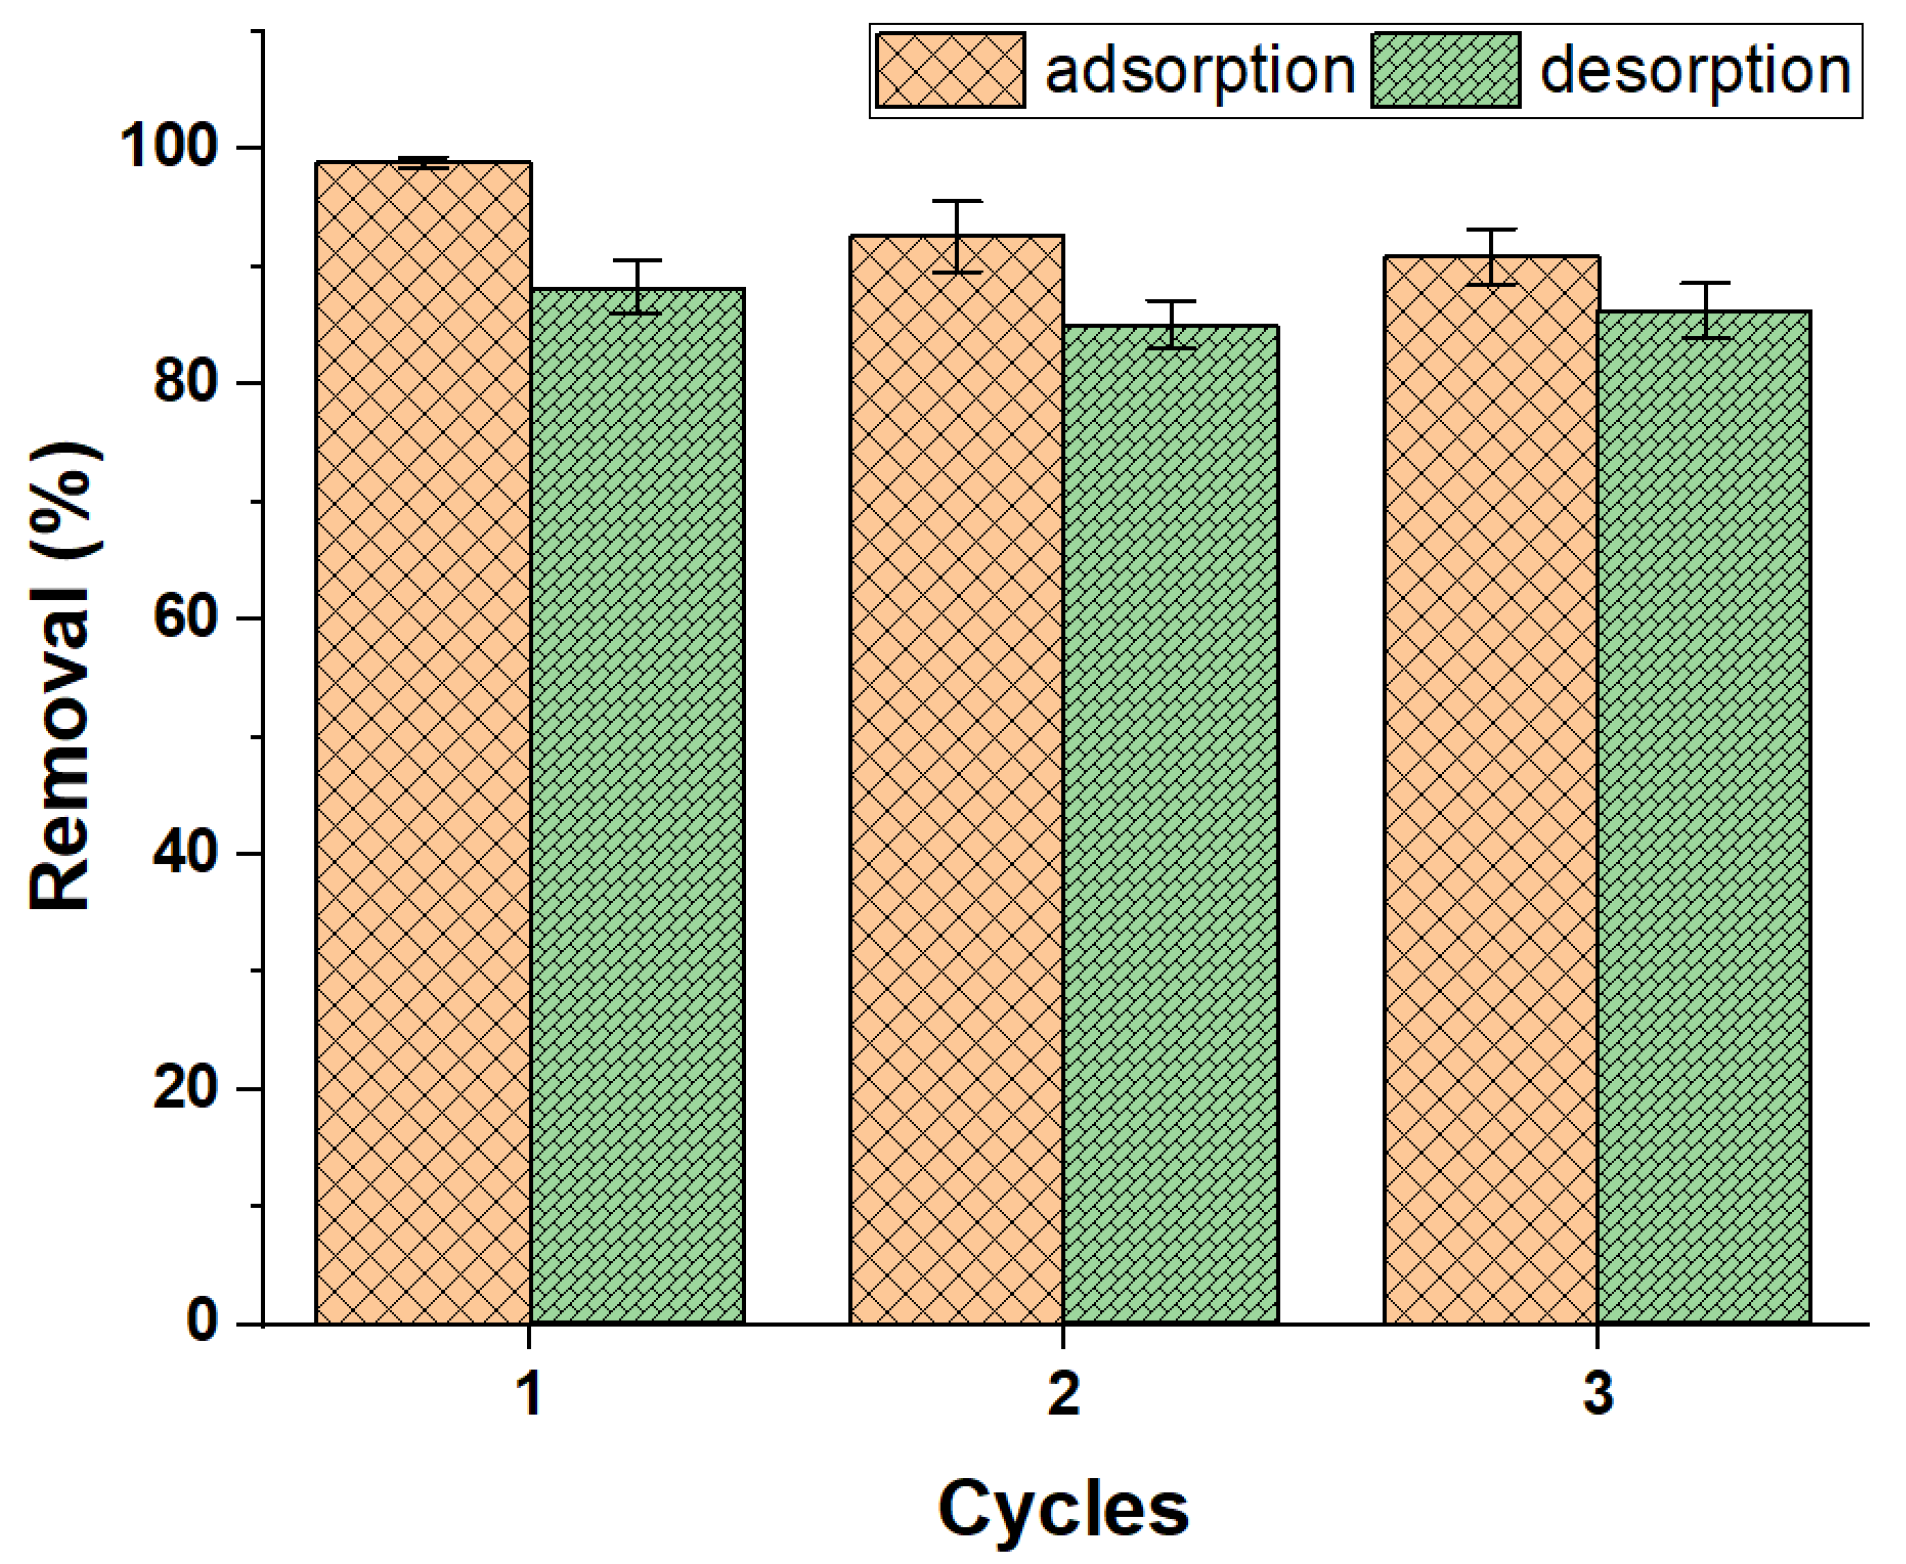
3.3. Reusability of ZFAC
3.4. Relative Performance of ZFAC
4. Conclusions
Author Contributions
Funding
Data Availability Statement
Acknowledgments
Conflicts of Interest
References
- Parvin, F.; Islam, S.; Akm, S.I.; Urmy, Z.; Ahmed, S. A Study on the Solutions of Environment Pollutions and Workers Health Problems Caused by Textile Manufacturing Operations. Biomed. J. Sci. Tech. Res. 2020, 28, 21831–21844. [Google Scholar]
- Pachaiappan, R.; Cornejo-Ponce, L.; Rajendran, R.; Manavalan, K.; Rajan, V.F.; Awad, F. A review on biofiltration techniques: Recent advancements in the removal of volatile organic compounds and heavy metals in the treatment of polluted water. Bioengineered 2022, 13, 8432–8477. [Google Scholar] [CrossRef] [PubMed]
- Hayzoun, H.; Ouammou, A.; Saidi, O.; Khalil, F.; Bouayyadi, L. Evaluation de la qualité bactériologique et chimique du Sebou, Maroc (Assessment of the bacteriological and chemical quality of the Sebou River, Morocco). J. Mater. Environ. Sci. 2014, 5, 2438–2443. [Google Scholar]
- Alghamdi, A.A.; Al-Odayni, A.-B.; Saeed, W.S.; Almutairi, M.S.; Alharthi, F.A.; Aouak, T.; Al-Kahtani, A. Adsorption of Azo Dye Methyl Orange from Aqueous Solutions Using Alkali-Activated Polypyrrole-Based Graphene Oxide. Molecules 2019, 24, 3685. [Google Scholar] [CrossRef] [PubMed]
- Alramadhan, S.A.; Hammud, H.H. Graphene nickel silica supported nanocomposites as an efficient purifier for water treatment. Appl. Nanosci. 2021, 11, 273–291. [Google Scholar] [CrossRef]
- Azarkohan, A.; Shemirani, F.; Alvand, M. Fast Analysis of Water Samples for Trace Amount of Crystal Violet Dye Based on Solid Phase Extraction Using Nanoporous SBA-3 prior to Determination by Fiber Optic-Linear Array Detection Spectrophotometry. J. Chem. 2013, 2013, 1–8. [Google Scholar] [CrossRef]
- Benjelloun, Y.; Lahrichi, A.; Boumchita, S.; Idrissi, M.; Miyah, Y.; Anis, K.; Nenov, V.; Zerrouq, F. Removal of crystal violet by wet oxidation with H2O2 over an iron oxide catalyst synthesized from fly ash. J. Mater. Environ. Sci. 2017, 8, 2259–2269. [Google Scholar]
- Ayed, L.; Chaieb, K.; Cheref, A.; Bakhrouf, A. Biodegradation of triphenylmethane dye Malachite Green by Sphingomonas paucimobilis. World J. Microbiol. Biotechnol. 2009, 25, 705–711. [Google Scholar] [CrossRef]
- Abbas, M.; Harrache, Z.; Trari, M. Removal of gentian violet in aqueous solution by activated carbon equilibrium, kinetics, and thermodynamic study. Adsorpt. Sci. Technol. 2019, 37, 566–589. [Google Scholar] [CrossRef]
- Mittal, A.; Mittal, J.; Malviya, A.; Kaur, D.; Gupta, V. Adsorption of hazardous dye crystal violet from wastewater by waste materials. J. Colloid Interface Sci. 2010, 343, 463–473. [Google Scholar] [CrossRef]
- Senthilkumaar, S.; Kalaamani, P.; Subburaam, C.V. Liquid phase adsorption of Crystal violet onto activated carbons derived from male flowers of coconut tree. J. Hazard. Mater. 2006, 136, 800–808. [Google Scholar] [CrossRef] [PubMed]
- Akansha, K.; Chakraborty, D.; Sachan, S.G. Decolorization and degradation of methyl orange by Bacillus stratosphericus SCA1007. Biocatal. Agric. Biotechnol. 2019, 18, 101044. [Google Scholar] [CrossRef]
- Adak, A.; Bandyopadhyay, M.; Pal, A. Removal of crystal violet dye from wastewater by surfactant-modified alumina. Sep. Purif. Technol. 2005, 44, 139–144. [Google Scholar] [CrossRef]
- Salem, I.A. Activation of H2O2 by Amberlyst-15 resin supported with copper(II)-complexes towards oxidation of crystal violet. Chemosphere 2001, 44, 1109–1119. [Google Scholar] [CrossRef]
- Ledakowicz, S.; Solecka, M.; Zylla, R. Biodegradation, decolourisation and detoxification of textile wastewater enhanced by advanced oxidation processes. J. Biotechnol. 2001, 89, 175–184. [Google Scholar] [CrossRef]
- Alghamdi, A.A.; Al-Odayni, A.-B.; Saeed, W.S.; Al-Kahtani, A.; Alharthi, F.A.; Aouak, T. Efficient Adsorption of Lead (II) from Aqueous Phase Solutions Using Polypyrrole-Based Activated Carbon. Materials 2019, 12, 2020. [Google Scholar] [CrossRef] [PubMed]
- Katheresan, V.; Kansedo, J.; Lau, S.Y. Efficiency of various recent wastewater dye removal methods: A review. J. Environ. Chem. Eng. 2018, 6, 4676–4697. [Google Scholar] [CrossRef]
- Gao, R.; Su, X.; He, X.; Chen, L.; Zhang, Y. Preparation and characterisation of core–shell CNTs@MIPs nanocomposites and selective removal of estrone from water samples. Talanta 2011, 83, 757–764. [Google Scholar] [CrossRef]
- Huang, B.; Liu, Y.; Li, B.; Liu, S.; Zeng, G.; Zeng, Z.; Wang, X.; Ning, Q.; Zheng, B.; Yang, C. Effect of Cu(II) ions on the enhancement of tetracycline adsorption by Fe3O4@SiO2-Chitosan/graphene oxide nanocomposite. Carbohydr. Polym. 2017, 157, 576–585. [Google Scholar] [CrossRef]
- Asmaly, H.A.; Ihsanullah; Abussaud, B.; Saleh, T.A.; Laoui, T.; Gupta, V.K.; Atieh, M.A. Adsorption of phenol on aluminum oxide impregnated fly ash. Desalination Water Treat. 2016, 57, 6801–6808. [Google Scholar] [CrossRef]
- Alghamdi, A.A.; Al-Odayni, A.-B.; Abduh, N.A.Y.; Alramadhan, S.A.; Aljboar, M.T.; Saeed, W.S. Adsorptive Performance of Polypyrrole-Based KOH-Activated Carbon for the Cationic Dye Crystal Violet: Kinetic and Equilibrium Studies. Adsorpt. Sci. Technol. 2021, 2021, 1–11. [Google Scholar] [CrossRef]
- Çavuşoğlu, F.C.; Akan, S.; Arı, E.A.; Çetinkaya, E.; Çolak, E.; Daştan, G.N.; Deniz, S.; Erdem, D.; Köksal, M.; Korkmaz, S.; et al. Preparation of magnetic activated carbon-chitosan nanocomposite for crystal violet adsorption. Korean J. Chem. Eng. 2019, 36, 1915–1921. [Google Scholar] [CrossRef]
- Langmuir, I. The adsorption of gases on plane surfaces of glass, mica and platinum. J. Am. Chem. Soc. 1918, 40, 1361–1403. [Google Scholar] [CrossRef]
- Mwangi, I.W.; Ngila, J.C.; Okonkwo, J.O. A comparative study of modified and unmodified maize tassels for removal of selected trace metals in contaminated water. Toxicol. Environ. Chem. 2012, 94, 20–39. [Google Scholar] [CrossRef]
- Freundlich, H.; Heller, W. The adsorption of cis-and trans-azobenzene. J. Am. Chem. Soc. 1939, 61, 2228–2230. [Google Scholar] [CrossRef]
- Banerjee, S.; Chattopadhyaya, M. Adsorption characteristics for the removal of a toxic dye, tartrazine from aqueous solutions by a low cost agricultural by-product. Arab. J. Chem. 2017, 10, S1629–S1638. [Google Scholar] [CrossRef]
- Aljeboree, A.M.; Alshirifi, A.N.; Alkaim, A.F. Kinetics and equilibrium study for the adsorption of textile dyes on coconut shell activated carbon. Arab. J. Chem. 2017, 10, S3381–S3393. [Google Scholar] [CrossRef]
- Lagegren, S.; Svenska, B. Zur theorie der sogenannten adsorption geloester stoffe. Vaternskapsakad Handl. 1898, 24, 1–39. [Google Scholar]
- Ho, Y.S.; McKay, G. Pseudo-second order model for sorption processes. Process Biochem. 1999, 34, 451–465. [Google Scholar] [CrossRef]
- Weber Jr, W.J.; Morris, J.C. Kinetics of adsorption on carbon from solution. J. Sanit. Eng. Div. 1963, 89, 31–59. [Google Scholar] [CrossRef]
- Yang, C.; Florent, M.; de Falco, G.; Fan, H.; Bandosz, T.J. ZnFe2O4/activated carbon as a regenerable adsorbent for catalytic removal of H2S from air at room temperature. Chem. Eng. J. 2020, 394, 124906. [Google Scholar] [CrossRef]
- Saif, M.M.S.; Alodeni, R.M.; Alghamdi, A.A.; Al-Odayni, A.-B. Synthesis, spectroscopic characterization, thermal analysis and in vitro bioactivity studies of the N-(cinnamylidene) tryptophan Schiff base. J. King Saud Univ. Sci. 2022, 34, 101988. [Google Scholar] [CrossRef]
- Gondal, M.; Drmosh, Q.; Saleh, T. Effect of post-annealing temperature on structural and optical properties of nano-ZnO synthesised from ZnO2 by laser ablation method. Int. J. Nanoparticles 2010, 3, 257. [Google Scholar] [CrossRef]
- Rayyif, S.M.I.; Mohammed, H.B.; Curuțiu, C.; Bîrcă, A.C.; Grumezescu, A.M.; Vasile, B.Ș.; Dițu, L.M.; Lazăr, V.; Chifiriuc, M.C.; Mihăescu, G.; et al. ZnO Nanoparticles-Modified Dressings to Inhibit Wound Pathogens. Materials 2021, 14, 3084. [Google Scholar] [CrossRef]
- Cheriaa, J.; Khaireddine, M.; Rouabhia, M.; Bakhrouf, A. Removal of Triphenylmethane Dyes by Bacterial Consortium. Sci. World J. 2012, 2012, 1–9. [Google Scholar] [CrossRef]
- Abbasian, A.R.; Afarani, M.S. One-step solution combustion synthesis and characterization of ZnFe2O4 and ZnFe1.6O4 nanoparticles. Appl. Phys. A 2019, 125, 721. [Google Scholar] [CrossRef]
- Sripriya, R.C.; Samson, V.A.F.; Anand, S.; Madhavan, J.; Raj, M.V.A. Comparative studies of structural, magnetic and photocatalytic degradation on 4-chlorophenol by ZnFe2O4 nanostructures prepared via cost effective combustion methods. J. Mater. Sci. Mater. Electron. 2018, 29, 14084–14092. [Google Scholar] [CrossRef]
- Ferrari, S.; Kumar, R.; Grinblat, F.; Aphesteguy, J.; Saccone, F.; Errandonea, D. In-situ high-pressure x-ray diffraction study of zinc ferrite nanoparticles. Solid State Sci. 2016, 56, 68–72. [Google Scholar] [CrossRef]
- Liu, X.-Y.; Huang, M.; Ma, H.-L.; Zhang, Z.-Q.; Gao, J.-M.; Zhu, Y.-L.; Han, X.-J.; Guo, X.-Y. Preparation of a Carbon-Based Solid Acid Catalyst by Sulfonating Activated Carbon in a Chemical Reduction Process. Molecules 2010, 15, 7188–7196. [Google Scholar] [CrossRef]
- Wang, H.-q.; Liu, M.-h.; Luo, X.; Liu, Y.-f.; Chen, F.-e.; Lv, Y.-c. One-pot hydrothermal synthesis, characterization, and desulfurization performance of ZnFe2O4/AC composites. J. Nanotechnol. 2018, 2018, 9417067. [Google Scholar] [CrossRef]
- Kumar, A.; Jena, H.M. Preparation and characterization of high surface area activated carbon from Fox nut (Euryale ferox) shell by chemical activation with H3PO4. Results Phys. 2016, 6, 651–658. [Google Scholar] [CrossRef]
- Vu, D.-L.; Seo, J.-S.; Lee, H.-Y.; Lee, J.-W. Activated carbon with hierarchical micro–mesoporous structure obtained from rice husk and its application for lithium–sulfur batteries. RSC Adv. 2017, 7, 4144–4151. [Google Scholar] [CrossRef]
- Wang, E.-R.; Shih, K.-Y. Facile microwave hydrothermal synthesis of ZnFe2O4/rGO nanocomposites and their ultra-fast adsorption of methylene blue dye. Materials 2021, 14, 5394. [Google Scholar] [CrossRef]
- Bazan, A.; Nowicki, P.; Półrolniczak, P.; Pietrzak, R. Thermal analysis of activated carbon obtained from residue after supercritical extraction of hops. J. Therm. Anal. 2016, 125, 1199–1204. [Google Scholar] [CrossRef]
- Nguyen, T.B.; Doong, R.-a. Heterostructured ZnFe 2 O 4/TiO 2 nanocomposites with a highly recyclable visible-light-response for bisphenol A degradation. RSC Adv. 2017, 7, 50006–50016. [Google Scholar] [CrossRef]
- Jassal, P.; Raut, V. Removal of crystal violet from wastewater using different chitosans and cross-linked derivatives. WIT Trans. Ecol. Environ. 2015, 196, 495–504. [Google Scholar] [CrossRef]
- Han, L.; Zhou, X.; Wan, L.; Deng, Y.; Zhan, S. Synthesis of ZnFe2O4 nanoplates by succinic acid-assisted hydrothermal route and their photocatalytic degradation of rhodamine B under visible light. J. Environ. Chem. Eng. 2014, 2, 123–130. [Google Scholar] [CrossRef]
- Casbeer, E.; Sharma, V.K.; Li, X.-Z. Synthesis and photocatalytic activity of ferrites under visible light: A review. Sep. Purif. Technol. 2012, 87, 1–14. [Google Scholar] [CrossRef]
- Saeed, A.; Sharif, M.; Iqbal, M. Application potential of grapefruit peel as dye sorbent: Kinetics, equilibrium and mechanism of crystal violet adsorption. J. Hazard. Mater. 2010, 179, 564–572. [Google Scholar] [CrossRef]
- Güzel, F.; Sayğılı, H.; Sayğılı, G.A.; Koyuncu, F. Decolorisation of aqueous crystal violet solution by a new nanoporous carbon: Equilibrium and kinetic approach. J. Ind. Eng. Chem. 2014, 20, 3375–3386. [Google Scholar] [CrossRef]
- Alorabi, A.Q.; Hassan, M.S.; Azizi, M. Fe3O4-CuO-activated carbon composite as an efficient adsorbent for bromophenol blue dye removal from aqueous solutions. Arab. J. Chem. 2020, 13, 8080–8091. [Google Scholar] [CrossRef]
- Potgieter, J.H.; Pardesi, C.; Pearson, S. A kinetic and thermodynamic investigation into the removal of methyl orange from wastewater utilizing fly ash in different process configurations. Environ. Geochem. Heal. 2021, 43, 2539–2550. [Google Scholar] [CrossRef] [PubMed]
- Saha, P.; Chowdhury, S. Insight Into Adsorption Thermodynamics. Thermodynamics 2011, 16, 349–364. [Google Scholar] [CrossRef]
- Kumar, R.; Ahmad, R. Biosorption of hazardous crystal violet dye from aqueous solution onto treated ginger waste (TGW). Desalination 2011, 265, 112–118. [Google Scholar] [CrossRef]
- Aljeboree, A.M.; Alkaim, A.F.; Al-Dujaili, A.H. Adsorption isotherm, kinetic modeling and thermodynamics of crystal violet dye on coconut husk-based activated carbon. DESALINATION Water Treat. 2015, 53, 3656–3667. [Google Scholar] [CrossRef]
- Kumar, P.S.; Ramalingam, S.; Kirupha, S.D.; Murugesan, A.; Vidhyadevi, T.; Sivanesan, S. Adsorption behavior of nickel (II) onto cashew nut shell: Equilibrium, thermodynamics, kinetics, mechanism and process design. Chem. Eng. J. 2011, 167, 122–131. [Google Scholar] [CrossRef]
- Haitham, K.; Razak, S.; Nawi, M. Kinetics and isotherm studies of methyl orange adsorption by a highly recyclable immobilized polyaniline on a glass plate. Arab. J. Chem. 2019, 12, 1595–1606. [Google Scholar] [CrossRef]
- Hamidzadeh, S.; Torabbeigi, M.; Shahtaheri, S.J. Removal of crystal violet from water by magnetically modified activated carbon and nanomagnetic iron oxide. J. Environ. Heal. Sci. Eng. 2015, 13, 8. [Google Scholar] [CrossRef]
- Singh, K.P.; Gupta, S.; Singh, A.K.; Sinha, S. Optimizing adsorption of crystal violet dye from water by magnetic nanocomposite using response surface modeling approach. J. Hazard. Mater. 2011, 186, 1462–1473. [Google Scholar] [CrossRef]
- Porkodi, K.; Kumar, K.V. Equilibrium, kinetics and mechanism modeling and simulation of basic and acid dyes sorption onto jute fiber carbon: Eosin yellow, malachite green and crystal violet single component systems. J. Hazard. Mater. 2007, 143, 311–327. [Google Scholar] [CrossRef]
- Ahsaine, H.A.; Anfar, Z.; Zbair, M.; Ezahri, M.; El Alem, N. Adsorptive Removal of Methylene Blue and Crystal Violet onto Micro-Mesoporous Zr3O/Activated Carbon Composite: A Joint Experimental and Statistical Modeling Considerations. J. Chem. 2018, 2018, 1–14. [Google Scholar] [CrossRef]
- Sarabadan, M.; Bashiri, H.; Mousavi, S.M. Removal of crystal violet dye by an efficient and low cost adsorbent: Modeling, kinetic, equilibrium and thermodynamic studies. Korean J. Chem. Eng. 2019, 36, 1575–1586. [Google Scholar] [CrossRef]
- Mohanty, K.; Naidu, J.T.; Meikap, B.C.; Biswas, M.N. Removal of Crystal Violet from Wastewater by Activated Carbons Prepared from Rice Husk. Ind. Eng. Chem. Res. 2006, 45, 5165–5171. [Google Scholar] [CrossRef]


| Sample | BET Surface Area (m2·g−1) | Pore Size (nm) | Pore Volume (cm3·g−1) |
|---|---|---|---|
| AC | 955 | 1.96 | 0.546 |
| ZnFe2O4 | 34 | 4.26 | 0.097 |
| ZFAC | 948 | 1.97 | 0.524 |
| Temp. (K) | Langmuir | Freundlich | Temkin | ||||||||
|---|---|---|---|---|---|---|---|---|---|---|---|
| Qm (mg/g) | KL (L/mg) | RL (C0 (mg/L) = 25, 50, 100, 150, 200) | R2 | KF | n | 1/n | R2 | KT | b | R2 | |
| 296 | 208.29 | 1.49 | 0.026, 0.013, 0.007, 0.004, 0.003 | 0.864 | 107.46 | 6.30 | 0.159 | 0.663 | 74.35 | 42.77 | 0.724 |
| 308 | 234.03 | 1.60 | 0.024, 0.012, 0.006, 0.004, 0.003 | 0.980 | 116.62 | 5.40 | 0.185 | 0.798 | 44.29 | 35.07 | 0.882 |
| 318 | 246.19 | 1.34 | 0.029, 0.015, 0.007, 0.005, 0.004 | 0.945 | 116.94 | 4.93 | 0.203 | 0.795 | 28.98 | 32.17 | 0.869 |
| Initial Dye Concentration (C0, mg/L) | Temp. (K) | ln Kd | ΔG° (kJ/mol) | ΔH° (kJ/mol) | ΔS° (J/mol·K) | R2 |
|---|---|---|---|---|---|---|
| 50 | 296 | 4.606 | −11.571 | 2.531 | 47.642 | 0.034 |
| 308 | 4.960 | −12.142 | ||||
| 318 | 4.650 | −12.619 | ||||
| 100 | 296 | 4.575 | −11.149 | 4.392 | 52.503 | 0.331 |
| 308 | 4.499 | −11.779 | ||||
| 318 | 4.711 | −12.304 | ||||
| 150 | 296 | 1.527 | −3.868 | 27.440 | 105.770 | 0.949 |
| 308 | 2.110 | −5.137 | ||||
| 318 | 2.285 | −6.195 | ||||
| 200 | 296 | 0.351 | −0.915 | 22.946 | 80.613 | 0.984 |
| 308 | 0.783 | −1.883 | ||||
| 318 | 0.990 | −2.689 |
| C0 (mg/L) | qe-exp (mg/g) | PFO | PSO | |||||
|---|---|---|---|---|---|---|---|---|
| qe (mg/g) | k1 (1/min) | R2 | qe (mg/g) | k2 (g/(mg·min)) | R2 | h (mg/(g·min) | ||
| 25 | 61.63 | 54.35 | 0.2165 | 0.949 | 63.69 | 0.0117 | 0.972 | 47.4601 |
| 50 | 121.44 | 287.01 | 0.1336 | 0.795 | 126.58 | 0.0012 | 0.984 | 19.2270 |
| 100 | 197.14 | 254.57 | 0.0781 | 0.941 | 212.77 | 0.0006 | 0.983 | 27.1626 |
| C0 | IPD | |||||||||||
|---|---|---|---|---|---|---|---|---|---|---|---|---|
| Full-Range | Stage 1 | Stage 2 | Stage 3 | |||||||||
| kid | C | R2 | kid-S1 | C-S1 | R2-S1 | kid-S2 | C-S2 | R2-S2 | kid-S3 | C-S3 | R2-S3 | |
| 25 | 14.45 | 3.534 | 0.934 | 18.23 | −0.772 | 0.996 | 1.82 | 52.56 | 0.999 | - | - | - |
| 50 | 14.40 | 12.911 | 0.928 | 22.45 | −2.972 | 0.993 | 9.18 | 45.91 | 0.958 | - | - | - |
| 100 | 21.09 | 27.166 | 0.919 | 35.13 | −0.665 | 0.998 | 22.11 | 36.39 | 0.958 | 2.48 | 172.68 | 0.831 |
| Adsorbent | Qm (mg/g) | Adsorption Conditions | Ref. | |||
|---|---|---|---|---|---|---|
| C0 (mg/L) | T. (°C) | pH | Dose (g/L) | |||
| Magnetically modified activated carbon | 44.7 | 5 | 20 | 7 | 0.5 | [58] |
| Magnetic carbon iron oxide nanocomposite | 81.7 | 240 | 50 | 8.5 | 5.0 | [59] |
| Magnetic charcoal | 28.0 | 40 | 30 | 8 | 1.0 | [60] |
| Zr3O/Activated carbon | 155.1 | 100 | 24 | - | 0.6 | [61] |
| Nanomagnetic iron oxide | 12.7 | 5 | 20 | 7 | 0.5 | [58] |
| Merck-activated carbon | 84.1 | 80 | 25 | 7 | 1.0 | [62] |
| ZnCl2-activated tomato waste carbon | 51.6 | - | 20 | 8.0 | 2.0 | [50] |
| ZnCl2-activated rice husk carbon | 61.6 | - | 25 | 10.8 | 2.0 | [63] |
| Polypyrrole-based activated carbon (PACK) | 380.2 | 100 | 25 | 6.9 | 0.8 | [21] |
| ZFAC | 208.3 | 100 | 23 | 7.2 | 0.6 | This work |
Publisher’s Note: MDPI stays neutral with regard to jurisdictional claims in published maps and institutional affiliations. |
© 2022 by the authors. Licensee MDPI, Basel, Switzerland. This article is an open access article distributed under the terms and conditions of the Creative Commons Attribution (CC BY) license (https://creativecommons.org/licenses/by/4.0/).
Share and Cite
Algarni, T.S.; Al-Mohaimeed, A.M.; Al-Odayni, A.-B.; Abduh, N.A.Y. Activated Carbon/ZnFe2O4 Nanocomposite Adsorbent for Efficient Removal of Crystal Violet Cationic Dye from Aqueous Solutions. Nanomaterials 2022, 12, 3224. https://doi.org/10.3390/nano12183224
Algarni TS, Al-Mohaimeed AM, Al-Odayni A-B, Abduh NAY. Activated Carbon/ZnFe2O4 Nanocomposite Adsorbent for Efficient Removal of Crystal Violet Cationic Dye from Aqueous Solutions. Nanomaterials. 2022; 12(18):3224. https://doi.org/10.3390/nano12183224
Chicago/Turabian StyleAlgarni, Tahani Saad, Amal M. Al-Mohaimeed, Abdel-Basit Al-Odayni, and Naaser A. Y. Abduh. 2022. "Activated Carbon/ZnFe2O4 Nanocomposite Adsorbent for Efficient Removal of Crystal Violet Cationic Dye from Aqueous Solutions" Nanomaterials 12, no. 18: 3224. https://doi.org/10.3390/nano12183224
APA StyleAlgarni, T. S., Al-Mohaimeed, A. M., Al-Odayni, A.-B., & Abduh, N. A. Y. (2022). Activated Carbon/ZnFe2O4 Nanocomposite Adsorbent for Efficient Removal of Crystal Violet Cationic Dye from Aqueous Solutions. Nanomaterials, 12(18), 3224. https://doi.org/10.3390/nano12183224