
Cement-Based Materials Modified by Colloidal Nano-Silica: Impermeability Characteristic and Microstructure


Abstract
:1. Introduction
2. Experimental
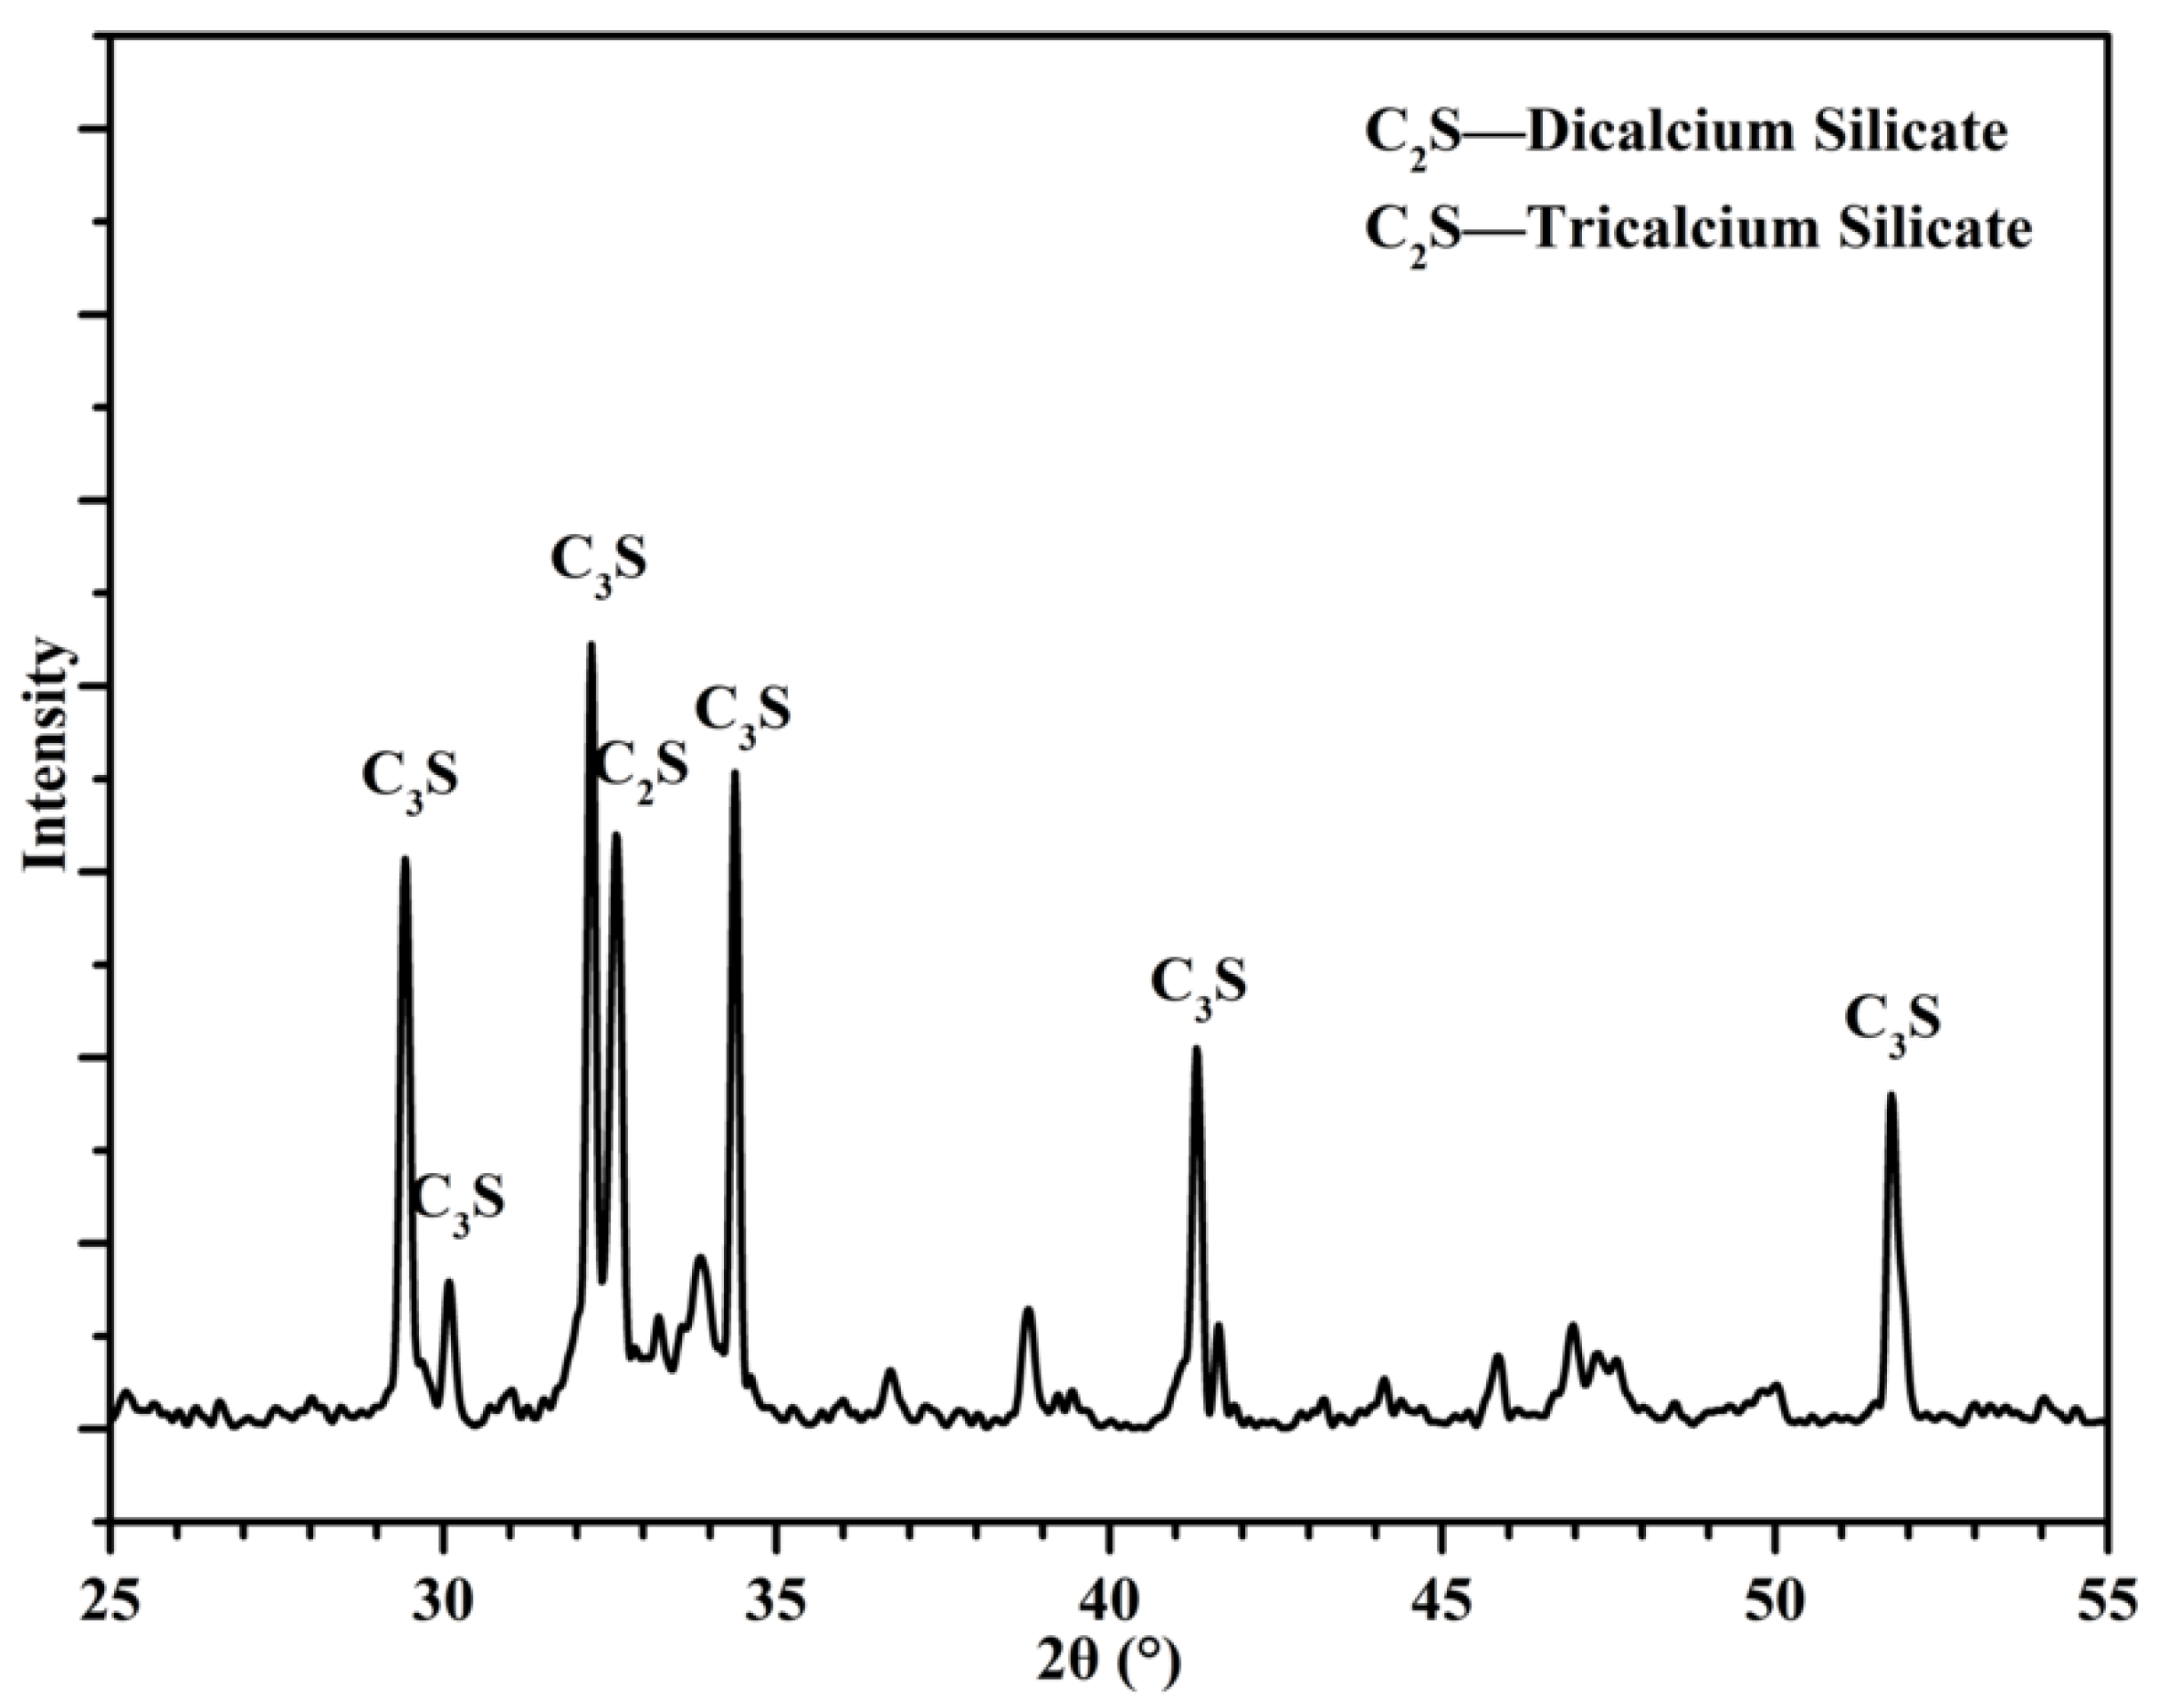
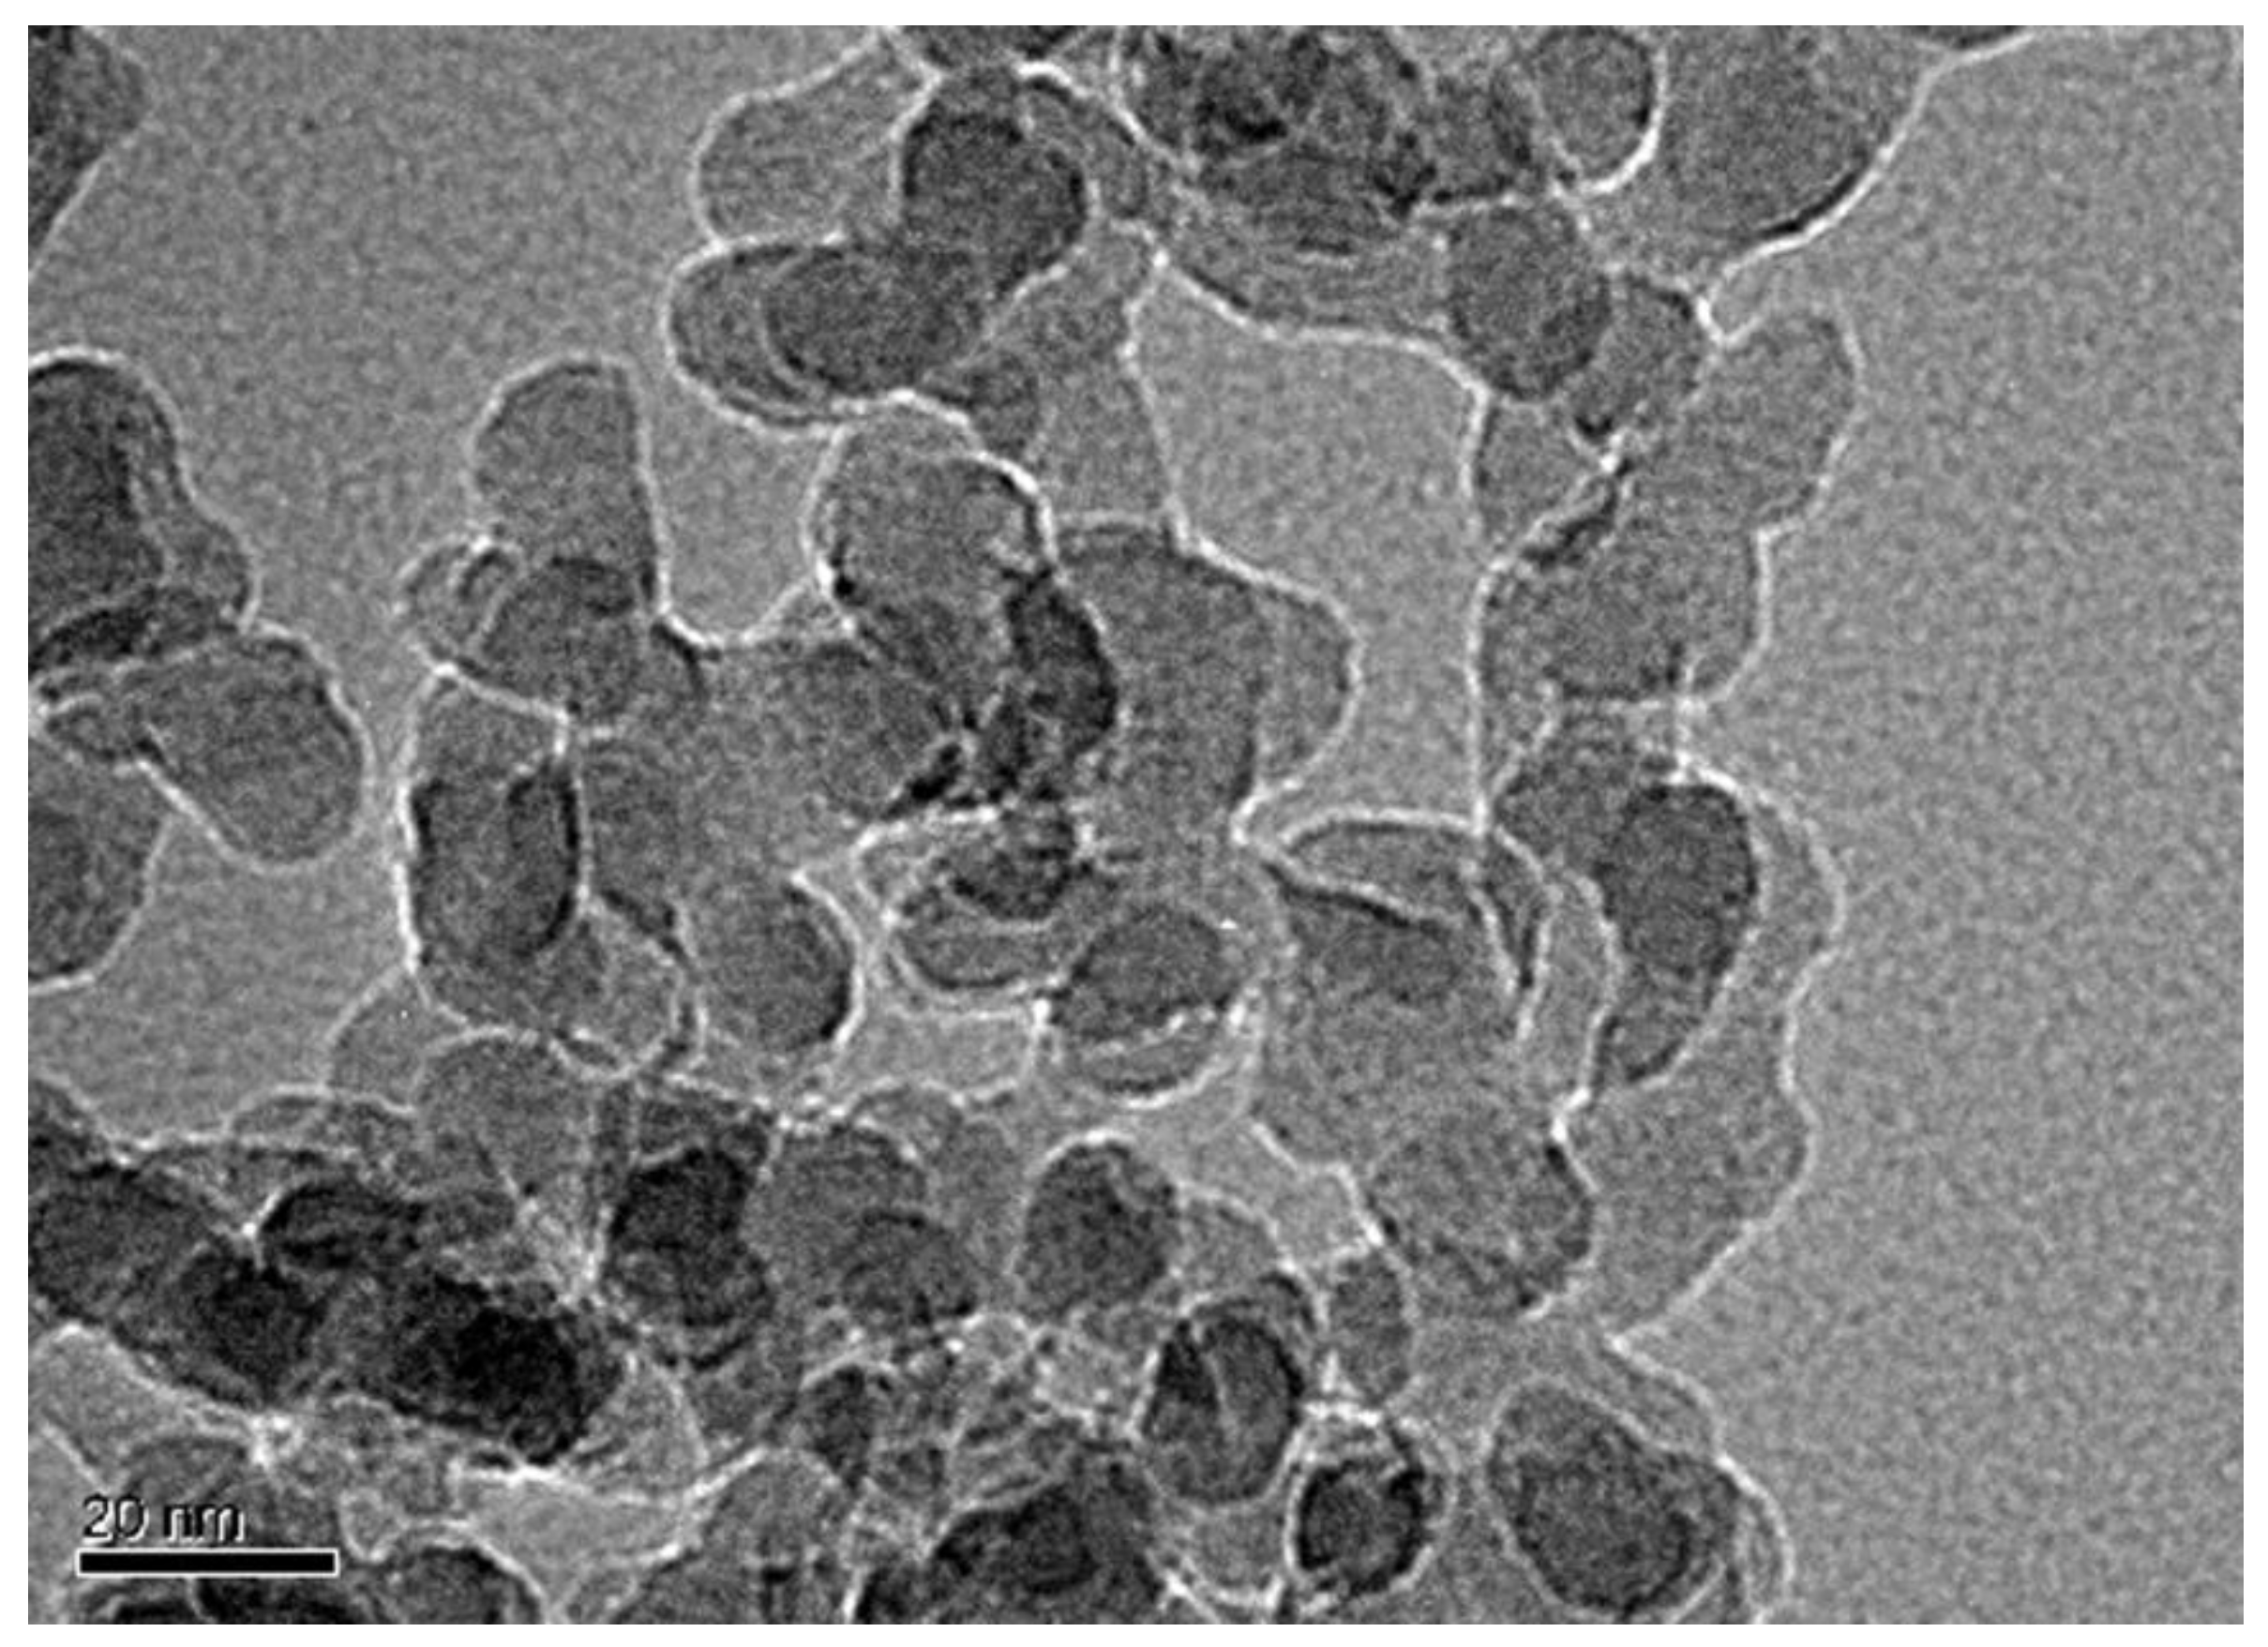
2.1. Raw Materials
2.2. Sample Preparation for Strength Test and Microscopic Analysis
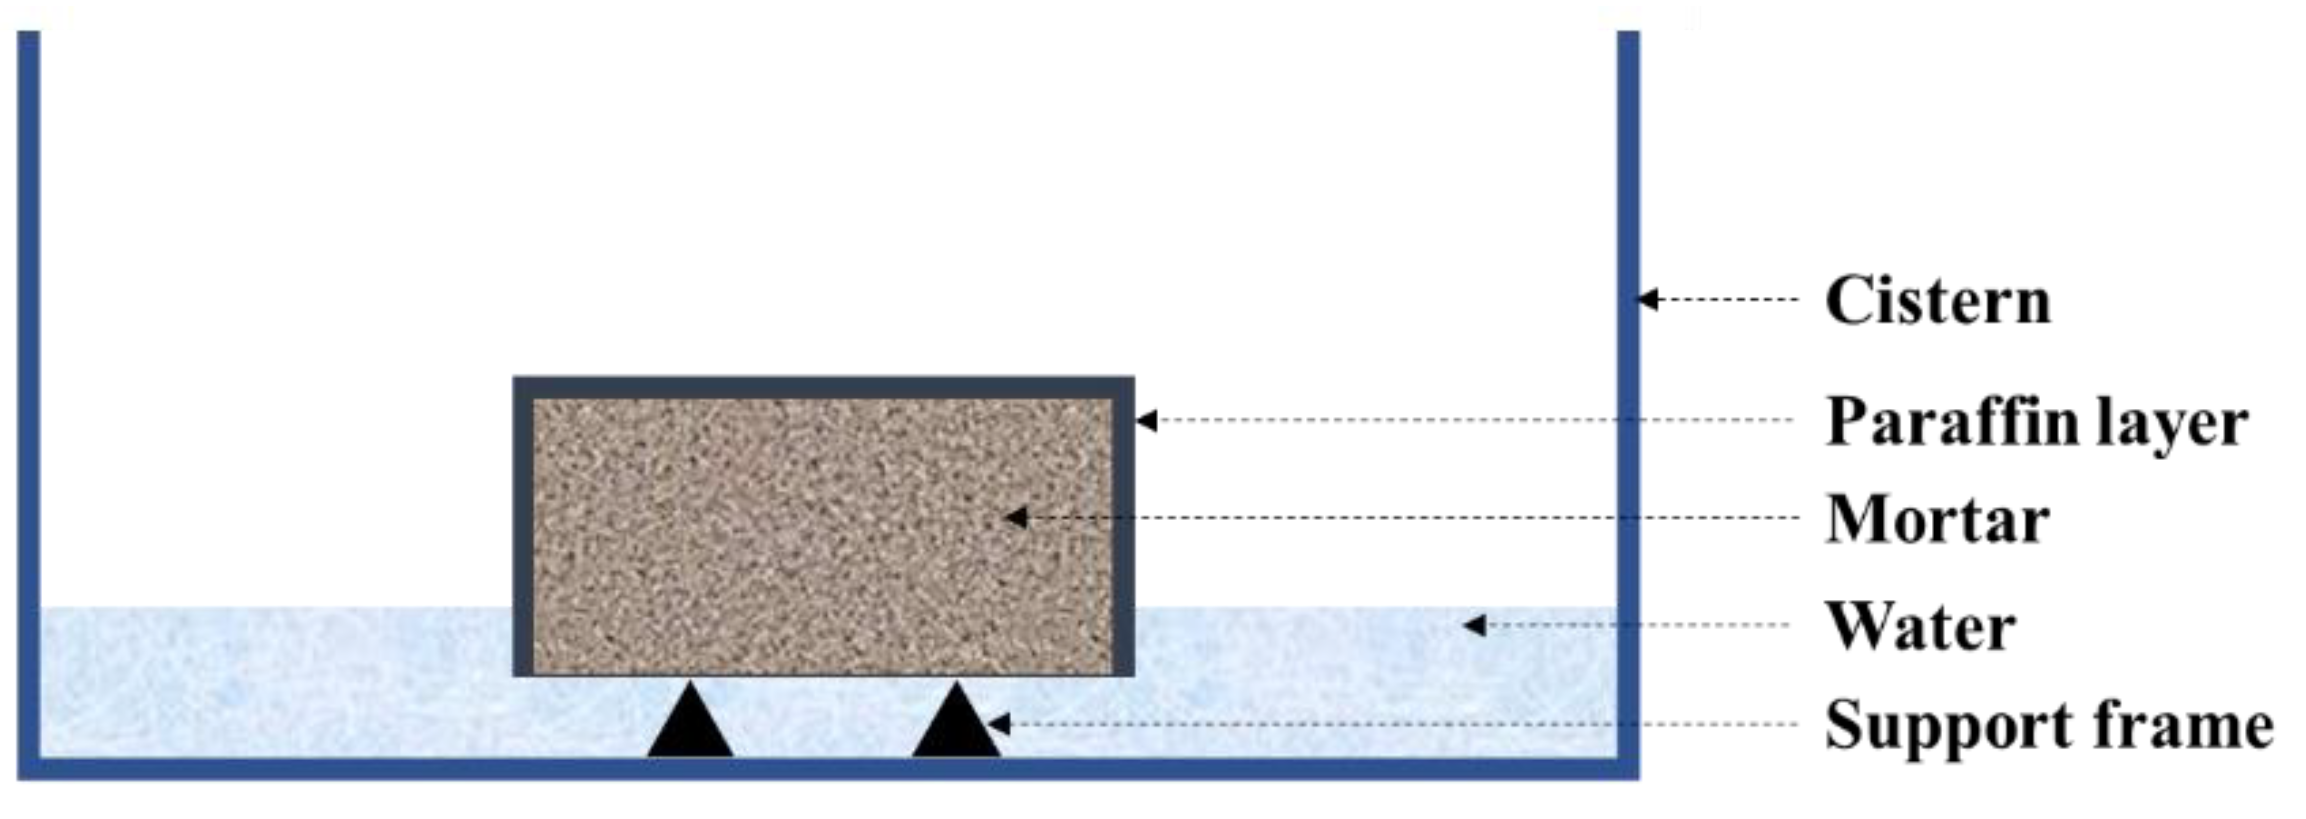
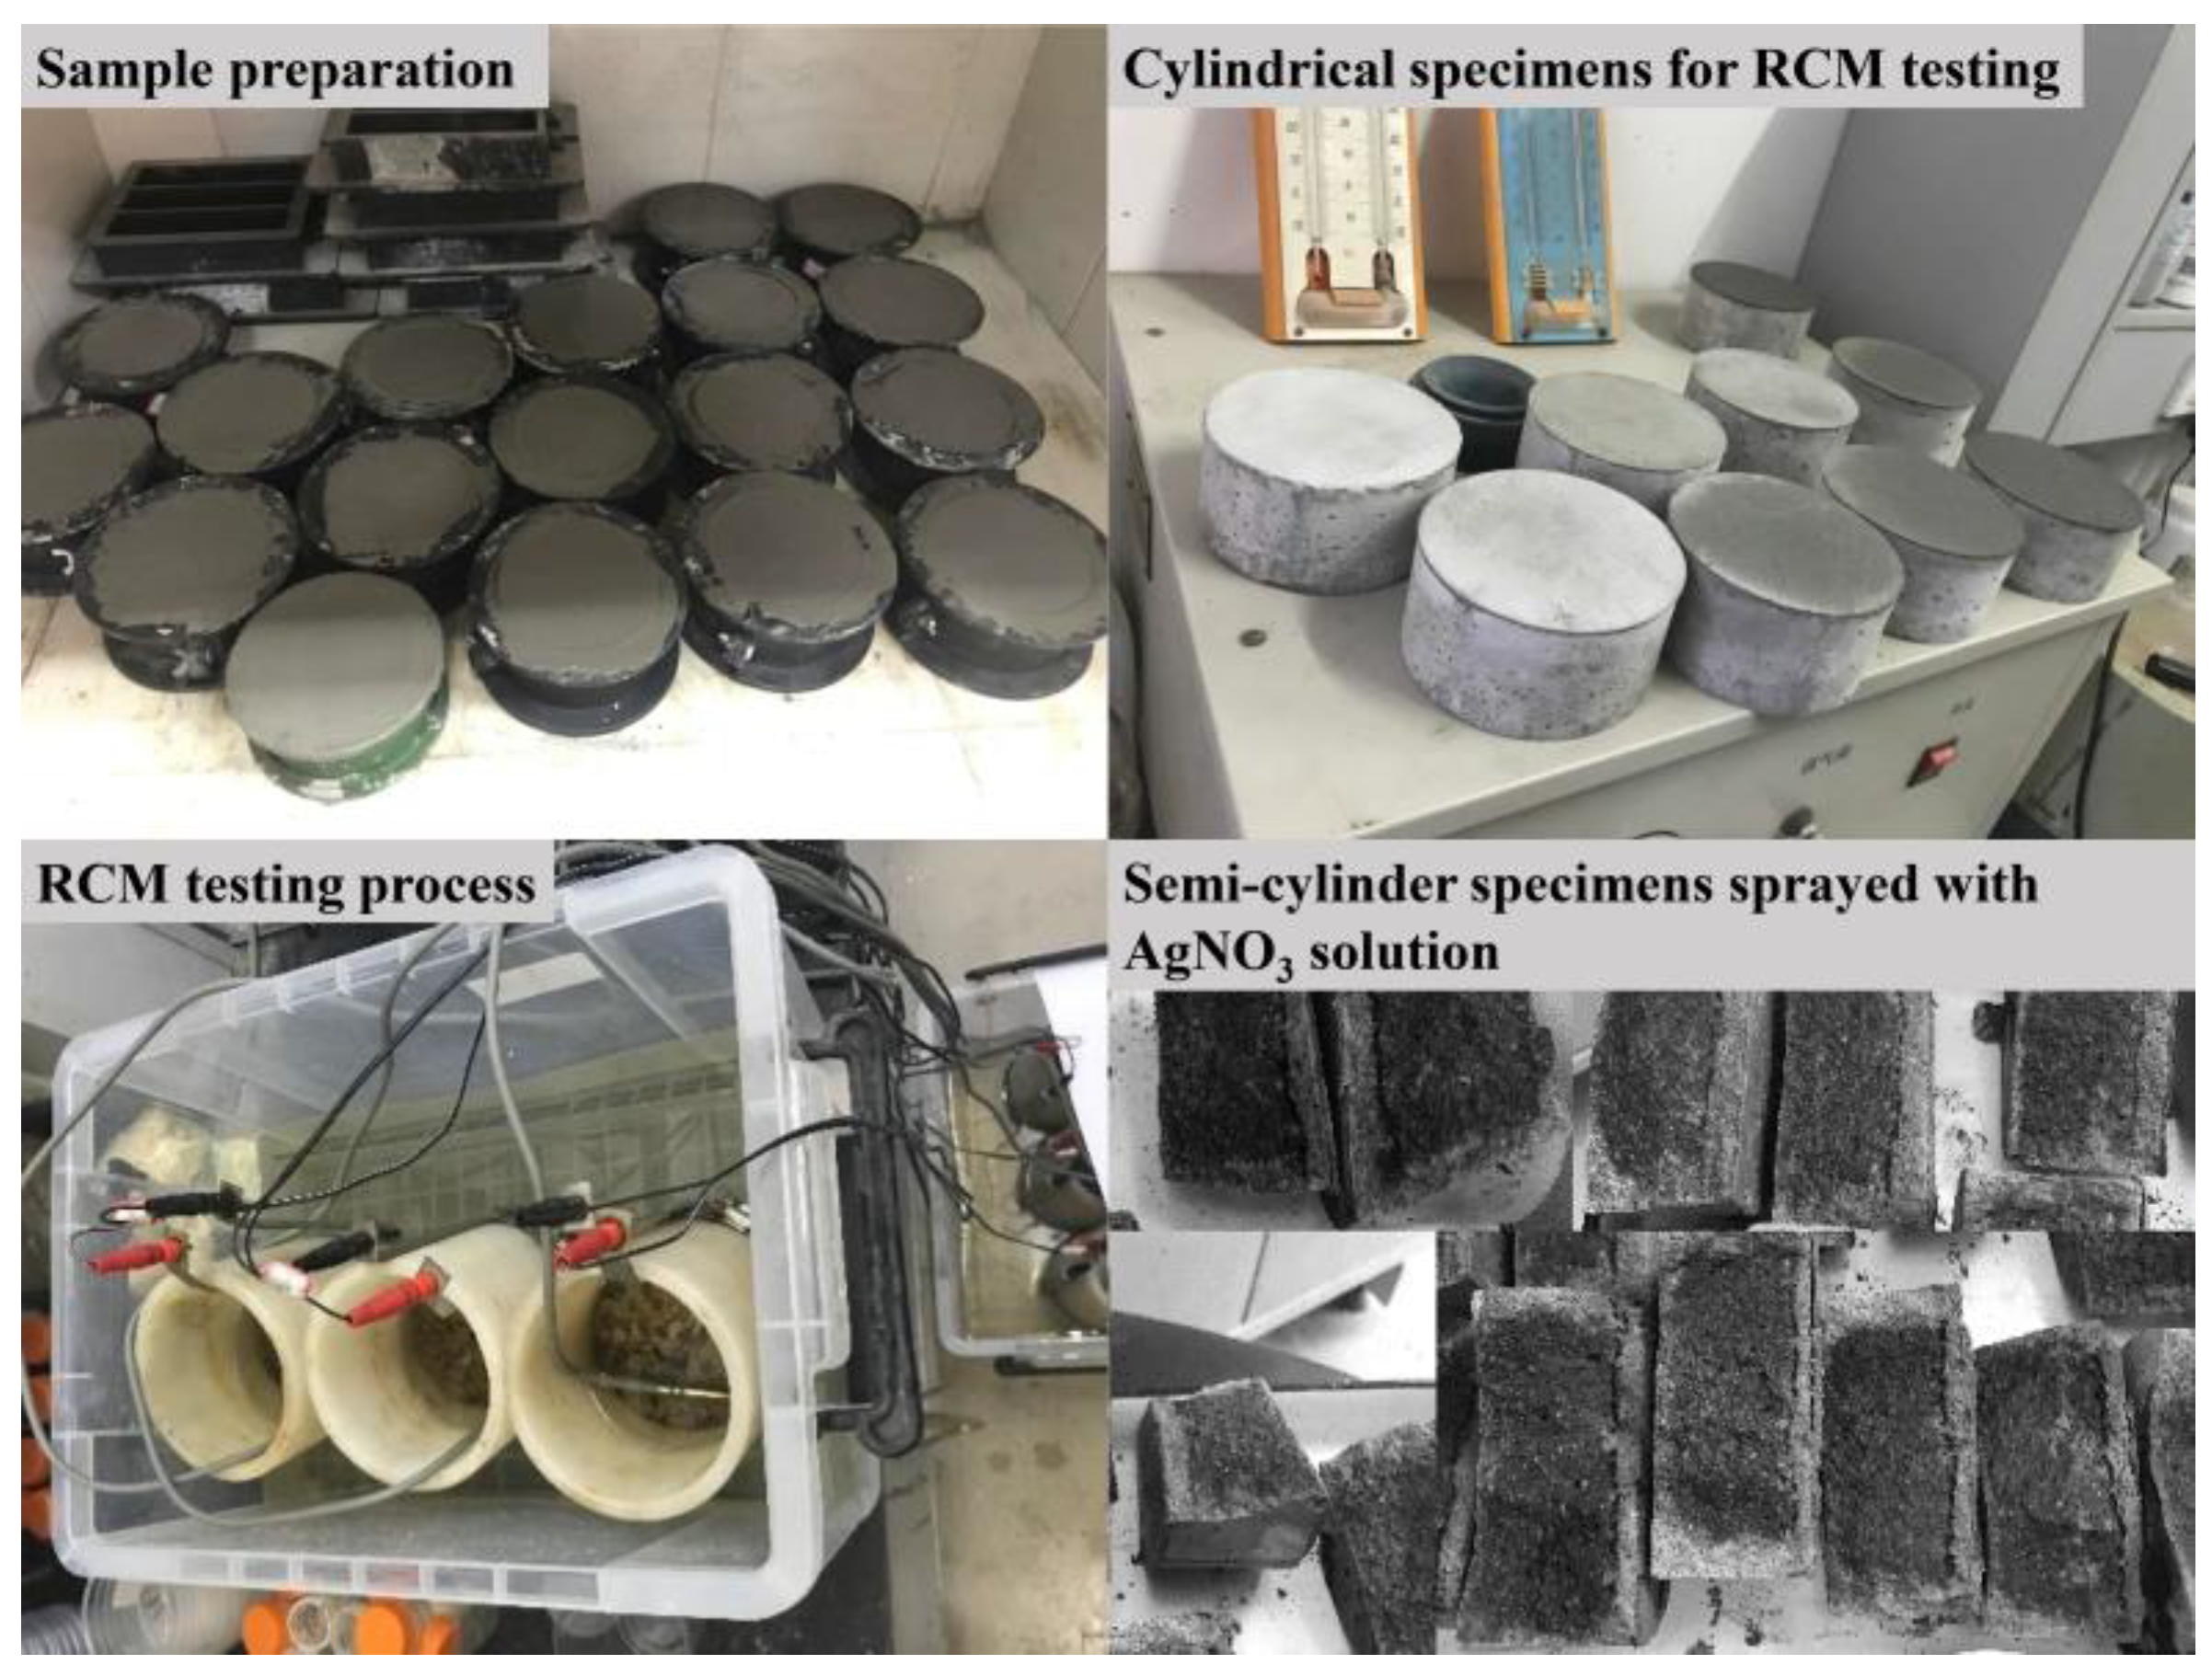
2.3. Test Methods
3. Results and Discussion
3.1. Permeability Characteristics
3.1.1. Total Water Absorption
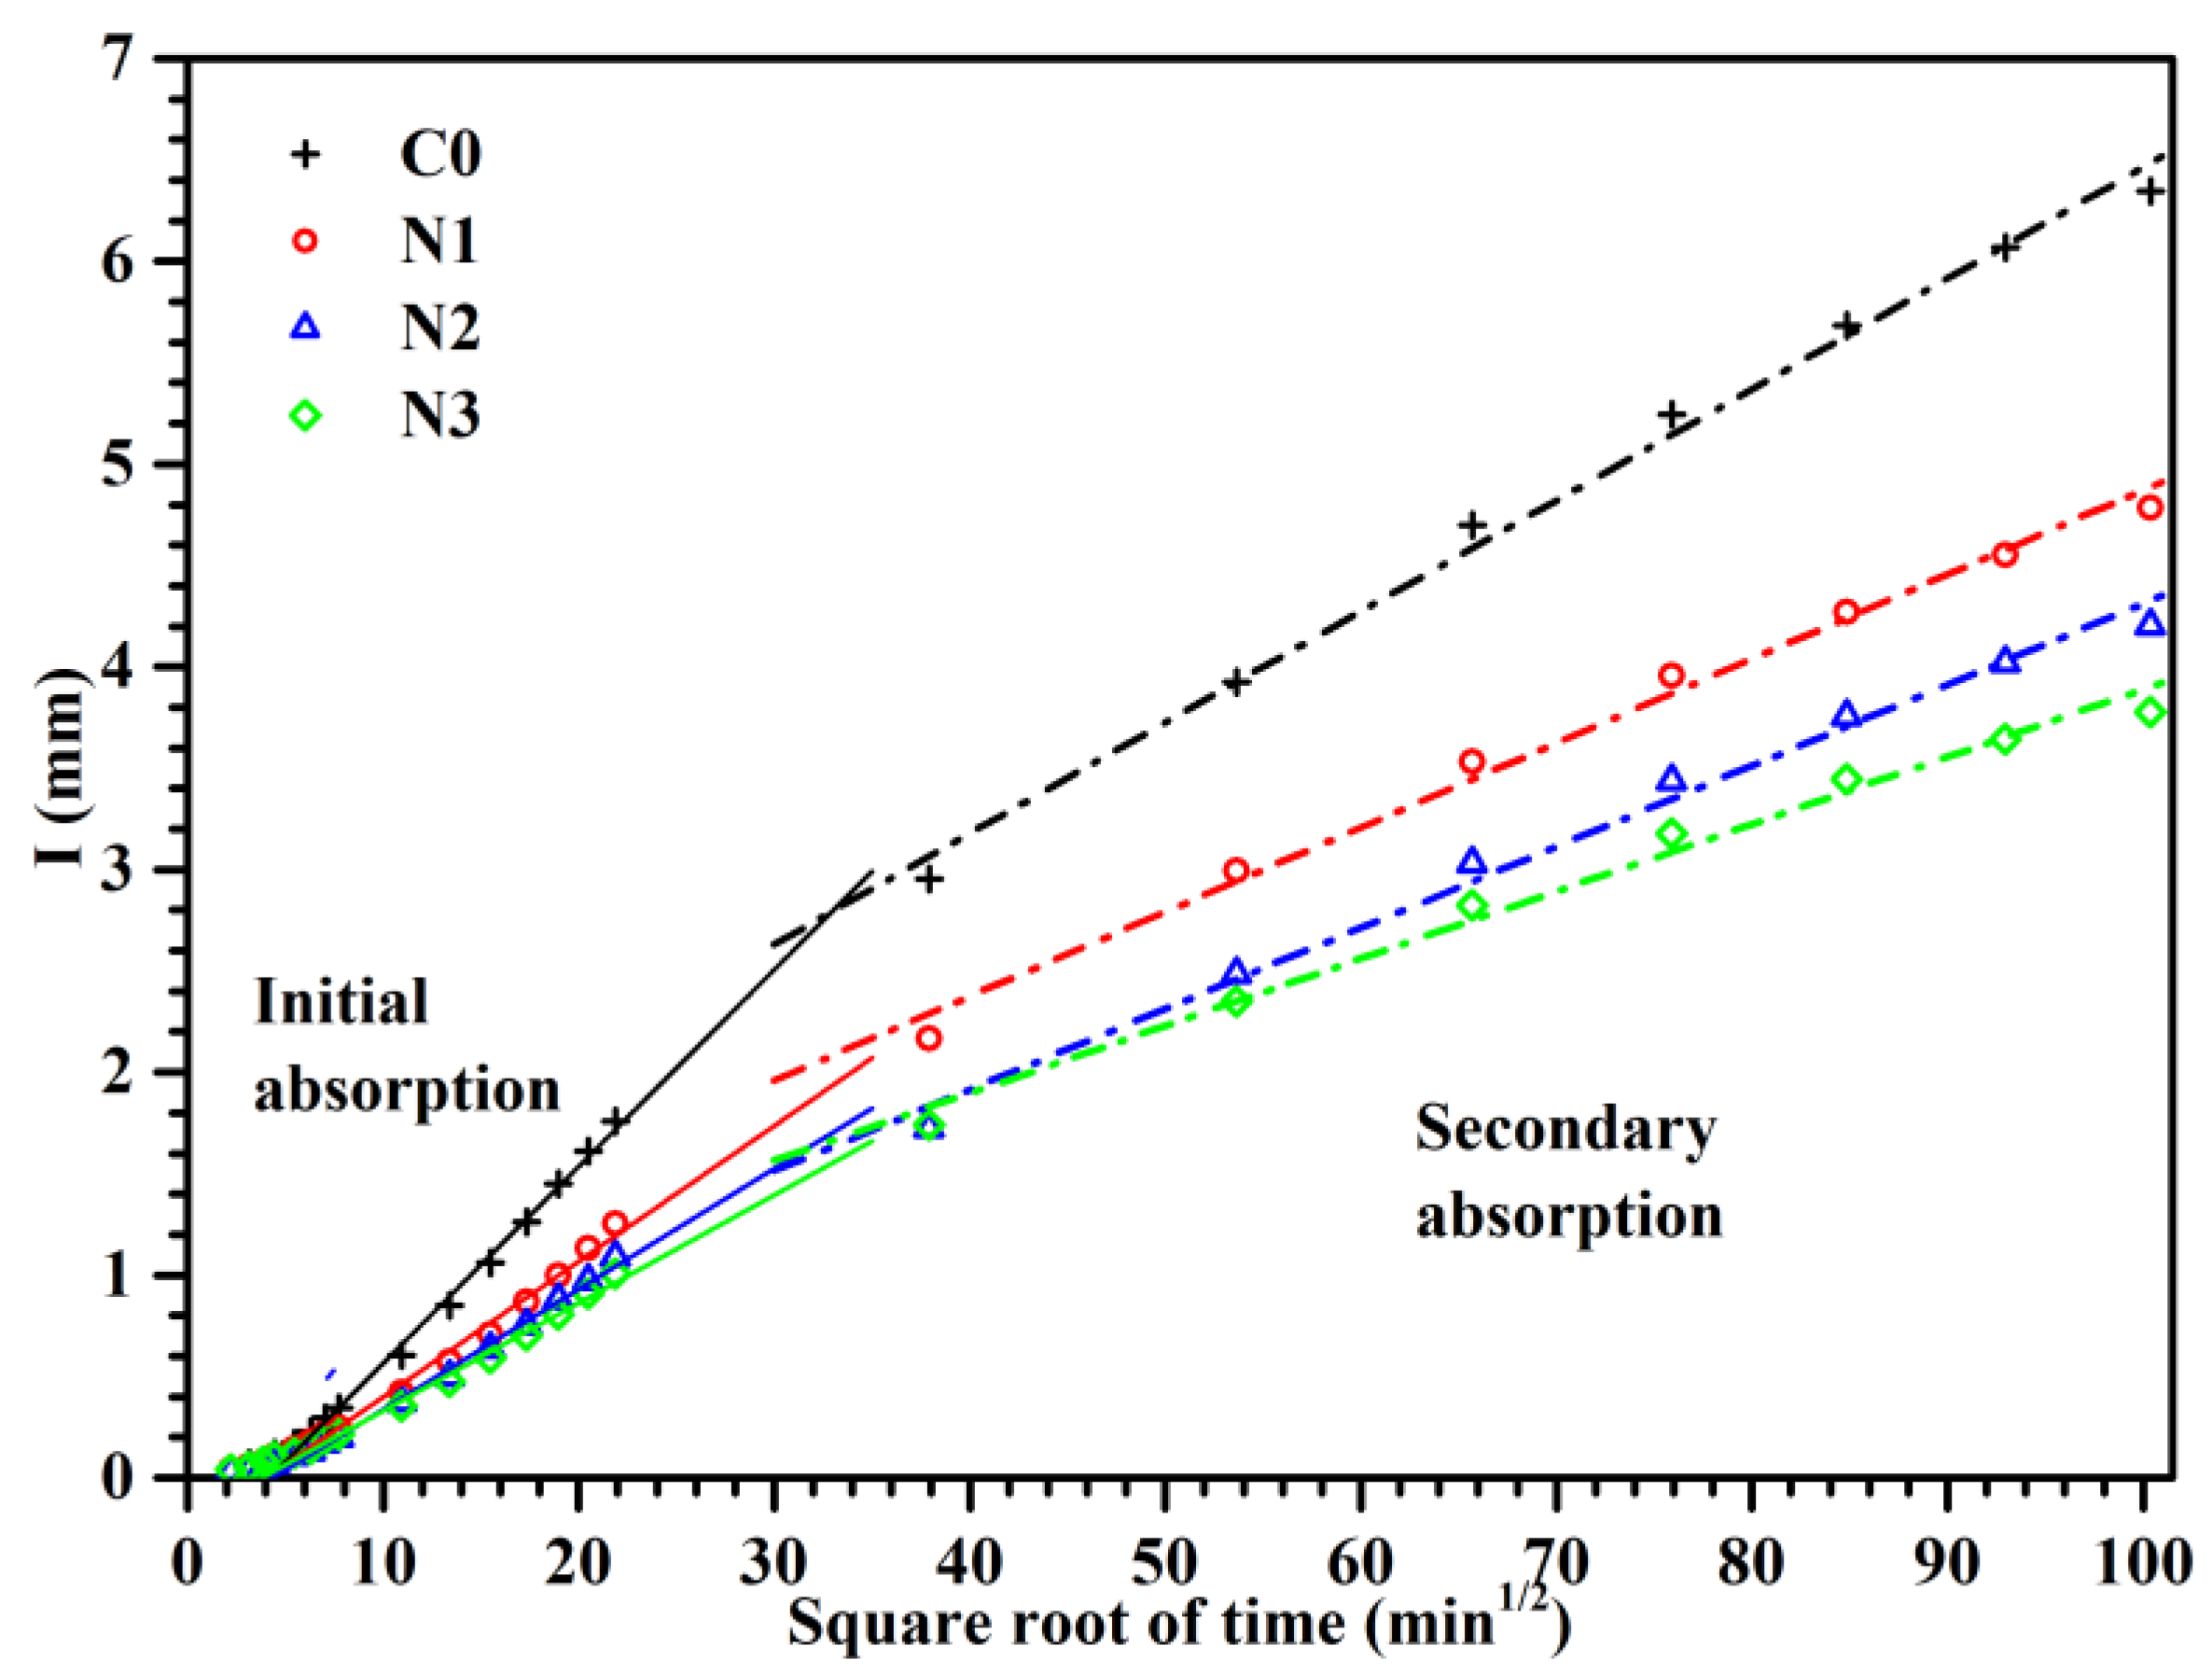
3.1.2. Capillary Water Absorption
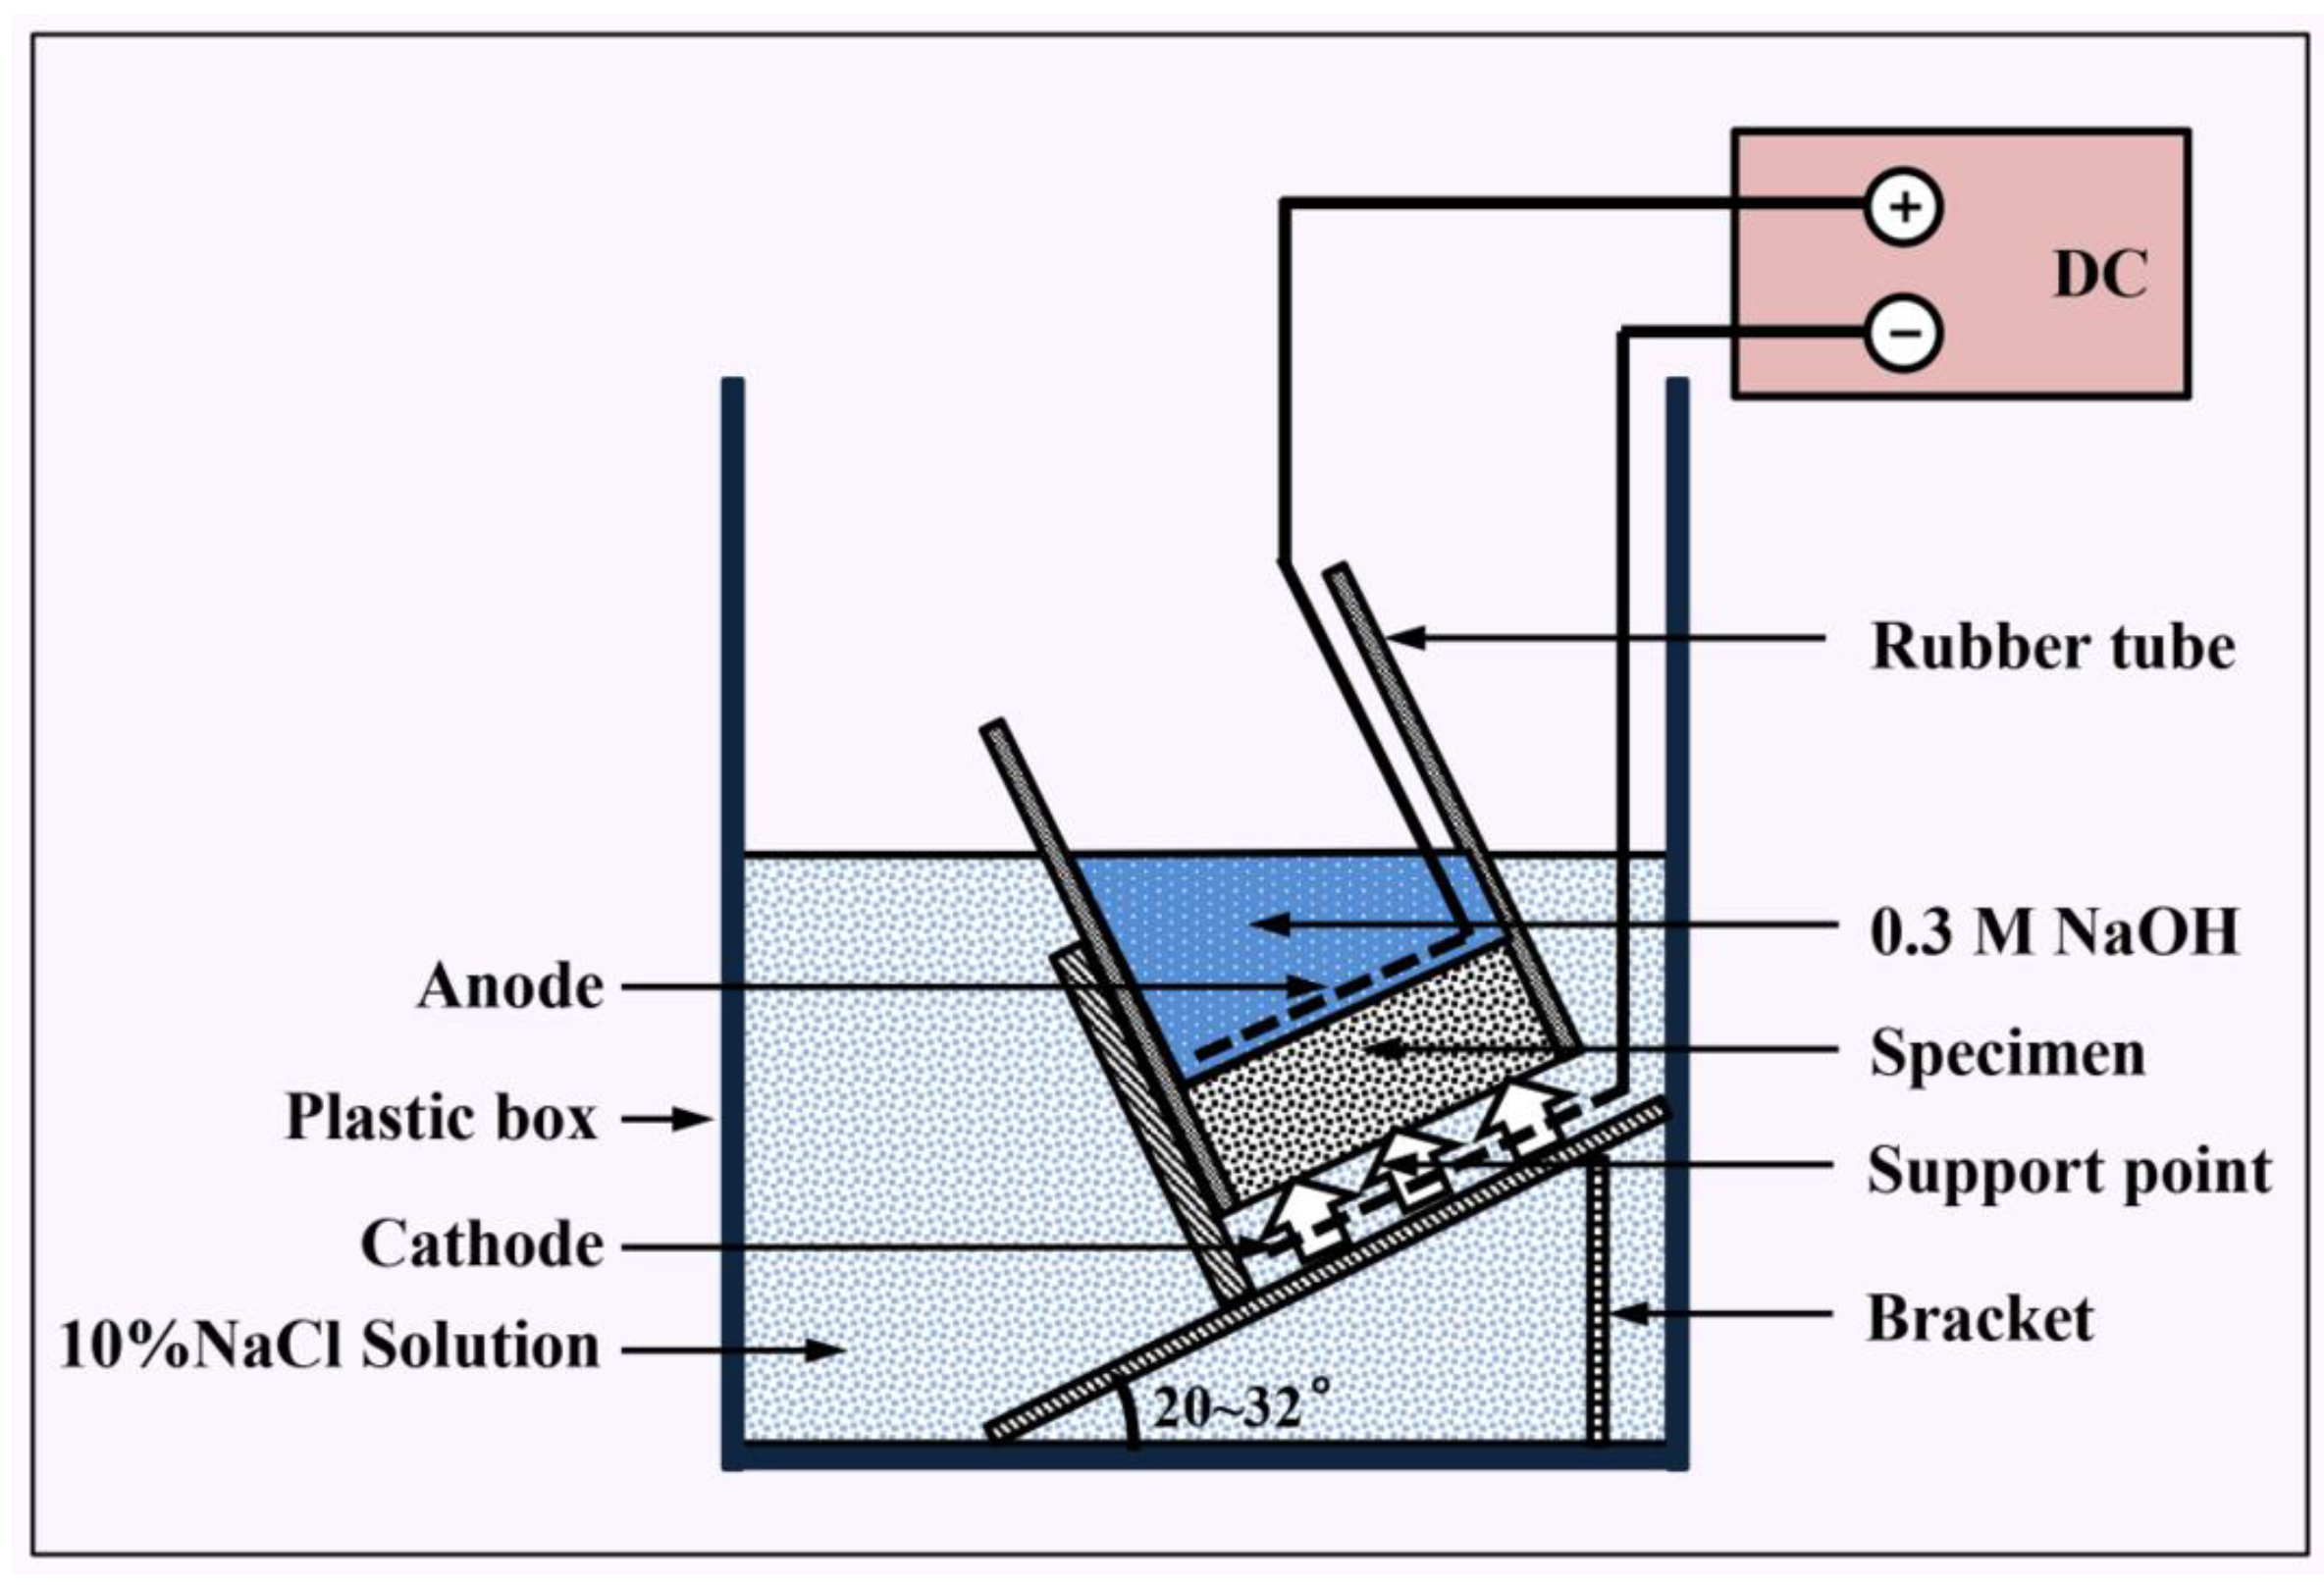
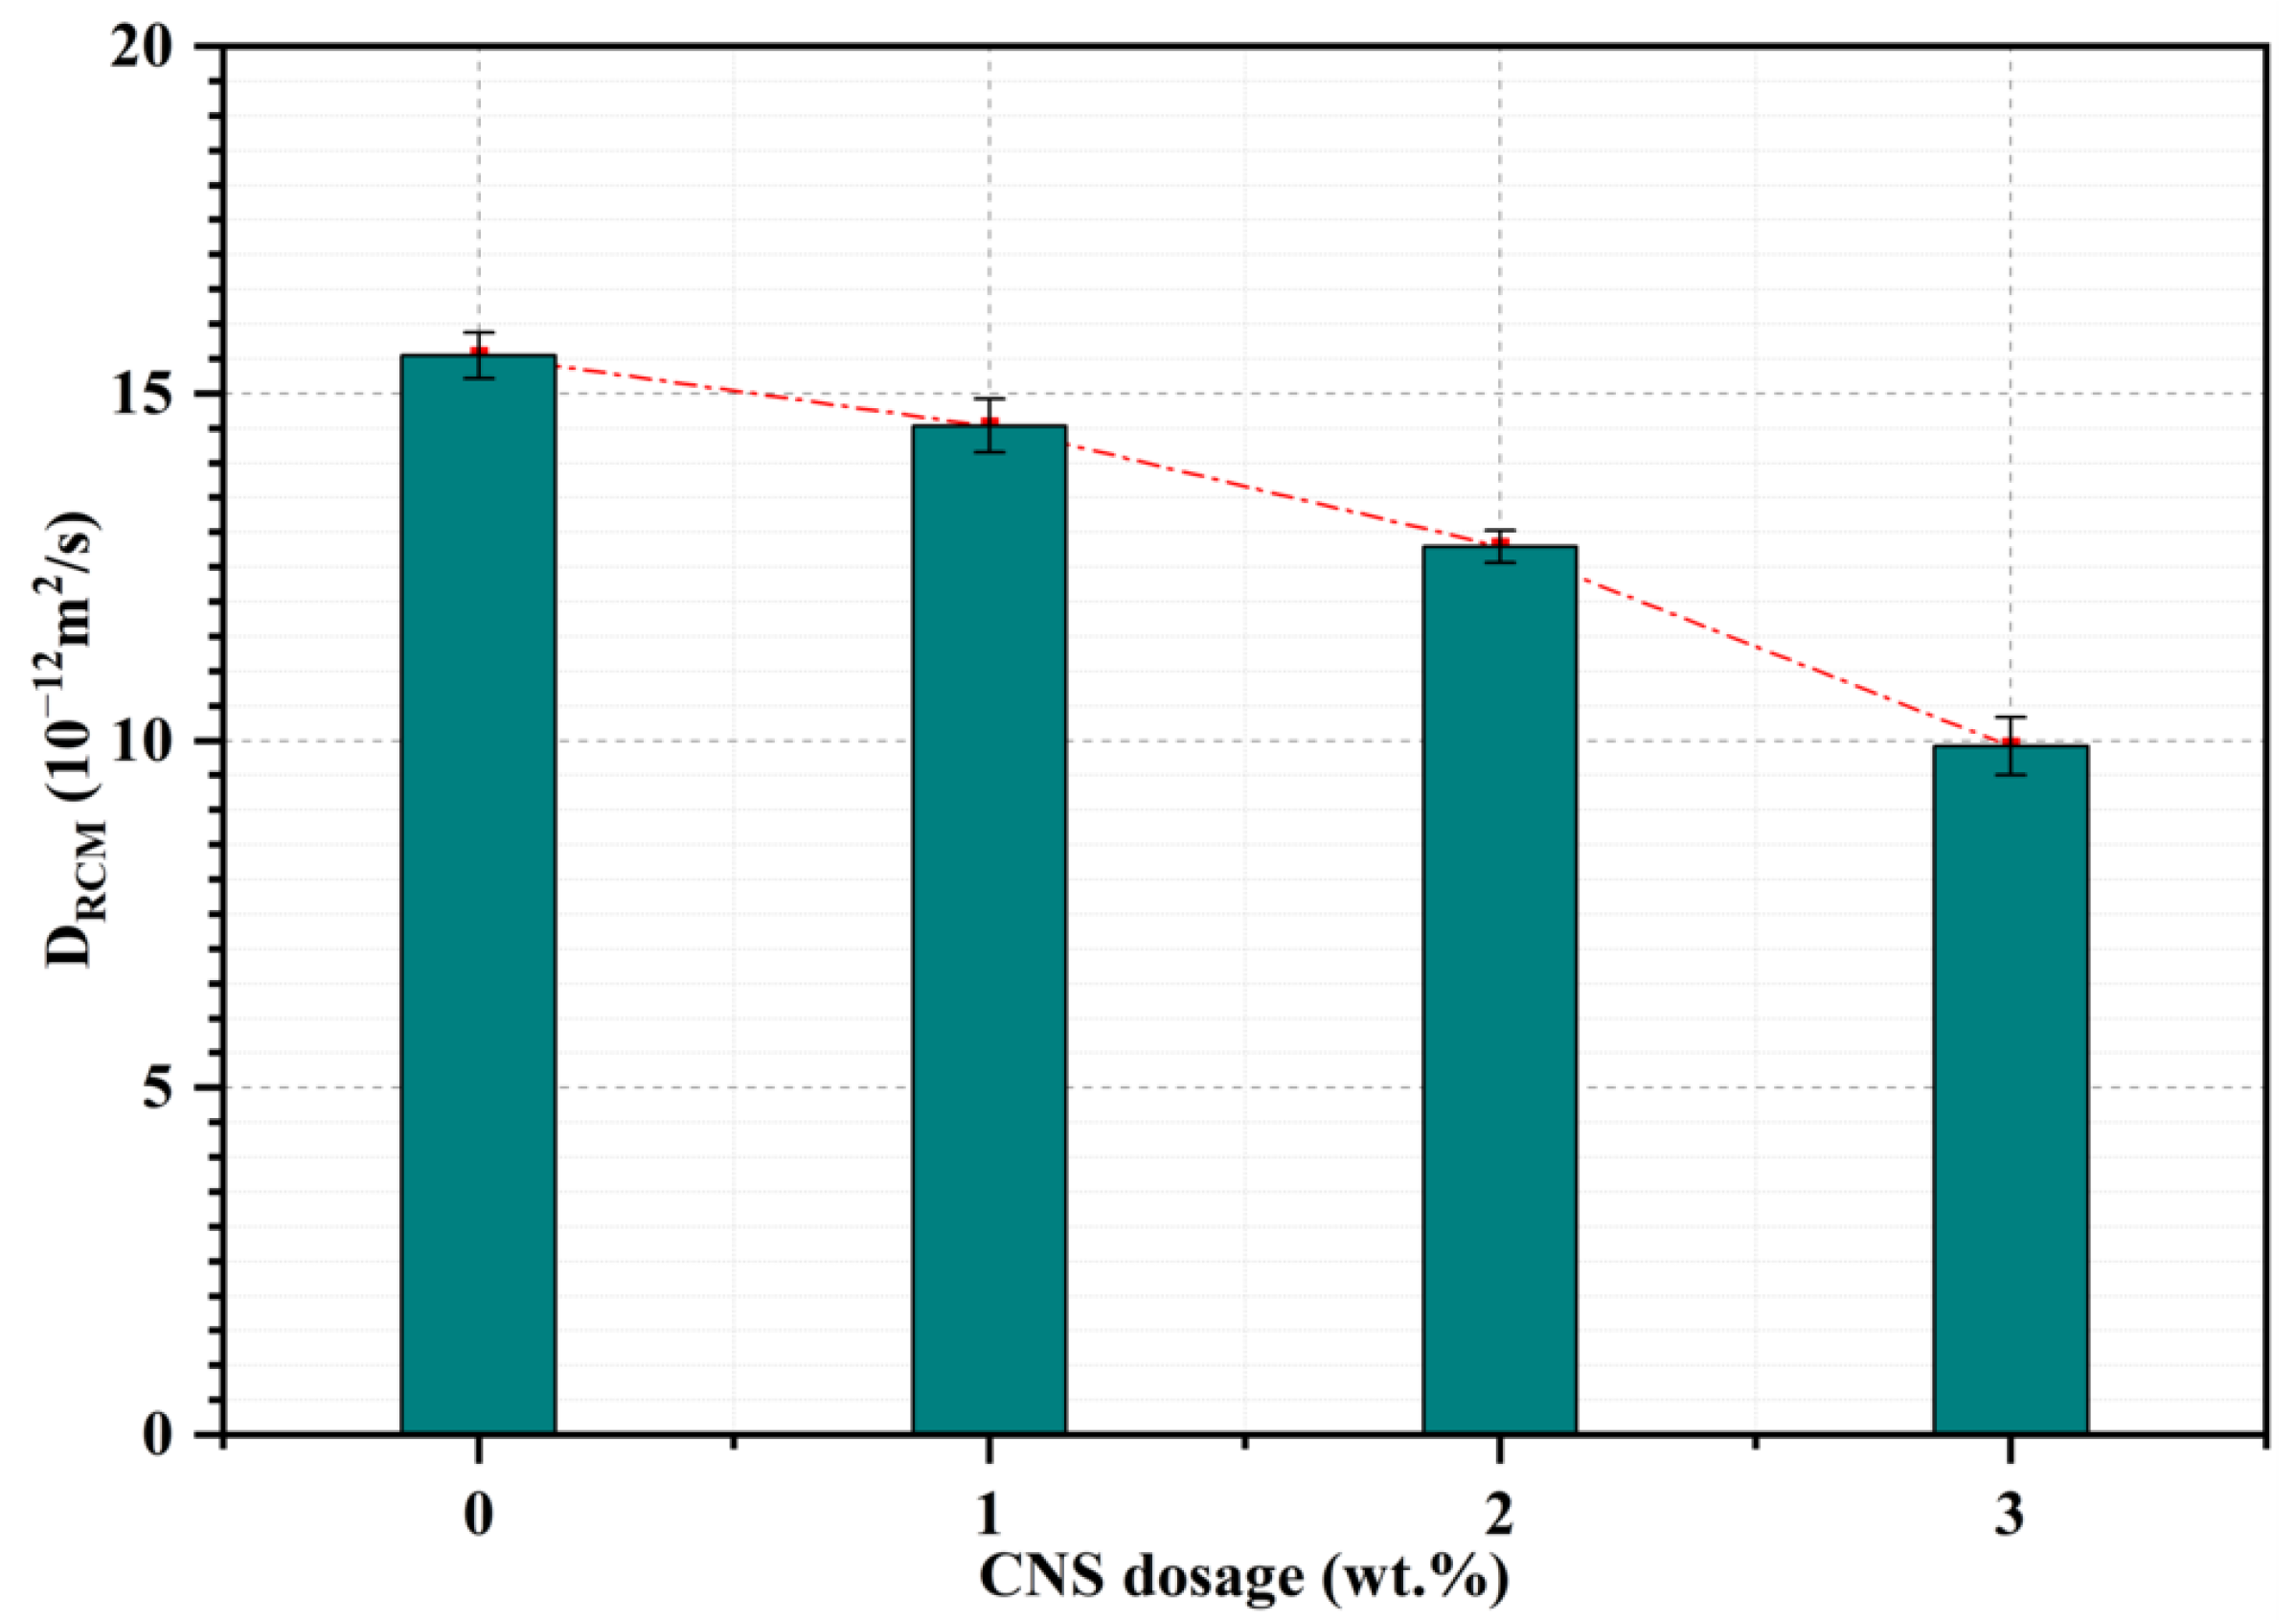
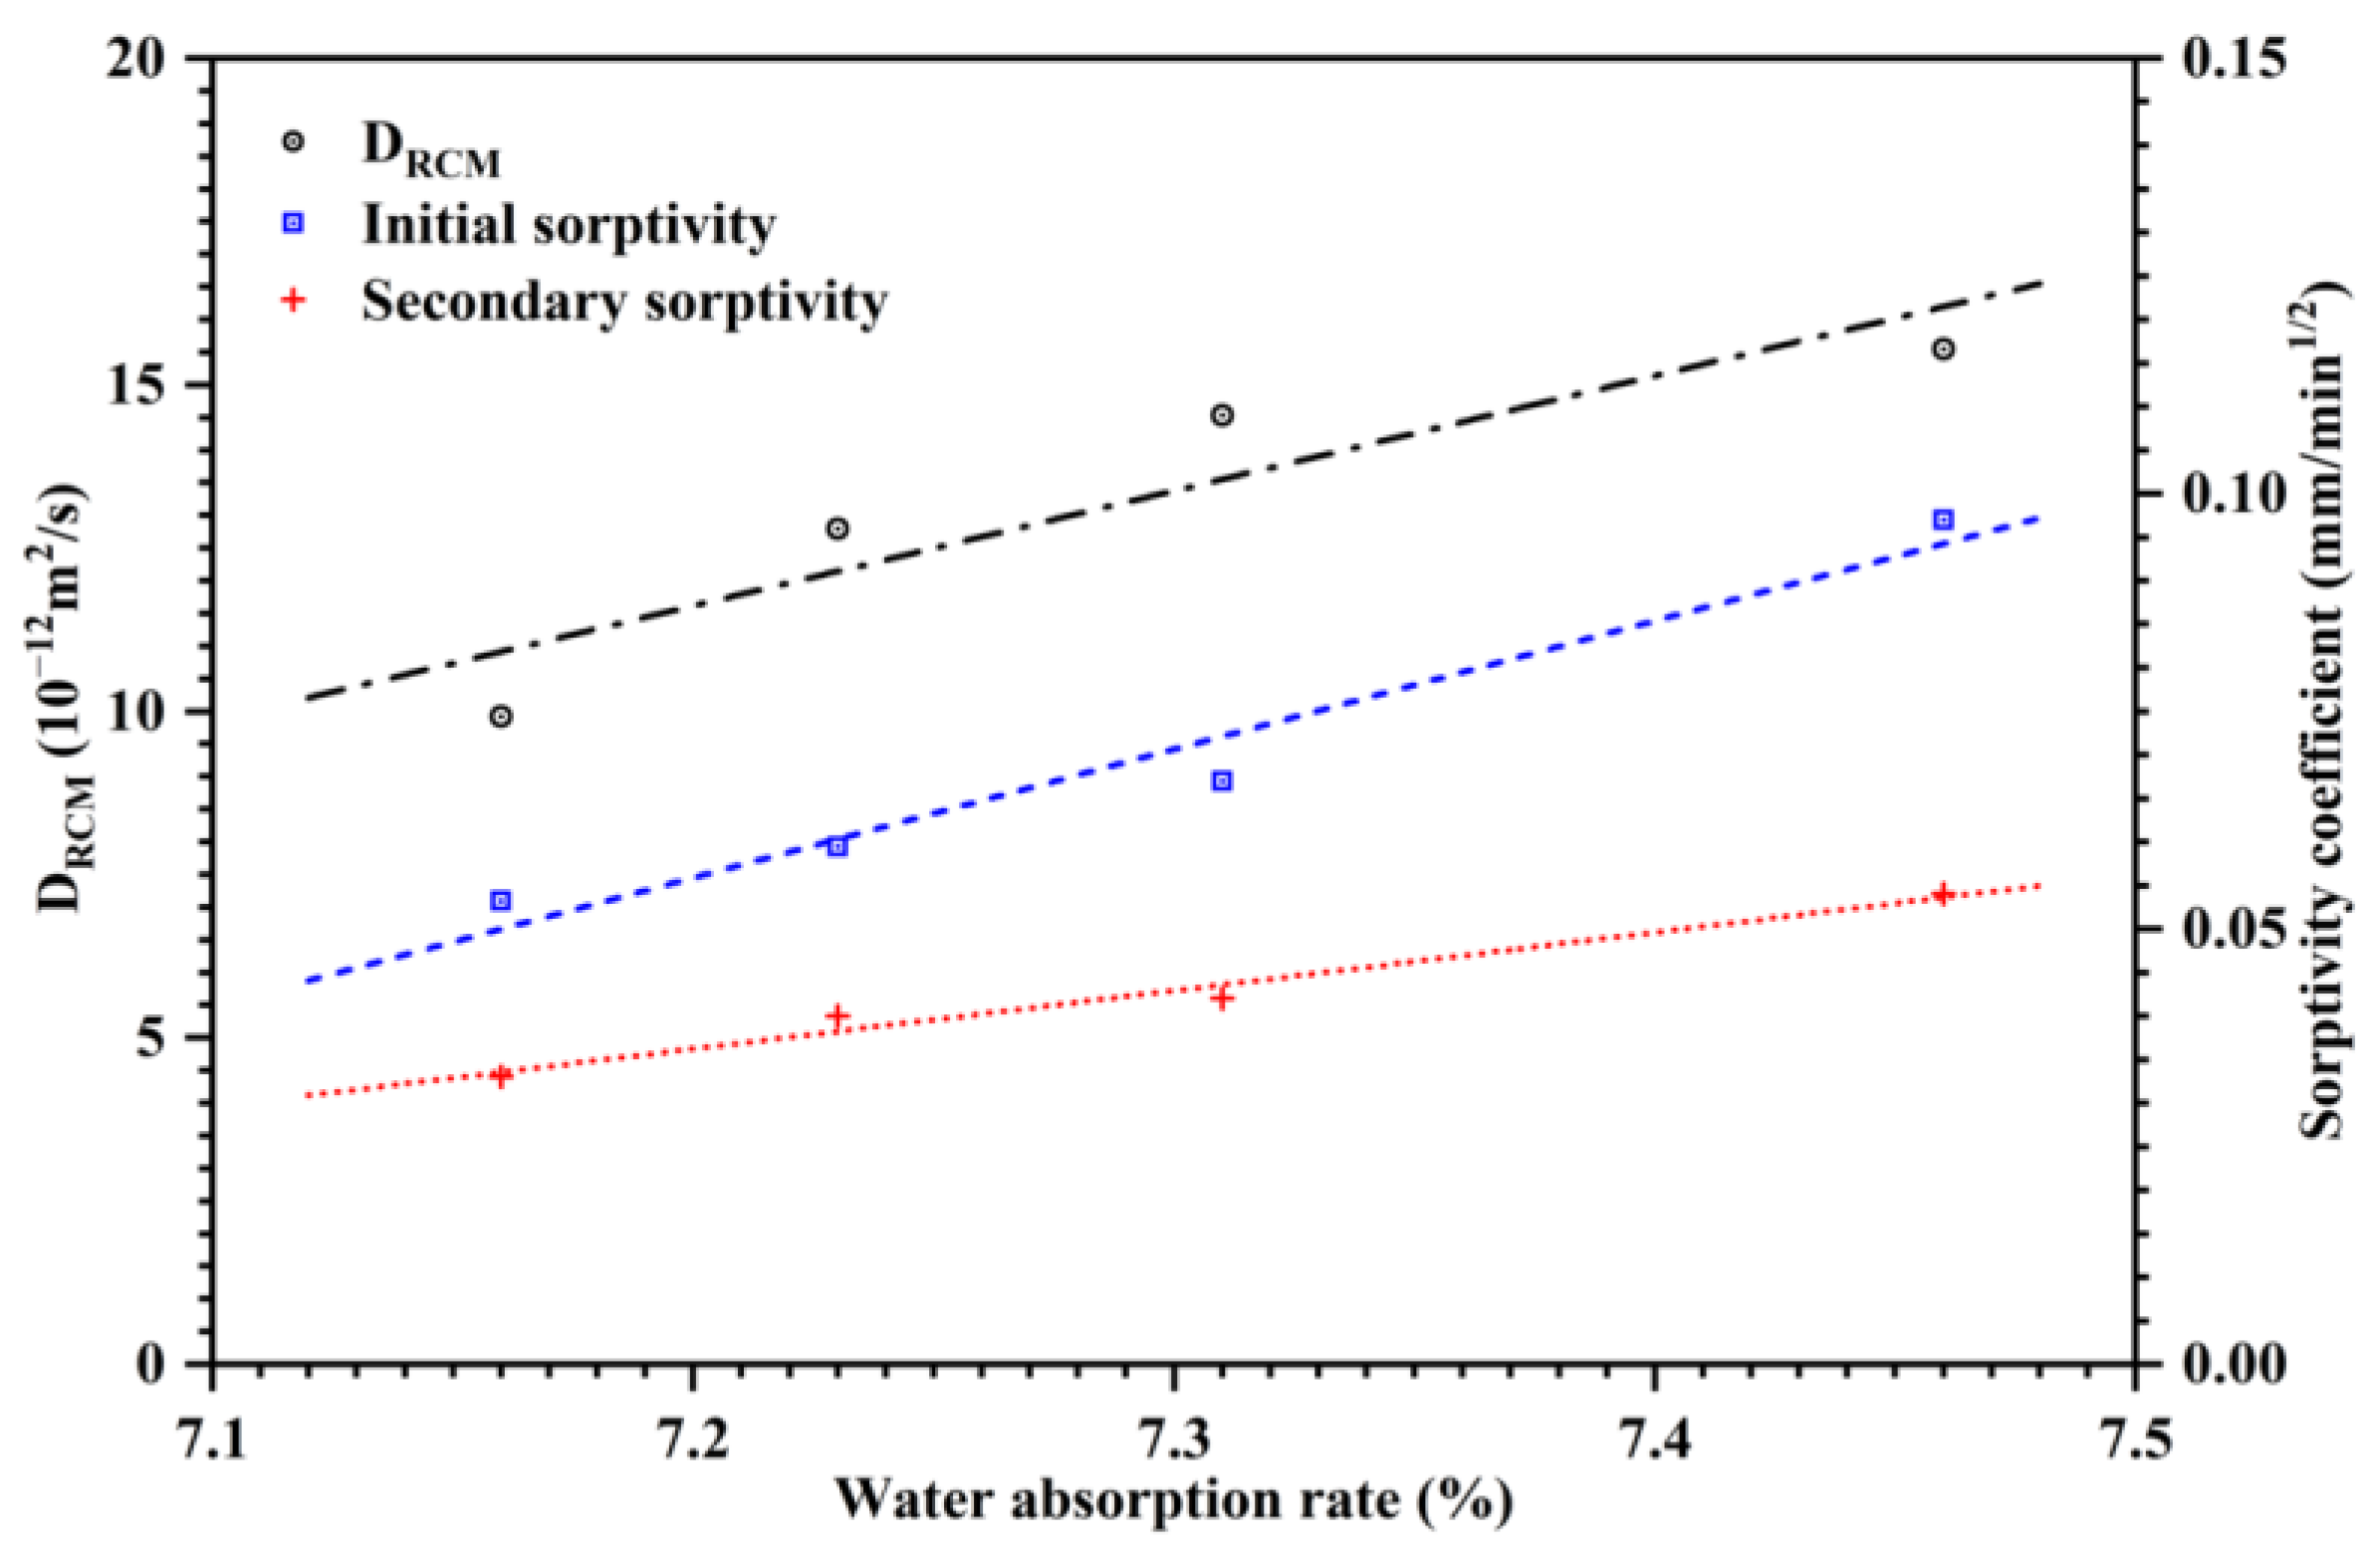
3.1.3. Chloride Diffusion Coefficient
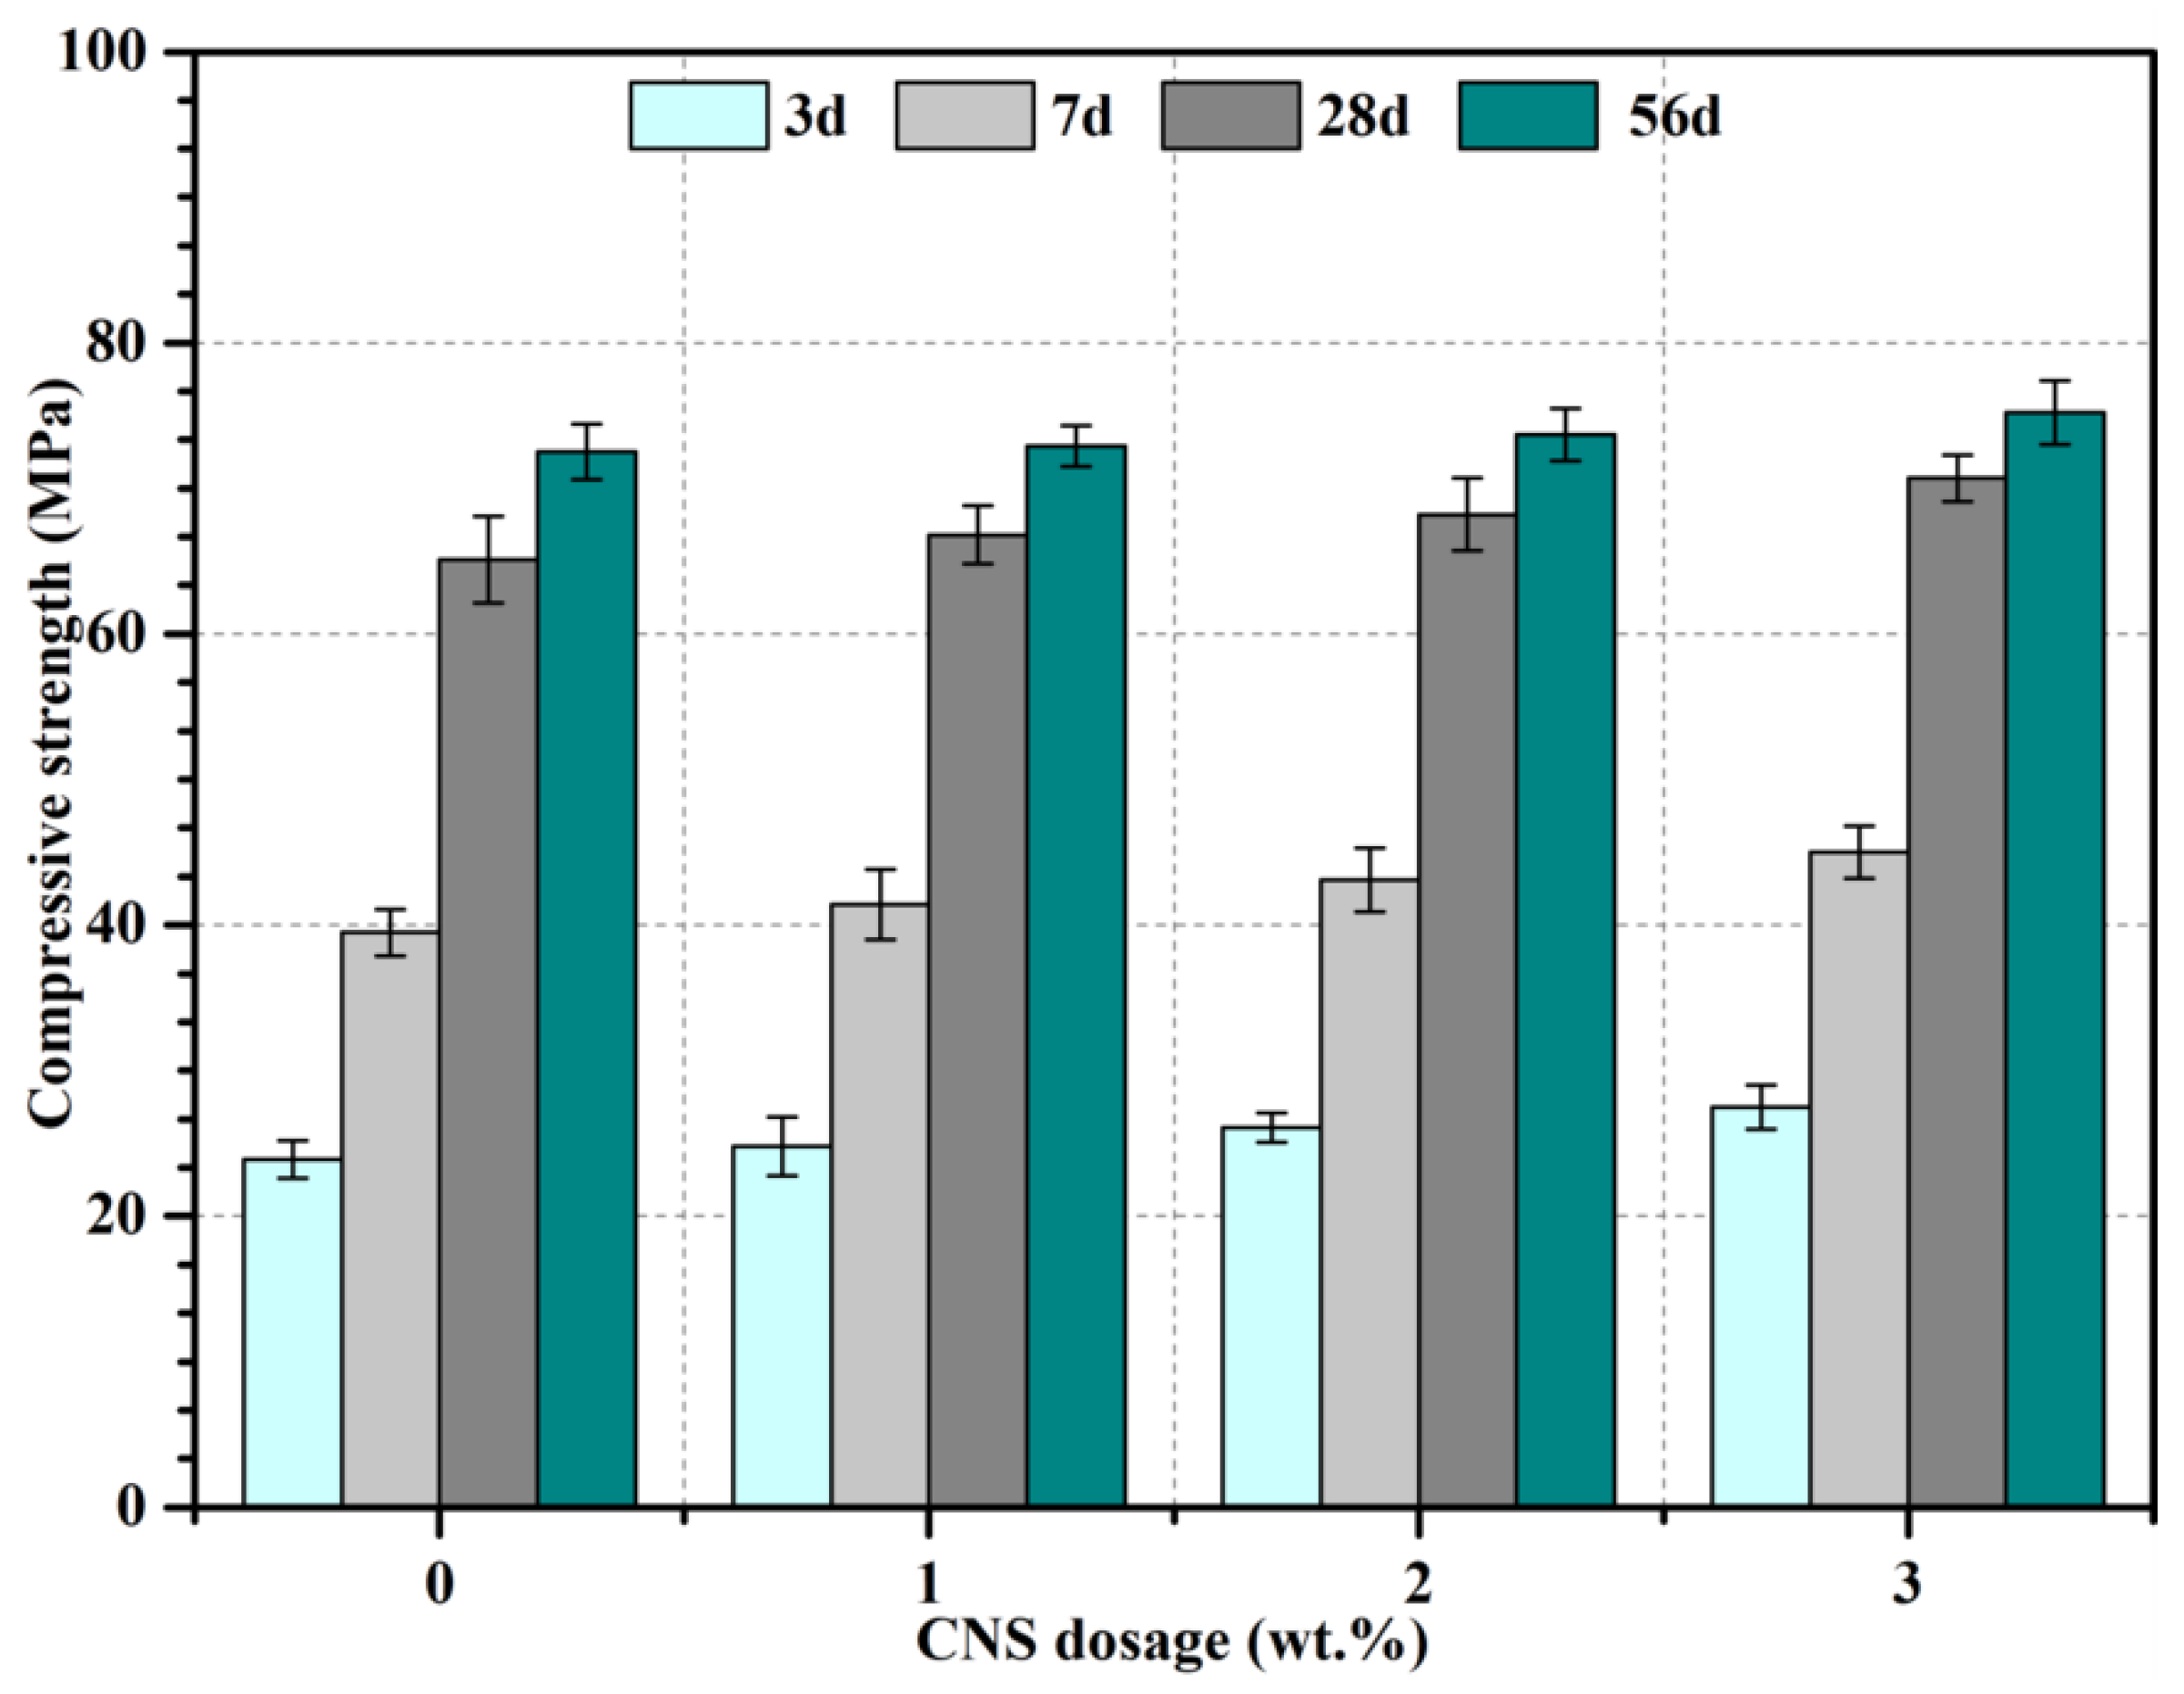
3.2. Mechanical Strength
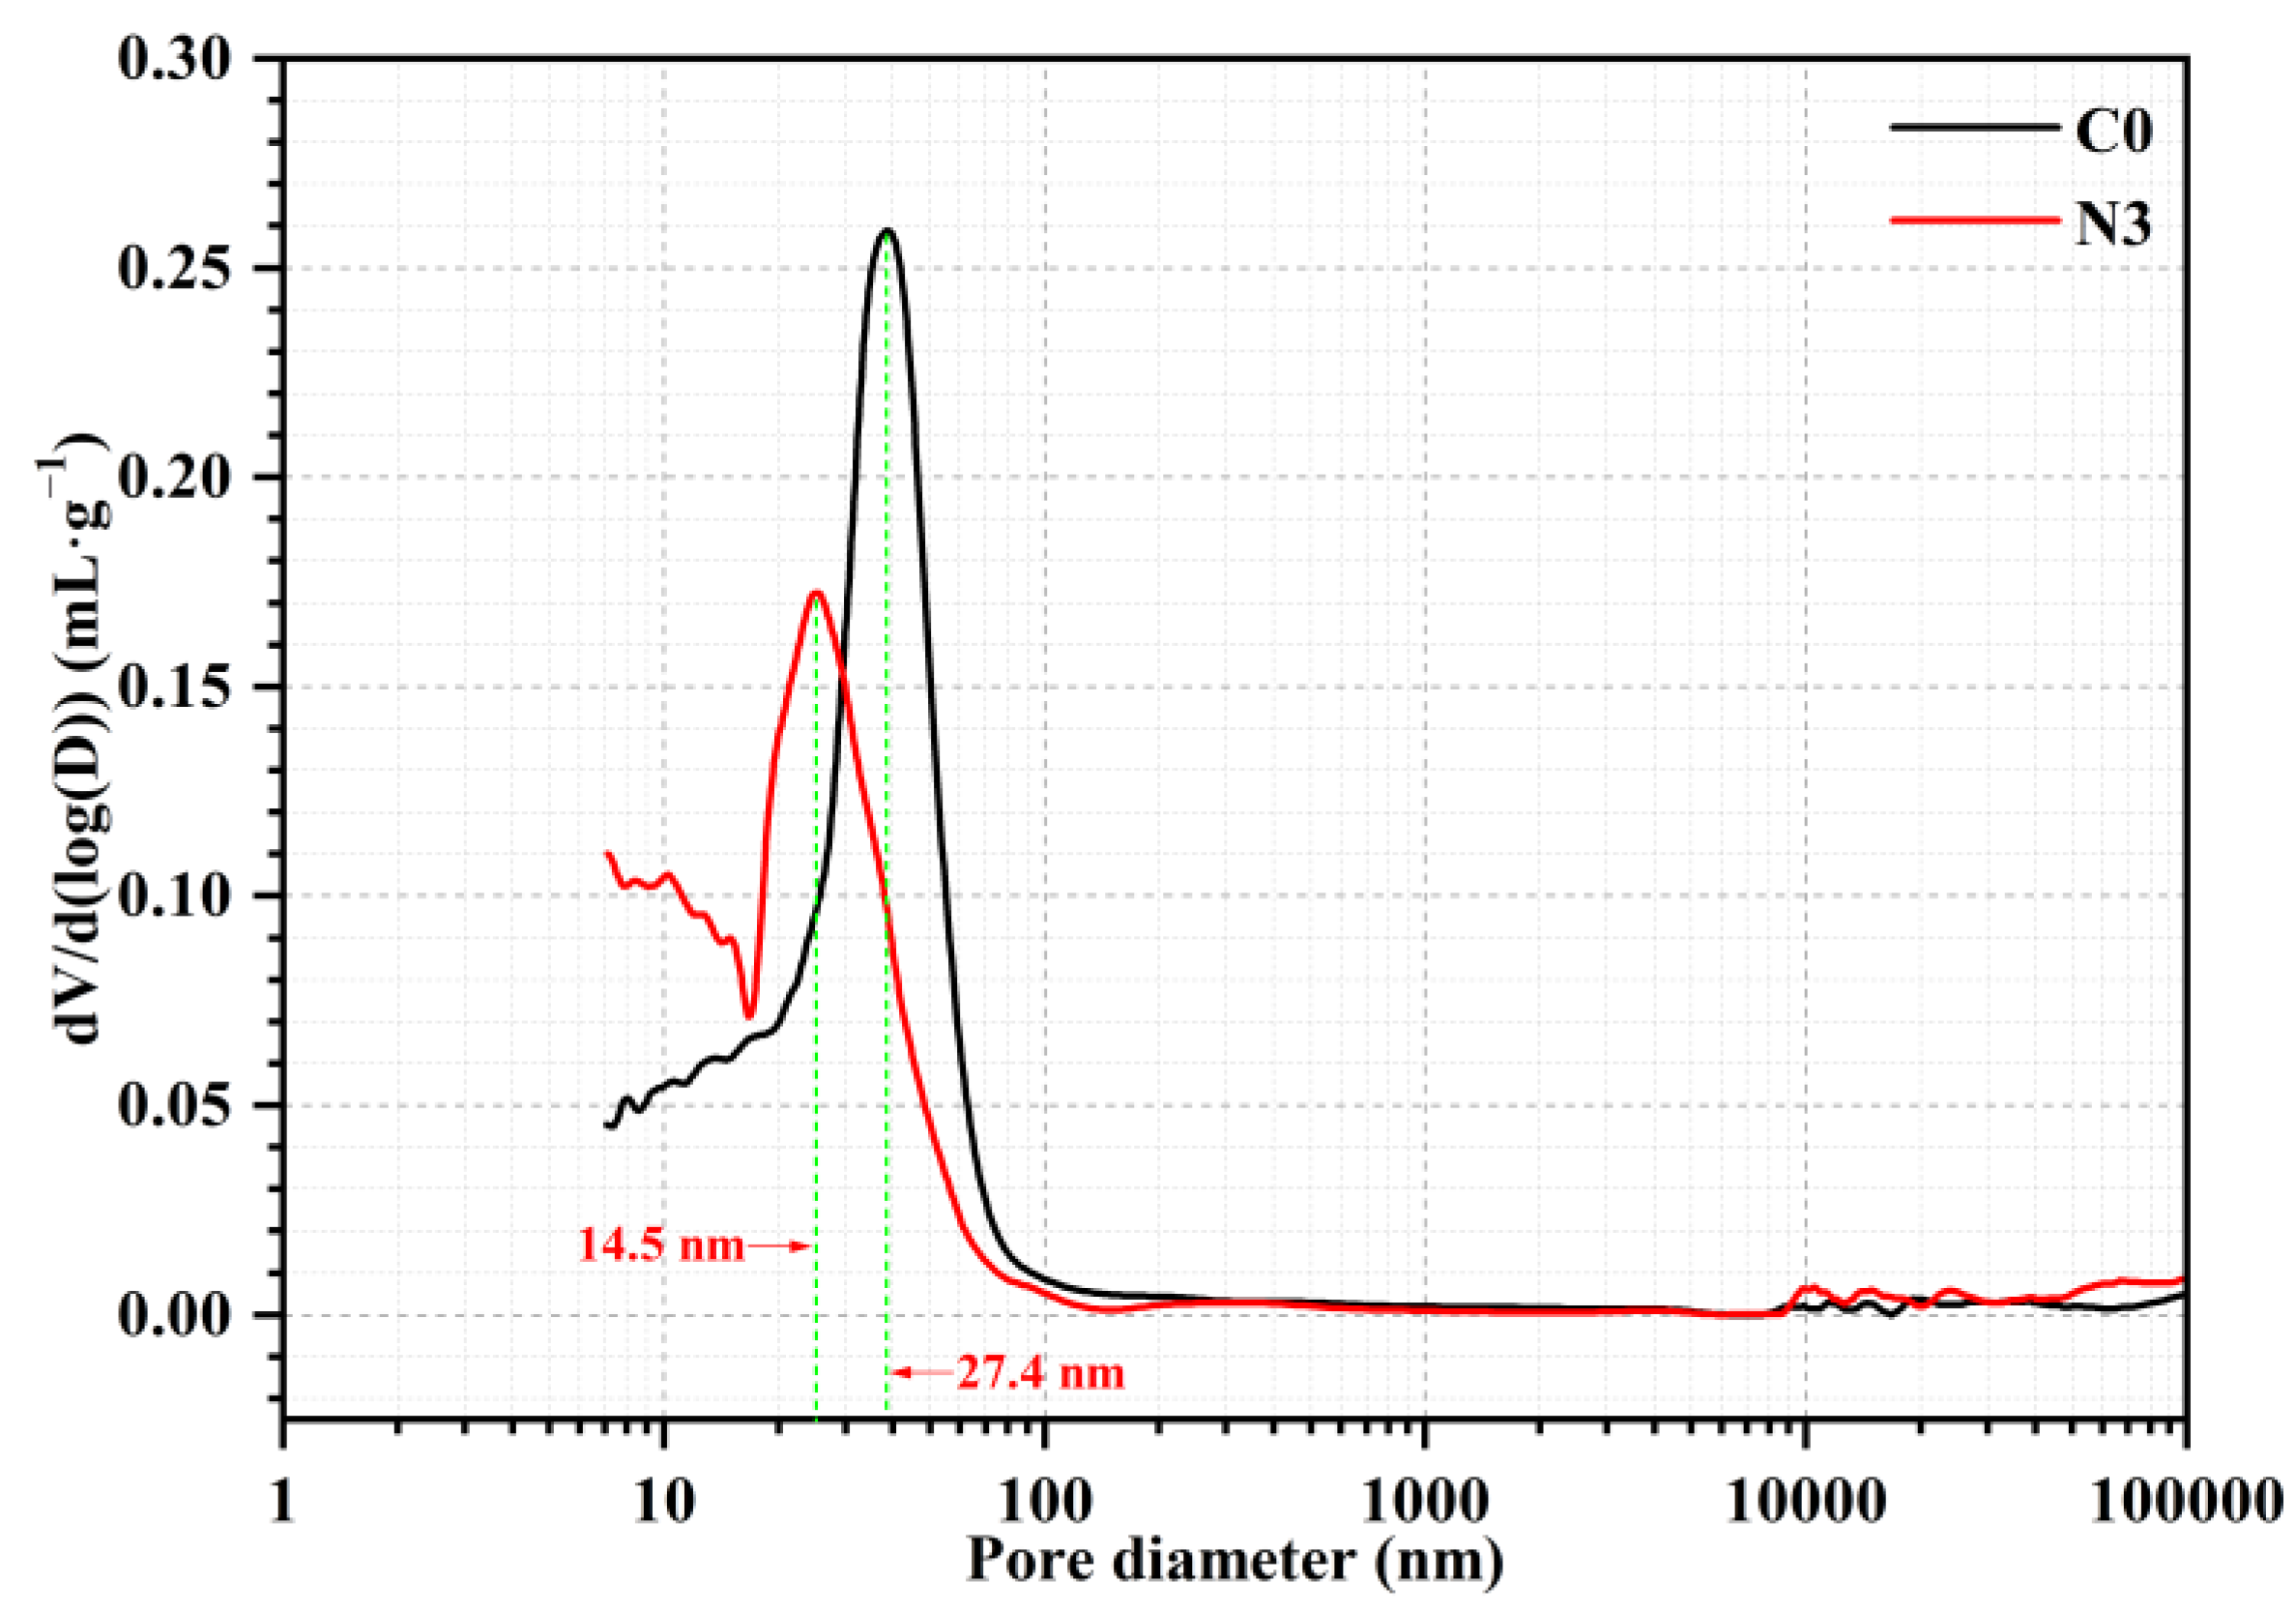
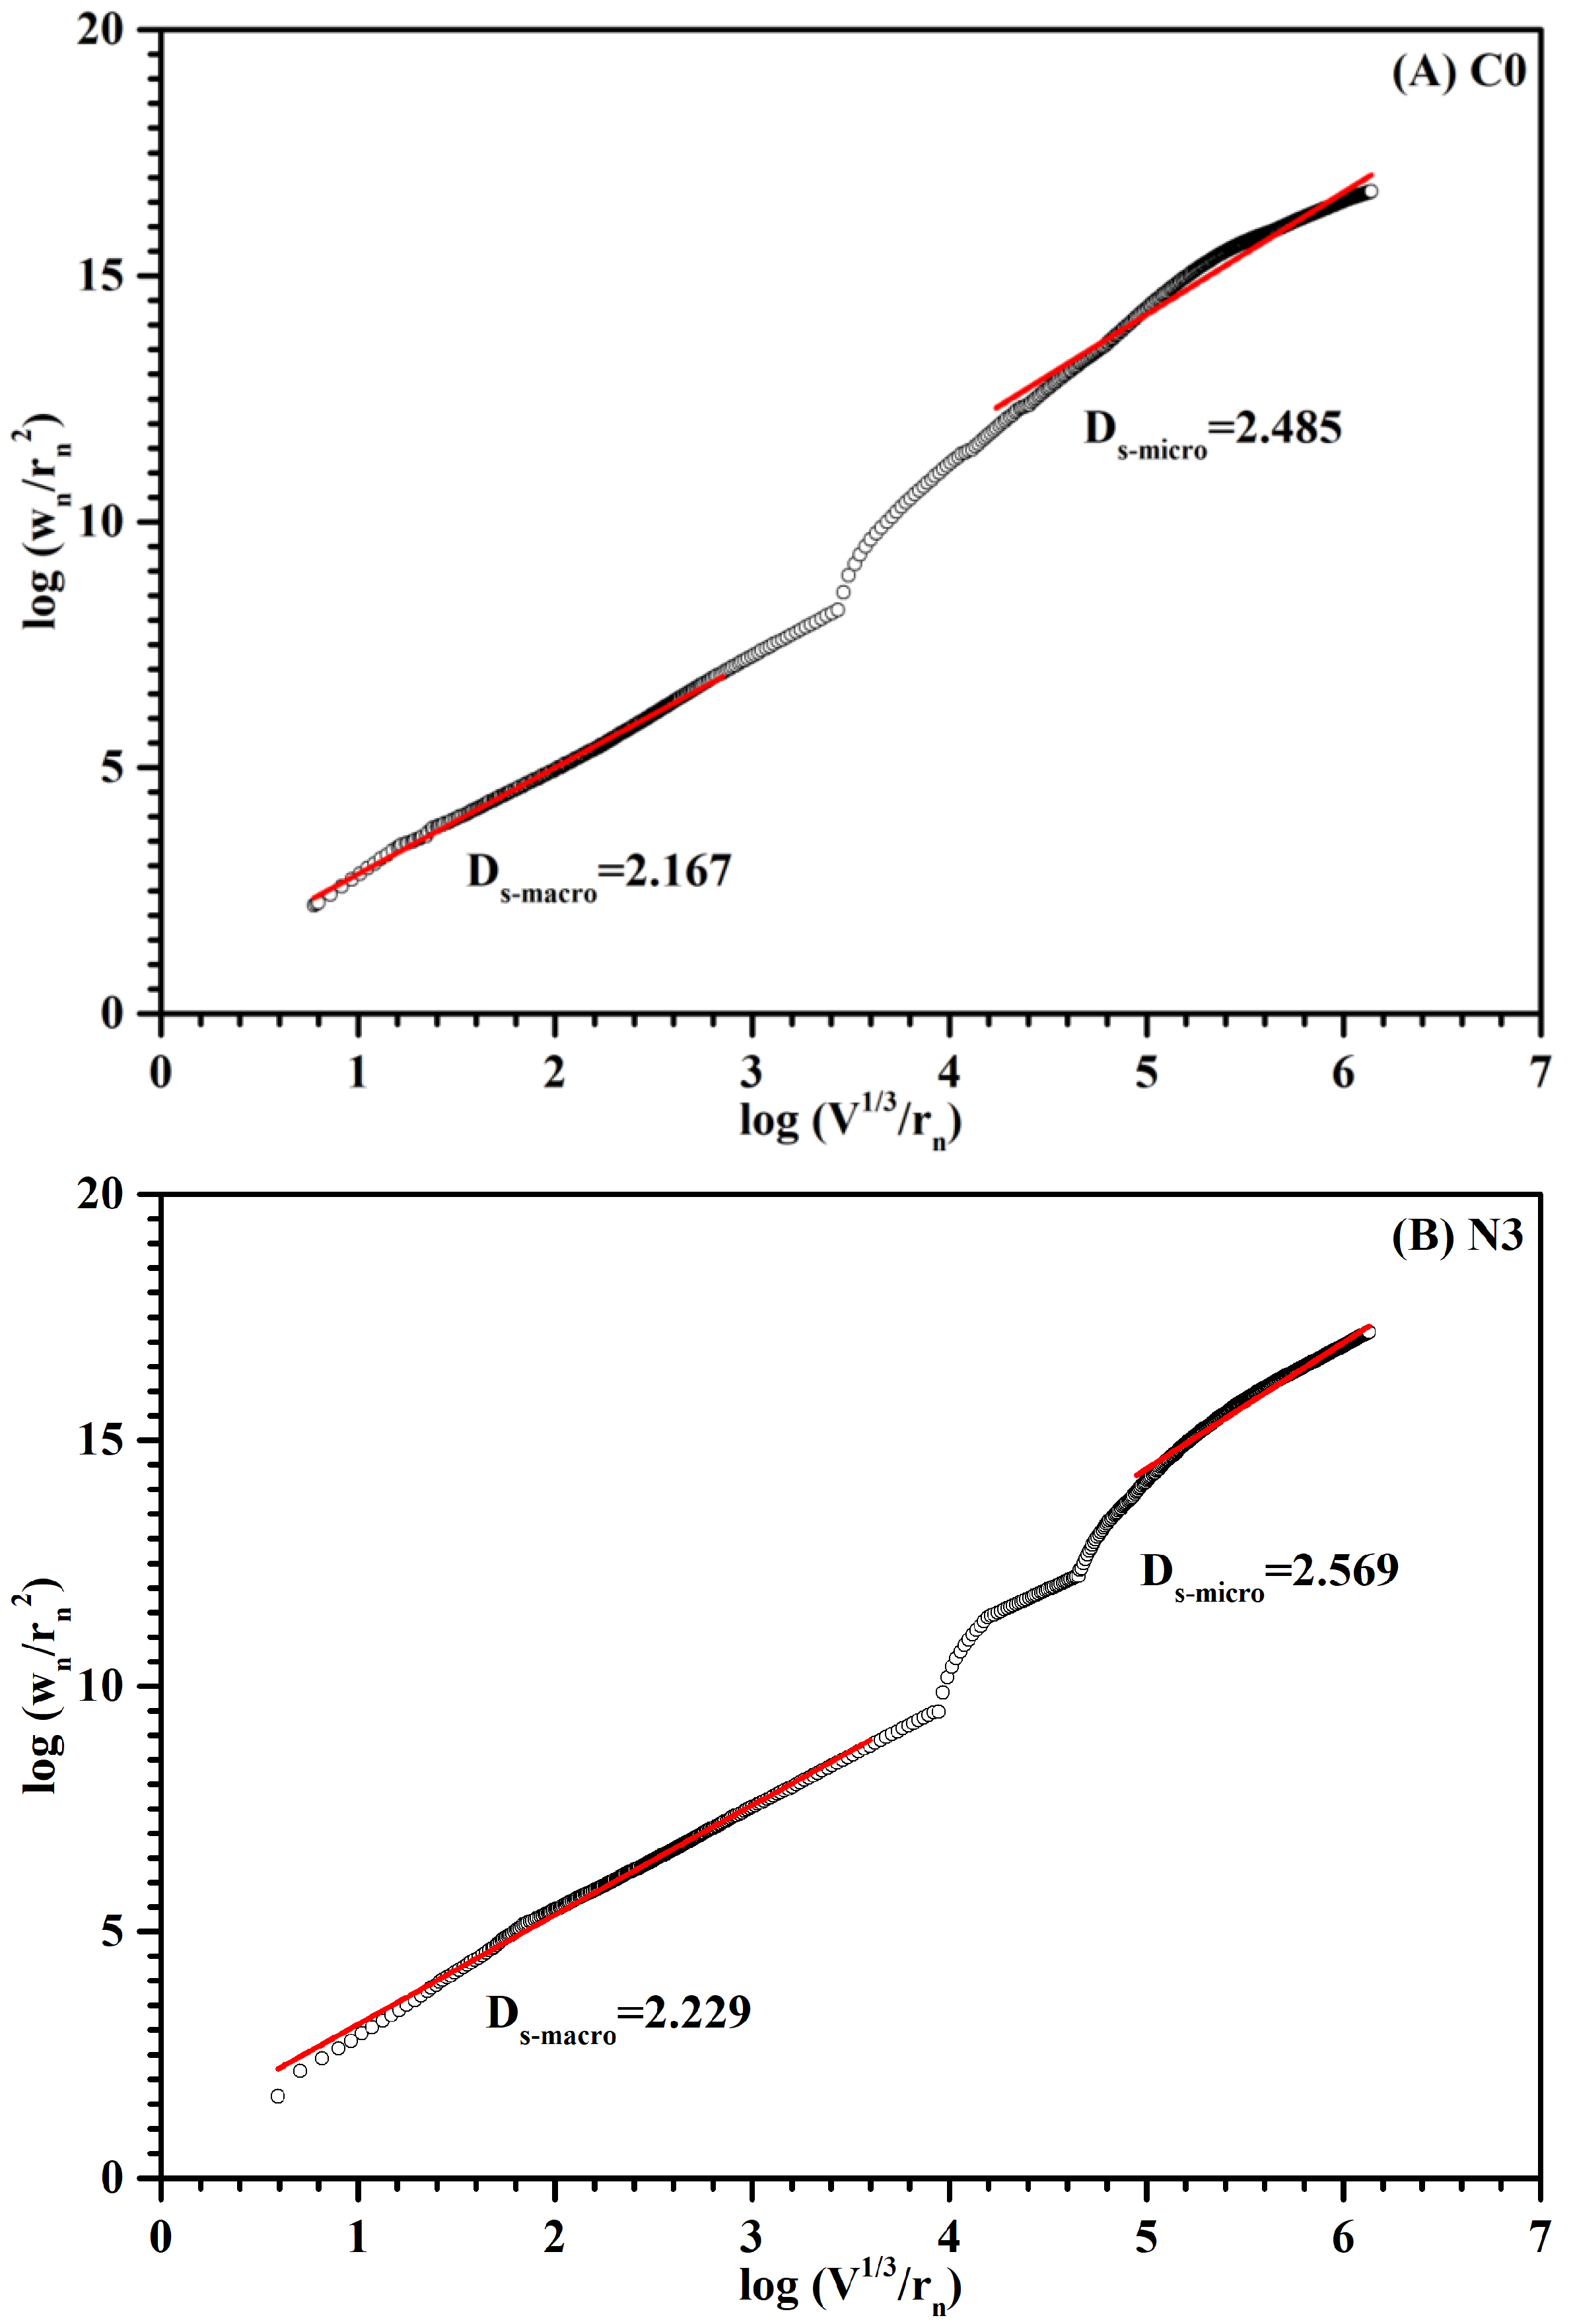
3.3. Pore Structure Analysis
3.4. Analysis of Hydration Process
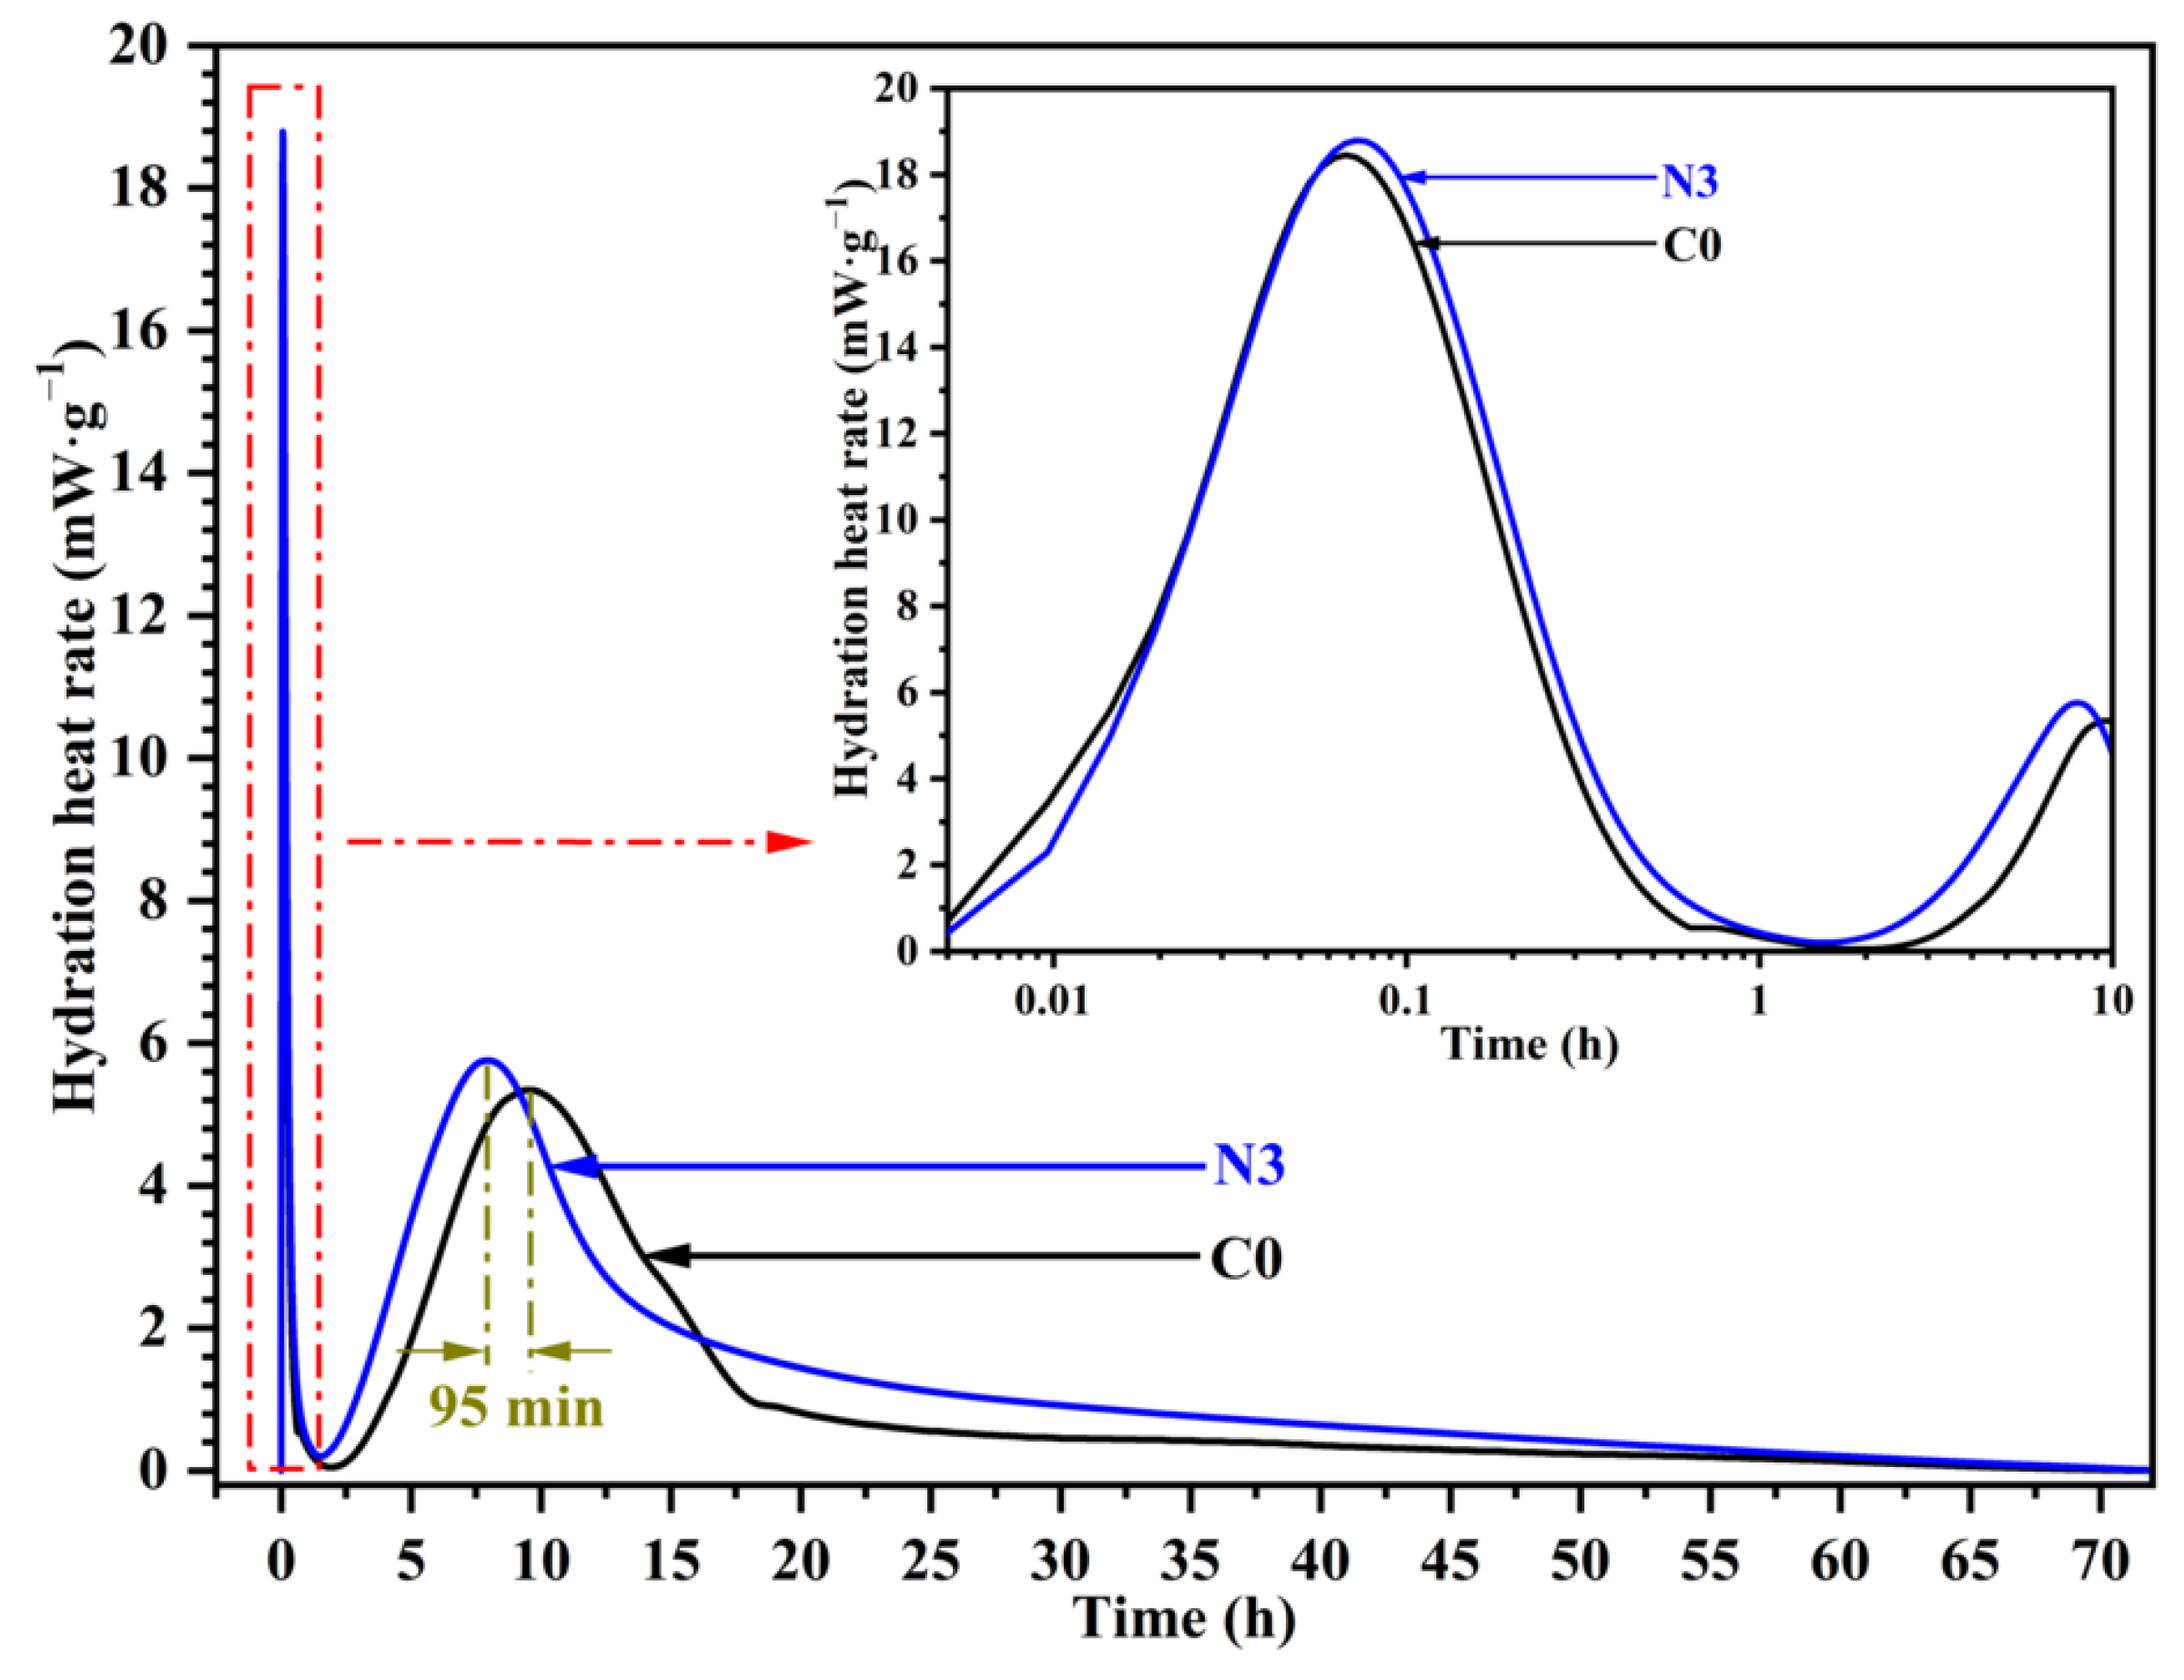
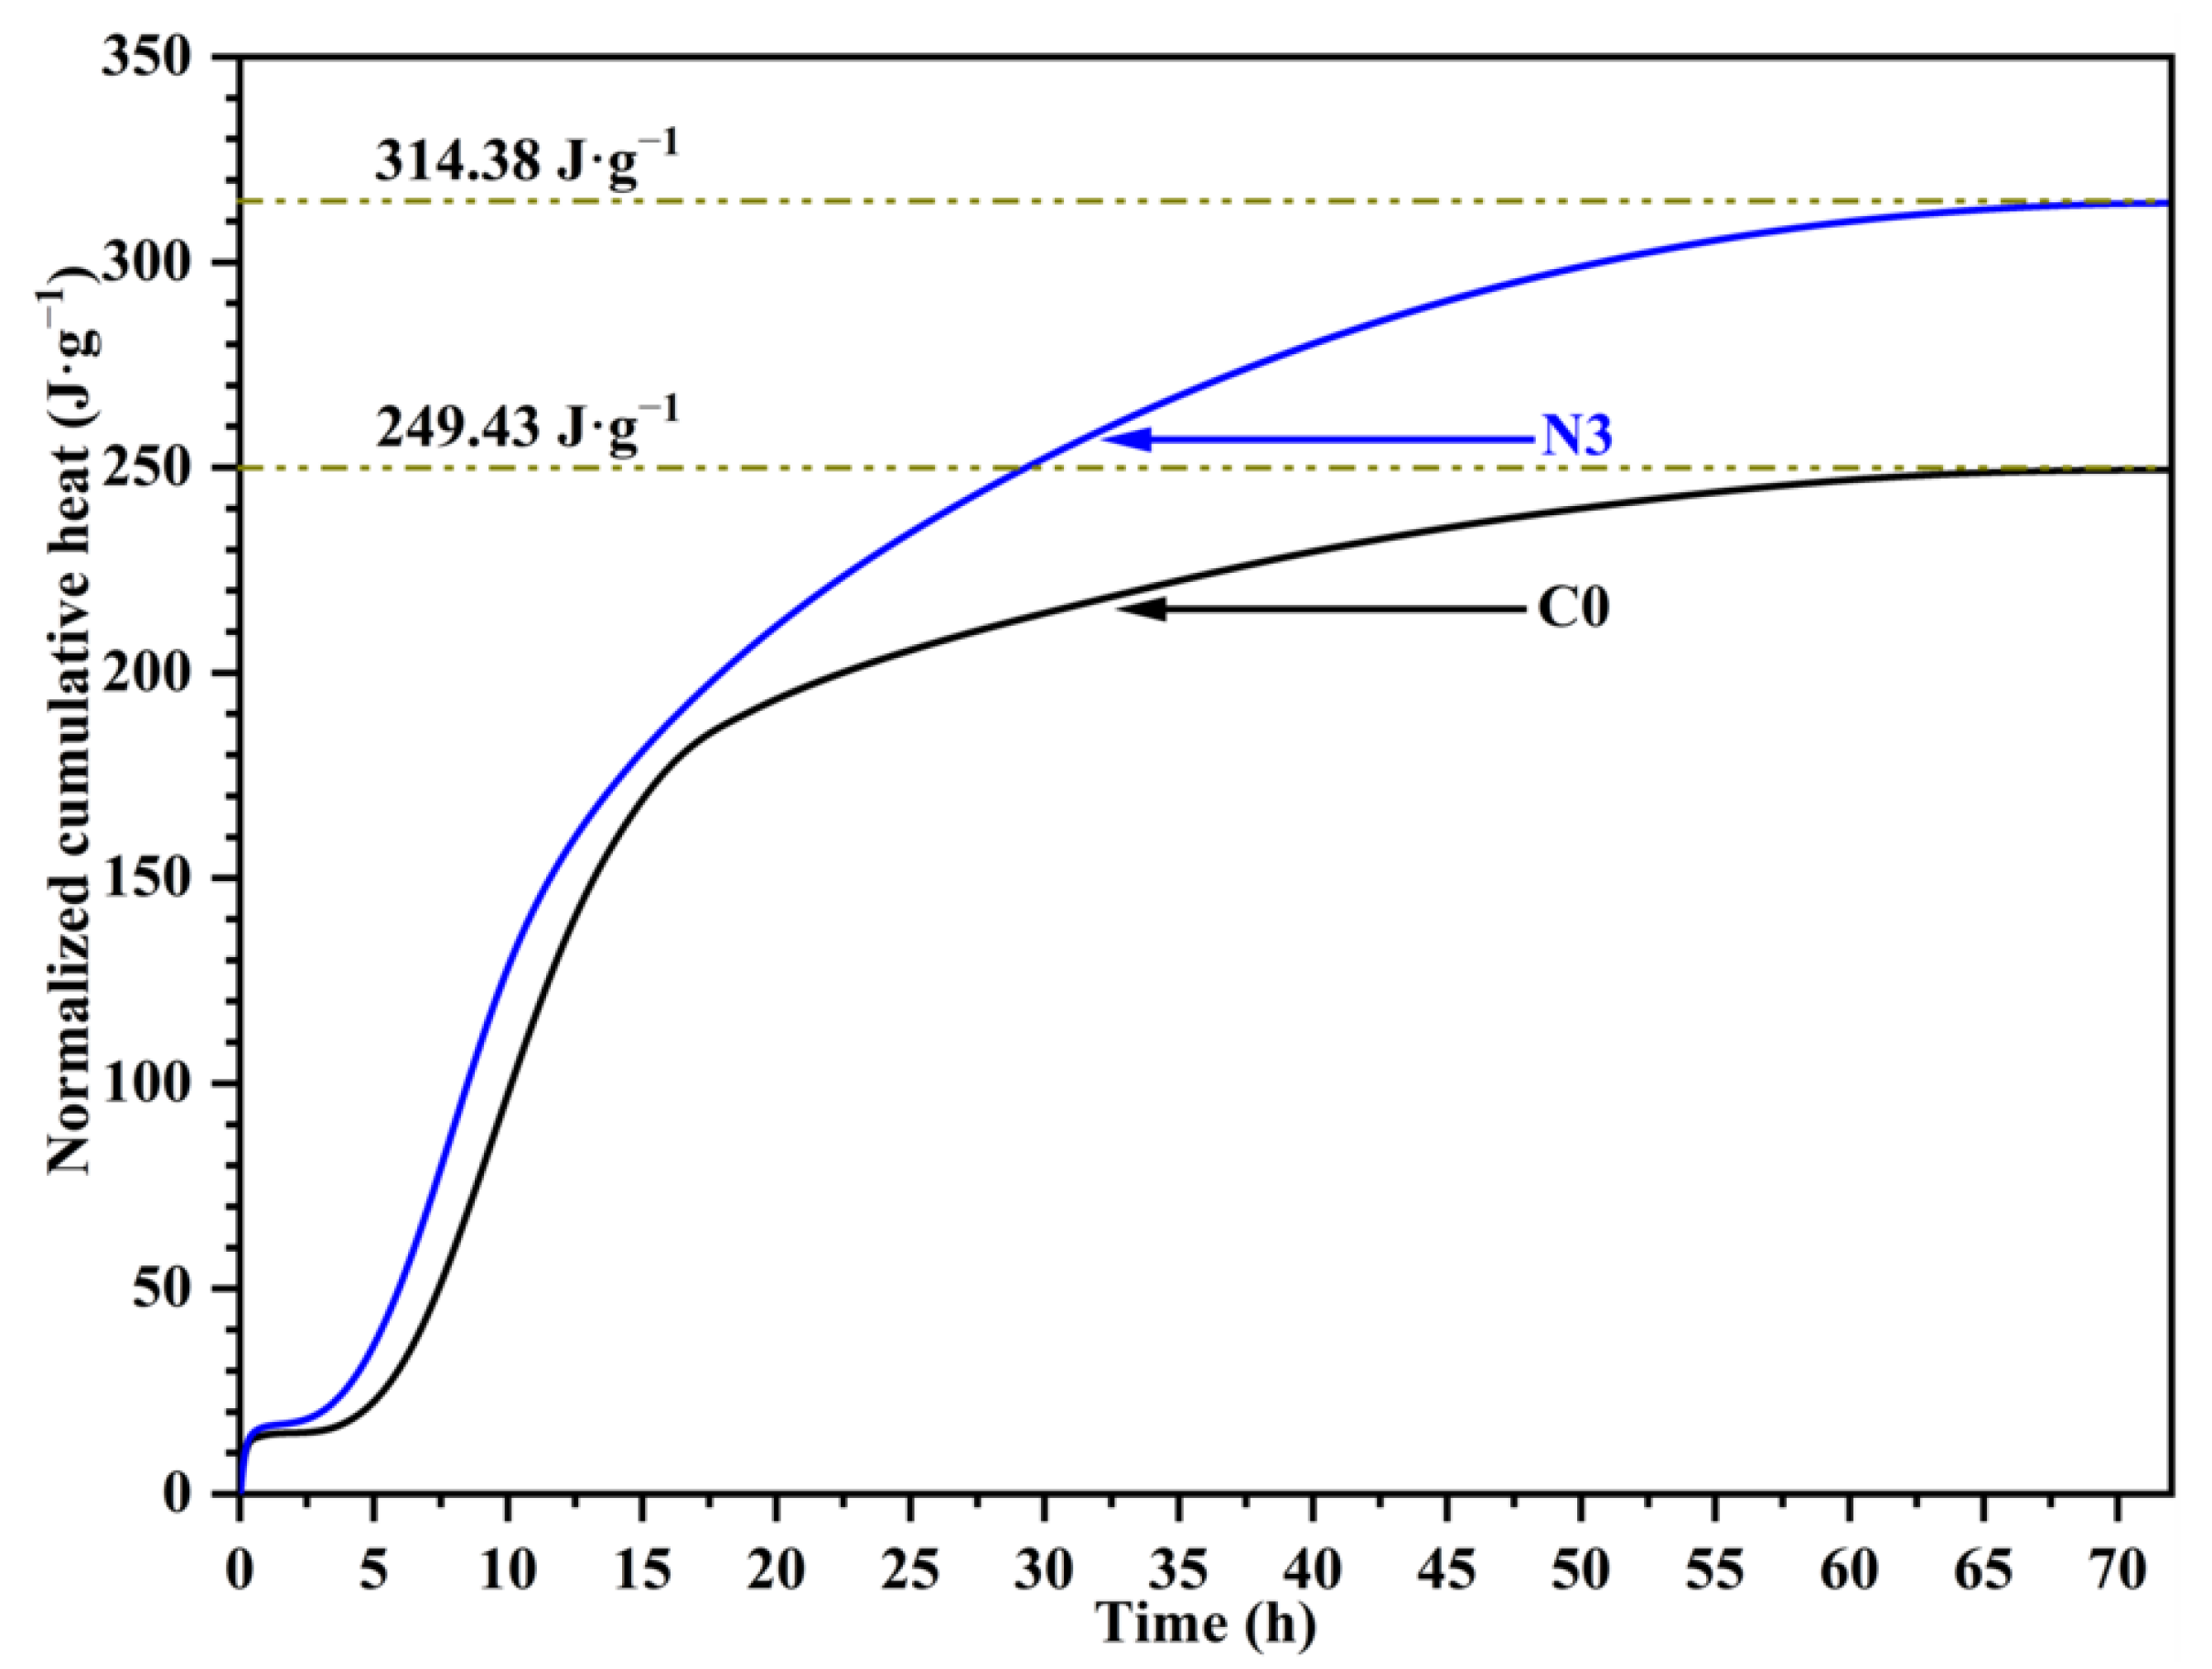
3.4.1. Hydration Heat Evolution
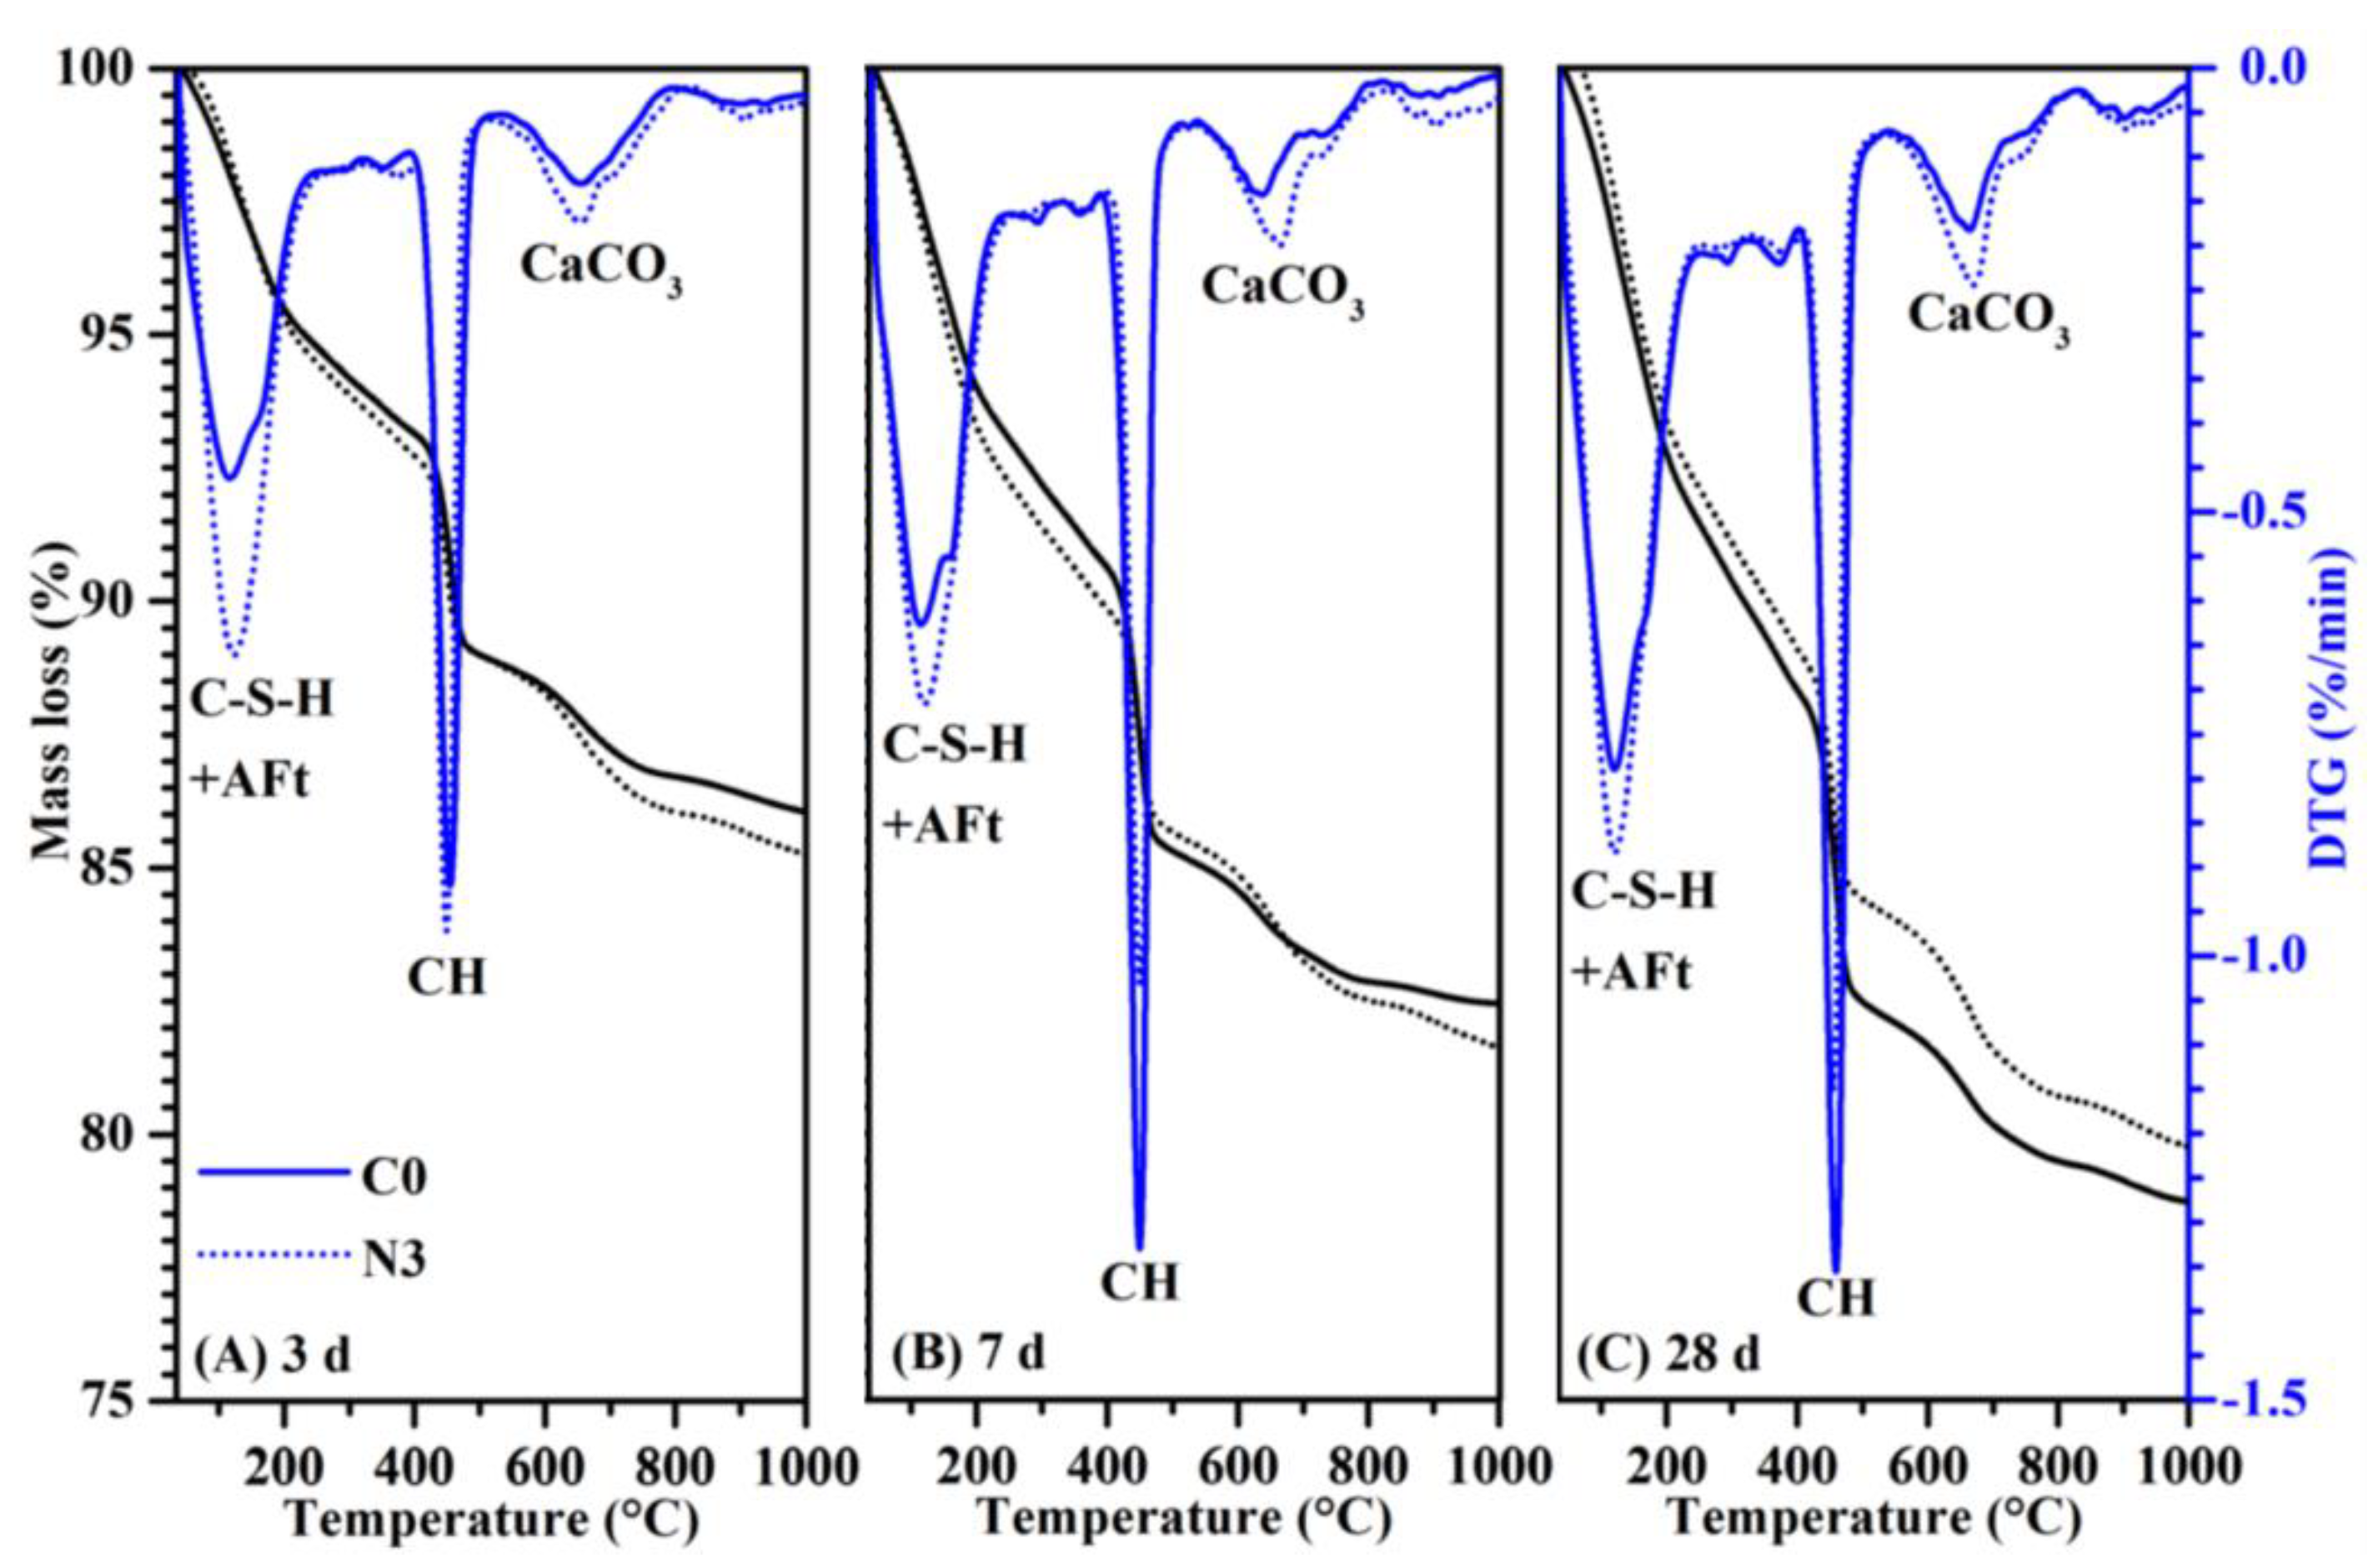
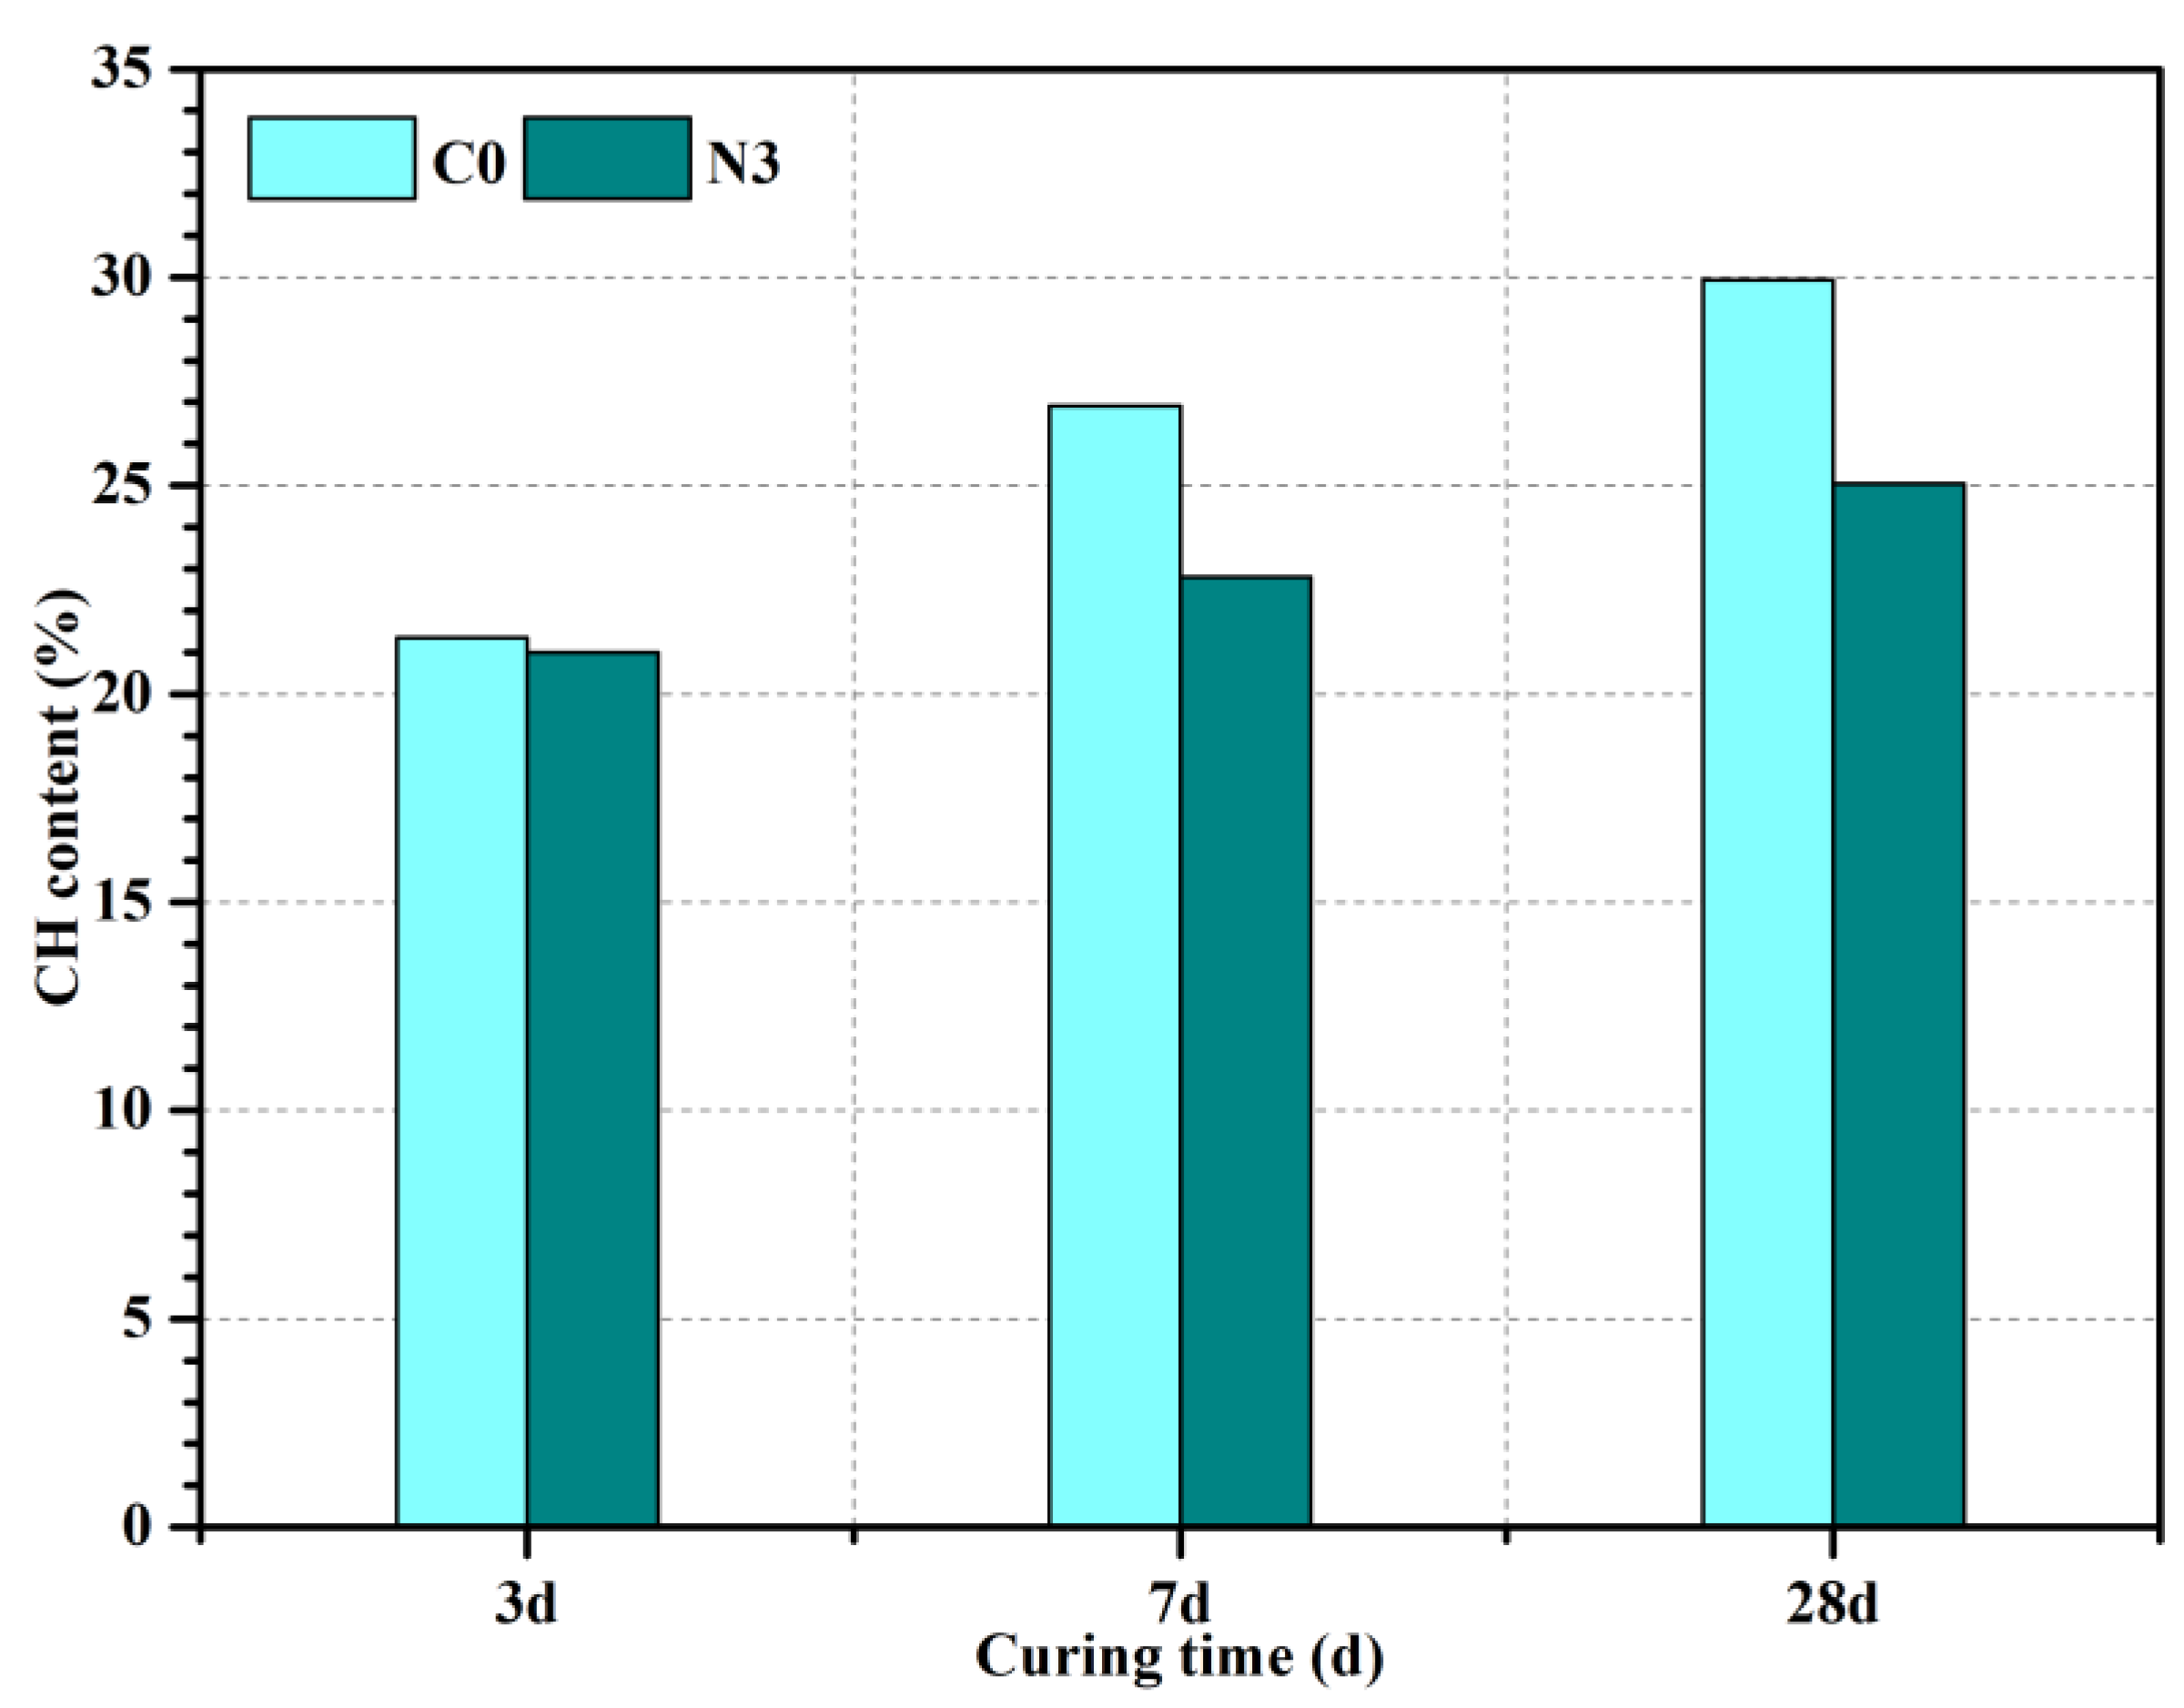
3.4.2. XRD and Thermal Analysis
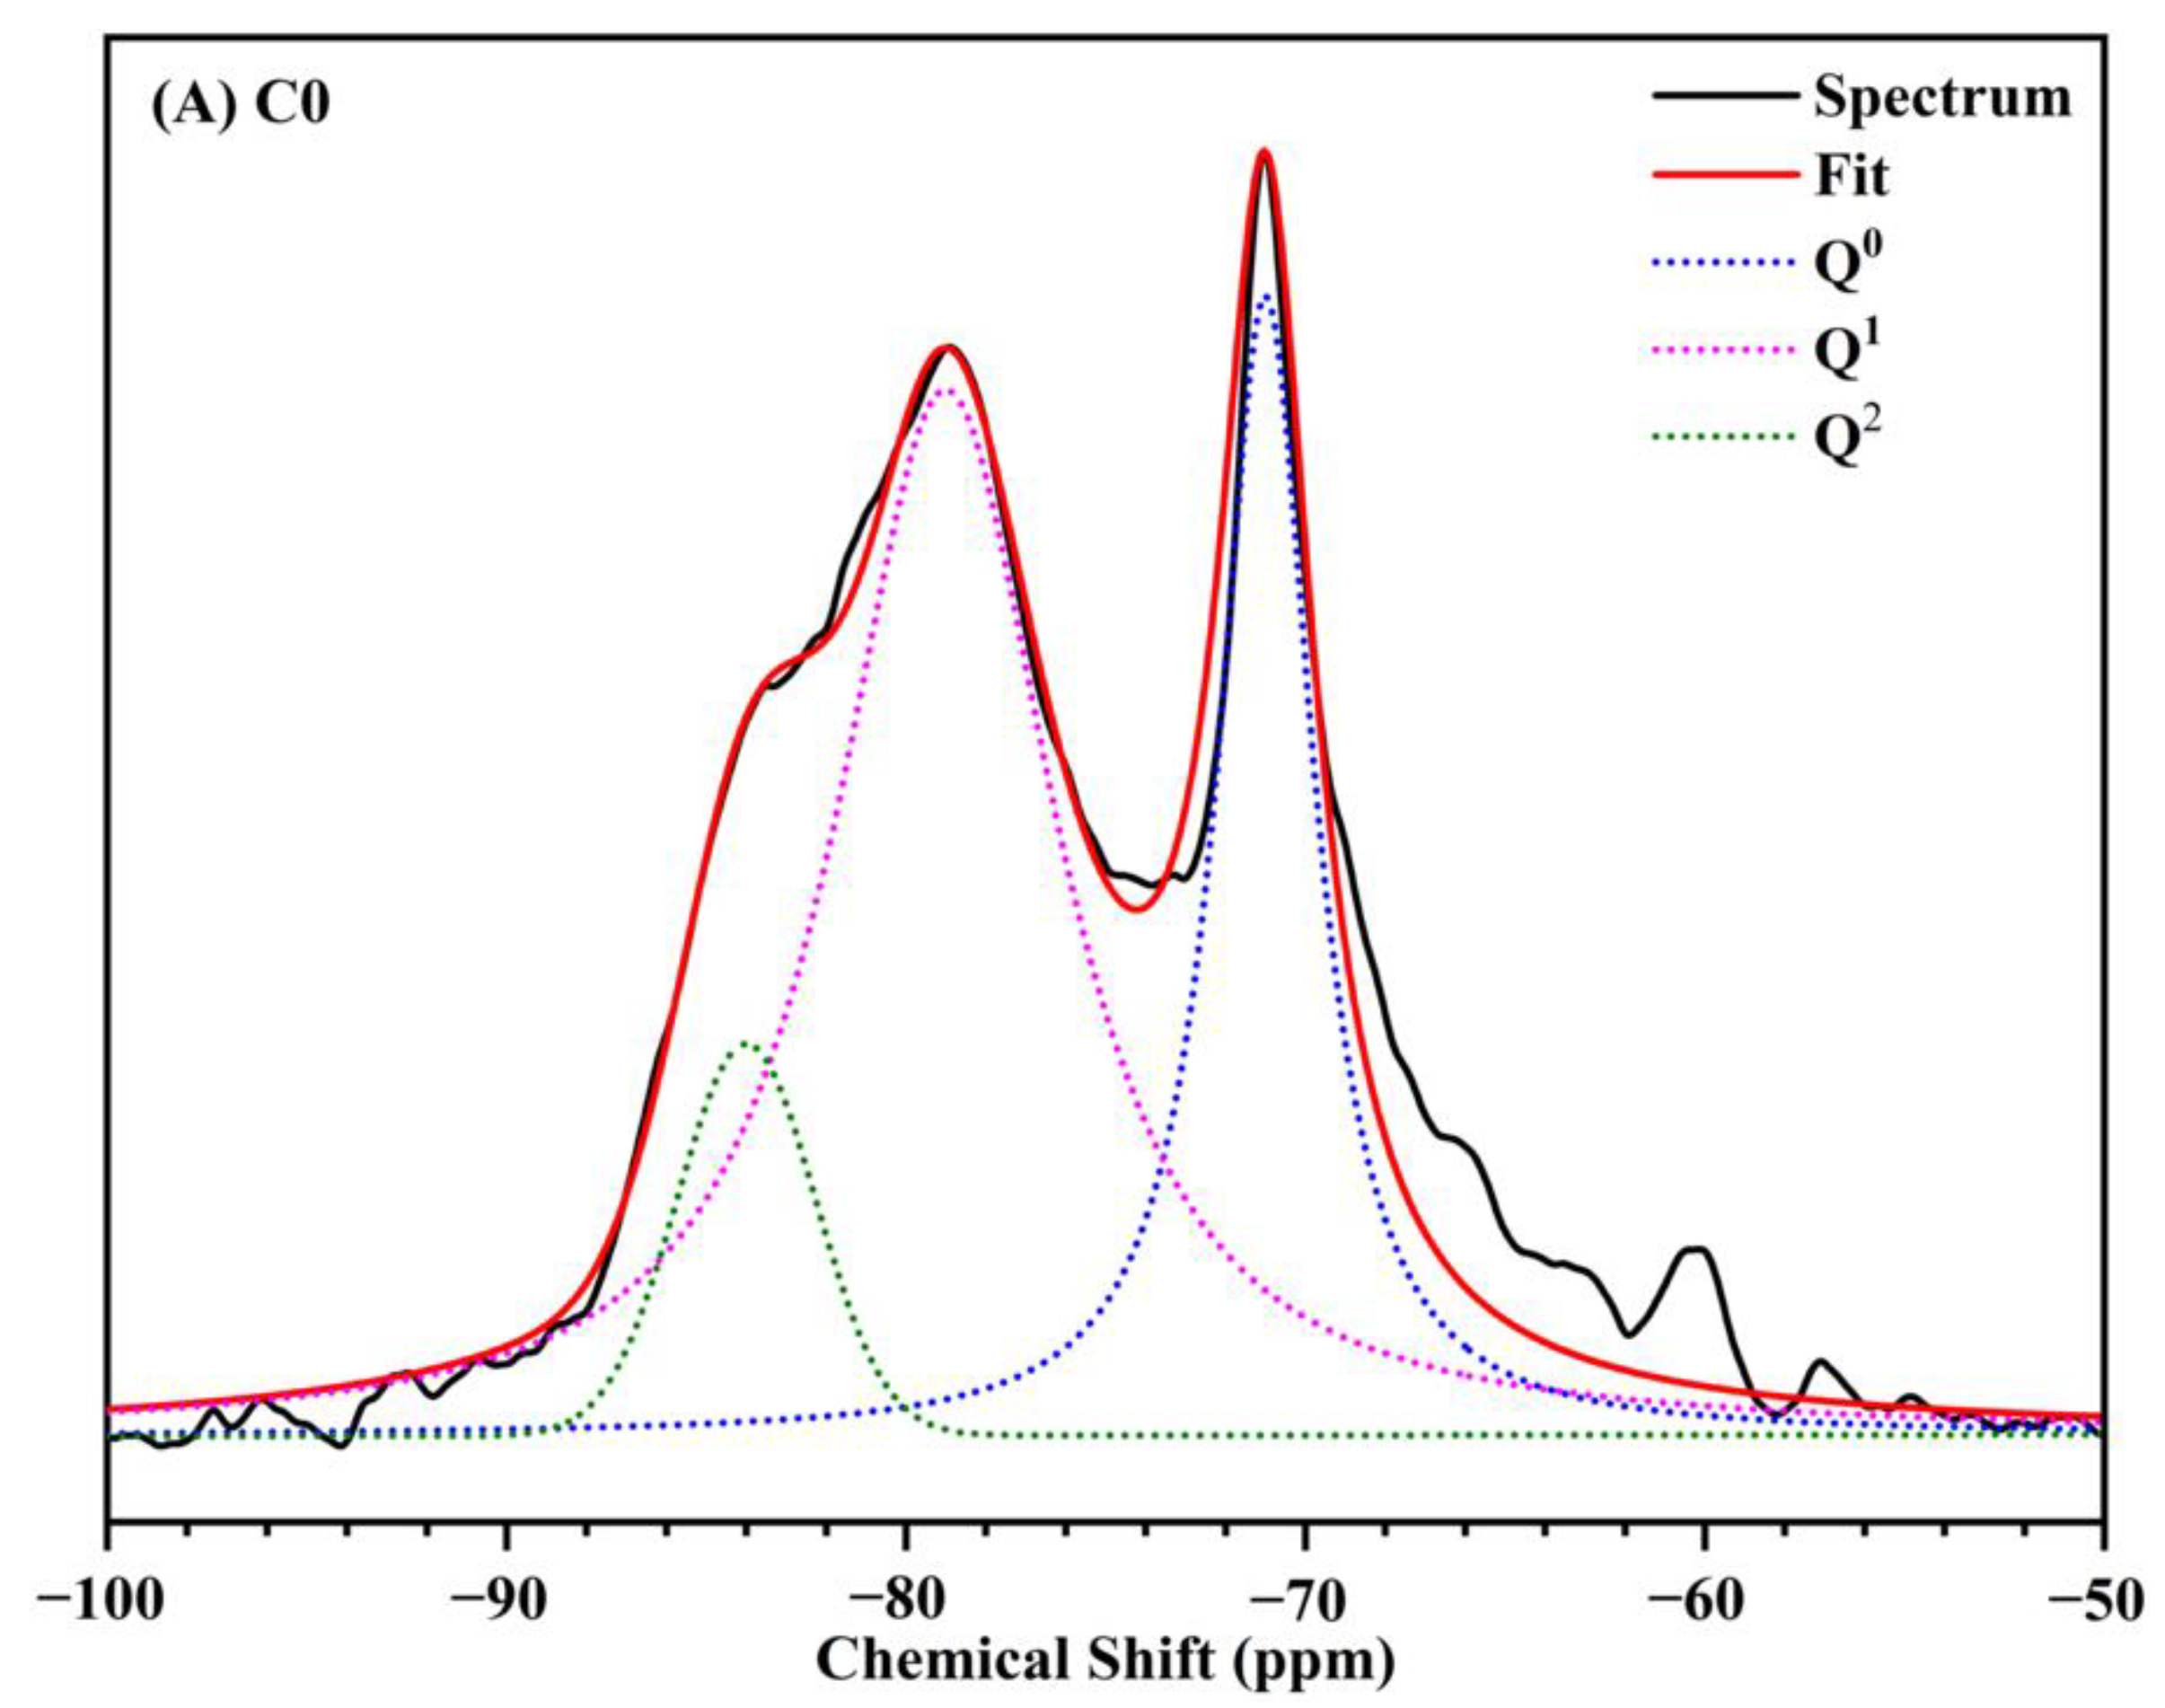
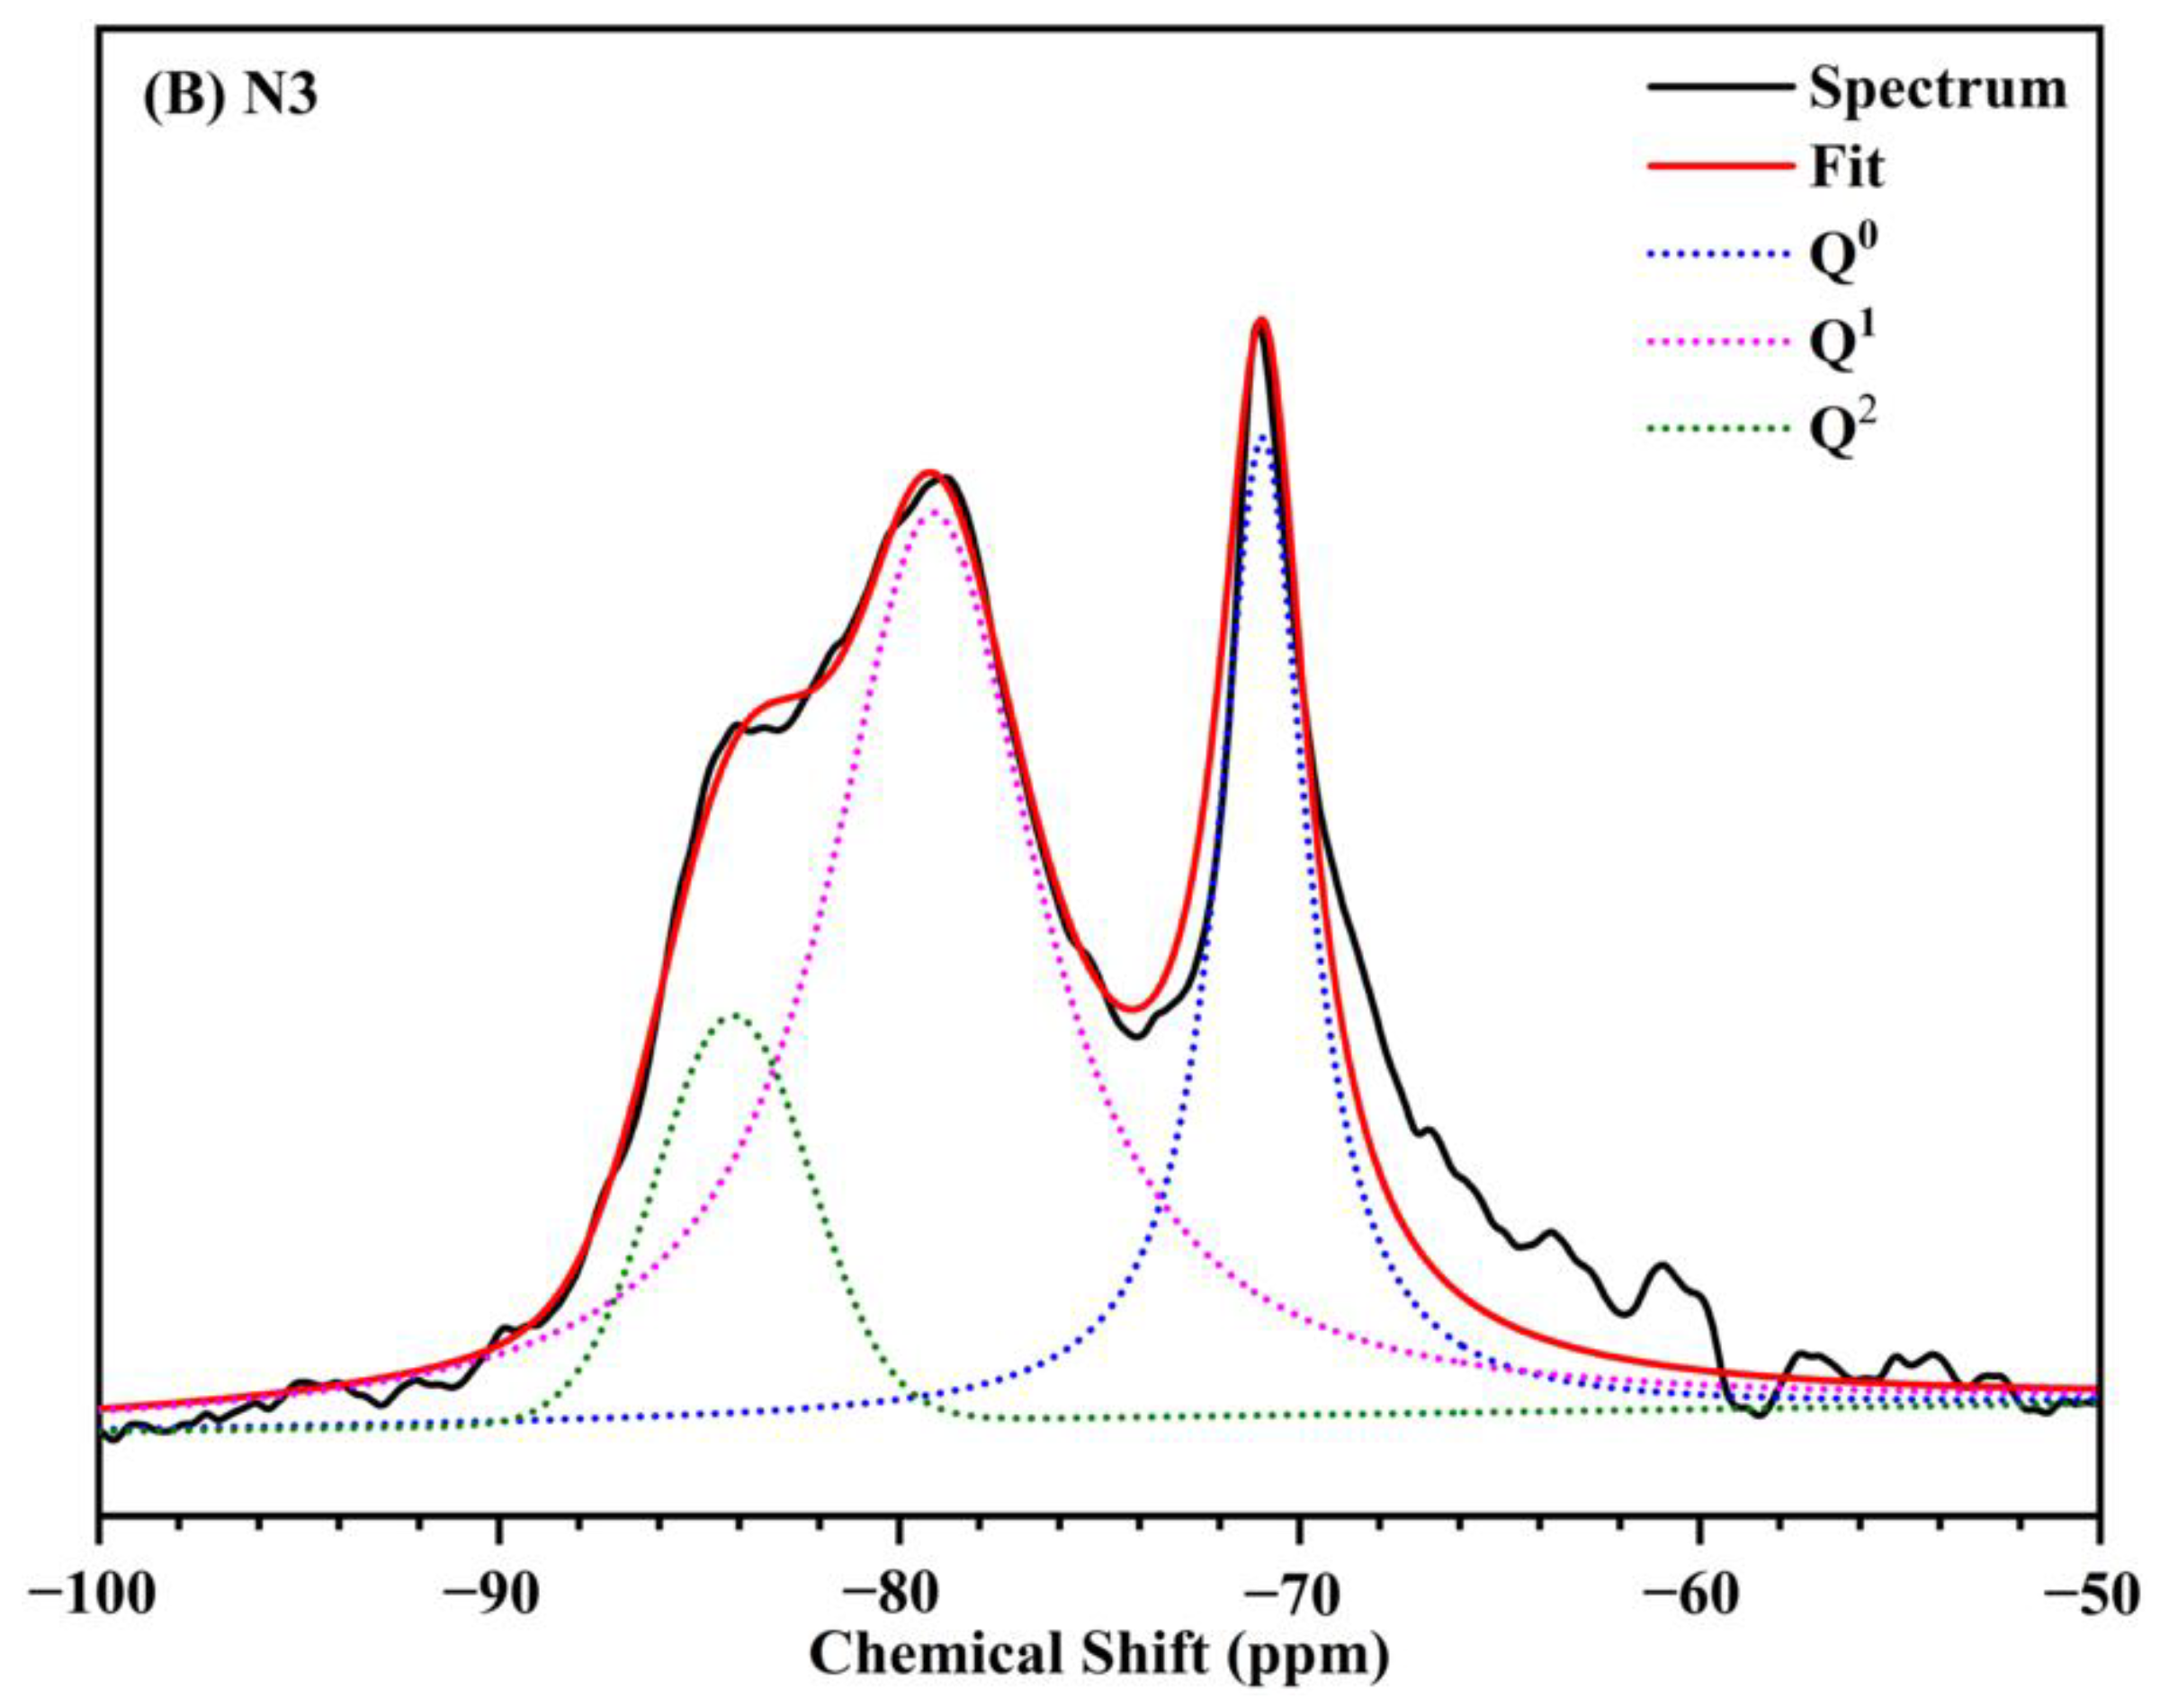
3.4.3. 29Si MAS-NMR Analysis
3.5. Microstructure Analysis
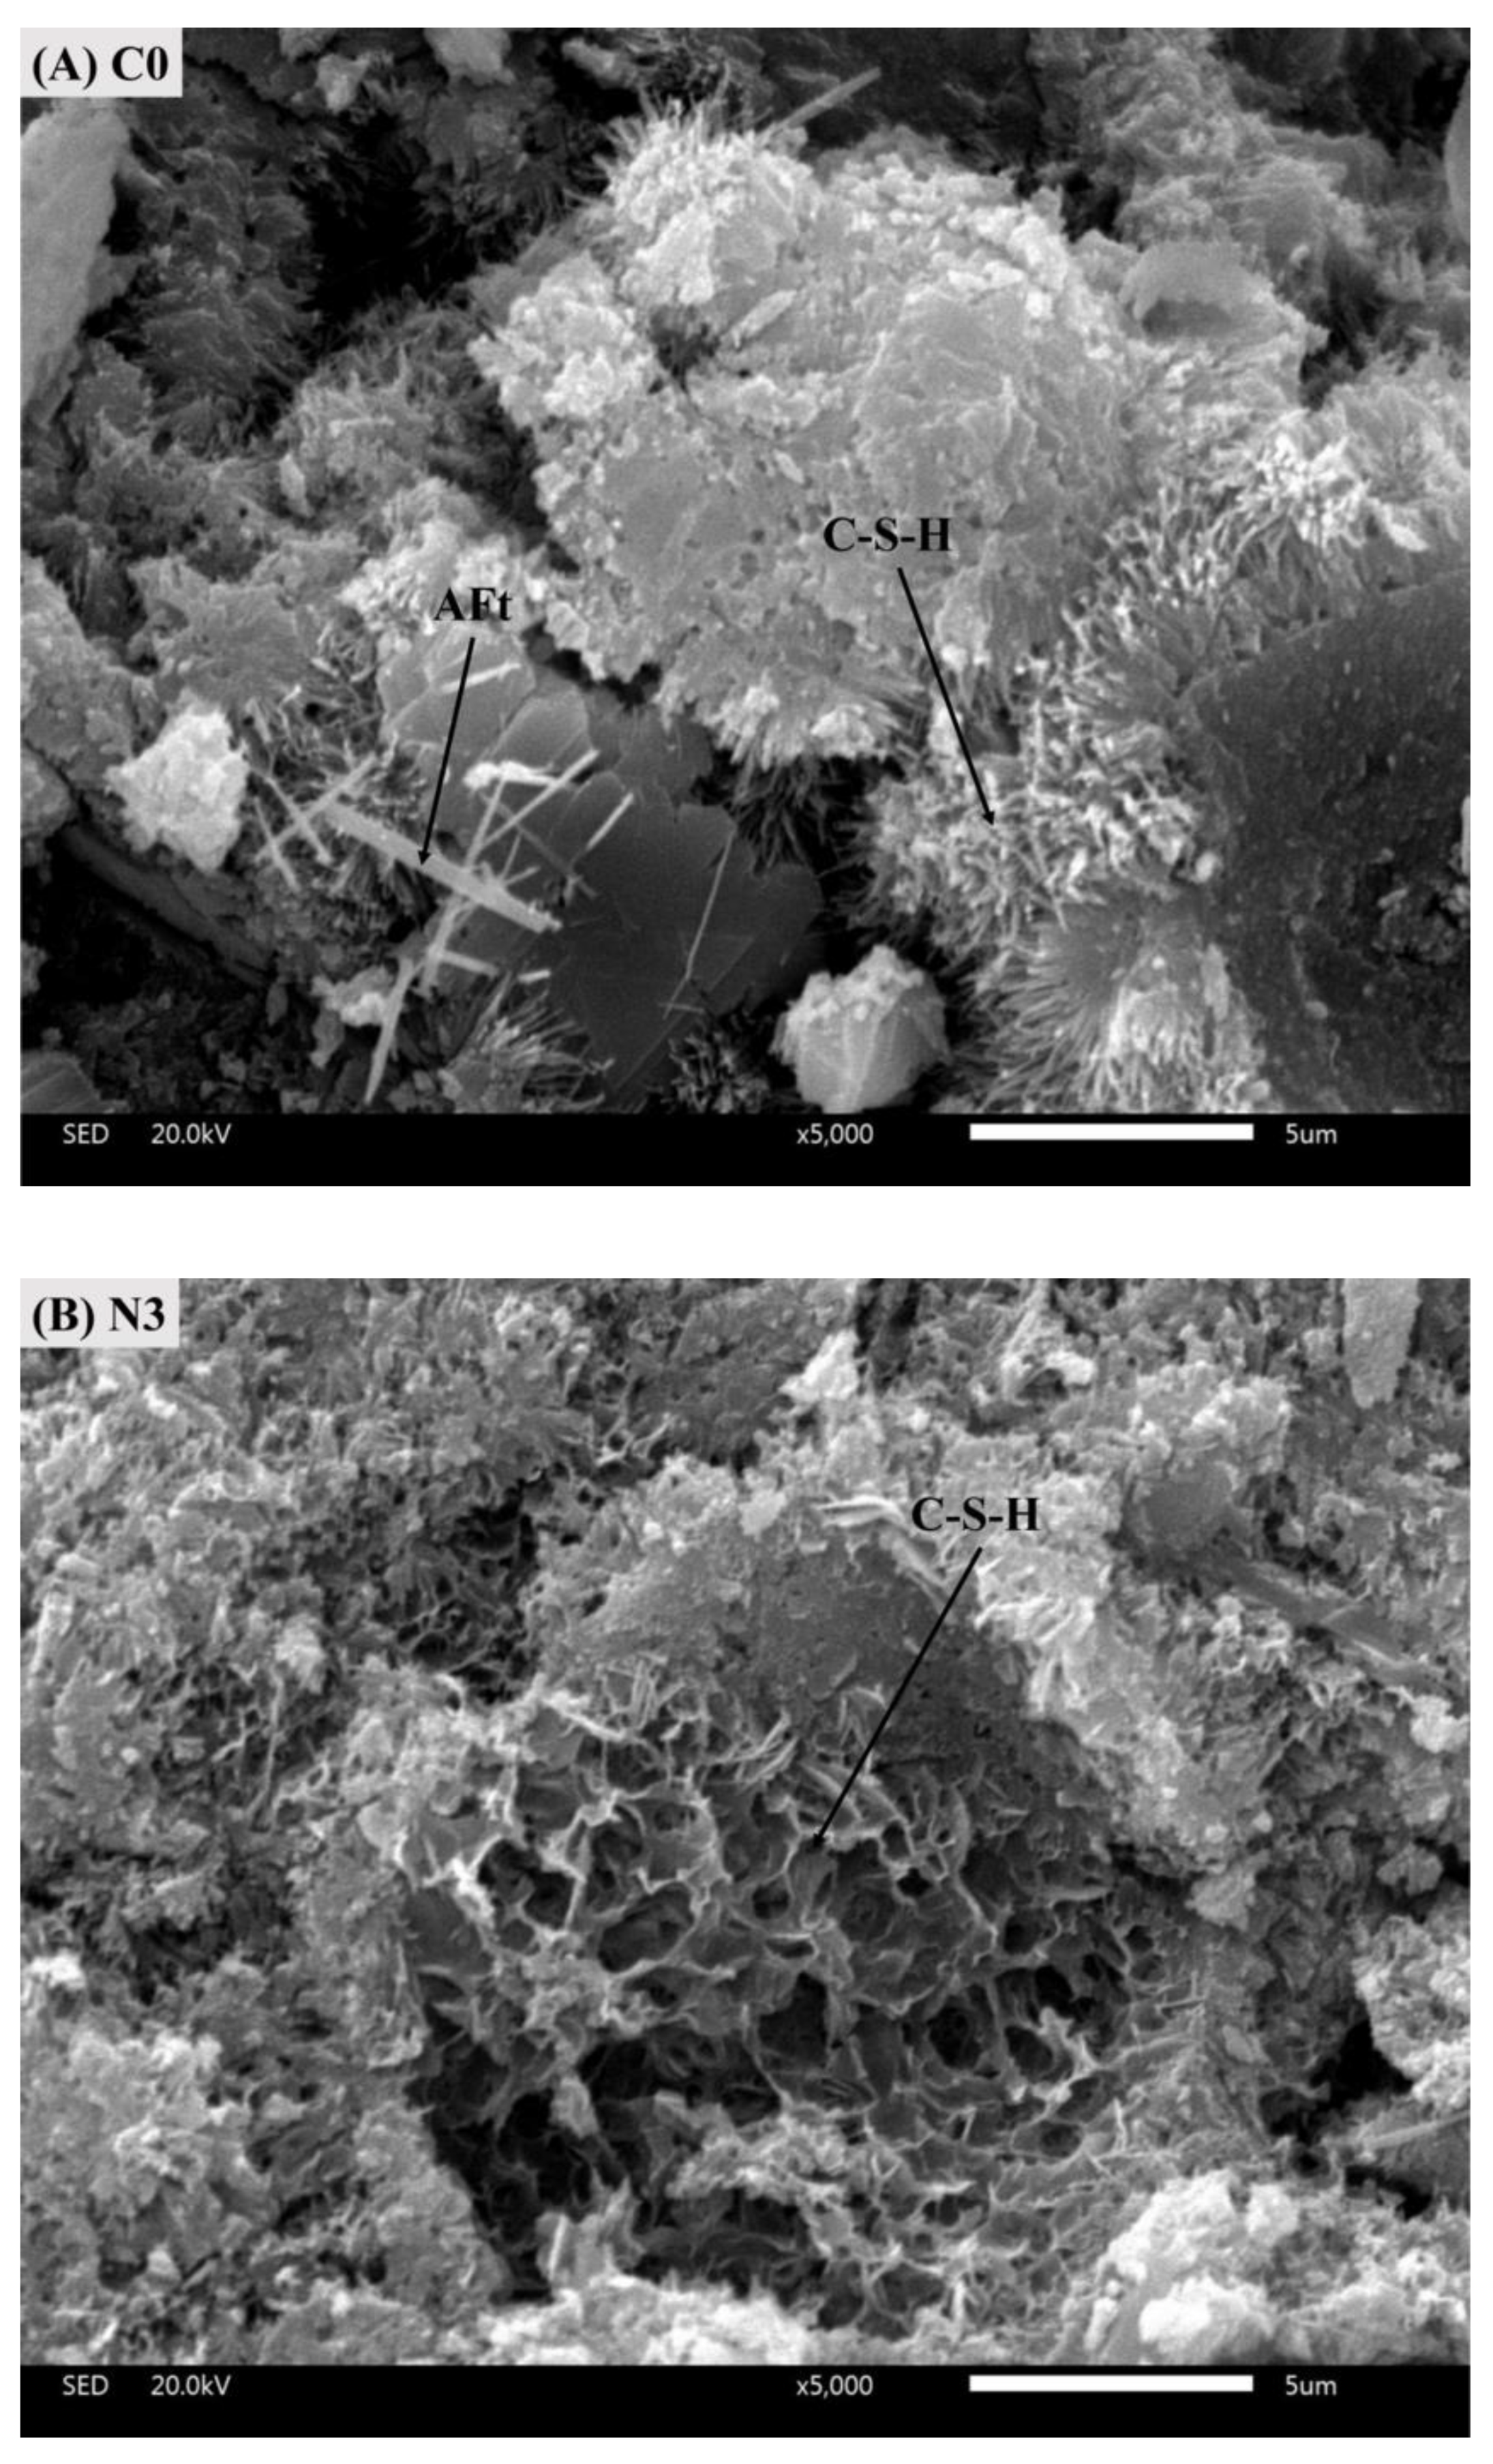
3.5.1. Microscopic Morphology
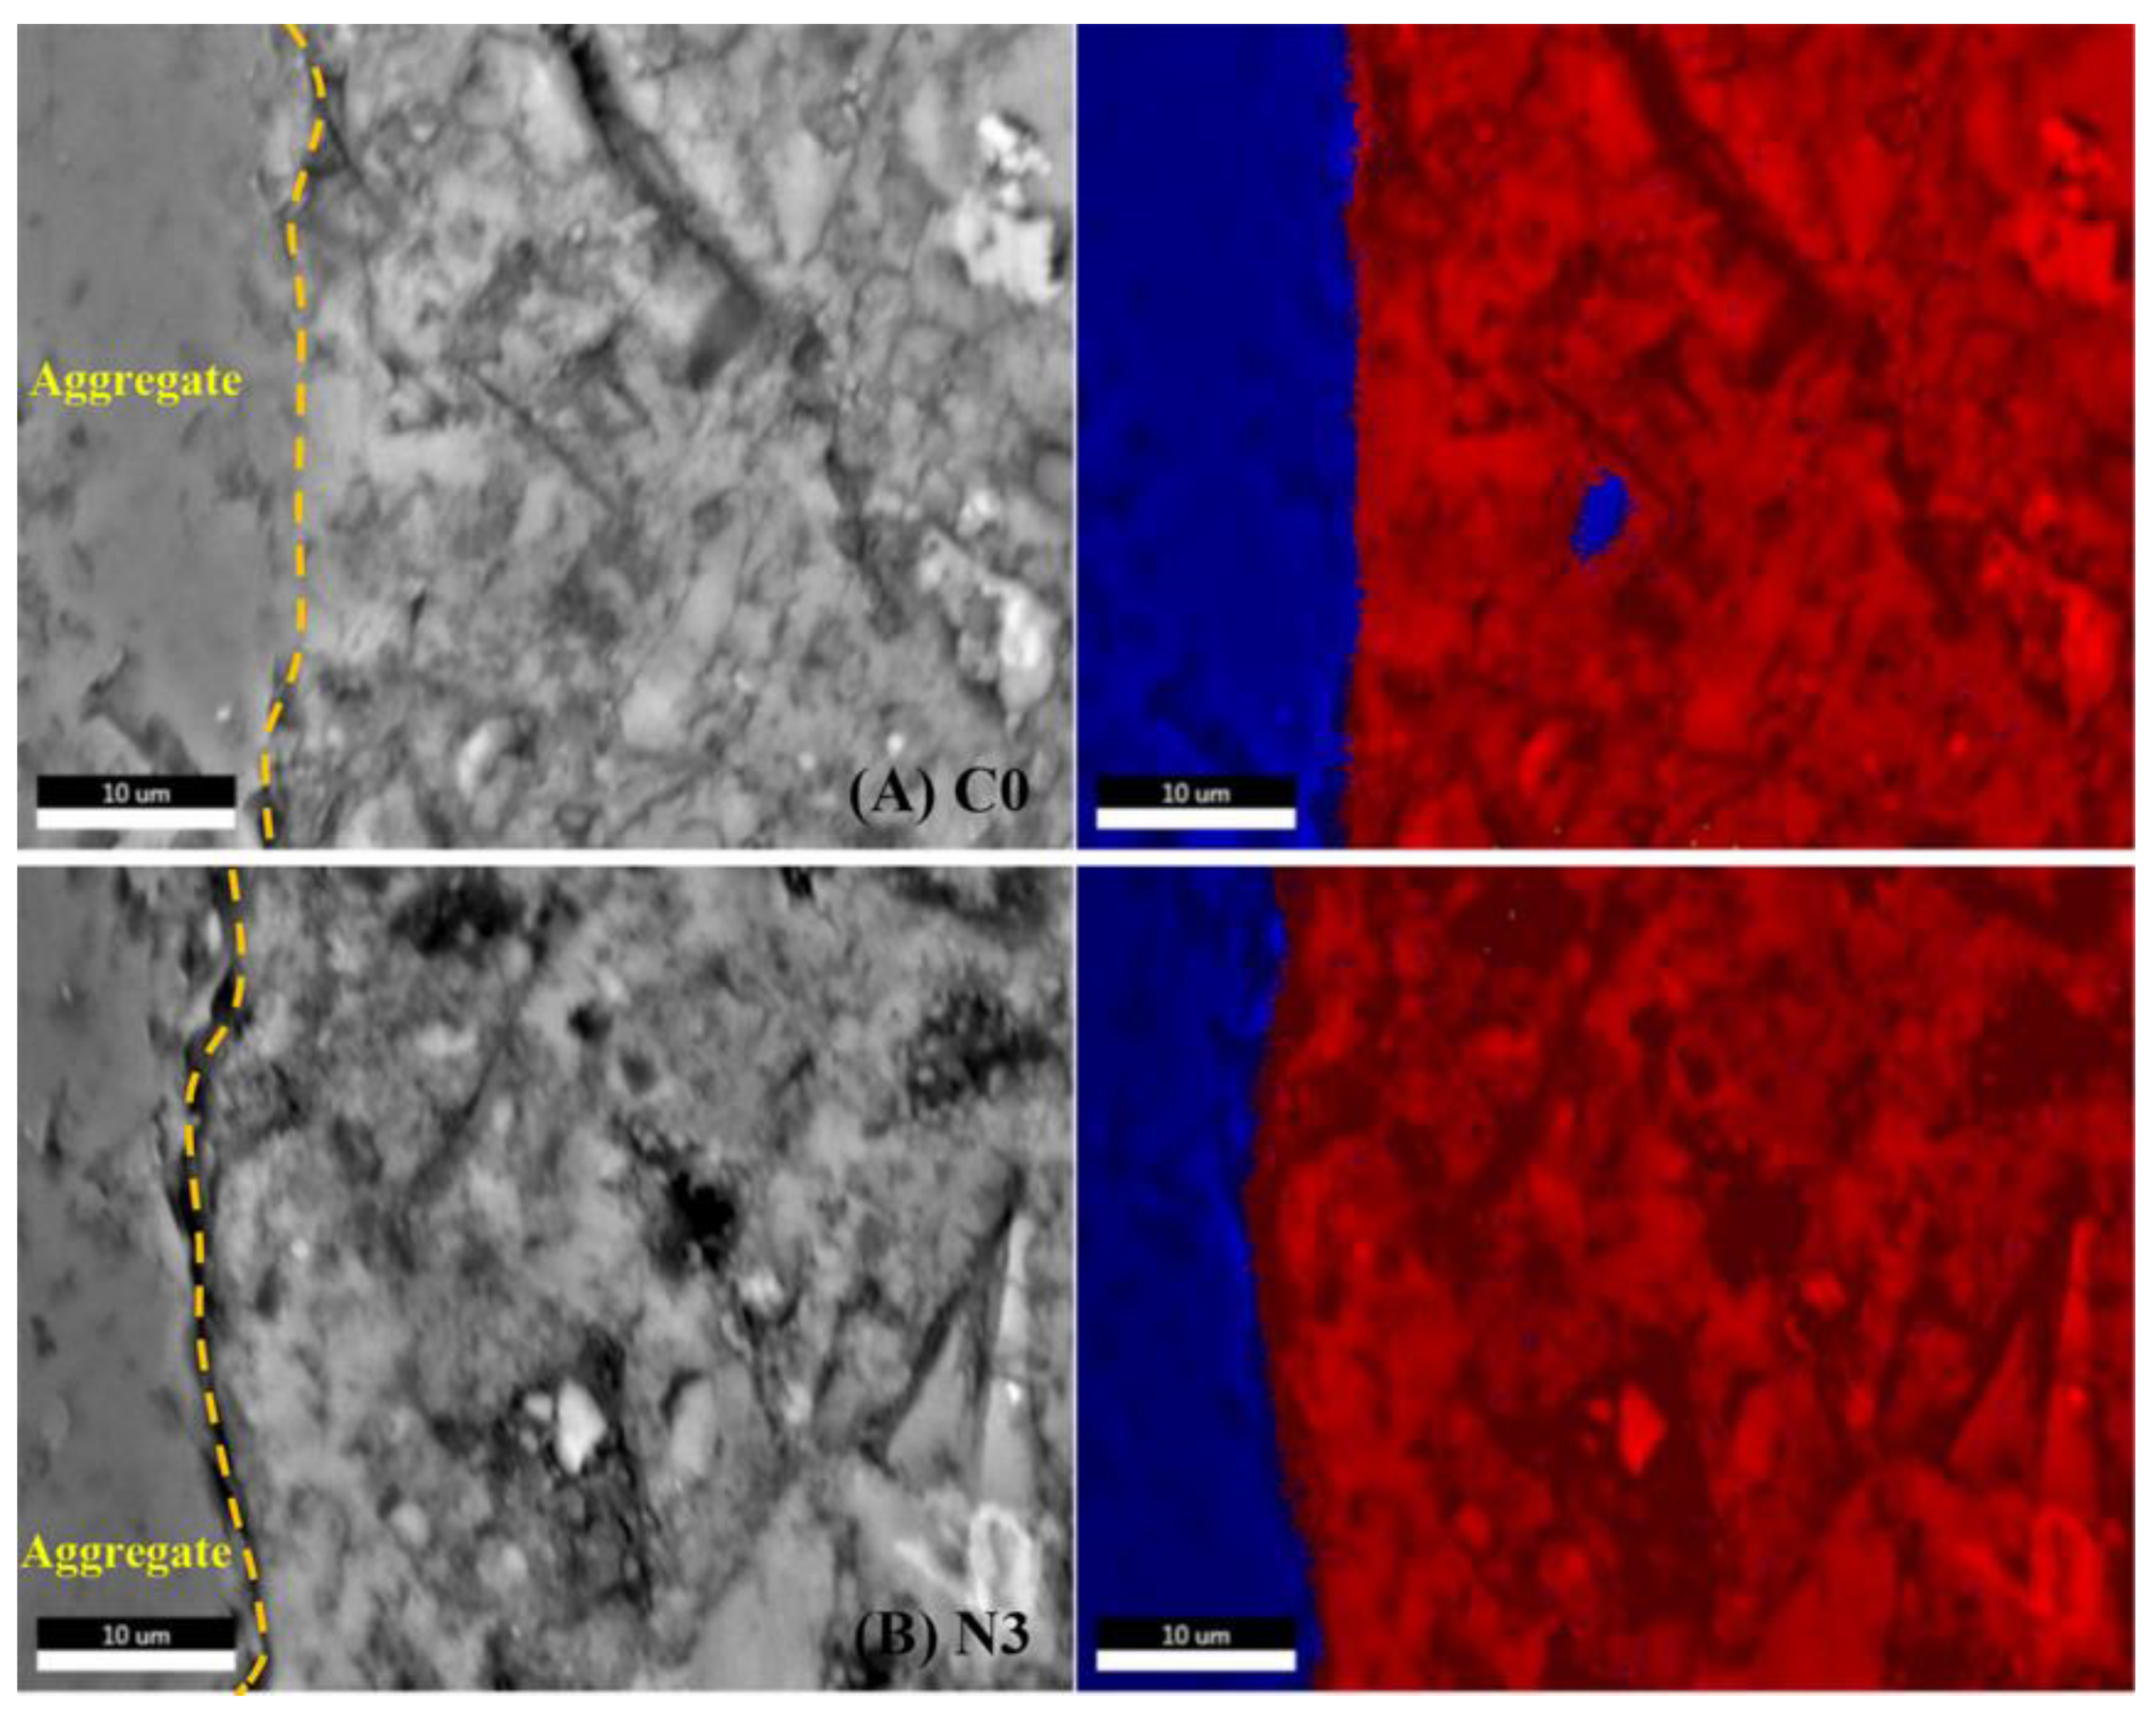
3.5.2. ITZ Analysis
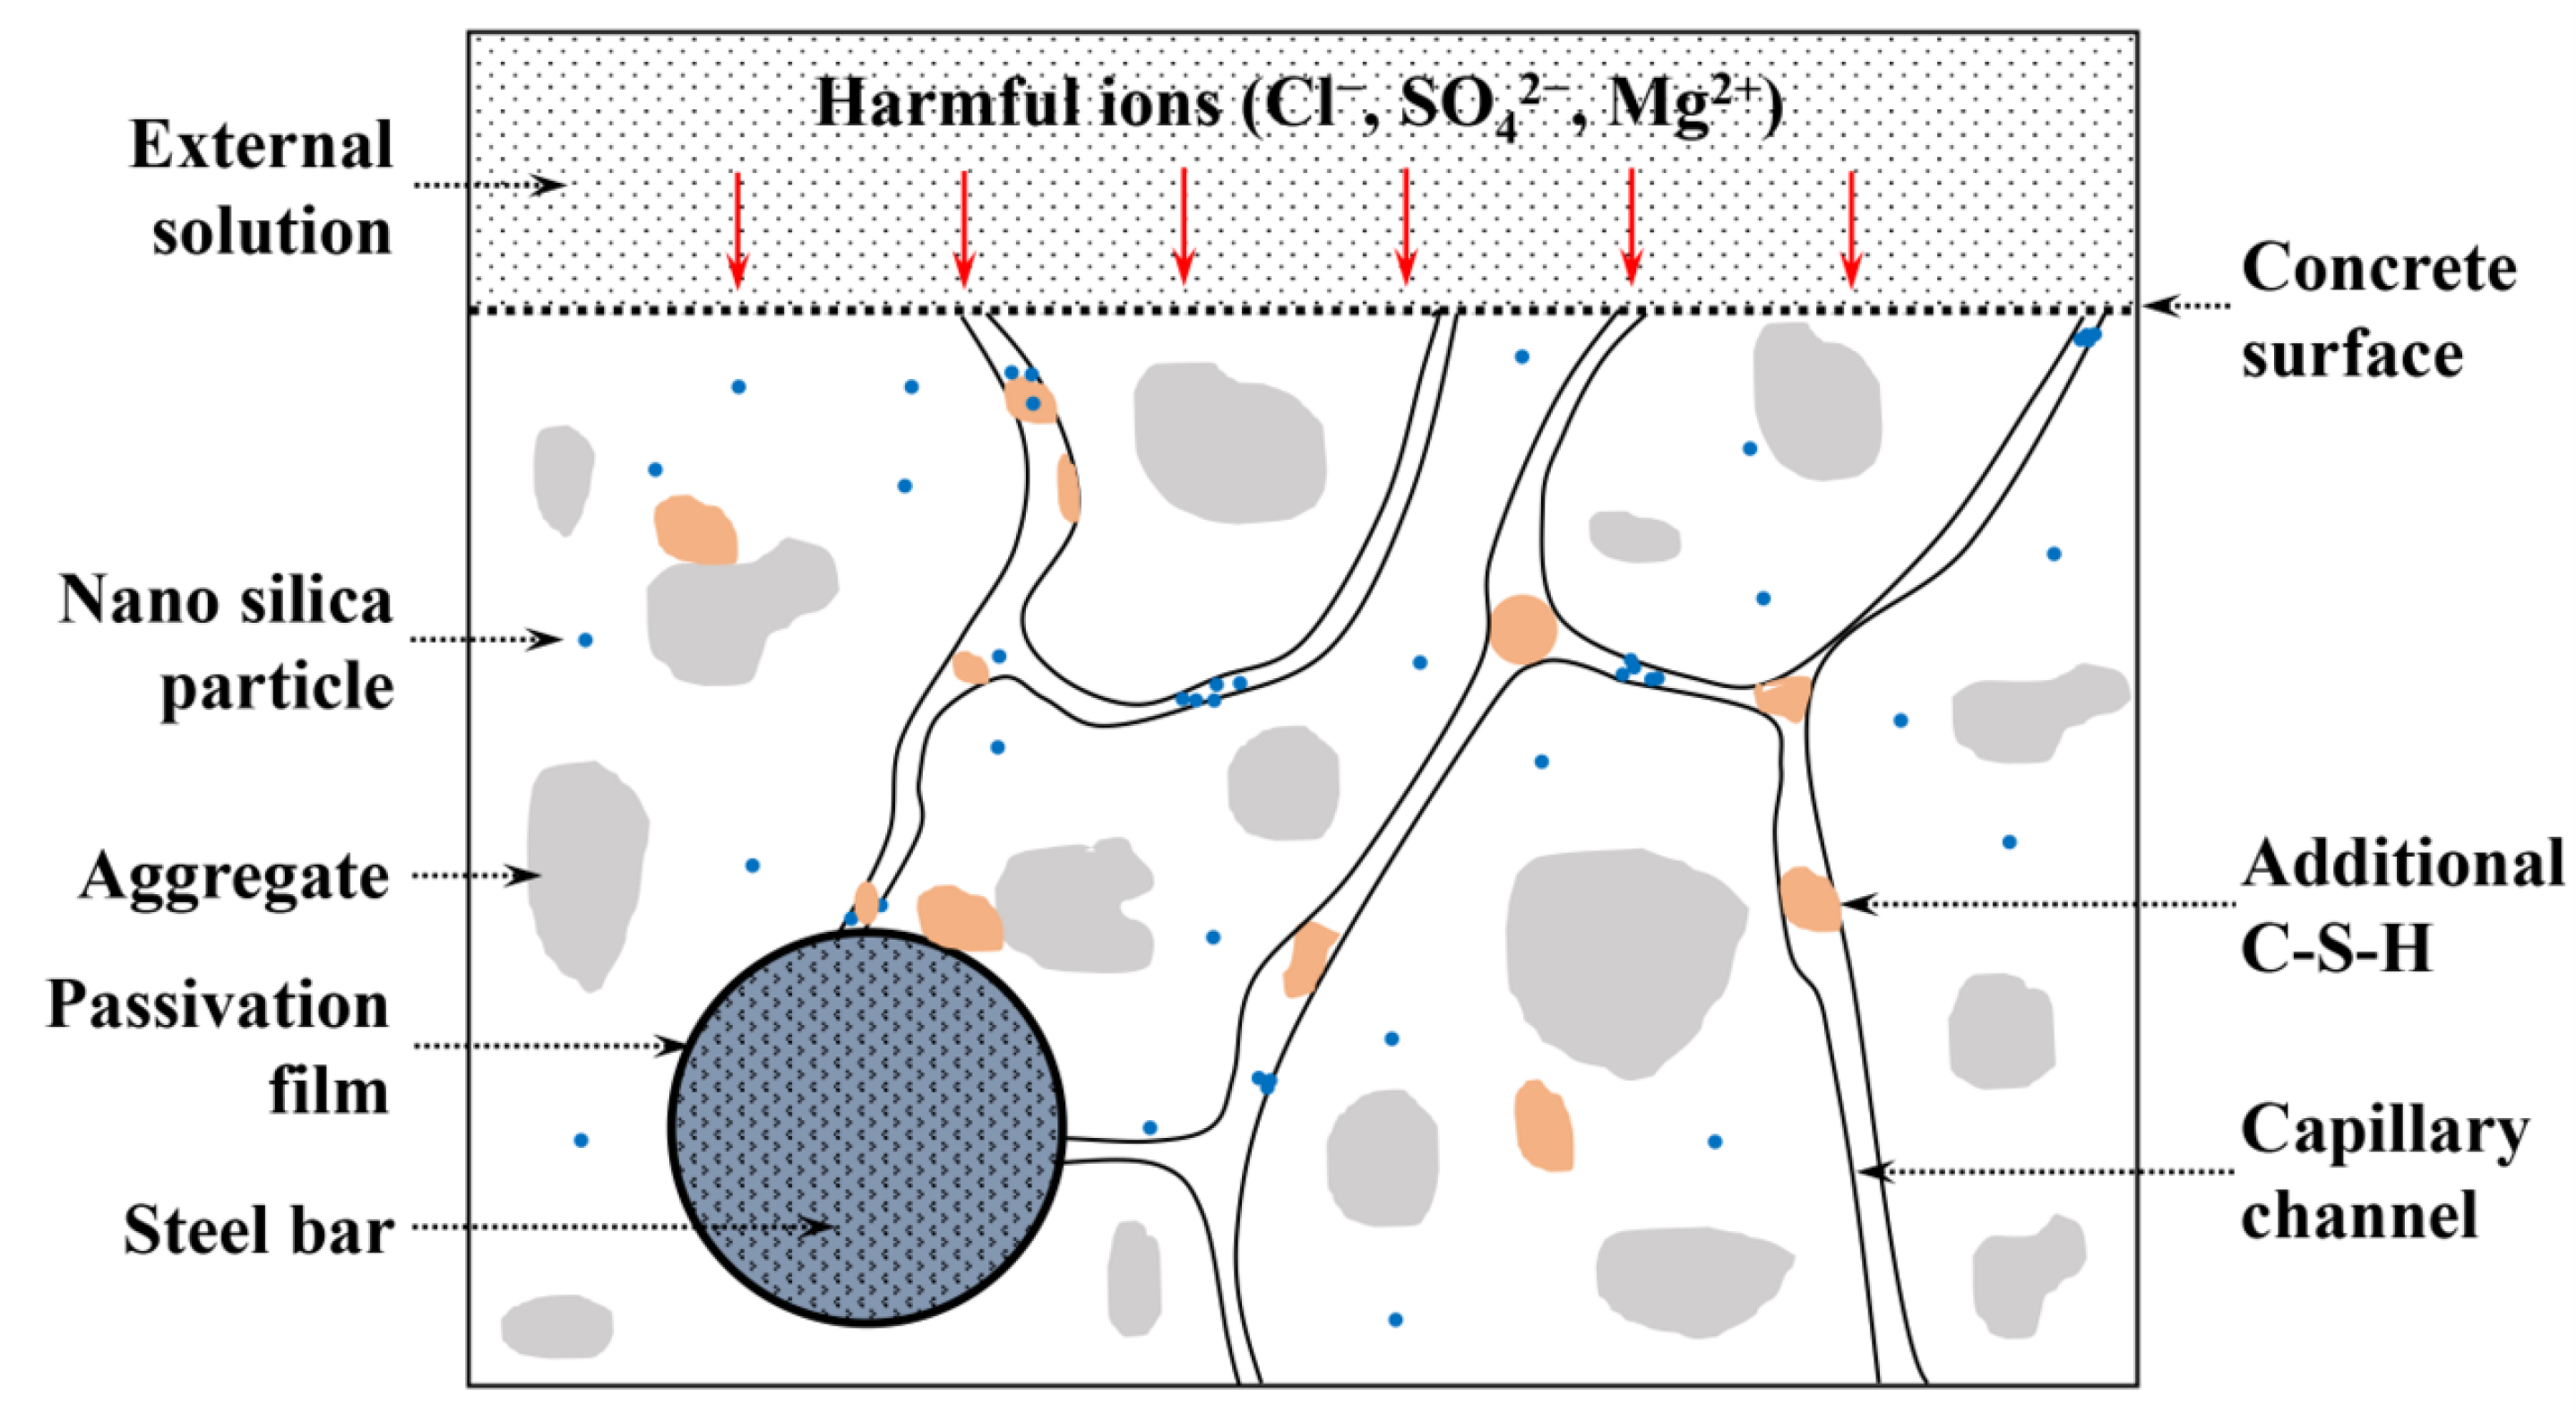
3.6. Mechanism
4. Conclusions
- CNS promoted the early cement hydration process and consumed plenty of CH. The total exothermic heat of the sample with 3% CNS increased by 26.0% compared with the sample C0 at 72 h;
- CNS improved the pore structure considerably: many of the micro pores converted into micro pores and the complexity of the spatial distribution of pores was increased as well. The porosity of N3 reduced from 0.1163 mL·g−1 to 0.1103 mL·g−1 compared to sample C0;
- The incorporation of 3% CNS significantly decreased the Ca/Si ratio of ITZ, which reduced from 3.18 to 2.22 in comparison with sample C0. This made the ITZ more compact, helping to improve the strength and impermeability;
- The impermeability of samples with CNS including water absorption, sorptivity coefficient, and chloride diffusion coefficient were significantly improved. Within a certain range (0–3%), the higher the CNS content, the better the improvement effect.
Author Contributions
Funding
Institutional Review Board Statement
Informed Consent Statement
Data Availability Statement
Conflicts of Interest
References
- Lv, Y.; Ye, G.; De Schutter, G. Utilization of miscanthus combustion ash as internal curing agent in cement-based materials: Effect on autogenous shrinkage. Constr. Build. Mater. 2019, 207, 585–591. [Google Scholar] [CrossRef]
- Lv, Y.; Ye, G.; De Schutter, G. Investigation on the potential utilization of zeolite as an internal curing agent for autogenous shrinkage mitigation and the effect of modification. Constr. Build. Mater. 2019, 198, 669–676. [Google Scholar] [CrossRef]
- Balapour, M.; Joshaghani, A.; Althoey, F. Nano-SiO2 contribution to mechanical, durability, fresh and microstructural characteristics of concrete: A review. Constr. Build. Mater. 2018, 181, 27–41. [Google Scholar] [CrossRef]
- Khodabakhshian, A.; Ghalehnovi, M.; de Brito, J.; Shamsabadi, E.A. Durability performance of structural concrete containing silica fume and marble industry waste powder. J. Clean. Prod. 2018, 170, 42–60. [Google Scholar] [CrossRef]
- Singh, L.; Karade, S.; Bhattacharyya, S.; Yousuf, M.; Ahalawat, S. Beneficial role of nanosilica in cement based materials—A review. Constr. Build. Mater. 2013, 47, 1069–1077. [Google Scholar] [CrossRef]
- Zhang, R.; Cheng, X.; Hou, P.; Ye, Z. Influences of nano-TiO2 on the properties of cement-based materials: Hydration and drying shrinkage. Constr. Build. Mater. 2015, 81, 35–41. [Google Scholar] [CrossRef]
- Sanchez, F.; Sobolev, K. Nanotechnology in concrete—A review. Constr. Build. Mater. 2010, 24, 2060–2071. [Google Scholar] [CrossRef]
- Lee, J.; Mahendra, S.; Alvarez, P.J. Nanomaterials in the construction industry: A review of their applications and environmental health and safety considerations. ACS Nano 2010, 4, 3580–3590. [Google Scholar] [CrossRef]
- Senff, L.; Hotza, D.; Lucas, S.; Ferreira, V.; Labrincha, J.A. Effect of nano-SiO2 and nano-TiO2 addition on the rheological behavior and the hardened properties of cement mortars. Mater. Sci. Eng. A 2012, 532, 354–361. [Google Scholar] [CrossRef]
- Sato, T.; Beaudoin, J.J. Effect of nano-CaCO3 on hydration of cement containing supplementary cementitious materials. Adv. Cem. Res. 2011, 23, 33–43. [Google Scholar] [CrossRef] [Green Version]
- Liu, X.; Chen, L.; Liu, A.; Wang, X. Effect of Nano-CaCO3 on Properties of Cement Paste. Energy Procedia 2012, 16, 991–996. [Google Scholar] [CrossRef]
- Musso, S.; Tulliani, J.-M.; Ferro, G.; Tagliaferro, A. Influence of carbon nanotubes structure on the mechanical behavior of cement composites. Compos. Sci. Technol. 2009, 69, 1985–1990. [Google Scholar] [CrossRef]
- Cwirzen, A.; Habermehl-Cwirzen, K.; Penttala, V. Surface decoration of carbon nanotubes and mechanical properties of cement/carbon nanotube composites. Adv. Cem. Res. 2008, 20, 65–73. [Google Scholar] [CrossRef]
- Qing, Y.; Zenan, Z.; Deyu, K.; Rongshen, C. Influence of nano-SiO2 addition on properties of hardened cement paste as compared with silica fume. Constr. Build. Mater. 2007, 21, 539–545. [Google Scholar] [CrossRef]
- Li, H.; Xiao, H.-G.; Yuan, J.; Ou, J. Microstructure of cement mortar with nano-particles. Compos. Part B Eng. 2004, 35, 185–189. [Google Scholar] [CrossRef]
- Lee, H.S.; Balasubramanian, B.; Gopalakrishna, G.V.T.; Kwon, S.-J.; Karthick, S.P.; Saraswathy, V. Durability performance of CNT and nanosilica admixed cement mortar. Constr. Build. Mater. 2018, 159, 463–472. [Google Scholar] [CrossRef]
- Kong, D.; Du, X.; Wei, S.; Zhang, H.; Yang, Y.; Shah, S.P. Influence of nano-silica agglomeration on microstructure and properties of the hardened cement-based materials. Constr. Build. Mater. 2012, 37, 707–715. [Google Scholar]
- Campillo, I.; Dolado, J.; Porro, A. High-performance nanostructured materials for construction. Spec. Publ. R. Soc. Chem. 2004, 292, 215–226. [Google Scholar]
- Kong, D.; Corr, D.J.; Hou, P.; Yang, Y.; Shah, S.P. Influence of colloidal silica sol on fresh properties of cement paste as compared to nano-silica powder with agglomerates in micron-scale. Cem. Concr. Compos. 2015, 63, 30–41. [Google Scholar]
- Chithra, S.; Kumar, S.S.; Chinnaraju, K. The effect of colloidal nano-silica on workability, mechanical and durability properties of high performance concrete with copper slag as partial fine aggregate. Constr. Build. Mater. 2016, 113, 794–804. [Google Scholar] [CrossRef]
- Hou, P.-K.; Kawashima, S.; Wang, K.-J.; Corr, D.J.; Qian, J.-S.; Shah, S.P. Effects of colloidal nanosilica on rheological and mechanical properties of fly ash–cement mortar. Cem. Concr. Compos. 2013, 35, 12–22. [Google Scholar] [CrossRef]
- Liu, J.; Liao, C.; Jin, H.; Jiang, Z.; Xie, R.; Tang, L. Electrically driven ionic transport in the RCM and RIM: Investigations based on experiments and numerical simulations. Constr. Build. Mater. 2022, 331, 127331. [Google Scholar] [CrossRef]
- Andersen, M.D.; Jakobsen, H.J.; Skibsted, J. Characterization of white Portland cement hydration and the CSH structure in the presence of sodium aluminate by 27Al and 29Si MAS NMR spectroscopy. Cem. Concr. Res. 2004, 34, 857–868. [Google Scholar] [CrossRef]
- Richardson, I.; Groves, G. The structure of the calcium silicate hydrate phases present in hardened pastes of white Portland cement/blast-furnace slag blends. J. Mater. Sci. 1997, 32, 4793–4802. [Google Scholar] [CrossRef]
- Lanzón, M.; García-Ruiz, P. Lightweight cement mortars: Advantages and inconveniences of expanded perlite and its influence on fresh and hardened state and durability. Constr. Build. Mater. 2008, 22, 1798–1806. [Google Scholar] [CrossRef]
- Cam, H.T.; Neithalath, N. Moisture and ionic transport in concretes containing coarse limestone powder. Cem. Concr. Compos. 2010, 32, 486–496. [Google Scholar] [CrossRef]
- Martys, N.S.; Ferraris, C.F.J.C. Capillary transport in mortars and concrete. Cem. Concr. Res. 1997, 27, 747–760. [Google Scholar] [CrossRef]
- Wang, D.; Shi, C.; Wu, Z.; Wu, L.; Xiang, S.; Pan, X. Effects of nanomaterials on hardening of cement–silica fume–fly ash-based ultra-high-strength concrete. Adv. Cem. Res. 2016, 28, 555–566. [Google Scholar] [CrossRef]
- Hou, P.; Kawashima, S.; Kong, D.; Corr, D.J.; Qian, J.; Shah, S.P. Modification effects of colloidal nanoSiO2 on cement hydration and its gel property. Compos. Part B Eng. 2013, 45, 440–448. [Google Scholar] [CrossRef]
- Zhang, M.-H.; Li, H. Pore structure and chloride permeability of concrete containing nano-particles for pavement. Constr. Build. Mater. 2011, 25, 608–616. [Google Scholar] [CrossRef]
- Hosseini, P.; Booshehrian, A.; Madari, A. Developing concrete recycling strategies by utilization of nano-SiO2 particles. Waste Biomass Valorization 2011, 2, 347–355. [Google Scholar] [CrossRef]
- Zhang, B.; Li, S.J.I. Determination of the Surface Fractal Dimension for Porous Media by Mercury Porosimetry. Ind. Eng. Chem. Res. 1995, 34, 1383–1386. [Google Scholar] [CrossRef]
- Lee, G.-J.; Pyun, S.-I. The effect of pore structures on fractal characteristics of meso/macroporous carbons synthesised using silica template. Carbon 2005, 43, 1804–1808. [Google Scholar] [CrossRef]
- Kim, J.; Choi, Y.C.; Choi, S. Fractal Characteristics of Pore Structures in GGBFS-based Cement Pastes. Appl. Surf. Sci. 2018, 428, 304–314. [Google Scholar] [CrossRef]
- Zeng, Q.; Li, K.; Fen-Chong, T.; Dangla, P. Surface fractal analysis of pore structure of high-volume fly-ash cement pastes. Appl. Surf. Sci. 2010, 257, 762–768. [Google Scholar] [CrossRef]
- Singh, L.; Bhattacharyya, S.; Shah, S.P.; Mishra, G.; Sharma, U. Studies on early stage hydration of tricalcium silicate incorporating silica nanoparticles: Part II. Constr. Build. Mater. 2016, 102, 943–949. [Google Scholar] [CrossRef]
- Xu, Z.; Zhou, Z.; Du, P.; Cheng, X. Effects of nano-silica on hydration properties of tricalcium silicate. Constr. Build. Mater. 2016, 125, 1169–1177. [Google Scholar] [CrossRef]
- Love, C.; Richardson, I.; Brough, A. Composition and structure of C–S–H in white Portland cement–20% metakaolin pastes hydrated at 25 C. Cem. Concr. Res. 2007, 37, 109–117. [Google Scholar] [CrossRef]
- Wang, L.; He, Z.; Zhang, B.; Cai, X. Quantitative Analysis of Fly Ash-cement Hydration by 29Si MAS NMR. J. Chin. Ceram. Soc. 2010, 11, 2. [Google Scholar]
- Singh, L.; Ali, D.; Sharma, U. Studies on optimization of silica nanoparticles dosage in cementitious system. Cem. Concr. Compos. 2016, 70, 60–68. [Google Scholar] [CrossRef]
- Del Bosque, I.S.; Zhu, W.; Howind, T.; Matías, A.; De Rojas, M.S.; Medina, C. Properties of interfacial transition zones (ITZs) in concrete containing recycled mixed aggregate. Cement Concr. Comp. 2017, 81, 25–34. [Google Scholar] [CrossRef]
- Hewlett, P.; Liska, M. Lea’s Chemistry of Cement and Concrete, 5th ed.; Butterworth-Heinemann: Oxford, UK, 2019. [Google Scholar]
- Feng, L.; Zhao, P.; Wang, Z.; Gao, J.; Su, X.; Li, H. Improvement of mechanical properties and chloride ion penetration resistance of cement pastes with the addition of pre-dispersed silica fume. Constr. Build. Mater. 2018, 182, 483–492. [Google Scholar] [CrossRef]
- Aleem, S.A.E.; Heikal, M.; Morsi, W. Hydration characteristic, thermal expansion and microstructure of cement containing nano-silica. Constr. Build. Mater. 2014, 59, 151–160. [Google Scholar] [CrossRef]


| Compound | Cement (wt.%) |
|---|---|
| SiO2 | 21.07 |
| Al2O3 | 4.71 |
| Fe2O3 | 3.21 |
| SO3 | 2.10 |
| CaO | 63.06 |
| MgO | 1.78 |
| Na2O | 0.12 |
| K2O | 0.68 |
| Loss on ignition (LOI) | 2.42 |
| Total | 99.15 |
| CNS | Solid Content (wt.%) | Average Particle Size (nm) | pH | Viscosity (Pa·s) | Density (g/cm3) |
|---|---|---|---|---|---|
| Indicator | 40 | 14 | 10.3 | 4.7 | 1.21 |
| Mixture | Cement (wt.%) | CNS (wt.%) | W/B | Sand (wt.%) |
|---|---|---|---|---|
| Mortars | ||||
| C0 | 100 | 0 | 0.5 | 300 |
| N1 | 99 | 1 | 0.5 | 300 |
| N2 | 98 | 2 | 0.5 | 300 |
| N3 | 97 | 3 | 0.5 | 300 |
| Pastes | ||||
| C0 | 100 | 0 | 0.5 | |
| N1 | 99 | 1 | 0.5 | |
| N2 | 98 | 2 | 0.5 | |
| N3 | 97 | 3 | 0.5 | |
| Mix No. | CNS Dosage (%) | Initial Sorptivity Coefficient (mm/min1/2) | Secondary Sorptivity Coefficient (mm/min1/2) |
|---|---|---|---|
| C0 | 0 | 0.097 | 0.054 |
| N1 | 1 | 0.067 | 0.042 |
| N2 | 2 | 0.059 | 0.040 |
| N3 | 3 | 0.053 | 0.033 |
| Sample | Porosity (mL·g−1) | Pore Volume Distribution (mL·g−1) | ||||
|---|---|---|---|---|---|---|
| 6–10 nm | 10–25 nm | 25–50 nm | 50–100 nm | >100 nm | ||
| C0 | 0.1163 | 0.0075 | 0.0262 | 0.0601 | 0.0133 | 0.0092 |
| N3 | 0.1103 | 0.0154 | 0.0438 | 0.0342 | 0.0052 | 0.0117 |
| Sample | Relative Intensity of Qn/% | αpc/% | ACL | ||
|---|---|---|---|---|---|
| Q0 | Q1 | Q2 | |||
| C0 | 29.54 | 60.8 | 9.66 | 70.45 | 2.32 |
| N3 | 27.28 | 59.77 | 12.94 | 72.72 | 2.43 |
| C0 | N3 | |||
|---|---|---|---|---|
 |  |  |  | |
| Area | Aggregate | Hydration Products | Aggregate | Hydration Products |
| Proportion (%) | 27% | 73% | 19% | 81% |
| Si (%) | 40.67% | 8.48% | 43.15% | 10.25% |
| Ca (%) | 1.22% | 26.95% | 1.20% | 22.78% |
| Ca/Si ratio of ITZ | 3.18 | 2.22 | ||
Publisher’s Note: MDPI stays neutral with regard to jurisdictional claims in published maps and institutional affiliations. |
© 2022 by the authors. Licensee MDPI, Basel, Switzerland. This article is an open access article distributed under the terms and conditions of the Creative Commons Attribution (CC BY) license (https://creativecommons.org/licenses/by/4.0/).
Share and Cite
Wang, J.; Lu, X.; Ma, B.; Tan, H. Cement-Based Materials Modified by Colloidal Nano-Silica: Impermeability Characteristic and Microstructure. Nanomaterials 2022, 12, 3176. https://doi.org/10.3390/nano12183176
Wang J, Lu X, Ma B, Tan H. Cement-Based Materials Modified by Colloidal Nano-Silica: Impermeability Characteristic and Microstructure. Nanomaterials. 2022; 12(18):3176. https://doi.org/10.3390/nano12183176
Chicago/Turabian StyleWang, Jie, Xuesong Lu, Baoguo Ma, and Hongbo Tan. 2022. "Cement-Based Materials Modified by Colloidal Nano-Silica: Impermeability Characteristic and Microstructure" Nanomaterials 12, no. 18: 3176. https://doi.org/10.3390/nano12183176
APA StyleWang, J., Lu, X., Ma, B., & Tan, H. (2022). Cement-Based Materials Modified by Colloidal Nano-Silica: Impermeability Characteristic and Microstructure. Nanomaterials, 12(18), 3176. https://doi.org/10.3390/nano12183176