
Quantitative Deviation of Nanocrystals Using the RIR Method in X-ray Diffraction (XRD)


Abstract
:1. Introduction
2. Materials and Methods
3. Results
4. Discussion
- (1)
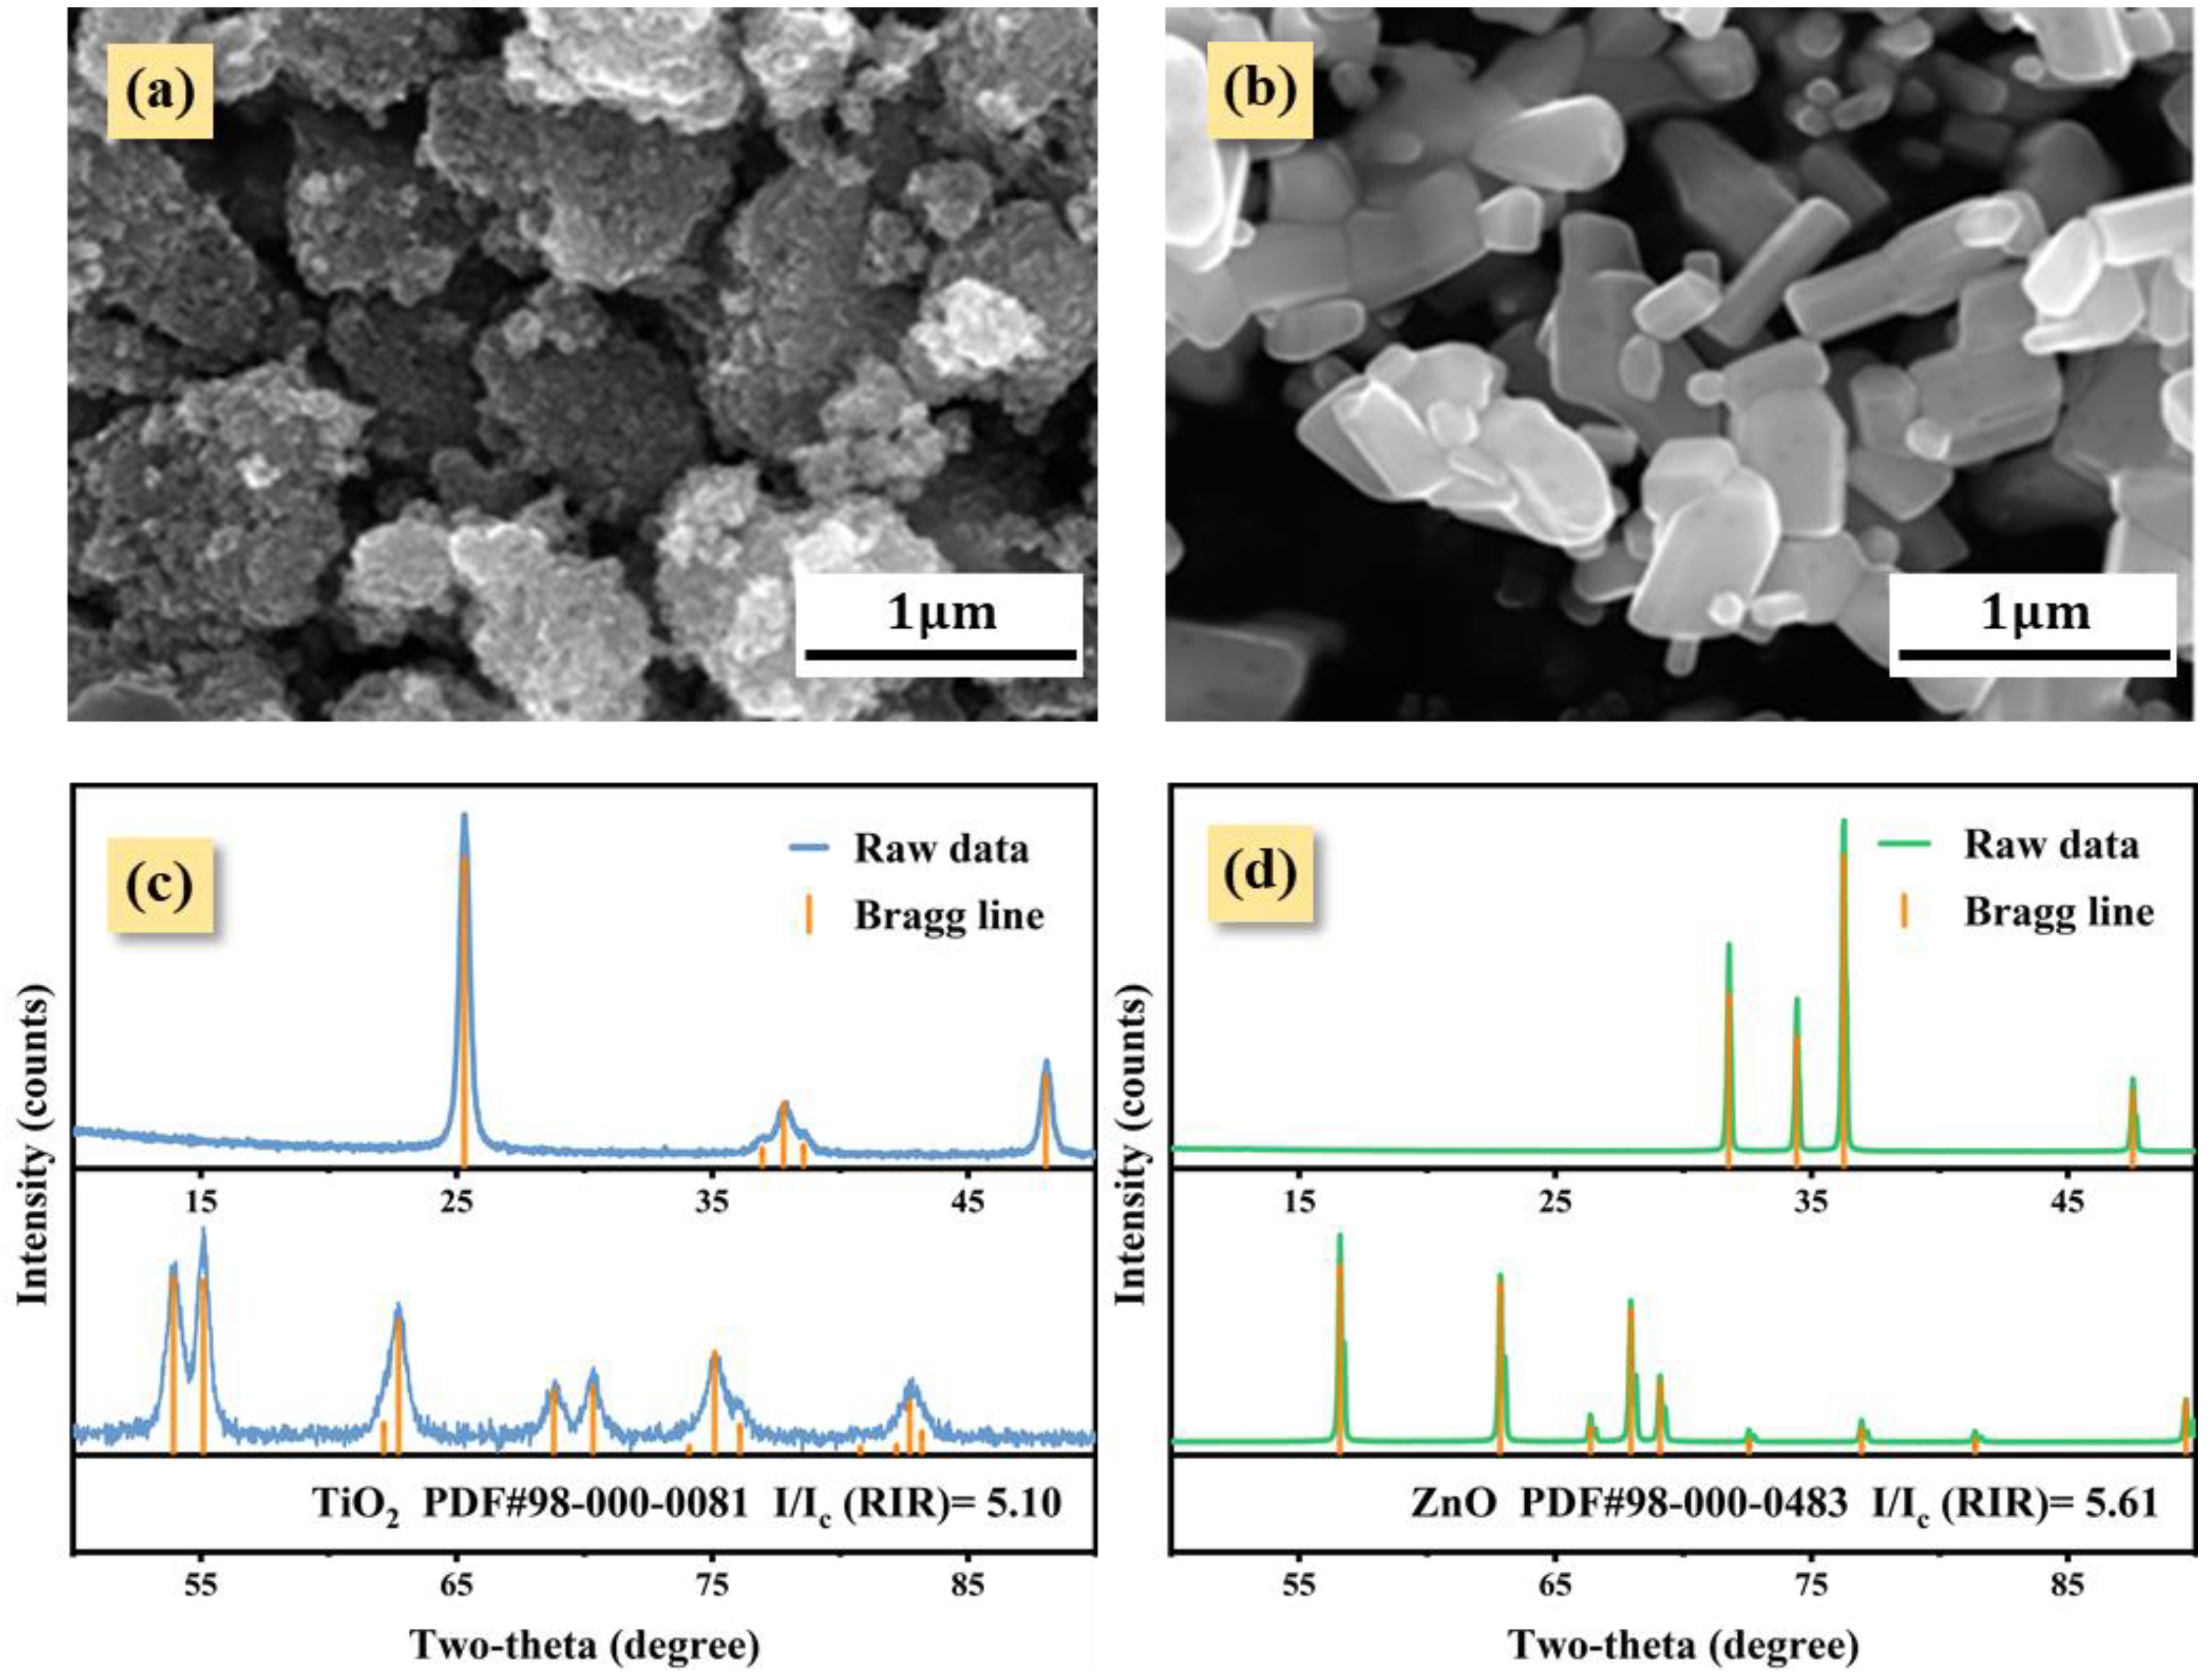
- The existing phases α and β have a determined crystal structure, and the reference intensity ratio (RIR) of each phase can be obtained through an XRD experiment.
- (2)
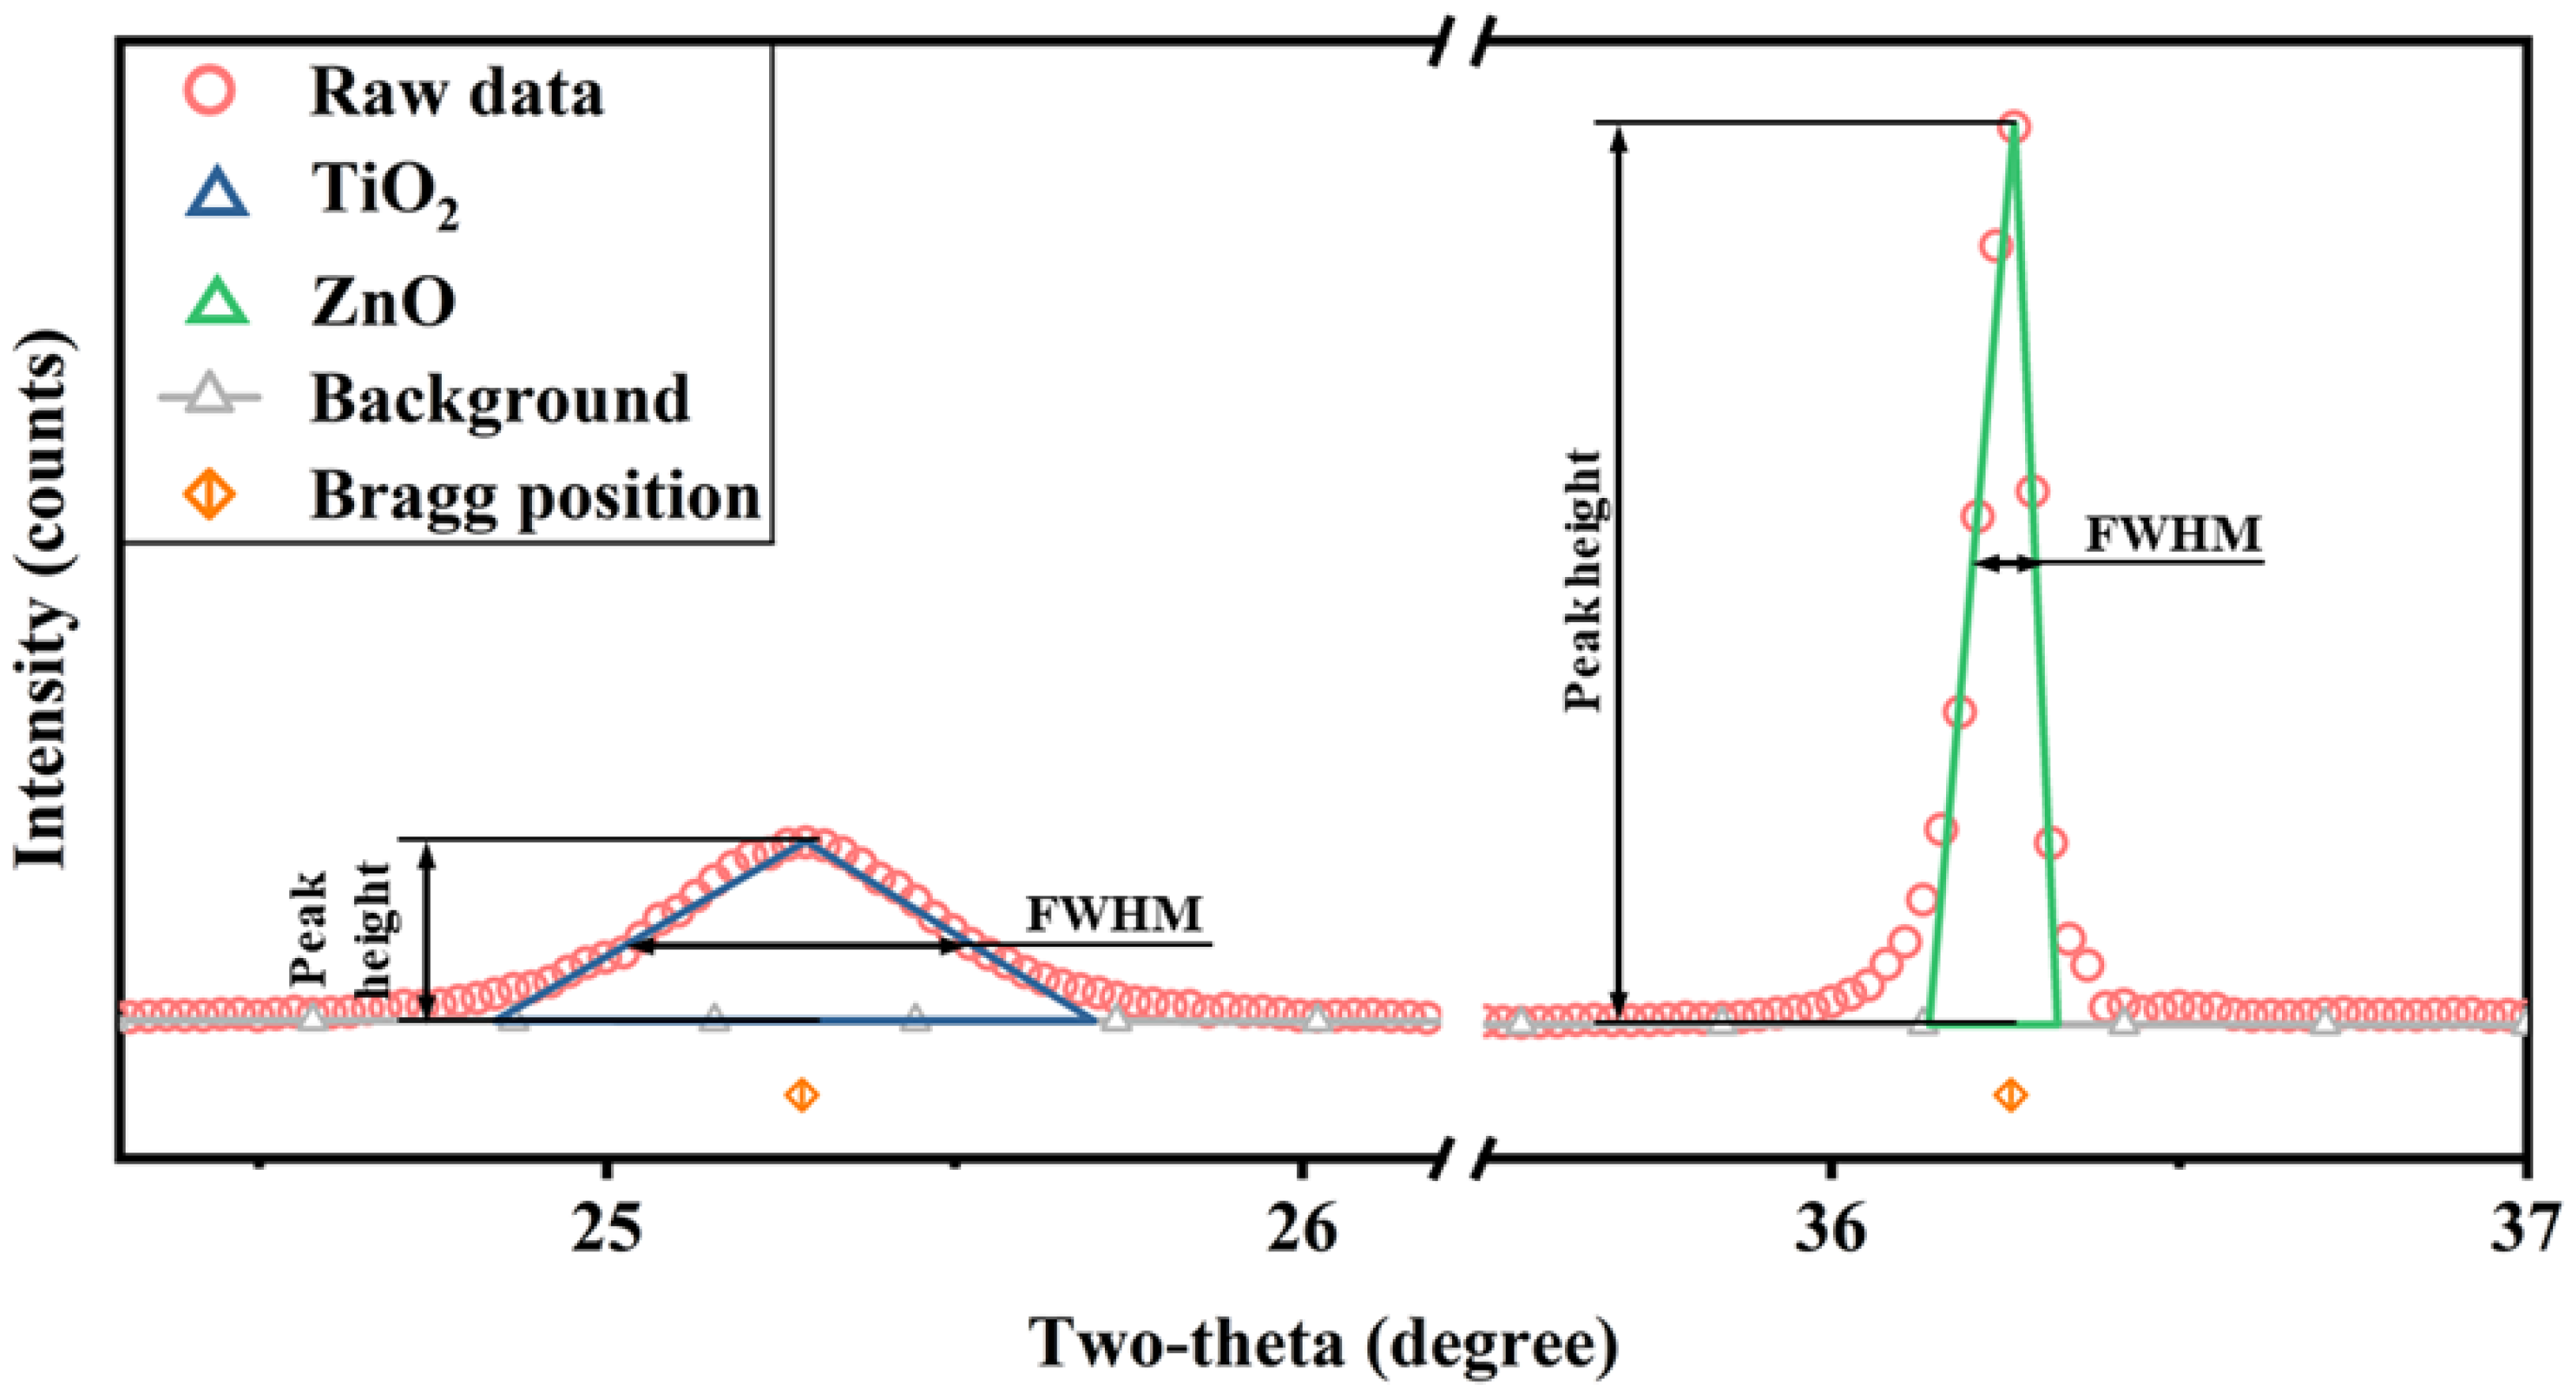
- We can use isosceles triangles to approximate the shape of the phase diffraction peaks (Figure 6). The integral area of the diffraction peak is approximately the product of the half-height of the isosceles triangle and its height; in Equation (2) can be elucidated as
- (3)
- There are powders α and β, where the FWHM of the diffraction peak of α is significantly increased due to the nanocrystal (larger than IB), and the FWHM of β is almost close to the instrumental broadening to the extent that they can be approximately equal.
5. Conclusions
Supplementary Materials
Author Contributions
Funding
Institutional Review Board Statement
Informed Consent Statement
Data Availability Statement
Conflicts of Interest
References
- Kaduk, J.A.; Billinge, S.J.L.; Dinnebier, R.E.; Henderson, N.; Madsen, I.; Černý, R.; Leoni, M.; Lutterotti, L.; Thakral, S.; Chateigner, D. Powder diffraction. Nat. Rev. Methods Primers 2021, 1, 77. [Google Scholar] [CrossRef]
- Suescun, L. International Tables for Crystallography, Volume H, Powder Diffraction. First edition. Edited by Christopher J. Gilmore, James A. Kaduk and Henk Schenk. Wiley, 2019. J. Appl. Crystallogr. 2021, 54, 710–713. [Google Scholar] [CrossRef]
- Doebelin, N.; Kleeberg, R. Profex: A graphical user interface for the Rietveld refinement program BGMN. J. Appl. Crystallogr. 2015, 48, 1573–1580. [Google Scholar] [CrossRef] [PubMed] [Green Version]
- Fernández, J.; González, F.; Pesquera, C.; Neves Junior, A.; Viana, M.M.; Dweck, J. Qualitative and quantitative characterization of a coal power plant waste by TG/DSC/MS, XRF and XRD. J. Therm. Anal. Calorim. 2016, 125, 703–710. [Google Scholar] [CrossRef]
- Ramkumar, T.; Selvakumar, M.; Vasanthsankar, R.; Sathishkumar, A.S.; Narayanasamy, P.; Girija, G. Rietveld refinement of powder X-ray diffraction, microstructural and mechanical studies of magnesium matrix composites processed by high energy ball milling. J. Magnes. Alloy. 2018, 6, 390–398. [Google Scholar] [CrossRef]
- Dinnebier, R.E.; Leineweber, A.; Evans, J.S. Rietveld refinement. In Rietveld Refinement; De Gruyter: Berlin, Germany, 2018. [Google Scholar]
- Hillier, S. Accurate quantitative analysis of clay and other minerals in sandstones by XRD: Comparison of a Rietveld and a reference intensity ratio (RIR) method and the importance of sample preparation. Clay Miner. 2000, 35, 291–302. [Google Scholar] [CrossRef]
- Madsen, I.; Scarlett, N.; Kleeberg, R.; Knorr, K. Reference intensity ratio. Int. Tables Crystallogr. 2019, H, 347. [Google Scholar]
- Zhou, X.; Liu, D.; Bu, H.; Deng, L.; Liu, H.; Yuan, P.; Du, P.; Song, H. XRD-based quantitative analysis of clay minerals using reference intensity ratios, mineral intensity factors, Rietveld, and full pattern summation methods: A critical review. Solid Earth Sci. 2018, 3, 16–29. [Google Scholar] [CrossRef]
- Hupp, B.N.; Donovan, J.J. Quantitative mineralogy for facies definition in the Marcellus Shale (Appalachian Basin, USA) using XRD-XRF integration. Sediment. Geol. 2018, 371, 16–31. [Google Scholar] [CrossRef]
- Marques, C.F.; Olhero, S.; Abrantes, J.C.C.; Marote, A.; Ferreira, S.; Vieira, S.I.; Ferreira, J.M.F. Biocompatibility and antimicrobial activity of biphasic calcium phosphate powders doped with metal ions for regenerative medicine. Ceram. Int. 2017, 43, 15719–15728. [Google Scholar] [CrossRef]
- Gates-Rector, S.; Blanton, T. The Powder Diffraction File: A quality materials characterization database. Powder Diffr. 2019, 34, 352–360. [Google Scholar] [CrossRef] [Green Version]
- Epp, J. X-ray diffraction (XRD) techniques for materials characterization. In Materials Characterization Using Nondestructive Evaluation (NDE) Methods; Hübschen, G., Altpeter, I., Tschuncky, R., Herrmann, H.-G., Eds.; Woodhead Publishing: Sawston, UK, 2016; pp. 81–124. [Google Scholar]
- Ładniak, A.; Jurak, M.; Wiącek, A.E. Wettability of DPPC Monolayers Deposited from the Titanium Dioxide–Chitosan–Hyaluronic Acid Subphases on Glass. Colloids Interfaces 2019, 3, 15. [Google Scholar] [CrossRef] [Green Version]
- Matusiak, J.; Grządka, E.; Bastrzyk, A.; Pasieczna-Patkowska, S. The influence of fucoidan on stability, adsorption and electrokinetic properties of ZnO and TiO2 suspensions. Appl. Nanosci. 2022, 12, 919–927. [Google Scholar] [CrossRef]
- Wiącek, A.E.; Anitowska, E.; Delgado, A.V.; Hołysz, L.; Chibowski, E. The electrokinetic and rheological behavior of phosphatidylcholine-treated TiO2 suspensions. Colloids Surf. A Physicochem. Eng. Asp. 2014, 440, 110–115. [Google Scholar] [CrossRef]
- Wiśniewska, M.; Chibowski, S.; Urban, T.; Nosal-Wiercińska, A.; Terpiłowski, K.; Goncharuk, O. Comparison of adsorption affinity of anionic polyacrylamide for nanostructured silica-titania mixed oxides. J. Mol. Liq. 2018, 258, 27–33. [Google Scholar] [CrossRef]
- Sahu, A.; Chaurashiya, R.; Hiremath, K.; Dixit, A. Nanostructured zinc titanate wide band gap semiconductor as a photoelectrode material for quantum dot sensitized solar cells. Solar Energy 2018, 163, 338–346. [Google Scholar] [CrossRef]
- Bratoev, B.; Doykov, I.; Ninov, J.; Lenchev, A. Pozzolanic activity assessment of calcined clays with complex minerals content. Adv. Cem. Res. 2018, 30, 103–112. [Google Scholar] [CrossRef]
- Bish, D.L.; Post, J.E. Modern Powder Diffraction; Walter de Gruyter GmbH & Co KG: Berlin, Germany, 2018; Volume 20. [Google Scholar]
- Alqahtani, H. A Study of Asphalt Binders by X-Ray Diffraction Using Pearson-VII, Pseudo-Voigt and Generalized Fermi Functions. Master’s Thesis, Memorial University of Newfoundland, St. John’s, NL, Canada, 2017. [Google Scholar]
- Rodriguez-Carvajal, J. Recent developments of the program FULLPROF, commission on powder diffraction. IUCr Newsl. 2001, 26. [Google Scholar]
- He, K.; Chen, N.; Wang, C.; Wei, L.; Chen, J. Method for determining crystal grain size by x-ray diffraction. Cryst. Res. Technol. 2018, 53, 1700157. [Google Scholar] [CrossRef]
- Chung, F. Quantitative X-ray diffraction and X-ray fluorescence analyses of mixtures—Unified and simplified. J. Appl. Crystallogr. 2018, 51, 789–795. [Google Scholar] [CrossRef]


| Weight Ratio, Artificial Mixtures of TiO2 and ZnO | ||||
|---|---|---|---|---|
| 9:1 | 7:3 | 1:1 | 3:7 | 1:9 |
| Cross-slit width (mm), TiO2-ZnO (1:1) | ||||
| 0.25 | 0.50 | 1.00 | 1.50 | 2.00 |
| Nano-TiO2, Known wt.% | FWHM of Nano-TiO2, 2θ at 25.321 (°) | FWHM of ZnO, 2θ at 25.321 (°) |
|---|---|---|
| 90 | 0.429 | 0.088 |
| 70 | 0.432 | 0.089 |
| 50 | 0.430 | 0.089 |
| 30 | 0.430 | 0.086 |
| 10 | 0.434 | 0.082 |
| Silicon powder standard | 0.083 | 0.081 |
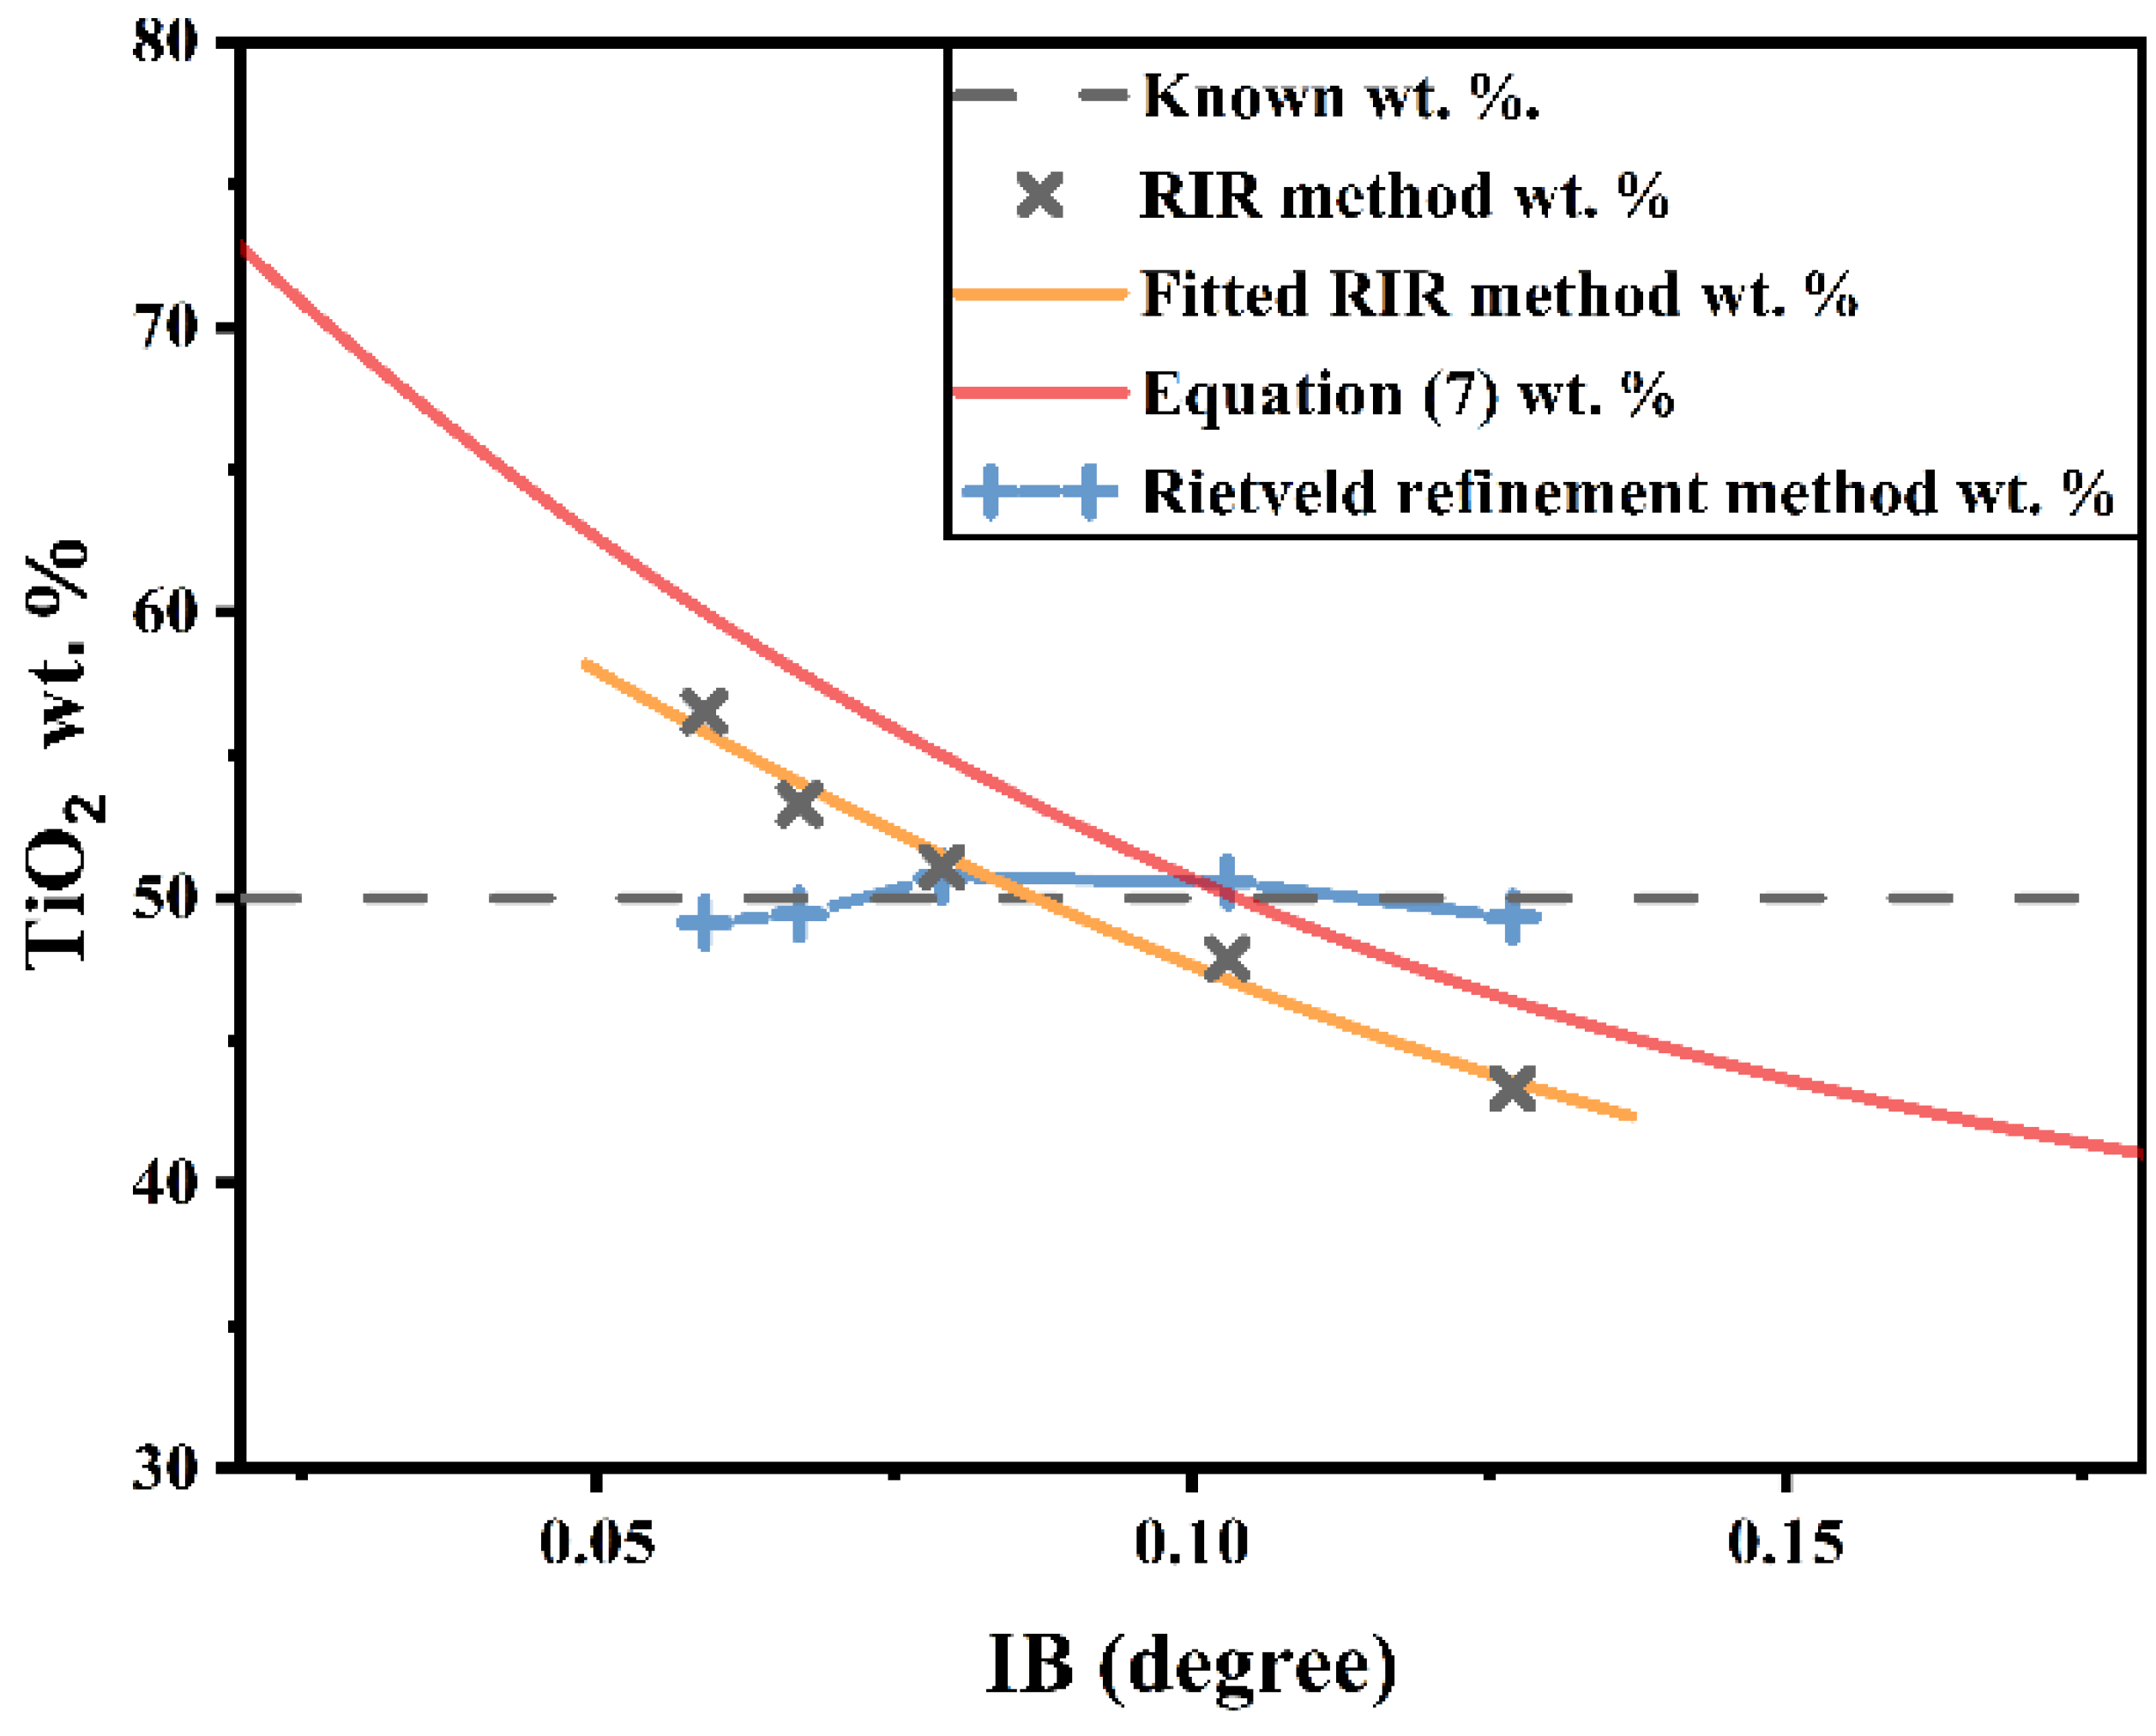
| Slit Width (mm) | FWHM of TiO2 (°) | FWHM of ZnO (°) | Peak Height Ratio: TiO2-ZnO | RIR Method | Rietveld Refinement Method | ||
|---|---|---|---|---|---|---|---|
| wt.% | Deviation 1 (%) | wt.% | Deviation 1 (%) | ||||
| 0.25 | 0.396 | 0.059 | 0.19 | 56.53 | +6.53 | 49.14 | −0.86 |
| 0.50 | 0.416 | 0.067 | 0.19 | 53.29 | +3.29 | 49.43 | −0.57 |
| 1.00 | 0.437 | 0.079 | 0.20 | 51.09 | +1.09 | 50.72 | +0.72 |
| 1.50 | 0.454 | 0.103 | 0.21 | 47.88 | −2.12 | 50.57 | +0.57 |
| 2.00 | 0.478 | 0.127 | 0.21 | 43.33 | −6.67 | 49.32 | −0.68 |
Publisher’s Note: MDPI stays neutral with regard to jurisdictional claims in published maps and institutional affiliations. |
© 2022 by the authors. Licensee MDPI, Basel, Switzerland. This article is an open access article distributed under the terms and conditions of the Creative Commons Attribution (CC BY) license (https://creativecommons.org/licenses/by/4.0/).
Share and Cite
Huang, Q.; Wang, C.; Shan, Q. Quantitative Deviation of Nanocrystals Using the RIR Method in X-ray Diffraction (XRD). Nanomaterials 2022, 12, 2320. https://doi.org/10.3390/nano12142320
Huang Q, Wang C, Shan Q. Quantitative Deviation of Nanocrystals Using the RIR Method in X-ray Diffraction (XRD). Nanomaterials. 2022; 12(14):2320. https://doi.org/10.3390/nano12142320
Chicago/Turabian StyleHuang, Qinyuan, Chunjian Wang, and Quan Shan. 2022. "Quantitative Deviation of Nanocrystals Using the RIR Method in X-ray Diffraction (XRD)" Nanomaterials 12, no. 14: 2320. https://doi.org/10.3390/nano12142320
APA StyleHuang, Q., Wang, C., & Shan, Q. (2022). Quantitative Deviation of Nanocrystals Using the RIR Method in X-ray Diffraction (XRD). Nanomaterials, 12(14), 2320. https://doi.org/10.3390/nano12142320