
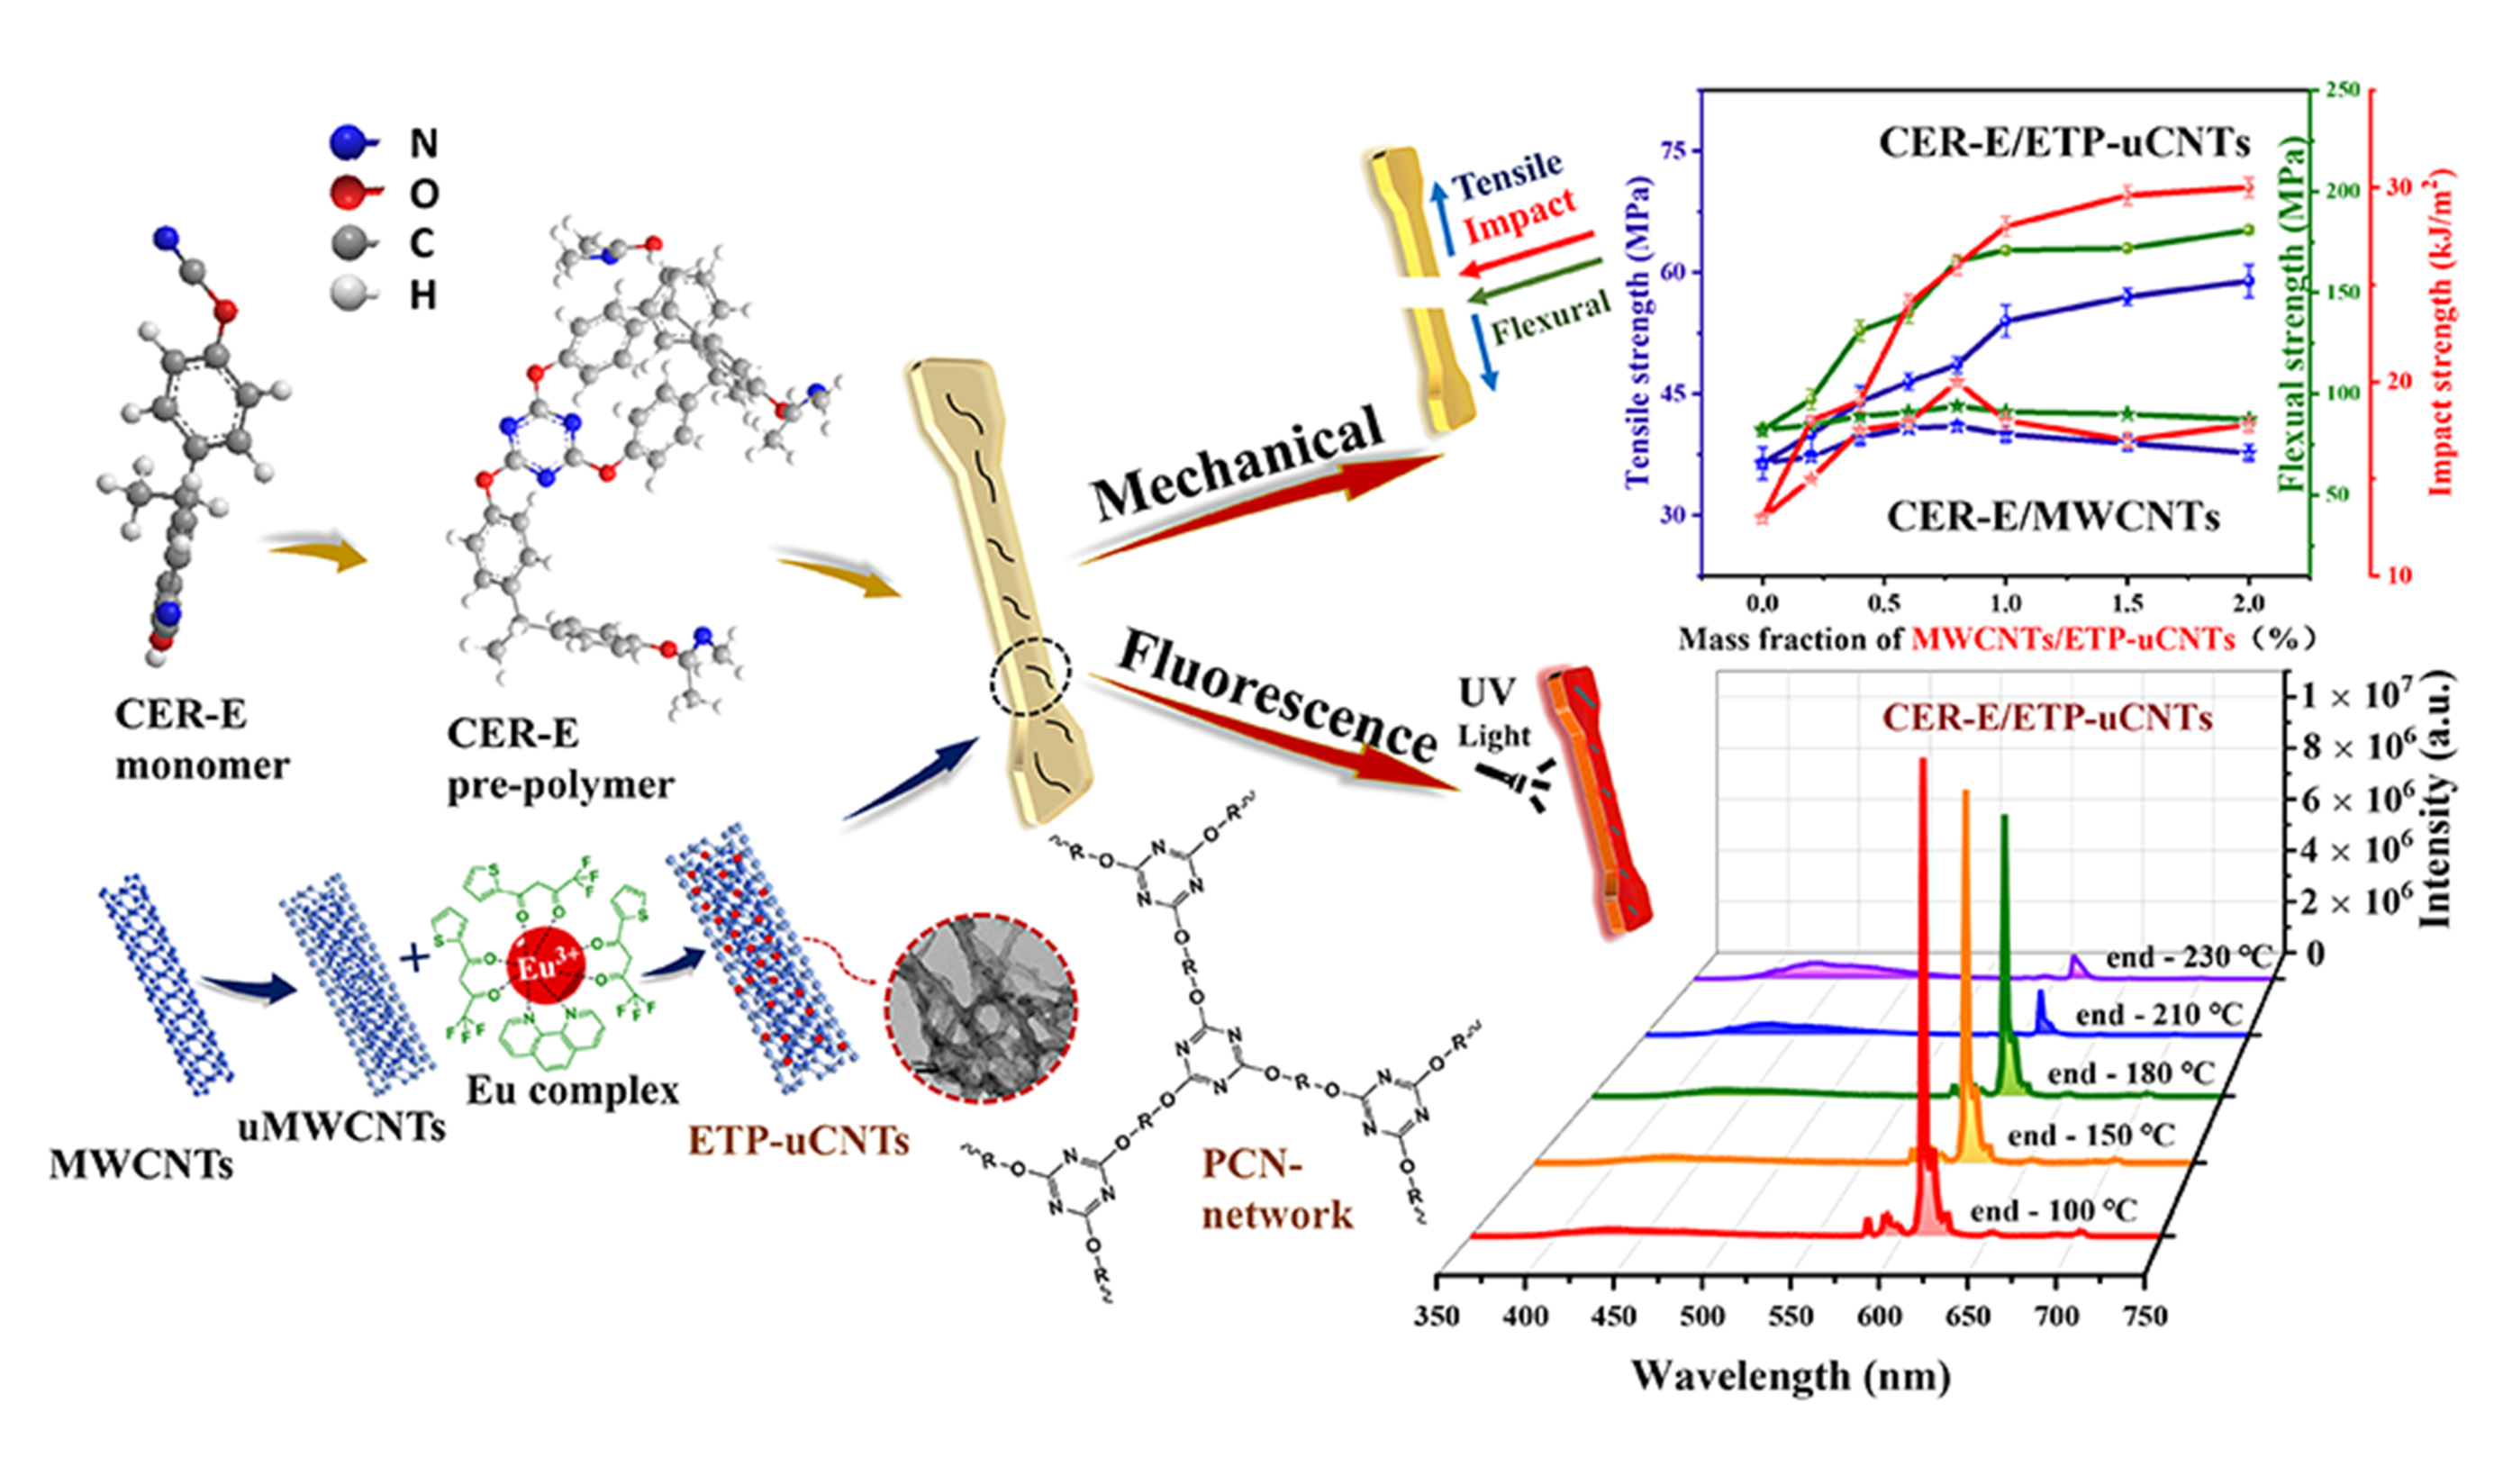
The Created Excellent Thermal, Mechanical and Fluorescent Properties by Doping Eu3+-Complex-Anchored Carbon Nanotubes in Polycyanate Resins


 ,
,  , and
, and
Abstract
:1. Introduction
2. Materials and Methods
2.1. Materials
2.2. Experimental Section
2.2.1. Modification of MWCNTs (uMWCNTs)
2.2.2. Preparation of ETP-MWCNTs and ETP-uCNTs
2.2.3. Synthesis of CER/ ETP-MWCNT and CER/ ETP-uCNT Hybrid Nanocomposites
2.3. Characterization
3. Results
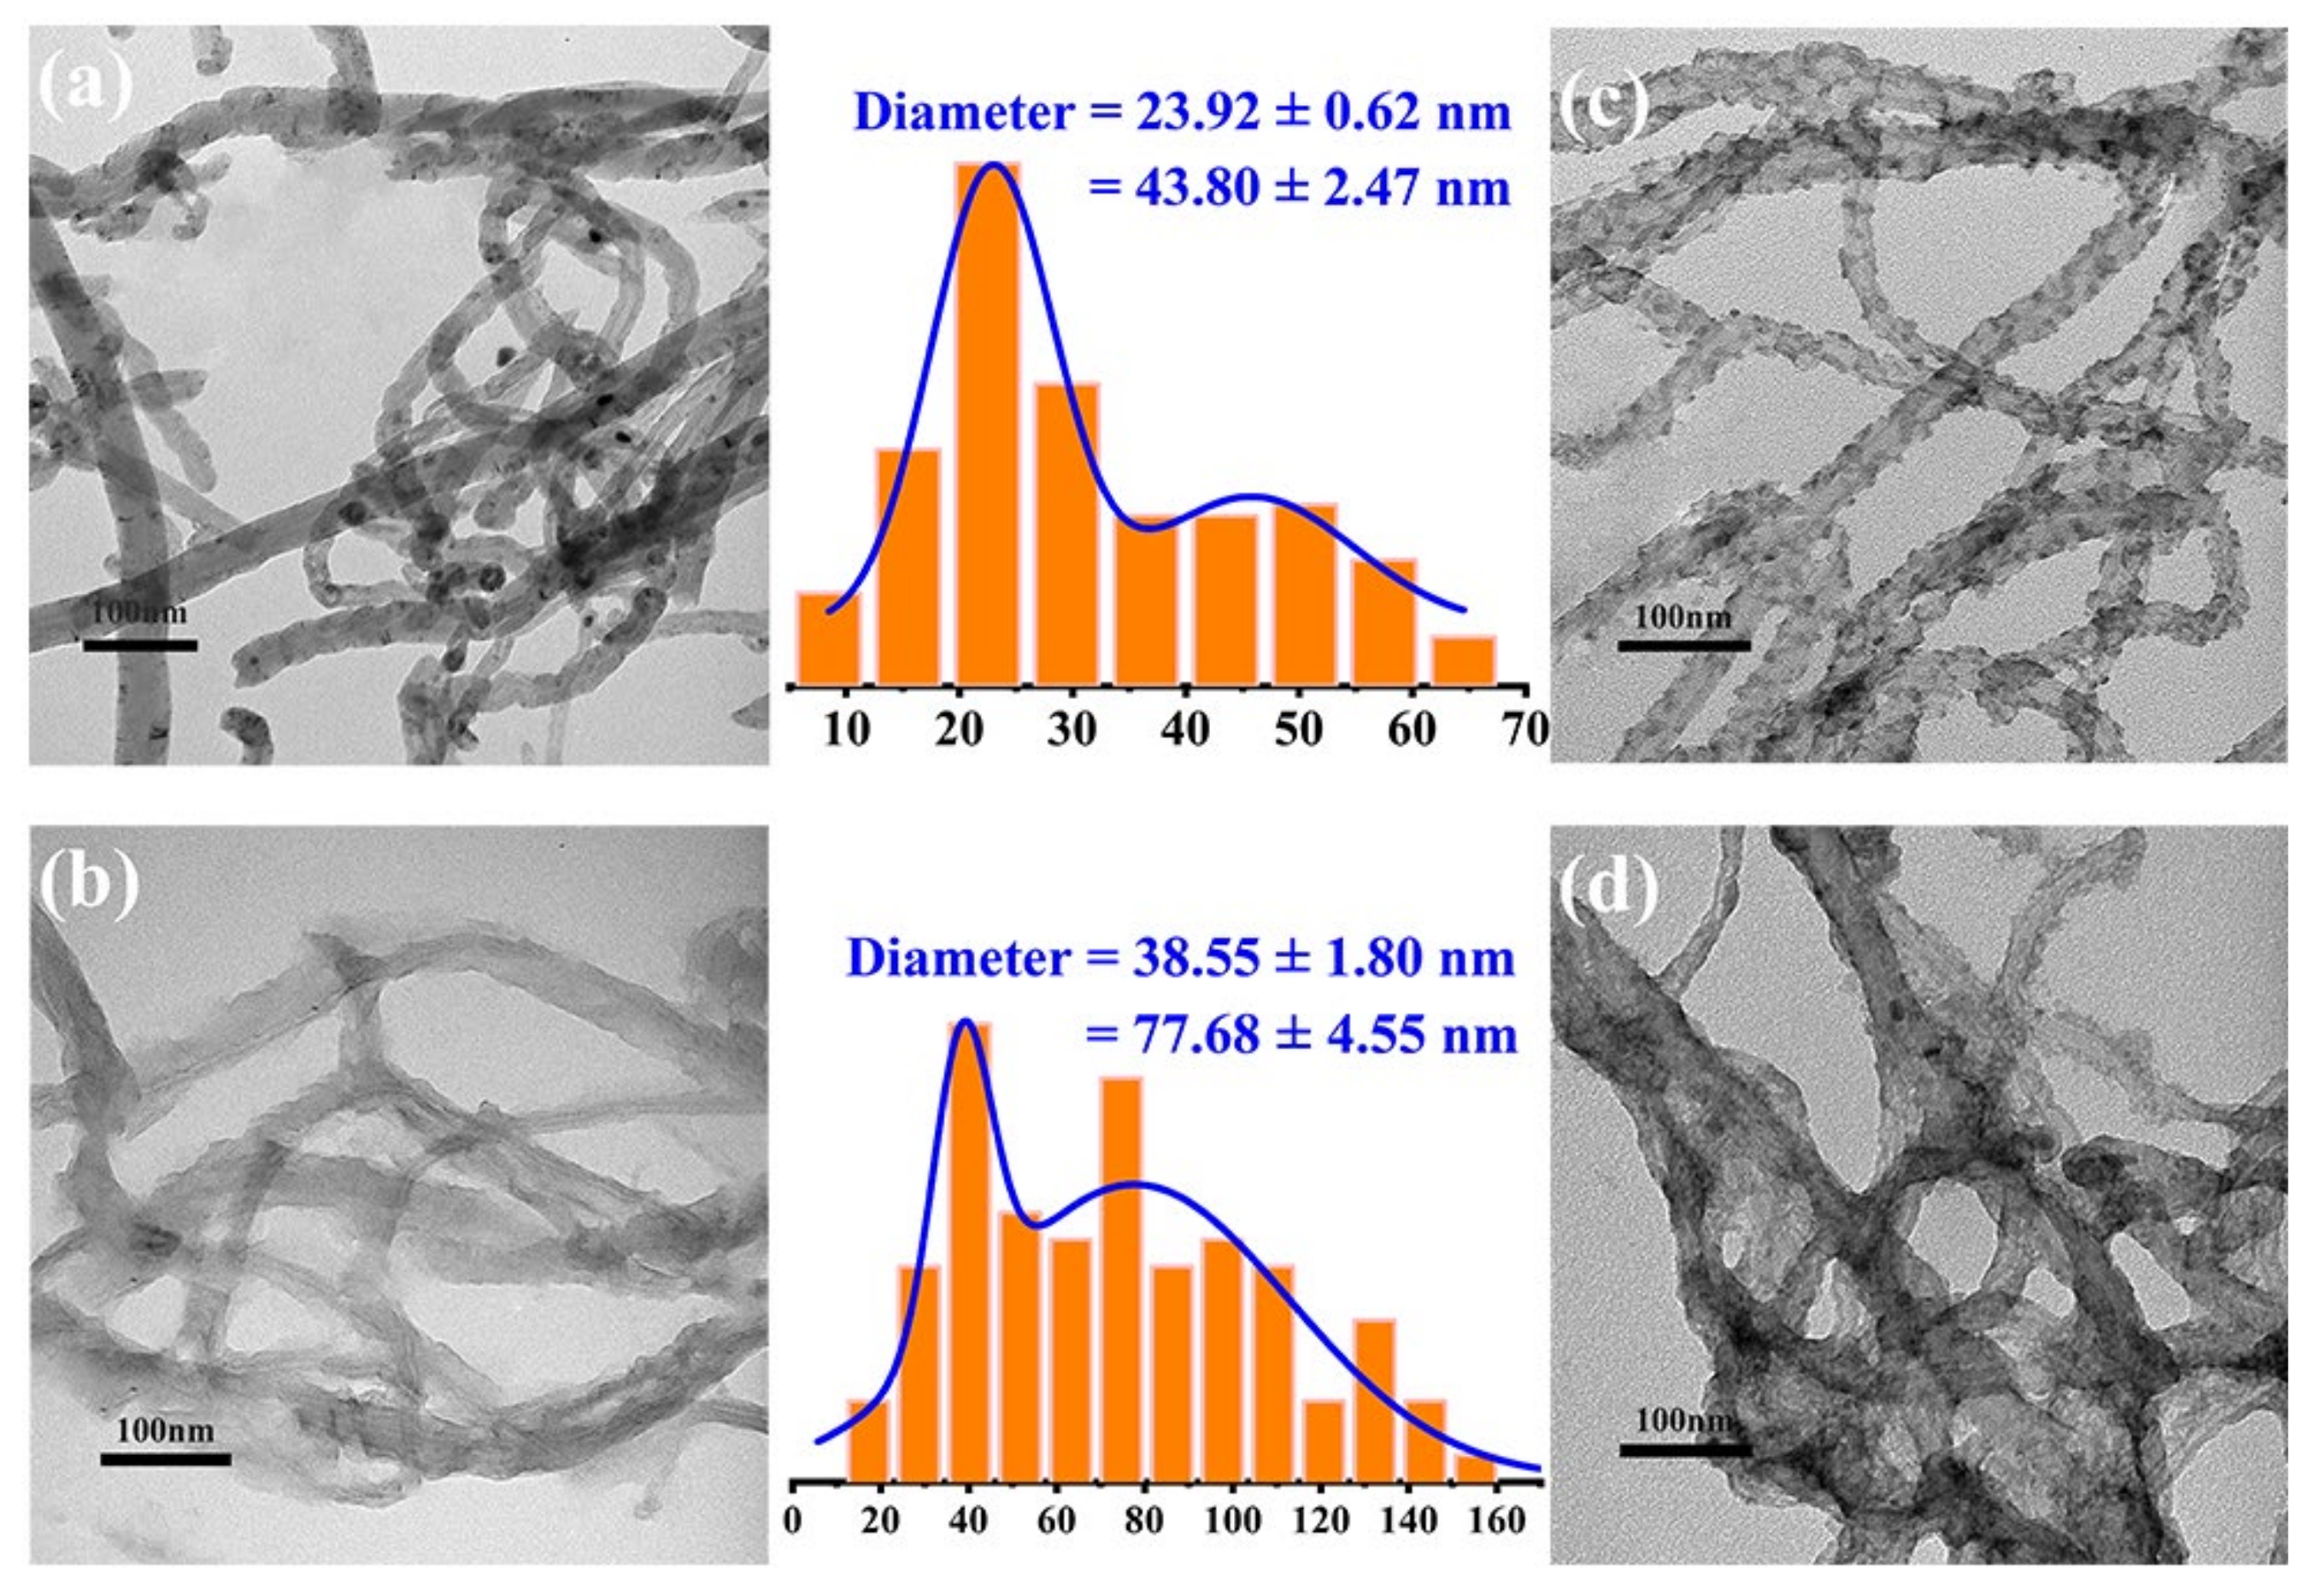
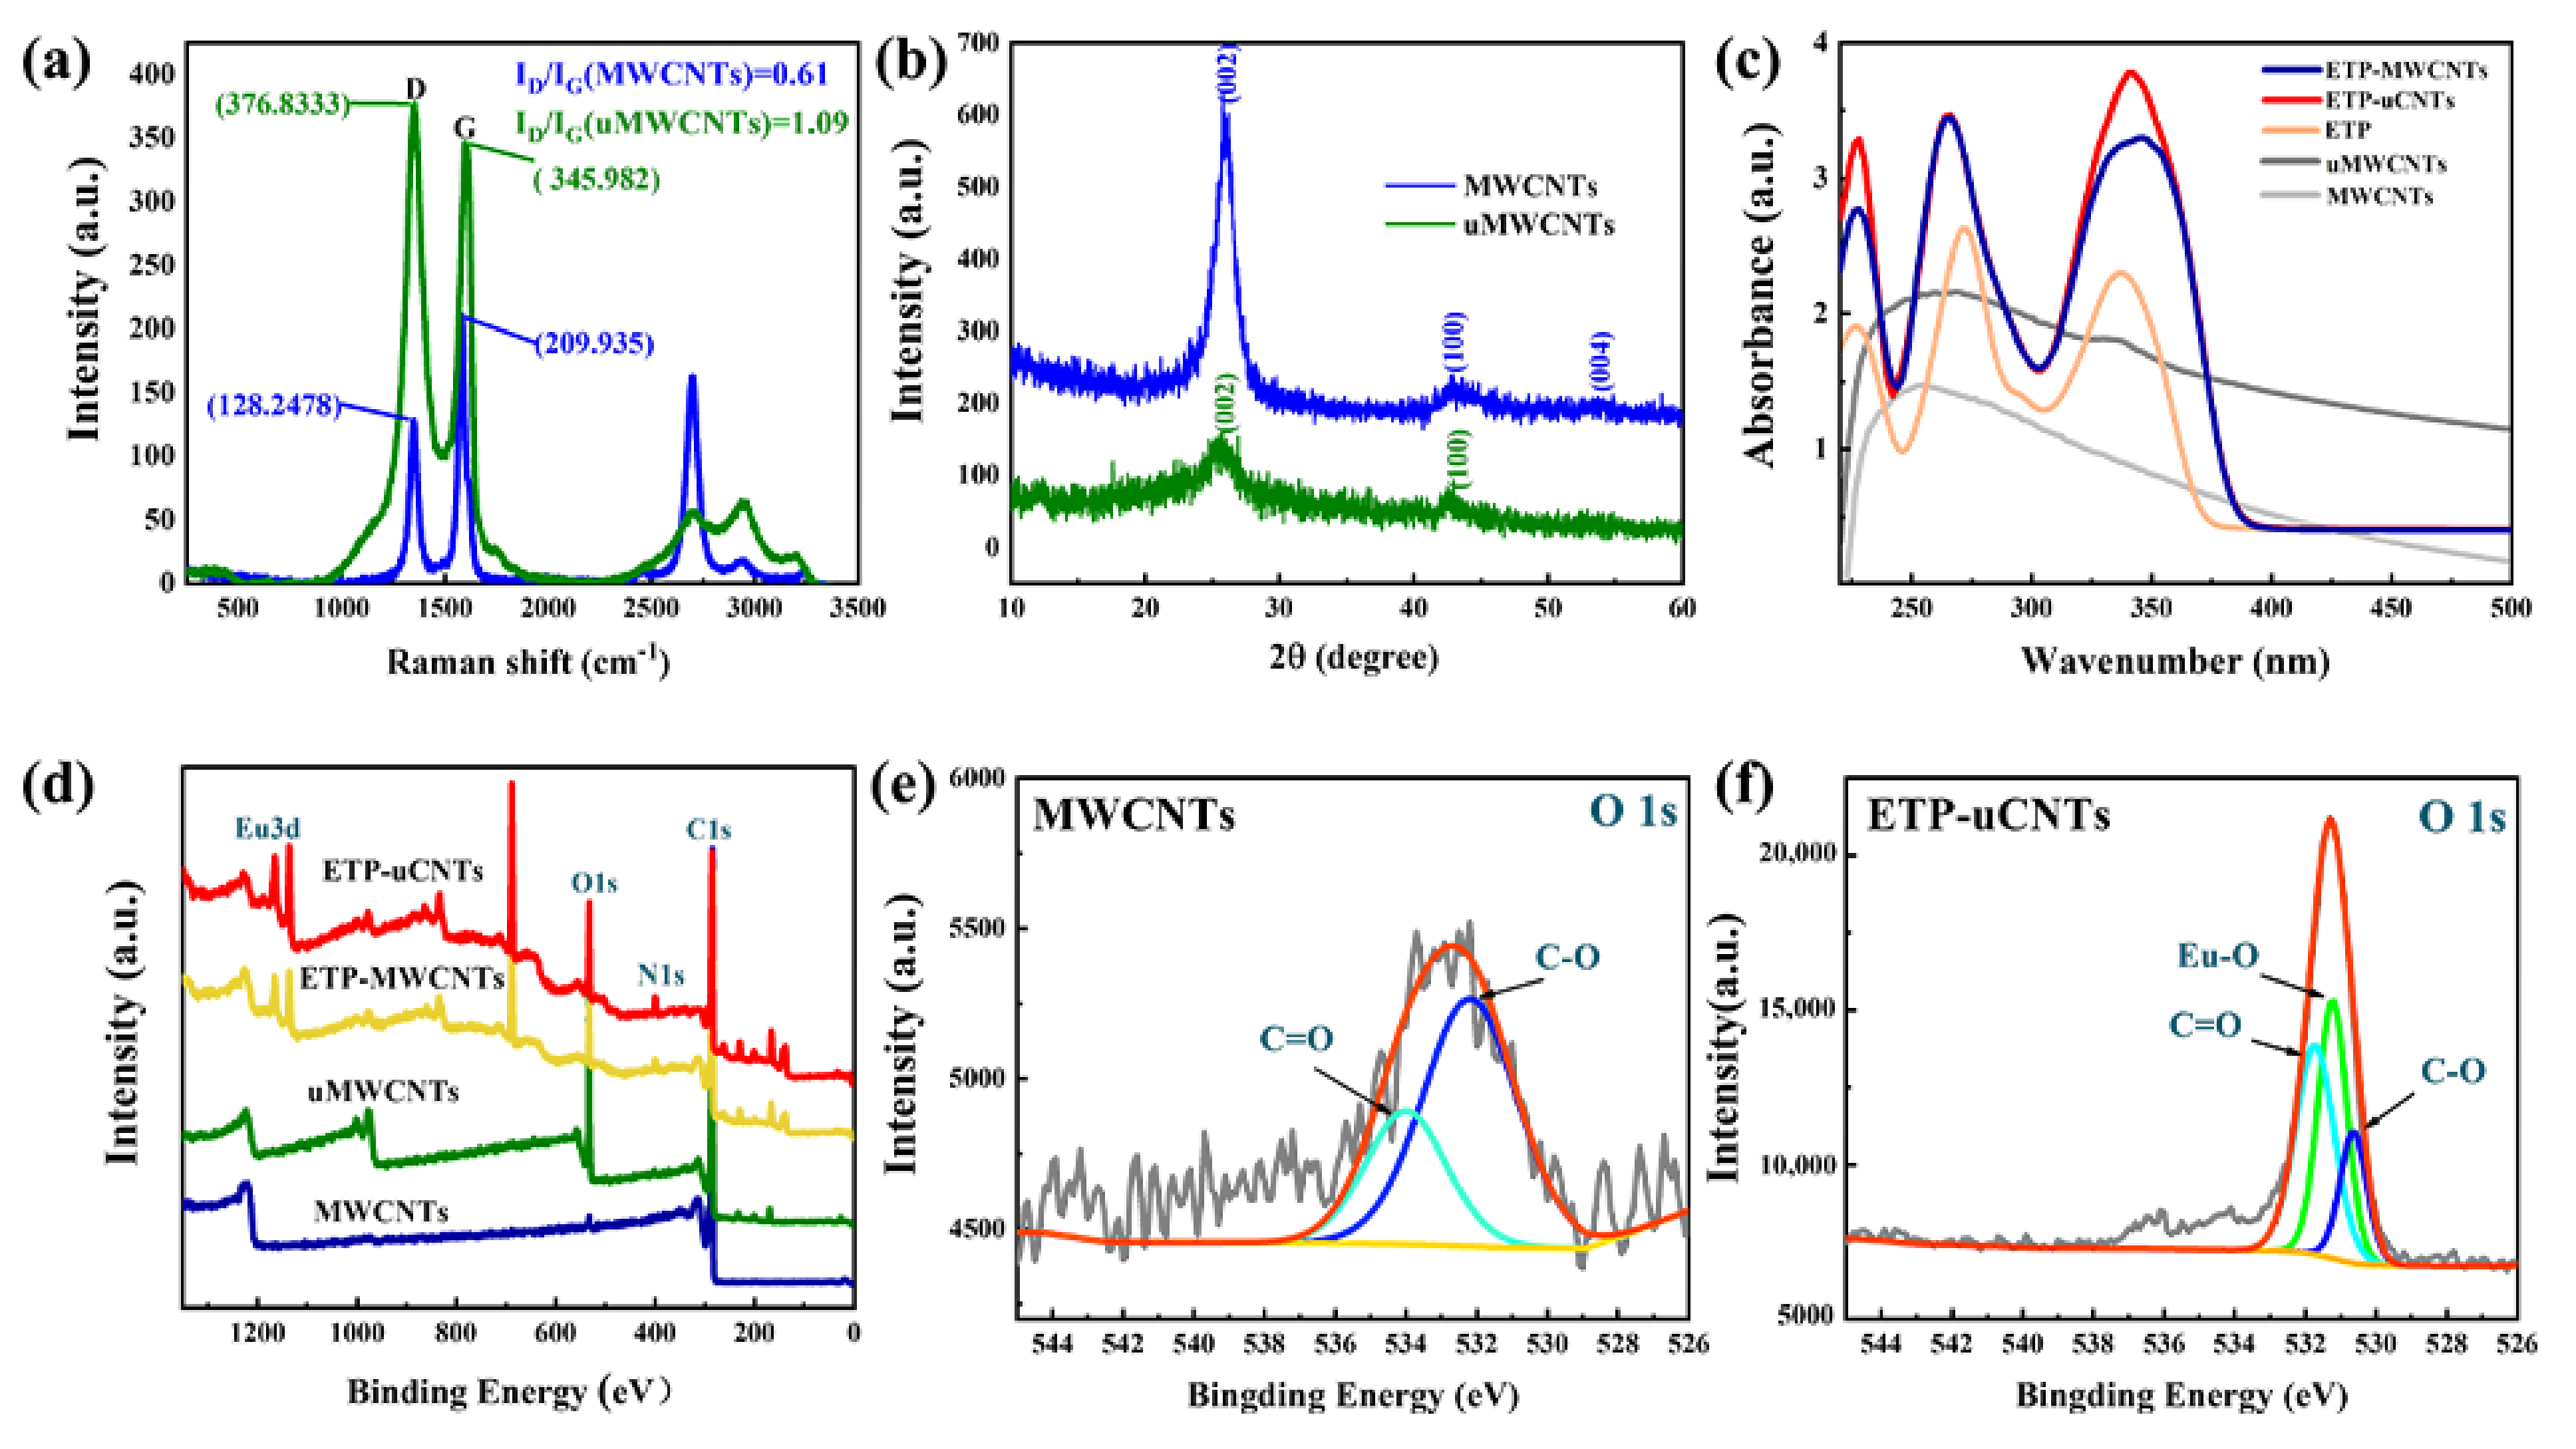
3.1. Morphology and Structure Analysis of ETP-uCNTs
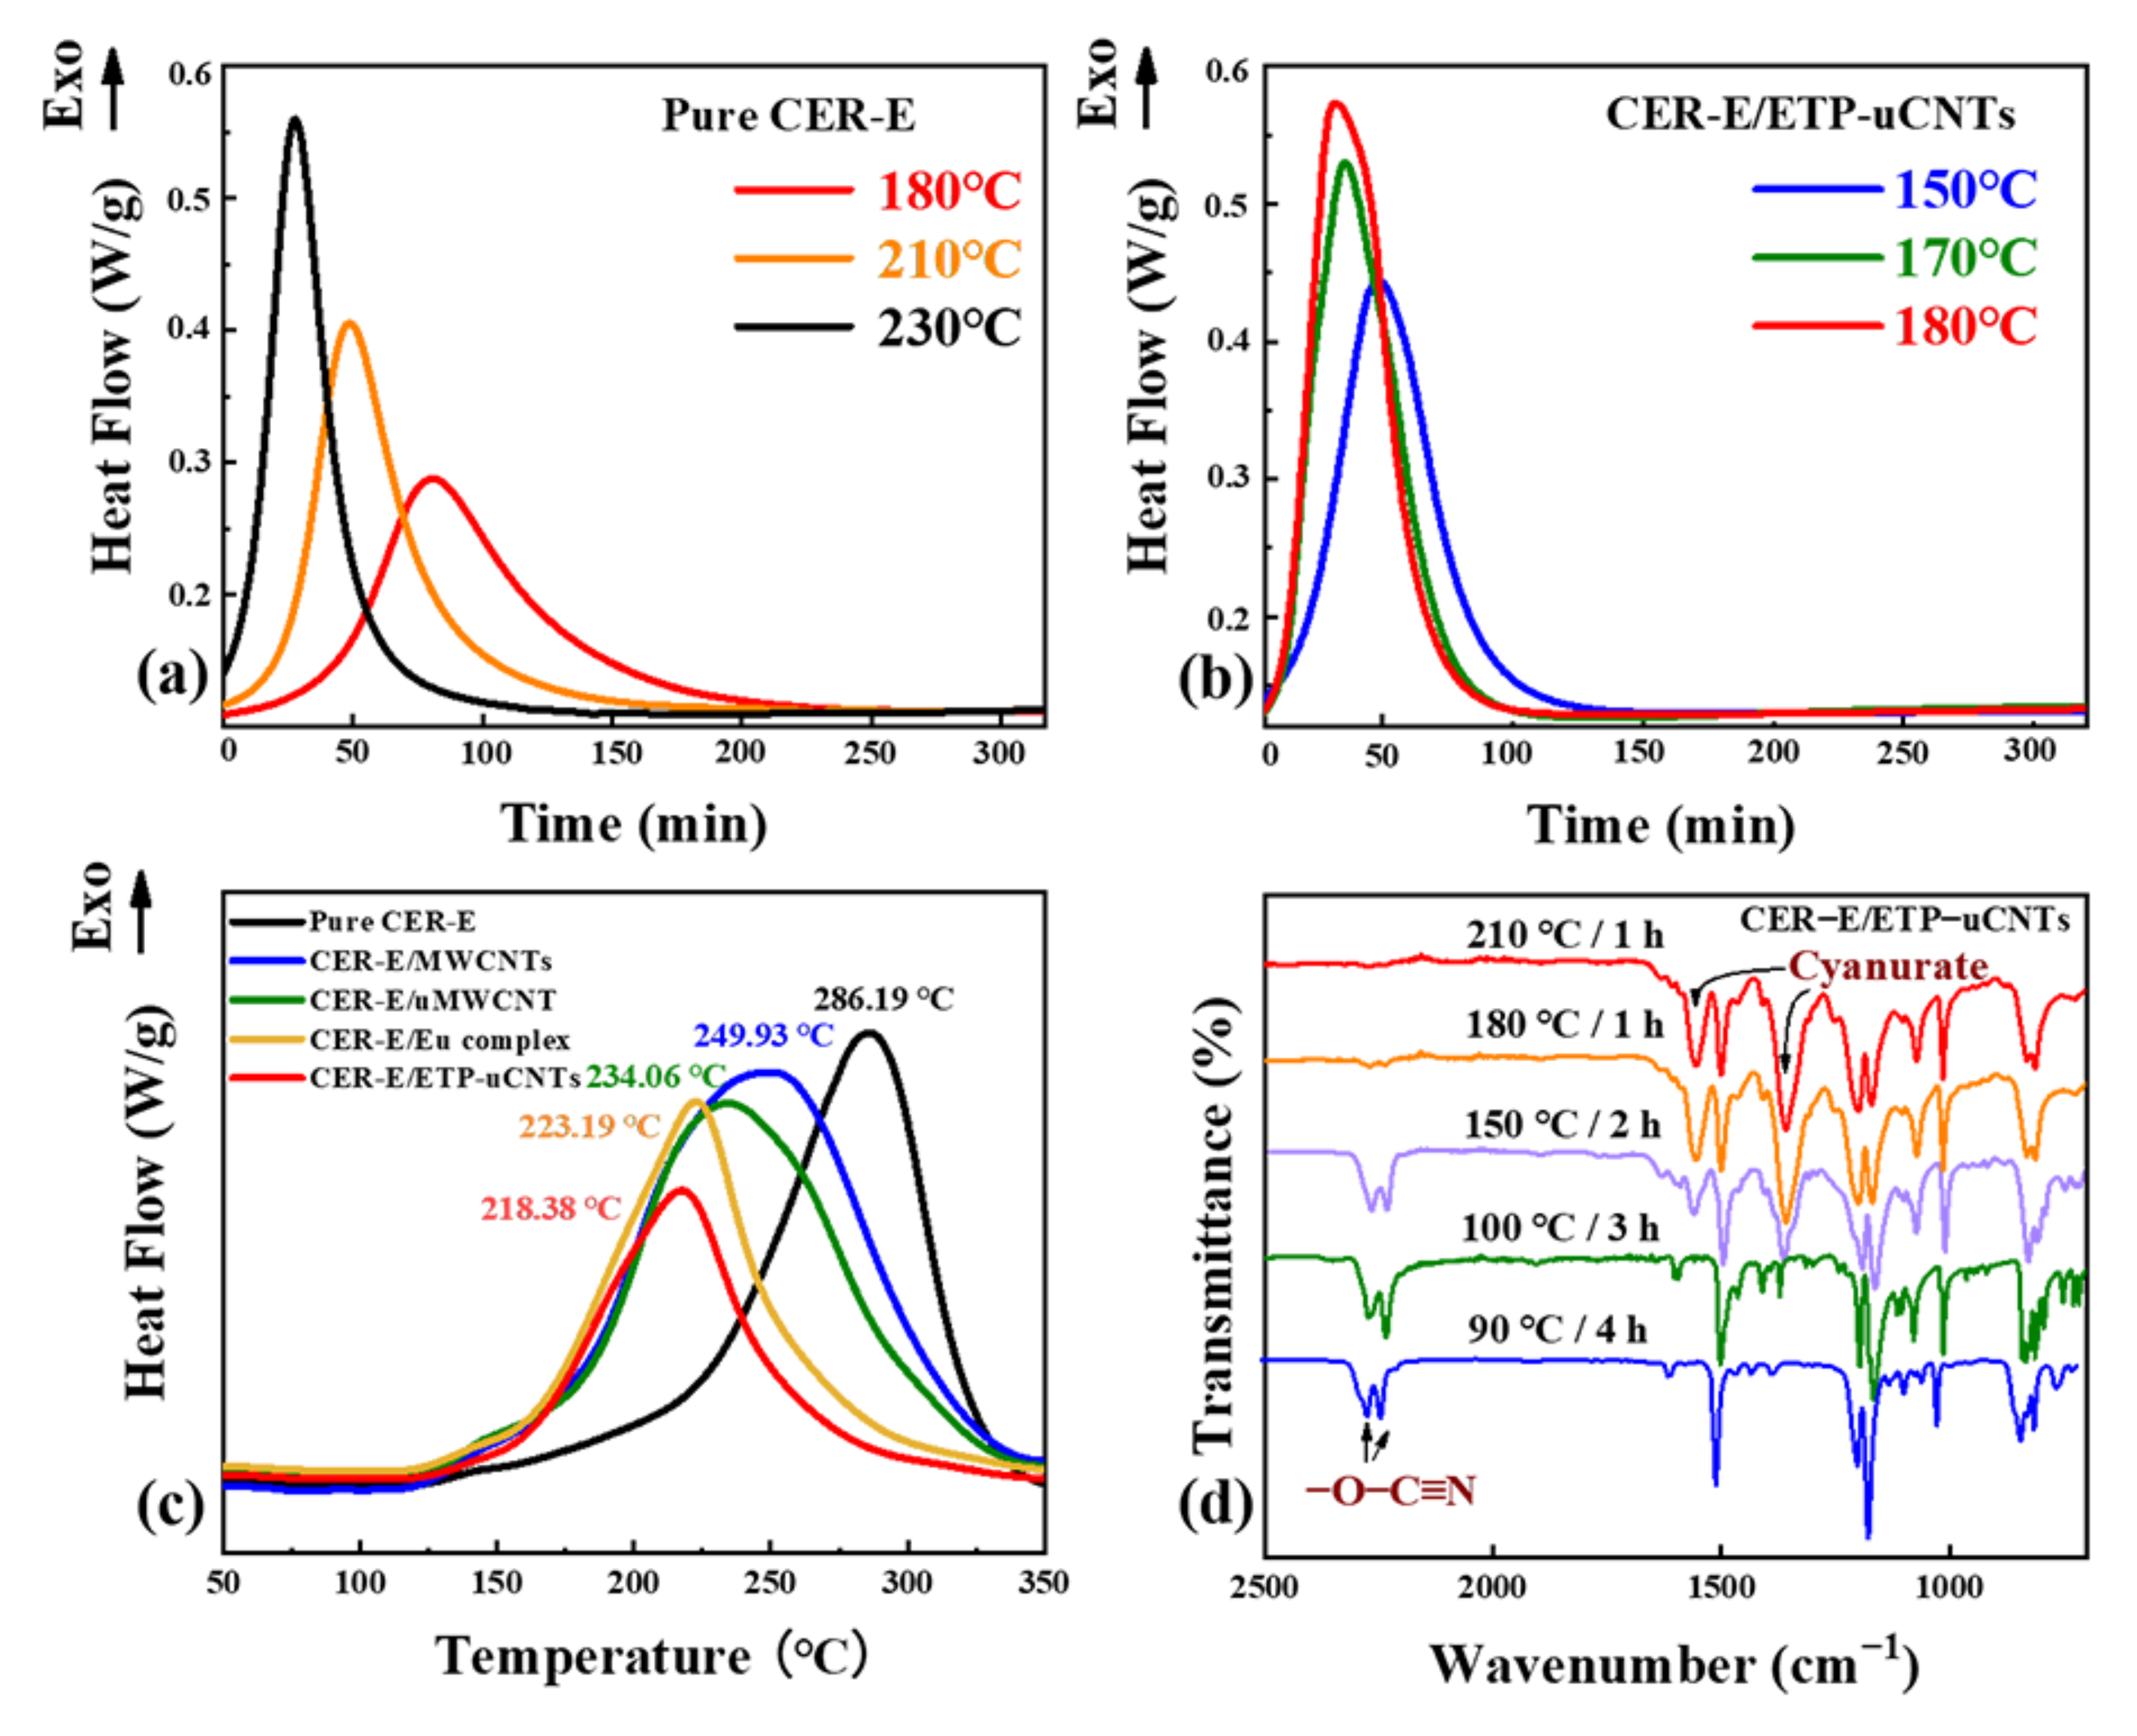
3.2. Curing Behavior of the CER-E Monomer
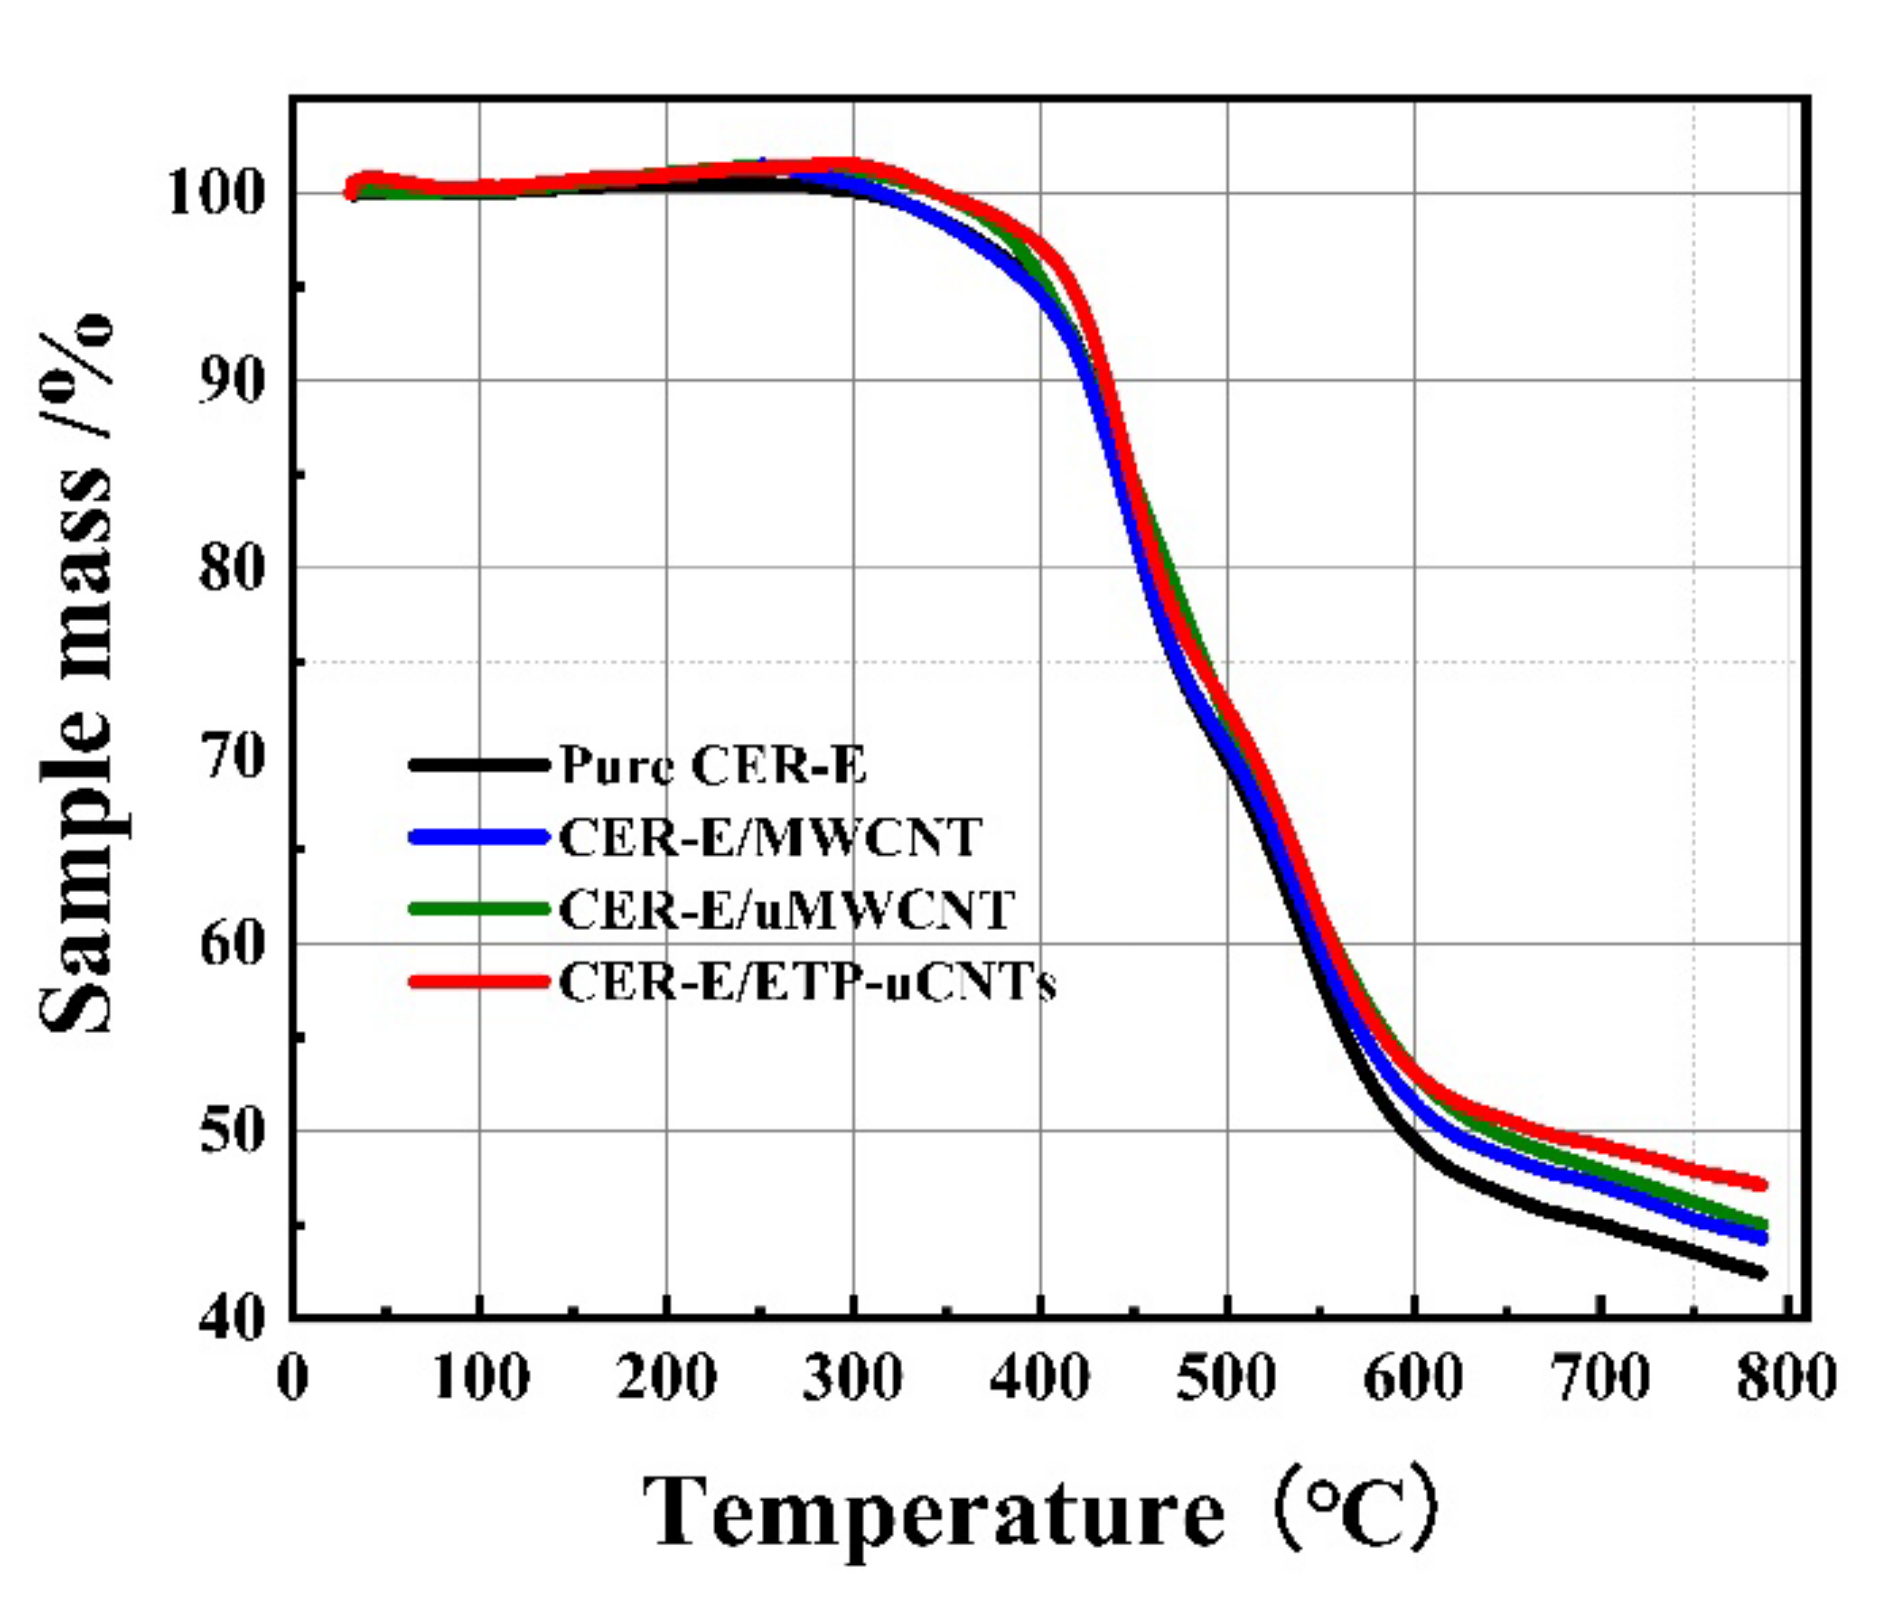
3.3. Thermal Stability of the CER-E-Based Hybrid Nanocomposites
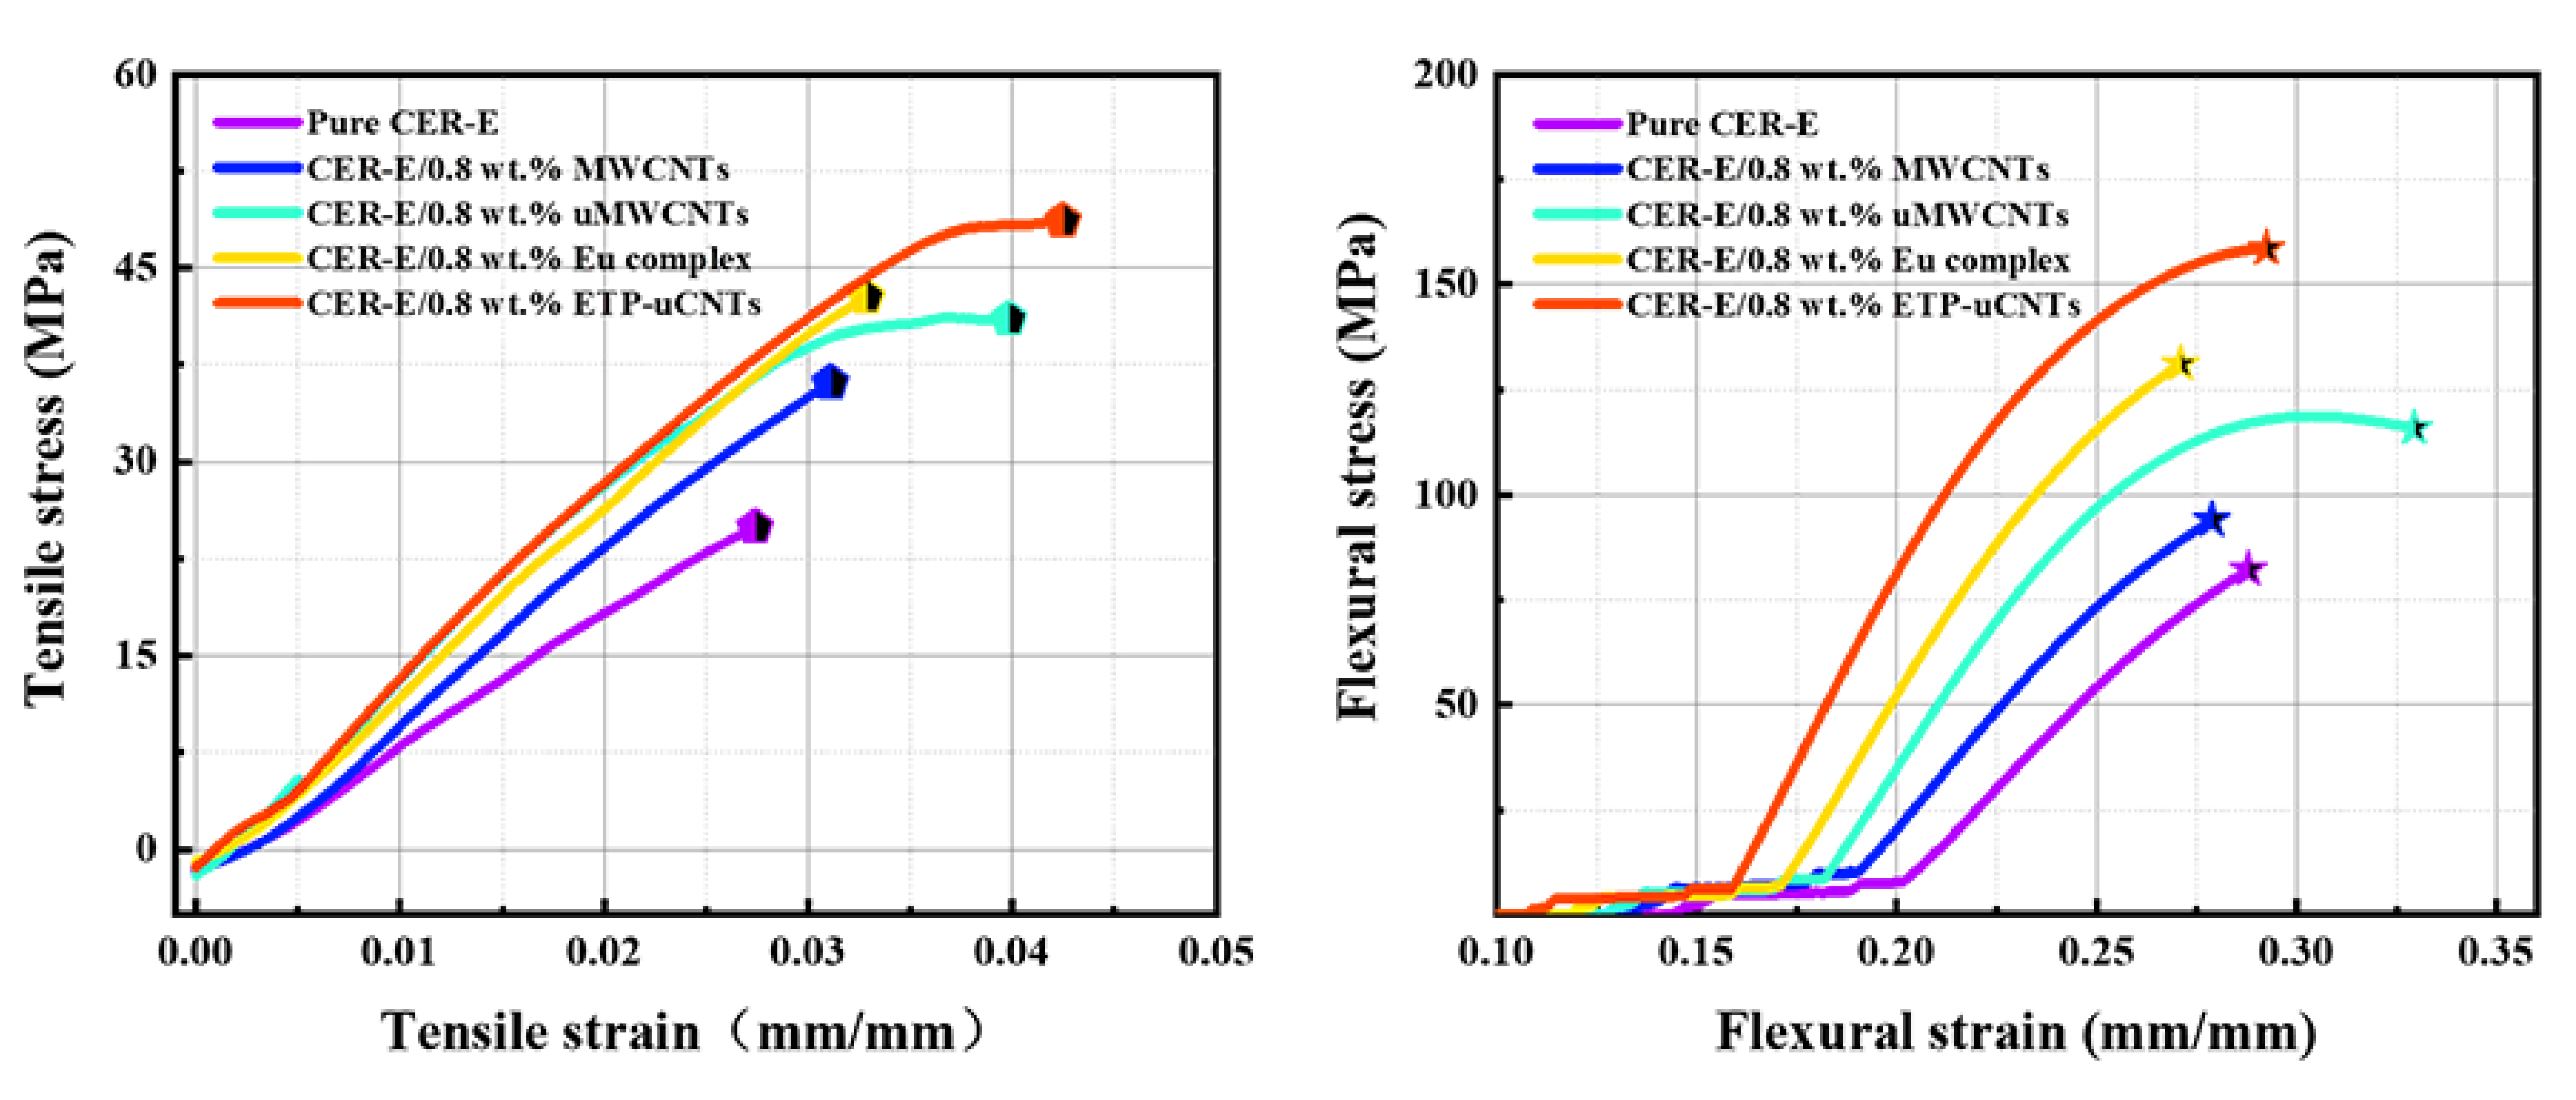
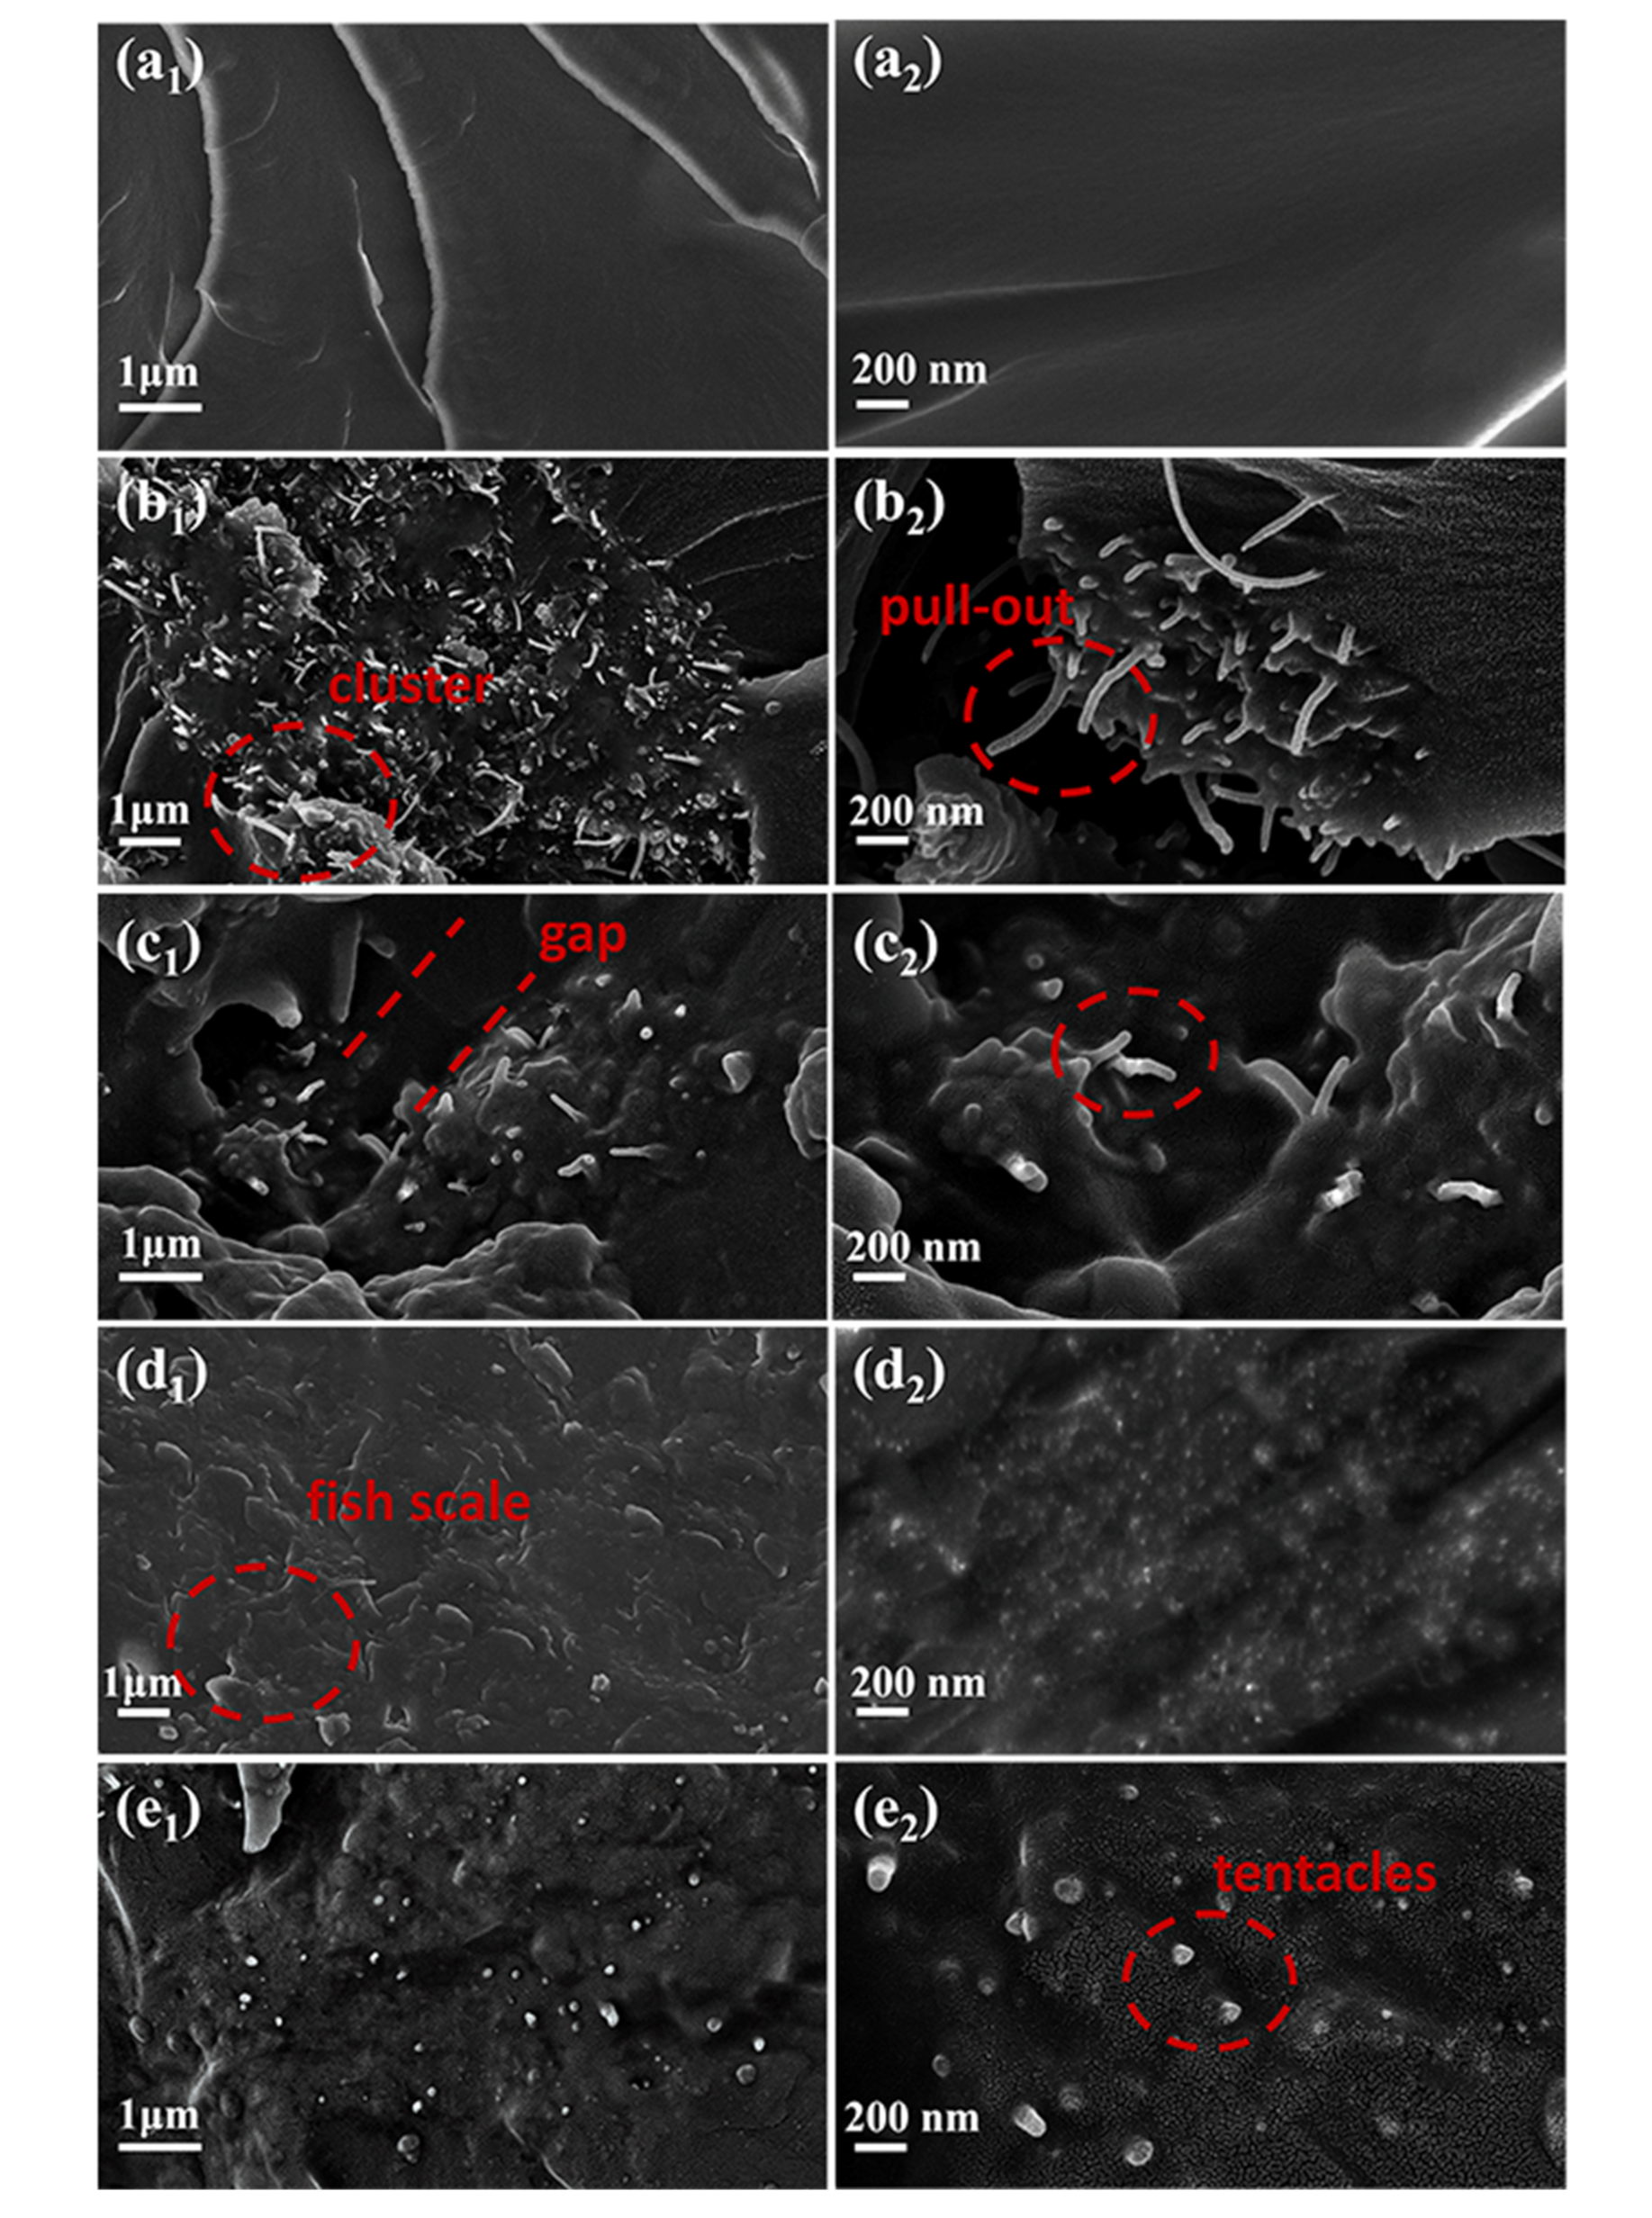
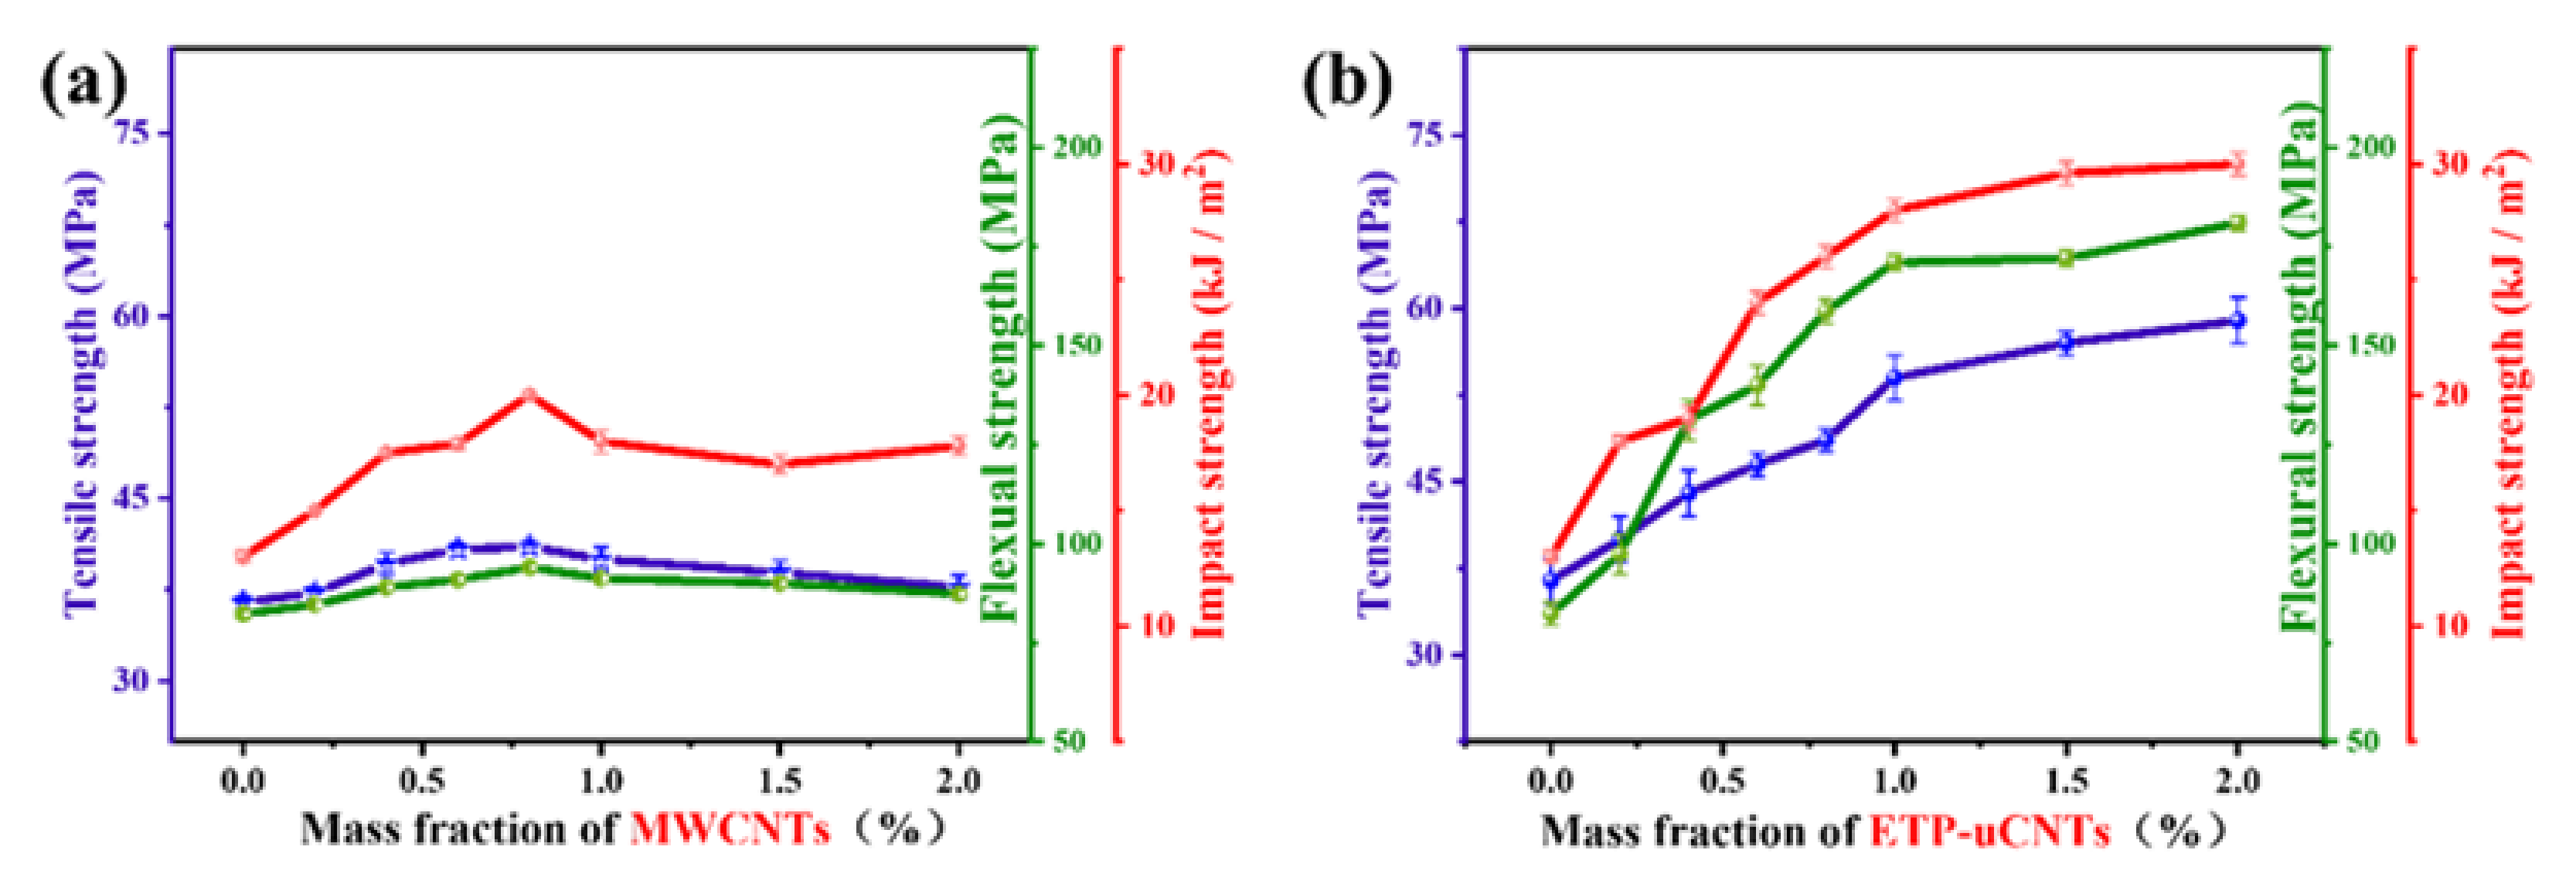
3.4. Mechanical Properties and Morphology (SEM Investigations) of the CER-Based Hybrid Nanocomposites
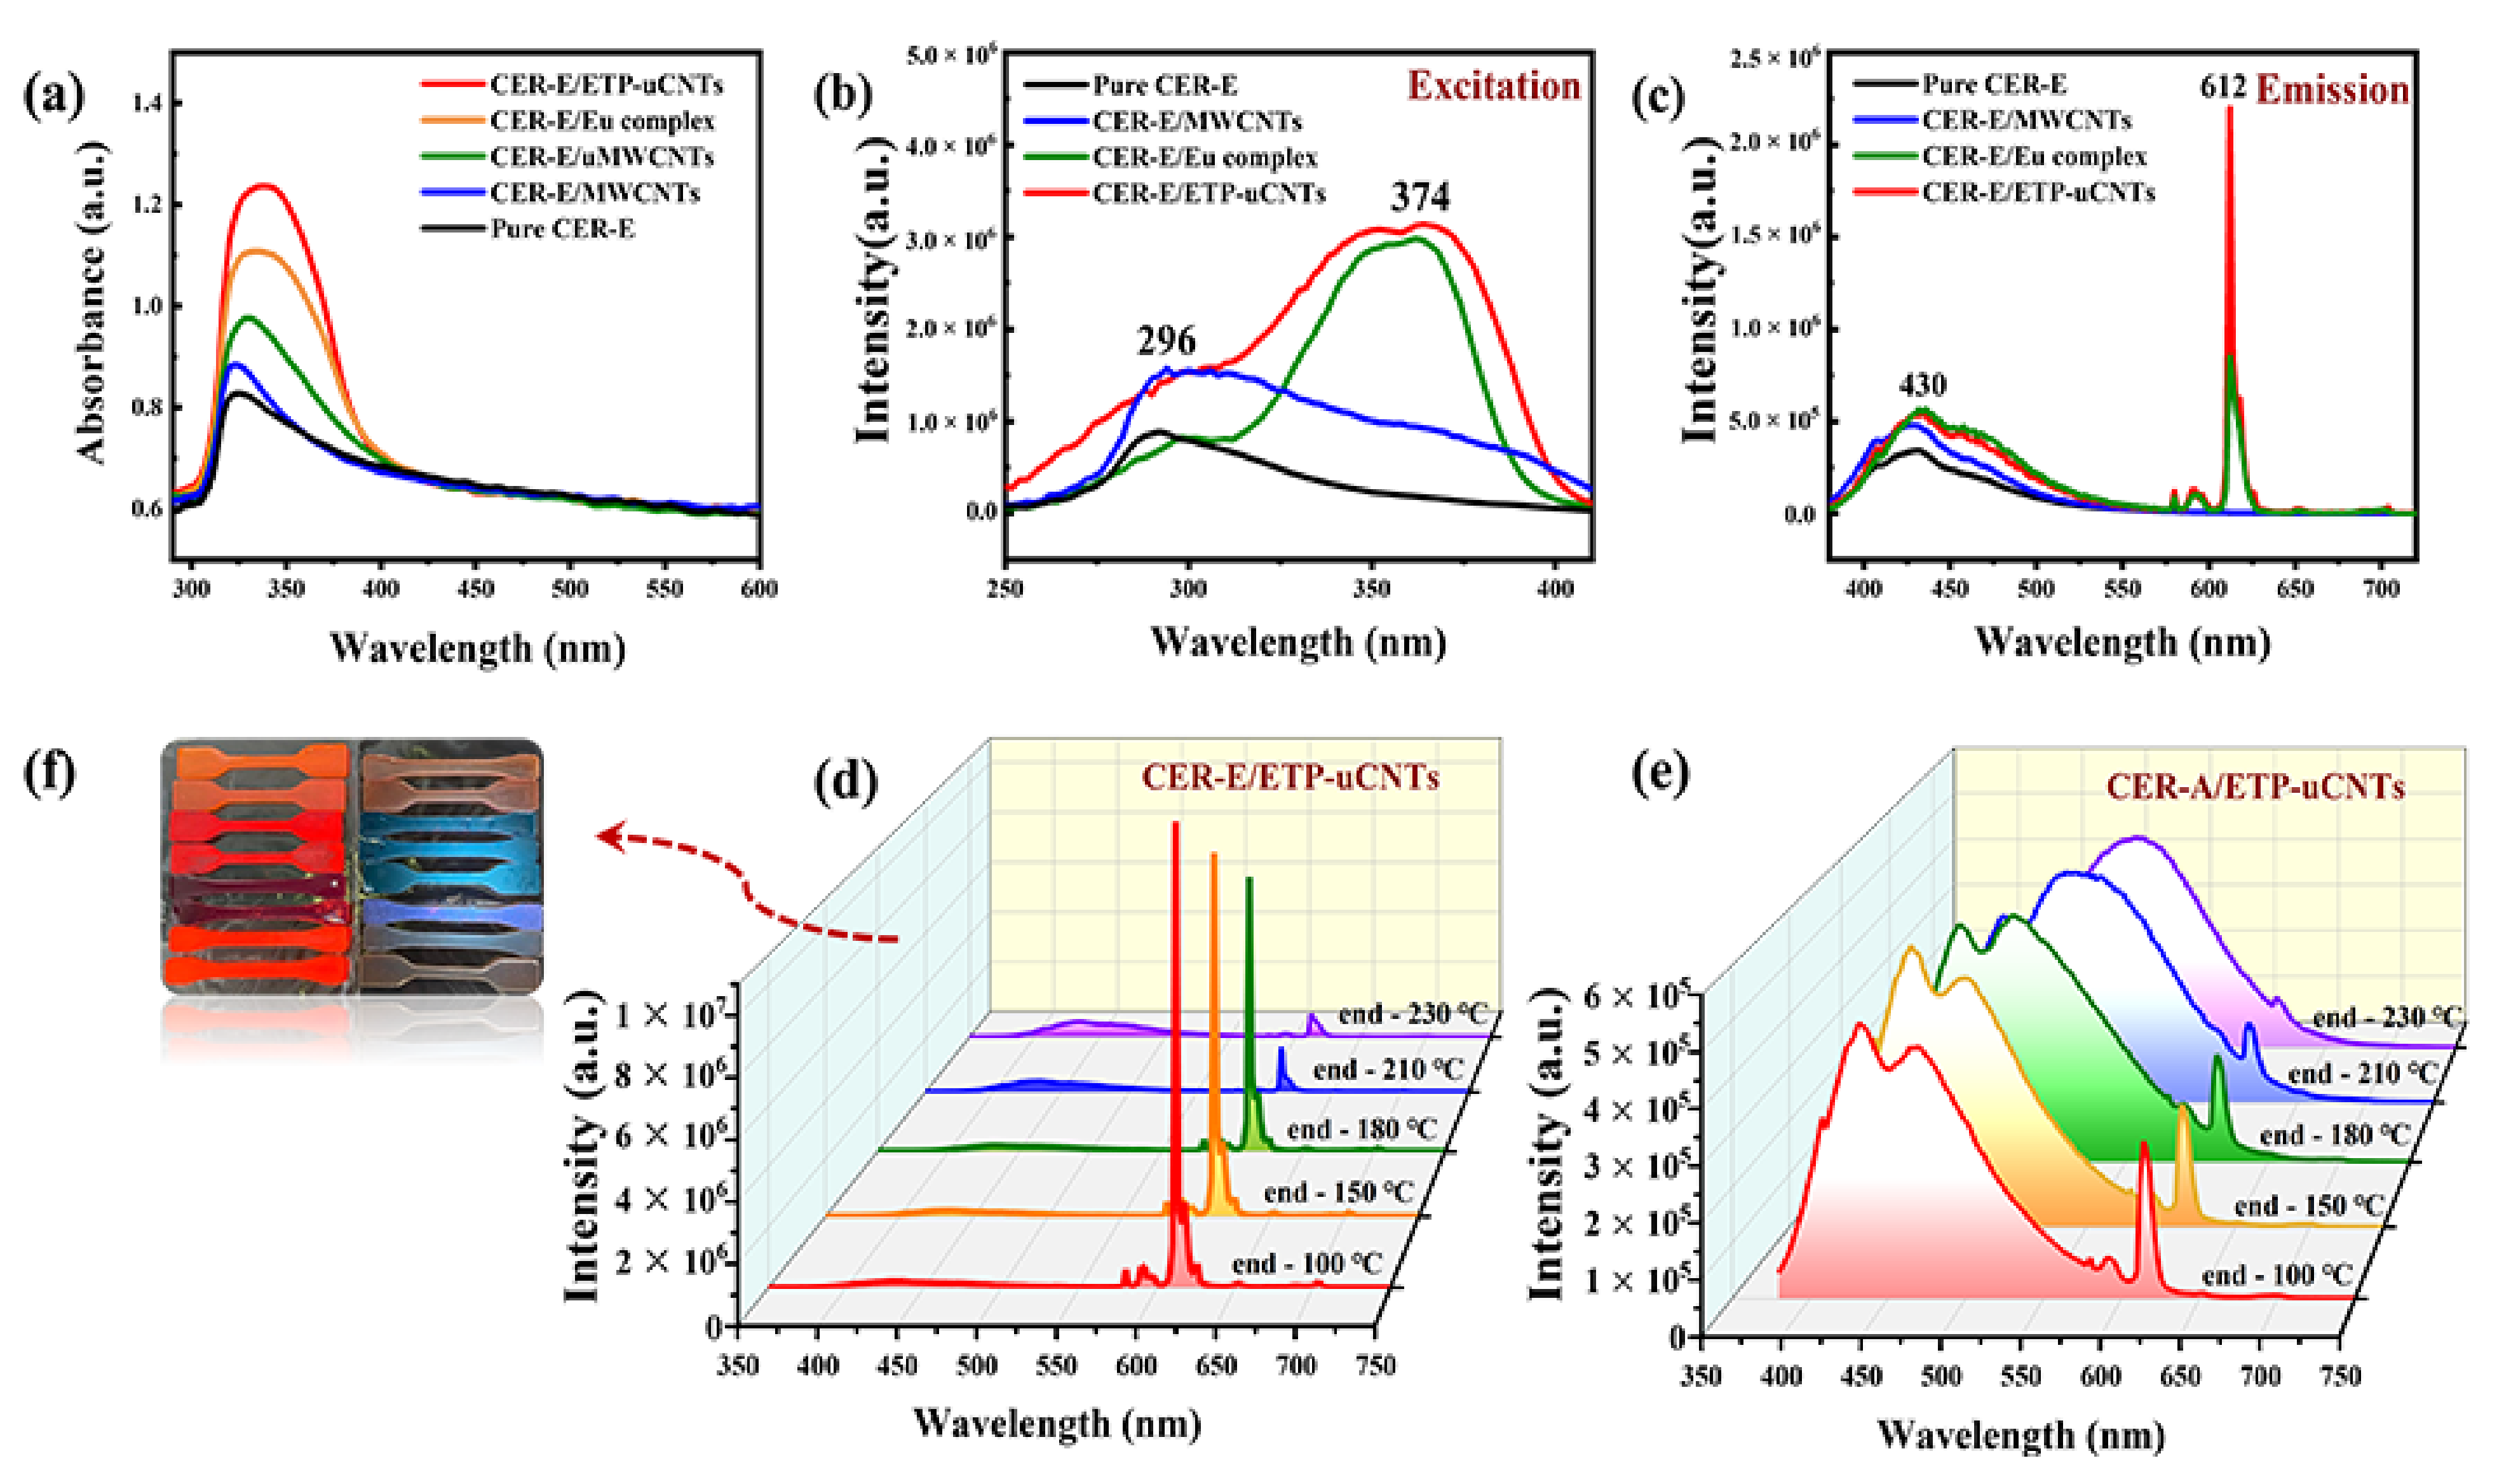
3.5. Fluorescence Characterization of CER-Based Hybrid Nanocomposites
4. Conclusions
Author Contributions
Funding
Institutional Review Board Statement
Informed Consent Statement
Data Availability Statement
Conflicts of Interest
References
- Hillermeier, R.W.; Hayes, B.S.; Seferis, J.C. Processing of highly elastomeric toughened cyanate esters through a modified resin transfer molding technique. Polym. Compos. 2010, 20, 155–165. [Google Scholar] [CrossRef]
- Dinakaran, K.; Alagar, M. Preparation and characterization of epoxy-cyanate ester interpenetrating network matrices/organoclay nanocomposites. Polym. Adv. Technol. 2003, 14, 574–585. [Google Scholar] [CrossRef]
- Gu, J.; Dong, W.; Tang, Y.; Guo, Y.; Guo, Z. Ultralow dielectric, fluoride-containing cyanate ester resins with improved mechanical properties and high thermal and dimensional stabilities. J. Mater. Chem. C 2017, 5, 6929–6936. [Google Scholar] [CrossRef]
- Bershtein, V.; Fainleib, A.; Yakushev, P.; Egorova, L.; Starostenko, O. Thermostable cyanate ester resins and POSS-containing nanocomposites: Influence of matrix chemical structure on their properties. Polym. Adv. Technol. 2015, 27, 339–349. [Google Scholar] [CrossRef]
- Kasehagen, L.J.; Macosko, C.W. Structure development in cyanate ester polymerization. Polym. Int. 1997, 44, 237–247. [Google Scholar] [CrossRef]
- Throckmorton, J.; Palmese, G. Acceleration of cyanate ester trimerization by dicyanamide RTILs. Polymer 2016, 91, 7–13. [Google Scholar] [CrossRef]
- Wu, S.J. Cure reaction and phase separation behavior of cyanate ester-cured epoxy/polyphenylene oxide blends. J. Appl. Polym. 2010, 102, 1139–1145. [Google Scholar] [CrossRef]
- Kosynkin, D.V.; Higginbotham, A.L.; Sinitskii, A.; Lomeda, J.R.; Tour, J.M. Longitudinal Unzipping of Carbon Nanotubes to Form Graphene Nanoribbons. Nature 2009, 458, 872–876. [Google Scholar] [CrossRef] [Green Version]
- Fan, J.; Shi, Z.; Tian, M.; Wang, J.; Yin, J. Unzipped multiwalled carbon nanotube oxide/multiwalled carbon nanotube hybrids for polymer reinforcement. ACS Appl. Mater. Interfaces 2012, 4, 5956–5965. [Google Scholar] [CrossRef]
- Coleman, J.N.; Cadek, M.; Ryan, K.P.; Fonseca, A.; Nagy, J.B.; Blau, W.J.; Ferreira, M.S. Reinforcement of polymers with carbon nanotubes. The role of an ordered polymer interfacial region. Experiment and modeling. Polymer 2006, 47, 8556–8561. [Google Scholar] [CrossRef]
- Wu, H.X.; Cao, W.M.; Wang, J.; Yang, H.; Yang, S.P. Coating multi-walled carbon nanotubes with rare-earth complexes by an insitu synthetic method. Nanotechnology 2008, 19, 345701. [Google Scholar] [CrossRef] [PubMed]
- Kodaira, C.A.; Brito, H.F.; Malta, O.L.; Serra, O.A. Luminescence and energy transfer of the europium (III) tungstate obtained via the Pechini method. J. Lumin. 2003, 101, 11–21. [Google Scholar] [CrossRef]
- Li, H.R.; Zhang, H.J.; Lin, J.; Wang, S.B.; Yang, K.Y. Preparation and luminescence properties of ormosil material doped with Eu(TTA)3phen complex. J. Non Cryst. Solids 2000, 278, 218–222. [Google Scholar] [CrossRef]
- Yang, N.; Qi, X.H.; Yang, D.; Chen, M.Y.; Wang, Y.; Huang, L.J.; Grygoryeva, O.; Strizhak, P.; Fainleib, A.; Tang, J.G. Improved Mechanical, Anti-UV Irradiation, and Imparted Luminescence Properties of Cyanate Ester Resin/Unzipped Multiwalled Carbon Nanotubes/Europium Nanocomposites. Materials 2021, 14, 4244. [Google Scholar] [CrossRef] [PubMed]
- Mahmoud, W.E.; Al-Hazmi, F.S.; Al-Harbi, G.H. Wall by wall controllable unzipping of MWCNTs via intercalation with oxalic acid to produce multilayers graphene oxide ribbon. Chem. Eng. J. 2015, 281, 192–198. [Google Scholar] [CrossRef]
- Grigoryeva, O.; Fainleib, A.; Gusakova, K.; Starostenko, O.; Saiter, J.M.; Levchenko, V.; Serghei, A.; Boiteux, G.; Grande, D. Nanoporous Polycyanurates Created by Chemically-Induced Phase Separation: Structure-Property Relationships. Macromol. Symp. 2014, 341, 57–66. [Google Scholar] [CrossRef]
- Miyauchi, Y.; Oba, M.; Maruyama, S. Cross-polarized optical absorption of single-walled nanotubes by polarized photoluminescence excitation spectroscopy. Phys. Rev. B 2006, 74, 205440. [Google Scholar] [CrossRef] [Green Version]
- Klonkowski, A.; Szalkowska, I.; Lis, S.; Pietraszkiewicz, M.; Hnatejko, Z. Luminescent materials consisting of Eu(III) ions complexed with cryptand ligand and coligands entrapped in xerogel matrices. J. Lumin. 2005, 115, 122–130. [Google Scholar] [CrossRef]
- Arumugam, V.; Kanthapazham, R.; Zherebtsov, D.A.; Kalimuthu, K.; Muthukaruppan, A. Fluorine free TiO2/cyanate ester coated cotton fabric with low surface free energy and rough surface for durable oil–water separation. Cellulose 2021, 28, 4847–4863. [Google Scholar] [CrossRef]
- Reams, J.T.; Guenthner, A.J.; Lamison, K.R.; Vij, V.; Lubin, L.M.; Mabry, J.M. Effect of Chemical Structure and Network Formation on Physical Properties of Di(Cyanate Ester) Thermosets. ACS Appl. Mater. Interfaces 2012, 4, 527–535. [Google Scholar] [CrossRef]
- Wang, X.; Jin, J.; Song, M. Cyanate ester resin/graphene nanocomposite: Curing dynamics and network formation. Eur. Polym. J. 2012, 48, 1034–1041. [Google Scholar] [CrossRef]
- Lei, Z.; Xiao, H. Autocatalytic curing kinetics of thermosetting polymers: A new model based on temperature dependent reaction orders. Polymer 2010, 51, 3814–3820. [Google Scholar]
- Simon, S.L.; Gillham, J.K. Cure kinetics of a thermosetting liquid dicyanate ester monomer/high-Tg polycyanurate material. J. Appl. Polym. Sci. 1993, 47, 461–485. [Google Scholar] [CrossRef]
- Chen, F.; Yuan, L.; Gu, A.; Lin, C.; Liang, G. Low-temperature cure high-performance cyanate ester resins/microencapsulated catalyst systems. Polym. Eng. Sci. 2013, 53, 1871–1877. [Google Scholar] [CrossRef]
- Badrinarayanan, P.; Leonard, J.; Kessler, M.R. Enhanced Reaction Kinetics and Impact Strength of Cyanate Ester Reinforced with Multiwalled Carbon Nanotubes. J. Nanosci. 2011, 11, 3970. [Google Scholar] [CrossRef]
- Shu, W.J.; Yang, B.Y.; Chin, W.K.; Perng, L.H. Synthesis and Properties of Novel Phosphorus-containing Bismaleimide/Epoxy Resins. J. Appl. Polym. 2010, 84, 2080–2089. [Google Scholar] [CrossRef] [Green Version]
- Maggioni, G.; Campagnaro, A.; Tonezzer, M.; Carturan, S.; Quaranta, A. Deposition and Characterization of Luminescent Eu(tta)3phen-Doped Parylene-Based Thin-Film Materials. ChemPhysChem 2013, 14, 1853–1863. [Google Scholar] [CrossRef]
- Teng, X.; Wang, F.; Jia, Q.; Xiang, C. Fluorescence Properties of Bio-based PA/Eu (TTA)3phen Fibers. IOP Conf. Ser. Earth Environ. Sci. 2019, 295, 032089. [Google Scholar] [CrossRef]
- Jiang, M.R.; Zhou, H.; Cheng, X.H. Effect of rare earth surface modification of carbon nanotubes on enhancement of interfacial bonding of carbon nanotubes reinforced epoxy matrix composites. J. Mater. Sci. 2019, 54, 10235–10248. [Google Scholar] [CrossRef]
- Priya, S.P.; Ramakrishna, H.V.; Rai, K.S. Utilization of Waste Silk Fabric as Reinforcement in Epoxy Phenol Cashew Nut Shell Liquid Toughened Epoxy Resin: Studies on Mechanical Properties. J. Compos. Mater. 2005, 40, 1301–1311. [Google Scholar] [CrossRef]
- Chen, J.K.; Huang, Z.P.; Zhu, J. Size effect of particles on the damage dissipation in nanocomposites. Compos. Sci. Technol. 2007, 67, 2990–2996. [Google Scholar] [CrossRef]
- Su, F.K.; Hong, J.L.; Liao, G.F.; Lin, L.L.; Hwang, G.L.; Day, T.C. Photoluminescent carbon nanocapsule/polycyanate composites with hydrogen bond interactions. J. Appl. Polym. 2010, 100, 3784–3788. [Google Scholar] [CrossRef]
- Singh, A.K.; Singh, S.K.; Mishra, H.; Prakash, R.; Rai, S.B. Structural, Thermal, and Fluorescence Properties of Eu(DBM)3Phenx Complex Doped in PMMA. J. Phys. Chem. B 2010, 114, 13042–13051. [Google Scholar] [CrossRef] [PubMed]
- Xu, Y.Z.E.; Sung, C.S.P. Fluorescence characterization of model compounds for cyanate monomers, cure intermediates, and cure product. Macromolecules 2003, 36, 2553–2555. [Google Scholar] [CrossRef]
- Lan, Y.; Zhou, L.; Ying, H.; Tang, Z. Ag-catalyzed synthesis of europium borate Eu(BO2)3 nanowires, growth mechanism and luminescent properties. Mater. Res. Bull. 2011, 46, 239–243. [Google Scholar]
- Xu, S.J.; Ren, W.T.; Zhang, Y.; Zhang, Y.X. Study on the preparation of Eu(Pht)3Phen/SBA-15 hybrids and photoluminescence properties of silicone rubber composites with the hybrids. J. Appl. Polym. 2013, 128, 2375–2384. [Google Scholar] [CrossRef]


| Samples | C (%) | O (%) | O/C | Eu (%) | F (%) |
|---|---|---|---|---|---|
| MWCNTs | 97.81 | 2.19 | 0.0224 | / | / |
| uMWCNTs | 74.01 | 25.99 | 0.3512 | / | / |
| ETP-MWCNTs | 81.39 | 11.07 | 0.1360 | 0.84 | 6.70 |
| ETP-uCNTs | 69.13 | 12.81 | 0.1853 | 1.76 | 16.30 |
| Sample | Tmax (°C) 1 | ΔHf (J·g−1) 2 | ΔEa (kJ·mol−1) 3 |
|---|---|---|---|
| Pure CER-E | 286.2 | 531 | 95.7 |
| CER-E/MWCNTs | 249.9 | 504 | 92.9 |
| CER-E/uMWCNTs | 234.1 | 439 | 92.2 |
| CER-E/Eu complex | 223.2 | 432 | 91.1 |
| CER-E/ETP-uCNTs | 218.4 | 318 | 88.7 |
| Sample | Td onset (°C) 1 | Td 10% (°C) 2 | Char yield at 800 °C (%) |
|---|---|---|---|
| Pure CER-E | 339.9 | 423.5 | 42.4 |
| CER-E/MWCNTs | 371.3 | 425.4 | 44.3 |
| CER-E/uMWCNTs | 376.1 | 427.4 | 45.0 |
| CER-E/ETP-uCNTs | 393.4 | 436.0 | 47.1 |
Publisher’s Note: MDPI stays neutral with regard to jurisdictional claims in published maps and institutional affiliations. |
© 2022 by the authors. Licensee MDPI, Basel, Switzerland. This article is an open access article distributed under the terms and conditions of the Creative Commons Attribution (CC BY) license (https://creativecommons.org/licenses/by/4.0/).
Share and Cite
Hu, Z.; Zhao, D.; Wang, Y.; Huang, L.; Wang, S.; Mao, S.; Grigoryeva, O.; Strizhak, P.; Fainleib, A.; Tang, J. The Created Excellent Thermal, Mechanical and Fluorescent Properties by Doping Eu3+-Complex-Anchored Carbon Nanotubes in Polycyanate Resins. Nanomaterials 2022, 12, 2040. https://doi.org/10.3390/nano12122040
Hu Z, Zhao D, Wang Y, Huang L, Wang S, Mao S, Grigoryeva O, Strizhak P, Fainleib A, Tang J. The Created Excellent Thermal, Mechanical and Fluorescent Properties by Doping Eu3+-Complex-Anchored Carbon Nanotubes in Polycyanate Resins. Nanomaterials. 2022; 12(12):2040. https://doi.org/10.3390/nano12122040
Chicago/Turabian StyleHu, Ziyao, Dong Zhao, Yao Wang, Linjun Huang, Shichao Wang, Sui Mao, Olga Grigoryeva, Peter Strizhak, Alexander Fainleib, and Jianguo Tang. 2022. "The Created Excellent Thermal, Mechanical and Fluorescent Properties by Doping Eu3+-Complex-Anchored Carbon Nanotubes in Polycyanate Resins" Nanomaterials 12, no. 12: 2040. https://doi.org/10.3390/nano12122040
APA StyleHu, Z., Zhao, D., Wang, Y., Huang, L., Wang, S., Mao, S., Grigoryeva, O., Strizhak, P., Fainleib, A., & Tang, J. (2022). The Created Excellent Thermal, Mechanical and Fluorescent Properties by Doping Eu3+-Complex-Anchored Carbon Nanotubes in Polycyanate Resins. Nanomaterials, 12(12), 2040. https://doi.org/10.3390/nano12122040