
Label-Free Morpho-Molecular Imaging for Studying the Differential Interaction of Black Phosphorus with Tumor Cells

 , , , ,
  , and
, and 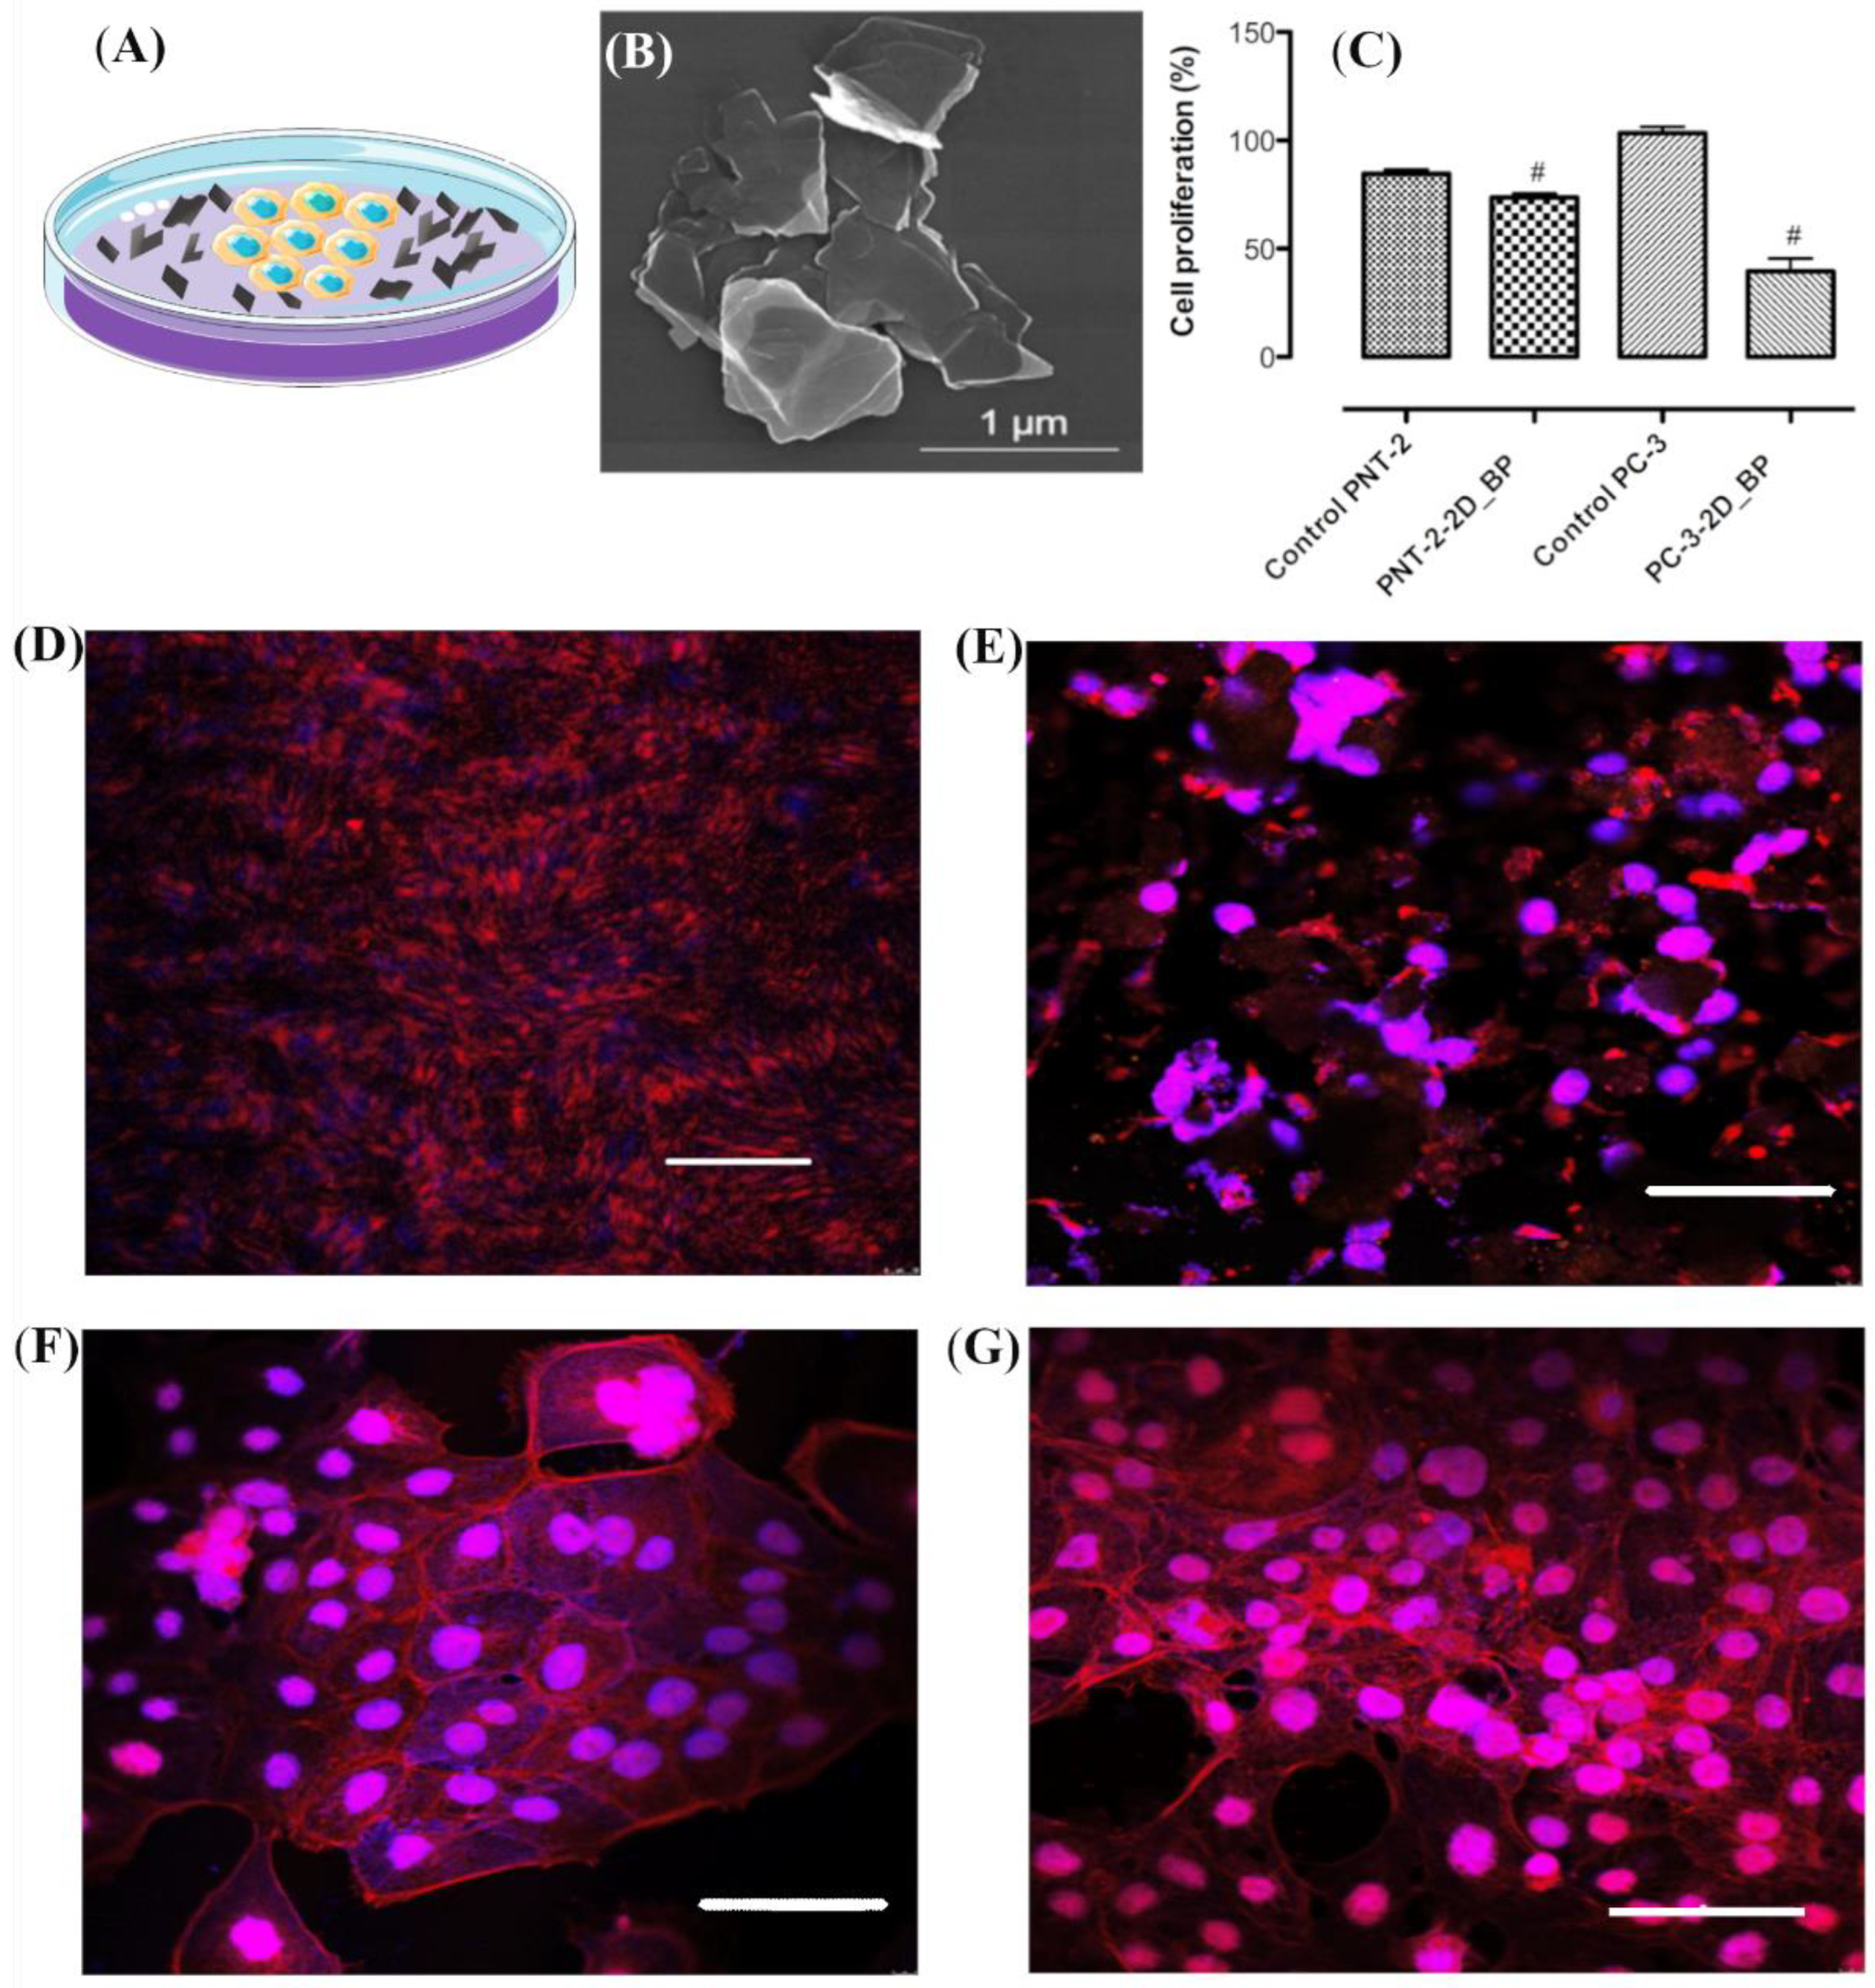
Abstract
:1. Introduction
2. Materials and Methods
2.1. Synthesis of 2D BP Flakes
2.2. Study of 2D BP Morphology
2.3. Cell Culture
2.4. Cell Proliferation
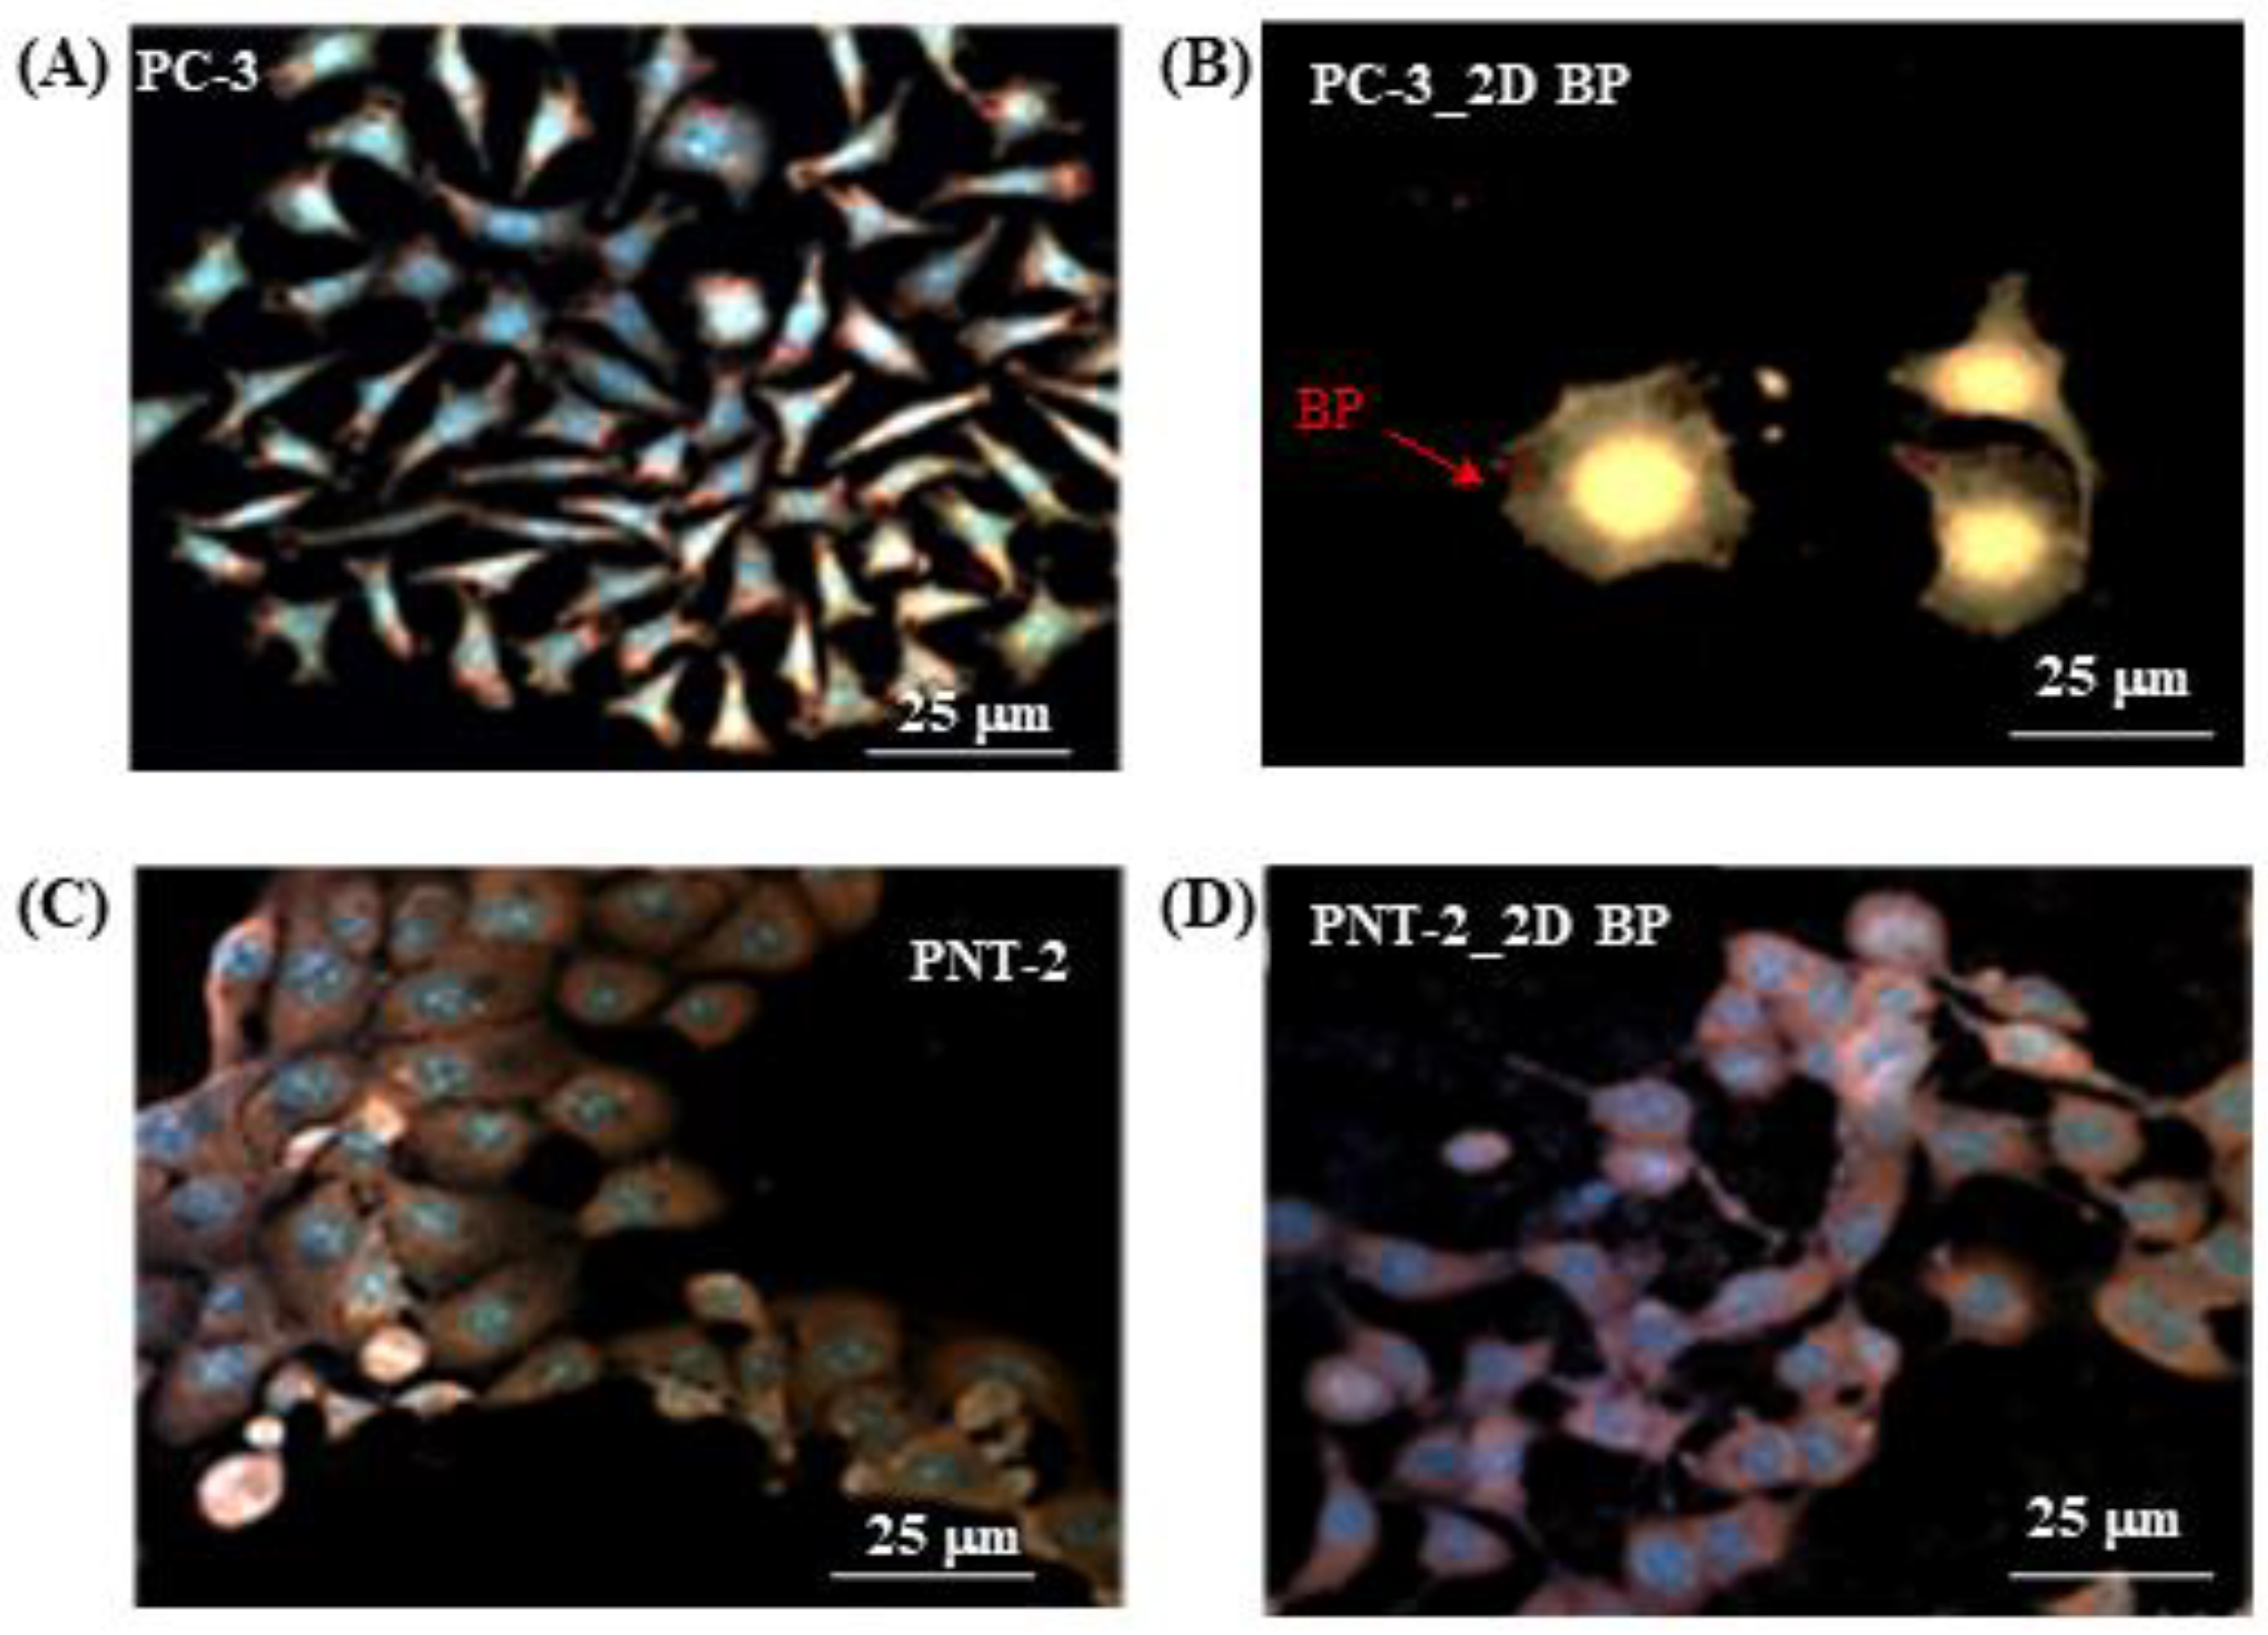
2.5. Cell Morphology
2.6. Cell Permeability and Apoptosis Detection
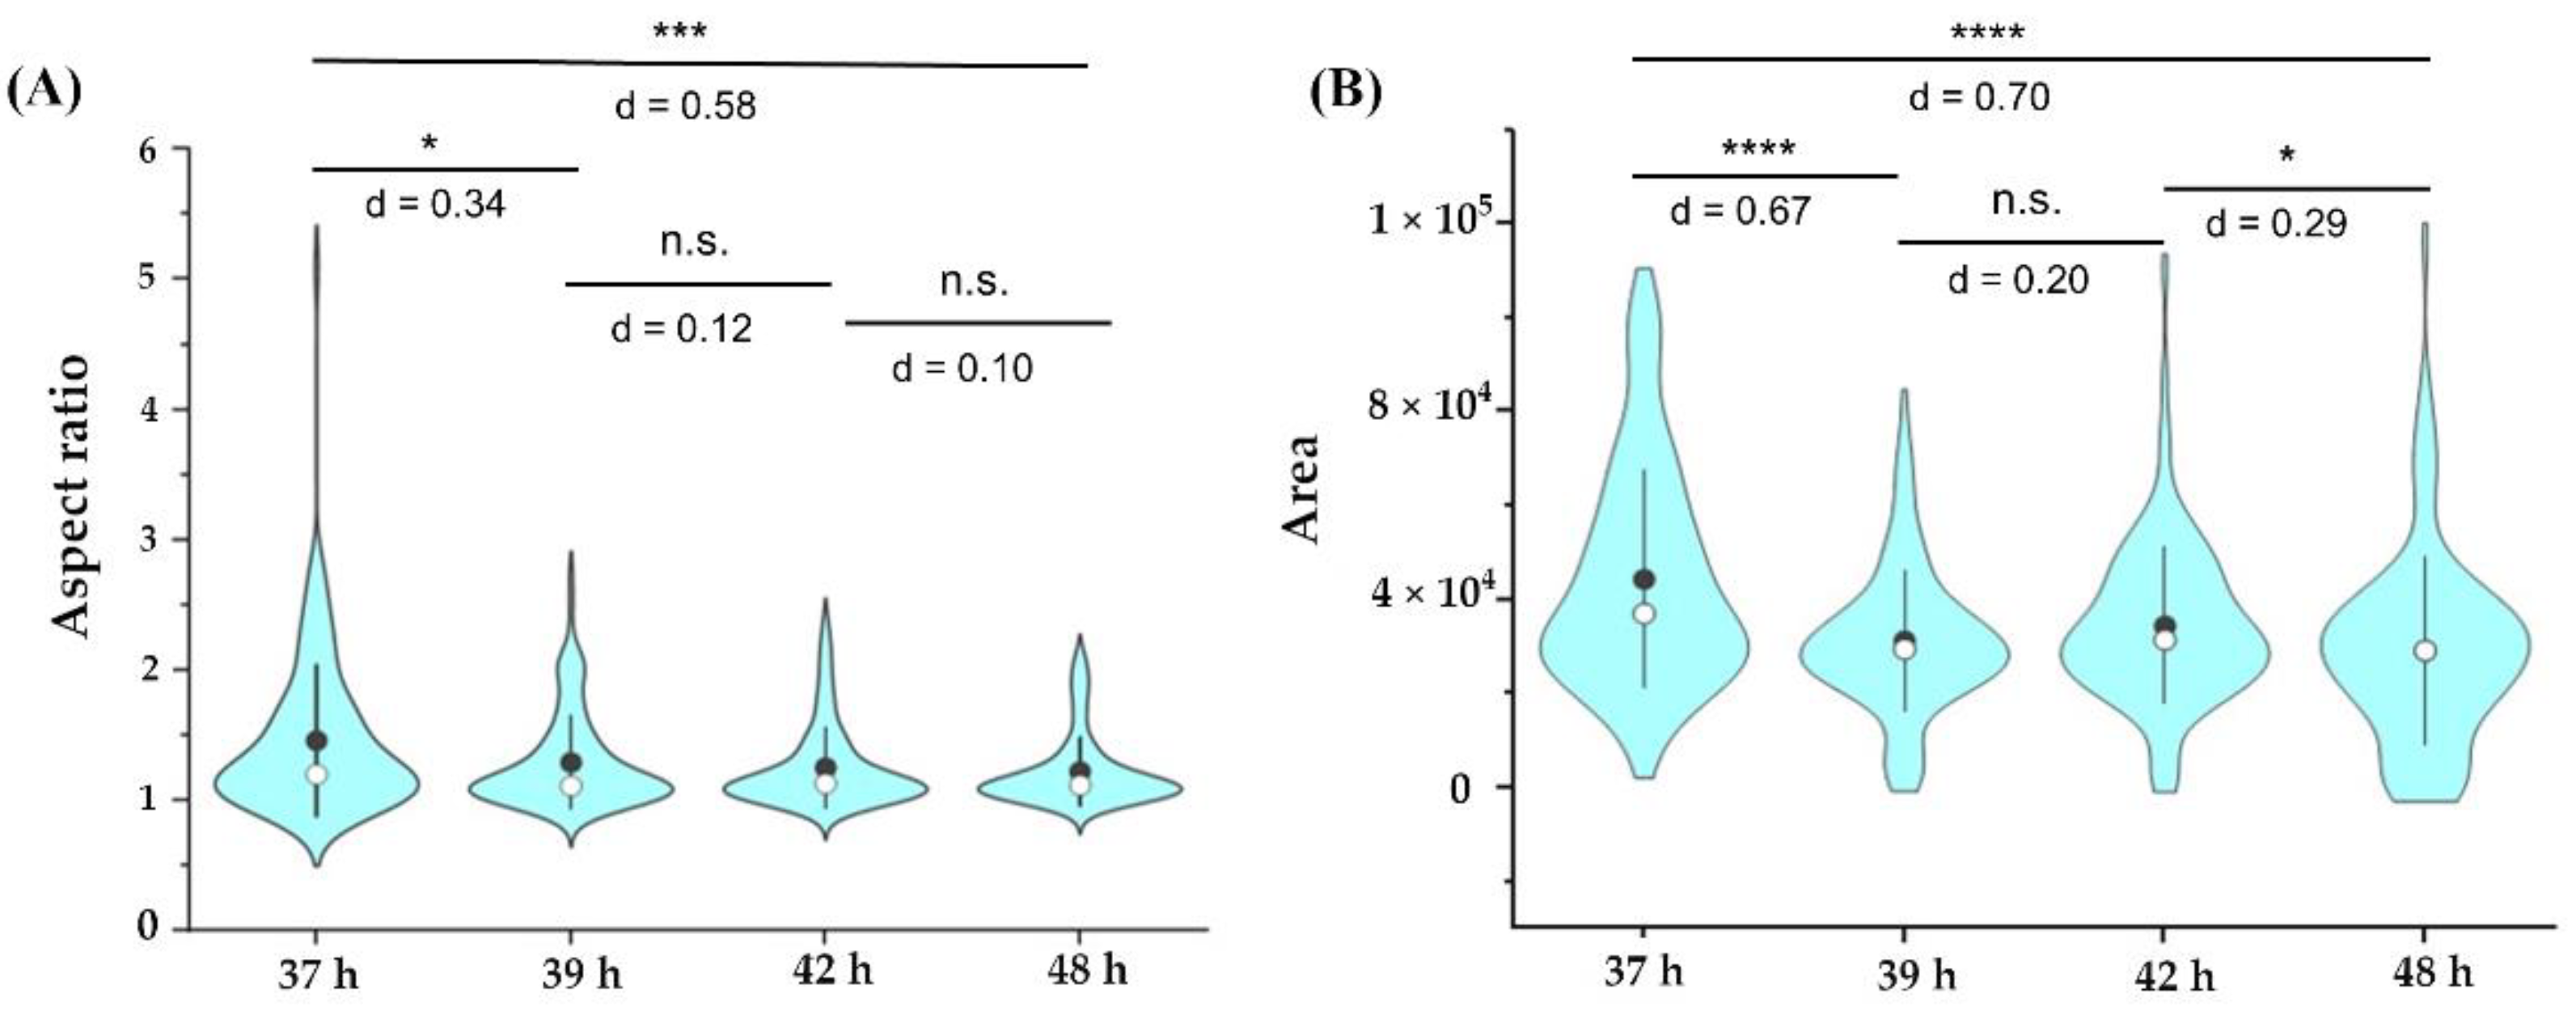
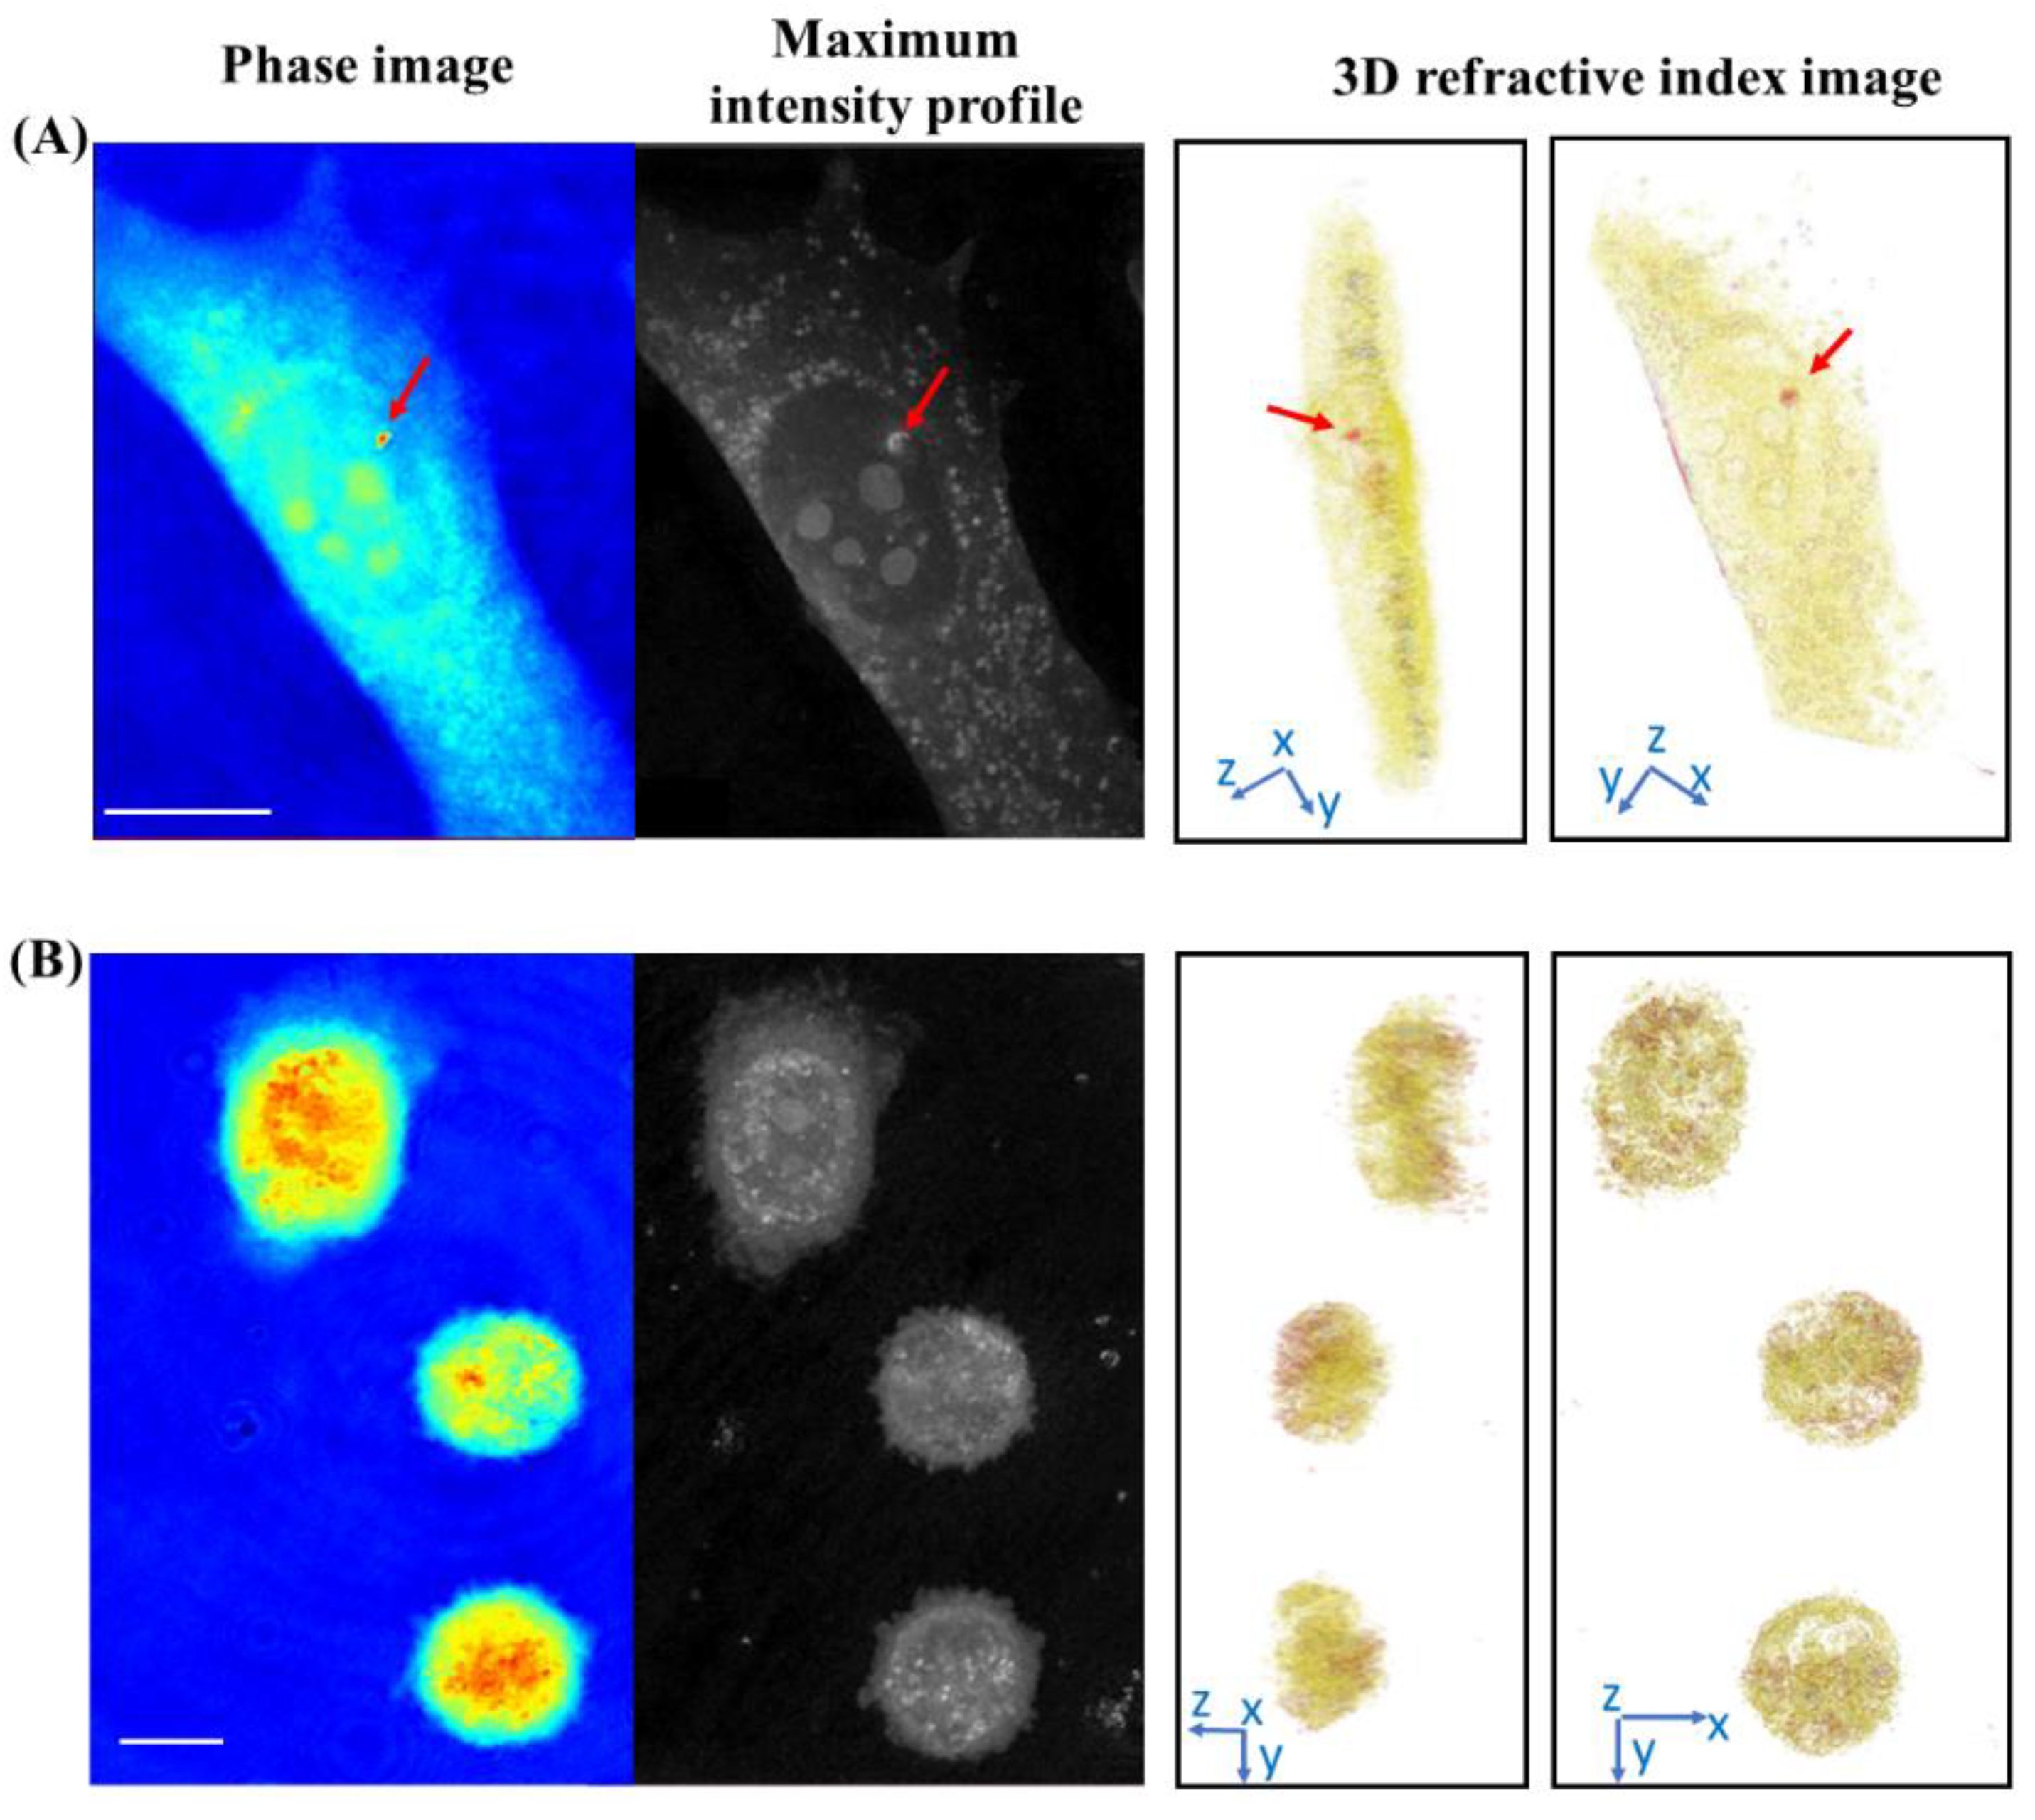
2.7. Optical Diffraction Tomography and Statistical Analysis
2.8. Raman Microscopy
3. Results and Discussion
3.1. Immunofluorescence Investigation on PC-3 and PNT-2 Cells Seeded on 2D BP Flakes
3.2. Label-Free Imaging of the Delivery of the 2D BP Flakes in the Live PC-3 Cells by ODT
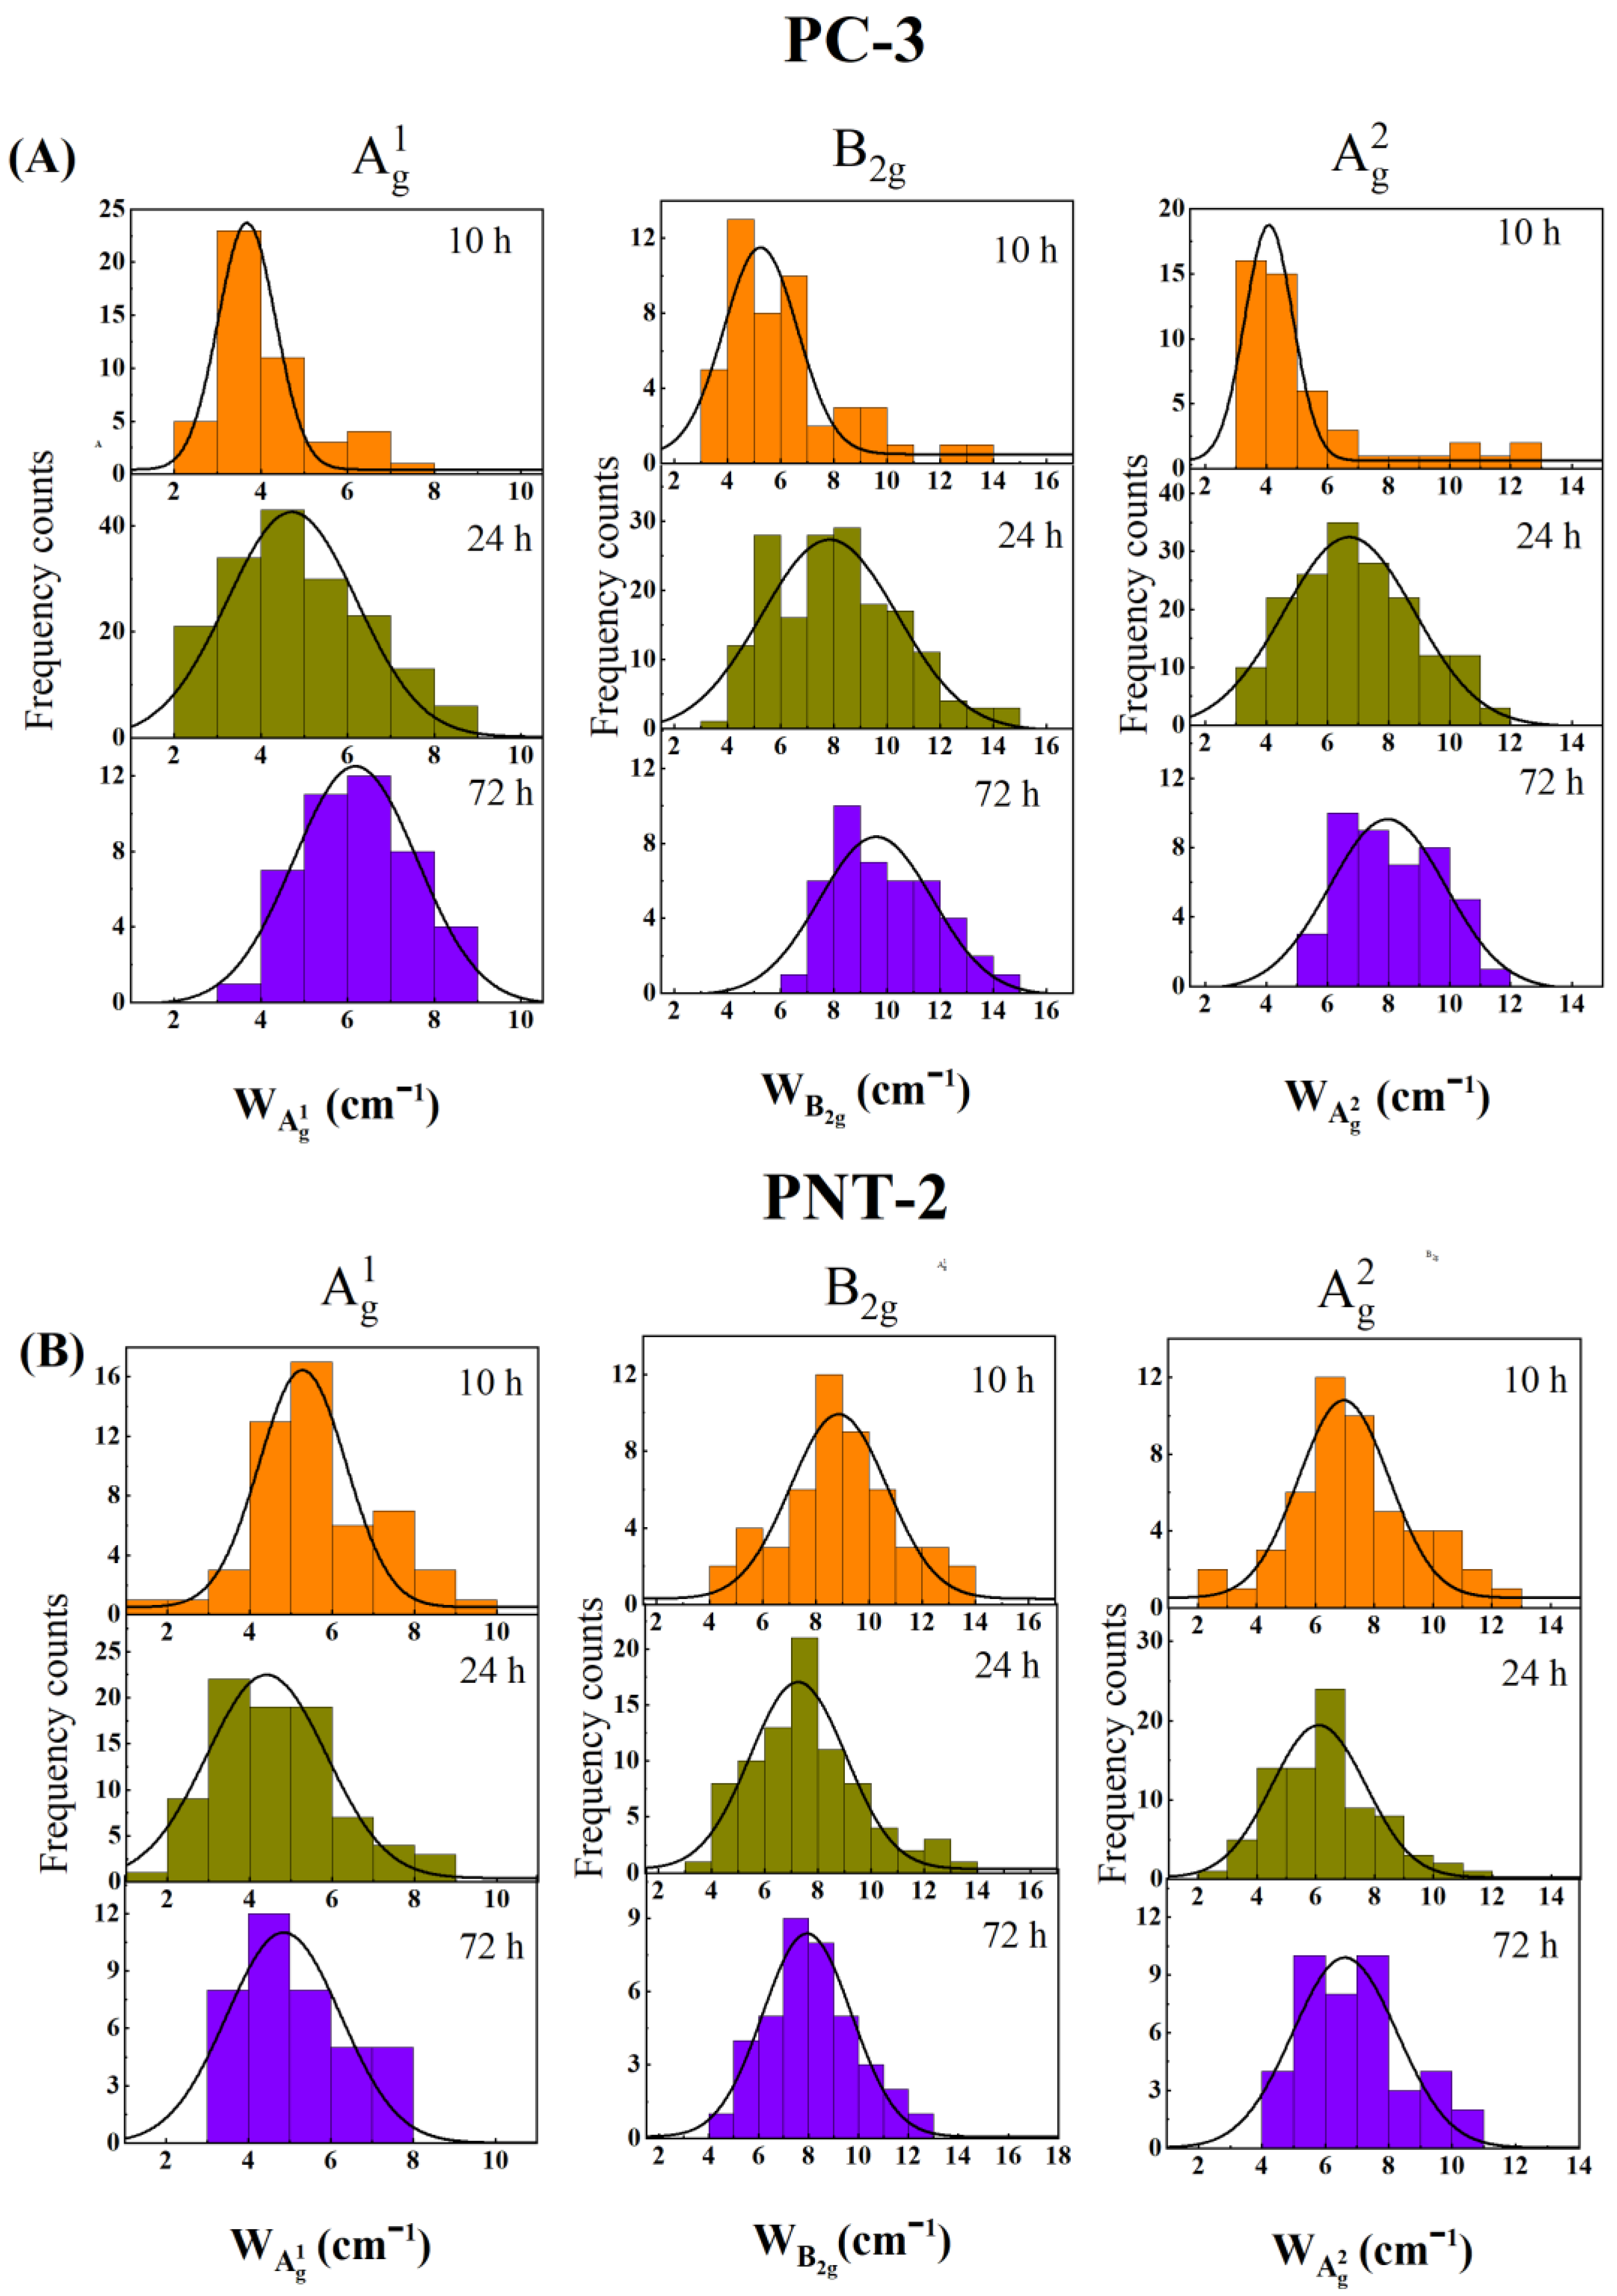
3.3. In Situ Characterization of the Degradation of 2D BP Flakes in the Intracellular Matrix of PC-3 Cells by Raman Spectroscopy
4. Conclusions
Supplementary Materials
Author Contributions
Funding
Institutional Review Board Statement
Informed Consent Statement
Data Availability Statement
Conflicts of Interest
References
- Wong, X.Y.; Seán-Torralba, A.; Álvarez-Diduk, R.; Muthoosamy, K.; MerkoçI, A. Nanomaterials for nanotheranostics: Tuning their properties according to disease needs. ACS Nano 2020, 14, 2585–2627. [Google Scholar] [CrossRef] [PubMed]
- El-Sayed, A.; Kamel, M. Advances in nanomedical applications: Diagnostic, therapeutic, immunization, and vaccine production. Environ. Sci. Pollut. Res. 2020, 27, 19200–19213. [Google Scholar] [CrossRef]
- Jain, P.K.; Lee, K.S.; El-Sayed, I.H.; El-Sayed, A.M. Calculated absorption and scattering properties of gold nanoparticles of different size, shape, and composition: Applications in biological imaging and biomedicine. J. Phys. Chem. B 2006, 110, 7238–7248. [Google Scholar] [CrossRef] [Green Version]
- Huang, X.; El-Sayed, I.H.; Qian, W.; El-Sayed, M.A. Cancer cell imaging and photothermal therapy in the near-infrared region by using gold nanorods. J. Am. Chem. Soc. 2006, 128, 2115–2120. [Google Scholar] [CrossRef] [PubMed]
- Jaque, D.; Maestro, L.M.; Del Rosal, V.; Haro-Gonzalez, P.; Benayas, A.; Plaza, J.; Rodriguez, E.M.; Sole, J.G. Nanoparticles for photothermal therapies. Nanoscale 2014, 6, 9494–9530. [Google Scholar] [CrossRef] [PubMed]
- Arvizo, R.R.; Miranda, O.R.; Moyano, D.F.; Walden, C.A.; Giri, K. Modulating pharmacokinetics, tumor uptake and biodistribution by engineered nanoparticles. PLoS ONE 2011, 6, e24374. [Google Scholar] [CrossRef] [PubMed] [Green Version]
- Veiseh, O.; Gunn, J.; Zhang, M. Design and fabrication of magnetic nanoparticles for targeted drug delivery and imaging. Adv. Drug Deliv. Rev. 2010, 62, 284–304. [Google Scholar] [CrossRef] [PubMed] [Green Version]
- Robinson, J.T.; Jorgolli, M.; Shalek, A.K.; Yoon, M.-H.; Gertner, R.S.; Park, H. Vertical nanowire electrode arrays as a scalable platform for intracellular interfacing to neuronal circuits. Nat. Nanotechnol. 2012, 7, 180–184. [Google Scholar] [CrossRef] [PubMed] [Green Version]
- Patolsky, F.; Zheng, G.; Hayden, O.; Lakadamyali, M.; Zhuang, X.; Lieber, C.M. Detection, stimulation, and inhibition of neuronal signals with high-density nanowire transistor arrays. Science 2006, 313, 1100–1104. [Google Scholar] [CrossRef] [Green Version]
- Saracino, E.; Maiolo, L.; Polese, D.; Semprini, M.; Borrachero-Conejo, A.I.; Gasparetto, J.; Murtagh, S.; Sola, M.; Tomasi, L.; Valle, F.; et al. A glial-silicon nanowire electrode junction enabling differentiation and noninvasive recording of slow oscillations from primary astrocytes. Adv. Biosyst. 2020, 4, e1900264. [Google Scholar] [CrossRef] [PubMed]
- Qing, Q.; Lin, Z.J.; Gao, X.R.; Mai, L.; Lieber, C.M. Free-standing kinked nanowire transistor probes for targeted intracellular recording in three dimensions. Nat. Nanotechnol. 2014, 9, 142–147. [Google Scholar] [CrossRef] [Green Version]
- Convertino, A.; Mussi, V.; Maiolo, L.; Ledda, M.; Lolli, M.G.; Bovino, F.A.; Fortunato, G.; Rocchia, M.; Lisi, A. Array of disordered silicon nanowires coated by a gold film for combined NIR photothermal treatment of cancer cells and Raman monitoring of the process evolution. Nanotechnology 2018, 29, 415102. [Google Scholar] [CrossRef]
- Paria, D.; Convertino, A.; Mussi, V.; Maiolo, L.; Barman, I. A Silver-coated disordered silicon nanowires provide highly sensitive label-free glycated albumin detection through molecular trapping and plasmonic hotspot formation. Adv. Healthc. Mater. 2021, 10, 2001110. [Google Scholar] [CrossRef]
- Mussi, V.; Ledda, M.; Polese, D.; Maiolo, L.; Paria, D.; Barman, I.; Lolli, M.G.; Lisi, A.; Convertino, A. Silver-coated silicon nanowire platform discriminates genomic DNA from normal and malignant human epithelial cells using label-free Raman spectroscopy. Mater. Sci. Eng. C 2021, 122, 111951. [Google Scholar] [CrossRef]
- Gao, Z.; Agarwal, A.; Trigg, A.D.; Singh, N.; Fang, C.; Tung, C.-H.; Fan, Y.; Buddharaju, K.D.; Kong, J. Silicon nanowire arrays for label-free detection of DNA. Anal. Chem. 2007, 79, 3291–3297. [Google Scholar] [CrossRef] [PubMed]
- Maiolo, L.; Polese, D.; Pecora, A.; Fortunato, G.; Diamond, Y.S.; Convertino, A. Highly disordered array of silicon nanowires: An effective and scalable approach for performing and flexible electrochemical biosensors. Adv. Healthc. Mater. 2016, 5, 575–583. [Google Scholar] [CrossRef] [PubMed]
- Paria, D.; Convertino, A.; Raj, P.; Glunde, K.; Chen, Y.; Barman, I. Nanowire Assisted Mechanotyping of Cellular Metastatic Potential. Adv. Funct. Mater. 2021, 31, 2101638. [Google Scholar] [CrossRef] [PubMed]
- Piret, G.; Galopin, E.; Coffinier, Y.; Boukherroub, R.; Legrand, D.; Slomianny, C. Culture of mammalian cells on patterned superhydrophilic/superhydrophobic silicon nanowire arrays. Soft Matter 2011, 7, 8642–8649. [Google Scholar] [CrossRef]
- Tao, W.; Ji, X.; Zhu, X.; Li, L.; Wang, J.; Zhang, Y.; Saw, P.E.; Li, W.; Kong, N.; Islam, M.A.; et al. Two-Dimensional Antimonene-Based Photonic Nanomedicine for Cancer Theranostics. Adv. Mater. 2018, 30, e1802061. [Google Scholar] [CrossRef] [PubMed]
- Lin, J.; Chen, X.; Huang, P. Graphene-Based Nanomaterials for Bioimaging. Adv. Drug Deliv. Rev. 2016, 105, 242–254. [Google Scholar] [CrossRef] [Green Version]
- Ji, X.; Kong, N.; Wang, J.; Li, W.; Xiao, Y.; Gan, S.T.; Zhang, Y.; Li, Y.; Song, X.; Xiong, Q.; et al. A novel top-down synthesis of ultrathin 2d boron nanosheets for multimodal imaging-guided cancer therapy. ACS Appl. Mater. Interfaces 2018, 10, 31136–31145. [Google Scholar] [CrossRef] [PubMed]
- Lin, Y.; Wu, Y.; Wang, R.; Tao, R.; Luo, P.F.; Lin, X.; Huang, G.; Li, J.; Yang, H. Two-dimensional tellurium nanosheets for photoacoustic imaging-guided photodynamic therapy. Chem. Commun. 2018, 54, 8579–8582. [Google Scholar] [CrossRef] [PubMed]
- Yang, K.; Zhang, S.; Zhang, G.; Sun, X.; Lee, S.-T.; Liu, Z. Graphene in mice: Ultrahigh in vivo tumor uptake and efficient photothermal therapy. Nano Lett. 2010, 10, 3318–3323. [Google Scholar] [CrossRef] [PubMed]
- Shao, J.; Xie, H.; Huang, H.; Li, Z.; Sun, Z.; Xu, Y.; Xiao, Q.; Yu, X.-F.; Zhao, Y.; Zhang, H.; et al. Biodegradable black phosphorus-based nanospheres for in vivo photothermal cancer therapy. Nat. Commun. 2016, 7, 12967. [Google Scholar] [CrossRef] [PubMed]
- Latiff, N.M.; Teo, W.Z.; Sofer, Z.; Fisher, A.C.; Pumera, M. The cytotoxicity of layered black phosphorus. Chem. Eur. J. 2015, 21, 13991–13995. [Google Scholar] [CrossRef] [PubMed]
- Zhou, W.; Pan, T.; Cui, H.; Zhao, Z.; Chu, P.K.; Yu, X.-F. Black phosphorus: Bioactive nanomaterials with inherent and selective chemotherapeutic effects. Angew. Chem. Int. Ed. 2019, 58, 769–774. [Google Scholar] [CrossRef] [PubMed]
- Kong, N.; Ji, X.; Wang, J.; Sun, X.; Chen, G.; Fan, T.; Liang, W.; Zhang, H.; Xie, A.; Farokhzad, O.C.; et al. ROS-mediated selective killing effect of black phosphorus: Mechanistic understanding and its guidance for safe biomedical applications. Nano Lett. 2020, 20, 3943–3955. [Google Scholar] [CrossRef]
- Fasolino, I.; Soriente, A.; Caporali, M.; Serrano-Ruiz, M.; Peruzzini, M.; Ambrosio, L.; Raucci, M.G. 2D exfoliated black phosphorus influences healthy and cancer prostate cell behaviors. Sci. Rep. 2021, 11, 5856. [Google Scholar] [CrossRef] [PubMed]
- Raucci, M.G.; Fasolino, I.; Caporali, M.; Serrano-Ruiz, M.; Soriente, A.; Peruzzini, M.; Ambrosio, L. Exfoliated black phosphorus promotes in vitro bone regeneration and suppresses osteosarcoma progression through cancer-related inflammation inhibition. ACS Appl. Mater. Interfaces 2019, 11, 9333–9342. [Google Scholar] [CrossRef] [PubMed]
- Huang, Y.; Qiao, J.; He, K.; Bliznakov, S.; Sutter, E.; Chen, X.; Luo, D.; Meng, F.; Su, D.; Decker, J.; et al. Interaction of Black Phosphorus with Oxygen and Water. Chem. Mater. 2016, 28, 8330–8339. [Google Scholar] [CrossRef] [Green Version]
- Peng, L.; Abbasi, N.; Xiao, Y.; Xie, Z. Black Phosphorus: Degradation Mechanism, Passivation Method, and Application for In Situ Tissue Regeneration. Adv. Mater. Interfaces 2020, 7, 2001538. [Google Scholar] [CrossRef]
- Zhang, T.; Wan, Y.; Xie, H.; Mu, Y.; Du, P.; Wang, D.; Wu, X.; Ji, H.; Wan, L. Degradation Chemistry and Stabilization of Exfoliated Few-Layer Black Phosphorus in Water. J. Am. Chem. Soc. 2018, 140, 7561–7567. [Google Scholar] [CrossRef] [PubMed]
- Choi, W.; Fang-Yen, C.; Badizadegan, K.; Oh, S.; Lue, N.; Dasari, R.R.; Feld, M.S. Tomographic phase microscopy. Nat. Methods 2007, 4, 717–719. [Google Scholar] [CrossRef]
- Lee, K.; Kim, K.; Jung, J.; Heo, J.; Cho, S.; Lee, S.; Chang, G.; Jo, Y.; Park, H.; Park, Y. Quantitative Phase Imaging Techniques for the Study of Cell Pathophysiology: From Principles to Applications. Sensors 2013, 13, 4170–4191. [Google Scholar] [CrossRef]
- Paidi, S.K.; Shah, V.; Raj, P.; Glunde, K.; Pandey, R.; Barman, I. Coarse Raman and optical diffraction tomographic imaging enable label-free phenotyping of isogenic breast cancer cells of varying metastatic potential. Biosens. Bioelectron. 2021, 175, 112863. [Google Scholar] [CrossRef]
- Alsaffar, F.; Alodan, S.; Alrasheed, A.; Alhussain, A.; Alrubaiq, N.; Abbas, A.; Amer, M.R. Raman sensitive degradation and etching dynamics of exfoliated black phosphorus. Sci. Rep. 2017, 7, srep44540. [Google Scholar] [CrossRef] [Green Version]
- Hemsworth, N.; Tayari, V.; Telesio, F.; Xiang, S.; Roddaro, S.; Caporali, M.; Ienco, A.; Serrano-Ruiz, M.; Peruzzini, M.; Gervais, G.; et al. Dephasing in strongly anisotropic black phosphorus. Phys. Rev. B 2016, 94, 245404. [Google Scholar] [CrossRef] [Green Version]
- Nilges, T.; Kersting, M.; Pfeifer, T. A fast low-pressure transport route to large black phosphorus single crystals. J. Solid State Chem. 2008, 181, 1707–1711. [Google Scholar] [CrossRef]
- Serrano-Ruiz, M.; Caporali, M.; Ienco, A.; Piazza, V.; Heun, S.; Peruzzini, M. The role of water in the preparation and stabilization of high-quality phosphorene flakes. Adv. Mater. Interfaces 2016, 3, 1500441. [Google Scholar] [CrossRef]
- Shin, S.; Kim, K.; Yoon, J.; Park, Y. Active illumination using a digital micromirror device for quantitative phase imaging. Opt. Lett. 2015, 40, 5407. [Google Scholar] [CrossRef]
- Kim, K.; Yoon, H.; Diez-Silva, M.; Dao, M.; Dasari, R.R.; Park, Y. High-resolution three-dimensional imaging of red blood cells parasitized by Plasmodium falciparum and in situ hemozoin crystals using optical diffraction tomography. J. Biomed. Opt. 2013, 19, 011005. [Google Scholar] [CrossRef] [Green Version]
- Wu, P.-H.; Phillip, J.M.; Khatau, S.B.; Chen, W.; Stirman, J.; Rosseel, S.; Tschudi, K.; Van Patten, J.; Wong, M.; Gupta, S.; et al. Evolution of cellular morpho-phenotypes in cancer metastasis. Sci. Rep. 2015, 5, 18437. [Google Scholar] [CrossRef] [Green Version]
- van Engeland, M.; Nieland, L.J.; Ramaekers, F.C.; Schutte, B.; Reutelingsperger, C.P. Annexin V-affinity assay: A review on an apoptosis detection system based on phosphatidylserine exposure. Cytometry 1998, 31, 1–9. [Google Scholar] [CrossRef]
- Commisso, C.; Davidson, S.M.; Soydaner-Azeloglu, R.G.; Parker, S.J.; Kamphorst, J.J.; Hackett, S.; Grabocka, E.; Nofal, M.; Drebin, J.A.; Thompson, C.B.; et al. Macropinocytosis of protein is an amino acid supply route in Ras-transformed cells. Nature 2013, 497, 633–637. [Google Scholar] [CrossRef] [Green Version]
- Swanson, J.A.; Watts, C. Macropinocytosis. Trends Cell Biol. 1995, 5, 424. [Google Scholar] [CrossRef]
- Shin, Y.C.; Song, S.J.Y.; Lee, B.; Kang, M.S.; Lee, H.U.; Oh, J.W.; Han, D.-W. Application of black phosphorus nanodots to live cell imaging. Biomater. Res. 2018, 22, 31. [Google Scholar] [CrossRef] [Green Version]
- Harmsen, S.; Huang, R.; Wall, M.A.; Karabeber, H.; Samii, J.M.; Spaliviero, M.; White, J.R.; Monette, S.; O’Connor, R.; Pitter, K.L.; et al. Surface-Enhanced Resonance Raman Scattering Nanostars for High-Precision Cancer Imaging. Sci. Transl. Med. 2015, 7, 271ra7. [Google Scholar] [CrossRef] [Green Version]
- Vranic, S.; Boggetto, N.; Contremoulins, V.; Mornet, S.; Reinhardt, N.; Marano, F.; Baeza-Squiban, A.; Boland, S. Deciphering the mechanisms of cellular uptake of engineered nanoparticles by accurate evaluation of internalization using imaging flow cytometry. Part. Fibre Toxicol. 2013, 10, 2. [Google Scholar] [CrossRef]
- Häcker, G. The morphology of apoptosis. Cell Tissue Res. 2000, 301, 5. [Google Scholar] [CrossRef]
- Ribeiro, H.B.; Pimenta, M.A.; de Matos, C.J.S. Raman spectroscopy in black phosphorus. J. Raman Spectrosc. 2018, 49, 76–90. [Google Scholar] [CrossRef]
- Movasaghi, Z.; Rehman, S.; Rehman, I.U. Raman spectroscopy of biological tissues. J. Appl. Spectros. Rev. 2007, 42, 493–541. [Google Scholar] [CrossRef]
- Ling, Z.-P.; Ang, K.-W. Thermal effects on the Raman phonon of few-layer phosphorene. APL Mater. 2015, 3, 126104. [Google Scholar] [CrossRef] [Green Version]
- Sarswat, P.K.; Sarkar, S.; Bhattacharyya, D.; Cho, J.; Free, M.L. Dopants induced structural and optical anomalies of anisotropic edges of black phosphorous thin films and crystals. Ceram. Int. 2016, 42, 13113–13127. [Google Scholar] [CrossRef]


Publisher’s Note: MDPI stays neutral with regard to jurisdictional claims in published maps and institutional affiliations. |
© 2022 by the authors. Licensee MDPI, Basel, Switzerland. This article is an open access article distributed under the terms and conditions of the Creative Commons Attribution (CC BY) license (https://creativecommons.org/licenses/by/4.0/).
Share and Cite
Mussi, V.; Fasolino, I.; Paria, D.; De Simone, S.; Caporali, M.; Serrano-Ruiz, M.; Ambrosio, L.; Barman, I.; Raucci, M.G.; Convertino, A. Label-Free Morpho-Molecular Imaging for Studying the Differential Interaction of Black Phosphorus with Tumor Cells. Nanomaterials 2022, 12, 1994. https://doi.org/10.3390/nano12121994
Mussi V, Fasolino I, Paria D, De Simone S, Caporali M, Serrano-Ruiz M, Ambrosio L, Barman I, Raucci MG, Convertino A. Label-Free Morpho-Molecular Imaging for Studying the Differential Interaction of Black Phosphorus with Tumor Cells. Nanomaterials. 2022; 12(12):1994. https://doi.org/10.3390/nano12121994
Chicago/Turabian StyleMussi, Valentina, Ines Fasolino, Debadrita Paria, Sara De Simone, Maria Caporali, Manuel Serrano-Ruiz, Luigi Ambrosio, Ishan Barman, Maria Grazia Raucci, and Annalisa Convertino. 2022. "Label-Free Morpho-Molecular Imaging for Studying the Differential Interaction of Black Phosphorus with Tumor Cells" Nanomaterials 12, no. 12: 1994. https://doi.org/10.3390/nano12121994
APA StyleMussi, V., Fasolino, I., Paria, D., De Simone, S., Caporali, M., Serrano-Ruiz, M., Ambrosio, L., Barman, I., Raucci, M. G., & Convertino, A. (2022). Label-Free Morpho-Molecular Imaging for Studying the Differential Interaction of Black Phosphorus with Tumor Cells. Nanomaterials, 12(12), 1994. https://doi.org/10.3390/nano12121994