
Enhanced Electrochemical Performance of LiNi0.5Mn1.5O4 Composite Cathodes for Lithium-Ion Batteries by Selective Doping of K+/Cl− and K+/F−

 and
and
Abstract
:1. Introduction
2. Experimental Section
2.1. Material Preparation
2.2. Material Characterization
2.3. Electrochemical Measurements
3. Results and Discussion
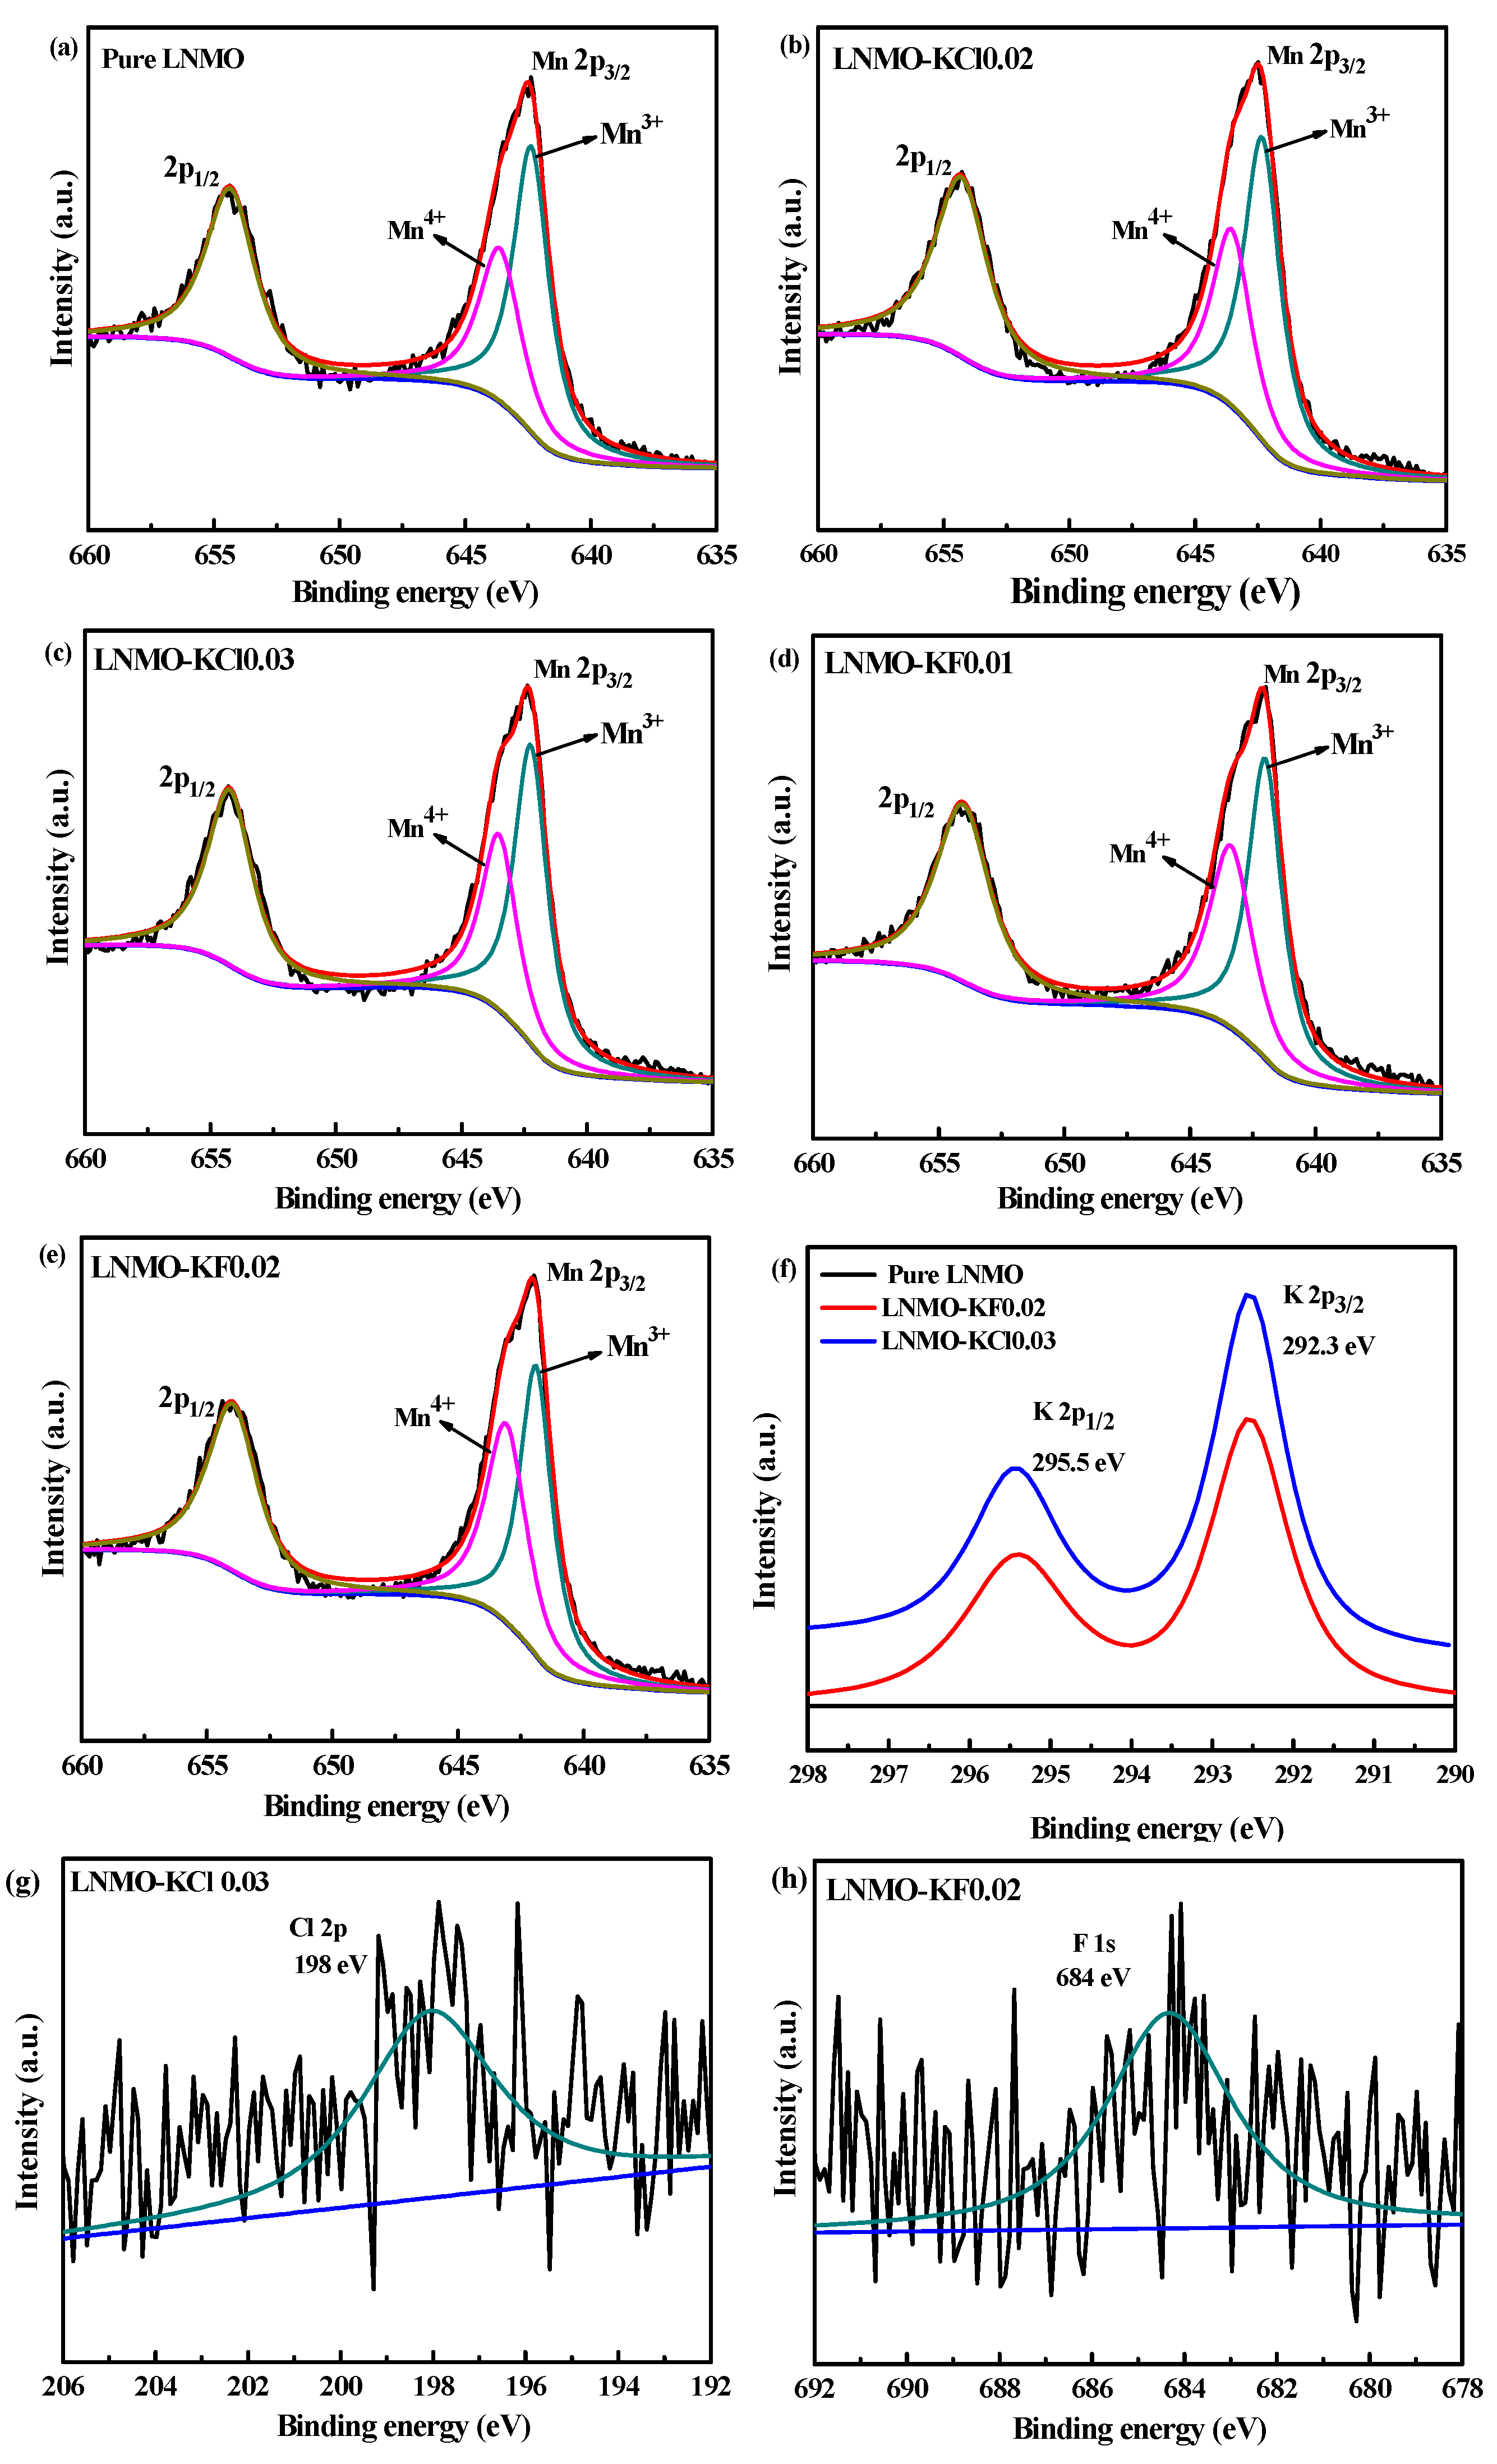
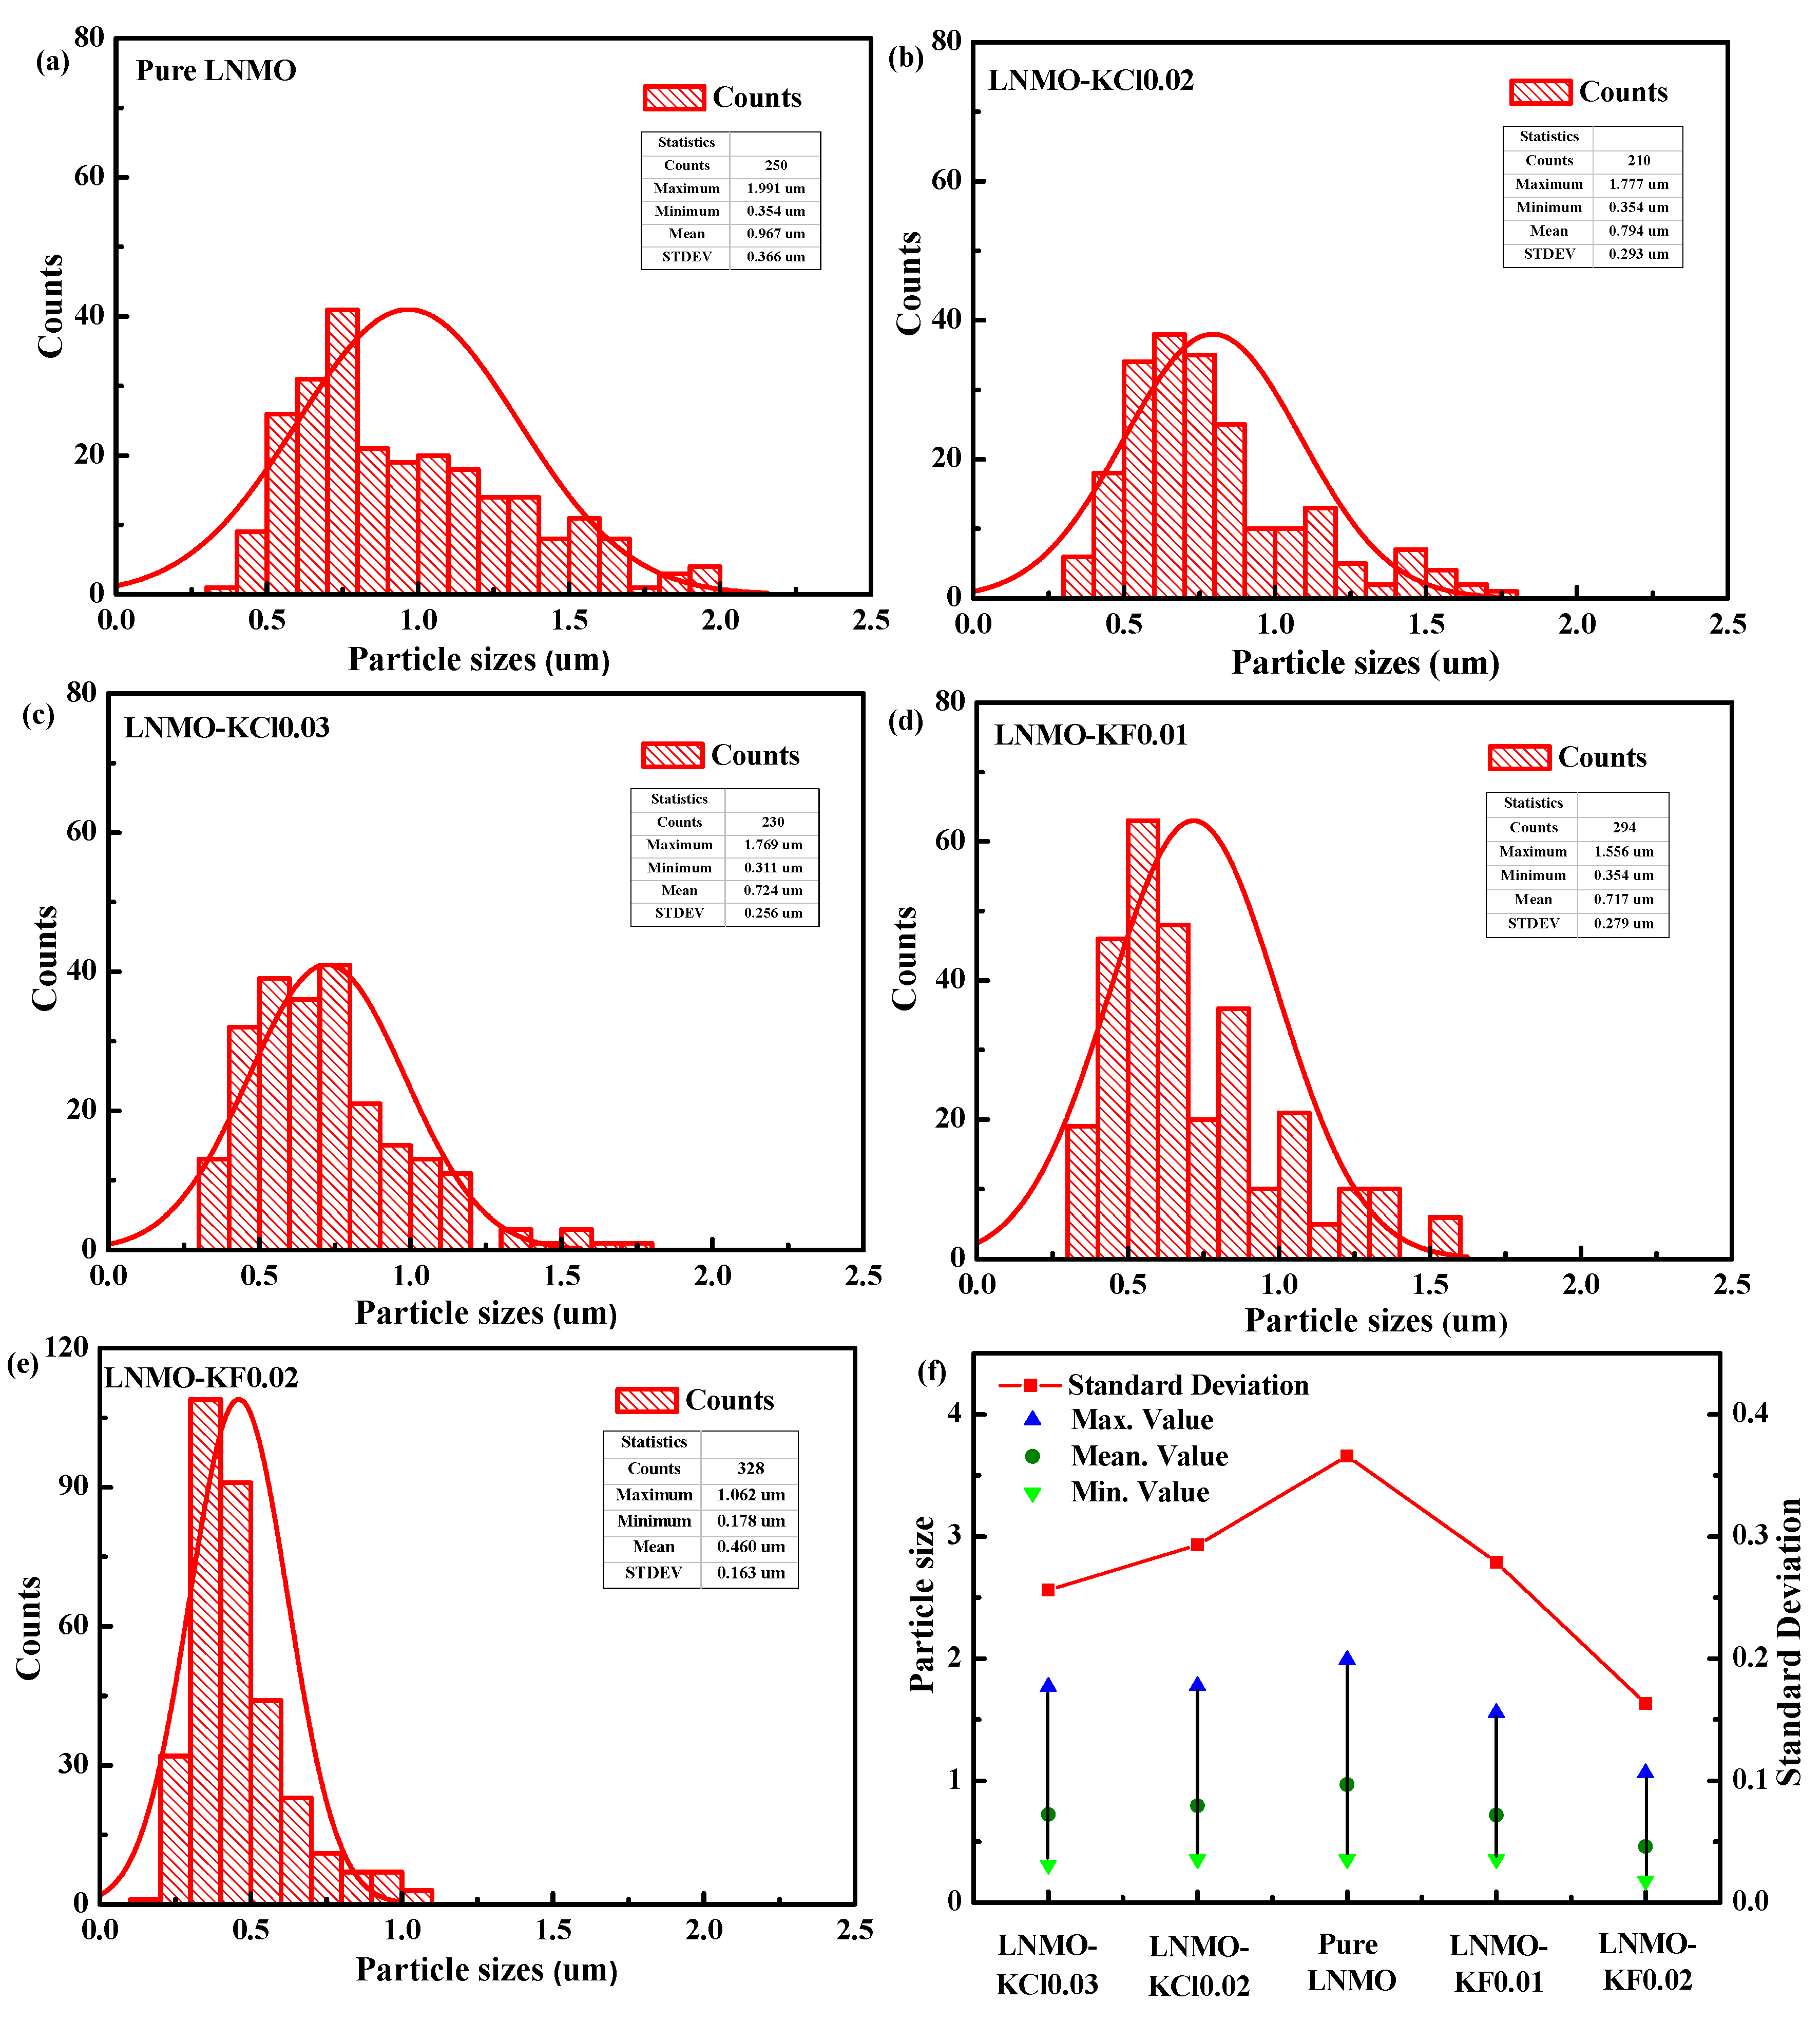
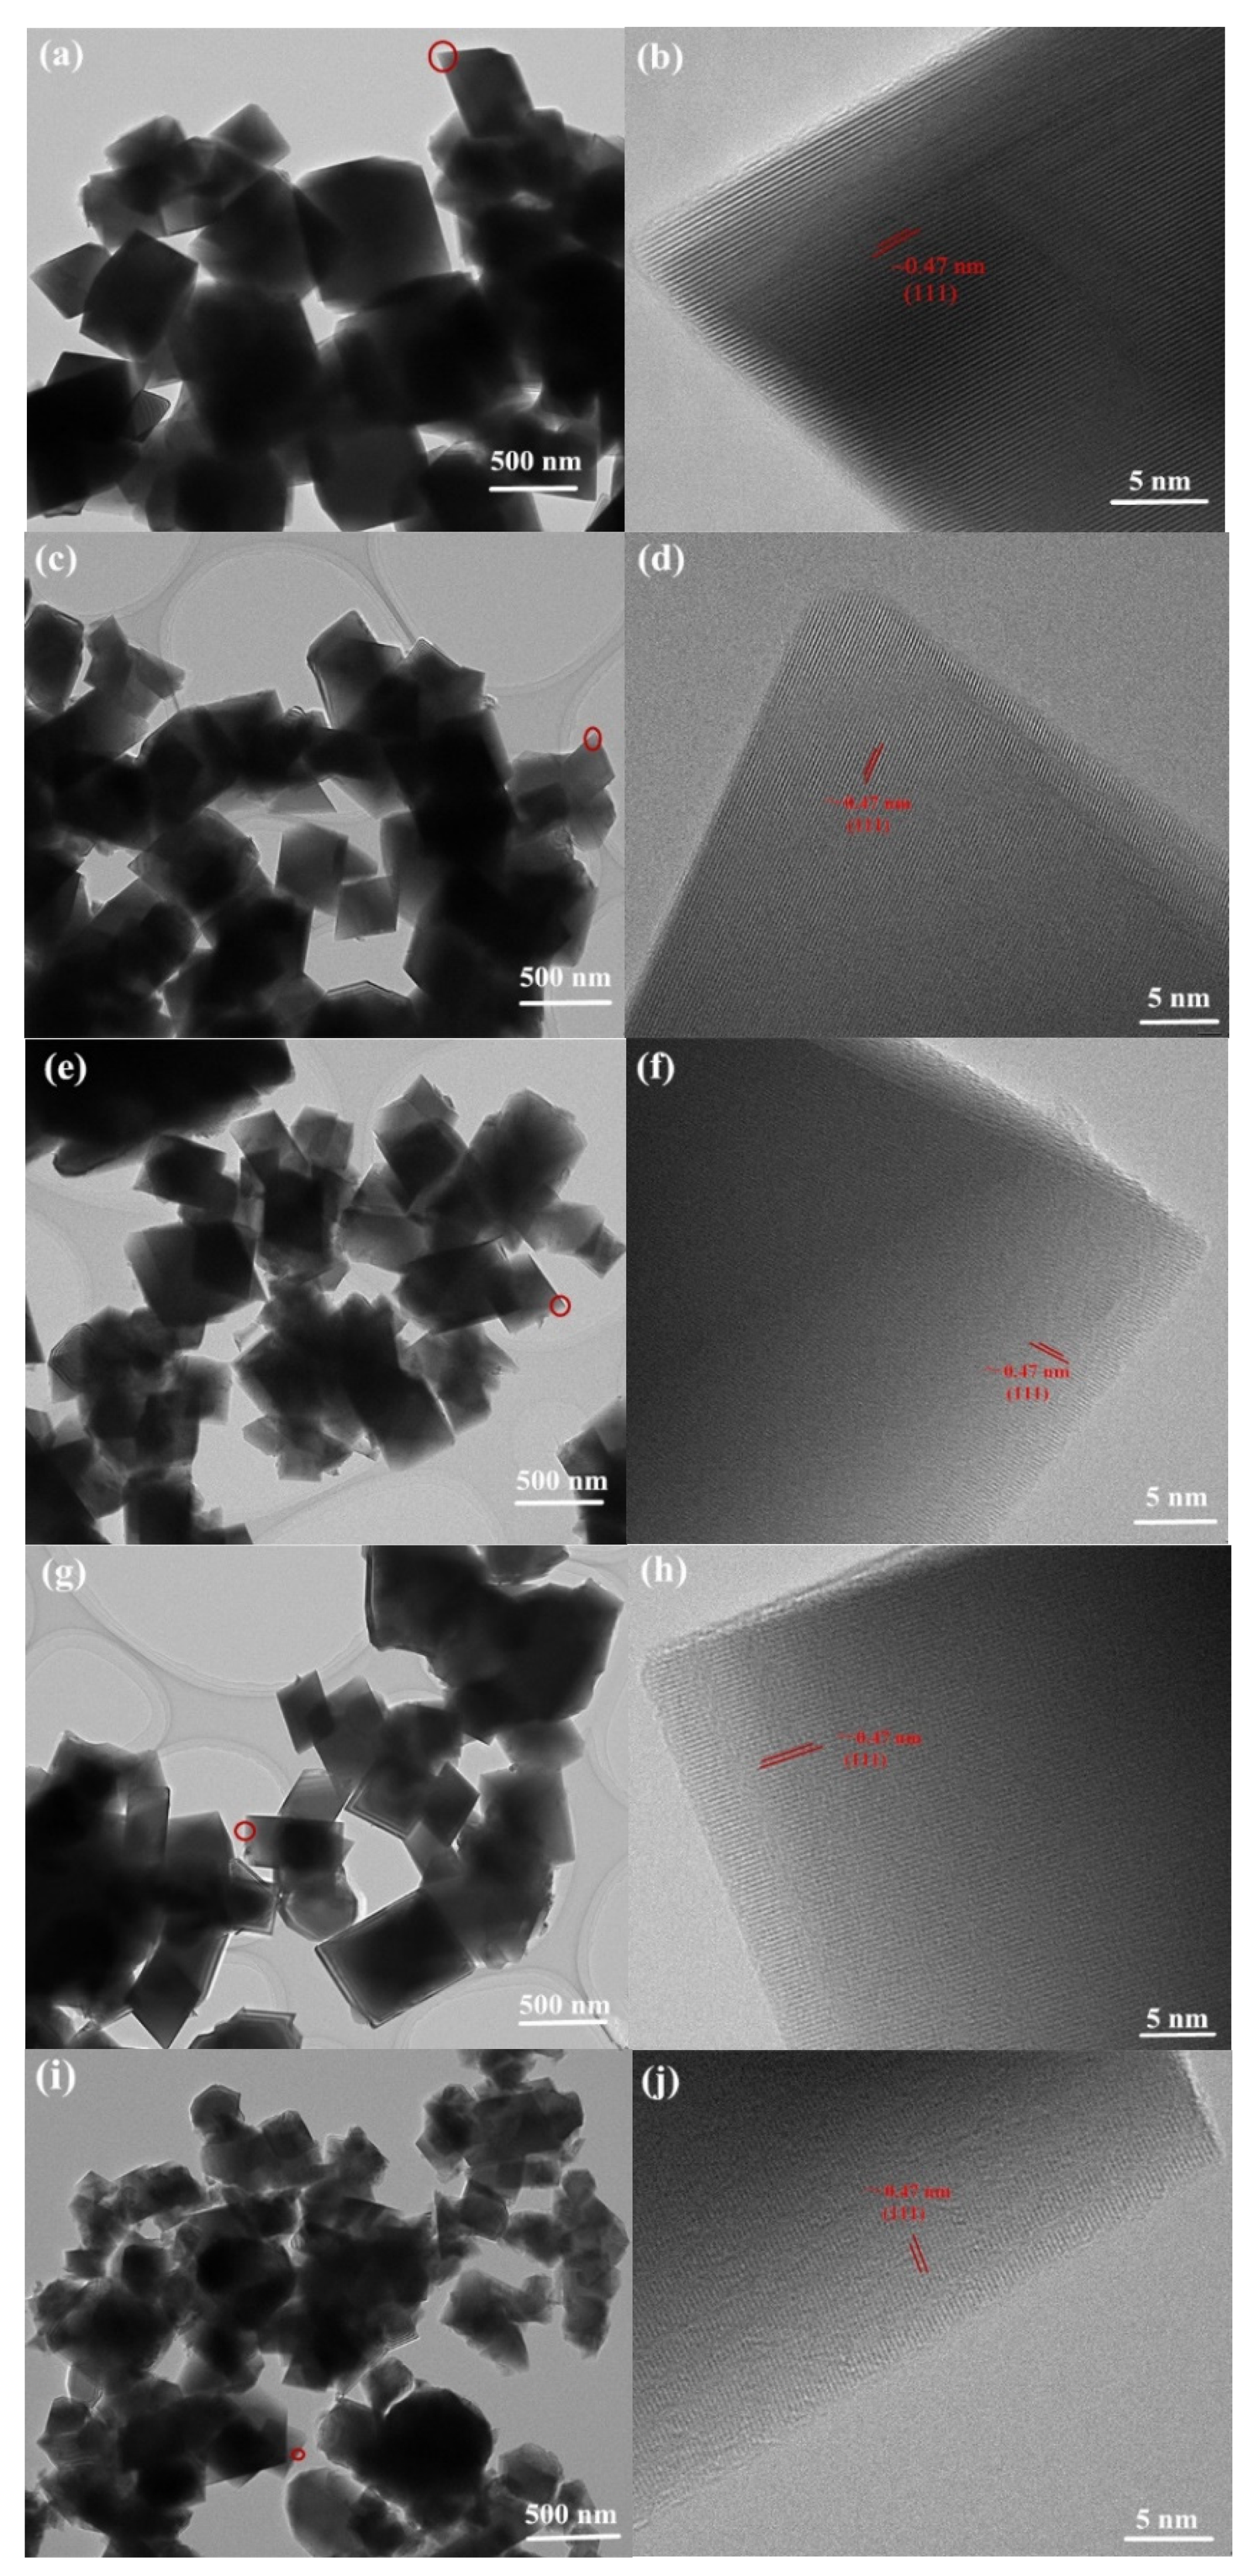
3.1. Material Characterization
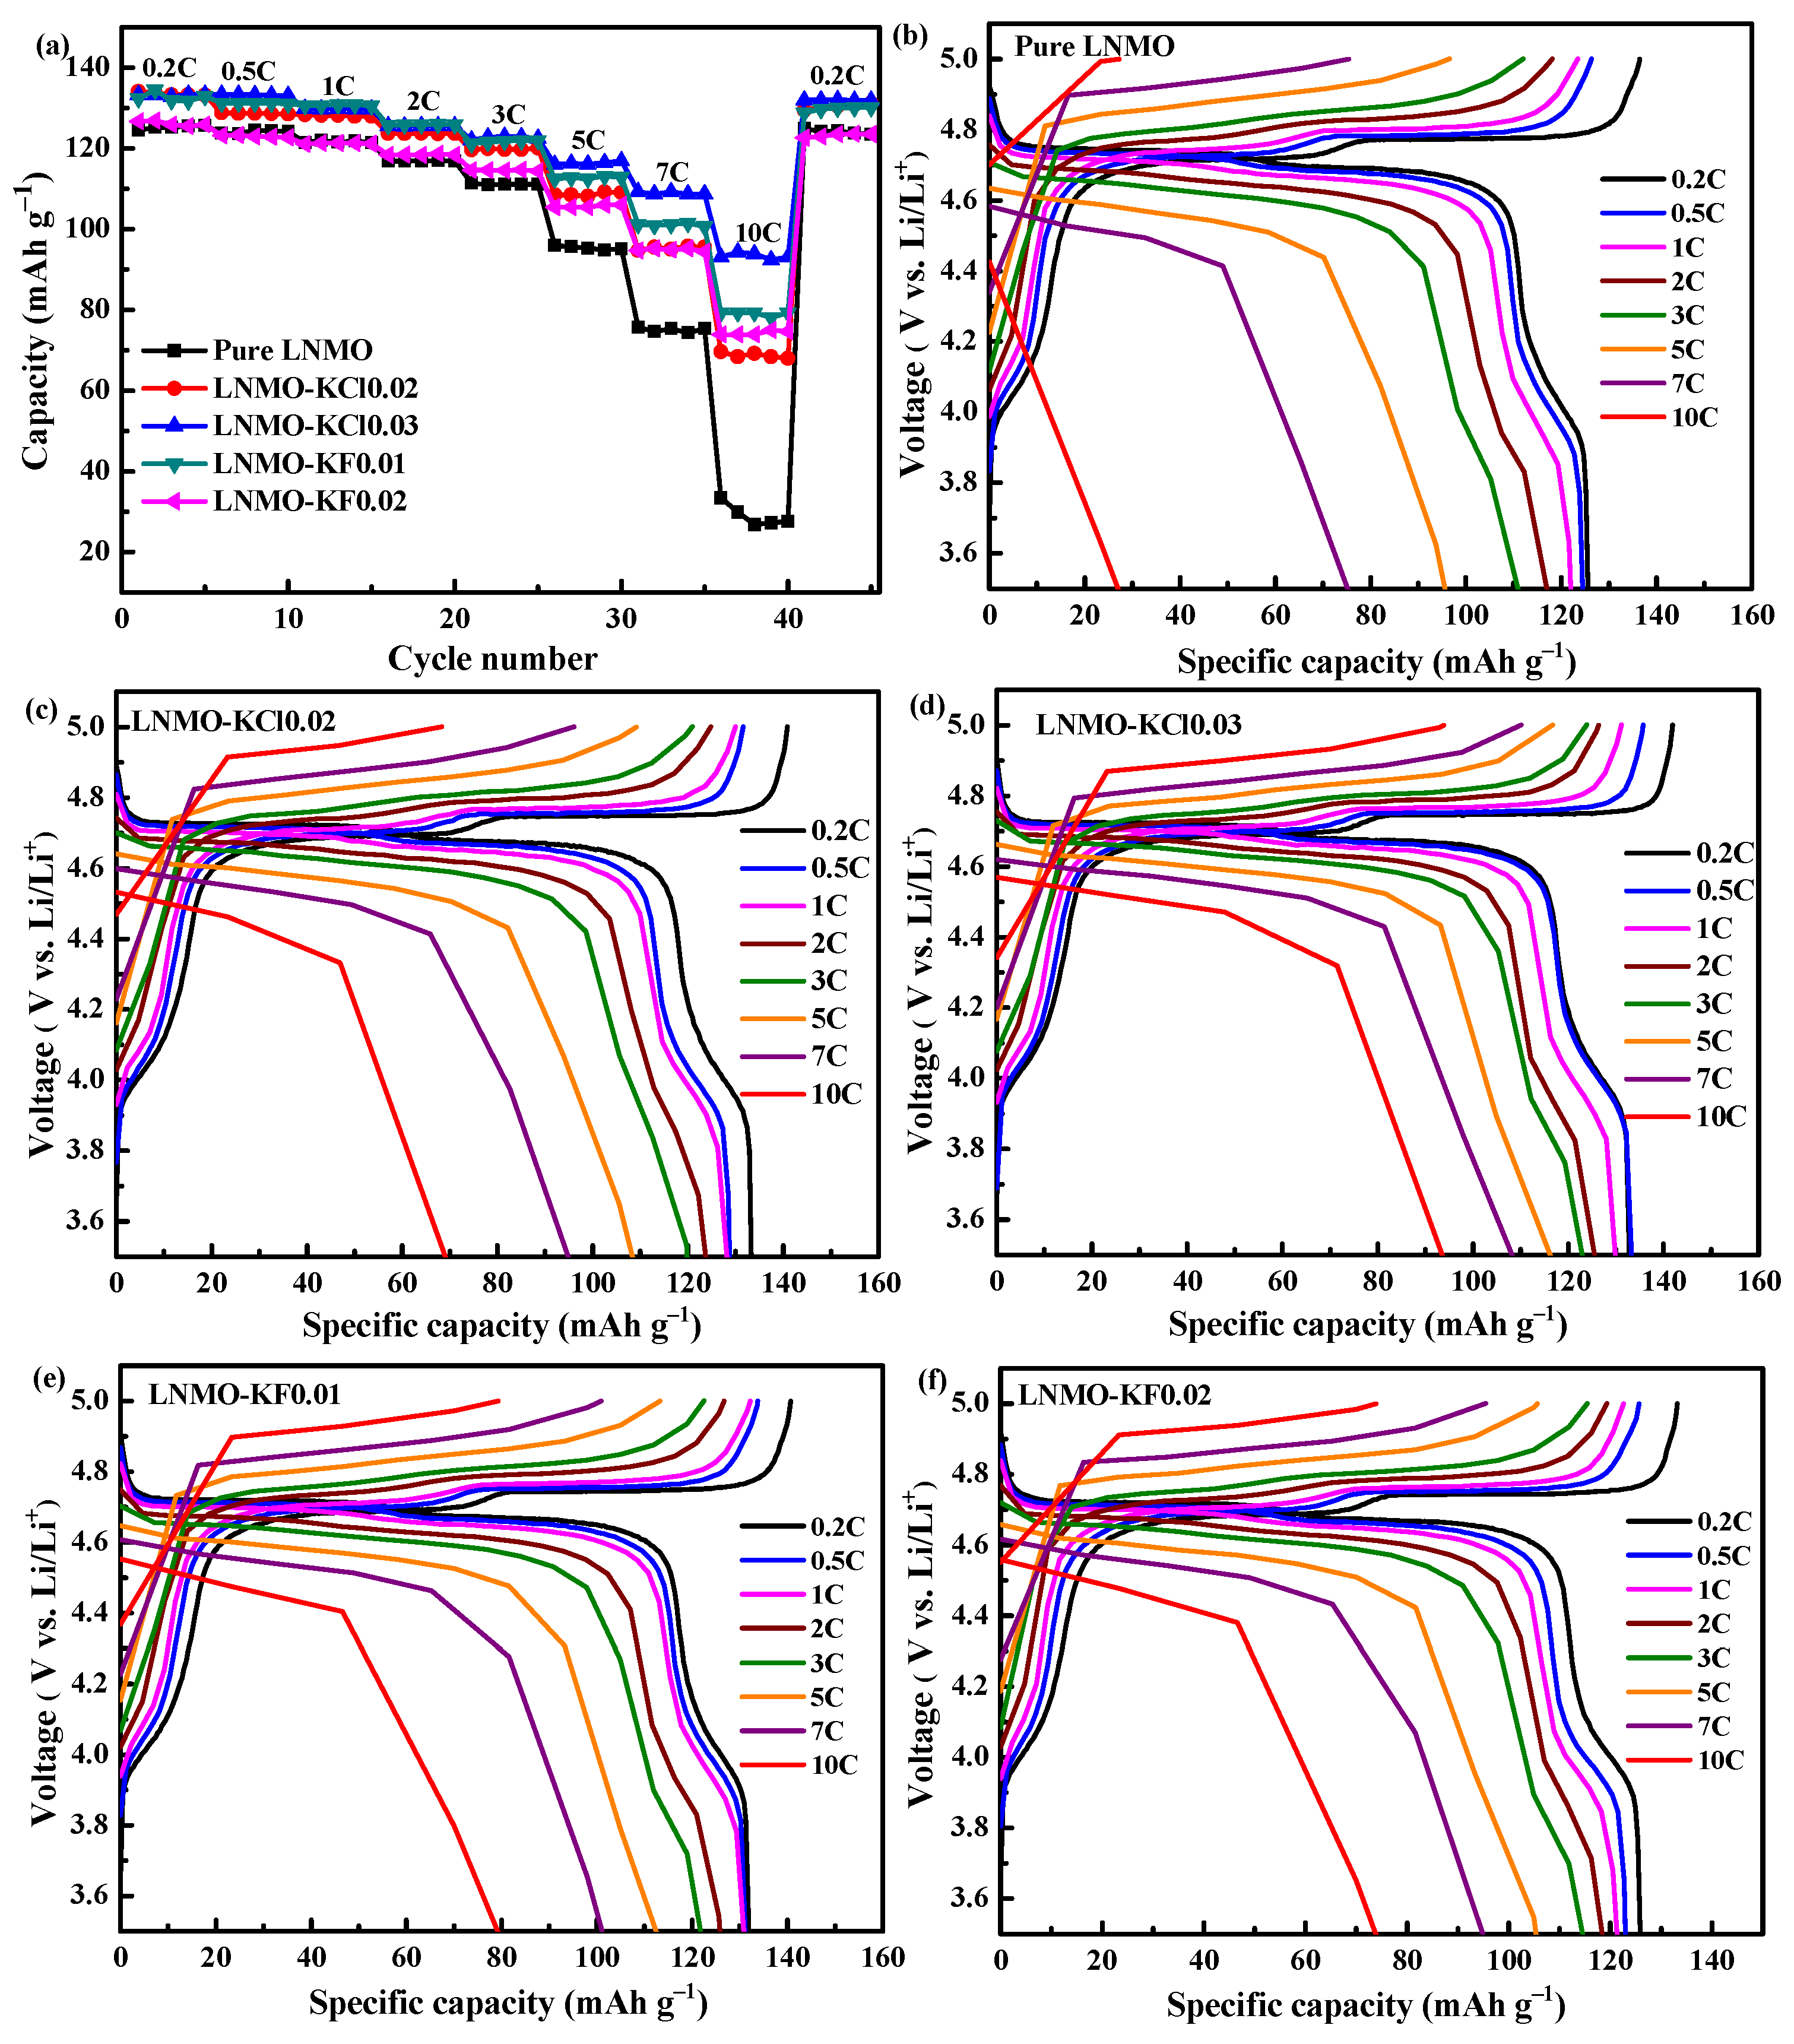
3.2. Electrochemical Properties
4. Conclusions
Supplementary Materials
Author Contributions
Funding
Data Availability Statement
Acknowledgments
Conflicts of Interest
References
- Choi, J.W.; Aurbach, D. Promise and reality of post-lithium-ion batteries with high energy densities. Nat. Rev. Mater. 2016, 1, 16013. [Google Scholar] [CrossRef]
- Zhang, H.; Zhao, H.; Khan, M.A.; Zou, W.; Xu, J.; Zhang, L.; Zhang, J. Recent progress in advanced electrode materials, separators and electrolytes for lithium batteries. J. Mater. Chem. A 2018, 6, 20564–20620. [Google Scholar] [CrossRef]
- Hua, W.; Chen, M.; Schwarz, B.; Knapp, M.; Bruns, M.; Barthel, J.; Yang, X.; Sigel, F.; Azmi, R.; Senyshyn, A.; et al. Lithium/Oxygen Incorporation and Microstructural Evolution during Synthesis of Li-Rich Layered Li[Li0.2Ni0.2Mn0.6]O2 Oxides. Adv. Energy Mater. 2019, 9, 1803094–1803104. [Google Scholar] [CrossRef]
- Hua, W.; Schwarz, B.; Azmi, R.; Müller, M.; Darma, M.S.D.; Knapp, M.; Senyshyn, A.; Heere, M.; Missyul, A.; Simonelli, L.; et al. Lithium-ion (de)intercalation mechanism in core-shell layered Li(Ni,Co,Mn)O2 cathode materials. Nano Energy 2020, 78, 105231. [Google Scholar] [CrossRef]
- Liang, G.; Peterson, V.K.; See, K.W.; Guo, Z.; Pang, W.K. Developing high-voltage spinel LiNi0.5Mn1.5O4 cathodes for high-energy-density lithium-ion batteries: Current achievements and future prospects. J. Mater. Chem. A 2020, 8, 15373–15398. [Google Scholar] [CrossRef]
- Ma, J.; Hu, P.; Cui, G.; Chen, L. Surface and Interface Issues in Spinel LiNi0.5Mn1.5O4: Insights into a Potential Cathode Material for High Energy Density Lithium Ion Batteries. Chem. Mater. 2016, 28, 3578–3606. [Google Scholar] [CrossRef]
- Chen, Y.; Li, Y.; Tang, S.; Guo, J.; Lei, T.; Deng, S.; Chang, S.; Zhu, J. Synthesis of LiNi0.5Mn1.5O4 via Ammonia-free Co-precipitation Method: Insight in the Effects of the Lithium Additions on the Morphology, Structure and Electrochemical properties. ChemistrySelect 2019, 4, 393–398. [Google Scholar] [CrossRef]
- Qian, Y.X.; Deng, Y.F.; Wan, L.N.; Xu, H.J.; Qin, X.S.; Chen, G.H. Investigation of the effect of extra lithium addition and post-annealing on the electrochemical performance of High-voltage spinel LiNi0.5Mn1.5O4 cathode material. J. Phys. Chem. 2014, C118, 15581–15589. [Google Scholar]
- Wang, J.; Lin, W.; Wu, B.; Zhao, J. Syntheses and electrochemical properties of the Na-Doped LiNi0.5Mn1.5O4 cathode materials for lith-ium-ion batteries. Electrochim. Acta 2014, 145, 245–253. [Google Scholar] [CrossRef]
- Luo, Y.; Lu, T.; Zhang, Y.; Yan, L.; Mao, S.S.; Xie, J. Surface-segregated, high-voltage spinel lithium-ion battery cathode material LiNi0.5Mn1.5O4 cathodes by aluminium doping with improved high-rate cyclability. J. Alloys Compd. 2017, 703, 289–297. [Google Scholar] [CrossRef]
- Sun, H.Y.; Kong, X.; Wang, B.S.; Luo, T.B.; Liu, G.Y. Cu doped LiNi0.5Mn1.5−xCuxO4 (x = 0, 0.03, 0.05, 0.10, 0.15) with significant im-proved electrochemical performance prepared by a modified low temperature solution combustion synthesis method. Ceram. Int. 2018, 44, 4603–4610. [Google Scholar] [CrossRef]
- Wu, W.; Guo, J.L.; Qin, X.; Bi, C.B.; Wang, J.F.; Wang, L.; Liang, G.C. Enhanced electrochemical performances of LiNi0.5Mn1.5O4 spi-nel in half-cell and full-cell via yttrium doping. J. Alloys Comp. 2017, 721, 712–730. [Google Scholar] [CrossRef]
- Yang, Y.; Li, S.; Zhang, Q.; Zhang, Y.; Xu, S. Spherical Agglomeration of Octahedral LiNi0.5Co4xMn1.5–3xO4 Cathode Material Prepared by a Continuous Coprecipitation Method for 5 V Lithium-Ion Batteries. Ind. Eng. Chem. Res. 2017, 56, 175–182. [Google Scholar] [CrossRef]
- Li, J.W.; Wang, H.L.; Dong, W.H.; Shi, Z.Q.; Xie, W.Q.; Qiao, H.L.; Yu, Q.Y.; Zhang, M.; Hu, J.B.; Yang, L.; et al. Phase transi-tion dominated high-rate performances of the high voltage LiNi0.5Mn1.5O4 cathode: Improvement on structure evolution and ionic diffu-sivity by Cr doping. J. Phys. Chem. 2018, C122, 25229–25236. [Google Scholar]
- Feng, S.; Kong, X.; Sun, H.; Wang, B.; Luo, T.; Liu, G. Effect of Zr doping on LiNi0.5Mn1.5O4 with ordered or disordered structures. J. Alloys Compd. 2018, 749, 1009–1018. [Google Scholar] [CrossRef]
- Deng, Y.F.; Zhao, S.X.; Xu, Y.H.; Gao, K.; Nan, C.W. Impact of P-doped in spinel LiNi0.5Mn1.5O4 on degree of disorder, grain mor-phology, and electrochemical performance. Chem. Mater. 2015, 27, 7734–7742. [Google Scholar] [CrossRef]
- Wei, A.; Mu, J.; He, R.; Bai, X.; Liu, Z.; Zhang, L.; Wang, Y.; Liu, Z. Enhancing electrochemical performance and structural stability of LiNi0.5Mn1.5O4 cathode material for rechargeable lithium-ion batteries by boron doping. Ceram. Int. 2021, 47, 226–237. [Google Scholar] [CrossRef]
- Zong, B.; Lang, Y.; Yan, S.; Deng, Z.; Gong, J.; Guo, J.; Wang, L.; Liang, G. Influence of Ti doping on microstructure and electrochemical performance of LiNi0.5Mn1.5O4 cathode material for lithium-ion batteries. Mater. Today Commun. 2020, 24, 101003. [Google Scholar] [CrossRef]
- Kocak, T.; Wu, L.; Wang, J.; Savaci, U.; Turan, S.; Zhang, X. The effect of vanadium doping on the cycling performance of LiNi0.5Mn1.5O4 spinel cathode for high voltage lithium-ion batteries. J. Electroanal. Chem. 2021, 881, 114926. [Google Scholar] [CrossRef]
- Luo, Y.; Li, H.; Lu, T.; Zhang, Y.; Mao, S.S.; Liu, Z.; Wen, W.; Xie, J.; Yan, L. Fluorine gradient-doped LiNi0.5Mn1.5O4 spinel with improved high voltage stability for Li-ion batteries. Electrochim. Acta 2017, 238, 237–245. [Google Scholar] [CrossRef]
- Kim, W.K.; Han, D.W.; Ryu, W.H.; Lim, S.J.; Eom, J.Y.; Kwon, H.S. Effects of Cl doping on the structural and electrochemical proper-ties of high voltage LiNi0.5Mn1.5O4 cathode materials for Li-ion batteries. J. Alloys Comp. 2014, 592, 48–52. [Google Scholar] [CrossRef]
- Sha, O.; Tang, Z.; Wang, S.; Yuan, W.; Qiao, Z.; Xu, Q.; Ma, L. The multi-substituted LiNi0.475Al0.01Cr0.04Mn1.475O3.95F0.05 cathode material with excellent rate capability and cycle life. Electrochim. Acta 2012, 77, 250–255. [Google Scholar] [CrossRef]
- Hagh, N.M.; Amatucci, G.G. Effect of cation and anion doping on microstructure and electrochemical properties of the LiNi0.5Mn1.5O4 -δ spinel. J. Power Sources 2014, 256, 457–469. [Google Scholar] [CrossRef]
- Li, H.; Luo, Y.; Xie, J.; Zhang, Q.; Yan, L. Effect of lithium and fluorine doping on the electrochemical and thermal stability of LiNi0.5Mn1.5O4 spinel cathode material. J. Alloys Compd. 2015, 639, 346–351. [Google Scholar] [CrossRef]
- Wei, A.J.; Li, W.; Chang, Q.; Bai, X.; He, R.; Zhang, L.H.; Liu, Z.F.; Wang, Y.J. Effect of Mg2+/F− co-doping on electrochemical perfor-mance of LiNi0.5Mn1.5O4 for 5 V lithium-ion batteries. Electrochim. Acta 2019, 323, 134692–134704. [Google Scholar] [CrossRef]
- Liu, J.; Sun, Z.; Xie, J.; Chen, H.; Wu, N.; Wu, B. Synthesis and electrochemical properties of LiNi0.5−xCuxMn1.5−yAlyO4 (x = 0, 0.05, y = 0, 0.05) as 5 V spinel materials. J. Power Sources 2013, 240, 95–100. [Google Scholar] [CrossRef]
- Li, S.Y.; Wei, Y.; Wang, P.; Feng, Y.H.; Liang, W.B.; Ding, H.; Cui, X.L. Synergism of Cu and Al co-doping on improvements of struc-tural integrity and electrochemical performance for LiNi0.5Mn1.5O4. J. Alloys Comp. 2019, 820, 153140. [Google Scholar] [CrossRef]
- Deng, J.; Xu, Y.; Xiong, L.; Li, L.; Sun, X.; Zhang, Y. Improving the fast discharge performance of high-voltage LiNi0.5Mn1.5O4 spinel by Cu 2+, Al 3+, Ti 4+ tri-doping. J. Alloys Compd. 2016, 677, 18–26. [Google Scholar] [CrossRef]
- Shu, X.; Zhao, H.; Hu, Y.; Liu, J.; Tan, M.; Liu, S.; Zhang, M.; Ran, Q.; Li, H.; Liu, X. Magnesium and silicon co-doped LiNi0.5Mn1.5O4 cathode material with outstanding cycling stability for lithium-ion batteries. Vacuum 2018, 156, 1–8. [Google Scholar] [CrossRef]
- Zheng, X.Y.; Liu, W.J.; Qu, Q.T.; Zheng, H.H.; Huang, Y.H. Bi-functions of titanium and lanthanum co-doping to enhance the electro-chemical performance of spinel LiNi0.5Mn1.5O4 cathode. J. Mater. 2019, 5, 156–163. [Google Scholar]
- Xiong, L.; Xu, Y.; Xiao, X.; Wang, J.; Li, Y. The effect of K-Ion on the electrochemical performance of spinel LiMn2O4. Electron. Mater. Lett. 2015, 11, 138–142. [Google Scholar] [CrossRef]
- Yang, Z.; Guo, X.; Xiang, W.; Hua, W.; Zhang, J.; He, F.; Wang, K.; Xiao, Y.; Zhong, B. K-doped layered LiNi0.5Co0.2Mn0.3O2 cathode material: Towards the superior rate capability and cycling performance. J. Alloys Compd. 2017, 699, 358–365. [Google Scholar] [CrossRef]
- Yang, M.C.; Hu, B.; Geng, F.S.; Li, C.; Lou, X.B.; Hu, B.W. Mitigating voltage decay in high-capacity Li1.2Ni0.2Mn0.6O2 cathode materi-al by surface K+ doping. Electrochim. Acta 2018, 291, 278–286. [Google Scholar] [CrossRef]
- Sun, Y.; Zhang, L.; Zhou, Y.; Shen, Y.; Hai, C.; Li, X.; Zeng, J.; Ren, X.; Ma, L.; Zhang, X.; et al. Study on Potassium Doped Modification of Li1.2Ni0.13Co0.13Mn0.54O2 Materials Synthesized by Novel Method for Lithium Ion Battery. J. Electrochem. Soc. 2018, 165, A333–A338. [Google Scholar] [CrossRef]
- Chen, Z.; Gong, X.; Zhu, H.; Cao, K.; Liu, Q.; Liu, J.; Li, L.; Duan, J. High Performance and Structural Stability of K and Cl Co-Doped LiNi0.5Co0.2Mn0.3O2 Cathode Materials in 4.6 Voltage. Front. Chem. 2019, 6, 643–652. [Google Scholar] [CrossRef] [PubMed]
- Minakshi, M.; Sharma, N.; Ralph, D.; Appadoo, D.; Nallathamby, K. Synthesis and Characterization of Li(Co0.5Ni0.5)PO4 Cathode for Li-Ion Aqueous Battery Applications. Electrochem. Solid State Lett. 2011, 14, A86–A89. [Google Scholar] [CrossRef]
- Mu, J.; Zhang, L.; He, R.; Li, X.; Bai, X.; Tian, L.; Zhang, X.; Wei, A.; Liu, Z. Enhancing the electrochemical performance of LiNi0.5Mn1.5O4 cathode material by a conductive LaCoO3 coating. J. Alloys Compd. 2021, 865, 158629. [Google Scholar] [CrossRef]
- Bhuvaneswari, S.; Varadaraju, U.; Gopalan, R.; Prakash, R. Sc-doping induced cation-disorder in LiNi0.5Mn1.5O4 spinel leading to improved electrochemical performance as cathode in lithium ion batteries. Electrochim. Acta 2019, 327, 135008. [Google Scholar] [CrossRef]
- Liu, Y.; Lu, Z.; Deng, C.; Ding, J.; Xu, Y.; Lu, X.; Yang, G. A novel LiCoPO4-coated core–shell structure for spinel LiNi0.5Mn1.5O4 as a high-performance cathode material for lithium-ion batteries. J. Mater. Chem. A 2016, 5, 996–1004. [Google Scholar] [CrossRef]
- Kim, H.; Byun, D.J.; Chang, W.Y.; Jung, H.G.; Choi, W.C. A nano-LiNbO3 coating layer and diffusion-induced surface control towards high-performance 5 V spinel cathodes for rechargeable batteries. J. Mater. Chem. 2017, A5, 25077–25089. [Google Scholar] [CrossRef]
- Han, D.; Ryu, W.-H.; Kim, W.-K.; Eom, J.-Y.; Kwon, H.-S. Effects of Li and Cl Codoping on the Electrochemical Performance and Structural Stability of LiMn2O4 Cathode Materials for Hybrid Electric Vehicle Applications. J. Phys. Chem. C 2013, 117, 4913–4919. [Google Scholar] [CrossRef]
- Chen, Z.; Zhao, R.; Li, A.; Hu, H.; Liang, G.; Lan, W.; Cao, Z.; Chen, H. Polyhedral ordered LiNi0.5Mn1.5O4 spinel with excellent electrochemical properties in extreme conditions. J. Power Sources 2015, 274, 265–273. [Google Scholar] [CrossRef]
- Liu, H.; Kloepsch, R.; Wang, J.; Winter, M.; Li, J. Truncated octahedral LiNi0.5Mn1.5O4 cathode material for ultralong-life lithium-ion battery: Positive (100) surfaces in high-voltage spinel system. J. Power Sources 2015, 300, 430–437. [Google Scholar] [CrossRef]
- Mao, J.; Dai, K.H.; Xuan, M.J.; Shao, G.S.; Qiao, R.M.; Yang, W.L.; Battaglia, V.S.; Liu, G. The effect of chromium and niobium dop-ing on the morphology and electrochemical performance of high-voltage spinel LiNi0.5Mn1.5O4 cathode material. ACS Appl. Mater. Interfaces 2016, 8, 9116–9124. [Google Scholar] [CrossRef]
- Kim, J.-H.; Huq, A.; Chi, M.; Pieczonka, N.P.; Lee, E.; Bridges, C.A.; Tessema, M.M.; Manthiram, A.; Persson, K.A.; Powell, B.R. Integrated Nano-Domains of Disordered and Ordered Spinel Phases in LiNi0.5Mn1.5O4 for Li-Ion Batteries. Chem. Mater. 2014, 26, 4377–4386. [Google Scholar] [CrossRef] [Green Version]
- Wang, S.; Hua, W.; Zhou, S.; He, X.; Liu, L. In situ synchrotron radiation diffraction study of the Li+ de/intercalation behavior in spinel LiNi0.5Mn1.5O4−δ. Chem. Eng. J. 2020, 400, 125998. [Google Scholar] [CrossRef]
- Liu, W.; Shi, Q.; Qu, Q.; Gao, T.; Zhu, G.; Shao, J.; Zheng, H. Improved Li-ion diffusion and stability of a LiNi0.5Mn1.5O4 cathode through in situ co-doping with dual-metal cations and incorporation of a superionic conductor. J. Mater. Chem. A 2017, 5, 145–154. [Google Scholar] [CrossRef]
- Sundaram, M.M.; Watcharatharapong, T.; Duraisamy, S.; Rao, P.T.; Munichandraiah, N.; Chakraborty, S.; Ahuja, R. Synthesis, and crystal and electronic structure of sodium metal phosphate for use as a hybrid capacitor in non-aqueous electrolyte. Dalton Trans. 2015, 44, 20108–20120. [Google Scholar] [CrossRef] [Green Version]


| Sample | Lattice Parameters | RP (%) | RWP (%) | LixNi1−xO (wt.%) | |
|---|---|---|---|---|---|
| a/Å | V/Å3 | ||||
| Pure LNMO | 8.1726(8) | 545.8753(5) | 10.1 | 16.0 | 3.9 |
| LNMO-KCl0.02 | 8.1771(0) | 546.7615(0) | 10.4 | 16.6 | 3.3 |
| LNMO-KCl0.03 | 8.1815(2) | 547.6486(1) | 12.0 | 17.6 | 1.5 |
| LNMO-KF0.01 | 8.1768(6) | 546.7133(6) | 10.3 | 16.0 | 2.4 |
| LNMO-KF0.02 | 8.1754(0) | 546.4205(6) | 9.4 | 14.6 | 2.0 |
| υ (mVs−1) | Pure LNMO | LNMO-KCl0.02 | LNMO-KCl0.03 | LNMO-KF0.01 | LNMO-KF0.02 | ||||||||||
|---|---|---|---|---|---|---|---|---|---|---|---|---|---|---|---|
| φpa | φpc | ∆V | φpa | φpc | ∆V | φpa | φpc | ∆V | φpa | φpc | ∆V | φpa | φpc | ∆V | |
| 0.1 | 4.827 | 4.624 | 0.203 | 4.819 | 4.608 | 0.211 | 4.804 | 4.624 | 0.180 | 4.804 | 4.623 | 0.181 | 4.811 | 4.617 | 0.194 |
| 0.2 | 4.849 | 4.581 | 0.268 | 4.852 | 4.577 | 0.275 | 4.836 | 4.589 | 0.247 | 4.838 | 4.587 | 0.251 | 4.842 | 4.585 | 0.257 |
| 0.3 | 4.881 | 4.548 | 0.333 | 4.872 | 4.552 | 0.320 | 4.856 | 4.565 | 0.291 | 4.860 | 4.565 | 0.295 | 4.864 | 4.562 | 0.302 |
| 0.4 | 4.901 | 4.519 | 0.382 | 4.890 | 4.534 | 0.356 | 4.874 | 4.547 | 0.327 | 4.877 | 4.545 | 0.332 | 4.884 | 4.541 | 0.343 |
| 0.5 | 4.921 | 4.495 | 0.426 | 4.907 | 4.511 | 0.396 | 4.893 | 4.524 | 0.361 | 4.890 | 4.528 | 0.362 | 4.90 | 4.522 | 0.378 |
| Sample | Li-Extraction DLi (cm2 s−1) | Li-Insertion DLi (cm2 s−1) |
|---|---|---|
| Pure LNMO | 5.77 × 10⁻¹¹ | 6.70 × 10⁻¹¹ |
| LNMO-KCl0.02 | 9.08 × 10⁻¹¹ | 1.06 × 10⁻¹⁰ |
| LNMO-KCl0.03 | 1.14 × 10⁻¹⁰ | 1.64 × 10⁻¹⁰ |
| LNMO-KF0.01 | 6.34 × 10⁻¹¹ | 8.79 × 10⁻¹¹ |
| LNMO-KF0.02 | 8.33 × 10⁻¹¹ | 7.60 × 10⁻¹¹ |
| Sample | Discharge Capacity (mAh g−1) | |||||||
|---|---|---|---|---|---|---|---|---|
| 0.2C | 0.5C | 1C | 2C | 3C | 5C | 7C | 10C | |
| Pure LNMO | 125.7 | 124.8 | 121.8 | 117.0 | 111.1 | 95.2 | 73.0 | 27.6 |
| LNMO-KCl0.02 | 133.3 | 128.7 | 128.2 | 123.8 | 119.8 | 108.1 | 95.0 | 69.2 |
| LNMO-KCl0.03 | 133.8 | 133.3 | 129.9 | 125.7 | 123.0 | 116.1 | 109.3 | 93.9 |
| LNMO-KF0.01 | 131.9 | 131.2 | 130.8 | 125.9 | 121.8 | 112.5 | 101.2 | 79.3 |
| LNMO-KF0.02 | 126.9 | 123.0 | 121.3 | 118.4 | 114.5 | 105.4 | 94.9 | 73.9 |
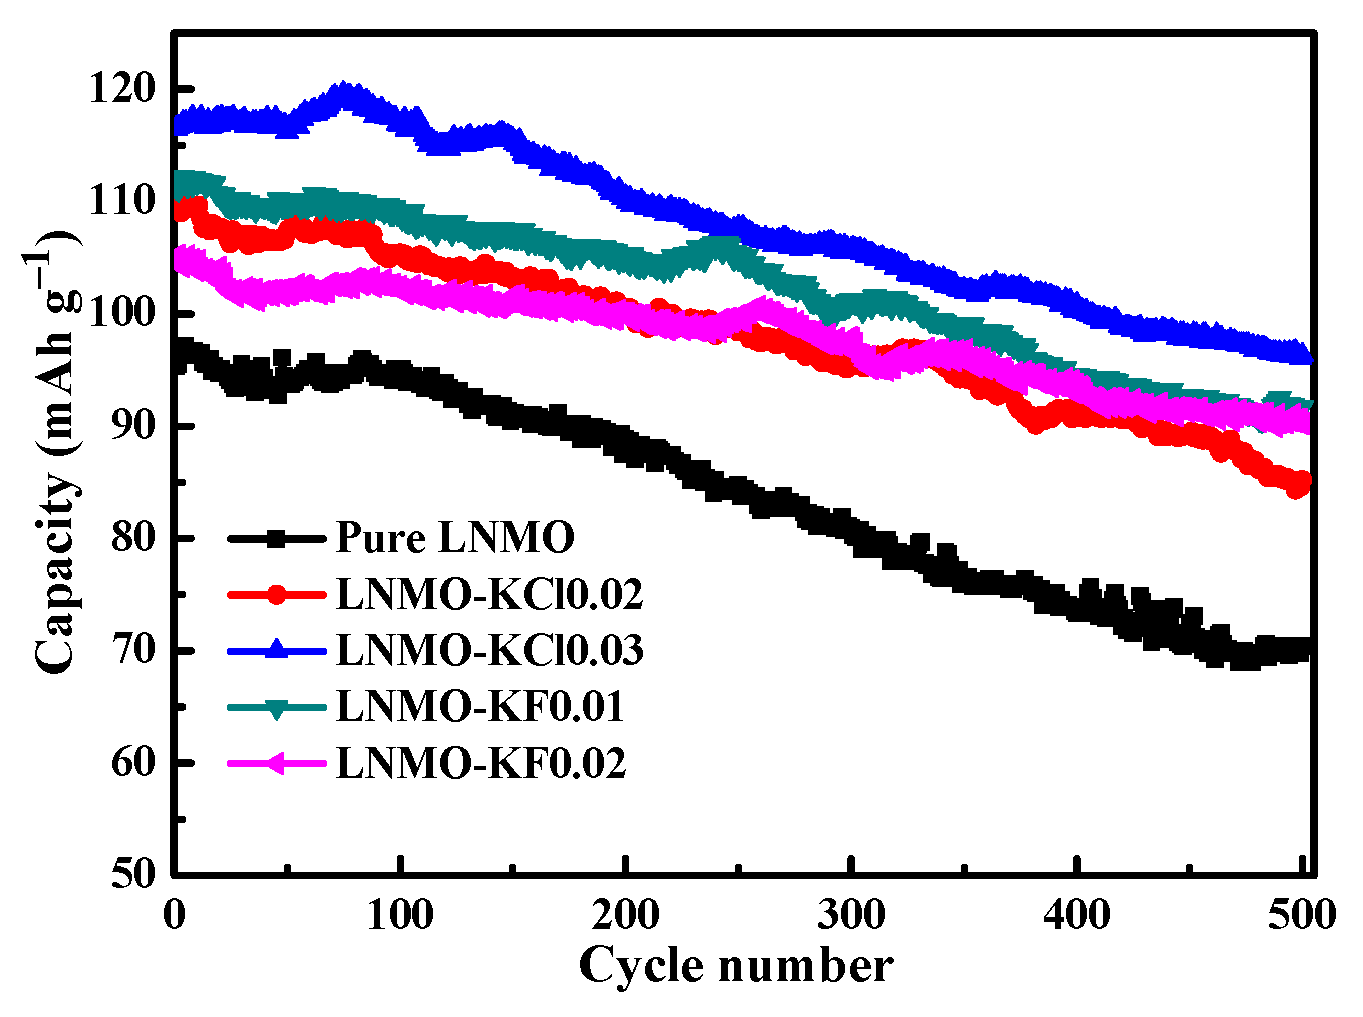
| Sample | Discharge Capacity at 5C (mAh g−1) | Retention at 5C (%) | |
|---|---|---|---|
| 1st Cycle | 500th Cycle | ||
| Pure LNMO | 95.3 | 70.4 | 73.9 |
| LNMO-KCl0.02 | 109.6 | 85.2 | 77.7 |
| LNMO-KCl0.03 | 116.5 | 96.3 | 82.7 |
| LNMO-KF0.01 | 111.2 | 91.7 | 82.5 |
| LNMO-KF0.02 | 105.1 | 90.2 | 85.8 |
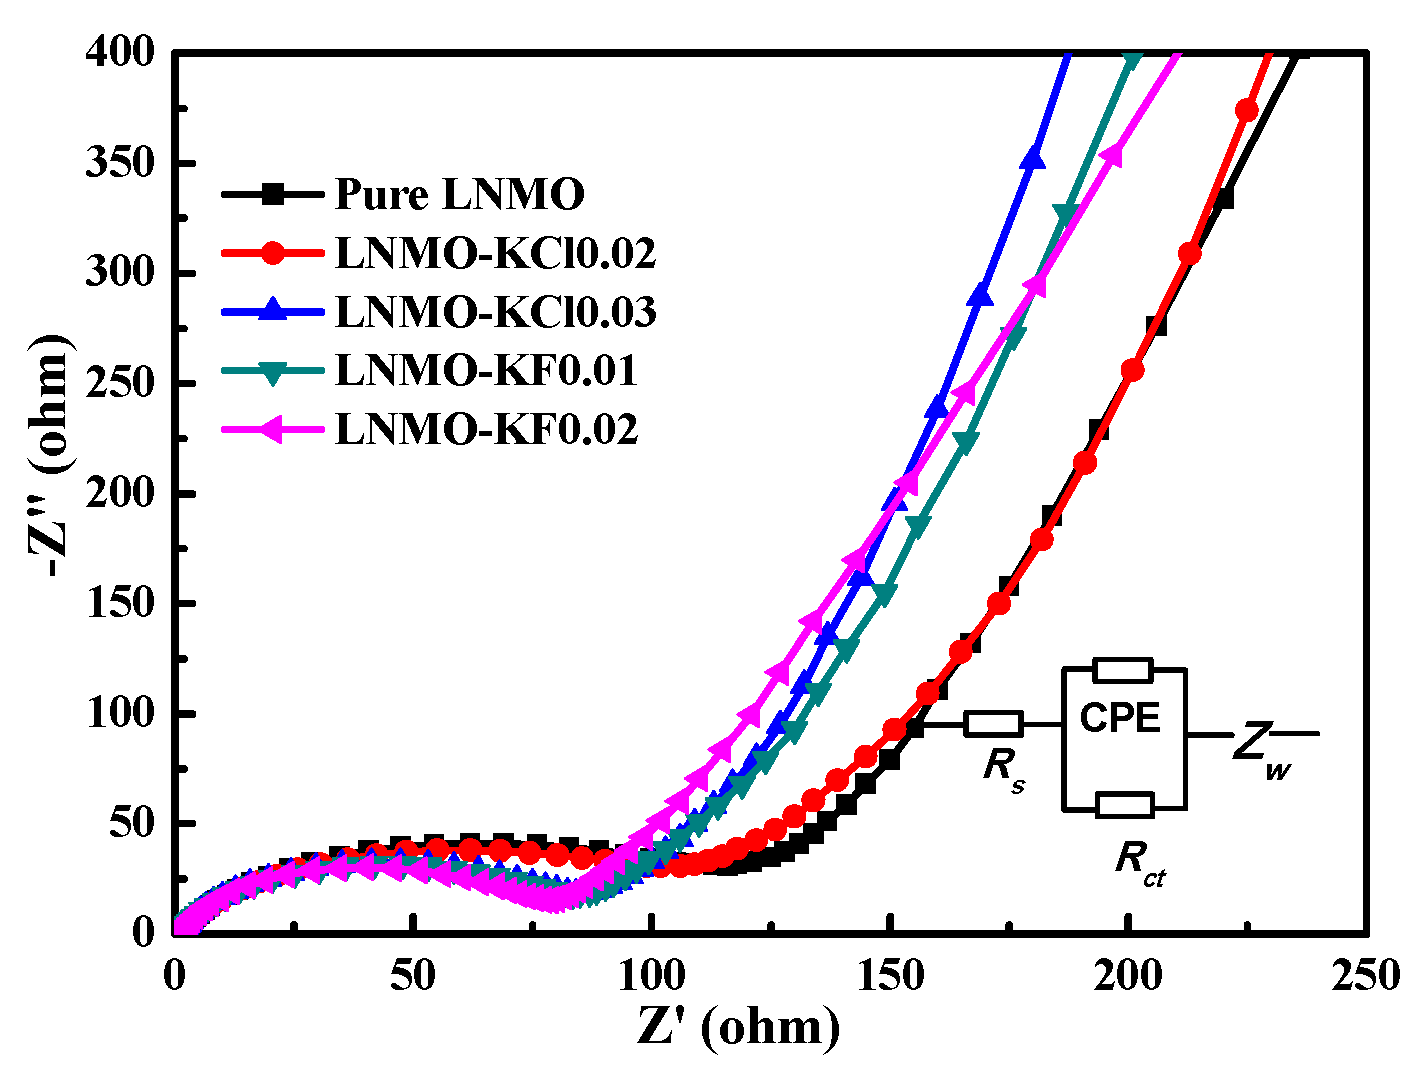
| Sample | Rs(Ω) | Rct(Ω) |
|---|---|---|
| Pure LNMO | 1.6 | 121.8 |
| LNMO-KCl0.02 | 1.6 | 100.5 |
| LNMO-KCl0.03 | 1.5 | 82.6 |
| LNMO-KF0.01 | 1.7 | 81.8 |
| LNMO-KF0.02 | 1.7 | 77.1 |
Publisher’s Note: MDPI stays neutral with regard to jurisdictional claims in published maps and institutional affiliations. |
© 2021 by the authors. Licensee MDPI, Basel, Switzerland. This article is an open access article distributed under the terms and conditions of the Creative Commons Attribution (CC BY) license (https://creativecommons.org/licenses/by/4.0/).
Share and Cite
Wei, A.; Mu, J.; He, R.; Bai, X.; Li, X.; Zhang, L.; Wang, Y.; Liu, Z.; Wang, S. Enhanced Electrochemical Performance of LiNi0.5Mn1.5O4 Composite Cathodes for Lithium-Ion Batteries by Selective Doping of K+/Cl− and K+/F−. Nanomaterials 2021, 11, 2323. https://doi.org/10.3390/nano11092323
Wei A, Mu J, He R, Bai X, Li X, Zhang L, Wang Y, Liu Z, Wang S. Enhanced Electrochemical Performance of LiNi0.5Mn1.5O4 Composite Cathodes for Lithium-Ion Batteries by Selective Doping of K+/Cl− and K+/F−. Nanomaterials. 2021; 11(9):2323. https://doi.org/10.3390/nano11092323
Chicago/Turabian StyleWei, Aijia, Jinping Mu, Rui He, Xue Bai, Xiaohui Li, Lihui Zhang, Yanji Wang, Zhenfa Liu, and Suning Wang. 2021. "Enhanced Electrochemical Performance of LiNi0.5Mn1.5O4 Composite Cathodes for Lithium-Ion Batteries by Selective Doping of K+/Cl− and K+/F−" Nanomaterials 11, no. 9: 2323. https://doi.org/10.3390/nano11092323
APA StyleWei, A., Mu, J., He, R., Bai, X., Li, X., Zhang, L., Wang, Y., Liu, Z., & Wang, S. (2021). Enhanced Electrochemical Performance of LiNi0.5Mn1.5O4 Composite Cathodes for Lithium-Ion Batteries by Selective Doping of K+/Cl− and K+/F−. Nanomaterials, 11(9), 2323. https://doi.org/10.3390/nano11092323