
ZnO Polymeric Composite Films for n-Decane Removal from Air Streams in a Continuous Flow NETmix Photoreactor under UVA Light

 , ,
, ,  ,
,  and
and
Abstract
:
1. Introduction
2. Materials and Methods
2.1. Chemicals
2.2. Photocatalyst Preparation
2.3. Catalyst Film Preparation
2.4. Catalyst Film Characterization
2.5. Photocatalytic Oxidation Tests
3. Results and Discussion
3.1. Photocatalyst Deactivation
3.2. Effect of Polymeric Films Preparation Procedures
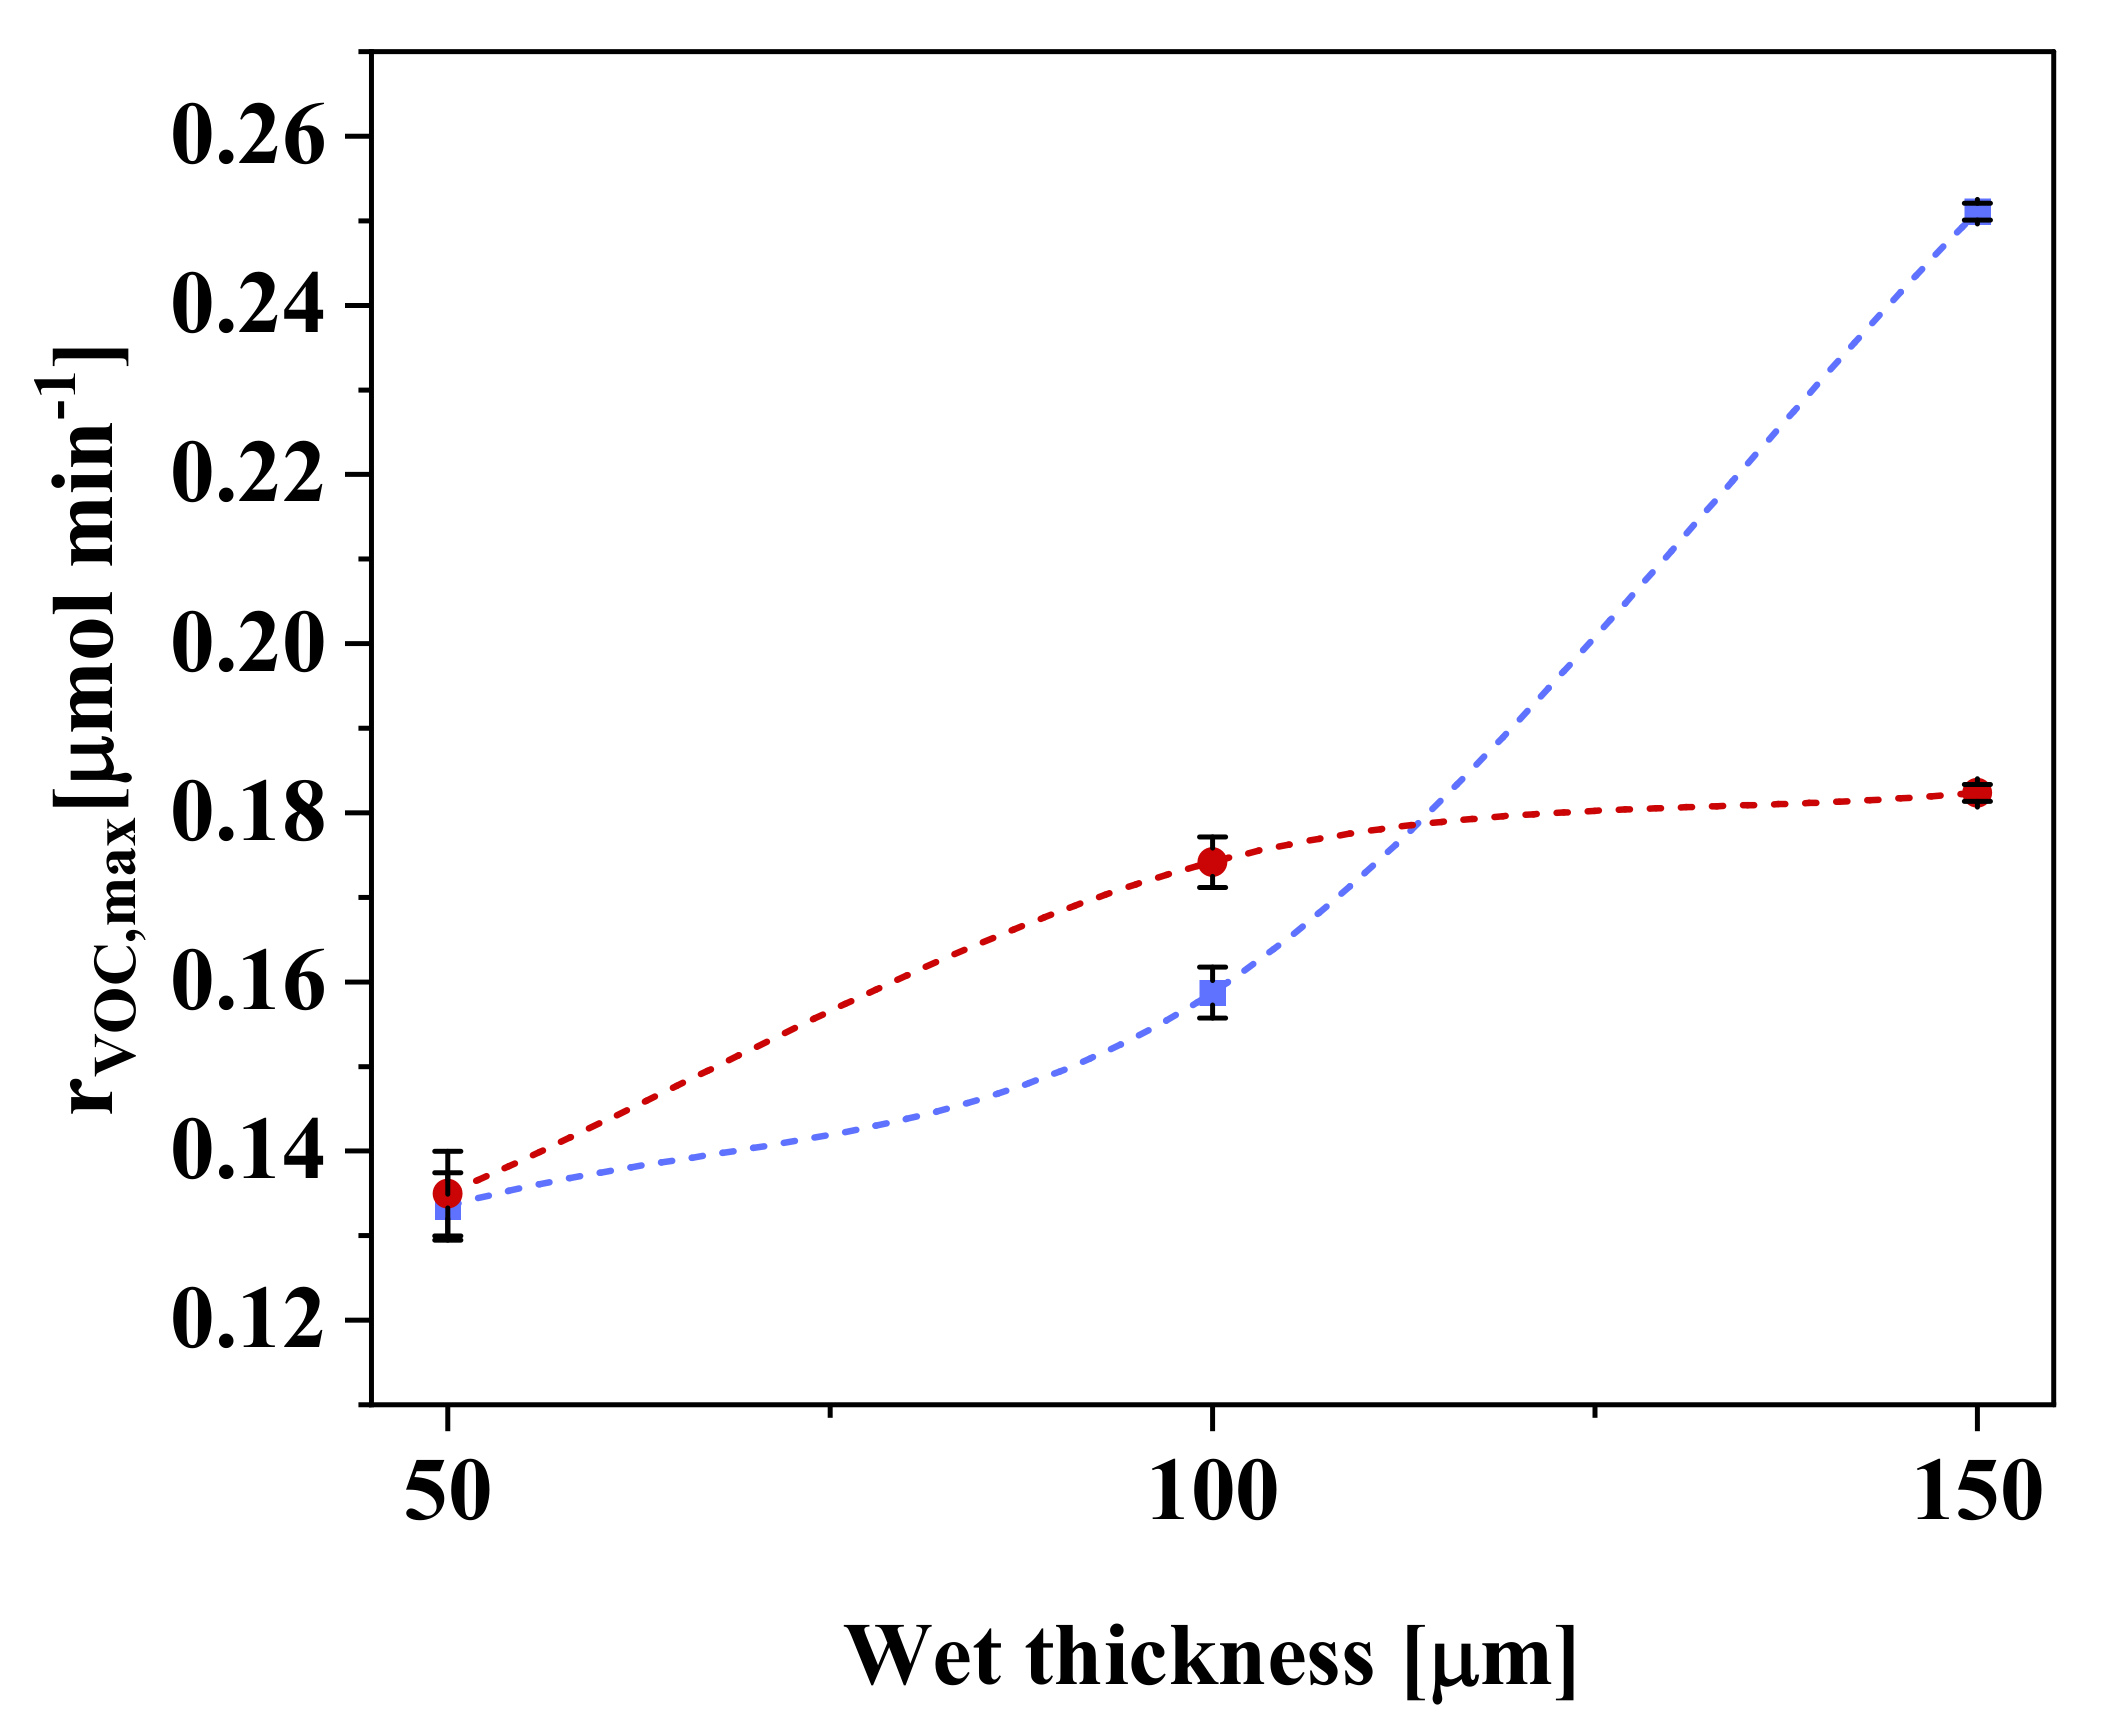
3.3. Effect of Polymeric Composite Film Thickness
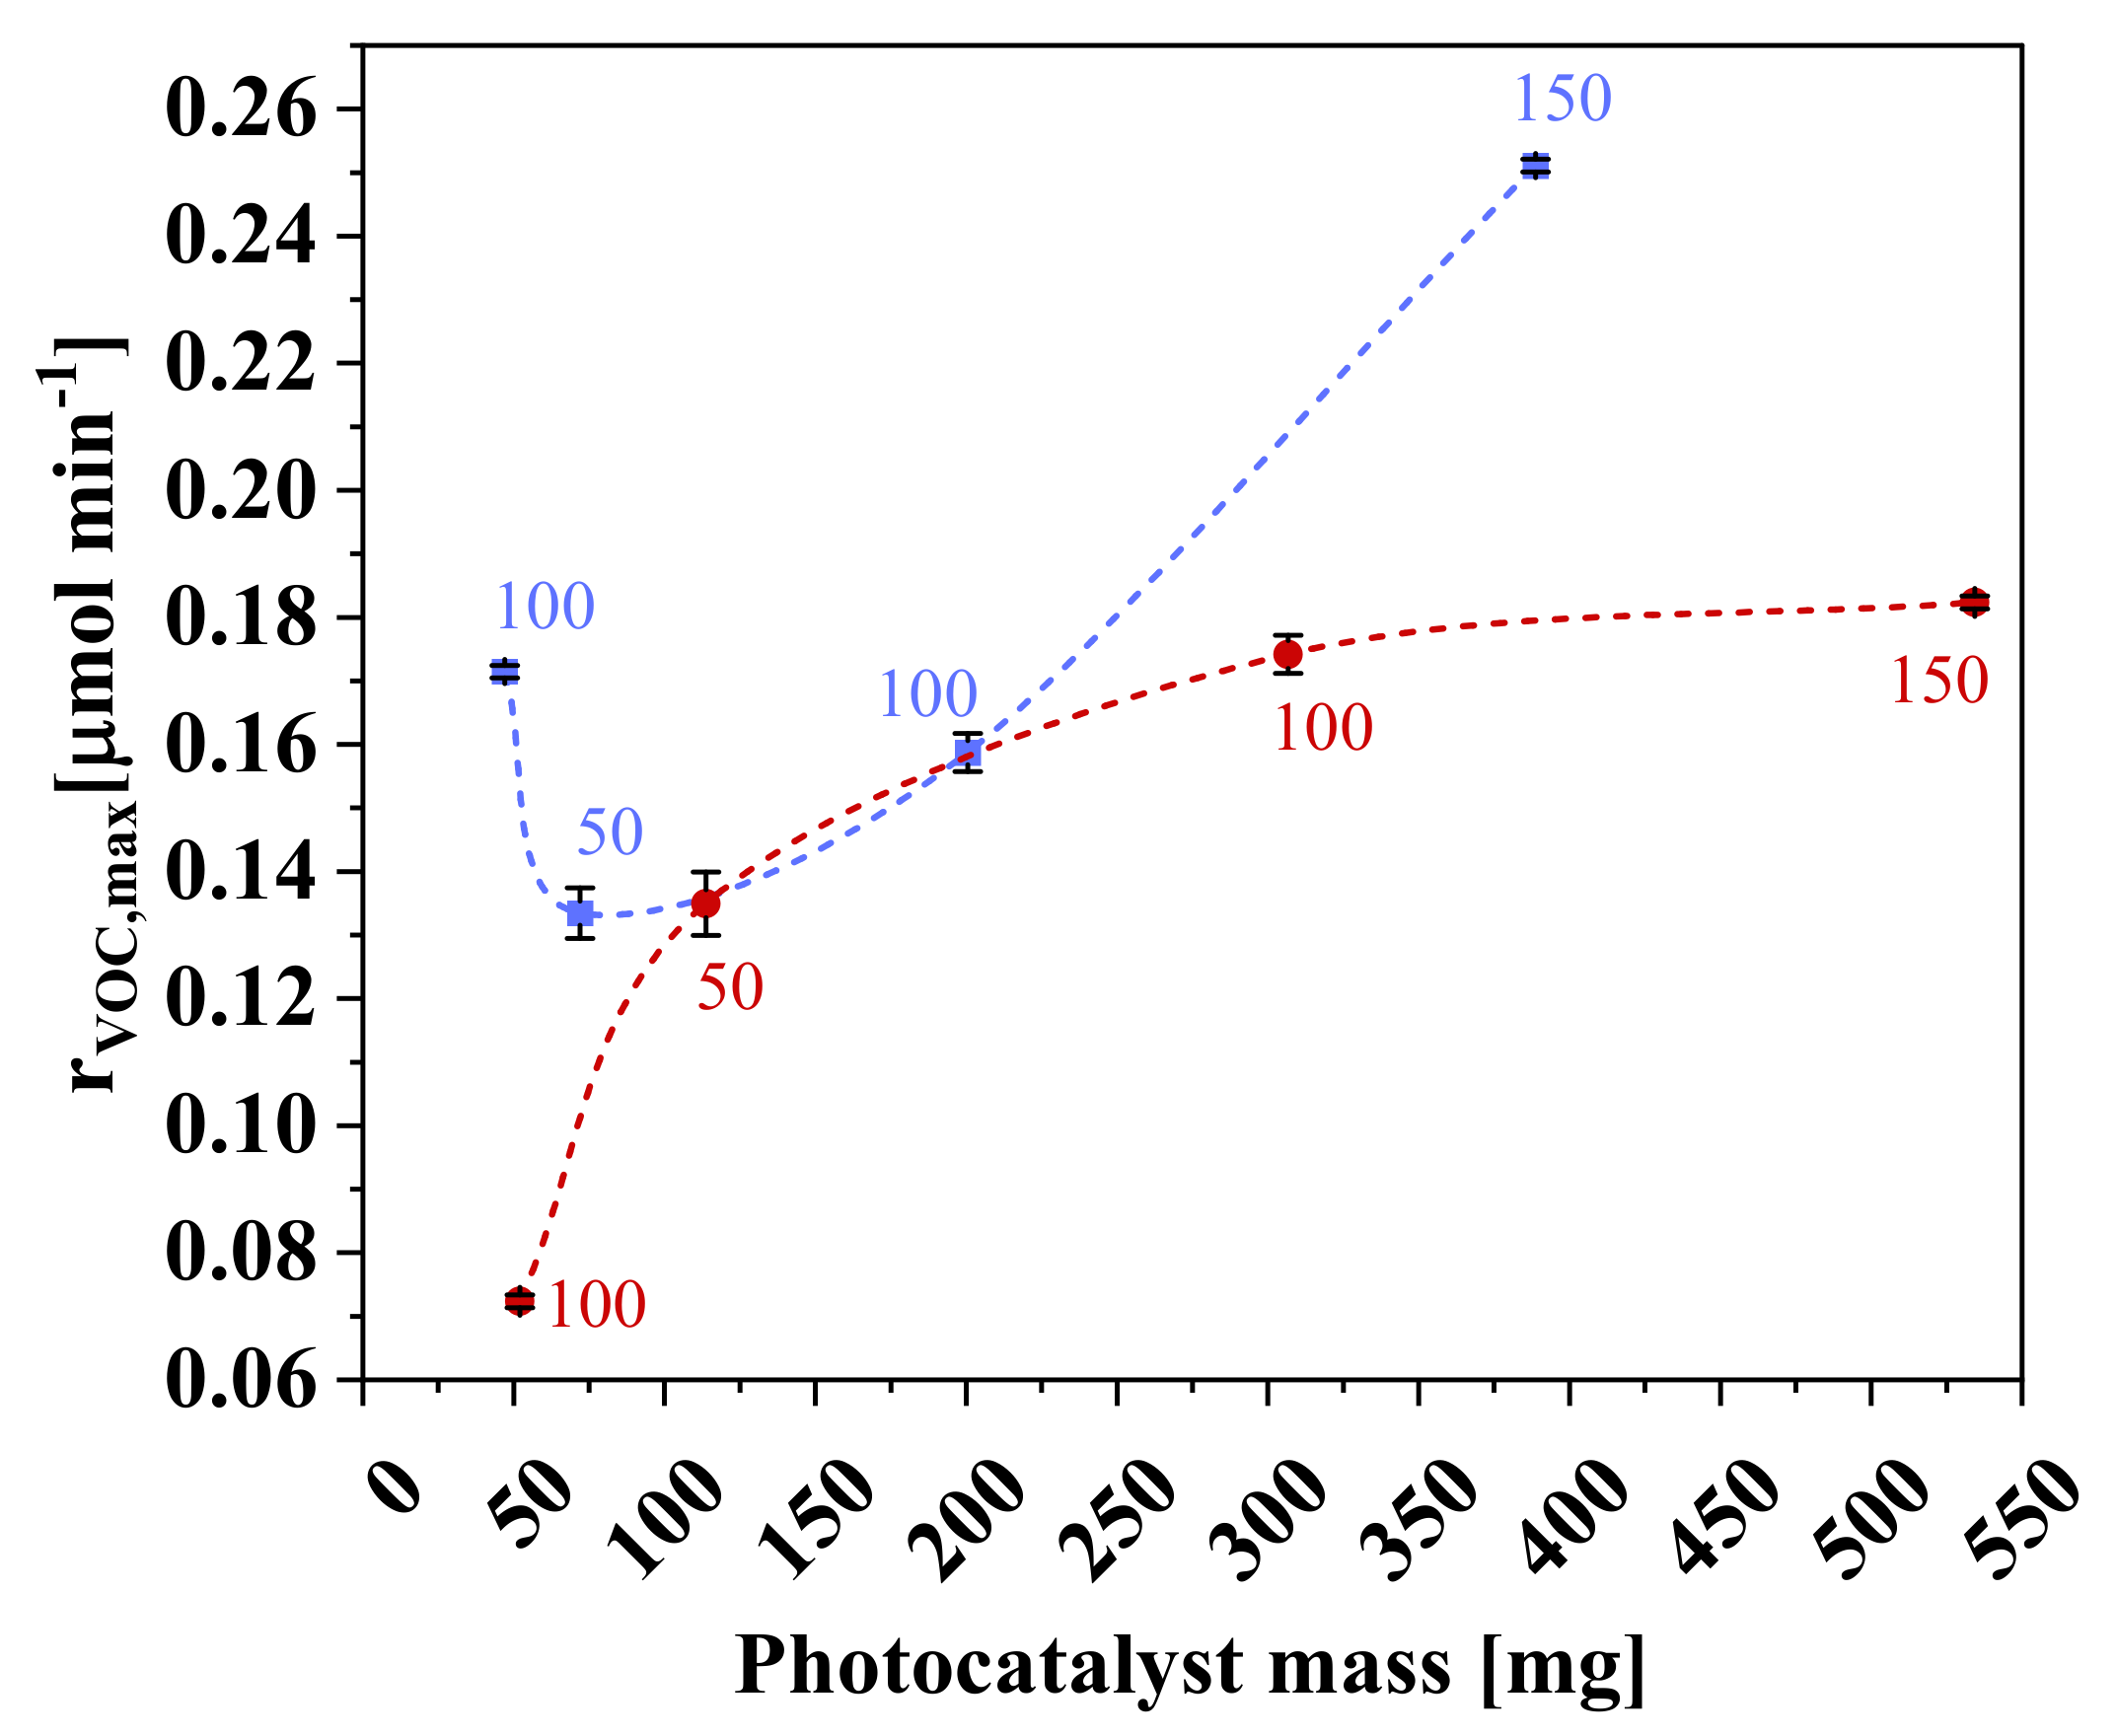
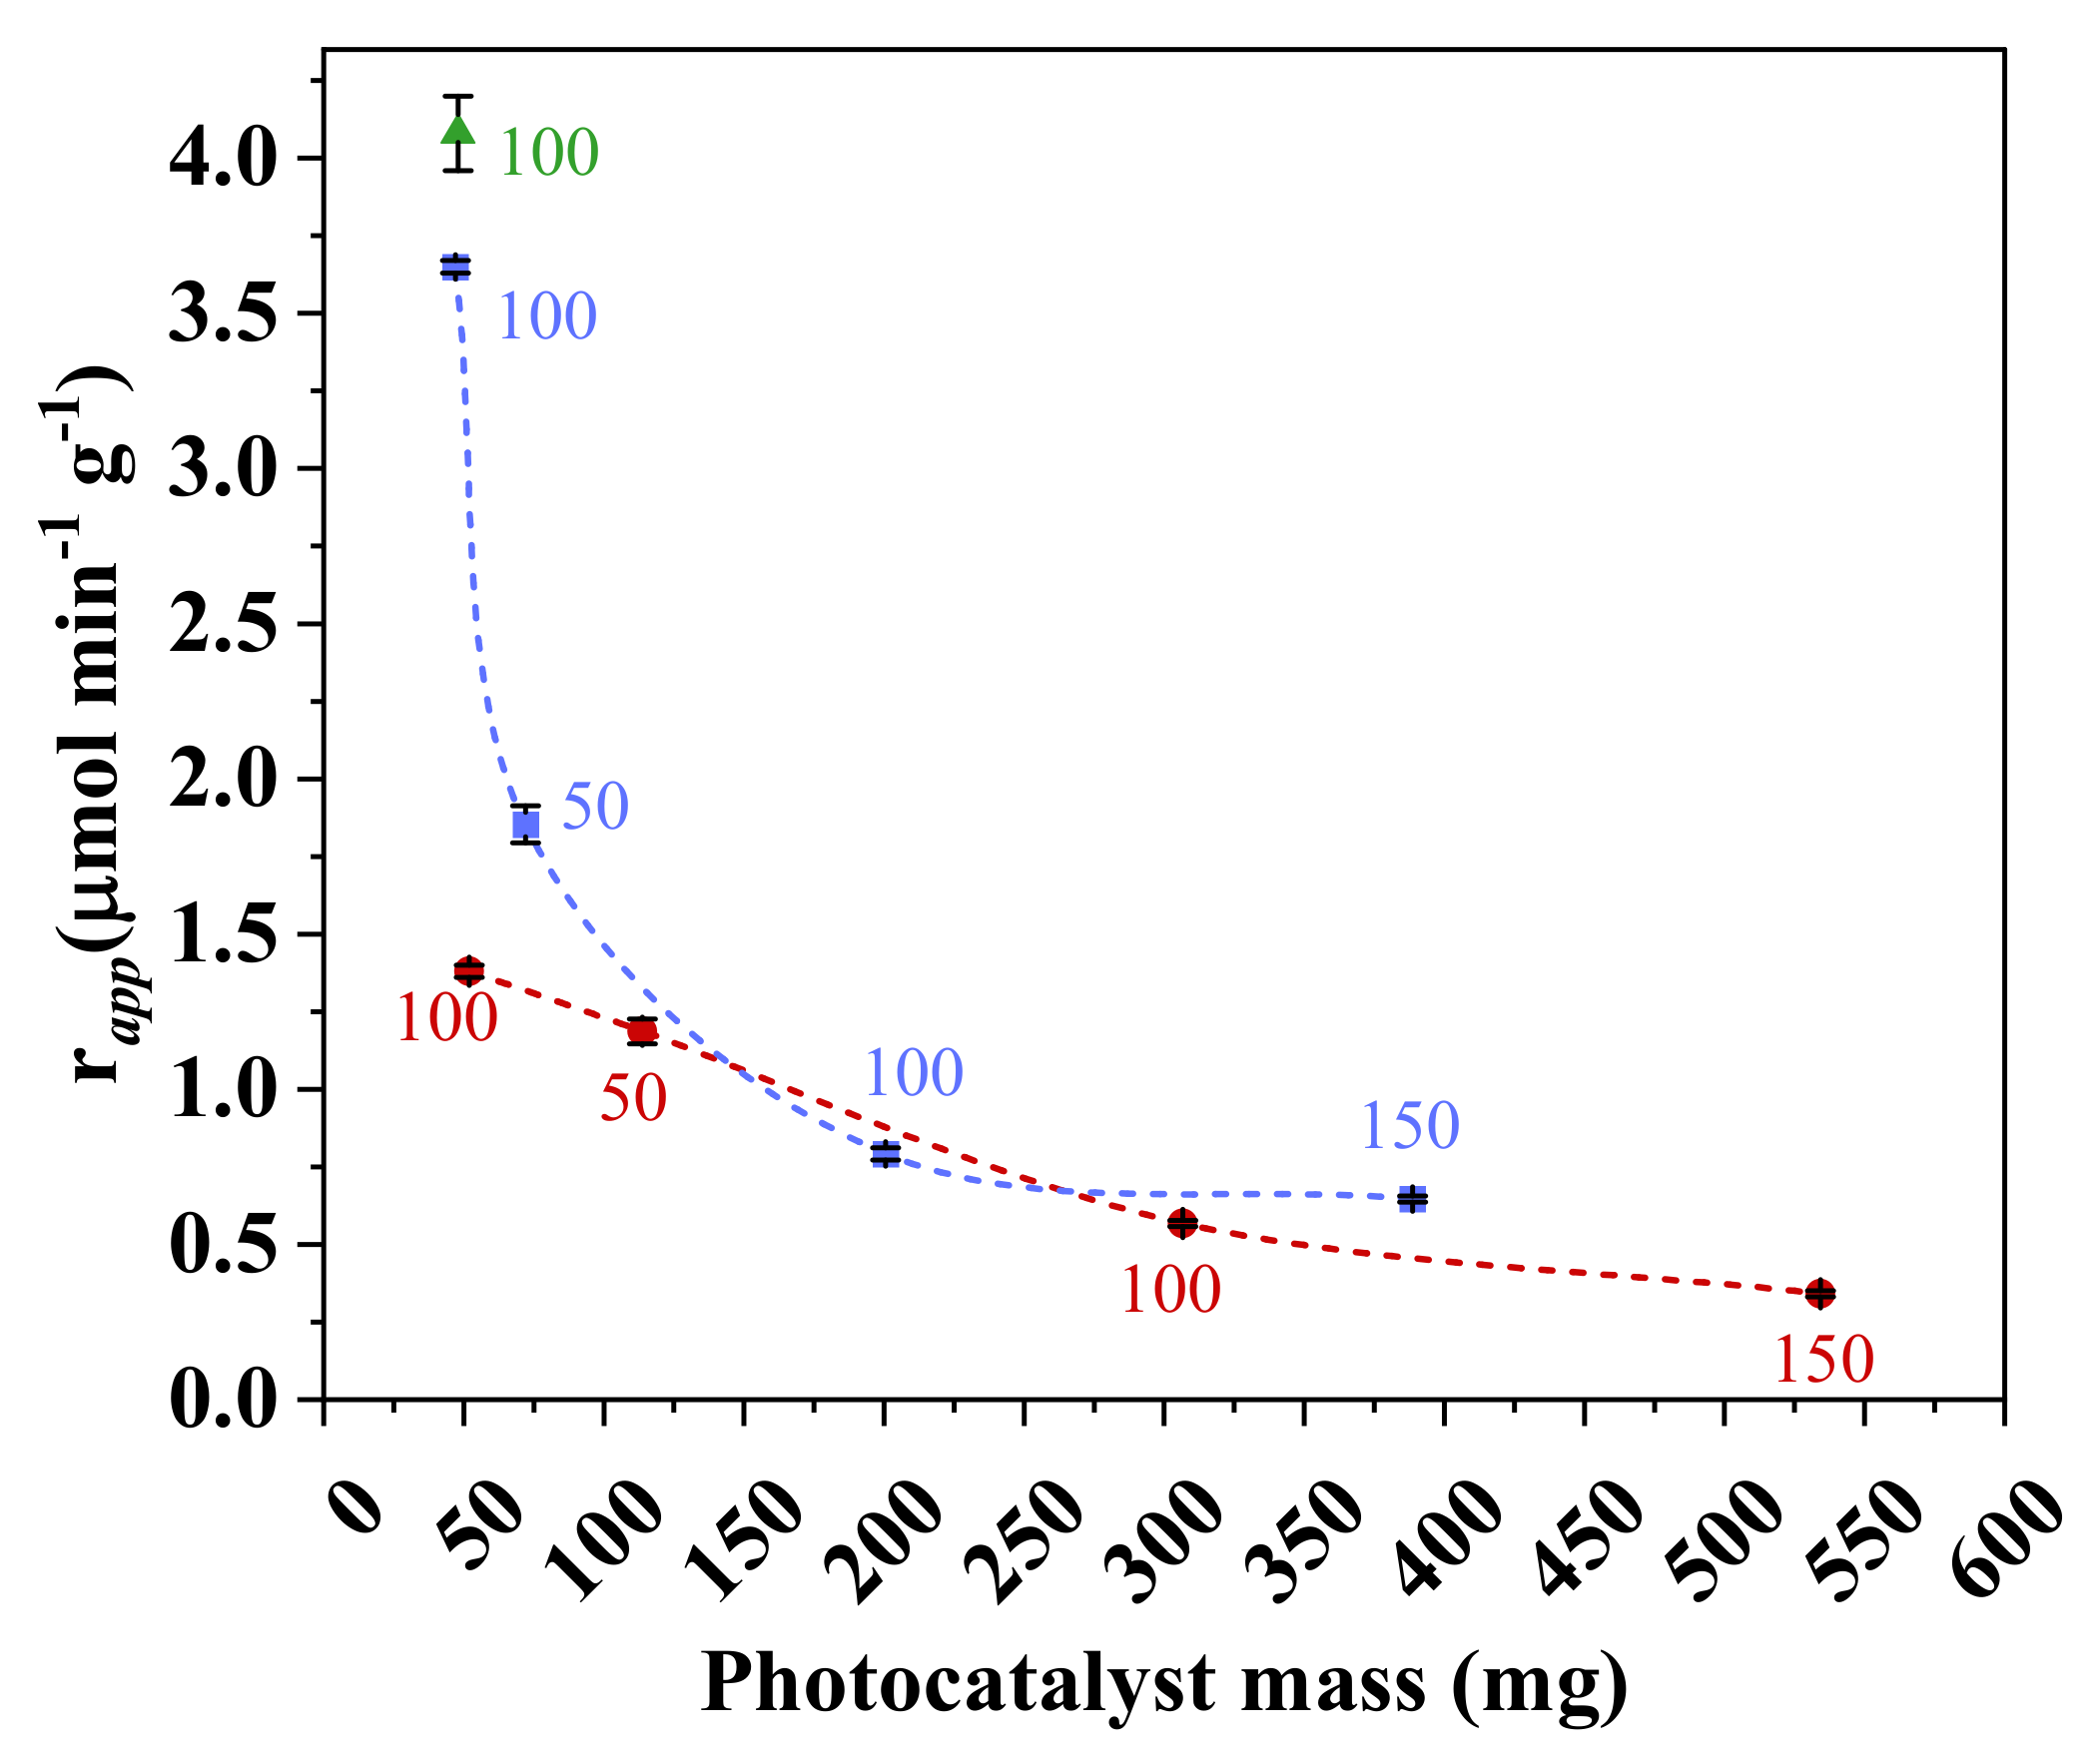
3.4. Effect of Photocatalyst Mass
4. Conclusions
Author Contributions
Funding
Conflicts of Interest
References
- Pedanekar, R.S.; Shaikh, S.K.; Rajpure, K.Y. Thin film photocatalysis for environmental remediation: A status review. Curr. Appl. Phys. 2020, 20, 931–952. [Google Scholar] [CrossRef]
- Espíndola, J.C.; Vilar, V.J.P. Innovative light-driven chemical/catalytic reactors towards contaminants of emerging concern mitigation: A review. Chem. Eng. Sci. 2020, 394, 124865. [Google Scholar] [CrossRef]
- Da Costa Filho, B.M.; Vilar, V.J.P. Strategies for the intensification of photocatalytic oxidation processes towards air streams decontamination: A review. Chem. Eng. Sci. 2020, 391, 123531. [Google Scholar] [CrossRef]
- Goutham, R.; Narayan, R.B.; Srikanth, B.; Gopinath, K.P. Supporting Materials for Immobilisation of Nano-photocatalysts. In Nanophotocatalysis and Environmental Applications; Namuddin, S.G., Kumar, A., Lichtfouse, E., Asiri, A., Eds.; Springer: New York, NY, USA, 2019; Volume 29, pp. 49–82. [Google Scholar]
- Shwetharani, R.; Chandan, H.R.; Sakar, M.; Balakrishna, G.R.; Reddy, K.R.; Raghu, A.V. Photocatalytic semiconductor thin films for hydrogen production and environmental applications. Int. J. Hydrogen Energy 2020, 45, 18289–18308. [Google Scholar] [CrossRef]
- Wang, J.; Isshiki, M. Handbook of Electronic and Photonic Materials. Mater. Today 2007, 10, 55. [Google Scholar] [CrossRef]
- Srikanth, B.; Goutham, R.; Badri Narayan, R.; Ramprasath, A.; Gopinath, K.P.; Sankaranarayanan, A.R. Recent advancements in supporting materials for immobilised photocatalytic applications in waste water treatment. J. Environ. Manag. 2017, 200, 60–78. [Google Scholar] [CrossRef] [PubMed]
- Singh, S.; Mahalingam, H.; Singh, P.K. Polymer-supported titanium dioxide photocatalysts for environmental remediation: A review. Appl. Catal. A Gen. 2013, 462, 178–195. [Google Scholar] [CrossRef]
- Aoudjit, L.; Martins, P.M.; Madjene, F.; Petrovykh, D.Y.; Lanceros-Mendez, S. Photocatalytic reusable membranes for the effective degradation of tartrazine with a solar photoreactor. J. Hazard. Mater. 2018, 344, 408–416. [Google Scholar] [CrossRef]
- Dossin Zanrosso, C.; Piazza, D.; Lansarin, M.A. PVDF/ZnO composite films for photocatalysis: A comparative study of solution mixing and melt blending methods. Polym. Eng. Sci. 2020, 60, 1146–1157. [Google Scholar] [CrossRef]
- Enesca, A.; Cazan, C. Volatile Organic Compounds (VOCs) Removal from Indoor Air by Heterostructures/Composites/Doped Photocatalysts: A Mini-Review. Nanomaterials 2020, 10, 1965. [Google Scholar] [CrossRef]
- Wang, Z.; Yu, H.; Xiao, Y.; Zhang, L.; Guo, L.; Zhang, L.; Dong, X. Free-standing composite films of multiple 2D nanosheets: Synergetic photothermocatalysis/photocatalysis for efficient removal of formaldehyde under ambient condition. Chem. Eng. Sci. 2020, 394, 125014. [Google Scholar] [CrossRef]
- Jeon, J.; Park, J.H.; Wi, S.; Yun, B.Y.; Kim, T.; Kim, S. Field study on the improvement of indoor air quality with toluene adsorption finishing materials in an urban residential apartment. Environ. Pollut. 2020, 261, 114137. [Google Scholar] [CrossRef] [PubMed]
- Rahimpour, A.; Jahanshahi, M.; Mollahosseini, A.; Rajaeian, B. Structural and performance properties of UV-assisted TiO2 deposited nano-composite PVDF/SPES membranes. Desalination 2012, 285, 31–38. [Google Scholar] [CrossRef]
- Cardoza-Contreras, M.N.; Sánchez-Serrano, S.; Contreras, O.E. Highly Efficient Photocatalytic and Antimicrobial AgGaCl Tri-Doped ZnO Nanorods for Water Treatment under Visible Light Irradiation. Catalysts 2020, 10, 752. [Google Scholar] [CrossRef]
- Yemmireddy, V.K.; Hung, Y.-C. Using Photocatalyst Metal Oxides as Antimicrobial Surface Coatings to Ensure Food Safety—Opportunities and Challenges. Compr. Rev. Food Sci. Food Saf. 2017, 16, 617–631. [Google Scholar] [CrossRef] [Green Version]
- Chawengkijwanich, C.; Hayata, Y. Development of TiO2 powder-coated food packaging film and its ability to inactivate Escherichia coli in vitro and in actual tests. Int. J. Food Microbiol. 2008, 123, 288–292. [Google Scholar] [CrossRef]
- Ferrone, E.; Araneo, R.; Notargiacomo, A.; Pea, M.; Rinaldi, A. ZnO Nanostructures and Electrospun ZnO–Polymeric Hybrid Nanomaterials in Biomedical, Health, and Sustainability Applications. Nanomaterials 2019, 9, 1449. [Google Scholar] [CrossRef] [PubMed] [Green Version]
- Padovani, G.C.; Feitosa, V.P.; Sauro, S.; Tay, F.R.; Durán, G.; Paula, A.J.; Durán, N. Advances in Dental Materials through Nanotechnology: Facts, Perspectives and Toxicological Aspects. Trends Biotechnol. 2015, 33, 621–636. [Google Scholar] [CrossRef] [PubMed]
- Wolska-Pietkiewicz, M.; Tokarska, K.; Grala, A.; Wojewódzka, A.; Chwojnowska, E.; Grzonka, J.; Cywiński, P.J.; Kruczała, K.; Sojka, Z.; Chudy, M.; et al. Safe-by-Design Ligand-Coated ZnO Nanocrystals Engineered by an Organometallic Approach: Unique Physicochemical Properties and Low Toxicity toward Lung Cells. Chem. A Eur. J. 2018, 24, 4033–4042. [Google Scholar] [CrossRef] [PubMed]
- Sevastaki, M.; Suchea, M.P.; Kenanakis, G. 3D Printed Fully Recycled TiO2-Polystyrene Nanocomposite Photocatalysts for Use against Drug Residues. Nanomaterials 2020, 10, 2144. [Google Scholar] [CrossRef]
- Pascariu, P.; Olaru, L.; Matricala, A.L.; Olaru, N. Photocatalytic activity of ZnO nanostructures grown on electrospun CAB ultrafine fibers. Appl. Surf. Sci. 2018, 455, 61–69. [Google Scholar] [CrossRef]
- Kunjuzwa, N.; Nthunya, L.N.; Nxumalo, E.N.; Mhlanga, S.D. The use of nanomaterials in the synthesis of nanofiber membranes and their application in water treatment. In Advanced Nanomaterials for Membrane Synthesis and Its Applications; Lau, W.-J., Ismail, A.F., Isloor, A., Al-Ahmed, A., Eds.; Elsevier: Amsterdam, The Netherlands, 2019; pp. 101–125. [Google Scholar]
- Mai, Z.; Xiong, Z.; Shu, X.; Liu, X.; Zhang, H.; Yin, X.; Zhou, Y.; Liu, M.; Zhang, M.; Xu, W.; et al. Multifunctionalization of cotton fabrics with polyvinylsilsesquioxane/ZnO composite coatings. Carbohydr. Polym. 2018, 199, 516–525. [Google Scholar] [CrossRef]
- Ardeshiri, F.; Salehi, S.; Peyravi, M.; Jahanshahi, M.; Amiri, A.; Rad, A.S. PVDF membrane assisted by modified hydrophobic ZnO nanoparticle for membrane distillation. Asia Pac. J. Chem. Eng. 2018, 13, e2196. [Google Scholar] [CrossRef]
- Da Costa Filho, B.M.; Araujo, A.L.P.; Silva, G.V.; Boaventura, R.A.R.; Dias, M.M.; Lopes, J.C.B.; Vilar, V.J.P. Intensification of heterogeneous TiO2 photocatalysis using an innovative micro-meso-structured-photoreactor for n-decane oxidation at gas phase. Chem. Eng. Sci. 2017, 310, 331–341. [Google Scholar] [CrossRef]
- Dossin Zanrosso, C.; Piazza, D.; Lansarin, M.A. Solution mixing preparation of PVDF/ZnO polymeric composite films engineered for heterogeneous photocatalysis. J. Appl. Polym. Sci. 2019, 137, 48417. [Google Scholar] [CrossRef]
- Martins, P.; Lopes, A.C.; Lanceros-Mendez, S. Electroactive phases of poly(vinylidene fluoride): Determination, processing and applications. Prog. Polym. Sci. 2014, 39, 683–706. [Google Scholar] [CrossRef]
- Laranjeira, P.E.; Martins, A.; Lopes, J.C.B.; Dias, M.M. NETmix®, A new type of static mixer: Modeling, simulation, macromixing, and micromixing characterization. AIChE J. 2009, 55, 2226–2243. [Google Scholar] [CrossRef]
- Da Costa Filho, B.M.; Araujo, A.L.P.; Padrão, S.P.; Boaventura, R.A.R.; Dias, M.M.; Lopes, J.C.B.; Vilar, V.J.P. Effect of catalyst coated surface, illumination mechanism and light source in heterogeneous TiO2 photocatalysis using a mili-photoreactor for n-decane oxidation at gas phase. Chem. Eng. Sci. 2019, 366, 560–568. [Google Scholar] [CrossRef]
- Liqiang, J.; Baifu, X.; Fulong, Y.; Baiqi, W.; Keying, S.; Weimin, C.; Honggang, F. Deactivation and regeneration of ZnO and TiO2 nanoparticles in the gas phase photocatalytic oxidation of n-C7H16 or SO2. Appl. Catal. A 2004, 275, 49–54. [Google Scholar] [CrossRef]
- Hossain, U.H.; Muench, F.; Ensinger, W. A comparative study on degradation characteristics of fluoropolymers irradiated by high energy heavy ions. RSC Adv. 2014, 4, 50171–50179. [Google Scholar] [CrossRef]
- Botelho, G.; Silva, M.M.; Gonçalves, A.M.; Sencadas, V.; Serrado-Nunes, J.; Lanceros-Méndez, S. Performance of electroactive poly (vinylidene fluoride) against UV radiation. Polym. Test. 2008, 27, 818–822. [Google Scholar] [CrossRef]
- Dzinun, H.; Othman, M.H.D.; Ismail, A.F.; Puteh, M.H.; Rahman, M.A.; Jaafar, J. Stability study of PVDF/TiO2 dual layer hollow fibre membranes under long-term UV irradiation exposure. J. Water Process Eng. 2017, 15, 78–82. [Google Scholar] [CrossRef]
- Salazar, H.; Martins, P.M.; Santos, B.; Fernandes, M.M.; Reizabal, A.; Sebastián, V.; Botelho, G.; Tavares, C.J.; Vilas-Vilela, J.L.; Lanceros-Mendez, S. Photocatalytic and antimicrobial multifunctional nanocomposite membranes for emerging pollutants water treatment applications. Chemosphere 2020, 250, 126299. [Google Scholar] [CrossRef] [PubMed]
- Espíndola, J.C.; Cristóvão, R.O.; Santos, S.G.S.; Boaventura, R.A.R.; Dias, M.M.; Lopes, J.C.B.; Vilar, V.J.P. Intensification of heterogeneous TiO2 photocatalysis using the NETmix mili-photoreactor under microscale illumination for oxytetracycline oxidation. Sci. Total. Environ. 2019, 681, 467–474. [Google Scholar] [CrossRef]
- Sridewi, N.; Tan, L.T.; Sudesh, K. Solar Photocatalytic Decolorization and Detoxification of Industrial Batik Dye Wastewater Using P (3HB)-TiO2 Nanocomposite Films. Clean Soil Air Water 2011, 39, 265–273. [Google Scholar] [CrossRef]


| Sample | Preparation Conditions | Cut Samples | ||||
|---|---|---|---|---|---|---|
| Photocatalyst | Pore Agent | Polymer | Wet Thickness | Photocatalyst Mass | ||
| Type | Mass (g) | %wt/wtPVDF | Mass (g) | µm | mg | |
| Z-1 a | ZnO | 0.05 | - | - | - | 50 |
| P-1 | - | - | 6 | 2.25 | 100 | - |
| PZ-1 | ZnO | 0.50 | - | 2.25 | 100 | 52 |
| PZ-2 | ZnO | 3.00 | - | 2.25 | 50 | 114 |
| PZ-3 | ZnO | 3.00 | - | 2.25 | 100 | 307 |
| PZ-4 | ZnO | 3.00 | - | 2.25 | 150 | 534 |
| PVZ-1 | ZnO | 0.50 | 8 | 2.25 | 100 | 47 |
| PVZ-2 | ZnO | 2.25 | 8 | 2.25 | 50 | 72 |
| PVZ-3 | ZnO | 2.25 | 8 | 2.25 | 100 | 201 |
| PVZ-4 | ZnO | 2.25 | 8 | 2.25 | 150 | 389 |
| PAZ-1 | A-ZnO | 0.50 | 8 | 2.25 | 100 | 48 |
| Sample | F[β] (%) | F[β]-AT (%) | IXRD (a.u) | IXRD-AT (a.u) |
|---|---|---|---|---|
| P-1 | 75.0 | 64.6 | - | - |
| PZ-1 | 68.6 | 67.8 | 56 | 60 |
| PVZ-1 | 71.0 | 72.5 | 85 | 61 |
| PAZ-1 | 70.8 | 80.2 | 53 | 64 |
| PVZ-4 | 73.1 | 75.4 | 188 | 146 |
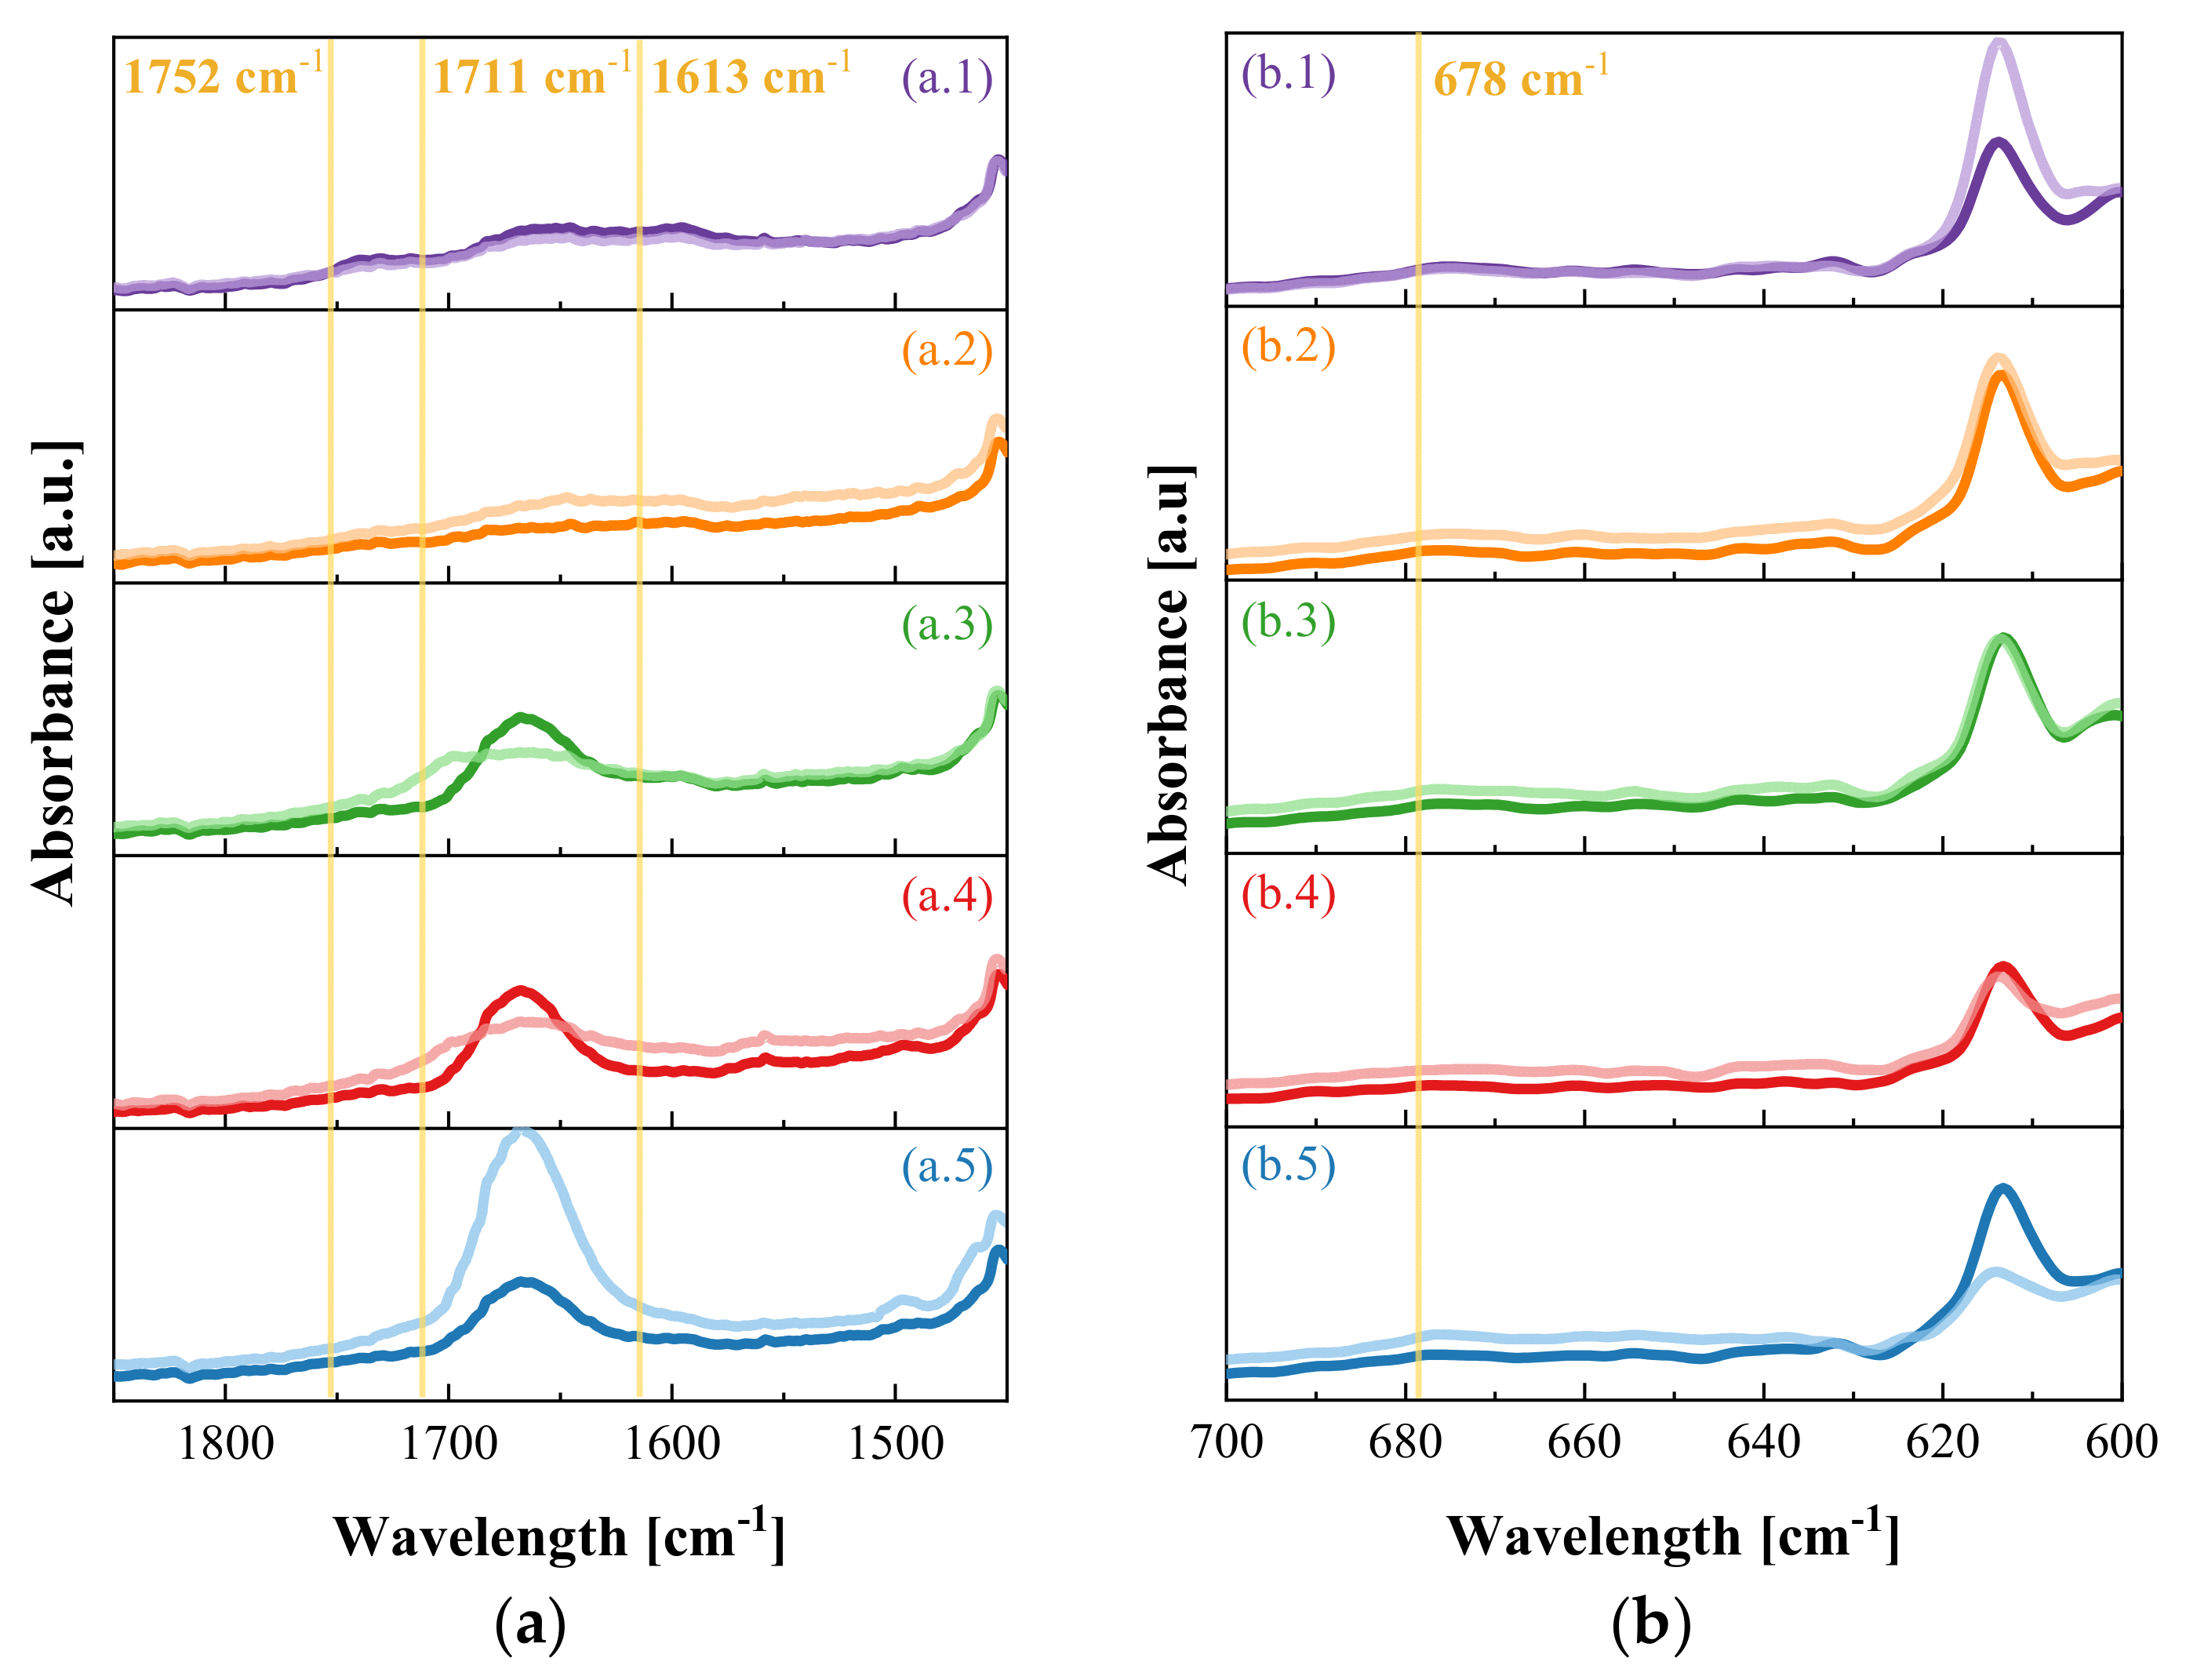
| Sample | (IAT/I)1752 (a.u) | (IAT/I)1711 (a.u) | (IAT/I)1613 (a.u) | (IAT/I)678 (a.u) |
|---|---|---|---|---|
| P-1 | 0.99 | 0.98 | 0.96 | 0.93 |
| PZ-1 | 1.07 | 1.00 | 1.16 | 1.22 |
| PVZ-1 | 1.06 | 1.13 | 1.35 | 1.02 |
| PAZ-1 | 1.07 | 1.16 | 1.31 | 1.27 |
| PVZ-4 | 1.06 | 1.15 | 1.32 | 1.24 |
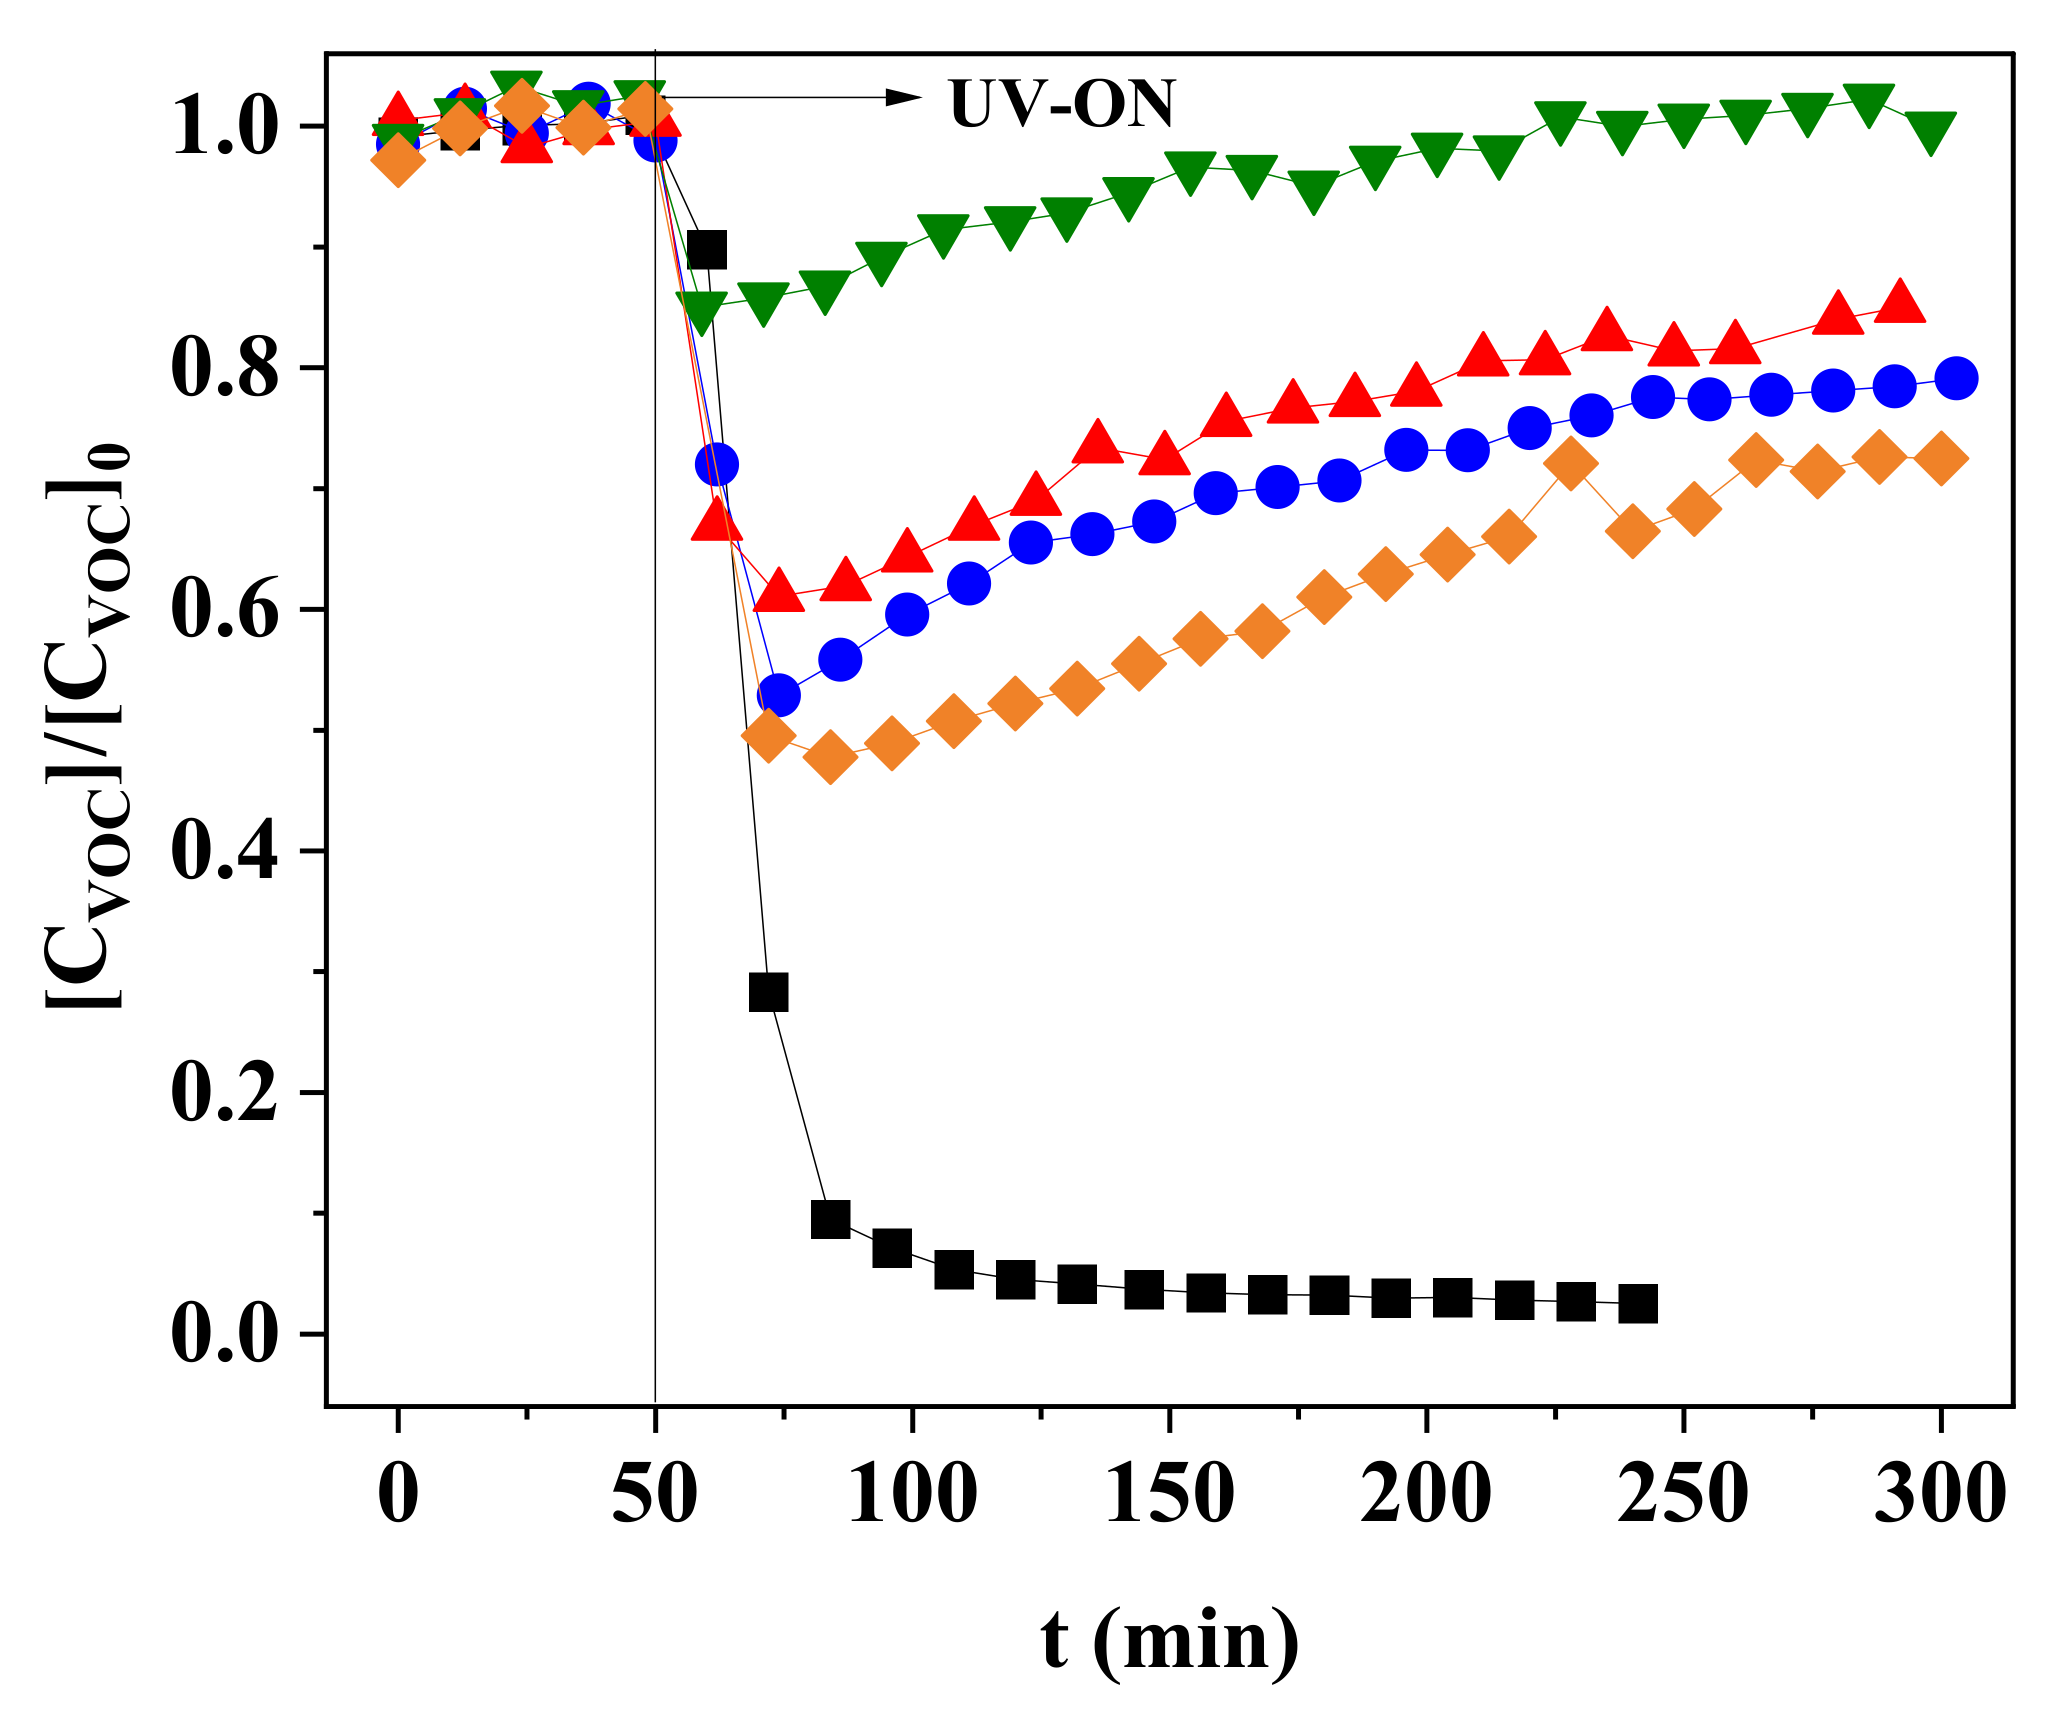
| Sample | rVOC,max (µmol min−1) | Conversion (%) | Mineralization (%) | rapp (µmol min−1 g−1) | Transmittance (%) |
|---|---|---|---|---|---|
| P-1 | * | * | * | * | 94.0 |
| PAZ-1 | 0.196 ± 0.006 | 44 ± 3 | 14.3 | 4.1 ± 0.1 | 0.4 |
| PZ-1 | 0.072 ± 0.001 | 14.9 ± 0.4 | 0.9 | 1.38 ± 0.02 | 1.2 |
| PZ-2 | 0.135 ± 0.005 | 27 ± 1 | 11.0 | 1.19 ± 0.04 | 1.2 |
| PZ-3 | 0.174 ± 0.003 | 37.3 ± 0.6 | 10.9 | 0.57 ± 0.01 | 0.0 |
| PZ-4 | 0.182 ± 0.001 | 36.9 ± 0.6 | 9.0 | 0.34 ± 0.01 | 0.0 |
| PVZ-1 | 0.172 ± 0.001 | 37 ± 1 | 12.5 | 3.65 ± 0.02 | 0.4 |
| PVZ-2 | 0.134 ± 0.004 | 27 ± 1 | 6.4 | 1.85 ± 0.06 | 4.5 |
| PVZ-3 | 0.159 ± 0.003 | 34.2 ± 0.5 | 10.1 | 0.79 ± 0.02 | 0.1 |
| PVZ-4 | 0.251 ± 0.001 | 51 ± 2 | 16.9 | 0.65 ± 0.01 | 0.0 |
| Z-1 | 0.450 ± 0.001 | 97 ± 6 | 84.3 | 8.99 ± 0.02 | - |
Publisher’s Note: MDPI stays neutral with regard to jurisdictional claims in published maps and institutional affiliations. |
© 2021 by the authors. Licensee MDPI, Basel, Switzerland. This article is an open access article distributed under the terms and conditions of the Creative Commons Attribution (CC BY) license (https://creativecommons.org/licenses/by/4.0/).
Share and Cite
Zanrosso, C.D.; Miranda, S.M.; M. da Costa Filho, B.; Espíndola, J.C.; Piazza, D.; J. P. Vilar, V.; A. Lansarin, M. ZnO Polymeric Composite Films for n-Decane Removal from Air Streams in a Continuous Flow NETmix Photoreactor under UVA Light. Nanomaterials 2021, 11, 1983. https://doi.org/10.3390/nano11081983
Zanrosso CD, Miranda SM, M. da Costa Filho B, Espíndola JC, Piazza D, J. P. Vilar V, A. Lansarin M. ZnO Polymeric Composite Films for n-Decane Removal from Air Streams in a Continuous Flow NETmix Photoreactor under UVA Light. Nanomaterials. 2021; 11(8):1983. https://doi.org/10.3390/nano11081983
Chicago/Turabian StyleZanrosso, Crissie D., Sandra M. Miranda, Batuira M. da Costa Filho, Jonathan C. Espíndola, Diego Piazza, Vítor J. P. Vilar, and Marla A. Lansarin. 2021. "ZnO Polymeric Composite Films for n-Decane Removal from Air Streams in a Continuous Flow NETmix Photoreactor under UVA Light" Nanomaterials 11, no. 8: 1983. https://doi.org/10.3390/nano11081983
APA StyleZanrosso, C. D., Miranda, S. M., M. da Costa Filho, B., Espíndola, J. C., Piazza, D., J. P. Vilar, V., & A. Lansarin, M. (2021). ZnO Polymeric Composite Films for n-Decane Removal from Air Streams in a Continuous Flow NETmix Photoreactor under UVA Light. Nanomaterials, 11(8), 1983. https://doi.org/10.3390/nano11081983