
Clustering of Diamond Nanoparticles, Fluorination and Efficiency of Slow Neutron Reflectors

 , ,
, ,  ,
,  ,
,  ,
, 
Abstract
:1. Introduction
2. Materials and Methods
2.1. Samples
2.2. Rationale for the Choice of Experimental Methods
2.3. The Model of Discrete-Sized Diamond Nanospheres
3. Results
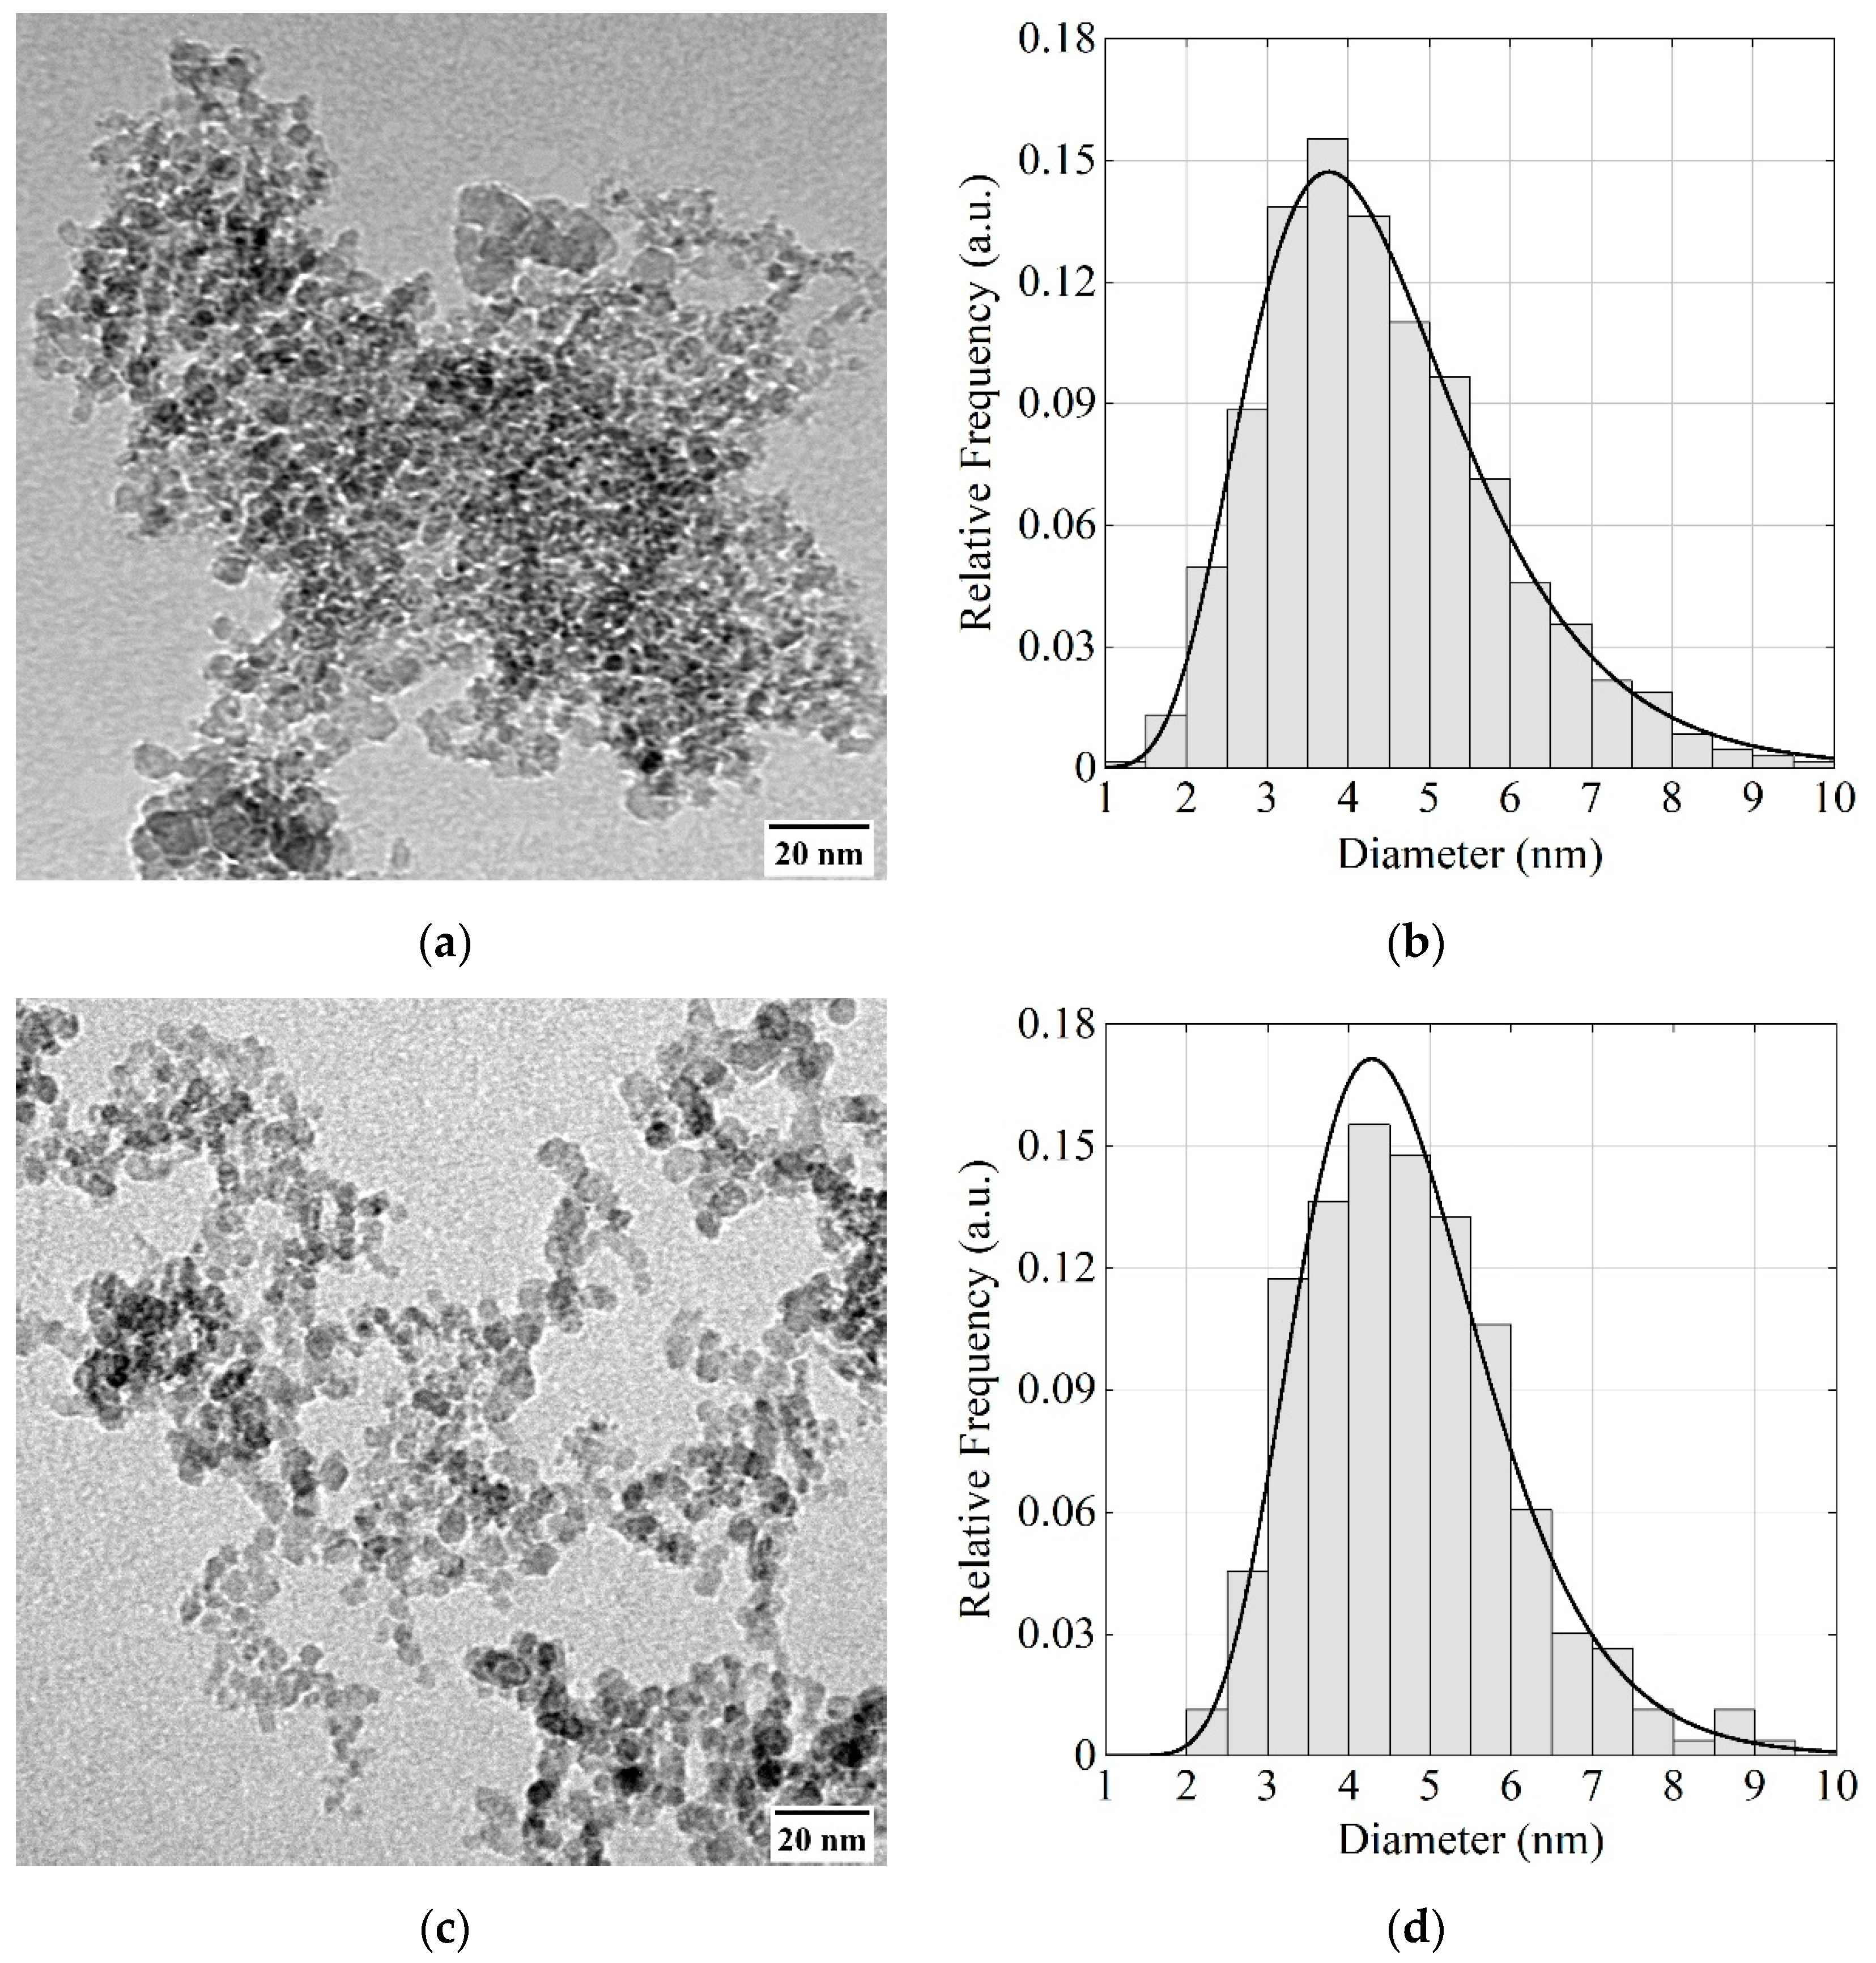
3.1. SEM and TEM
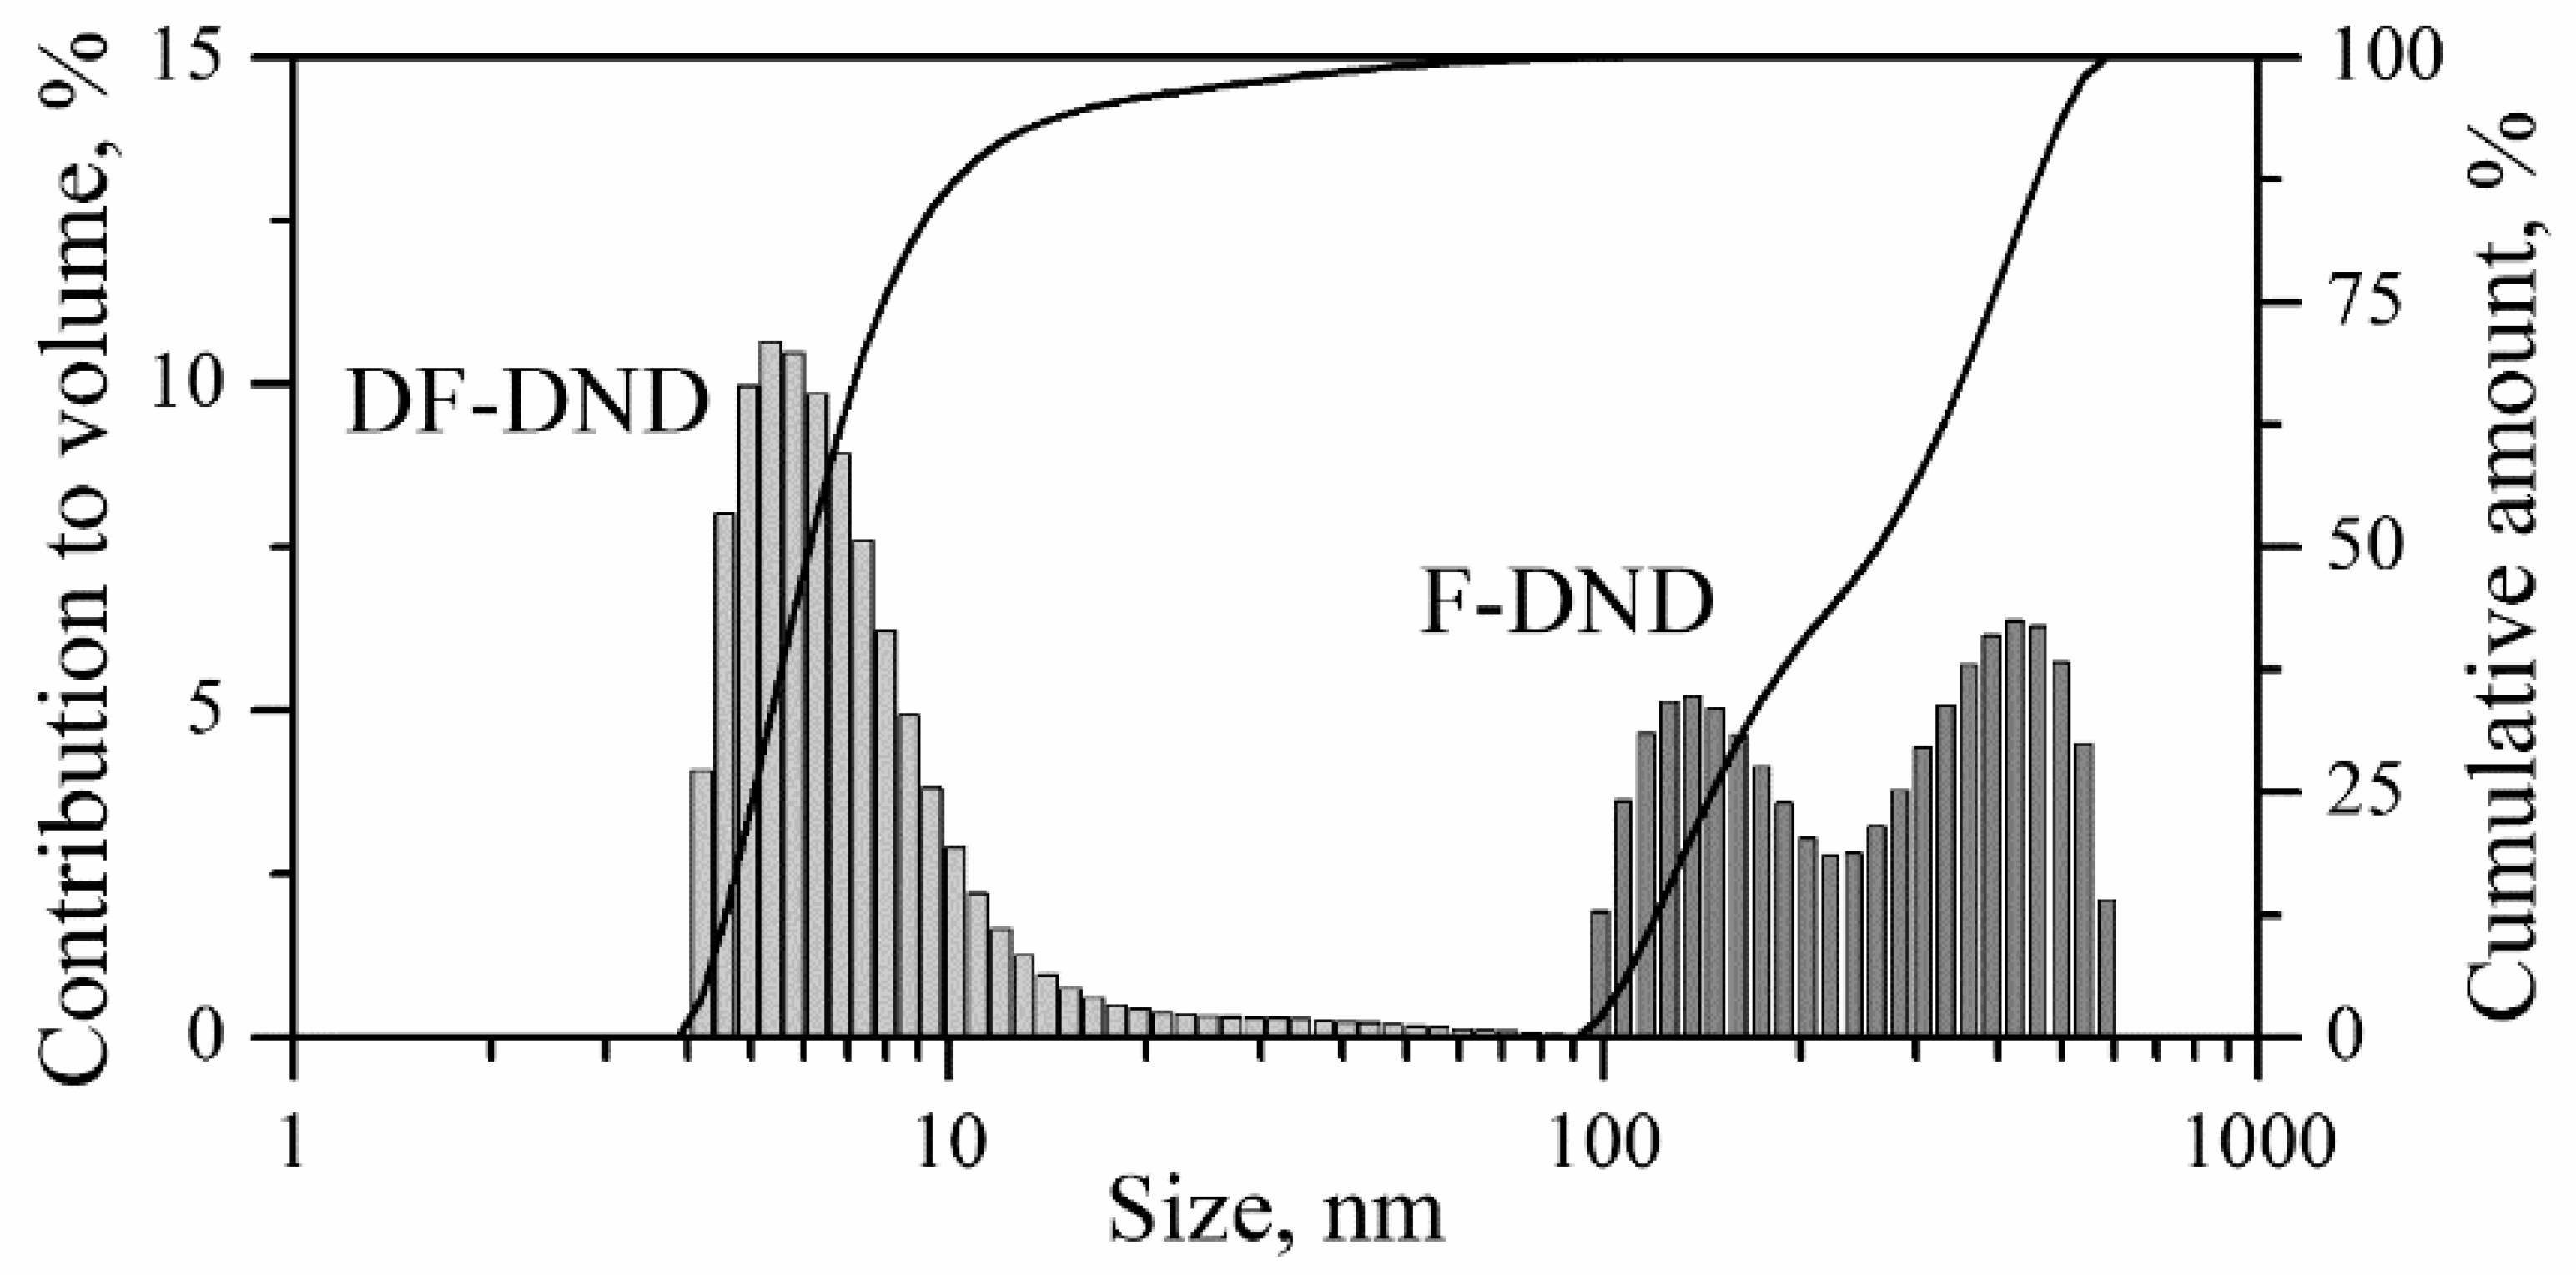
3.2. DLS
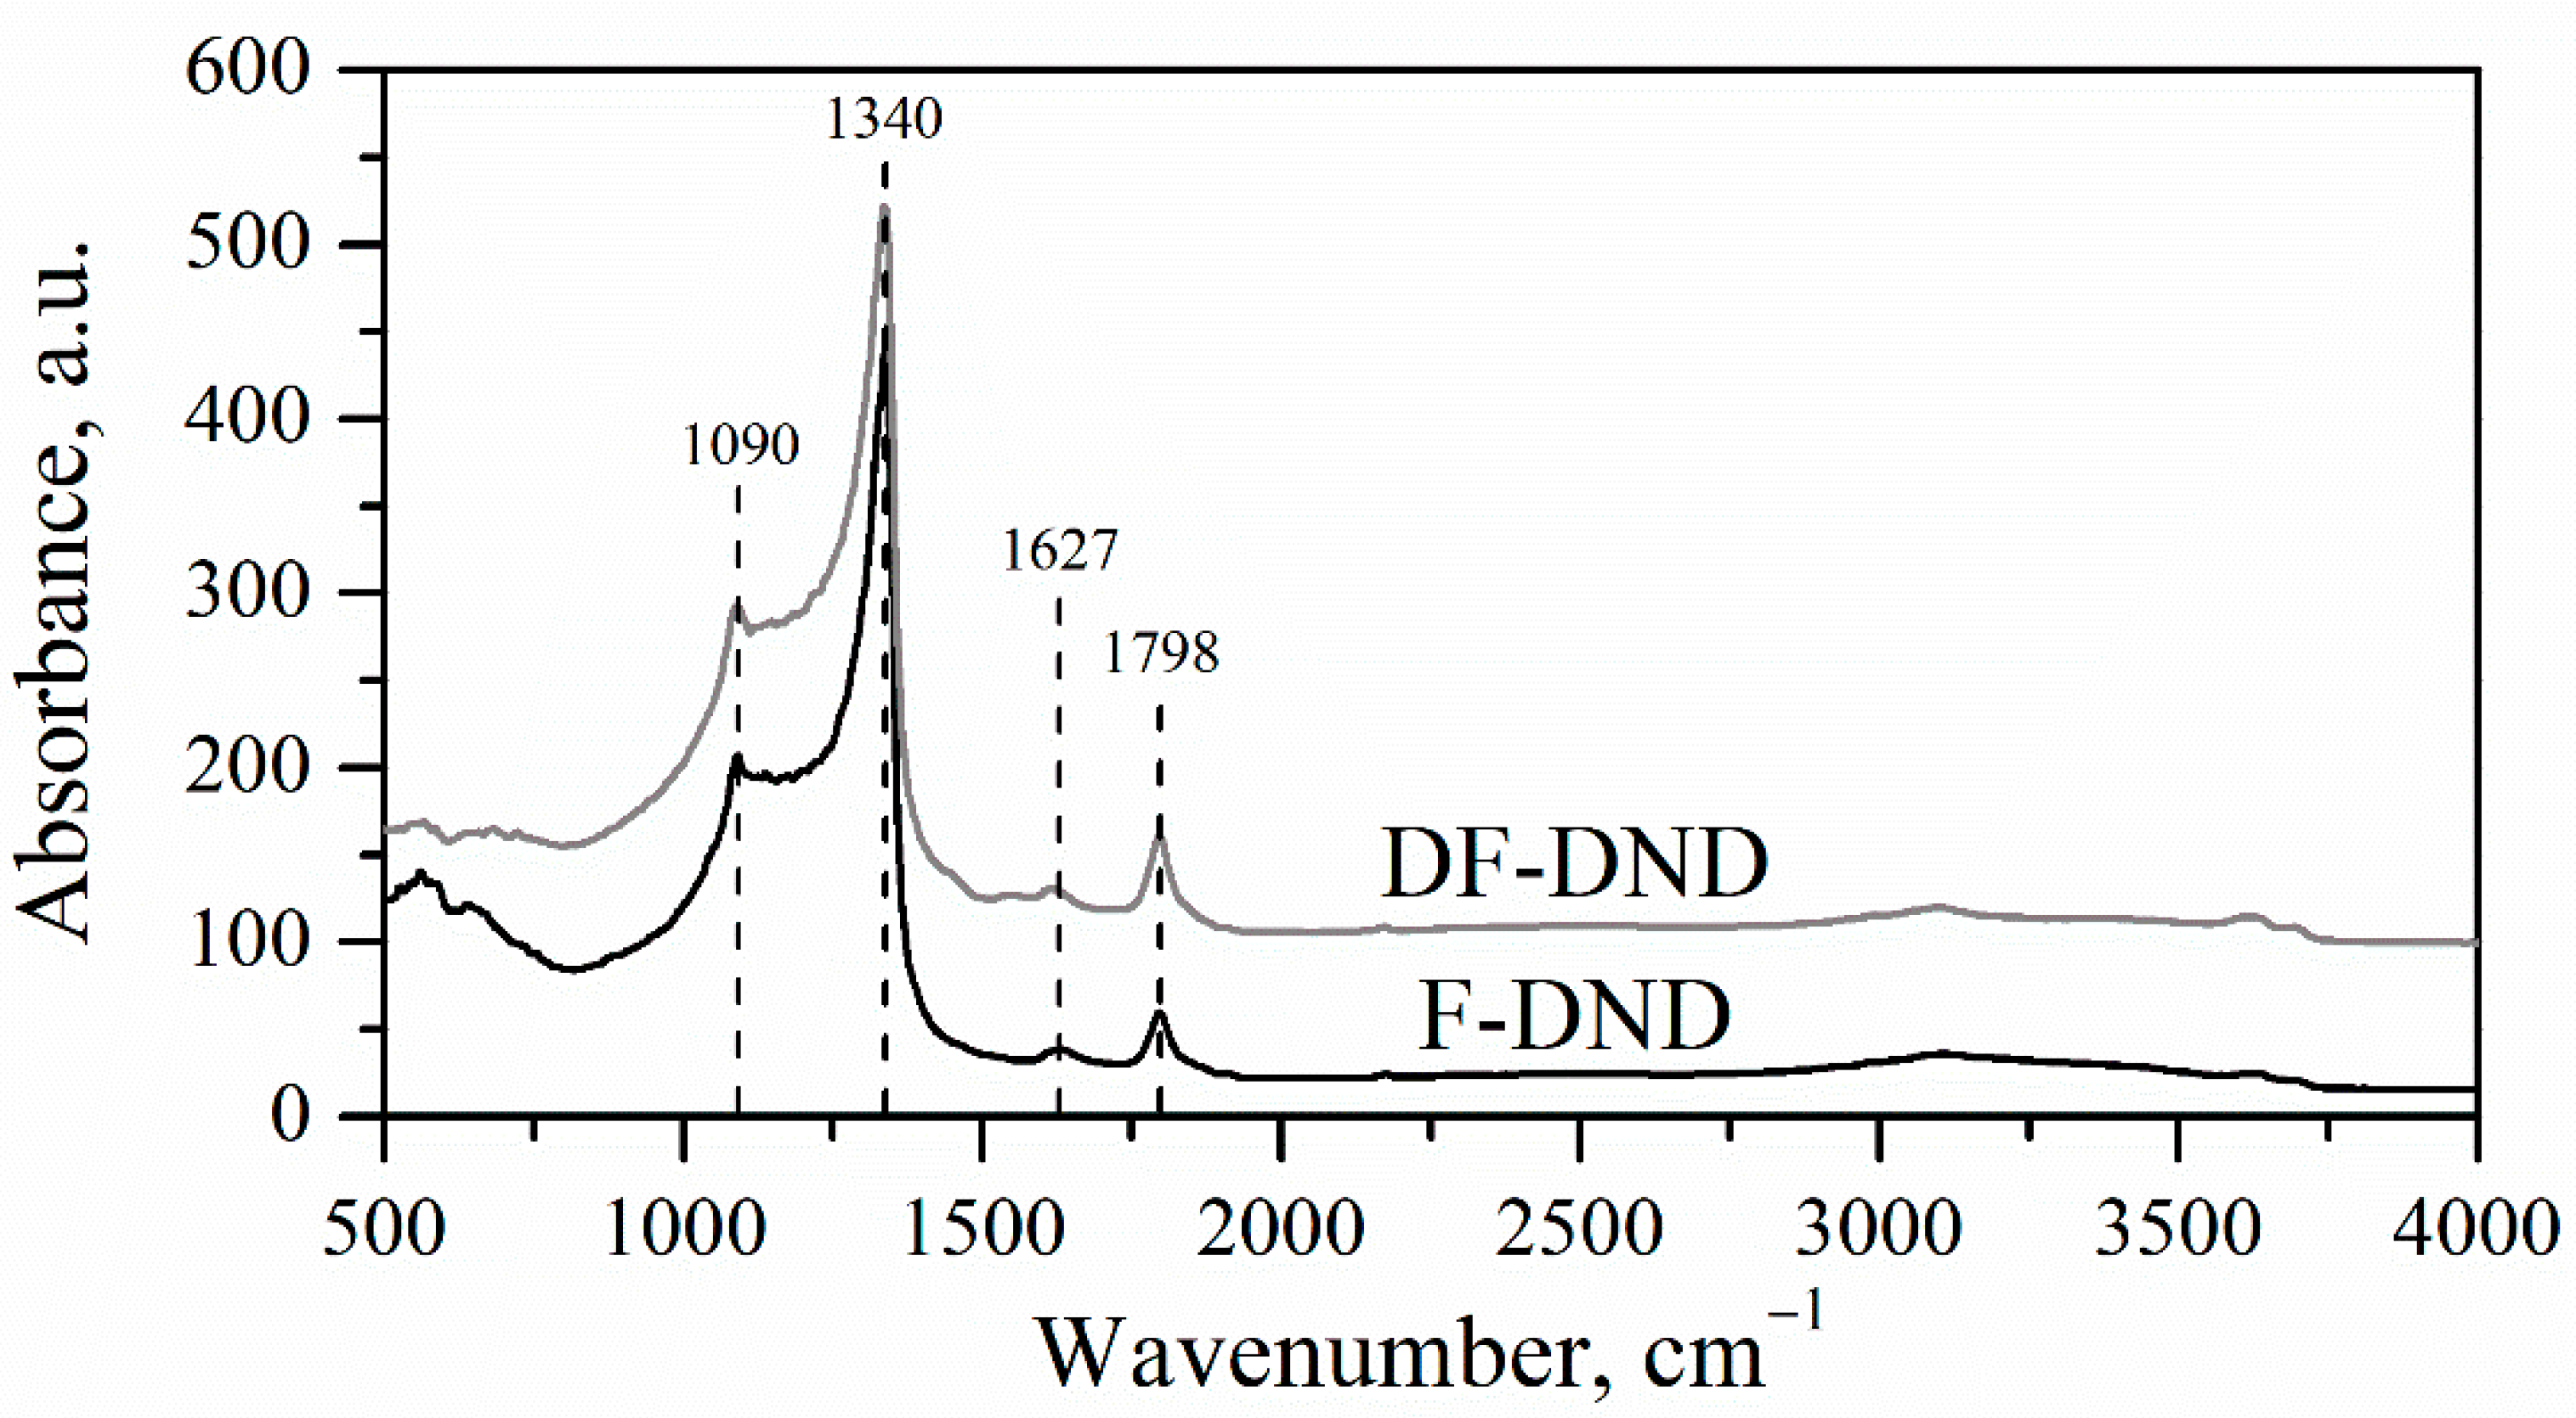
3.3. Chemical Composition by NAA and IR Spectroscopy
3.4. XRD
3.5. SANS
4. Discussion
4.1. Size Distribution of Nanoparticles
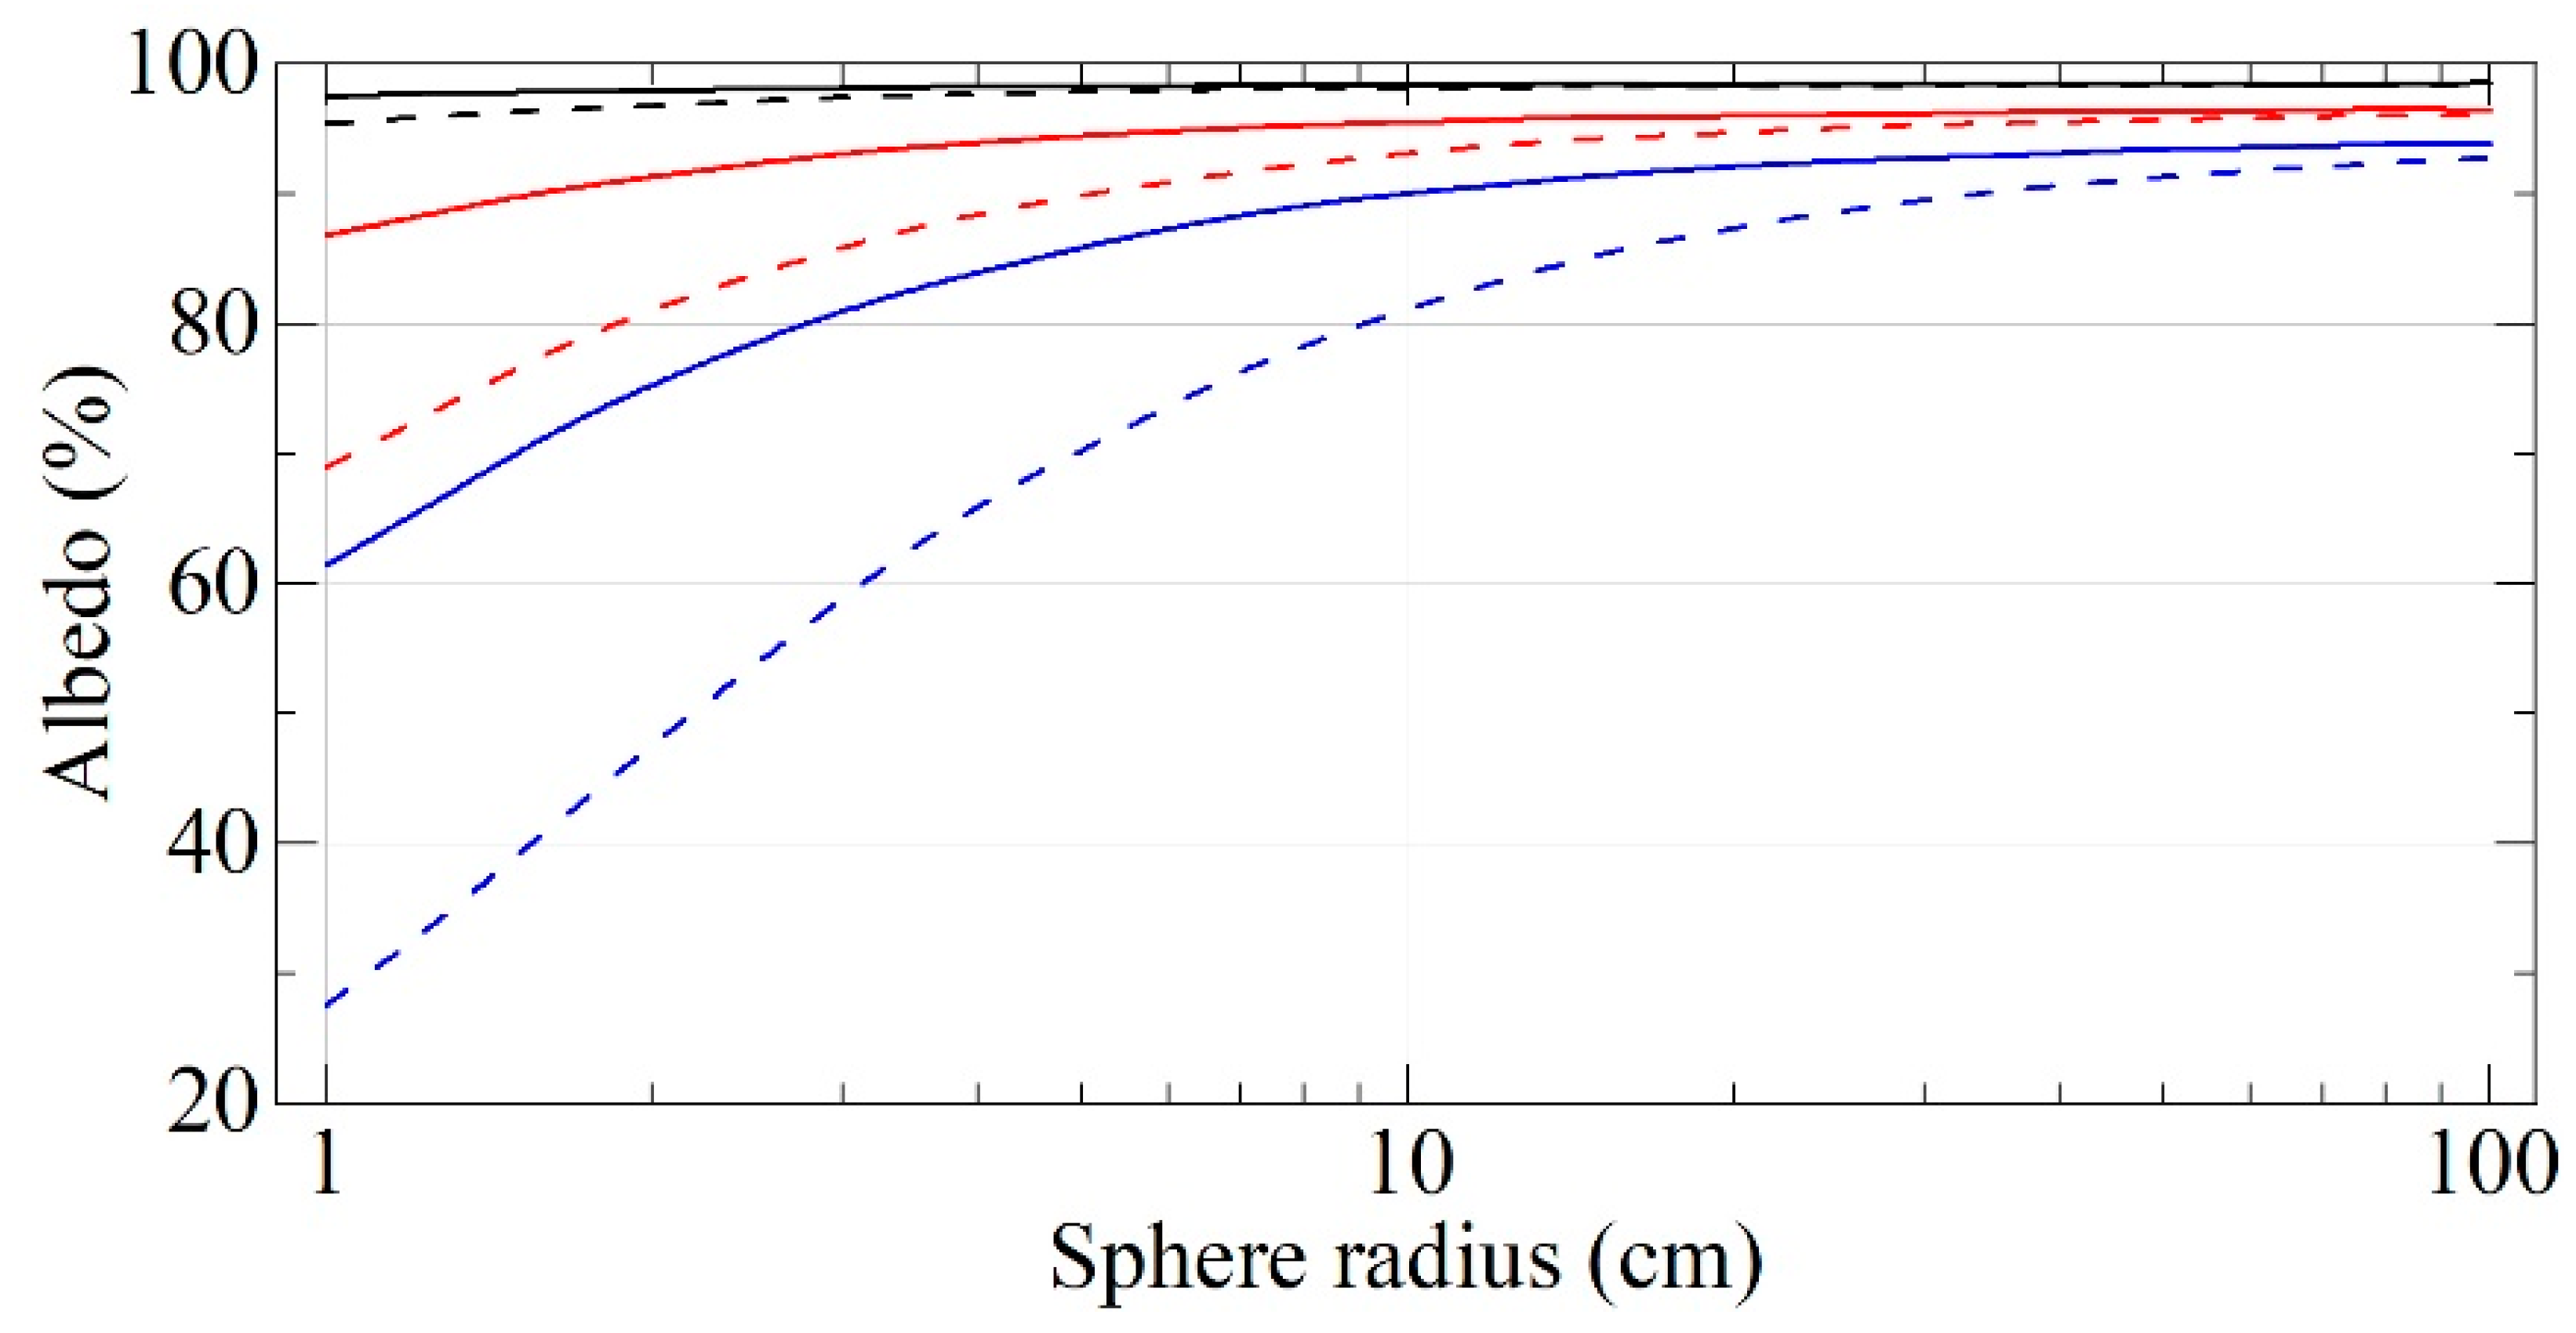
4.2. Calculation of Albedo from a Flat Reflector
4.3. Calculation Storage Times in Closed Nano-Diamond Traps
5. Conclusions
6. Patents
Author Contributions
Funding
Institutional Review Board Statement
Informed Consent Statement
Data Availability Statement
Acknowledgments
Conflicts of Interest
References
- Nesvizhevsky, V.V. Interaction of neutrons with nanoparticles. Phys. At. Nucl. 2002, 65, 400–408. [Google Scholar] [CrossRef]
- Artem’ev, V.A. Estimation of neutron reflection from nanodispersed materials. At. Energy 2006, 101, 901–904. [Google Scholar] [CrossRef]
- Nesvizhevsky, V.V.; Lychagin, E.V.; Muzychka, A.Y.; Strelkov, A.V.; Pignol, G.; Protasov, K.V. The reflection of very cold neutrons from diamond powder nanoparticles. Nucl. Instrum. Methods Phys. Res. Sect. A Accel. Spectrometers Detect. Assoc. Equip. 2008, 595, 631–636. [Google Scholar] [CrossRef] [Green Version]
- Lychagin, E.V.; Muzychka, A.Y.; Nesvizhevsky, V.V.; Pignol, G.; Protasov, K.V.; Strelkov, A.V. Storage of very cold neutrons in a trap with nano-structured walls. Phys. Lett. B 2009, 679, 186–190. [Google Scholar] [CrossRef]
- Zousman, B.; Levinson, O. Pure nanodiamonds produced by laser-assisted technique. In Nanodiamond; Williams, O., Ed.; RSC Nanoscience & Nanotechnology: London, UK, 2014; Chapter 5; pp. 112–127. [Google Scholar]
- Greiner, N.R.; Philips, D.S.; Johnson, J.C. Diamonds in detonation soot. Nature 1988, 333, 440–442. [Google Scholar] [CrossRef]
- Aleksenskii, A.E.; Baidakova, M.V.; Vul’, A.Y.; Sikitskii, V.I. The structure of diamond nanoclusters. Phys. Solid State 1999, 41, 668–671. [Google Scholar] [CrossRef]
- Nesvizhevsky, V.V.; Dubois, M.; Gutfreund, P.H.; Lychagin, E.V.; Nezvanov, A.Y.; Zhernenkov, K.N. Effect of nanodiamond fluorination on the efficiency of quasispecular reflection of cold neutrons. Phys. Rev. A 2018, 97, 023629. [Google Scholar] [CrossRef]
- Krylov, A.R.; Lychagin, E.V.; Muzychka, A.Y.; Nesvizhevsky, V.V.; Nekhaev, G.V.; Strelkov, A.V.; Ivanov, A.S. Study of bound hydrogen in powders of diamond nanoparticles. Crystallogr. Rep. 2011, 56, 1186–1191. [Google Scholar] [CrossRef]
- Mochalin, V.N.; Shednerova, O.; Ho, D.; Gogotsi, Y. The properties and applications of nanodiamonds. Nat. Nanotechnol. 2012, 7, 11–23. [Google Scholar] [CrossRef]
- Krueger, A. Current issues and challenges in surface chemistry in nanodiamonds. In Nanodiamonds: Advanced Material Analysis; Arnault, J.-C., Ed.; Elsevier: Amsterdam, The Netherlands, 2017; Chapter 8; pp. 184–242. [Google Scholar]
- Nesvizhevsky, V.V.; Koester, U.; Dubois, M.; Batisse, N.; Frezet, L.; Bosak, A.; Gines, L.; Williams, O. Fluorinated nanodiamonds as unique neutron reflector. Carbon 2018, 130, 799–805. [Google Scholar] [CrossRef]
- Nesvizhevsky, V.V.; Koester, U.; Dubois, M.; Batisse, N.; Frezet, L.; Bosak, A.; Gines, L.; Williams, O. Fluorinated nanodiamonds as unique neutron reflector. J. Neutron Res. 2018, 20, 81–82. [Google Scholar] [CrossRef]
- Herraiz, M.; Batisse, N.; Dubois, M.; Nesvizhevsky, V.V.; Cavallari, C.; Brunelli, M.; Pischedda, V.; Radescu Cioranescu, S. A multi-technique study of fluorinated nanodiamonds for low-energy neutron physics applications. J. Phys. Chem. C 2020, 124, 14229–14236. [Google Scholar] [CrossRef]
- Batsanov, S.S.; Osavchuk, A.N.; Naumov, S.P.; Gavrilkin, S.M.; Batsanov, A.S. Novel synthesis and properties of hydrogen-free detonation nanodiamond. Mater. Chem. Phys. 2018, 216, 120–129. [Google Scholar] [CrossRef] [Green Version]
- Ersez, T.; Osborn, J.C.; Lu, W.; Mata, J.P. Small angle and inelastic scattering investigations of nanodiamonds. Phys. B Condens. Matter 2018, 551, 278–282. [Google Scholar] [CrossRef]
- Teshigawara, M.; Tsuchikawa, Y.; Ichikawa, G.; Takata, S.; Mishima, K.; Harada, M.; Ooi, M.; Kawamura, Y.; Kai, T.; Ohira-Kawamura, S.; et al. Measurement of neutron scattering cross section of nano-diamond with particle diameter of approximately 5 nm in energy range of 0.2 meV to 100 meV. Nucl. Instrum. Methods Phys. Res. Sect. A Accel. Spectrometers Detect. Assoc. Equip. 2019, 929, 113–120. [Google Scholar] [CrossRef]
- Grammer, K.B.; Gallmeier, F.X. The small-angle neutron scattering extension in MCNPX and the SANS cross section for nanodiamonds. Nucl. Instrum. Methods Phys. Res. Sect. A Accel. Spectrometers Detect. Assoc. Equip. 2020, 953, 163226. [Google Scholar] [CrossRef]
- Gradana, J.R.; Damain, J.I.; Helman, C.H. Studies of reflector materials for cold neutrons. Eur. Phys. J. Web Conf. 2020, 231, 04002. [Google Scholar] [CrossRef]
- Jamalipour, M.; Zanini, L.; Gorini, G. Directional reflection of cold neutrons using nanodiamond particles for compact neutron sources. Eur. Phys. J. Web Conf. 2020, 231, 04003. [Google Scholar] [CrossRef]
- Ignatovich, V.K.; Nesvizhevsky, V.V. Reflection of slow neutrons from nanorod powder. At. Energy 2014, 116, 132–143. [Google Scholar] [CrossRef]
- Lychagin, E.V.; Muzychka, A.Y.; Nesvizhevsky, V.V.; Nekhaev, G.V.; Pignol, G.; Protasov, K.V.; Strelkov, A.V. Coherent scattering of slow neutrons at nanoparticles in particle physics experiments. Nucl. Instrum. Methods Phys. Res. Sect. A Accel. Spectrometers Detect. Assoc. Equip. 2009, 611, 302–305. [Google Scholar] [CrossRef]
- Nesvizhevsky, V.V. Reflectors for VCN and applications of VCN. Rev. Mex. Fis. 2011, 57, 1–5. [Google Scholar]
- Vul’, A.; Shenderova, O. Detonation Nanodiamonds: Science and Applications; Pan Stanford Publishing: Singapore, 2014. [Google Scholar]
- Williams, O. Nanodiamond; RSC Publishing: Cambridge, UK, 2014. [Google Scholar]
- Baidakova, M.; Vul’, A. New prospects and frontiers of nanodiamond clusters. J. Phys. D Appl. Phys. 2007, 40, 6300. [Google Scholar] [CrossRef]
- Badziag, P.; Verwoerd, W.S.; Ellis, W.P.; Greiner, N.R. Nanometre-sized diamonds are more stable than graphite. Nature 1990, 343, 244–245. [Google Scholar] [CrossRef]
- Raty, J.Y.; Galli, G.; Bostedt, C.; van Buuren, T.W.; Terminello, L.J. Quantum confinement and fullerene like surface reconstructions in nanodiamonds. Phys. Rev. Lett. 2003, 90, 037401. [Google Scholar] [CrossRef] [PubMed]
- Barnard, A.S.; Sternberg, M. Crystallinity and surface electrostatics of diamond nanocrystals. J. Mater. Chem. 2007, 17, 4811–4819. [Google Scholar] [CrossRef]
- Aleksenskii, A.E.; Baidakova, M.V.; Vul’, A.Y.; Dideikin, A.T.; Sikitskii, V.I.; Vul’, S.P. Effect of hydrogen on the structure of ultradisperse diamond. Phys. Solid State 2000, 42, 1575–1578. [Google Scholar] [CrossRef]
- Palosz, B.; Grzanka, E.; Gierlotka, S.; Stel’makh, S.; Pielaszek, R.; Bismayer, U.; Neuefeind, J.; Weber, H.-P.; Proffen, T.; von Dreele, R.; et al. Analysis of short and long range order in nanocrystalline diamonds with application of powder diffractometer. Z. Krist.-Cryst. Mater. 2002, 217, 497–509. [Google Scholar] [CrossRef]
- Avdeev, M.V.; Aksenov, V.L.; Tomchuk, O.V.; Bulavin, L.A.; Garamus, V.M.; Osawa, E. The spatial diamond-graphite transition in detonation nanodiamond as revealed by small-angle neutron scattering. J. Phys. Condens. Mater. 2013, 25, 445001. [Google Scholar] [CrossRef] [Green Version]
- Osawa, E. Monodisperse single nanodiamond particles. Pure Appl. Chem. 2008, 80, 1365–1379. [Google Scholar] [CrossRef]
- Kruger, A.; Kataoka, F.; Ozawa, M.; Fujino, T.; Suzuki, Y.; Aleksenskii, A.E.; Vul’, A.Y.; Osawa, E. Usually tight aggregation in detonation nanodiamond: Identification and disintegration. Carbon 2005, 43, 1722–1730. [Google Scholar] [CrossRef]
- Williams, O.; Hees, J.; Dieker, C.; Jager, W.; Kiste, L.; Nebel, C.E. Size-dependent reactivity of diamond nanoparticles. ACS Nano 2010, 4, 4824–4830. [Google Scholar] [CrossRef]
- Aleksenskii, A.E.; Eydelman, E.D.; Vul’, A.Y. Deagglomeration of detonation nanodiamonds. Nanosci. Nanotechnol. Lett. 2011, 3, 68–74. [Google Scholar] [CrossRef]
- Avdeev, M.V.; Aksenov, V.L.; Rosta, L. Pressure induced charges in fractal structure of detonation nanodiamond powder by small-angle neutron scattering. Diam. Relat. Mater. 2007, 16, 2050–2053. [Google Scholar] [CrossRef]
- Chang, L.-Y.; Osawa, E.; Barnard, A.S. Confirmation of the electrostatic self-assembly of nanodiamonds. Nanoscale 2011, 3, 958–962. [Google Scholar] [CrossRef] [Green Version]
- Osawa, E.; Sasaki, S.; Yamanoi, R. Deagglomeration of Detonation Nanodiamond. In Ultrananocrystalline Diamond: Synthesis, Properties and Applications; Gruen, D., Shenderova, O., Eds.; Elsevier: Amsterdam, The Netherlands, 2012; Chapter 6; pp. 165–179. [Google Scholar]
- Bosak, A.; Dideikin, A.; Dubois, M.; Ivankov, O.; Lychagin, E.; Muzychka, A.; Nekhaev, G.; Nesvizhevsky, V.; Nezvanov, A.; Schweins, R.; et al. Fluorination of diamond nanoparticles in slow neutron reflectors does not destroy their crystalline cores and clustering while decreasing neutron losses. Materials 2020, 13, 3337. [Google Scholar] [CrossRef] [PubMed]
- Dideikin, A.T.; Aleksenskii, A.E.; Baidakova, M.V.; Brunkov, P.N.; Brzhezinskaya, M.; Davydov, V.Y.; Levitskii, V.S.; Kidalov, S.V.; Kukushkina, Y.A.; Kirilenko, D.A.; et al. Rehybridization of carbon on facets of detonation diamond nanocrystals and forming hydrosols of individual particles. Carbon 2017, 122, 737–745. [Google Scholar] [CrossRef]
- Yao, A.; Mori, I. Synthesis and evaluation of fluorinated nano diamond for application of polymer composite. In Proceedings of the 16th International Conference on Nanotechnology, Sendai, Japan, 22–25 August 2016; pp. 608–611. [Google Scholar]
- Artem’ev, V.A.; Nezvanov, A.Y.; Nesvizhevsky, V.V. Precise calculations in simulations of the interaction of low energy neutrons with nano-dispersed media. Crystallogr. Rep. 2016, 61, 84–88. [Google Scholar] [CrossRef]
- Aleksenskii, A.E.; Shvidchenko, A.V.; Eidel’man, E.D. The applicability of dynamic light scattering to determination of nanoparticle dimensions in sols. Tech. Phys. Lett. 2012, 38, 1049–1052. [Google Scholar] [CrossRef]
- The Yellow Book 2005. Available online: http://rencurel.essworkshop.org/documents/YellowBookCDrom/index.htm (accessed on 6 July 2021).
- Shvetsov, V. Pulsed fast reactor IBR-2 after modernization. J. Surf. Investig. X-ray Synchrotron Neutron Tech. 2020, 14, S213–S217. [Google Scholar] [CrossRef]
- Kirmani, A.R.; Peng, W.; Mahfouz, R.; Amassian, A.; Losovyj, Y.; Idriss, H.; Katsiev, K. On the relation between chemical composition and optical properties of detonation nanodiamonds. Carbon 2015, 94, 79–84. [Google Scholar] [CrossRef] [Green Version]
- Osipov, V.Y.; Romanov, N.M.; Kogane, K.; Touhara, H.; Hattori, Y.; Takai, K. Intrinsic infrared absorption for carbon–fluorine bonding in fluorinated nanodiamond. Mendeleev Commun. 2020, 30, 84–87. [Google Scholar] [CrossRef]
- Dyadkin, V.; Pattison, P.; Dmitriev, V.; Chernyshov, D. A new multipurpose diffractometer PILATUS@SNBL. J. Synchrotron Radiat. 2016, 23, 825. [Google Scholar] [CrossRef]
- Prescher, C.; Prakapenka, V.B. DIOPTAS: A program for reduction of two-dimensional X-ray diffraction data and data exploration. High Press. Res. 2015, 35, 223–230. [Google Scholar] [CrossRef]
- Linder, P.; Zemb, T. Neutrons, X-ray and Light: Scattering Methods Applied to Soft Condensed Matter, 1st ed.; Elsevier: Amsterdam, The Netherlands, 2002. [Google Scholar]
- Linder, P.; Schweins, R. The D11 small-angle scattering instrument: A new benchmark for SANS. Neutron News 2010, 21, 15–18. [Google Scholar] [CrossRef]
- Richard, D.; Ferrand, M.; Kearley, G.J. Analysis and visualization of neutron-scattering data. J. Neutron Res. 1996, 4, 33–39. [Google Scholar] [CrossRef]
- Kuklin, A.I.; Rogachev, A.V.; Soloviov, D.V.; Ivankov, O.I.; Kovalev, Y.S.; Utrobin, P.K.; Gordeliy, V.I. Neutronographic investigations of supramolecular structures on upgraded small-angle spectrometer YuMO. J. Phys. Conf. Ser. 2017, 848, 012010. [Google Scholar] [CrossRef]
- Glinka, C.J.; Barker, J.G.; Hammouda, B.; Krueger, S.; Moyer, J.J.; Orts, W.J. The 30m small angle neutron scattering instruments at the National Institute of Standard and Technology. J. Appl. Cryst. 1998, 31, 430. [Google Scholar] [CrossRef]
- Kline, S.R. Reduction and analysis of SANS and USANS data using Igor Pro. J. Appl. Cryst. 2006, 39, 895–900. [Google Scholar] [CrossRef]
- Enyashin, A.N.; Ivanovskii, A.L. Atomic and electronic structures and stability of icosahedral nanodiamonds and onions. Phys. Solid State 2007, 49, 392–397. [Google Scholar] [CrossRef]
- Spanier, J.; Gelbard, E. Monte Carlo Principles and Neutron Transport Problems; Addison Wesley Publication Company: New York, NY, USA, 1969. [Google Scholar]
- Nezvanov, A.Y. Monte Carlo Neutron Transport in Nanodispersed Diamond Powder in Using of Born approximation (MCNT-NDP-B). RU Certificate of the Computer Program State Registration 2015618099, 30 July 2015. Available online: https://www.fips.ru/registers-doc-view/fips_servlet?DB=EVM&DocNumber=2015618099 (accessed on 6 July 2021).
- Nezvanov, A.Y. Structural Nanopowders Analyzer Based on Small-Angle Scattering Data (SNASAS). RU Certificate of the Computer Program State Registration 2020662675, 16 October 2020. Available online: https://www.fips.ru/registers-doc-view/fips_servlet?DB=EVM&DocNumber=2020662675 (accessed on 6 July 2021).


Publisher’s Note: MDPI stays neutral with regard to jurisdictional claims in published maps and institutional affiliations. |
© 2021 by the authors. Licensee MDPI, Basel, Switzerland. This article is an open access article distributed under the terms and conditions of the Creative Commons Attribution (CC BY) license (https://creativecommons.org/licenses/by/4.0/).
Share and Cite
Aleksenskii, A.; Bleuel, M.; Bosak, A.; Chumakova, A.; Dideikin, A.; Dubois, M.; Korobkina, E.; Lychagin, E.; Muzychka, A.; Nekhaev, G.; et al. Clustering of Diamond Nanoparticles, Fluorination and Efficiency of Slow Neutron Reflectors. Nanomaterials 2021, 11, 1945. https://doi.org/10.3390/nano11081945
Aleksenskii A, Bleuel M, Bosak A, Chumakova A, Dideikin A, Dubois M, Korobkina E, Lychagin E, Muzychka A, Nekhaev G, et al. Clustering of Diamond Nanoparticles, Fluorination and Efficiency of Slow Neutron Reflectors. Nanomaterials. 2021; 11(8):1945. https://doi.org/10.3390/nano11081945
Chicago/Turabian StyleAleksenskii, Aleksander, Markus Bleuel, Alexei Bosak, Alexandra Chumakova, Artur Dideikin, Marc Dubois, Ekaterina Korobkina, Egor Lychagin, Alexei Muzychka, Grigory Nekhaev, and et al. 2021. "Clustering of Diamond Nanoparticles, Fluorination and Efficiency of Slow Neutron Reflectors" Nanomaterials 11, no. 8: 1945. https://doi.org/10.3390/nano11081945
APA StyleAleksenskii, A., Bleuel, M., Bosak, A., Chumakova, A., Dideikin, A., Dubois, M., Korobkina, E., Lychagin, E., Muzychka, A., Nekhaev, G., Nesvizhevsky, V., Nezvanov, A., Schweins, R., Shvidchenko, A., Strelkov, A., Turlybekuly, K., Vul’, A., & Zhernenkov, K. (2021). Clustering of Diamond Nanoparticles, Fluorination and Efficiency of Slow Neutron Reflectors. Nanomaterials, 11(8), 1945. https://doi.org/10.3390/nano11081945