Article

Effect of Serum Albumin on Porphyrin-Quantum Dot Complex Formation, Characteristics and Spectroscopic Analysis

by
André L. S. Pavanelli
1,
Leandro N. C. Máximo
2,
Roberto S. da Silva
3 and
Iouri E. Borissevitch
1,*
1
Departamento de Física, Faculdade de Filosofia, Ciências e Letras de Ribeirão Preto, Universidade de São Paulo, Av. Bandeirantes 3900, Ribeirão Preto 14040-900, Brazil
2
Instituto Federal de Educação, Ciência e Tecnologia Goiano, Urutaí 75790-000, Brazil
3
Departamento de Ciências Biomoleculares, Faculdade de Ciências Farmacêuticas de Ribeirão Preto, Universidade de São Paulo, Av. Bandeirantes 3900, Ribeirão Preto 14040-900, Brazil
*
Author to whom correspondence should be addressed.
Nanomaterials 2021, 11(7), 1674; https://doi.org/10.3390/nano11071674
Submission received: 7 May 2021 / Revised: 16 June 2021 / Accepted: 21 June 2021 / Published: 25 June 2021

Abstract

:
The effect of bovine serum albumin (BSA) upon interaction between CdTe QD functionalized by 3-Mercaptopropionic Acid (CdTe-3-MPA QD) and two water soluble porphyrins: positively charged meso-tetra methyl pyridyl porphyrin (TMPyP) and negatively charged meso-tetrakis(p-sulfonato-phenyl) porphyrin (TPPS4), was studied in function of pH using the steady-state and time resolved optical absorption and fluorescence spectroscopies. It was shown that, depending on the charge state of the components, interaction with albumin could either prevent the formation of the QD…PPh complex, form a mixed QD…PPh…BSA complex or not affect PPh complexation with QD at all. The obtained results may be of interest for application in photomedicine.

1. Introduction

Photodynamic therapy (PDT) is a method of treatment of various diseases, including several types of cancer [1,2,3,4,5,6]. PDT is based on mutual application of a photoactive compound (photosensitizer, PS), visible or infrared light and molecular oxygen to generate reactive oxygen species (ROS). The efficacy of PDT depends on the PS structural characteristics, which are important to increase its uptake and subcellular localization. Porphyrin-type compounds are of a special interest among PS. Due to their intensive optical absorption in the required spectral regions, high quantum yield of the triplet state and relative intense fluorescence, high dark and photostability and affinity with biological structures, such as proteins, nucleic acids and cell membranes, porphyrins (PPh) are widely applied as PS in Photodynamic Therapy (PDT) [1,2,3,4,5,6] and as fluorescence probes in Fluorescence Diagnostics (FD) [7,8]. However, a great disadvantage of PPh for these applications lies in their relatively low optical absorption in the spectral region of the so-called phototherapeutic window (600–800 nm), where biological tissues are the most transparent. The problem could be corrected by PPh complexation with certain structures, able to absorb light energy in this spectral range and transfer this energy to PPh molecules.
Semiconductor nanocrystals (quantum dots, QD) possess intense optical absorption in a wide spectral range and intensive and narrow fluorescence band, the position of which depends on QD core size [9]. Due to these extraordinary characteristics, QD can serve as an antenna, accumulating the light energy in a wide spectral region and passing it to other compounds, PPh, in particular [10,11,12,13].
On the other hand, being inorganic semiconductors, QDs manifest high toxicity toward biological objects and possess low water solubility, which restricts their direct application in medicine and biology. However, when the QD surface is covered with appropriate molecules (functionalized QD), it overcomes this imperfection, as in this case living systems appear protected from the contact with the toxic QD core (CdTe or CdSe, for example). Moreover, functionalization of the QD surface by specific groups, for example, aptamers, can increase their affinity to specific biological targets, malignant tissues in particular [14,15]. This makes QD a promising drug delivery system [16,17,18].
At the same time, the mechanisms of QD action in photochemotherapy, not well studied yet, differ from the photodynamic effect, the basis of the photodynamic therapy (PDT), which is effective and well described. Therefore, the complexes of porphyrins with quantum dots are of great interest for medicine. PPh and QD complexation can occur via energy, electron or proton transfer, depending on the structural characteristics of the participants [19,20,21,22,23,24,25,26,27,28,29].
When introduced into an organism, PPh and QD should interact with various organized structures, such as cell membranes, nucleic acids, proteins, etc. Among them, serum albumin attracts a special attention due to its ability to bind various compounds and transport them within the organism with blood flux [30]. Besides, albumins possess elevated affinity to malignant tissues [31,32]. This makes albumins perspective compounds as delivery systems. On the other hand, interaction with albumins can affect complexation of PPh with QD, changing its and the complex characteristics.
In the present work, we have studied the effect of bovine serum albumin on interaction between CdTe QD functionalized by 3-mercaptopropionic acid (CdTe-3-MPA QD) and two water soluble porphyrins: positively charged meso-tetra methyl pyridyl porphyrin (TMPyP) and negatively charged meso-tetrakis(p-sulfonato-phenyl) porphyrin (TPPS4). The study was realized at pH 7.0 and pH 4.0 using optical absorption and fluorescence spectroscopies. It was shown that, depending on the charge state of components, interaction with albumin could produce various effects: prevent formation of the QD…PPh complex, form a mixed QD…PPh…BSA complex or not affect the PPh complexation with QD at all. The obtained results may be of interest for application in photomedicine.

2. Materials and Methods

TMPyP and TPPS4 porphyrins (Figure 1) were purchased from Mid Century Chemicals (Posen, IL, USA), and used without any additional purification. Bovine serum albumin (BSA) was obtained from Sigma Aldrich Products (San Luis, MO, USA). CdTe-3-MPA QD were synthesized at the Department of Biomolecular Sciences of the Faculty of Pharmaceutic Sciences, Sao Paulo University, Brazil. The synthesis was realized in an aqueous media from Cd2+ and Te2− solutions in accordance with the procedure described in details in [33] with some modifications. The solution was prepared by adding the oxygen-free NaHTe solution to the Cd2+ precursor solution at pH 11, in the absence of light, under continuous argon flow.
The QD diameter (D) and molar absorption coefficient (ε), were calculated by the Equations (1) and (2) [34]:
D = ( 9.8127 × 10 7 ) λ 3 ( 1.7147 × 10 3 ) λ 2 + ( 1.0064 ) λ 194.84
ε = 10043   ( D ) 2.12
leading to D ≈ 2.5 nm and ελ557 nm = 7.0 × 10⁵ M−1 cm−1, respectively.
The compound concentrations were determined from optical absorption (A) as
C = A ε
using molar absorption coefficients: for BSA ε = 4.55 × 10⁴ M−1 cm−1 at λ = 280 nm, for CdTe-3-MPA QD ε = 1.27 × 10⁵ M−1 cm−1 at λ = 557 nm, for TMPyP ε = 2.26 × 10⁵ M−1 cm−1 at λ = 425 nm, for non-protonated TPPS4 form (pH 7.0) ε =1.3 × 10⁴ M−1 cm−1 at λ = 515 nm and ε = 3.26 × 10⁴ M−1 cm−1 at λ = 644 nm for its biprotonated form (pH 4.0).

2.1. Steady-State Optical Absorption and Fluorescence Measurements

The absorption spectra were obtained with the help of a Beckman Coulter DU-640 spectrophotometer and the fluorescence spectra were monitored by a Hitachi 7000 spectrometer.
To exclude the effect of changes in optical absorption at excitation wavelengths, the fluorescence intensities obtained experimentally were corrected in accordance with the equation:
I c o r r = I e x p A e x
where I e x p and I c o r r are experimental and corrected fluorescence intensities, respectively, and A e x is the absorbance at the excitation wavelength.

2.2. Measurements of Time Resolved Fluorescence

Time-resolved fluorescence experiments were made using the time-correlated single photon counting technique. The excitation source was a pulse titanium-sapphire laser Tsunami 3950 pumped by a Millena Xs laser, both from Spectra Physics, with 5 ps pulse width at the half height and 8.0 MHz frequency, controlled by the pulse picker 3980 from Spectra Physics. The excitation wavelengths were obtained by the BBO (GWN-23PL from Spectra Physics) crystal. The measurements were made with a FL9000 spectrometer from Edinburgh, adjusted in an ‘L’ configuration with the excitation source. The wavelengths for measurement were selected by a monochromator and the detection was made by a Hamamatsu R3809U photomultiplier. The average time response of the instrument was 100 ps.
The PPh, QD and BSA stock solutions were prepared in phosphate buffer (pH 6.8, 7.5 mM). All experiments were realized at room temperature (24 ± 1) °C.
The experimental data were treated using OriginPro 8 commercial program. All final values were average of three independent experiments.

3. Results and Discussion

The CdTe-3-MPA QD possess optical absorption in the spectral range from 200 nm to 650 nm with an accentuated peak in the range from 425 nm to 575 nm with λmax = 490 nm (Figure 2A). The fluorescence emission spectra of the synthesized CdTe-3-MPA QD were measured with excitation at 490 nm. Figure 2B shows the emission spectra with a band in the region of 500 nm to 700 nm (λmax = 585 nm).

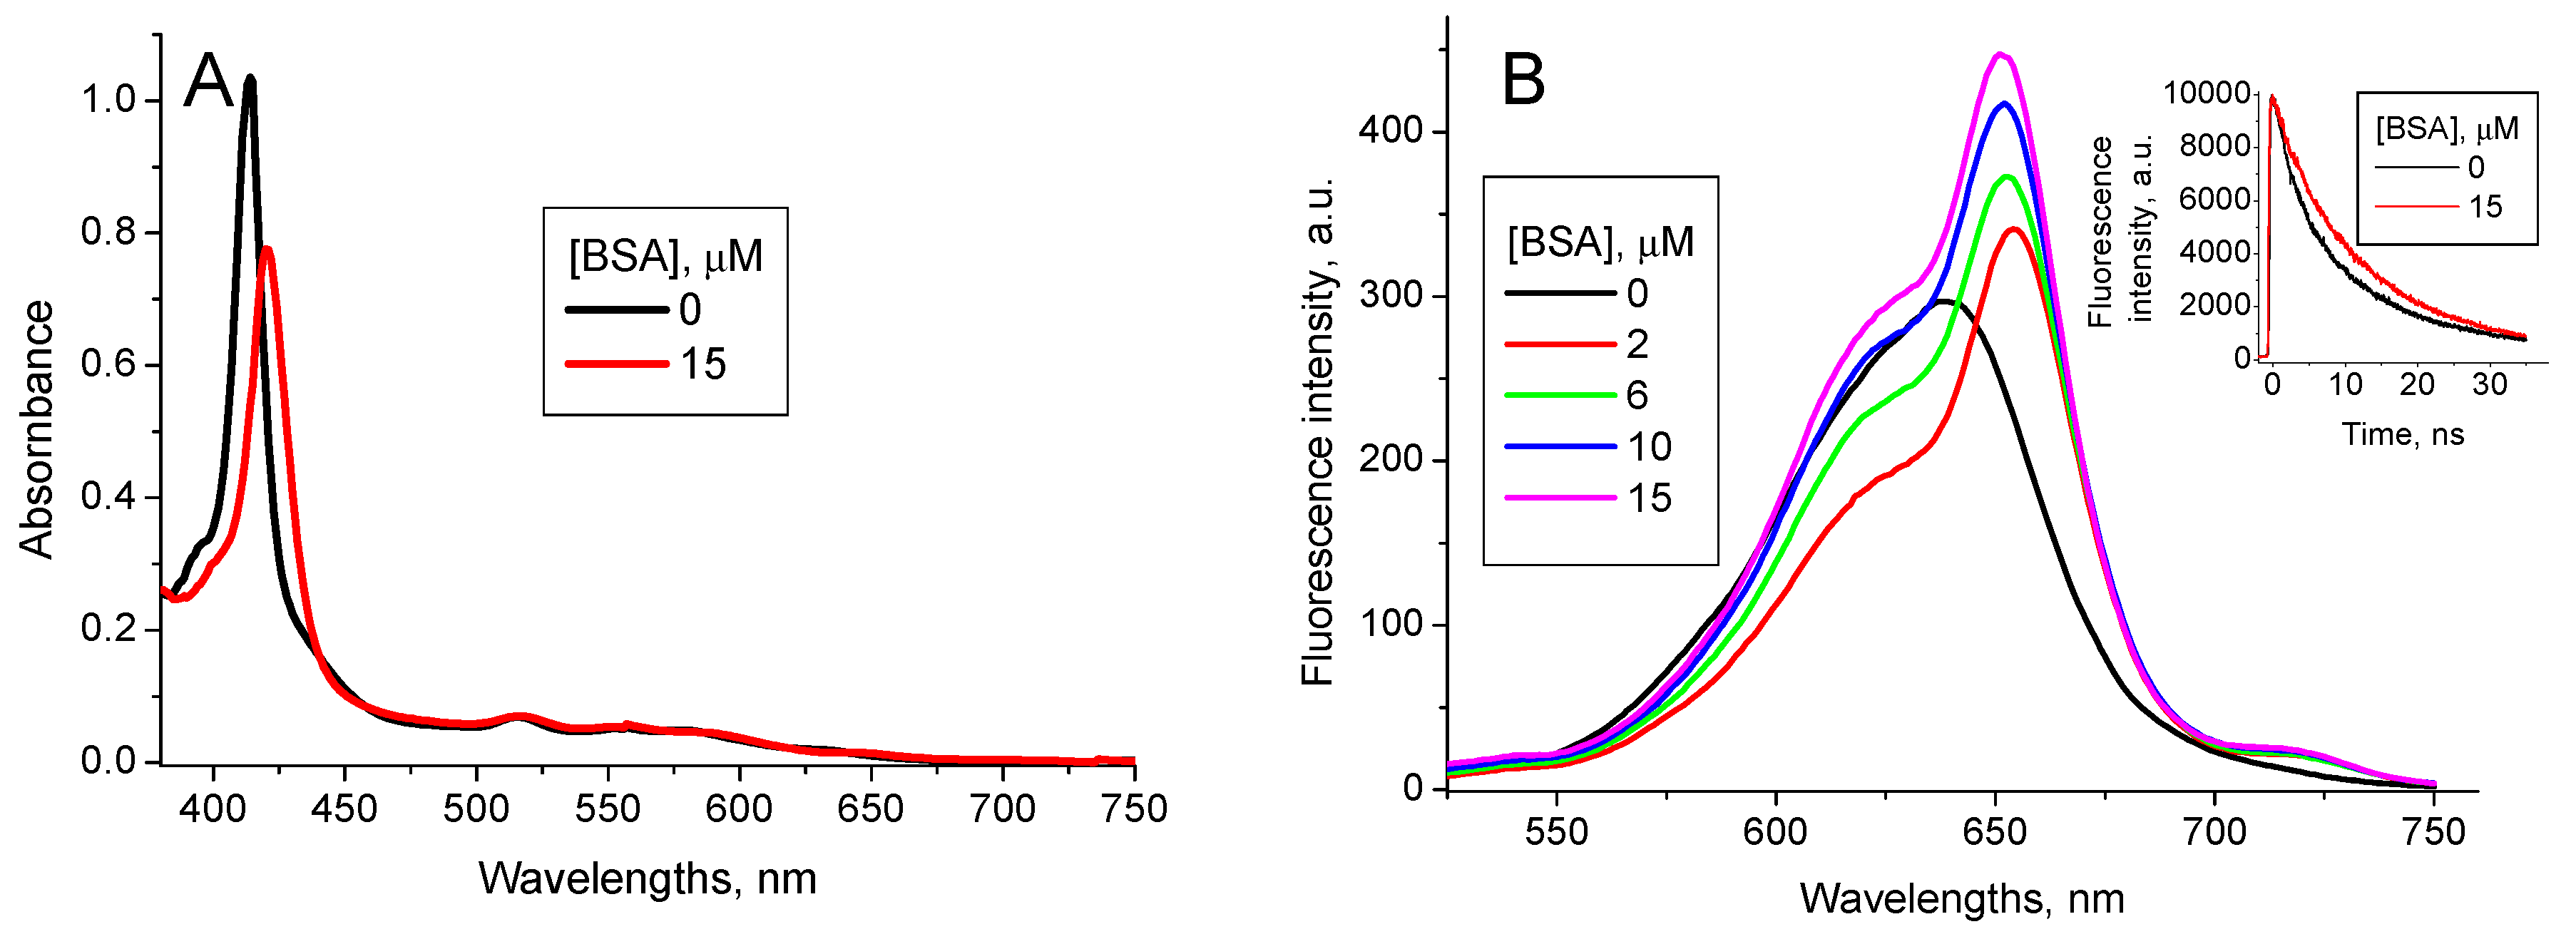
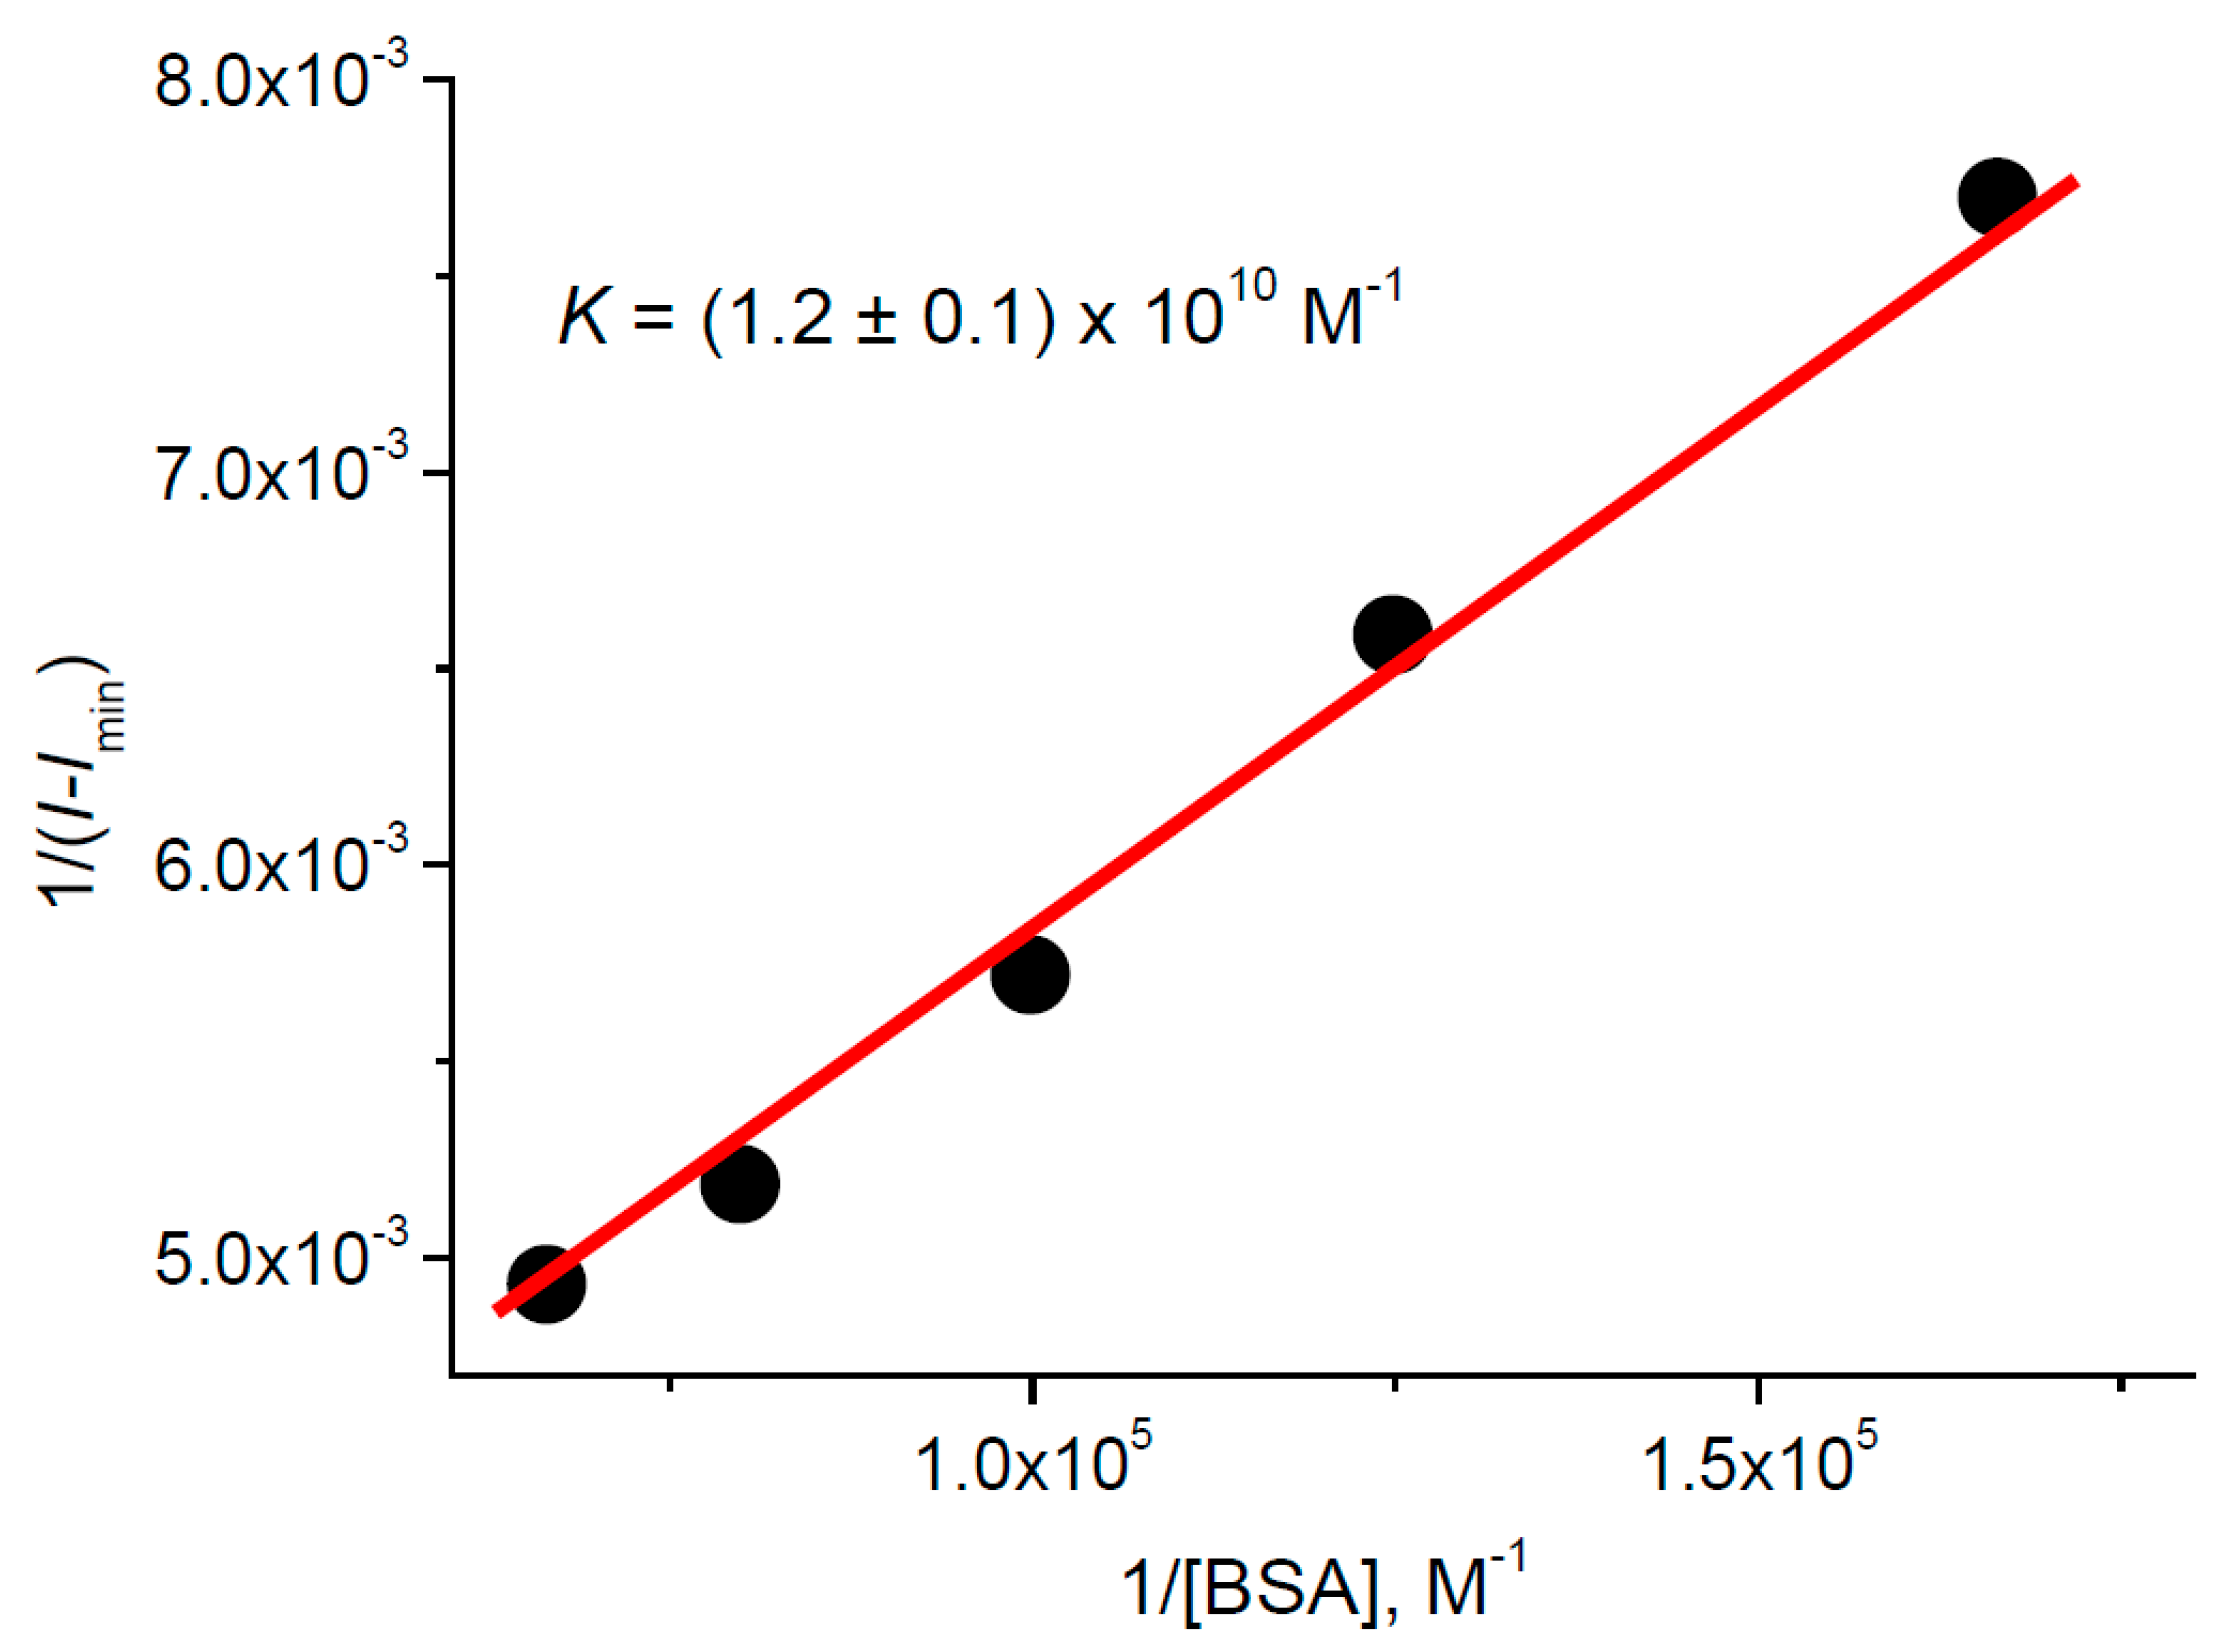
3.1. Quantum Dot Interaction with BSA

The results presented in this section were obtained at pH 7.0. At pH 4.0 we have observed no significant effect of BSA on QD characteristics in the concentration range used.
In an aqueous solution, BSA possesses UV-visible spectrum with maximum absorption at 280 nm and the fluorescence emission spectrum with maximum at 380 nm when excited at 280 nm. Interaction of BSA with CdTe-3-MPA QD in aqueous solutions show significant increase of the QD stability with no precipitation even after 24 h. The QD luminescence decay curves, registered for 480 nm excitation have been fitted successfully as the sum of two exponents (Figure 2C):
I = I 1 × exp ( t / τ 1 QD _ BSA ) + I 2 × exp ( t / τ 2 QD _ BSA )
With lifetimes of the components τ 1 QD _ BSA = (0.9 ± 0.1) ns and τ 2 QD _ BSA = (20 ± 1) ns.
Addition of BSA does not affect the QD absorption spectrum, however, it increases the QD luminescence intensity (Figure 2B, inset). The profile of the QD luminescence decay curve continues biexponentially with invariable lifetimes of the components, and their relative amplitudes vary with the BSA concentration (Table 1).
The contribution of the respective component can be calculated as the ratio between its amplitude (I1 or I2) and the sum of amplitudes of both components (I1 + I2). Therefore, the contribution of the long-lived component, calculated as
R 2 = I 2 I 1 + I 2
where I1 and I2 are the amplitudes of the short-lived and the long-lived components, respectively, and suffer an increase, which coincides with the increase in the integral luminescence intensity (compare the insets on Figure 2B,C).
Thus, it is possible to conclude that the increase of the QD luminescence intensity may be associated with increase of the contribution of the long-lived component R 2 . Consequently, the contribution of the short-lived component decreases.
As it has been shown recently [13,26,27,28,29], the short-lived component of the CdTe-3-MPA QD luminescence is associated with the electron-hole annihilation in the QD core, while the long-lived one is due to the electron-hole annihilation in the QD functionalizing (protective) shell. Therefore, the increase of the QD luminescence intensity in the presence of BSA can be due to interaction of BSA with 3-MPA groups on the QD surface.
The binding constant of QD with BSA (KQD_BSA) was calculated using the equation from [35]:
1 I I m i n = 1 I m a x I m i n + 1 ( I m a x I m i n ) K QD _ BSA   1 [ B S A ]
where Imin, I and Imax are integral luminescence intensities in the absence of BSA, for BSA concentration [BSA] and for the BSA excess.
The determined value was KQD_BSA = (1.2 ± 0.1) × 106 M−1.
The fact that at pH 4.0 no changes in the QD and BSA characteristics at used concentrations were observed may be explained by strong electrostatic repulsion between positively charged QD and BSA. Indeed, the isoelectric point (IP) of BSA is at pH 4.7 [30]. At the same time the pKa point of CdTe-3-MPA QD is at pH 4.34 [36]. Thus, at pH 4.0 the total charge of both BSA and QD is positive, which should reduce the probability of their binding making the binding constant much less than (1.2 ± 0.1) × 106 M−1 observed for pH 7.0.

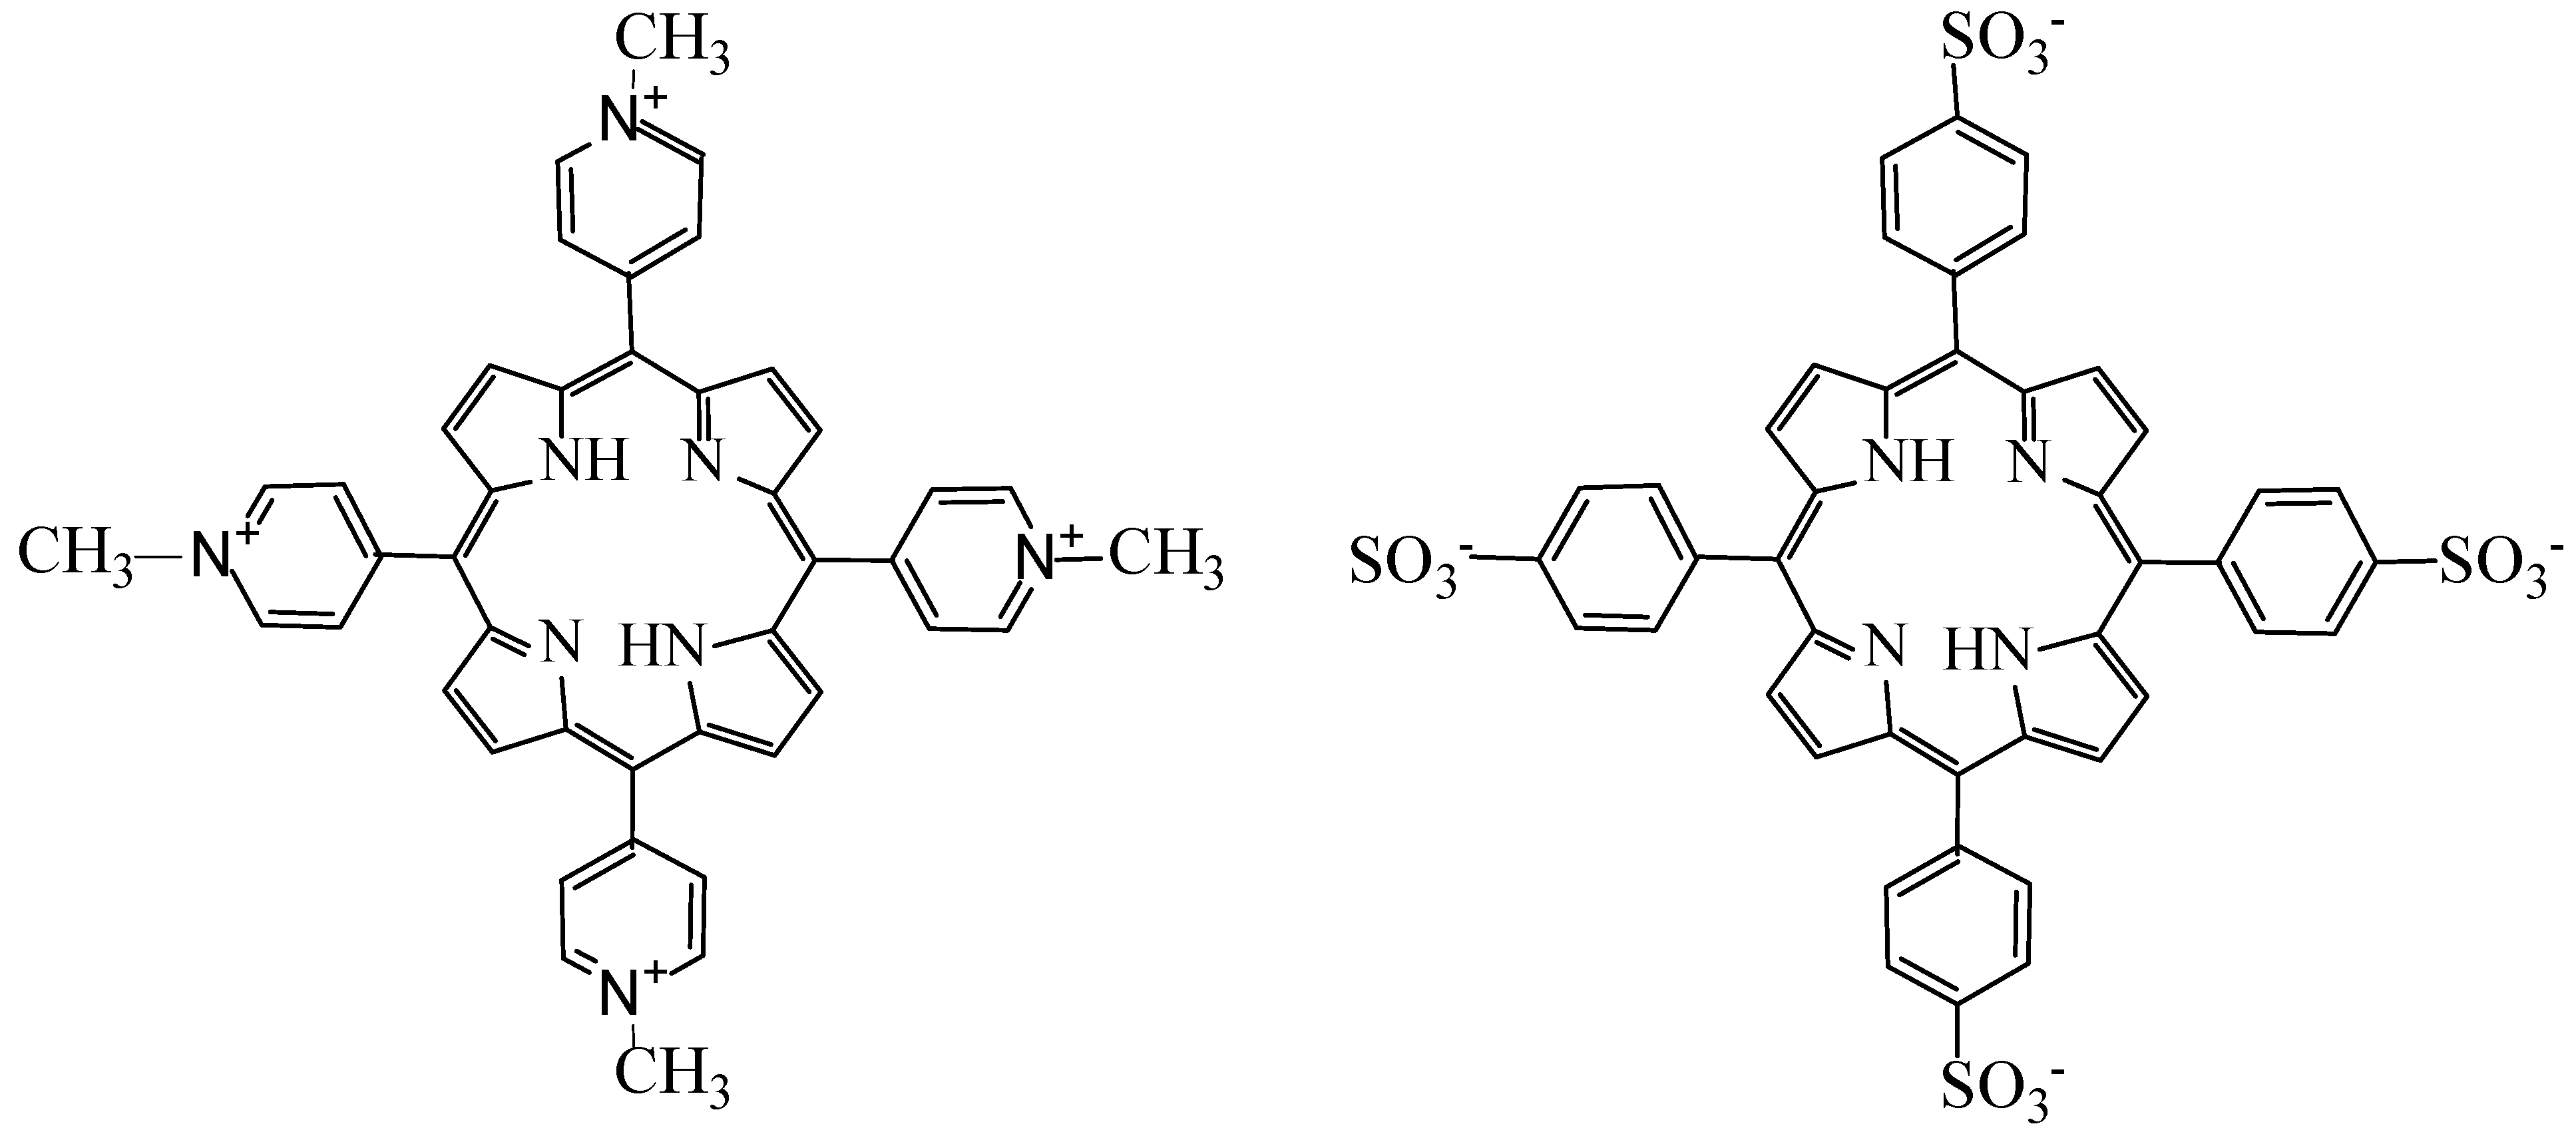
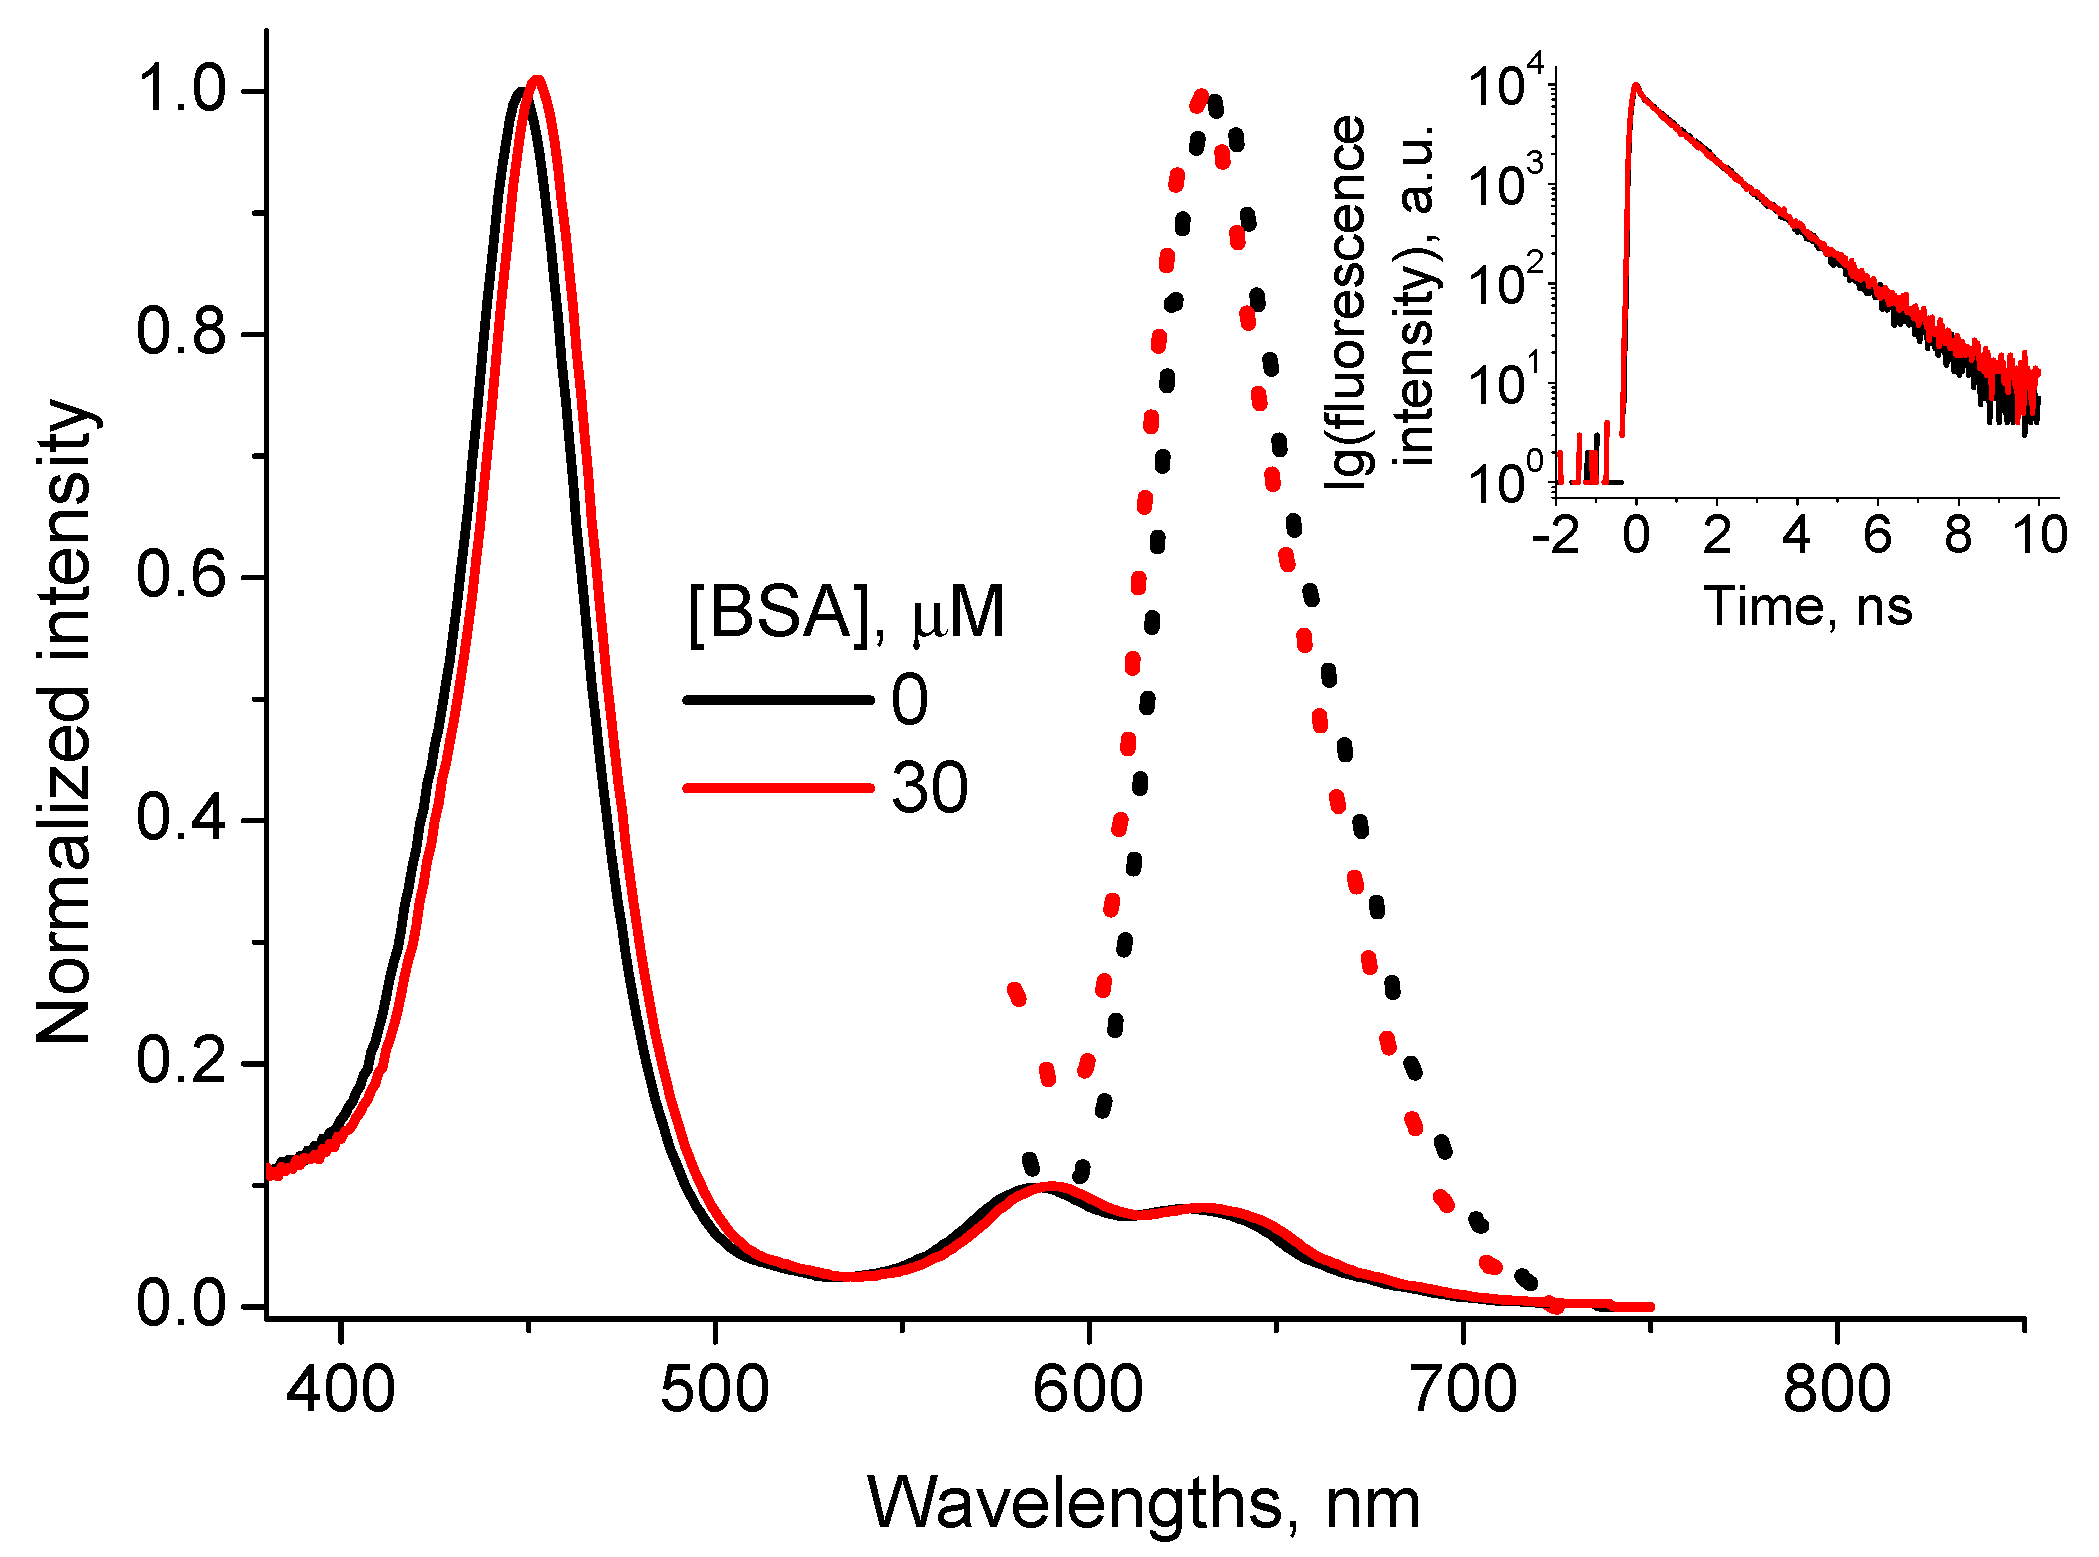
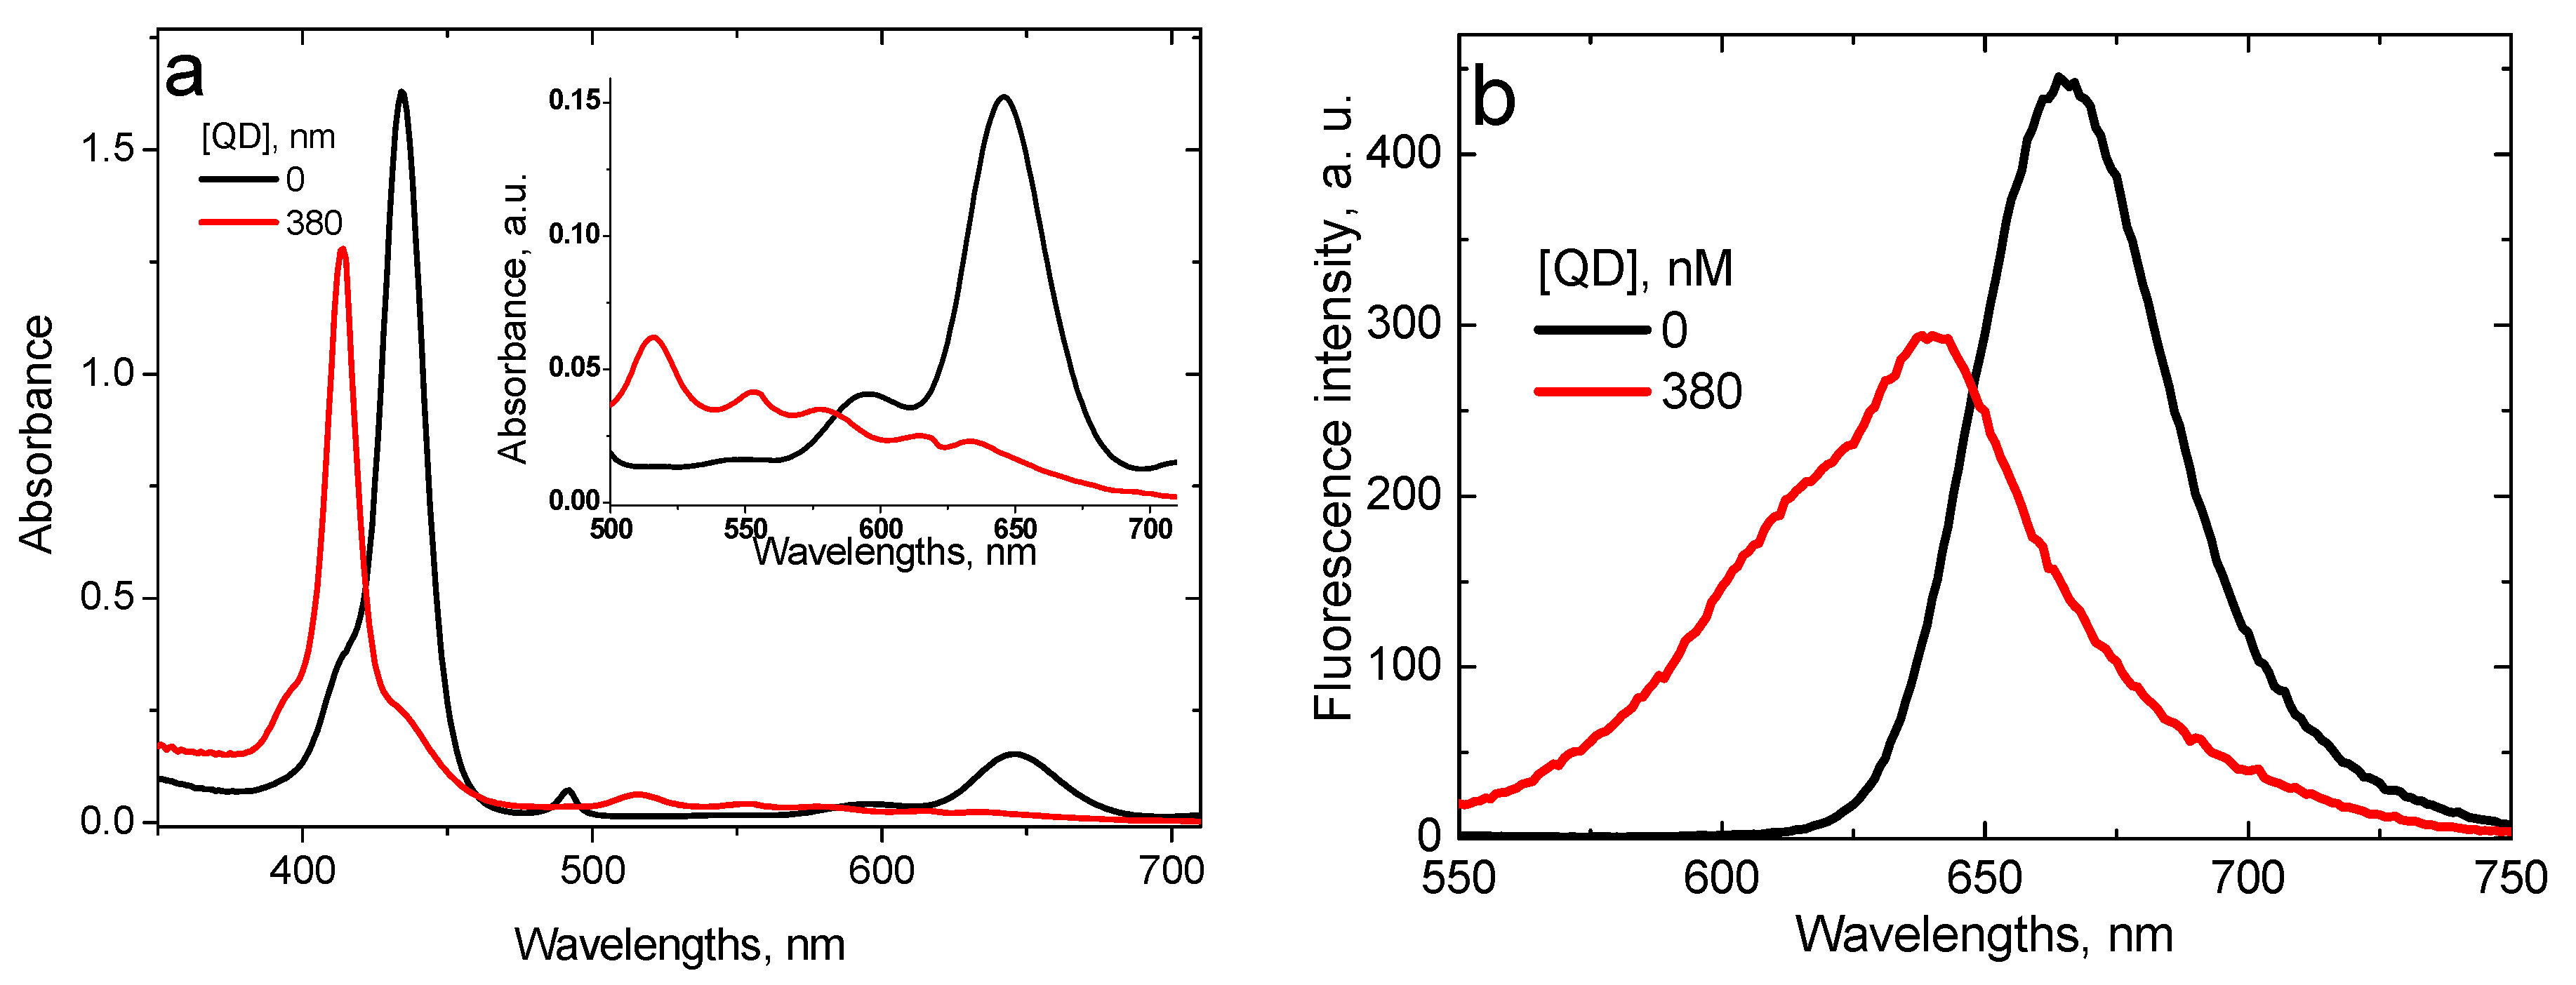
3.2. Effect of BSA upon QD Interaction with TMPyP Porphyrin

Due to the presence of four positive side groups in its structure TMPyP porphyrin possesses 4+ charge in the pH range from 2.0 up to 9.0. These series of experiments were made at pH 4.0 and pH 7.0. However, the results, obtained for these two pHs were quite similar. Therefore, we present here only the results obtained in aqueous phosphate buffer solution at pH 7.0.
Interaction between CdTe-3MPA QD and TMPyP porphyrin in water solutions is characterized by formation of a charge transfer complex between negatively charged MPA groups of QD and positively charged methyl-pyridinium groups of TMPyP [28]. The complex is characterized by optical absorption peaks at 455 nm, 585 nm and 629 nm and a fluorescence peak at 632 nm (Figure 3). The fluorescence decay curve is monoexponential with the lifetime τTMPyP_QD= (5.3 ± 0.2) ns (Figure 3, inset).
The binding constant, determined from TMPyP fluorescence quenching by QD was KTMPyP_QD = (6.0 ± 0.5) × 106 M−1 [28].
The addition of BSA to the solution with formed CdTe-3MPA…TMPyP complex induces changes neither in the complex absorption and fluorescence spectra nor in the profile of the fluorescence decay curve (Figure 3).
Another series of experiments was made adding QD into the solution containing TMPyP and BSA. It was shown formerly [37] that TMPyP and BSA form a complex characterized by the optical absorption spectrum with Soret peak at 425 nm and three peaks in the Q region (Figure 4A) and fluorescence spectrum with a peak at 629 nm (Figure 4B). The binding constant of TMPyP with BSA was estimated as KTMPyP_BSA = 7.3 × 10⁵ M−1 [37].
The addition of QD into the TMPyP + BSA solution induces the reduction of the absorption peak at 425 nm and formation of a new absorption peak at 455 nm. This new absorption peak coincides with that of CdTe-3MPA…TMPyP complex (see Figure 3). Besides, the QD addition induces increase of the solution fluorescence intensity. Thus, we can associate these spectral changes with the formation of CdTe-3MPA…TMPyP charge transfer complex even in the BSA presence.
Binding constant of TMPyP with QD in the presence of BSA was calculated from the dependence of the integral fluorescence on the QD concentration using the Equation (7), which led to KTMPyP_QD + BSA = (10 ± 3) × 106 M−1, close to that obtained in the BSA absence.
Thus, we can affirm that BSA in the solution does not destruct CdTe-3MPA…TMPyP complex already formed, and does not reduce the probability of its formation, as well. This could be explained by the fact that the constant of the CdTe-3MPA…TMPyP complex formation is approximately 10 times larger than that for TMPyP binding with BSA and 5 time larger than for CdTe-3MPA binding with BSA. Therefore, in the system of equilibria
CdTe-3MPA + TMPyP ⇔ CdTe-3MPA…TMPyP   KTMPyP_QD = (6.0 ± 0.5) × 106 M−1
BSA + TMPyP ⇔ BSA…TMPyP   KTMPyP_BSA = 7.3 × 10⁵ M−1
CdTe-3MPA + BSA ⇔ CdTe-3MPA…BSA      KQD_BSA = (1.2 ± 0.1) × 106 M−1
the first one should be predominant.
Taking into account that IP of BSA is at pH 4.7, at pH 7.0 its net charge is negative and the electrostatic attraction should stimulate its binding with positively charged TMPyP molecules. However, TMPyP interaction with CdTe-3MPA QD appears stronger. This may be due to stabilization of TMPyP-QD contact via charge transfer complex formation.
The question is whether the CdTe-3MPA…TMPyP complex can bind with BSA. However, no spectral changes have been observed which could be associated with the formation of this complex.

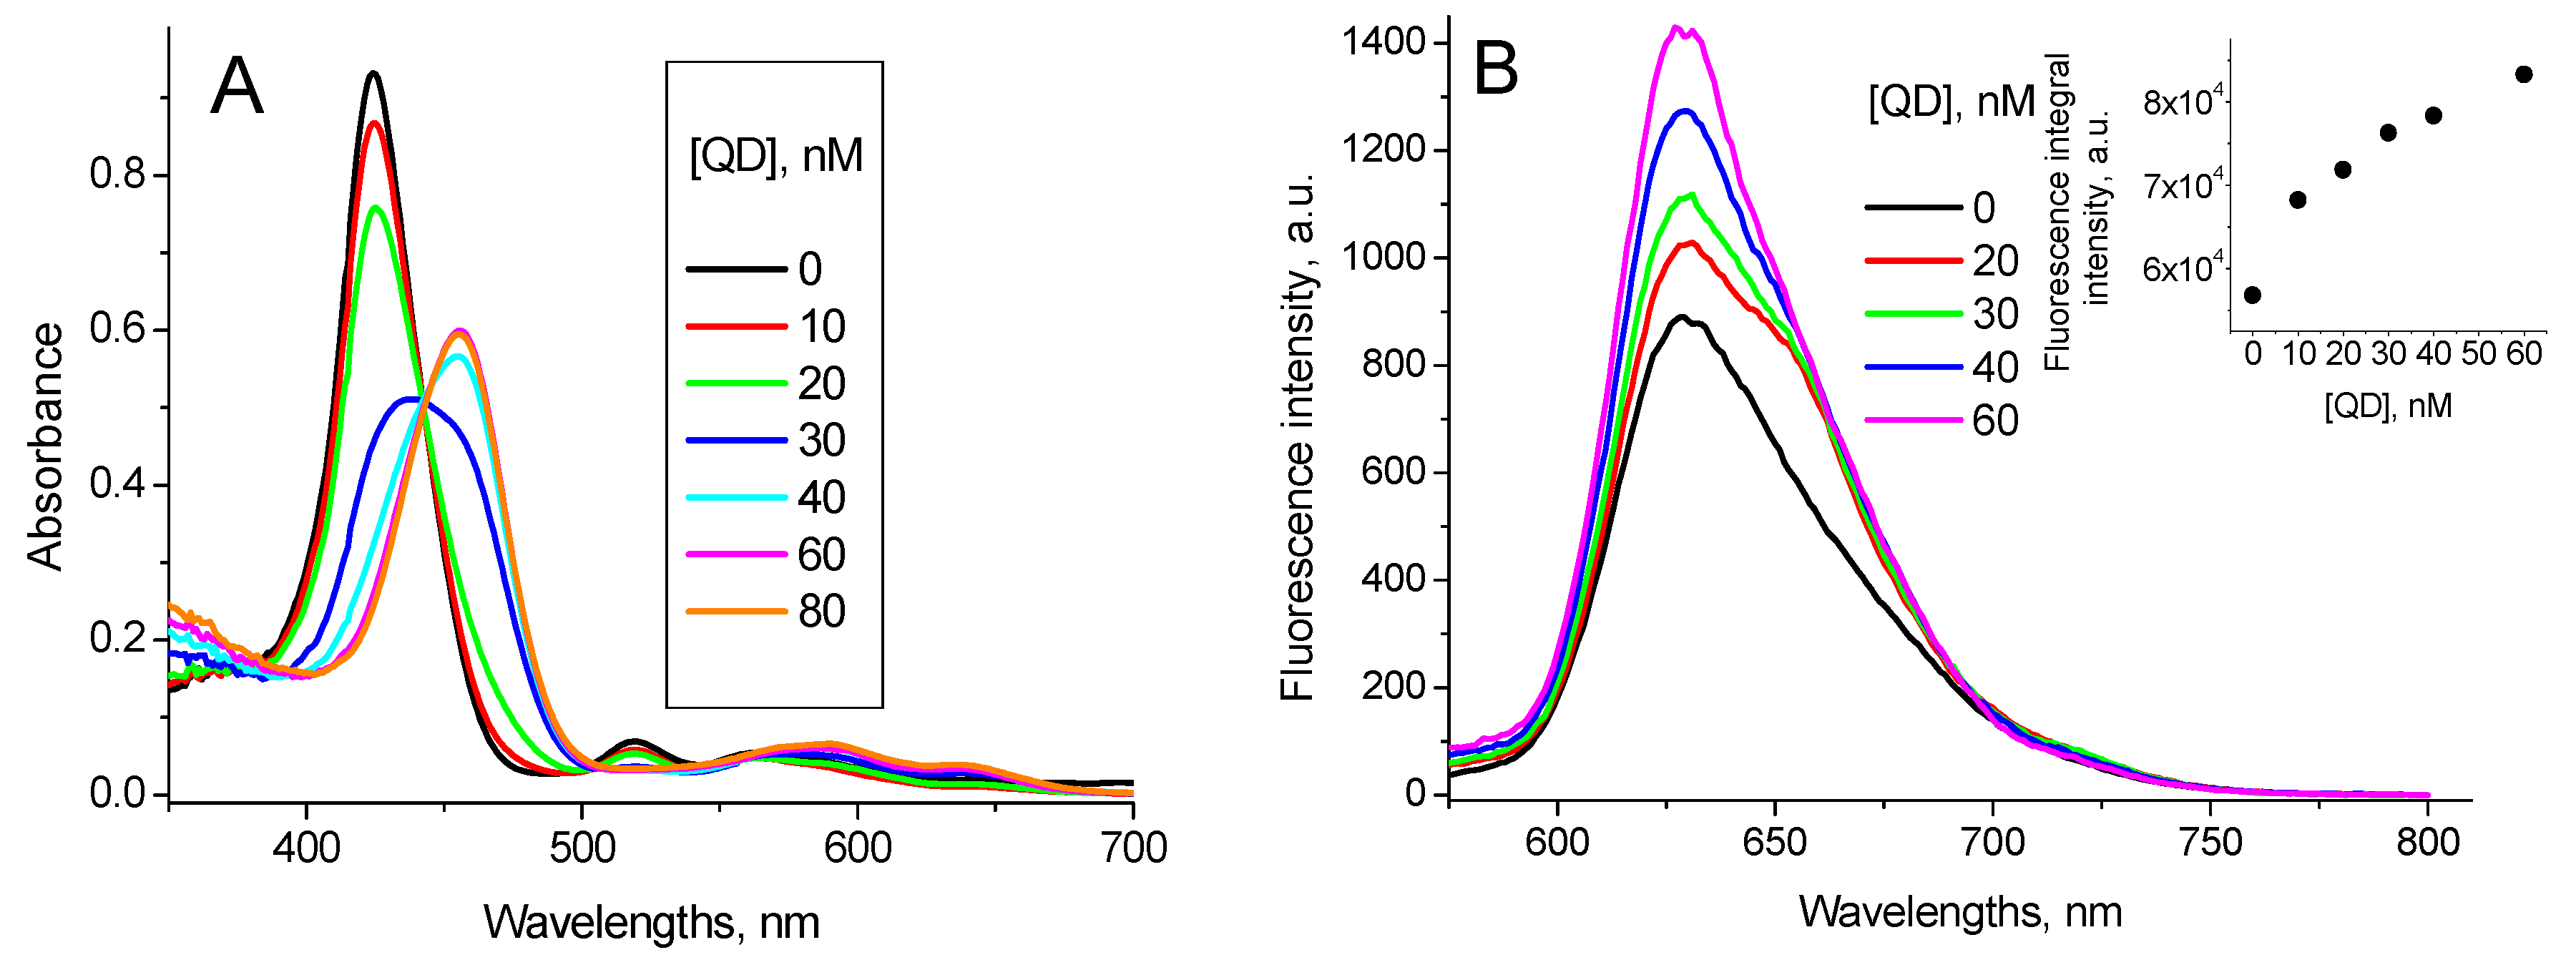
3.3. Effect of BSA on Interaction of QD with TPPS4 Porphyrin

Due to the presence of four nitrogen atoms in the porphyrin ring structure TPPS4 porphyrin can be biprotonated, with the pKa point close to pH 5.0 [38]. Therefore, at pH 7.0, where TPPS4 is in the non-protonated form, it possesses a charge 4, while at pH 4.0, where it is in the biprotonated form, its charge is 2. This determines the difference in the TPPS4 behavior at these two pHs. Therefore, at pH 7.0 the non-protonated TPPS4 is characterized by the optical absorption spectrum with Soret peak at 413 nm and four peaks in the Q-region, the largest localized at 518 nm, and fluorescence with maximum at 640 nm (Figure 5) and the lifetime τpH7 = 8.5 ns. Biprotonated TPPS4 possesses the absorption spectrum with Soret peak at 434 nm and three peaks in the Q-region with the largest one at 646 nm and fluorescence with maximum at 665 nm (Figure 5) and the fluorescence lifetime of τpH4 = 3.6 ns [39].

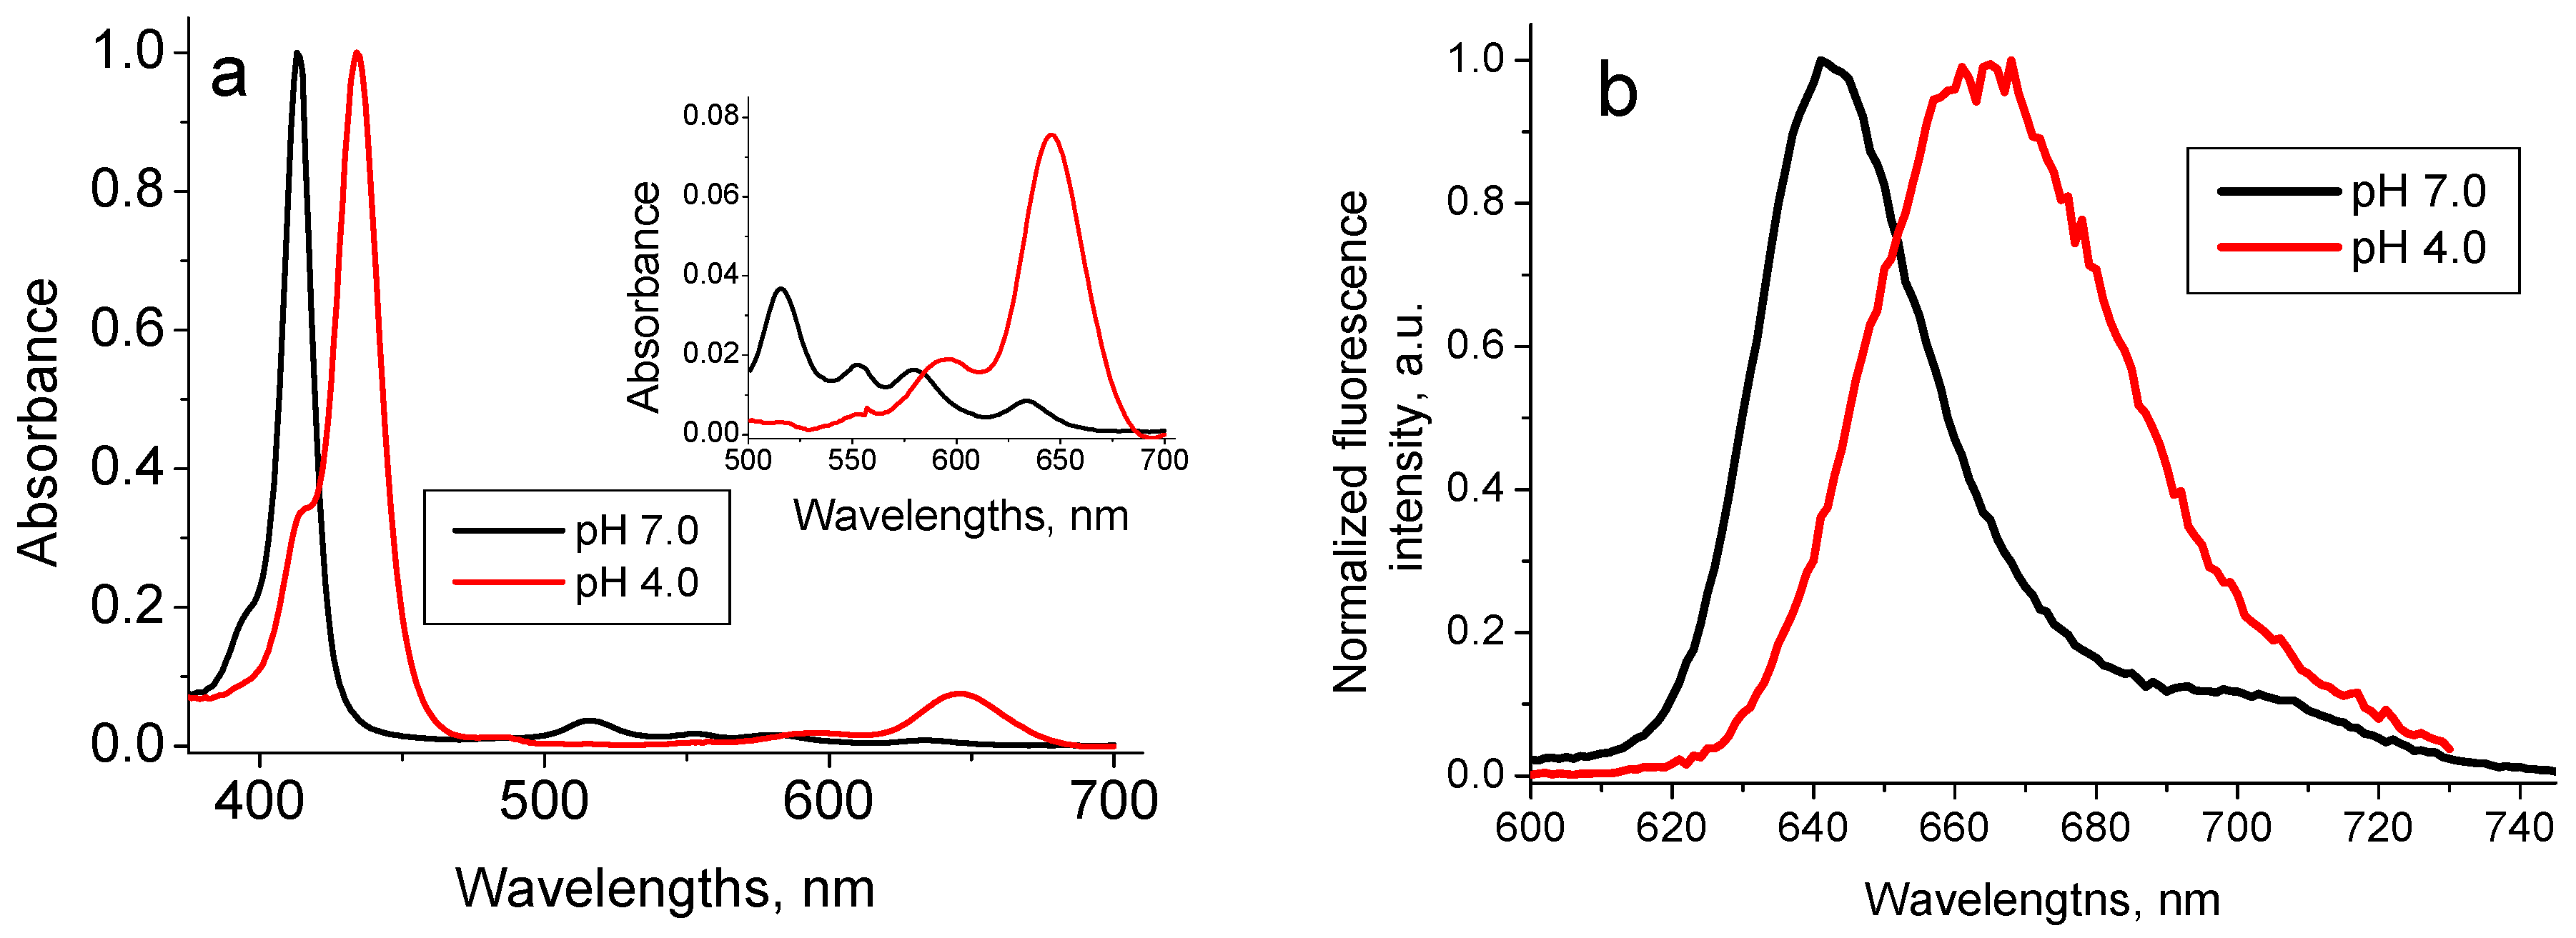
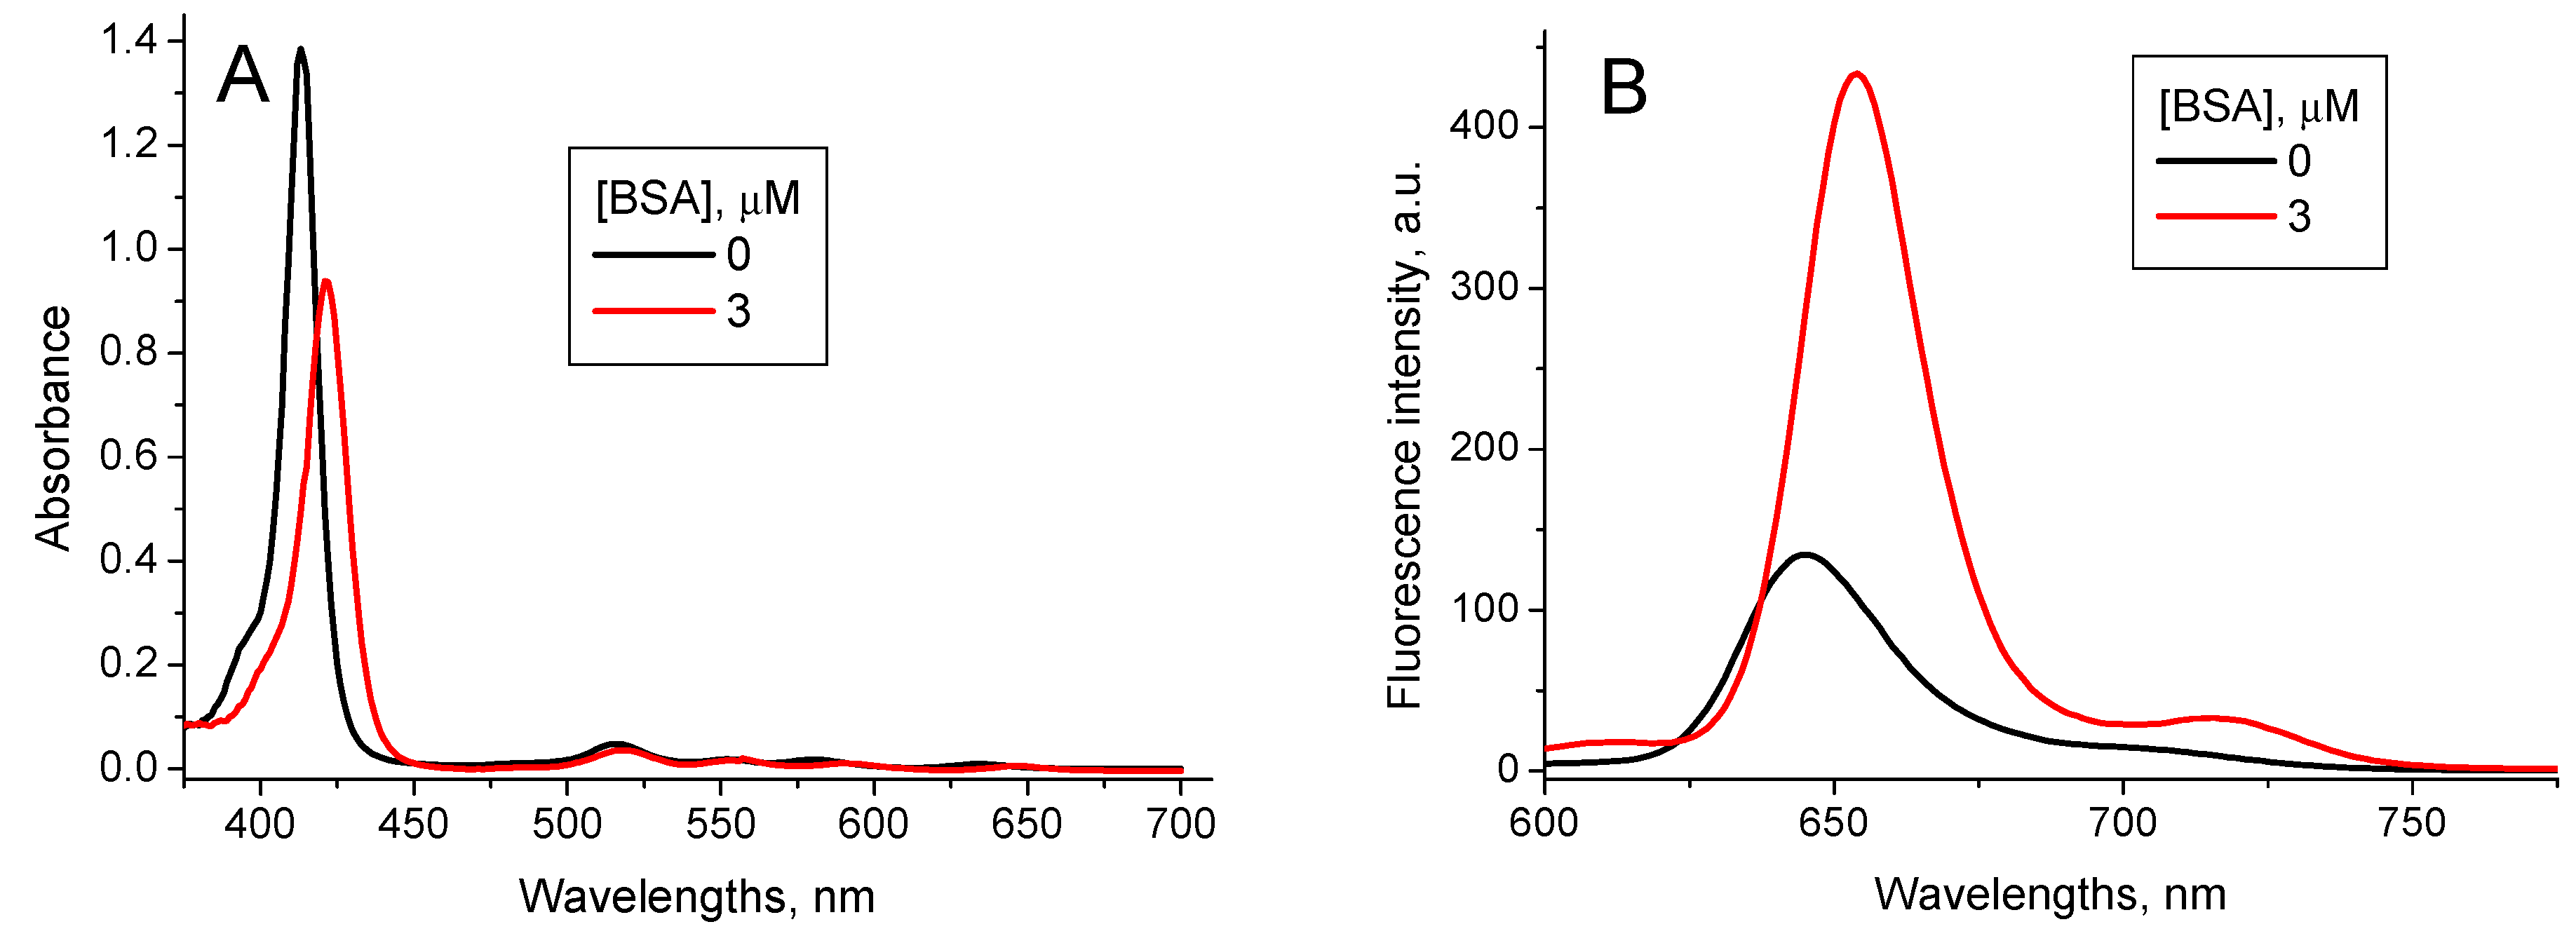
3.3.1. Effect of BSA on Interaction of QD with TPPS4 Porphyrin at pH 7.0

Recently we have demonstrated [29] that at pH 7.0 interaction of TPPS4 with CdTe-3-MPA QD is realized via energy transfer from QD to TPPS4. This interaction induces no changes in absorption and emission spectra of both TPPS4 and QD; however, it reduces the QD luminescence intensity. The binding constant of the non-protonated TPPS4 with QD was estimated as KTPPS_QD pH7 = (2.5 ± 0.1) × 106 M−1 [29].
Interaction of TPPS4 with BSA has recently been studied in [37]. Addition of BSA into the TPPS4 solutions at pH 7.0 induces the shift of the TPPS4 Soret absorption band from λ = 412 nm to λ = 422 nm and the fluorescence peak from λ = 645 nm to λ = 654 nm. The TPPS4 fluorescence intensity increases (Figure 6), and lifetime is practically unchanged τTPPS_BSA pH7 = (10.8 ± 0.1) ns. The TPPS4-BSA binding constant is KTPPS_BSA pH7 = 3.2 × 10⁶ M−1 [37].
The addition of BSA into the TPPS4…QD solution shifts the TPPS4 absorption band from 412 nm to 422 nm and a new band centered at 436 nm appears. Simultaneously, the TPPS4…QD complex emission increases and an emission peak at 650 nm is formed (Figure 7).
These new peaks combine with no peak of either pure TPPS4, pure CdTe-3-MPA QD or TPPS4…CdTe-3-MPA complex. Therefore, we believe they reflect formation of a new mixed TPPS4…CdTe-3-MPA…BSA complex. The binding constant calculated from the fluorescence data in accordance with the Equation (7) is KTPPS_QD + BSA pH7 = (6.5 ± 0.2) × 106 M−1.
Addition of QD into the TPPS4 + BSA mixed solution induces no changes in the absorption and fluorescence spectra of these solutions, demonstrating that binding of TPPS4 with BSA at pH 7.0 prevents the formation of TPPS4…CdTe-3-MPA complex and consequently the formation of the mixed TPPS4…CdTe-3-MPA…BSA complex.
Effective binding of negatively charged non-protonated TPPS4 with BSA, which at pH 7.0 is also negatively charged, shows that in this case electrostatic repulsion is not dominant and other types of interaction, such as a hydrophobic one, should be responsible for porphyrin binding with BSA. High stability of the TPPS4…CdTe-3-MPA complex cannot be associated with the electrostatic interaction, as well, since at pH 7.0 the MPA groups of QD are non-protonated and do not possess a positive charge. The effective contribution of non-electrostatic interactions in the non-protonated TPPS4 + QD + BSA system follows from the fact of formation of the mixed TPPS4…QD…BSA complex. However, more detailed and justified conclusions about the nature and contributions of various types of interaction in this complex system require more profound studies using other experimental techniques besides spectroscopic ones.

3.3.2. Effect of BSA on Interaction of QD with TPPS4 Porphyrin at pH 4.0

As it has been demonstrated earlier [29], at pH 4.0 interaction of TPPS4 with CdTe-3-MPA QD occurs via two mechanisms: the proton transfer from TPPS4 to QD and the energy transfer from QD to TPPS4, the first one being predominant. The proton transfer changes the TPPS4 absorption and fluorescence spectra, characteristic for the biprotonated TPPS4, to those of the non-protonated form (Figure 8). The fluorescence lifetime changes from τ TPPS   pH 4 = ( 3.6 ± 0.2 )   ns to τ TPPS _ BSA   pH 4 = ( 8.5 ± 1 )   ns , which is also characteristic for the non-protonated TPPS4.
The binding constant of TPPS4 with CdTe-3-MPA QD, calculated from fluorescence data is K TPPS _ QDpH 4 = ( 2.4 ± 0.2 ) × 10 6 M−1 [29].
Addition of BSA into the TPPS4 solutions at pH 4.0 induces the TPPS4 deprotonation, as well, leading to spectral characteristics equal to those of the non-protonated TPPS4 bound with BSA: Soret peak at λ = 422 nm, fluorescence peak at 654 nm and fluorescence lifetime τ = 10.8 ns. The obtained binding constant of TPPS4 with BSA is KTPPS_BSA pH4 = 1.5 × 10⁸ M−1 [37].
Addition of BSA into the TPPS4…CdTe-3-MPA complex solution changes the profile and peak positions of the optical absorption and fluorescence spectra in such a way that the final ones coincide with those of TPPS4 bound with BSA (Figure 9). The fluorescence intensity and lifetime increase (Figure 9, inset), which is also characteristic for TPPS4 binding with BSA. This could mean that addition of BSA destructs the TPPS4…CdTe-3-MPA complex in favor of the TPPS4 complex with BSA. At the same time, the calculation of the TPPS4 binding constant with BSA using the Equation (3) leads to K TPPS QD + BSApH 4 = ( 1.2 ± 0.2 ) × 10 10   M−1 (Figure 10). This value is ≈100 times larger than that for TPPS4 binding with BSA in the absence of CdTe-3-MPA QD. This demonstrates that the TPPS4 binding with QD increases the probability of its binding with BSA.
When QD is added into the TPPS4 + BSA solutions, no changes either in its optical absorption and fluorescence spectra or in the fluorescence lifetime occur, which demonstrates that the porphyrin binding with BSA blocks its binding with QD.

4. Conclusions

Depending on the porphyrin characteristics, principally its charge state, its interaction with bovine serum albumin (BSA) manifests in different forms.
In the case of meso-tetra methyl pyridyl porphyrin (TMPyP), which possesses charge 4+ and forms a charge transfer complex with CdTe-3-MPA quantum dots, albumin neither destructs this complex already formed nor reduces the probability of its formation.
For meso-tetrakis(p-sulfonato-phenyl) porphyrin (TPPS4), non-protonated at pH 7.0, which has a charge 4− and forms an energy transfer complex with CdTe-3-MPA quantum dots, BSA is able to form a mixed TPPS4…CdTe-3-MPA…BSA complex.
In the case of the biprotonated TPPS4 with charge 2− at pH 4.0, for which the complexation with CdTe-3-MPA includes both an energy transfer and a proton transfer, BSA destructs this complex in favor of the TPPS4…BSA one and prevents TPPS4 from complexation with QD. Moreover, surprisingly, TPPS4 complexation with QD increases the probability of its binding with BSA.
We consider this study as the first step in investigation of effects of albumins upon the porphyrin complexation with quantum dots. To clarify the mechanisms of these effects, more detailed studies are necessary with the help of various experimental techniques, besides the spectroscopic ones. However, since the main purpose of this study is to evaluate the perspective of application of porphyrin…quantum dot complexes in photochemotherapy, which is based on light exposure, the spectroscopic results presented in this paper can be important for application of porphyrin…quantum dot complexes in medicine for fluorescence diagnostics and photodynamic therapy.

Author Contributions

A.L.S.P.: realizing experiments, data analysis, discussions and text preparation; L.N.C.M.: compound synthesis, discussions, text evaluation; R.S.d.S.: discussions, text evaluation; I.E.B.: conceptualization, realizing experiments, data analysis, discussions and text preparation. All authors have read and agreed to the published version of the manuscript.

Funding

The authors are indebted to CNPq (Grant No. 405389/2018-3, 306243/2018-0, 304863/2017-3 and 405389/2018-3) and FAPESP (Grant No. 2016/12707-0, 2019/19448-8) Brazilian agencies for partial financial support. The pos-graduate student André L. S. Pavanelli receives his Doctorship support from Coordenação de Aperfeiçoamento de Pessoal de Nível Superior -Brasil (CAPES)-Finance Code 001.

Data Availability Statement

All original data related in this study are presented in the manuscript text and in cited articles.

Conflicts of Interest

The authors declare no conflict of interest.

References

  1. Xue, X.; Lindstrom, A.; Li, Y. Porphyrin-Based Nanomedicines for Cancer Treatment. Bioconj. Chem. 2019, 30, 1585–1603. [Google Scholar] [CrossRef]
  2. Gomes, A.T.P.C.; Neves, M.G.P.M.S.; Cavaleiro, J.A.S. Cancer, Photodynamic Therapy and Porphyrin-Type Derivatives. An. Acad. Bras. Ciênc. 2018, 90 (Suppl. 2). [Google Scholar] [CrossRef]
  3. Kou, J.; Dou, D.; Yang, L. Porphyrin photosensitizers in photodynamic therapy and its applications. Oncotarget. 2017, 8, 81591–81603. [Google Scholar] [CrossRef] [Green Version]
  4. Cui, L.; Chen, J.; Zheng, G. Chapter 7: Porphyrin Nanoparticles for Cancer Imaging and Phototherapy. In Handbook of Photodynamic Therapy, 1st ed.; World Scientific Publishing Company: Singapore, 2016; pp. 273–293. [Google Scholar] [CrossRef]
  5. Pushpan, S.K.; Venkatraman, S.; Anand, V.G.; Sankar, J.; Parmeswaran, D.; Ganesan, S.; Chandrashekar, T.K. Porphyrins in Photodynamic Therapy—A Search for Ideal Photosensitizers. Anti-Curr. Med. Chem.—Anti-Cancer Agents 2002, 2, 187–207. [Google Scholar] [CrossRef]
  6. Shi, J.; Liu, T.W.B.; Chen, J.; Green, D.; Jaffray, D.; Wilson, B.C.; Wang, F.; Zheng, G. Transforming a Targeted Porphyrin Theranostic Agent into a PET Imaging Probe for Cancer. Theranostics 2011, 1, 363–370. [Google Scholar] [CrossRef] [PubMed] [Green Version]
  7. Ricchelli, F.; Gobbo, S. Porphyrins as fluorescent probes for monitoring phase transitions of lipid domains in biological membranes. Factors influencing the microenvironment of haematoporphyrin and protoporphyrin in liposomes. J. Photochem. Photobiol. B Biol. 1995, 29, 65–70. [Google Scholar] [CrossRef]
  8. Liu, F.; Shen, Y.-C.; Chen, S.; Yan, G.-P.; Zhang, Q.; Guo, Q.-Z.; Gu, Y.-T. Tumor-Targeting Fluorescent Probe Based on Naphthalimide and Porphyrin Groups. Biol. Chem. Chem. Biol. 2020, 5, 7680–7684. [Google Scholar] [CrossRef]
  9. Burda, C.; Chen, X.; Narayanan, R.; El-Sayed, M.A. Chemistry and Properties of Nanocrystals of Different Shapes. Chem. Rev. 2005, 105, 1025–1102. [Google Scholar] [CrossRef] [PubMed]
  10. Buhbut, S.; Itzhakov, S.; Tauber, E.; Shalom, M.; Hod, I.; Geiger, T.; Garini, Y.; Oron, D.; Zaban, A. Built-in Quantum Dot Antennas in Dye-Sensitized Solar Cells. ACS Nano 2010, 4, 1293–1298. [Google Scholar] [CrossRef]
  11. Mokhlespour, S.; Haverkort, J.E.M.; Slepyan, G.Y.; Maksimenko, S.A.; Hoffmann, A. Quantum Dot Lattice as Nano-Antenna for Collective Spontaneous Emission. In Fundamental and Applied Nano-Electromagnetics; Maffucci, A., Maksimenko, S.A., Eds.; NATO Science for Peace and Security Series B: Physics and Biophysics; Springer: Dordrecht, The Netherlands, 2016. [Google Scholar] [CrossRef]
  12. Nabiev, I.; Rakovich, A.; Sukhanova, A.; Lukashev, E.; Zagidullin, V.; Pachenko, V.; Rakovich, Y.P.; Donegan, J.F.; Rubin, A.B.; Govorov, A.O. Fluorescent Quantum Dots as Artificial Antennas for Enhanced Light Harvesting and Energy Transfer to Photosynthetic Reaction Centers. Angew. Chem. Int. Ed. Engl. 2010, 49, 7217–7221. [Google Scholar] [CrossRef] [PubMed]
  13. Borissevitch, I.E.; Lukashev, E.P.; Oleinikov, I.P.; Pavanelli, A.L.S.; Gonçalves, P.J.; Knox, P.P. Electrostatic interactions and covalent binding effects on the energy transfer between quantum dots and reaction centers of purple bacteria. J. Lumin. 2019, 207, 129–136. [Google Scholar] [CrossRef]
  14. Zhang, Y. Surface Functionalization of Quantum Dots for Biotechnological Applications. Ph.D. Thesis, Iowa State University, Ames, IA, USA, April 2012. [Google Scholar]
  15. Karakoti, A.S.; Shukla, R.; Shanker, R.; Singh, S. Surface functionalization of quantum dots for biological applications. Adv. Colloid Interface Sci. 2015, 215, 28–45. [Google Scholar] [CrossRef]
  16. Chandan, R.H.; Schiffman, J.D.; Balakrishna, R.G. Quantum dots as fluorescent probes: Synthesis, surface chemistry, energy transfer mechanisms, and applications. Sens. Actuators B Chem. 2018, 258, 1191–1214. [Google Scholar] [CrossRef]
  17. Rizvi, S.B.; Ghaderi, S.; Keshtgar, M.; Seifalian, A.M. Semiconductor quantum dots as fluorescent probes for in vitro and in vivo bio-molecular and cellular imaging. Nano Rev. 2010, 1. [Google Scholar] [CrossRef] [PubMed]
  18. Frasco, M.F.; Chaniotakis, N. Bioconjugated quantum dots as fluorescent probes for bioanalytical applications. Anal. Bioanal Chem. 2010, 396, 229–240. [Google Scholar] [CrossRef]
  19. Samia, A.C.S.; Dayal, S.; Burda, C. Quantum Dot-based Energy Transfer: Perspectives and Potential for Applications in Photodynamic Therapy. Photochem. Photobiol. 2006, 82, 617–625. [Google Scholar] [CrossRef]
  20. Martynenko, I.V.; Kuznetsova, V.A.; Orlova, A.O.; Kanaev, P.A.; Maslov, V.G.; Loudon, A.; Zaharov, V.; Parfenov, P.; Gun’ko, Y.K.; Baranov, A.V. Chlorin e6–ZnSe/ZnS quantum dots based system as reagent for photodynamic therapy. Nanotechnology 2015, 26, 055102. [Google Scholar] [CrossRef] [PubMed]
  21. Dayal, S.; Krolicki, R.; Lou, Y.; Qiu, X.; Berlin, J.C.; Kenney, M.E.; Burda, C. Femtosecond time-resolved energy transfer from CdSe nanoparticles to phthalocyanines. Appl. Phys. B Lasers Opt. 2006, 84, 309–315. [Google Scholar] [CrossRef]
  22. Gromova, Y.A.; Orlova, A.O.; Maslov, V.G.; Fedorov, A.V.; Baranov, A.V. Fluorescence energy transfer in quantum dot/azo dye complexes in polymer track membranes. Nanoscale Res. Lett. 2013, 8, 452. [Google Scholar] [CrossRef] [PubMed] [Green Version]
  23. Białek, R.; Burdziński, G.; Gibasiewicz, K.; Worch, R.; Grzyb, J. Competition between Photoinduced Electron Transfer and Resonance Energy Transfer in an Example of Substituted Cytochrome c–Quantum Dot Systems. J. Phys. Chem. B 2021, 125, 3307–3320. [Google Scholar] [CrossRef]
  24. Jhonsi, A.M.; Renganathan, R. Investigations on the photoinduced interaction of water soluble thioglycolic acid (TGA) capped CdTe quantum dots with certain porphyrins. J. Colloid Interface Sci. 2010, 344, 596–602. [Google Scholar] [CrossRef]
  25. Zhang, X.; Liu, Z.; Ma, L.; Hossu, M.; Chen, W. Interaction of porphyrins with CdTe quantum dots. Nanotechnology 2011, 22, 195501–195510. [Google Scholar] [CrossRef] [PubMed]
  26. Borissevitch, I.E.; Parra, G.; Zagidullin, V.; Lukashev, E.; Knox, P.; Pashenko, V.; Rubin, A. Cooperative effects in CdSe/ZnS-PEGOH quantum dot luminescence quenching by a water soluble porphyrin. J. Lumin. 2013, 134, 83–87. [Google Scholar] [CrossRef]
  27. Parra, G.G.; Ferreira, L.P.; Gonçalves, P.J.; Sizova, S.V.; Oleinikov, V.A.; Morozov, V.N.; Kuzmin, V.A.; Borissevitch, I.E. Stimulation of Cysteine-Coated CdSe/ZnS Quantum Dot Luminescence by meso-Tetrakis (p-sulfonato-phenyl) Porphyrin. Nanoscale Res. Lett. 2018, 13. [Google Scholar] [CrossRef]
  28. Parra, G.G.; Pavanelli, A.L.S.; Franco, L.P.; Máximo, L.N.C.; da Silva, R.S.; Borissevitch, I. Interaction of CdTe-MPA quantum dots with meso-tetra methyl pyridyl porphyrin. Charge transfer complex formation. J. Photochem. Photobiol. A Chem. 2020, 398, 112580. [Google Scholar] [CrossRef]
  29. Pavanelli, A.L.S.; Máximo, L.N.C.; da Silva, R.S.; Borissevitch, I. Interaction between TPPS4 porphyrin and CdTe-3-MPA quantum dot: Proton and energy transfer. J. Lumin. 2021, 237, 118213. [Google Scholar] [CrossRef]
  30. Peters, T., Jr. All about Albumin. In Biochemistry, Genetics, and Medical Applications; Academic Press: Cambridge, MA, USA, 1996; ISBN 9780080527048. [Google Scholar]
  31. Kratz, F.; Beyer, U. Serum proteins as drug carriers of anticancer agents, a review. Drug Deliv. 1998, 5, 281–299. [Google Scholar] [CrossRef]
  32. Dennis, M.S.; Jin, H.; Dugger, D.; Yang, R.; McFarland, L.; Ogasawara, A.; Williams, S.; Cole, M.J.; Ross, S.; Schwall, R. Imaging Tumors with an Albumin-Binding Fab, a Novel Tumor-Targeting Agent. Cancer Res. 2007, 67, 254–261. [Google Scholar] [CrossRef] [Green Version]
  33. Franco, L.P.; Cicillini, S.; Biazzotto, J.; Schiavon, M.; Mikhailovsky, A.; Burks, P.; Garcia, J.; Ford, P.; Silva, R. Photoreactivity of a quantum dot-ruthenium nitrosyl conjugate. J. Phys. Chem. A 2014, 118, 12184–12191. [Google Scholar] [CrossRef] [Green Version]
  34. Yu, W.W.; Qu, L.; Guo, W.; Peng, X. Experimental Determination of the Extinction Coefficient of CdTe, CdSe, and CdS Nanocrystals. Chem. Mater. 2003, 15, 2854–2860. [Google Scholar] [CrossRef]
  35. Tabak, M.; Borisevitch, I.E. Interaction of dipyridamole with micelles of lysophosphatidylcholine and with bovine serum albumin: Fluorescence studies. BBA—Gen. Sub. 1992, 1116, 241–249. [Google Scholar] [CrossRef]
  36. Patty, F.A. (Ed.) Industrial Hygiene and Toxicology, 2nd ed.; John Wiley & Sons, Inc.: New York, NY, USA, 1963; Volume II. [Google Scholar] [CrossRef]
  37. Borissevitch, I.E.; Tominaga, T.T.; Imasato, H.; Tabak, M. Fluorescence and optical absorption study of interaction of two water soluble porphyrins with bovine serum albumin. The role of albumin and porphyrin aggregation. J. Lumin. 1996, 69, 65–76. [Google Scholar] [CrossRef]
  38. Aggarwal, L.P.F.; Borissevitch, I.E. On the dynamics of the TPPS4 aggregation in aqueous solutions: Successive formation of H and J aggregates. Spectrochim. Acta A Mol. Biomol. Spectrosc. 2006, 63, 227–233. [Google Scholar] [CrossRef] [PubMed]
  39. Gonçalves, P.J.; De Boni, L.; Barbosa Neto, N.M.; Rodrigues, J.J.; Zílio, S.C.; Borissevitch, I.E. Effect of protonation on the photophysical properties of meso-tetra(sulfonatophenyl) porphyrin. Chem. Phys. Lett. 2005, 407, 236–241. [Google Scholar] [CrossRef]
Figure 1. Chemical structures of TMPyP (left) and TPPS4 (right).
Nanomaterials 11 01674 g001
Figure 2. CdTe-3-MPA QD (A) absorption spectrum, normalized by absorbance at 350 nm, (B) QD luminescence spectrum (λex = 490 nm) for different BSA concentrations, (inset: the integral QD luminescence intensity in function of the BSA concentration) and (C) QD luminescence decay curves (λex = 490 nm, λem = 580 nm) for [BSA] = 0 and [BSA] = 15 μM (inset: the contribution of the long-lived luminescence decay component R2 in function of the BSA concentration).
Nanomaterials 11 01674 g002
Figure 3. Normalized optical absorption (solid lines) and fluorescence (points) spectra (λex = 455 nm) of the CdTe-3MPA…TMPyP complex in the presence of 0 and 30 μM BSA (inset: the complex fluorescence decay curves, λex = 455 nm, λem = 650 nm).
Nanomaterials 11 01674 g003
Figure 4. Absorption (A) and fluorescence (B) spectra (λex = 445 nm) of 5 μM TMPyP solution in the presence of 30 μM BSA at different CdTe-3MPA QD concentrations. (The fluorescence spectra were recalculated subtracting the respective QD emission from the experimental ones).
Nanomaterials 11 01674 g004
Figure 5. Normalized optical absorption (a) and fluorescence spectra (λex = 420 nm) (b) of 1.6 µM TPPS4 in the bi-protonated (pH 4.0) and non-protonated (pH 7.0) states [39].
Nanomaterials 11 01674 g005
Figure 6. Optical absorption (A) and fluorescence (λex = 417 nm) (B) spectra of 1.6 µM TPPS4 water solution at pH 7.0 in the absence and presence of 3 µM BSA [37].
Nanomaterials 11 01674 g006
Figure 7. 1.6 µM TPPS4 optical absorption (A) and fluorescence spectra (λex = 420 nm) (B) in the presence of 400 nM CdTe-MPA QD at different BSA concentrations (pH 7.0), (inset: the fitting of the fluorescence integral intensity in accordance with the Equation (7)).
Nanomaterials 11 01674 g007
Figure 8. Optical absorption (a) and fluorescence (b) (λex = 420 nm) spectra of the 1.6 μM TPPS4 solution at pH 4.0 in the absence and in the presence of 380 nM CdTe-3-MPA QD [29].
Nanomaterials 11 01674 g008
Figure 9. TPPS4 optical absorption (A) and fluorescence (B) spectra (λex = 417 nm) at pH 4.0 in the presence of 380 nM CdTe-3-MPA QD for different BSA concentrations (Inset: the fluorescence decay curves in the absence and presence of 15 μM BSA, λex = 420 nm, λem = 650 nm).
Nanomaterials 11 01674 g009
Figure 10. Fitting in accordance with the Equation (3) of the TPPS4 fluorescence intensity in the presence of 380 nM CdTe-3-MPAQD in function of BSA concentration at pH 4.0.
Nanomaterials 11 01674 g010
Table 1. Lifetimes of the short-lived (τ1) and long-lived (τ2) components of CdTe-3-MPA QD luminescence decay curves and their relative amplitudes (I1, I2) for different BSA concentrations.
[BSA], μMτ1, nsI1τ2, nsI2
00.913 ± 0.0040.196 ± 0.00220.5 ± 0.020.804 ± 0.008
20.867 ± 0.0040.169 ± 0.00221.4 ± 0.020.831 ± 0.008
40.920 ± 0.0030.176 ± 0.00219.6 ± 0.010.824 ± 0.008
60.903 ± 0.0040.156 ± 0.00218.9 ± 0.030.844 ± 0.008
80.867 ± 0.0050.160 ± 0.00218.0 ± 0.030.841 ± 0.008
100.888 ± 0.0050.148 ± 0.00221.5 ± 0.040.852 ± 0.008
150.922 ± 0.0030.157 ± 0.00220.4 ± 0.030.843 ± 0.008
Publisher’s Note: MDPI stays neutral with regard to jurisdictional claims in published maps and institutional affiliations.

