
Carrier Fibers for the Safe Dosage of Nanoparticles in Nanocomposites: Nanomechanical and Thermomechanical Study on Polycarbonate/Boehmite Electrospun Fibers Embedded in Epoxy Resin

 and
and
Abstract

1. Introduction
2. Materials and Methods
2.1. Electrospinning
2.2. Energy Dispersive X-ray Spectroscopy (EDX)
2.3. Atomic Force Microscopy (AFM)
2.4. Transmission Scanning Electron Microscopy (TSEM)
2.5. Thermogravimetric Analysis (TGA)
2.6. Confocal Raman Spectroscopy
2.7. Dynamic Thermomechanical Analysis
3. Results and Discussion
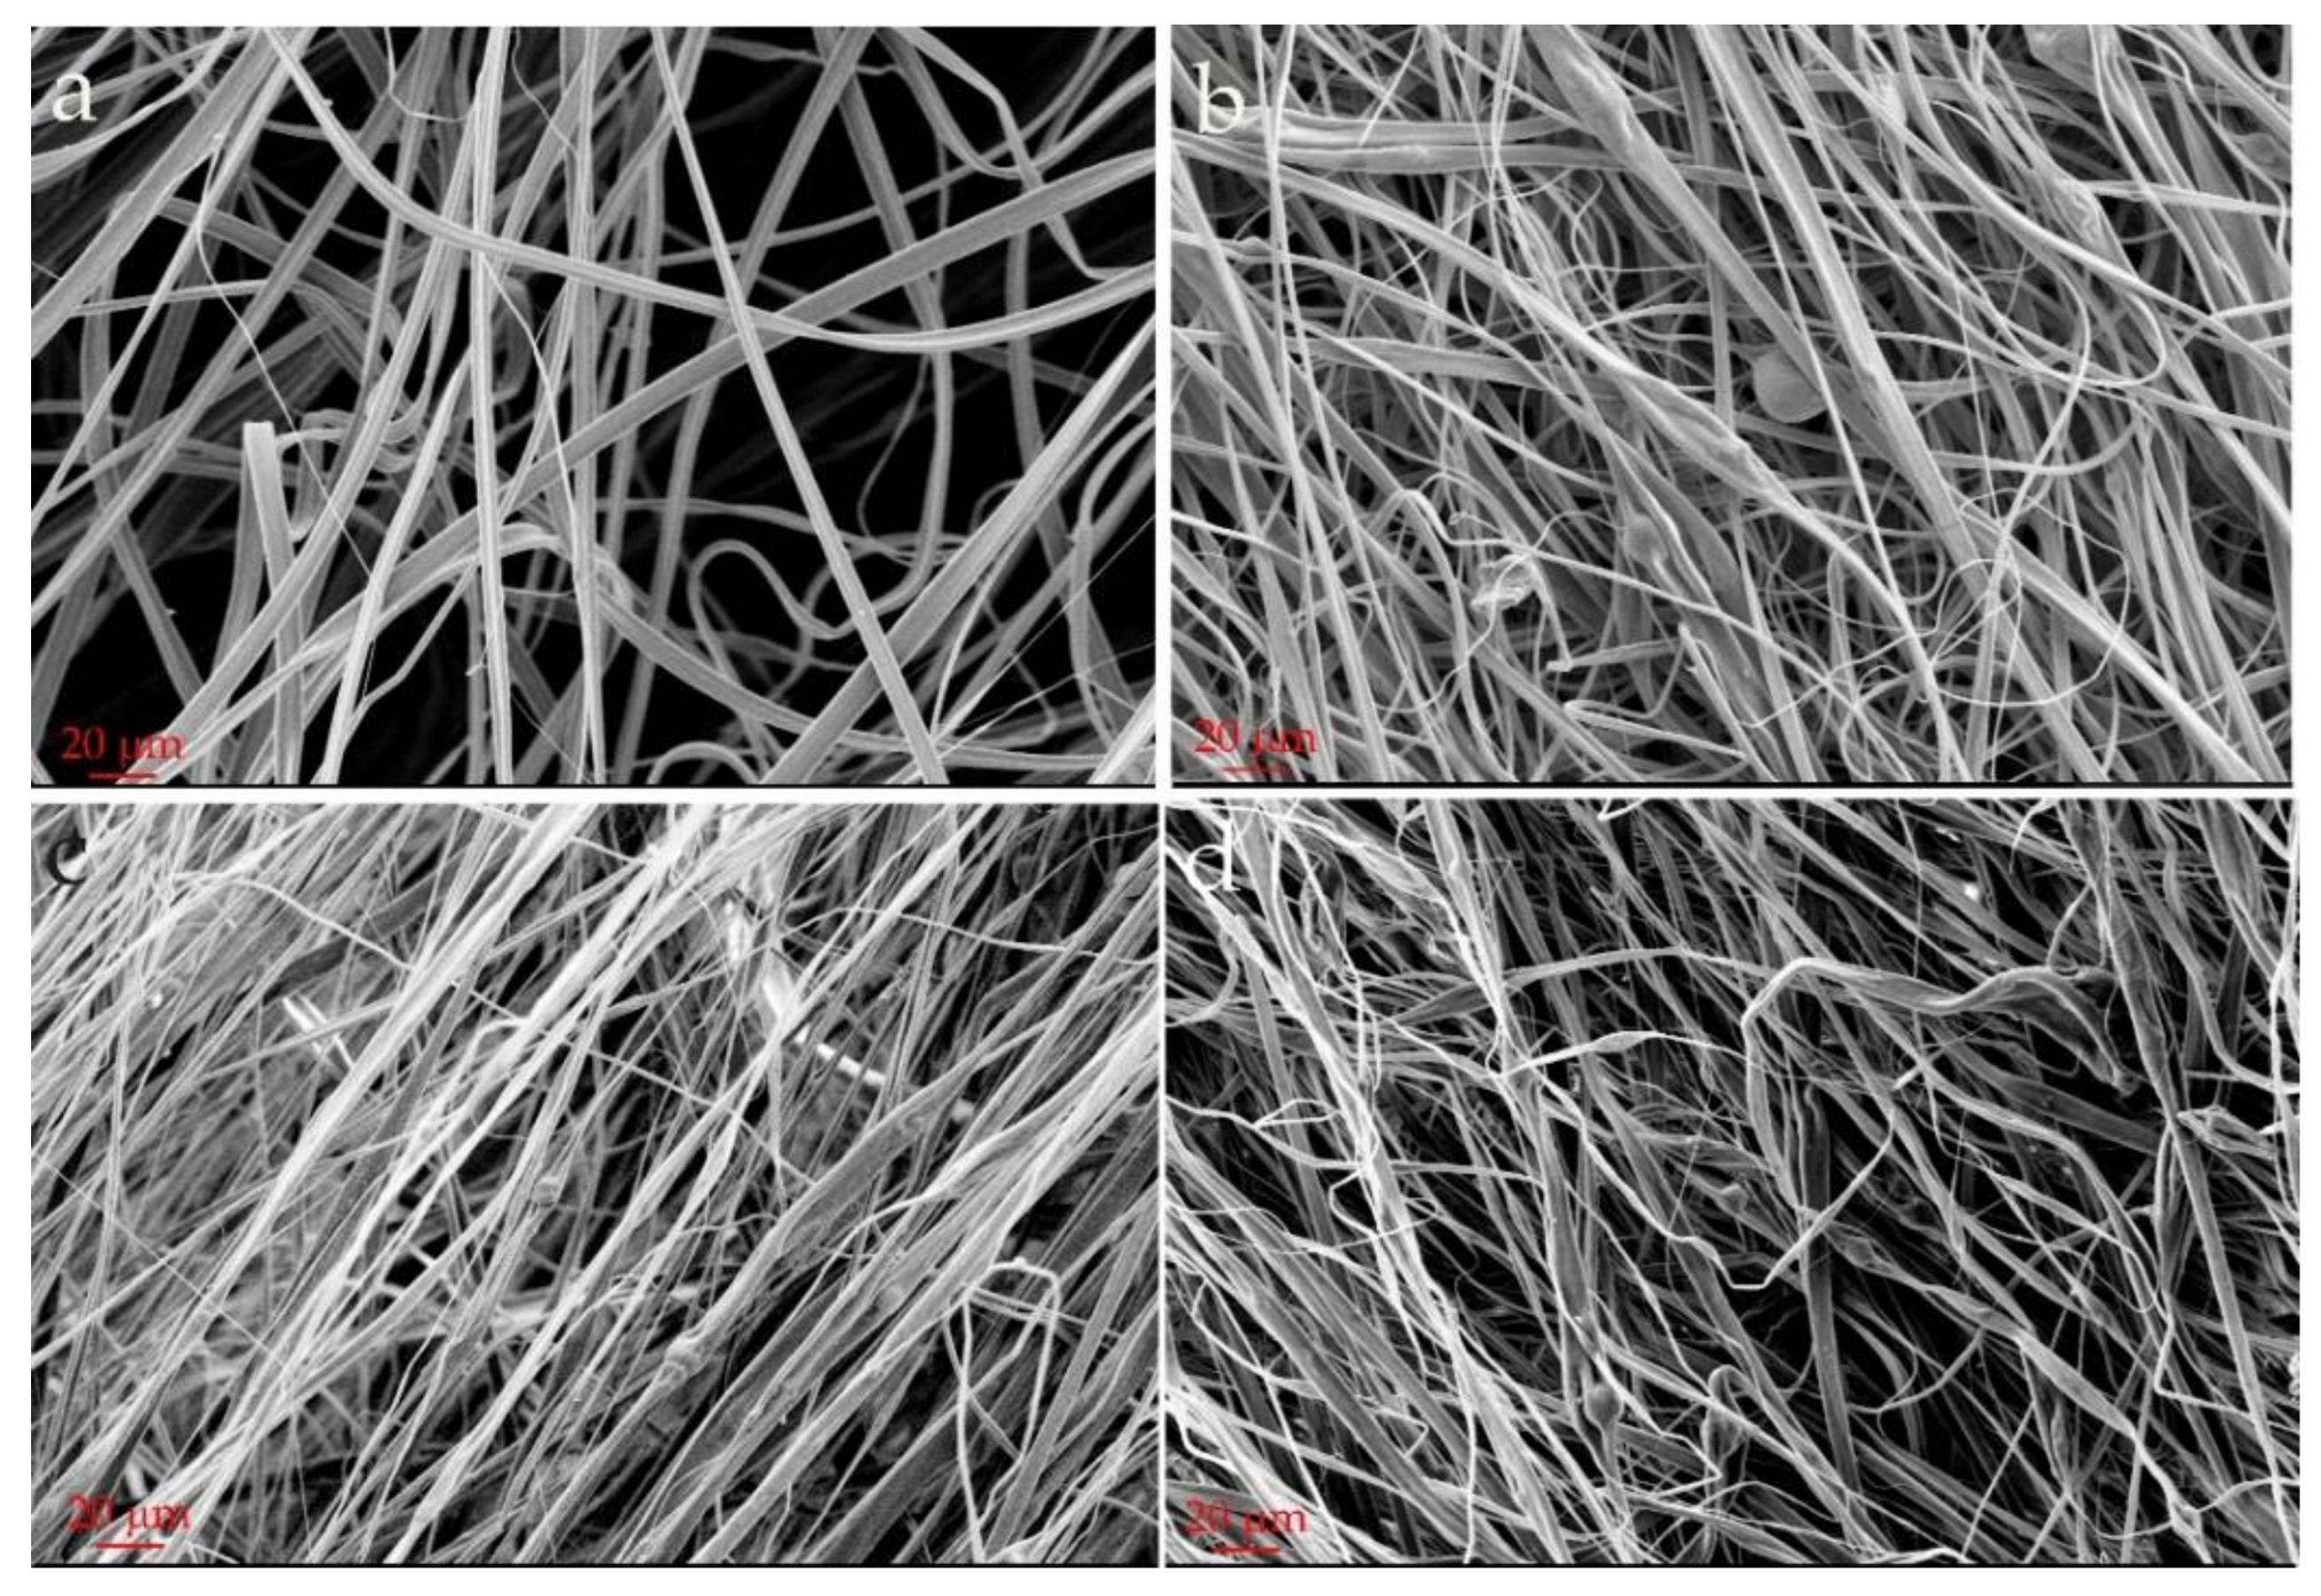
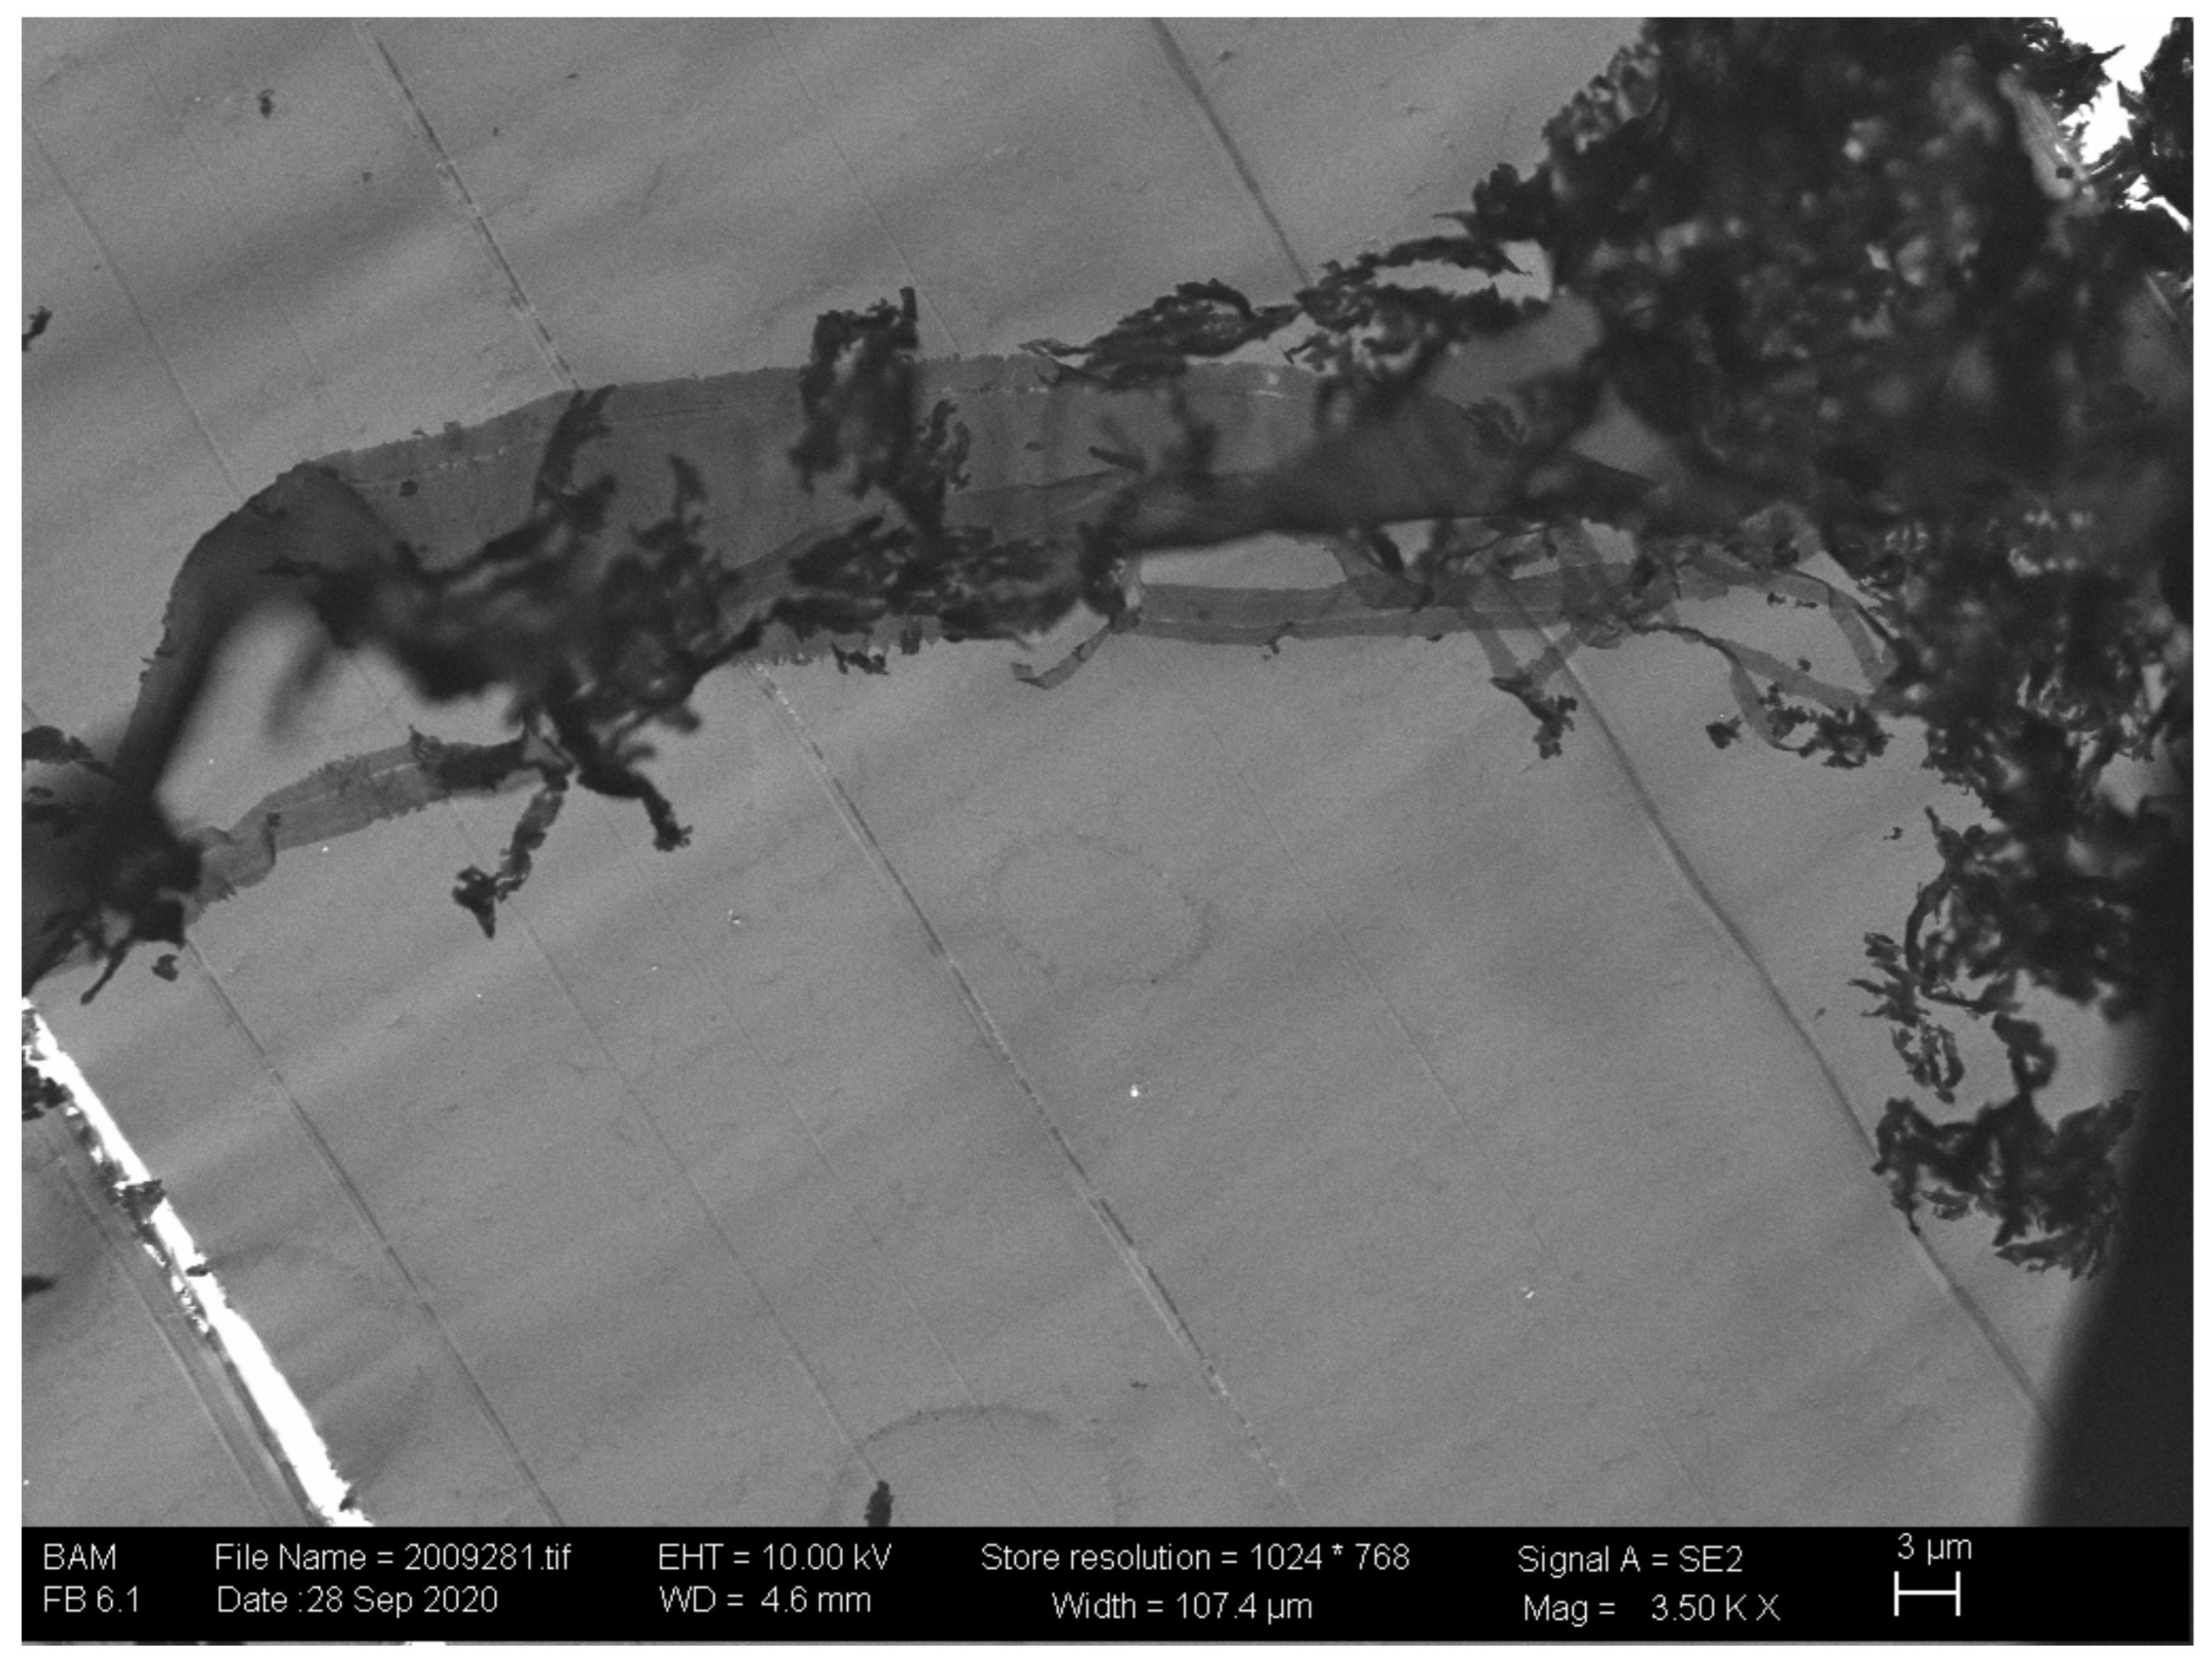
3.1. Polycarbonate-Boehmite Electrospun Fibers Morphology
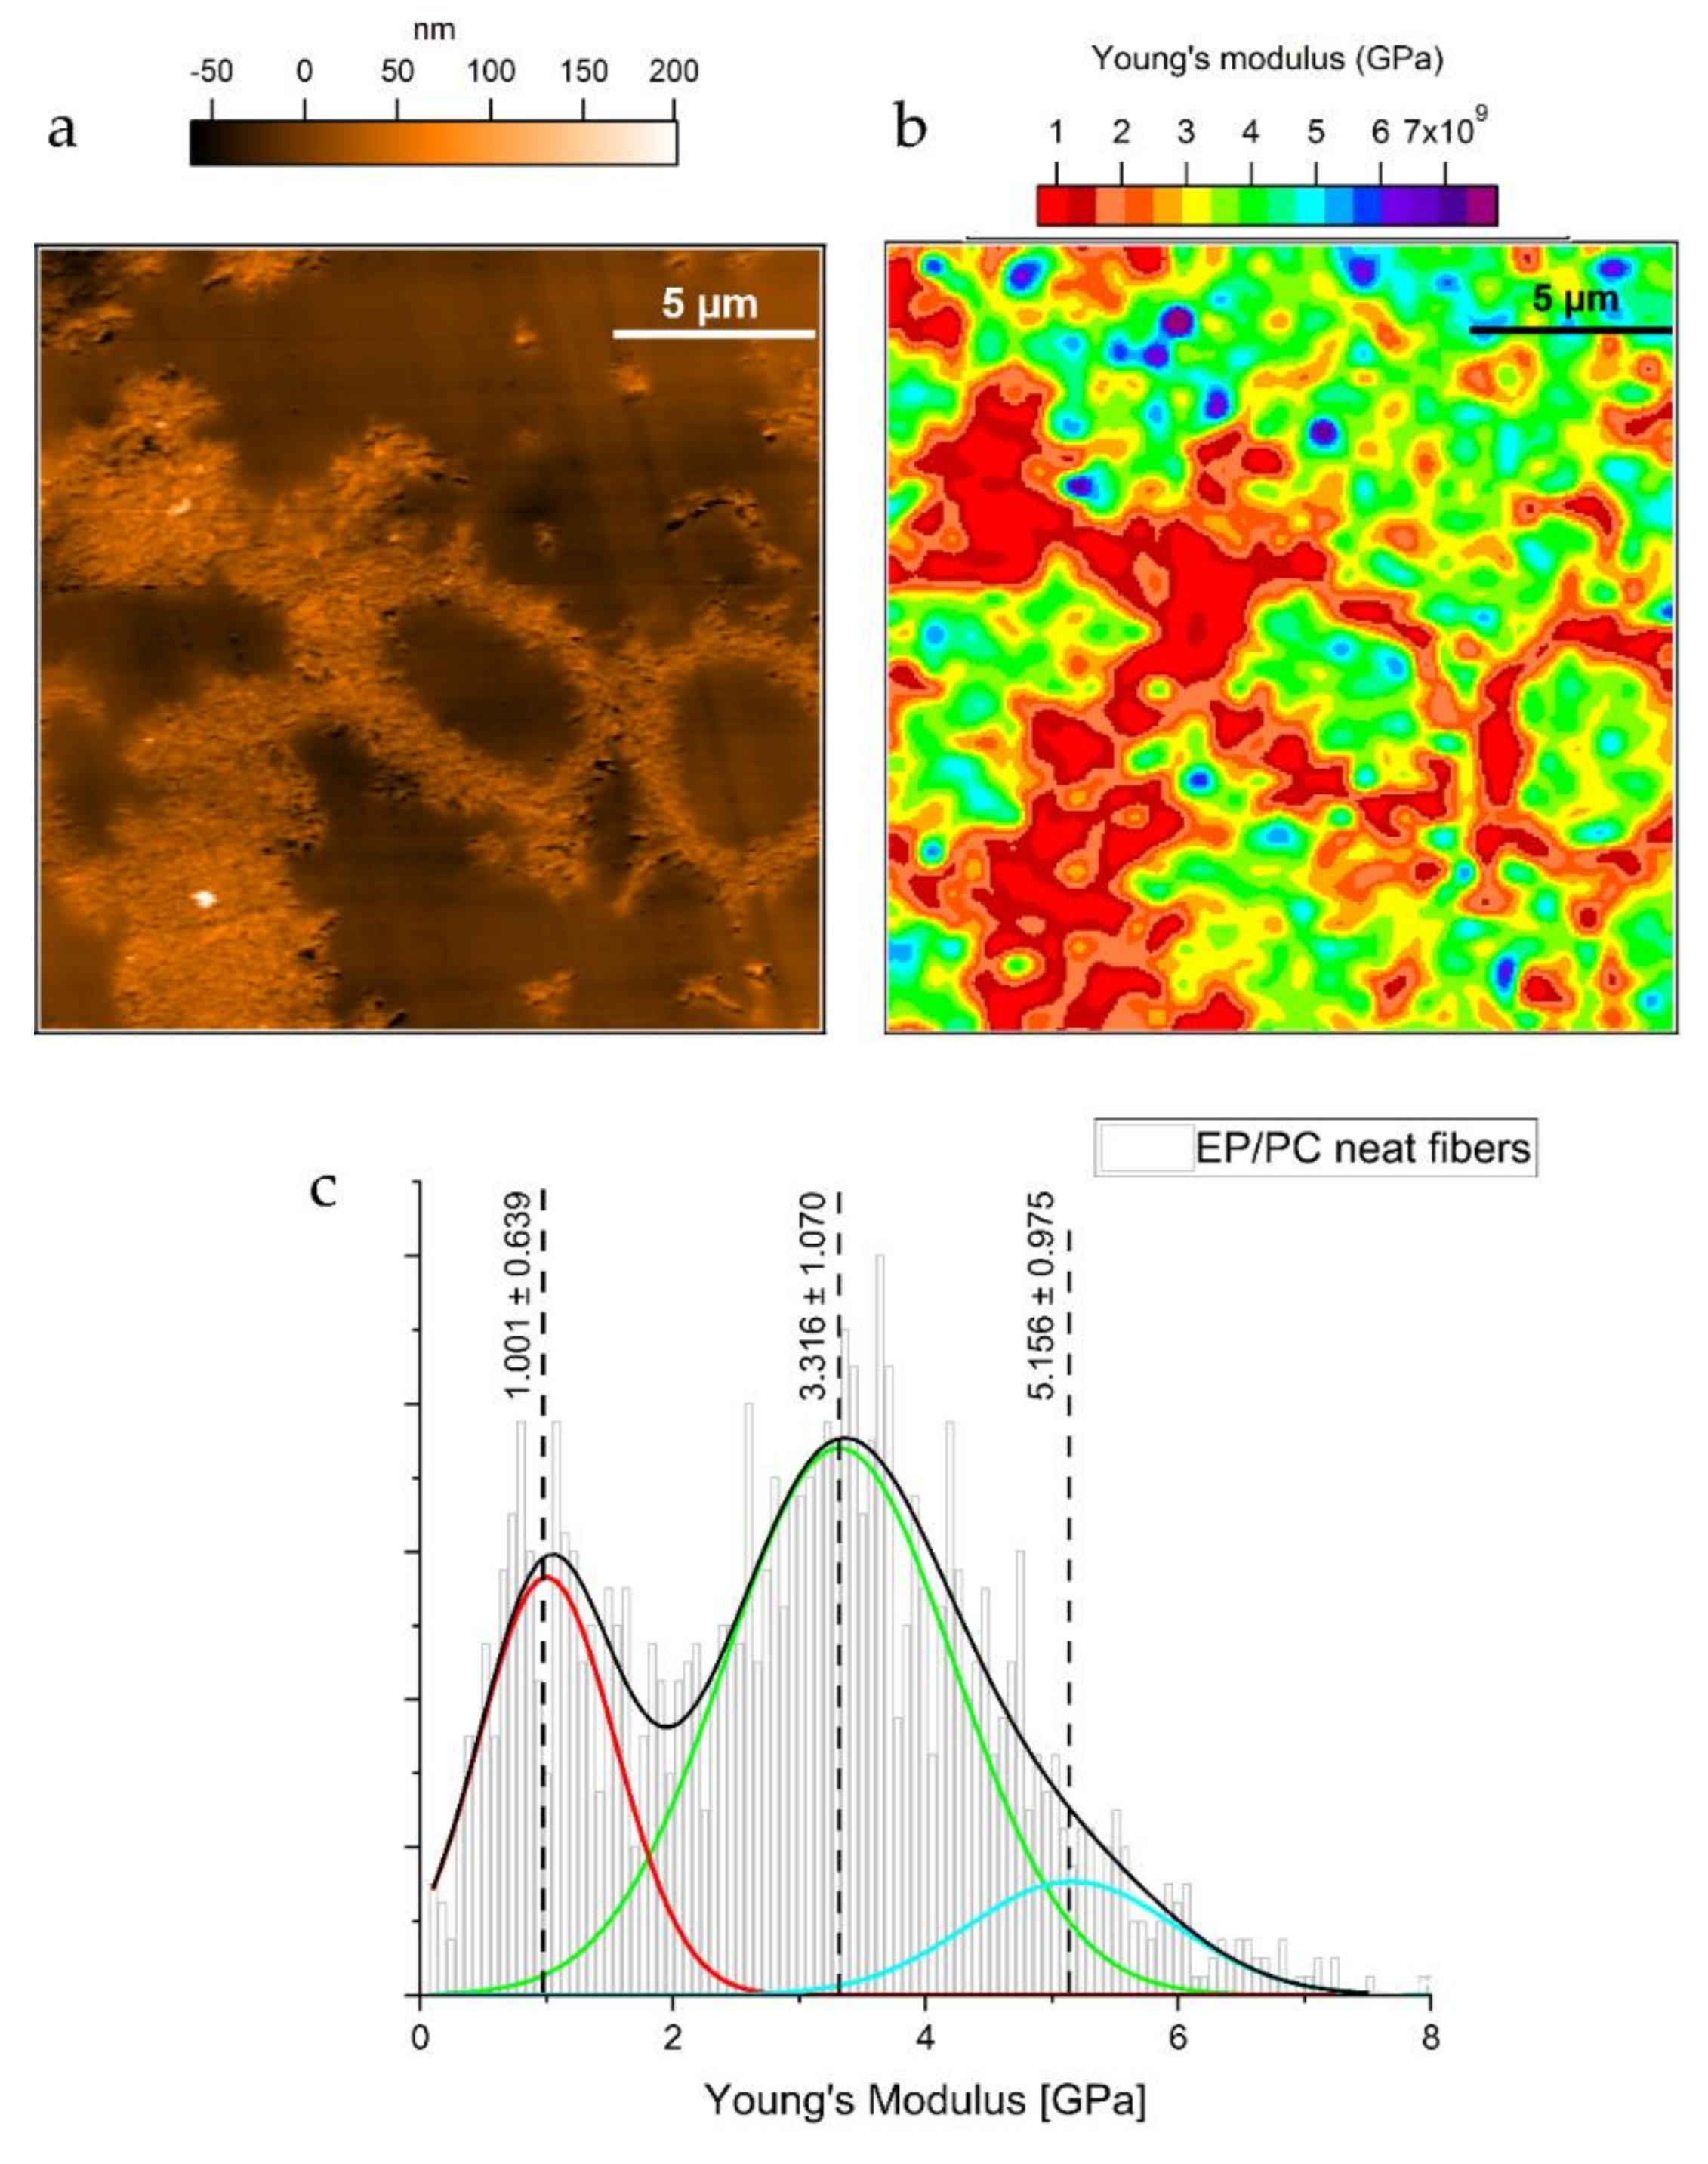
3.2. Epoxy/Neat Polycarbonate Fiber Morphology and Nanomechanical Response
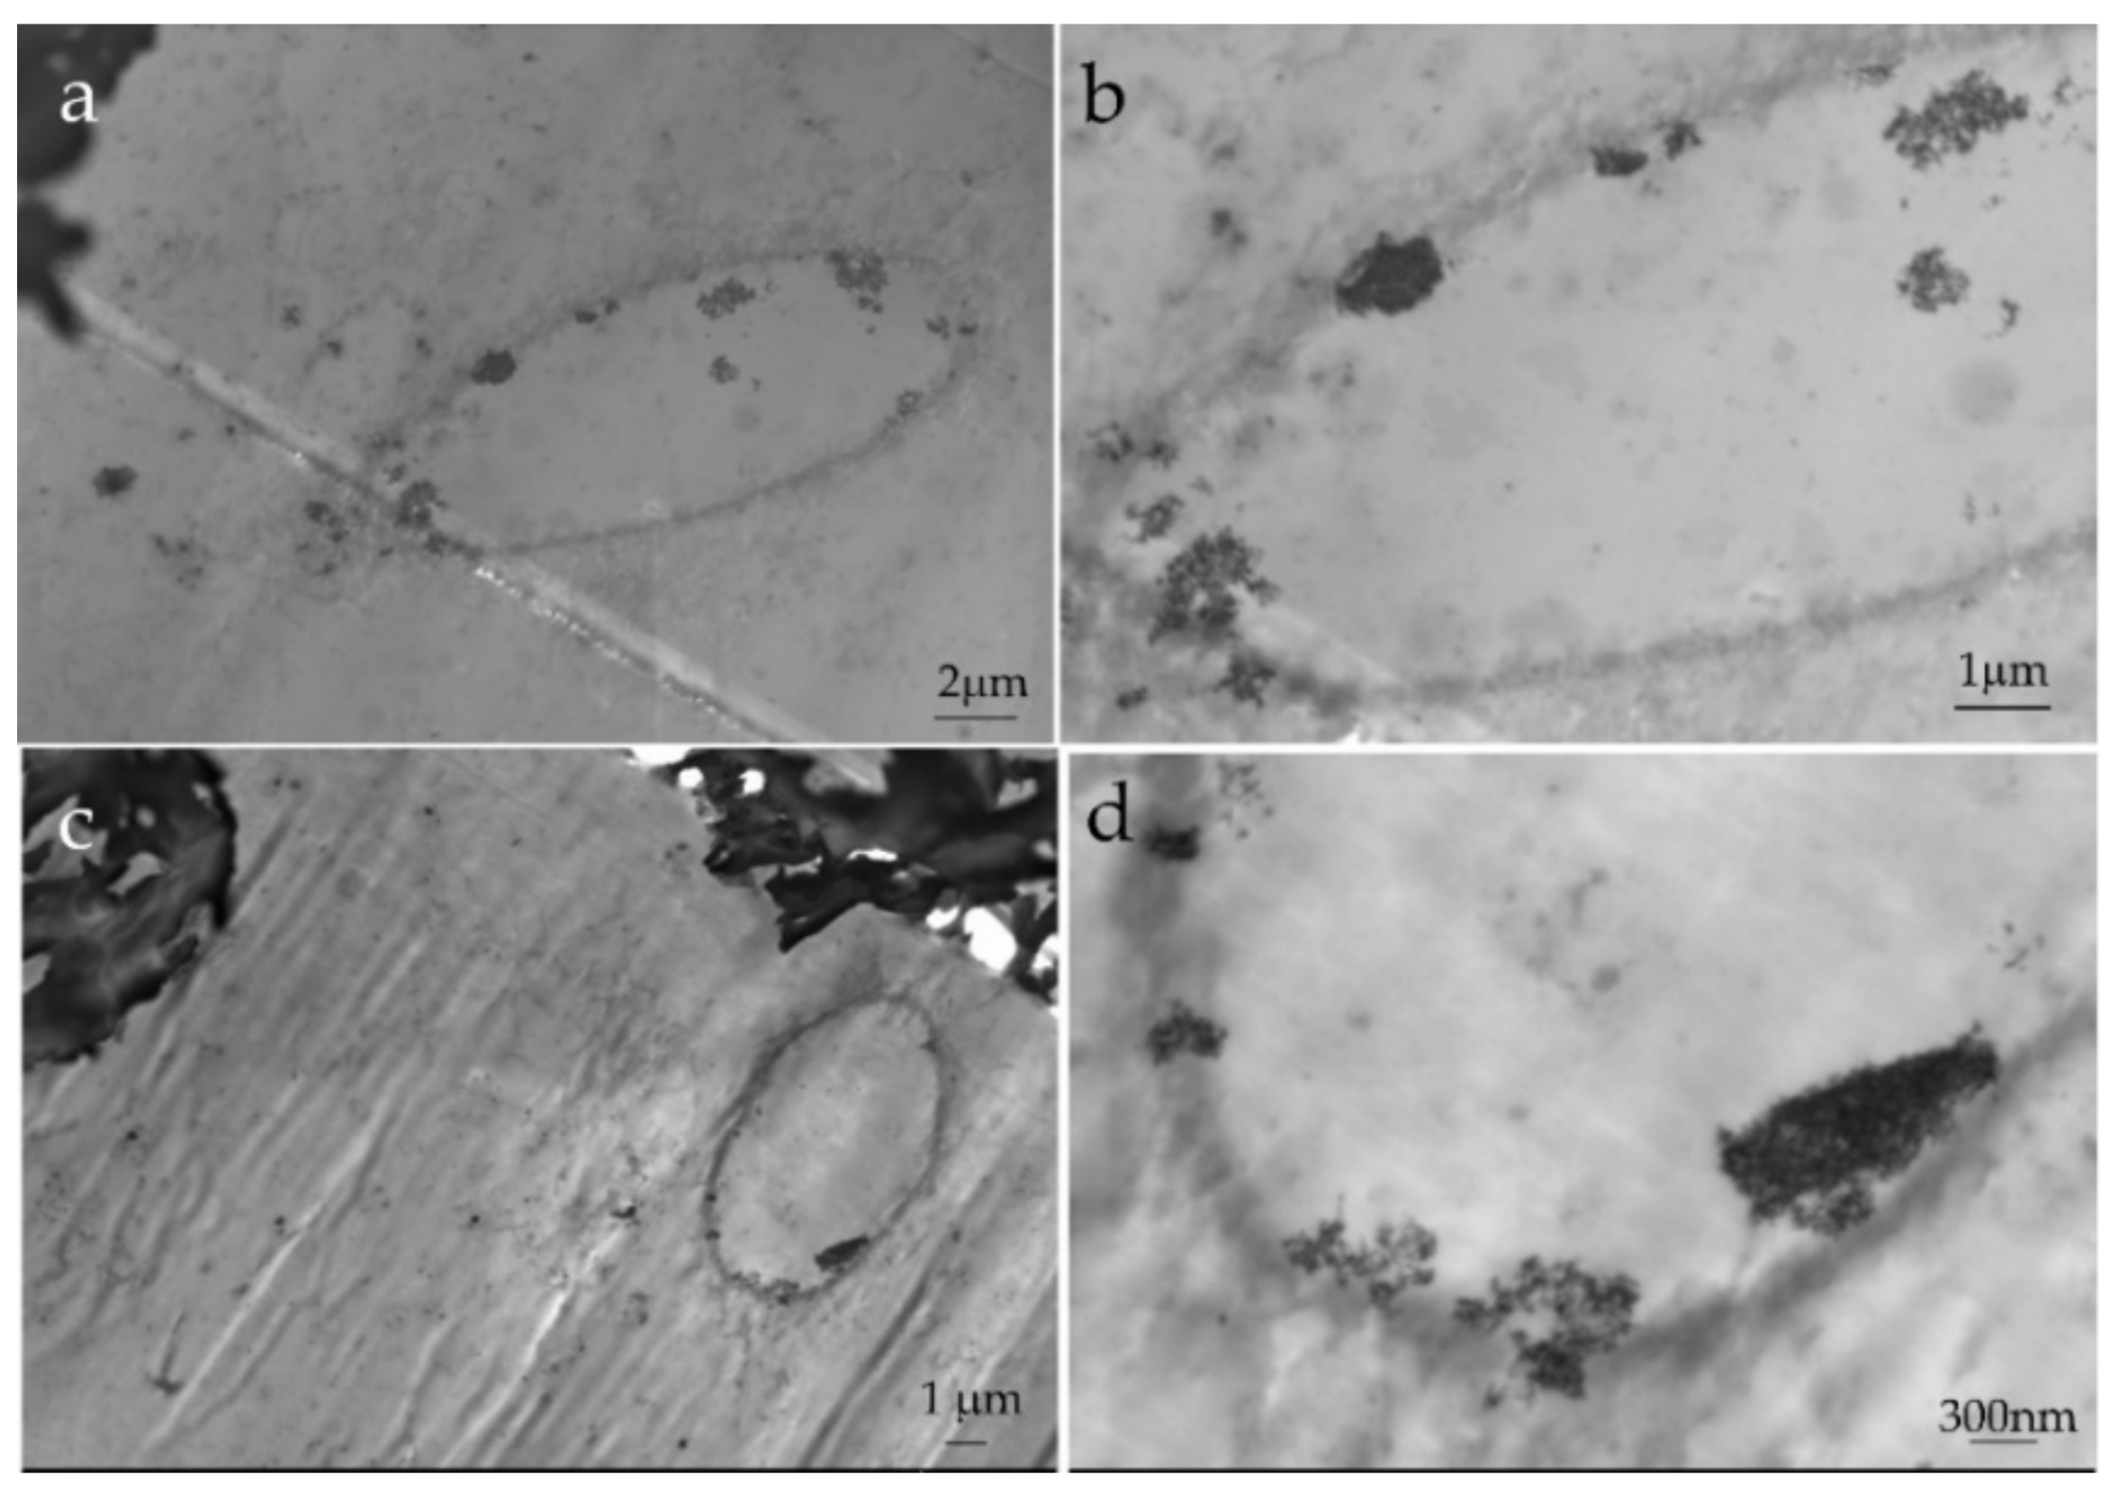
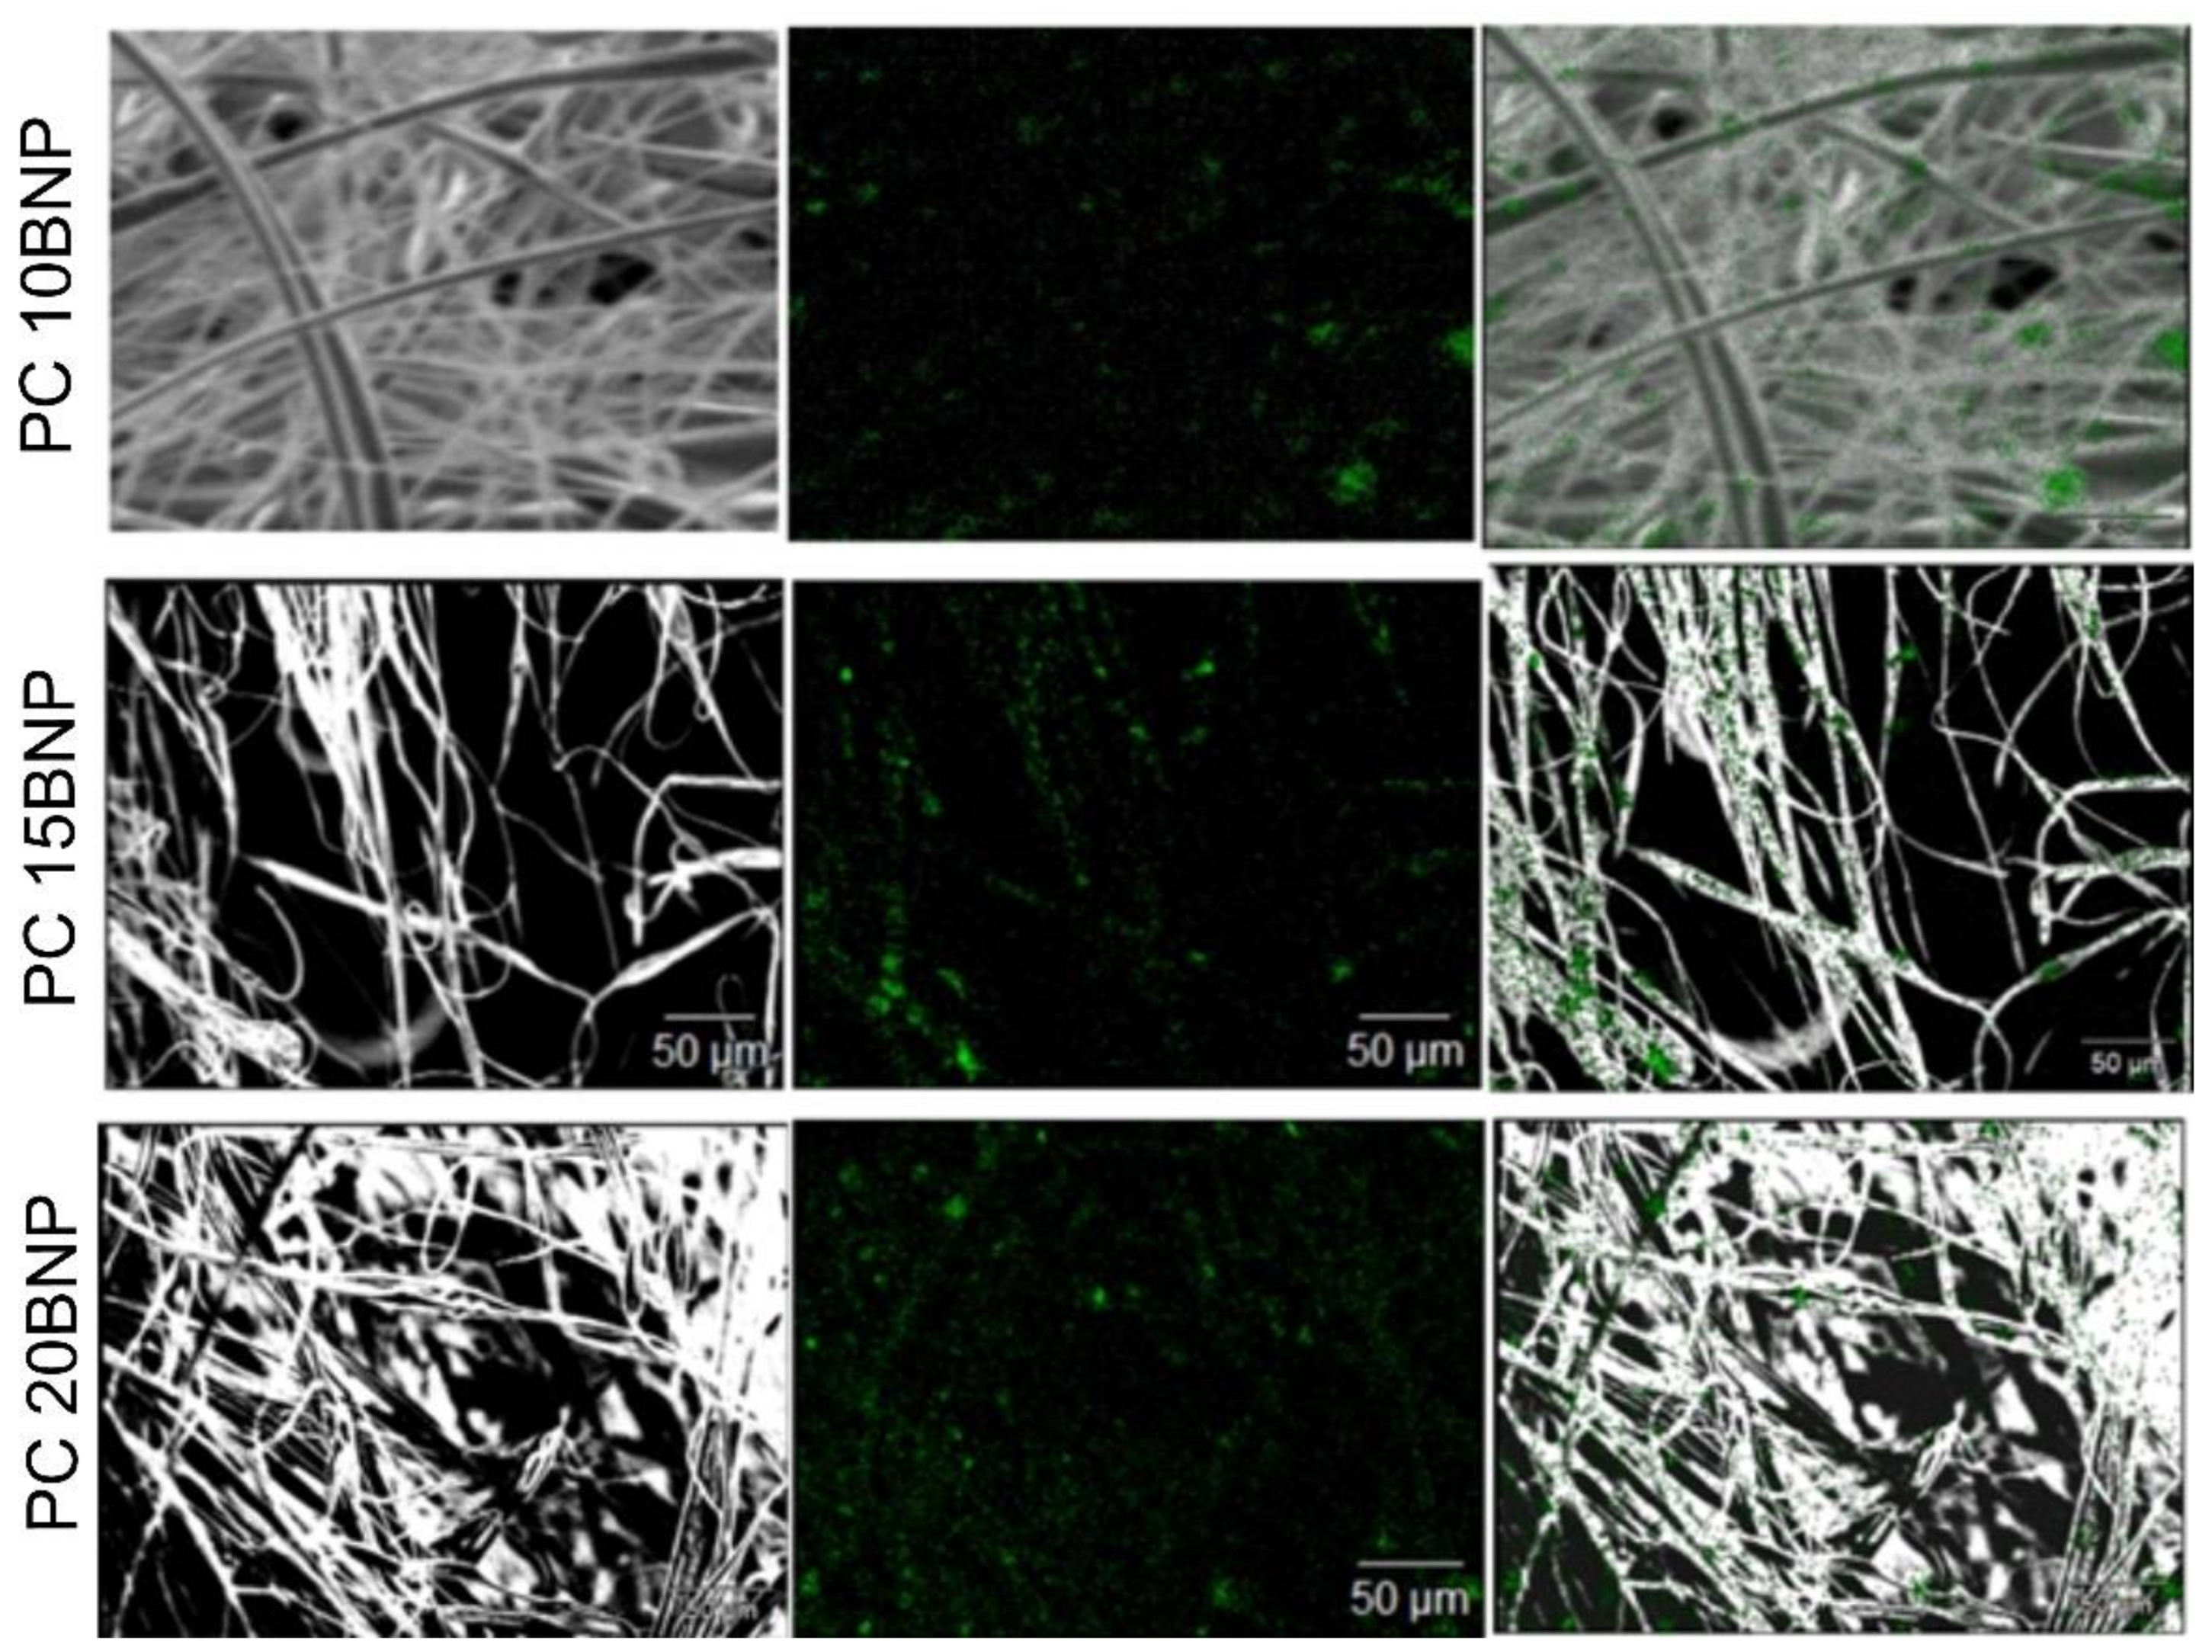
3.3. Epoxy/Polycarbonate/BNP Fiber Morphology and Nanomechanical Response
3.4. Dynamic Mechanical Thermal Analysis (DMA) of the Composites
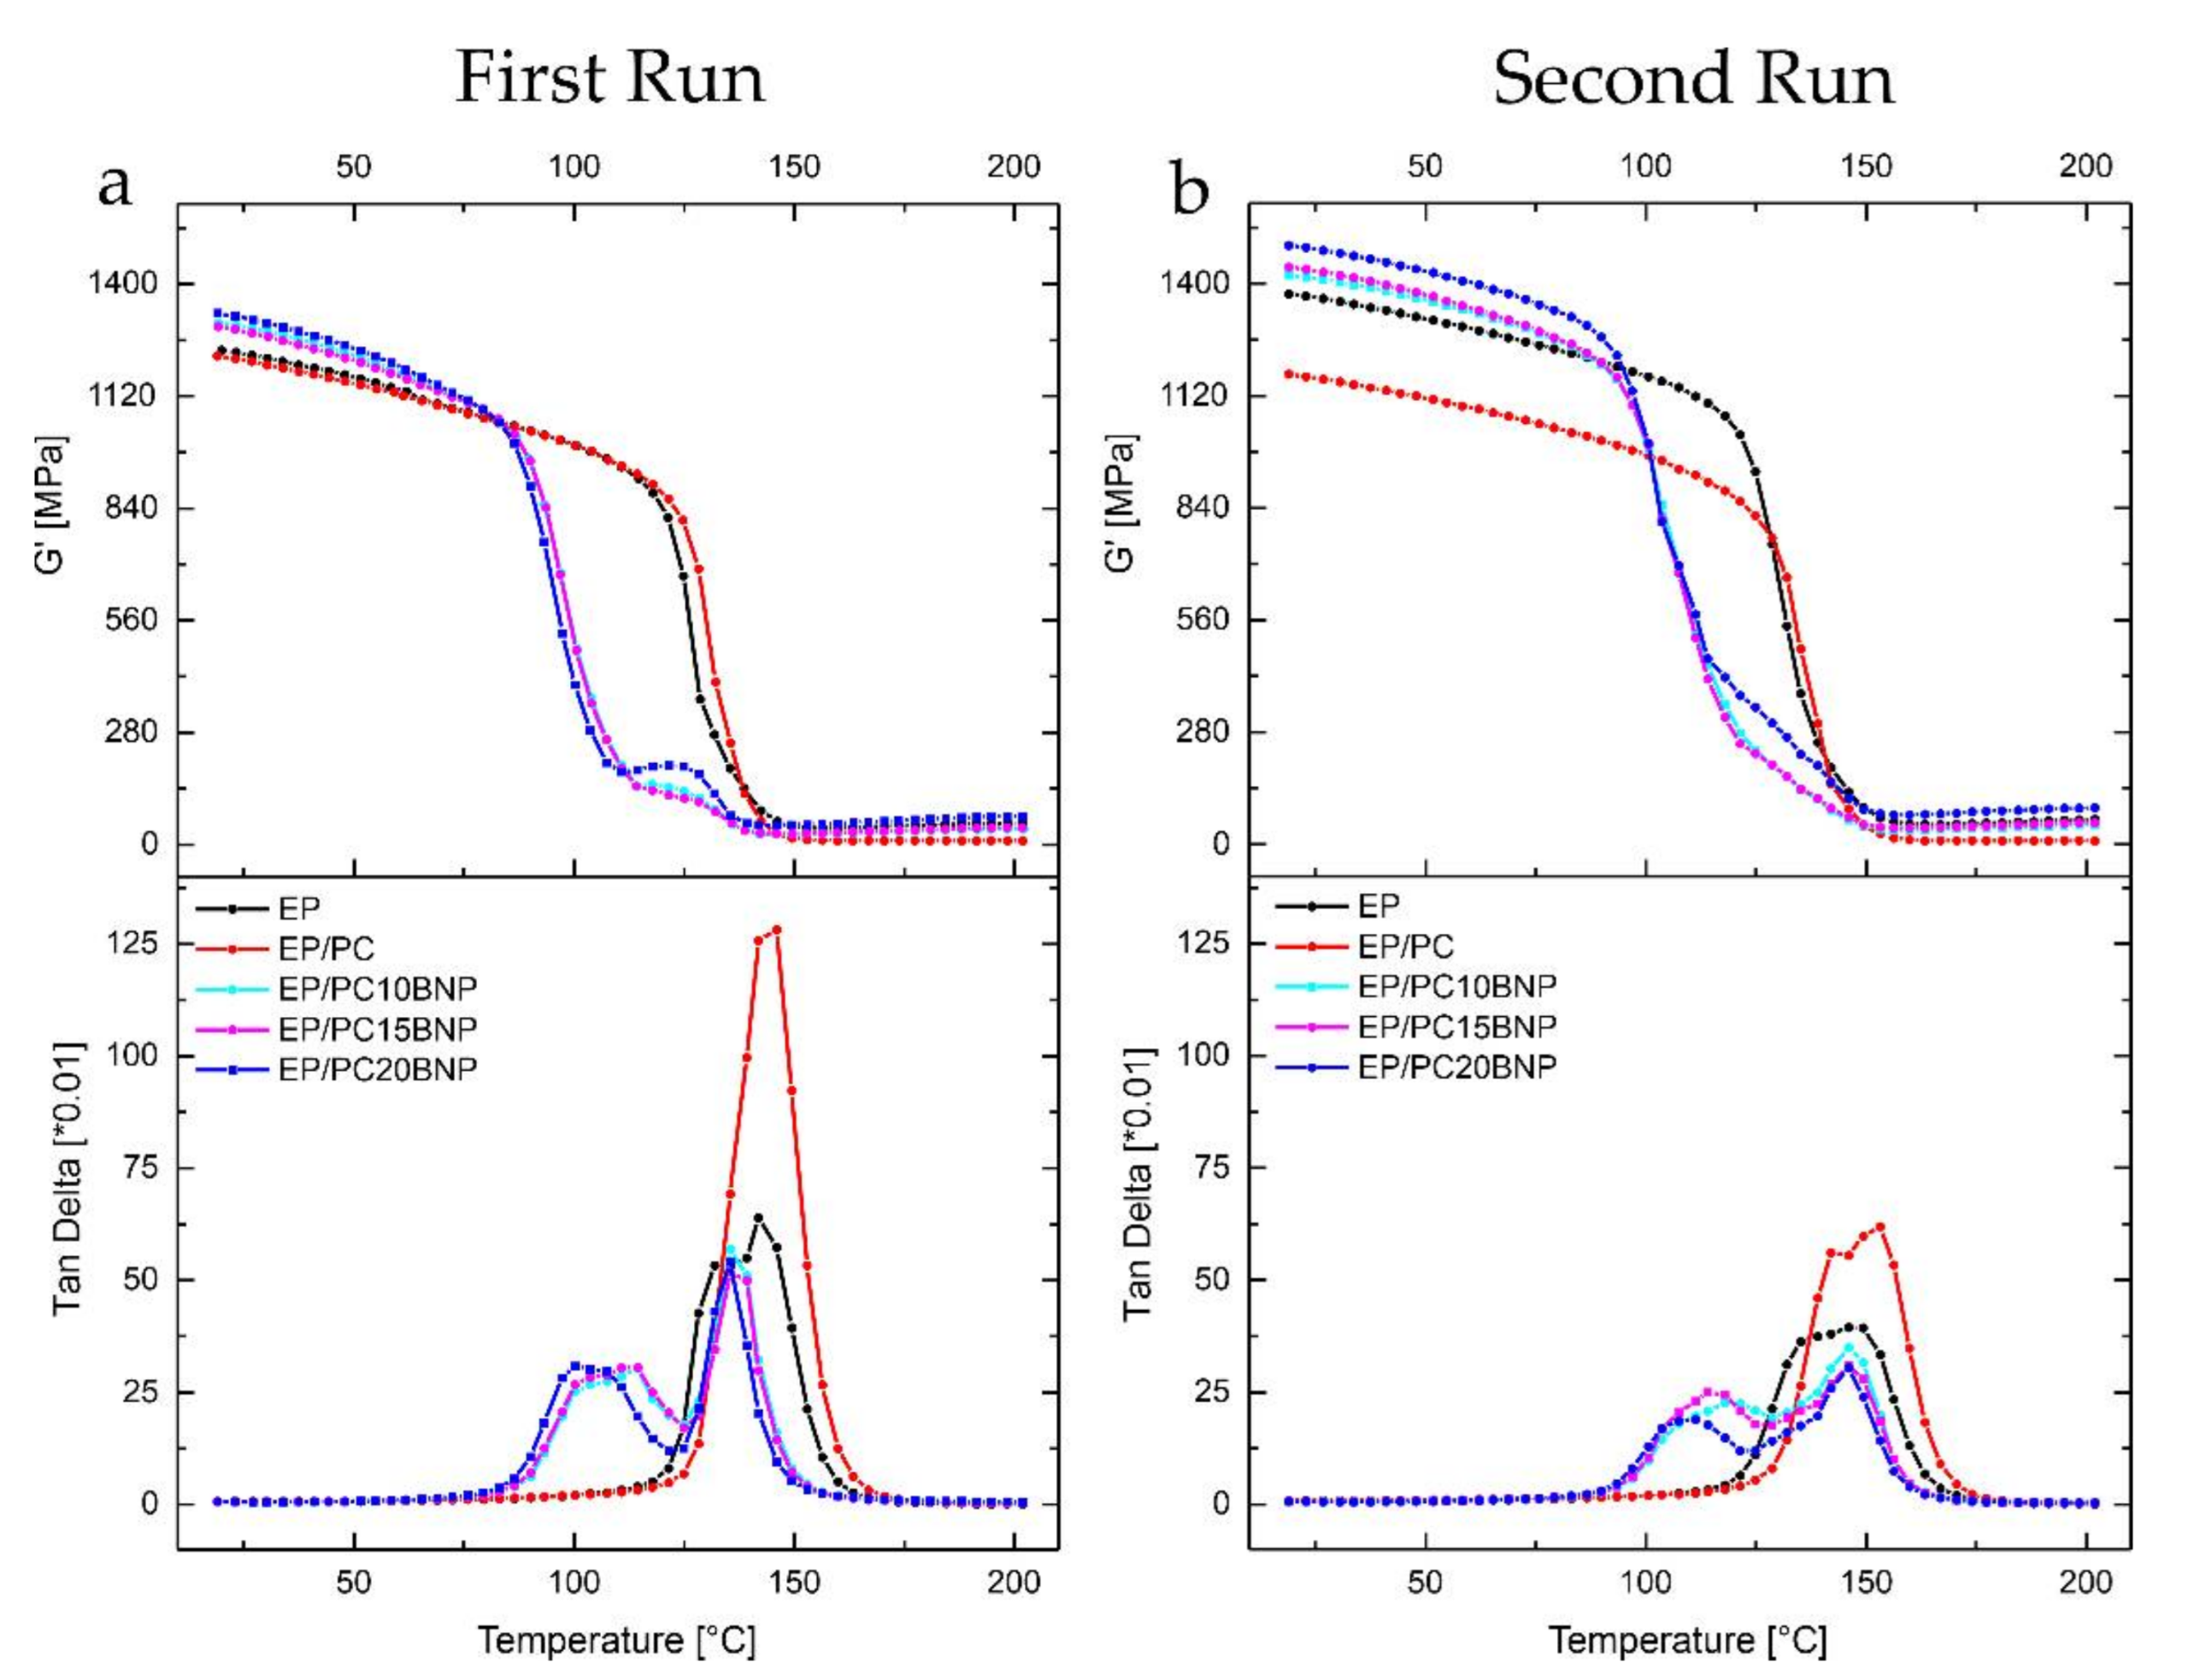
3.4.1. Storage Modulus G′
3.4.2. Tan δ Analysis
4. Conclusions
Author Contributions
Funding
Data Availability Statement
Acknowledgments
Conflicts of Interest
Appendix A

Appendix B

Appendix C

Appendix D


Appendix E


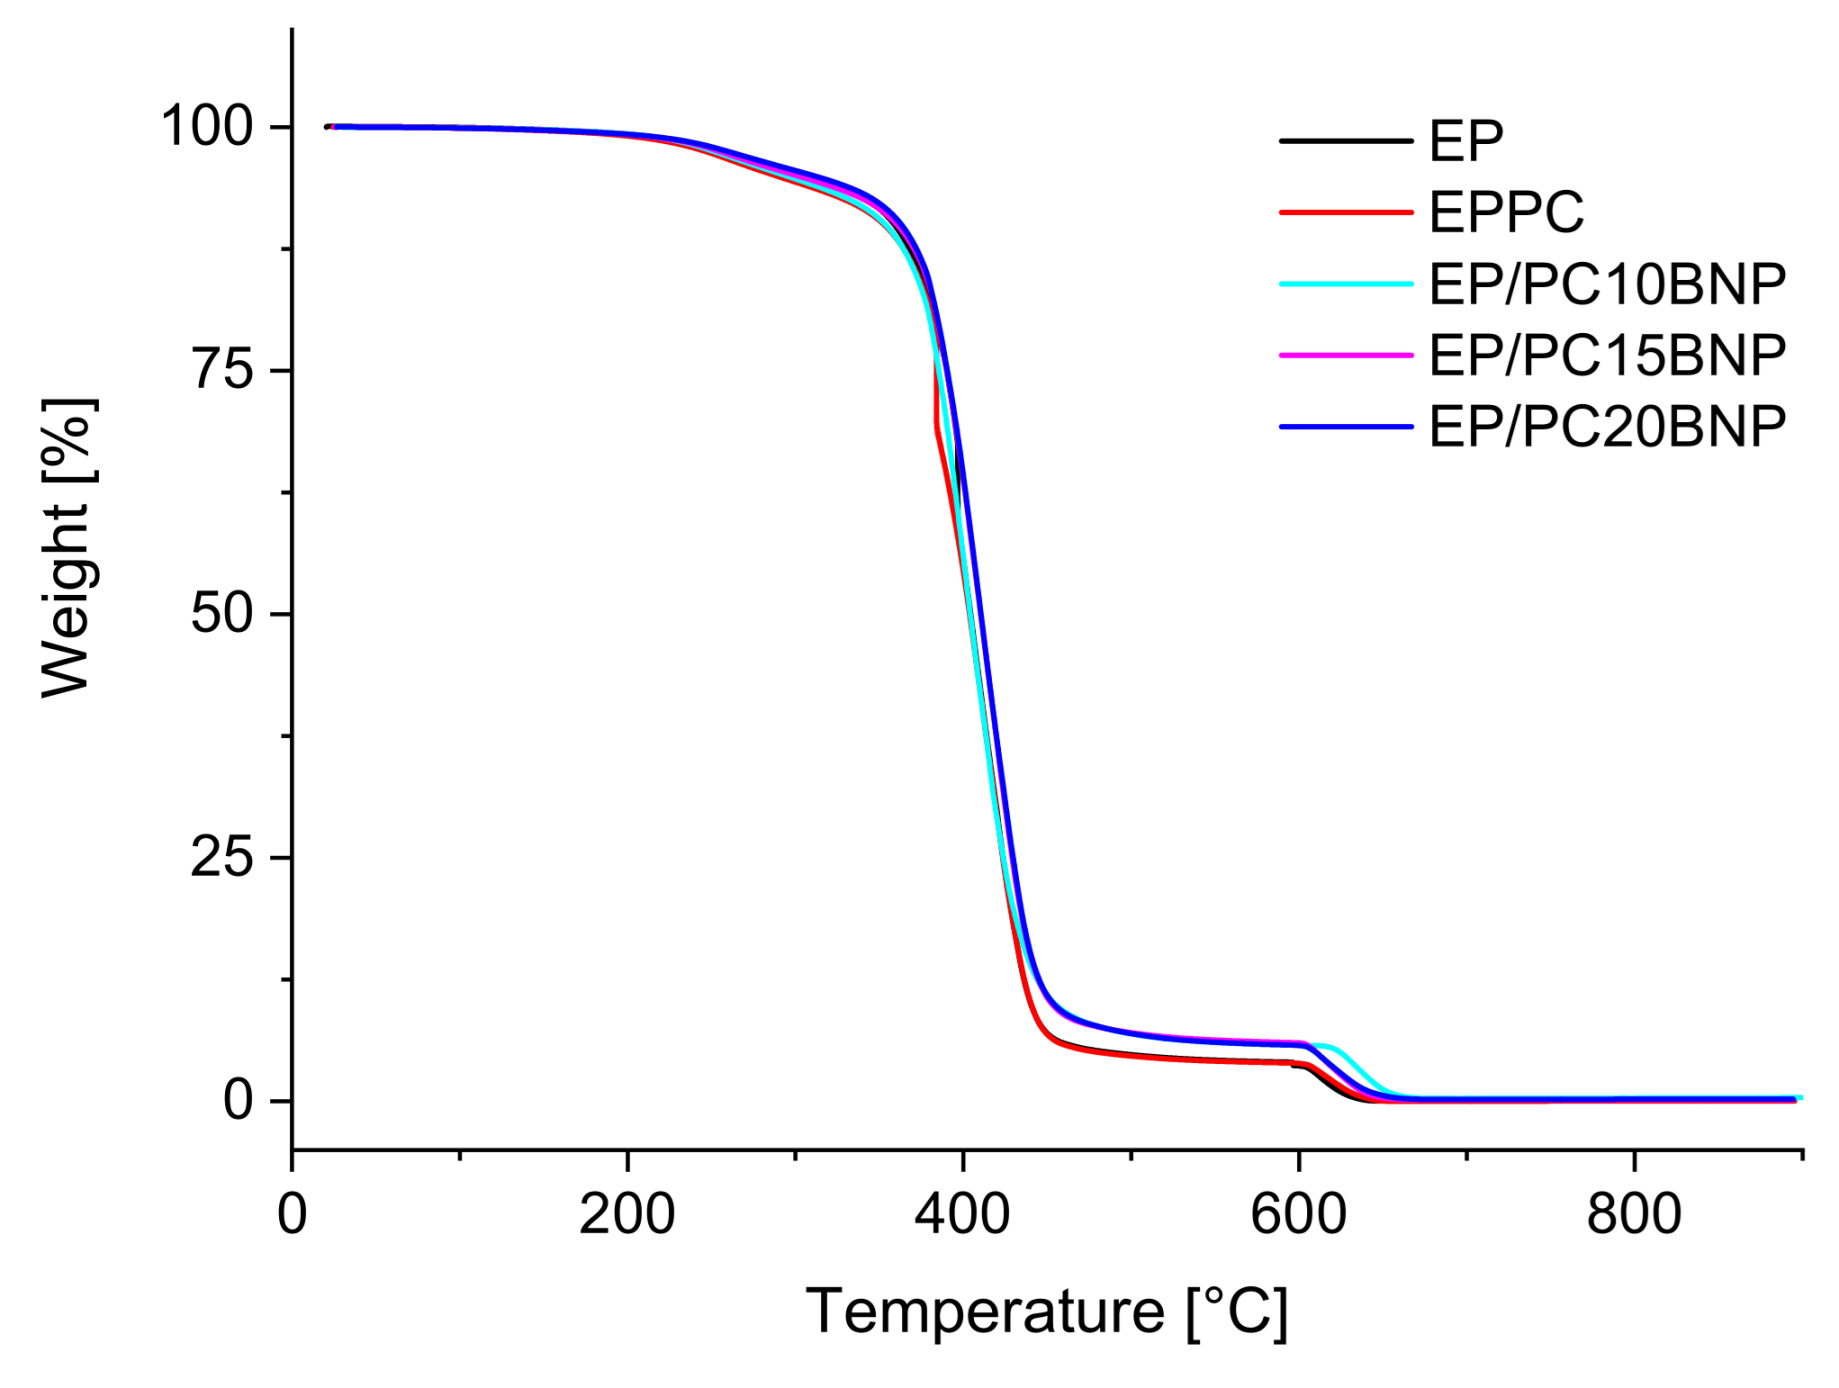
| Component [%] | EP | EPPC | EPPC 10BNP | EPPC 15BNP | EPPC 20BNP |
|---|---|---|---|---|---|
| High volatile | 0.74 | 0.92 | 1.29 | 0.97 | 0.83 |
| Medium volatile | 95.05 | 94.95 | 92.04 | 93.51 | 93.06 |
| Combustible | 4.20 | 4.11 | 6.31 | 5.37 | 5.83 |
| Char | 0.05 | 0.03 | 0.38 | 0.16 | 0.29 |
| Temperature 5% mass loss | 306.60 | 288.30 | 253.10 | 286.27 | 293.77 |
| Maximum temperature [°C] | 396.90 | 384.42 | 400.40 | 409.76 | 410.87 |
Appendix F

References
- Waniek, T.; Braun, U.; Silbernagl, D.; Sturm, H. The impact of water released from boehmite nanoparticles during curing in epoxy-based nanocomposites. J. Appl. Polym. Sci. 2021, 51006. [Google Scholar] [CrossRef]
- Jux, M.; Fankhänel, J.; Daum, B.; Mahrholz, T.; Sinapius, M.; Rolfes, R. Mechanical properties of epoxy/boehmite nanocomposites in dependency of mass fraction and surface modification—An experimental and numerical approach. Polymer 2018, 141, 34–45. [Google Scholar] [CrossRef]
- Jux, M.; Finke, B.; Mahrholz, T.; Sinapius, M.; Kwade, A.; Schilde, C. Effects of Al(OH)O nanoparticle agglomerate size in epoxy resin on tension, bending, and fracture properties. J. Nanoparticle Res. 2017, 19, 139. [Google Scholar] [CrossRef]
- Fankhänel, J.; Arash, B.; Rolfes, R. Elastic interphase properties of nanoparticle/epoxy nanocomposites: A molecular dynamics study. Compos. Part B Eng. 2019, 176, 107211. [Google Scholar] [CrossRef]
- Khorasani, M.G.Z.; Silbernagl, D.; Szymoniak, P.; Hodoroaba, V.-D.; Sturm, H. The effect of boehmite nanoparticles (γ-AlOOH) on nanomechanical and thermomechanical properties correlated to crosslinking density of epoxy. Polymer 2019, 164, 174–182. [Google Scholar] [CrossRef]
- Topolniak, I.; Hodoroaba, V.-D.; Pfeifer, D.; Braun, U.; Sturm, H. Boehmite Nanofillers in Epoxy Oligosiloxane Resins: Influencing the Curing Process by Complex Physical and Chemical Interactions. Materials 2019, 12, 1513. [Google Scholar] [CrossRef] [PubMed]
- Exner, W.; Arlt, C.; Mahrholz, T.; Riedel, U.; Sinapius, M. Nanoparticles with various surface modifications as functionalized cross-linking agents for composite resin materials. Compos. Sci. Technol. 2012, 72, 1153–1159. [Google Scholar] [CrossRef]
- Wang, G.; Yu, D.; Kelkar, A.D.; Zhang, L. Electrospun nanofiber: Emerging reinforcing filler in polymer matrix composite materials. Prog. Polym. Sci. 2017, 75, 73–107. [Google Scholar] [CrossRef]
- Zucchelli, A.; Focarete, M.L.; Gualandi, C.; Ramakrishna, S. Electrospun nanofibers for enhancing structural performance of composite materials. Polym. Adv. Technol. 2010, 22, 339–349. [Google Scholar] [CrossRef]
- Ozdil, F.; Carlsson, L.A. Mode I Interlaminar Fracture of Interleaved Graphite/Epoxy. J. Compos. Mater. 1992, 26, 432–459. [Google Scholar] [CrossRef]
- Shakil, U.A.; Hassan, S.B.A.; Yahya, M.Y.; Nauman, S. Mechanical properties of electrospun nanofiber reinforced/interleaved epoxy matrix composites—A review. Polym. Compos. 2020, 41, 2288–2315. [Google Scholar] [CrossRef]
- Aljarrah, M.T.; Abdelal, N.R. Improvement of the mode I interlaminar fracture toughness of carbon fiber composite reinforced with electrospun nylon nanofiber. Compos. Part B Eng. 2019, 165, 379–385. [Google Scholar] [CrossRef]
- Monteserín, C.; Blanco, M.; Murillo, N.; Pérez-Márquez, A.; Maudes, J.; Gayoso, J.; Laza, J.M.; Aranzabe, E.; Vilas, J.L. Effect of Different Types of Electrospun Polyamide 6 Nanofibres on the Mechanical Properties of Carbon Fibre/Epoxy Composites. Polymer 2018, 10, 1190. [Google Scholar] [CrossRef]
- Bovicelli, F.; Saghafi, H.; Brugo, T.; Belcari, J.; Zucchelli, A.; Minak, G. On Consideration the Mode I Fracture Response of CFRP Composite Interleaved by Composite Nanofibers. Procedia Mater. Sci. 2014, 3, 1316–1321. [Google Scholar] [CrossRef]
- Cohades, A.; Daelemans, L.; Ward, C.; Meireman, T.; Van Paepegem, W.; De Clerck, K.; Michaud, V. Size limitations on achieving tough and healable fibre reinforced composites through the use of thermoplastic nanofibres. Compos. Part A Appl. Sci. Manuf. 2018, 112, 485–495. [Google Scholar] [CrossRef]
- Chen, Y.; Sui, L.; Fang, H.; Ding, C.; Li, Z.; Jiang, S.; Hou, H. Superior mechanical enhancement of epoxy composites reinforced by polyimide nanofibers via a vacuum-assisted hot-pressing. Compos. Sci. Technol. 2019, 174, 20–26. [Google Scholar] [CrossRef]
- Lin, S.; Cai, Q.; Ji, J.; Sui, G.; Yu, Y.; Yang, X.; Ma, Q.; Wei, Y.; Deng, X. Electrospun nanofiber reinforced and toughened composites through in situ nano-interface formation. Compos. Sci. Technol. 2008, 68, 3322–3329. [Google Scholar] [CrossRef]
- Bazilevsky, A.V.; Yarin, A.L.; Megaridis, C.M. Co-electrospinning of core-shell fibers using a single-nozzle technique. Langmuir 2007, 23, 2311–2314. [Google Scholar] [CrossRef]
- Chen, L.-S.; Huang, Z.-M.; Dong, G.-H.; He, C.-L.; Liu, L.; Hu, Y.-Y.; Li, Y. Development of a transparent PMMA composite reinforced with nanofibers. Polym. Compos. 2009, 30, 239–247. [Google Scholar] [CrossRef]
- Murillo, N.C.; Khorasani, M.G.Z.; Silbernagl, D.; Hahn, M.B.; Hodoroaba, V.; Sturm, H. Nanomechanical study of polycarbonate/boehmite nanoparticles/epoxy ternary composite and their interphases. J. Appl. Polym. Sci. 2021, 138. [Google Scholar] [CrossRef]
- Palazzetti, R.; Zucchelli, A. Electrospun nanofibers as reinforcement for composite laminates materials—A review. Compos. Struct. 2017, 182, 711–727. [Google Scholar] [CrossRef]
- Maccaferri, E.; Mazzocchetti, L.; Benelli, T.; Brugo, T.M.; Zucchelli, A.; Giorgini, L. Rubbery nanofibrous interleaves enhance fracture toughness and damping of CFRP laminates. Mater. Des. 2020, 195, 109049. [Google Scholar] [CrossRef]
- Fankhänel, J.; Silbernagl, D.; Khorasani, M.G.Z.; Daum, B.; Kempe, A.; Sturm, H.; Rolfes, R. Mechanical Properties of Boehmite Evaluated by Atomic Force Microscopy Experiments and Molecular Dynamic Finite Element Simulations. J. Nanomater. 2016, 2016, 1–13. [Google Scholar] [CrossRef]
- Wojdyr, M. Fityk: A general-purpose peak fitting program. J. Appl. Crystallogr. 2010, 43, 1126–1128. [Google Scholar] [CrossRef]
- Hodoroaba, V.-D.; Motzkus, C.; Macé, T.; Vaslin-Reimann, S. Performance of High-Resolution SEM/EDX Systems Equipped with Transmission Mode (TSEM) for Imaging and Measurement of Size and Size Distribution of Spherical Nanoparticles. Microsc. Microanal. 2014, 20, 602–612. [Google Scholar] [CrossRef] [PubMed]
- Cano Murillo, N.; Szymoniak, P.; Smales, G.J.; Sturm, H.; Schönhals, A. Fast Scanning Calorimetric Studies on Electrospun Nanocomposites of Polycarbonate and Taurine Modified Boehmite Nanoparticles. Unpublished work. 2021. [Google Scholar]
- Casper, C.L.; Stephens, J.S.; Tassi, N.G.; Chase, D.B.; Rabolt, J.F. Controlling Surface Morphology of Electrospun Polystyrene Fibers: Effect of Humidity and Molecular Weight in the Electrospinning Process. Macromolecules 2004, 37, 573–578. [Google Scholar] [CrossRef]
- Lu, P.; Xia, Y. Maneuvering the Internal Porosity and Surface Morphology of Electrospun Polystyrene Yarns by Controlling the Solvent and Relative Humidity. Langmuir 2013, 29, 7070–7078. [Google Scholar] [CrossRef]
- Zhang, J.; Guo, Q.; Huson, M.; Slota, I.; Fox, B. Interphase study of thermoplastic modified epoxy matrix composites: Phase behaviour around a single fibre influenced by heating rate and surface treatment. Compos. Part A Appl. Sci. Manuf. 2010, 41, 787–794. [Google Scholar] [CrossRef]
- Francis, B.; Rao, V.L.; Poel, G.V.; Posada, F.; Groeninckx, G.; Ramaswamy, R.; Thomas, S. Cure kinetics, morphological and dynamic mechanical analysis of diglycidyl ether of bisphenol-A epoxy resin modified with hydroxyl terminated poly (ether ether ketone) containing pendent tertiary butyl groups. Polymer 2006, 47, 5411–5419. [Google Scholar] [CrossRef]
- Szymoniak, P.; Pauw, B.R.; Qu, X.; Schönhals, A. Competition of nanoparticle-induced mobilization and immobilization effects on segmental dynamics of an epoxy-based nanocomposite. Soft Matter 2020, 16, 5406–5421. [Google Scholar] [CrossRef]
- Wu, W.-L.; Bauer, B.J.; Su, W. Network structure in epoxies: 6. The growth process investigated by neutron scattering. Polymer 1989, 30, 1384–1388. [Google Scholar] [CrossRef]
- Sahagun, C.M.; Knauer, K.M.; Morgan, S.E. Molecular network development and evolution of nanoscale morphology in an epoxy-amine thermoset polymer. J. Appl. Polym. Sci. 2012, 126, 1394–1405. [Google Scholar] [CrossRef]
- Morsch, S.; Liu, Y.; Lyon, S.B.; Gibbon, S.R. Insights into Epoxy Network Nanostructural Heterogeneity Using AFM-IR. ACS Appl. Mater. Interfaces 2015, 8, 959–966. [Google Scholar] [CrossRef]
- Silbernagl, D.; Khorasani, M.G.Z.; Murillo, N.C.; Elert, A.M.; Sturm, H. Bulk chemical composition contrast from attractive forces in AFM force spectroscopy. Beilstein J. Nanotechnol. 2021, 12, 58–71. [Google Scholar] [CrossRef]
- Ghasem Zadeh Khorasani, M.; Elert, A.M.; Hodoroaba, V.D.; Agudo Jácome, L.; Altmann, K.; Silbernagl, D.; Sturm, H. Short- and Long-Range Mechanical and Chemical Interphases Caused by Interaction of Boehmite (gamma-AlOOH) with Anhydride-Cured Epoxy Resins. Nanomaterials 2019, 9, 853. [Google Scholar]
- Khorasani, M.G.Z.; Silbernagl, D.; Platz, D.; Sturm, H. Insights into Nano-Scale Physical and Mechanical Properties of Epoxy/Boehmite Nanocomposite Using Different AFM Modes. Polymer 2019, 11, 235. [Google Scholar] [CrossRef]
- Stark, W. Investigation of the curing behaviour of carbon fibre epoxy prepreg by Dynamic Mechanical Analysis DMA. Polym. Test. 2013, 32, 231–239. [Google Scholar] [CrossRef]
- Nakka, J.S.; Jansen, K.M.B.; Ernst, L.J. Effect of chain flexibility in the network structure on the viscoelasticity of epoxy thermosets. J. Polym. Res. 2011, 18, 1879–1888. [Google Scholar] [CrossRef]
- Lu, M.-S.; Chen, J.-L.; Li, Y.-S.; Chang, F.-C.; Li, M.-S.; Ma, C.-C.M. The kinetics, thermal and mechanical properties of epoxy-polycarbonate blends cured with aromatic amine. J. Polym. Res. 1998, 5, 115–124. [Google Scholar] [CrossRef]
- Ishida, H.; Allen, D.J. Mechanical characterization of copolymers based on benzoxazine and epoxy. Polymer 1996, 37, 4487–4495. [Google Scholar] [CrossRef]
- Silva, I.D.S.; Barros, J.J.P.; Albuquerque, A.; Jaques, N.G.; Fook, M.V.L.; Wellen, R.M.R. Insights into the curing kinetics of epoxy/PLA: Implications of the networking structure. Express Polym. Lett. 2020, 14, 1180–1196. [Google Scholar] [CrossRef]
- Mori, T.; Ogawa, K.; Tanaka, T. Heterogeneous network polymers. IV. Dynamic mechanical properties—Composition—Phase structure relationships. J. Appl. Polym. Sci. 1977, 21, 3381–3405. [Google Scholar] [CrossRef]
- Gillham, J.K. Characterization of thermosetting materials by torsional braid analysis. Polym. Eng. Sci. 1976, 16, 353–356. [Google Scholar] [CrossRef]
- Woo, E.; Wu, M.N. Blends of a diglycidylether epoxy with bisphenol-A polycarbonate or poly (methyl methacrylate): Cases of miscibility with or without specific interactions. Polymer 1996, 37, 2485–2492. [Google Scholar] [CrossRef]
- Raghava, R.S. Development and characterization of thermosetting-thermoplastic polymer blends for applications in damage-tolerant composites. J. Polym. Sci. Part B Polym. Phys. 1988, 26, 65–81. [Google Scholar] [CrossRef]


| Sample | First Heating | Second Heating |
|---|---|---|
| Epoxy | 1203.98 | 1471.04 |
| EP PC neat | 1220.39 | 1173.51 |
| EPPC 10BNP | 1303.05 | 1421.28 |
| EPPC 15BNP | 1294.67 | 1441.42 |
| EPPC 20BNP | 1327.03 | 1496.02 |
| Sample | Peak Position Tg (°C) | Width of Half Height (C°) | Peak Height (a.u) | ||||||
|---|---|---|---|---|---|---|---|---|---|
| Tg1 | Tg2 | Tg3 | FWHM1 | FWHM2 | FWHM3 | Height1 | Height2 | Height3 | |
| EP | -- | 130.59 | 143.18 | -- | 10.27 | 15.32 | -- | 40.17 | 60.98 |
| EP/PC fibers | -- | -- | 143.51 | -- | -- | 16.817 | -- | -- | 128.19 |
| EP/PC10BNP | 109.50 | -- | 137.06 | 27.30 | -- | 12.88 | 29.43 | -- | 52.40 |
| EP/PC15BNP | 101.37 | 115.64 | 136.95 | 16.62 | 16.34 | 12.81 | 22.96 | 24.97 | 50.89 |
| EP/PC20BNP | 97.33 | 105.44 | 135.14 | 7.2 | 23.80 | 11.91 | 7.03 | 28.73 | 49.26 |
| Sample | Peak Position Tg (°C) | Width of Half Height (C°) | Peak Height (a.u) | ||||||
|---|---|---|---|---|---|---|---|---|---|
| Tg1 | Tg2 | Tg3 | FWHM1 | FWHM2 | FWHM3 | Height1 | Height2 | Height3 | |
| EP | -- | 135.52 | 150.32 | -- | 17.21 | 15.75 | -- | 32.25 | 32.96 |
| EP/PC fibers | -- | 141.08 | 153.79 | -- | 13.69 | 14.65 | -- | 44.15 | 54.43 |
| EP/PC10BNP | -- | 119.9 | 146.44 | -- | 34.74 | 15.42 | -- | 22.35 | 29.48 |
| EP/PC15BNP | 114.68 | 133.32 | 146.41 | 25.50 | 9.98 | 15.52 | 24.25 | 9.79 | 29.71 |
| EP/PC20BNP | 109.95 | 131.40 | 145.69 | 23.16 | 11.89 | 14.49 | 18.62 | 11.48 | 28.42 |
Publisher’s Note: MDPI stays neutral with regard to jurisdictional claims in published maps and institutional affiliations. |
© 2021 by the authors. Licensee MDPI, Basel, Switzerland. This article is an open access article distributed under the terms and conditions of the Creative Commons Attribution (CC BY) license (https://creativecommons.org/licenses/by/4.0/).
Share and Cite
Cano Murillo, N.; Ghasem Zadeh Khorasani, M.; Silbernagl, D.; Emamverdi, F.; Cacua, K.; Hodoroaba, V.-D.; Sturm, H. Carrier Fibers for the Safe Dosage of Nanoparticles in Nanocomposites: Nanomechanical and Thermomechanical Study on Polycarbonate/Boehmite Electrospun Fibers Embedded in Epoxy Resin. Nanomaterials 2021, 11, 1591. https://doi.org/10.3390/nano11061591
Cano Murillo N, Ghasem Zadeh Khorasani M, Silbernagl D, Emamverdi F, Cacua K, Hodoroaba V-D, Sturm H. Carrier Fibers for the Safe Dosage of Nanoparticles in Nanocomposites: Nanomechanical and Thermomechanical Study on Polycarbonate/Boehmite Electrospun Fibers Embedded in Epoxy Resin. Nanomaterials. 2021; 11(6):1591. https://doi.org/10.3390/nano11061591
Chicago/Turabian StyleCano Murillo, Natalia, Media Ghasem Zadeh Khorasani, Dorothee Silbernagl, Farnaz Emamverdi, Karen Cacua, Vasile-Dan Hodoroaba, and Heinz Sturm. 2021. "Carrier Fibers for the Safe Dosage of Nanoparticles in Nanocomposites: Nanomechanical and Thermomechanical Study on Polycarbonate/Boehmite Electrospun Fibers Embedded in Epoxy Resin" Nanomaterials 11, no. 6: 1591. https://doi.org/10.3390/nano11061591
APA StyleCano Murillo, N., Ghasem Zadeh Khorasani, M., Silbernagl, D., Emamverdi, F., Cacua, K., Hodoroaba, V.-D., & Sturm, H. (2021). Carrier Fibers for the Safe Dosage of Nanoparticles in Nanocomposites: Nanomechanical and Thermomechanical Study on Polycarbonate/Boehmite Electrospun Fibers Embedded in Epoxy Resin. Nanomaterials, 11(6), 1591. https://doi.org/10.3390/nano11061591