Article

The Concentration of C(sp3) Atoms and Properties of an Activated Carbon with over 3000 m2/g BET Surface Area

by
Yury M. Shulga
1,2,*,
Eugene N. Kabachkov
1,3,
Vitaly I. Korepanov
4,
Igor I. Khodos
4,
Dmitry Y. Kovalev
5,
Alexandr V. Melezhik
6,
Aleksei G. Tkachev
6 and
Gennady L. Gutsev
7,*
1
Institute of Problems of Chemical Physics, Russian Academy of Sciences, 142432 Chernogolovka, Russia
2
Institute of New Materials and Nanotechnologies, National University of Science and Technology MISIS, Leninsky pr. 4, 119049 Moscow, Russia
3
Chernogolovka Scientific Center, Russian Academy of Sciences, 142432 Chernogolovka, Russia
4
Institute of Microelectronics Technology and High Purity Materials, Russian Academy of Sciences, 142432 Chernogolovka, Russia
5
Merzhanov Institute of Structural Macrokinetics and Materials Science “ISMAN”, Russian Academy of Sciences, 142432 Chernogolovka, Russia
6
Institute of Technology, Tambov State Technical University, ul. Leningrad 1, 392000 Tambov, Russia
7
Department of Physics, Florida A&M University, Tallahassee, FL 32307, USA
*
Authors to whom correspondence should be addressed.
Nanomaterials 2021, 11(5), 1324; https://doi.org/10.3390/nano11051324
Submission received: 29 March 2021 / Revised: 14 May 2021 / Accepted: 14 May 2021 / Published: 17 May 2021

Abstract

:
The alkaline activation of a carbonized graphene oxide/dextrin mixture yielded a carbon-based nanoscale material (AC-TR) with a unique highly porous structure. The BET-estimated specific surface area of the material is 3167 m2/g, which is higher than the specific surface area of a graphene layer. The material has a density of 0.34 g/cm3 and electrical resistivity of 0.25 Ω·cm and its properties were studied using the elemental analysis, transmission electron microscopy (TEM), electron diffraction (ED), X-ray diffraction (XRD), Raman spectroscopy, X-ray photoelectron spectroscopy (XPS), X-ray induced Auger electron spectroscopy (XAES), and electron energy loss spectroscopy (EELS) in the plasmon excitation range. From these data, we derive an integral understanding of the structure of this material. The concentration of sp3 carbon atoms was found to be relatively low with an absolute value that depends on the measurement method. It was shown that there is no graphite-like (002) peak in the electron and X-ray diffraction pattern. The characteristic size of a sp2-domain in the basal plane estimated from the Raman spectra was 7 nm. It was also found that plasmon peaks in the EELS spectrum of AC-TR are downshifted compared to those of graphite.

Graphical Abstract

1. Introduction

Activated carbons (AC) with high specific surface areas (SSA) are very important for a wide range of industrial applications where they are used as adsorbents for solvents, vapors and pollutants [1,2,3,4]. Their electric conductivity makes them highly promising electrodes for supercapacitors in energy storage applications [5,6,7], and as fillers for thermally conductive polymer composites [8,9,10].
Among a wide variety of high-SSA activated carbons, there is a special class of materials whose SSA measured by the Brunauer-Emmett-Teller (BET) method exceeds the SSA of double-sided graphene sheets (2620–2675 m2/g [11,12,13,14,15,16]), which indicates the presence of high concentrations of nanoscale pores and other structure inhomogeneities. One of the basic assumptions of the BET approach is the uniformity of the surface, which is obviously violated for such materials. Nonetheless, one can expect that that the SSA determined using the BET approach is still a useful parameter for characterizing ultraporous carbon materials [17,18].
A common approach used for the production of super-graphene high-porous materials is the alkaline activation of some carbon precursor, typically graphene oxide. For example, the material with SSA ~ 3100 m2/g was obtained [11] from microwave-exfoliated graphene oxide (MEGO). The chemical activation with KOH is based on the following reaction [19]:
6KOH + 2C = 2K + 3H2 + 2K2CO3
Alkaline activation has been extensively used to produce AC with SSA > 3000 m2/g as shown in Table 1.
Oxidative activation can also be used for this purpose. For example, carbon fiber obtained from pitch was subjected to oxidative activation [32]. One of the interesting findings was that the Raman scattering had a high sensitivity to the precursor material and a very low sensitivity to its SSA, which varied in the range from 1000 to 3000 m2/g. It should be noted that even higher SSA values can be found in non-carbonaceous materials. In particular, an SSA value exceeding 5000 m2/g was obtained [33] for the polymer derived from zinc-mediated coordination copolymerization of a dicarboxylic and tricarboxylic acid based on the data on low-temperature (77 K) adsorption of N2. Metal-organic frameworks (MOFs) are made by linking inorganic and organic units. The surface area values of such MOFs range from 1000 m2/g to 10,000 m2/g, thus exceeding those of traditional porous materials, such as carbon materials [38]. Recent advancements, technological issues, advantages and drawbacks related to natural gas storage in carbon-based materials and metal−organic frameworks are summarized in [39]. A theoretical substantiation of such high SSA values is based on rolling a spherical probe of a particular size over the atoms of the molecular structure under study. This approach has been applied for the characterization of various materials, and a good agreement between the calculated and BET-measured SSA values was reported [40,41,42,43,44]. This agreement is especially surprising for ultramicroporous materials [44], for which the BET theory assumptions are not fulfilled. Within the framework of this approach, the theoretical SSA maximum is about 15,000 m2/g for both crystalline and disordered structures [45]. It is believed that the SSA values measured by the BET method, which are larger than 3000 m2/g, reflect the presence of a large number of micropores and/or mesopores in a carbon material.
This work is aimed at a systematic study of the structure of an AC material obtained via an efficient industry-level approach from a graphene oxide/dextrin precursor with carbonization and alkaline activation (the abbreviation for this material is AC-TR). The material has SSA well above 3000 m2/g and is conductive. The key parameters of its structure are the content of different carbon fragments, the characteristic size of the sp2 domains, the stacking mode (or inter-layer structure) of the graphene-like layers and the (de)localization of the electronic excitations inside the material.
Experimental techniques that allow for obtaining these data are TEM, ED, XRD, Raman spectroscopy, XPS, XAES and EELS in the plasmon excitation range. The XPS and EELS techniques were previously used to estimate the sp3/sp2 fragment ratio in AC [11,46]. The authors of the study of the MEGO-derived AC material concluded that 98% of all carbon atoms belong to the sp2 phase [11]. The conclusion on the presence of the sp2 phase content was based on the EELS study of the C1s transitions 1s → π * and 1s → σ * observed in the range 280–320 eV. The motivation of the present work was to systematically study the structure of the AC-TR material including reliable estimations of the sp3 phase content by various techniques. Such information is important for engineering 3D graphene-based materials [47,48].
In this work, the concentration of sp3 states in AC-TR with SSA = 3167 m2/g was estimated using numerous techniques. Some methods of characterization of this class of AC materials were used for the first time. It should be noted that the methods used are well known and the results obtained do not depend on the specific surface area of the samples under study. It seems interesting to compare the results obtained by different methods for the same sample with SSA > 3000 m2/g, which was not done previously, but can be useful for understanding the structure of such materials.

2. Experimental Section

2.1. Materials

AC-TR was obtained by alkaline activation at 750 °C of a carbonized at 300 °C mixture of graphene oxide and corn dextrin with the 1:20 mass ratio. After being cooled, the reaction mixture was washed on a filter to remove the alkali. Nest, the mixture was treated with hydrochloric acid to dissolve impurities and washed with water to neutral pH. The resulting material was dried at 110 °C to a constant weight. The AC-TR yield was 30% of the mass of the mixture carbonized at 300 °C. The modified Hummers method was used for GO synthesis [49], and the details of the syntheses are described elsewhere [50,51]. An energy dispersive analysis showed that in addition to carbon, potassium (0.3–0.4 mass %) and oxygen (3–5 mass %) were present in the material. The resistivity and specific gravity of a mixture of AC-TR powders with 15% PTFE were measured on a sample obtained by compressing the mixture at a pressure of 10 MPa in a glass tube with an inner cross-section of 0.06 cm2 between steel dies. The specific gravity of the cylinder obtained was 0.33–0.35 g/cm3, and the specific electrical resistance was 0.25 Ω·cm.

2.2. Equipment Details

The specific surface area for the AC-TR sample was measured with a QUADRASORB SI Analyzer (Quantachrome Instruments, Boynton Beach, FL, United States). N2 sorption isotherms were obtained at 77 K.
Elemental analysis of AC-TR samples, preliminarily degassed in an argon flow at a temperature of 110 °C for 30 min, was carried out on a CHNS analyzer Vario Micro cube (Elementar GmbH, Hanau, Germany).
Raman spectra were measured with a Bruker Senterra (Billerica, MA, United States) micro-Raman system. The excitation wavelength was 532 nm, the laser power was ~1 mW at the sample point with the beam waist of ~1 µm. Five peaks were used to describe the spectra in the 800–2100 cm−1 region: two Gaussians and three pseudo-Vogt functions, as suggested previously [52].
XPS and REELS spectra were obtained using a Specs PHOIBOS 150 MCD9 electron spectrometer (Specs, Berlin, Germany). The vacuum in the spectrometer chamber did not exceed 4 × 10⁻⁸ Pa. The XPS spectra were excited with an Mg Kα radiation ( = 1253.6 eV) and recorded in the constant transmission energy mode (40 eV for the survey spectra and 10 eV for individual lines). The survey spectrum was recorded in 1.00 eV increments, while the spectra of individual lines were recorded in 0.03 eV increments. Background subtraction was carried out according to the Shirley method [53], and the spectra decomposition was performed according to the set of mixed Gaussian/Lorentz peaks in the framework of the Casa XPS 2.3.23 software. The quantification of atomic content was performed using sensitivity factors provided by the elemental library of CasaXPS. The REELS spectra were excited with an electron beam (SPECS EQ 22/35 Electron Source) (Specs, Berlin, Germany). The energy of the exciting electrons was set at 900 eV.
Transmission electron microscopy studies were performed with a JEOL-2100 microscope at the accelerating voltage of 200 kV (JEOL, Tokyo, Japan).
XRD patterns were collected with a DRON (Bourevestnik, St. Petersburg, Russia) diffractometer with Cu Kα radiation (λ = 1.54187Å) and secondary C (002) monochromator under ambient conditions. The XRD data were recorded in a range from 10 to 60° (2θ) with a step of 0.02° with a counting time of 4 s per a step.

3. Results and Discussion

3.1. Specific Surface Area

The N2 adsorption-desorption isotherms of the sample under study are presented in Figure 1A. The non-localized density functional theory (NLDFT) method was utilized to obtain the pore size distribution shown in Figure 1B, which highlights the presence of both micropores (less than 2 nm) and mesopores (2 nm or more) in the sample. The specific surface area of the sample under study was calculated by the BET method to be 3167 m2/g. This value is higher than the previously reported values of activated carbon (1000–2000 m2/g) [42,43,44,45]. That is, the presence of numerous pores (2.048 cc/g) contribute to an increase in the surface area. Thus, we are dealing with carbon material with SSA > 3000 m2/g in this work.

3.2. Elemental Analysis

The data on the composition of the AC-TR sample presented in Table 2 were obtained by elemental analysis by averaging over five experiments. As could be seen, the sum of concentrations of all elements in the first row of the table is less than 100%. Usually, the residue is attributed to oxygen. With this assumption, the sample contains 5.76 wt % oxygen, which presents the estimate from above. The presence of sulfur and nitrogen in the sample is due to their presence in graphene oxide (see, for example, [54]). Note that the presence of elements such as hydrogen and oxygen in the sample may lead to a decrease in the concentration of carbon atoms with sp2 hybridization due to the chemical bonding of the impurity atoms with the graphene structure.

3.3. TEM and ED

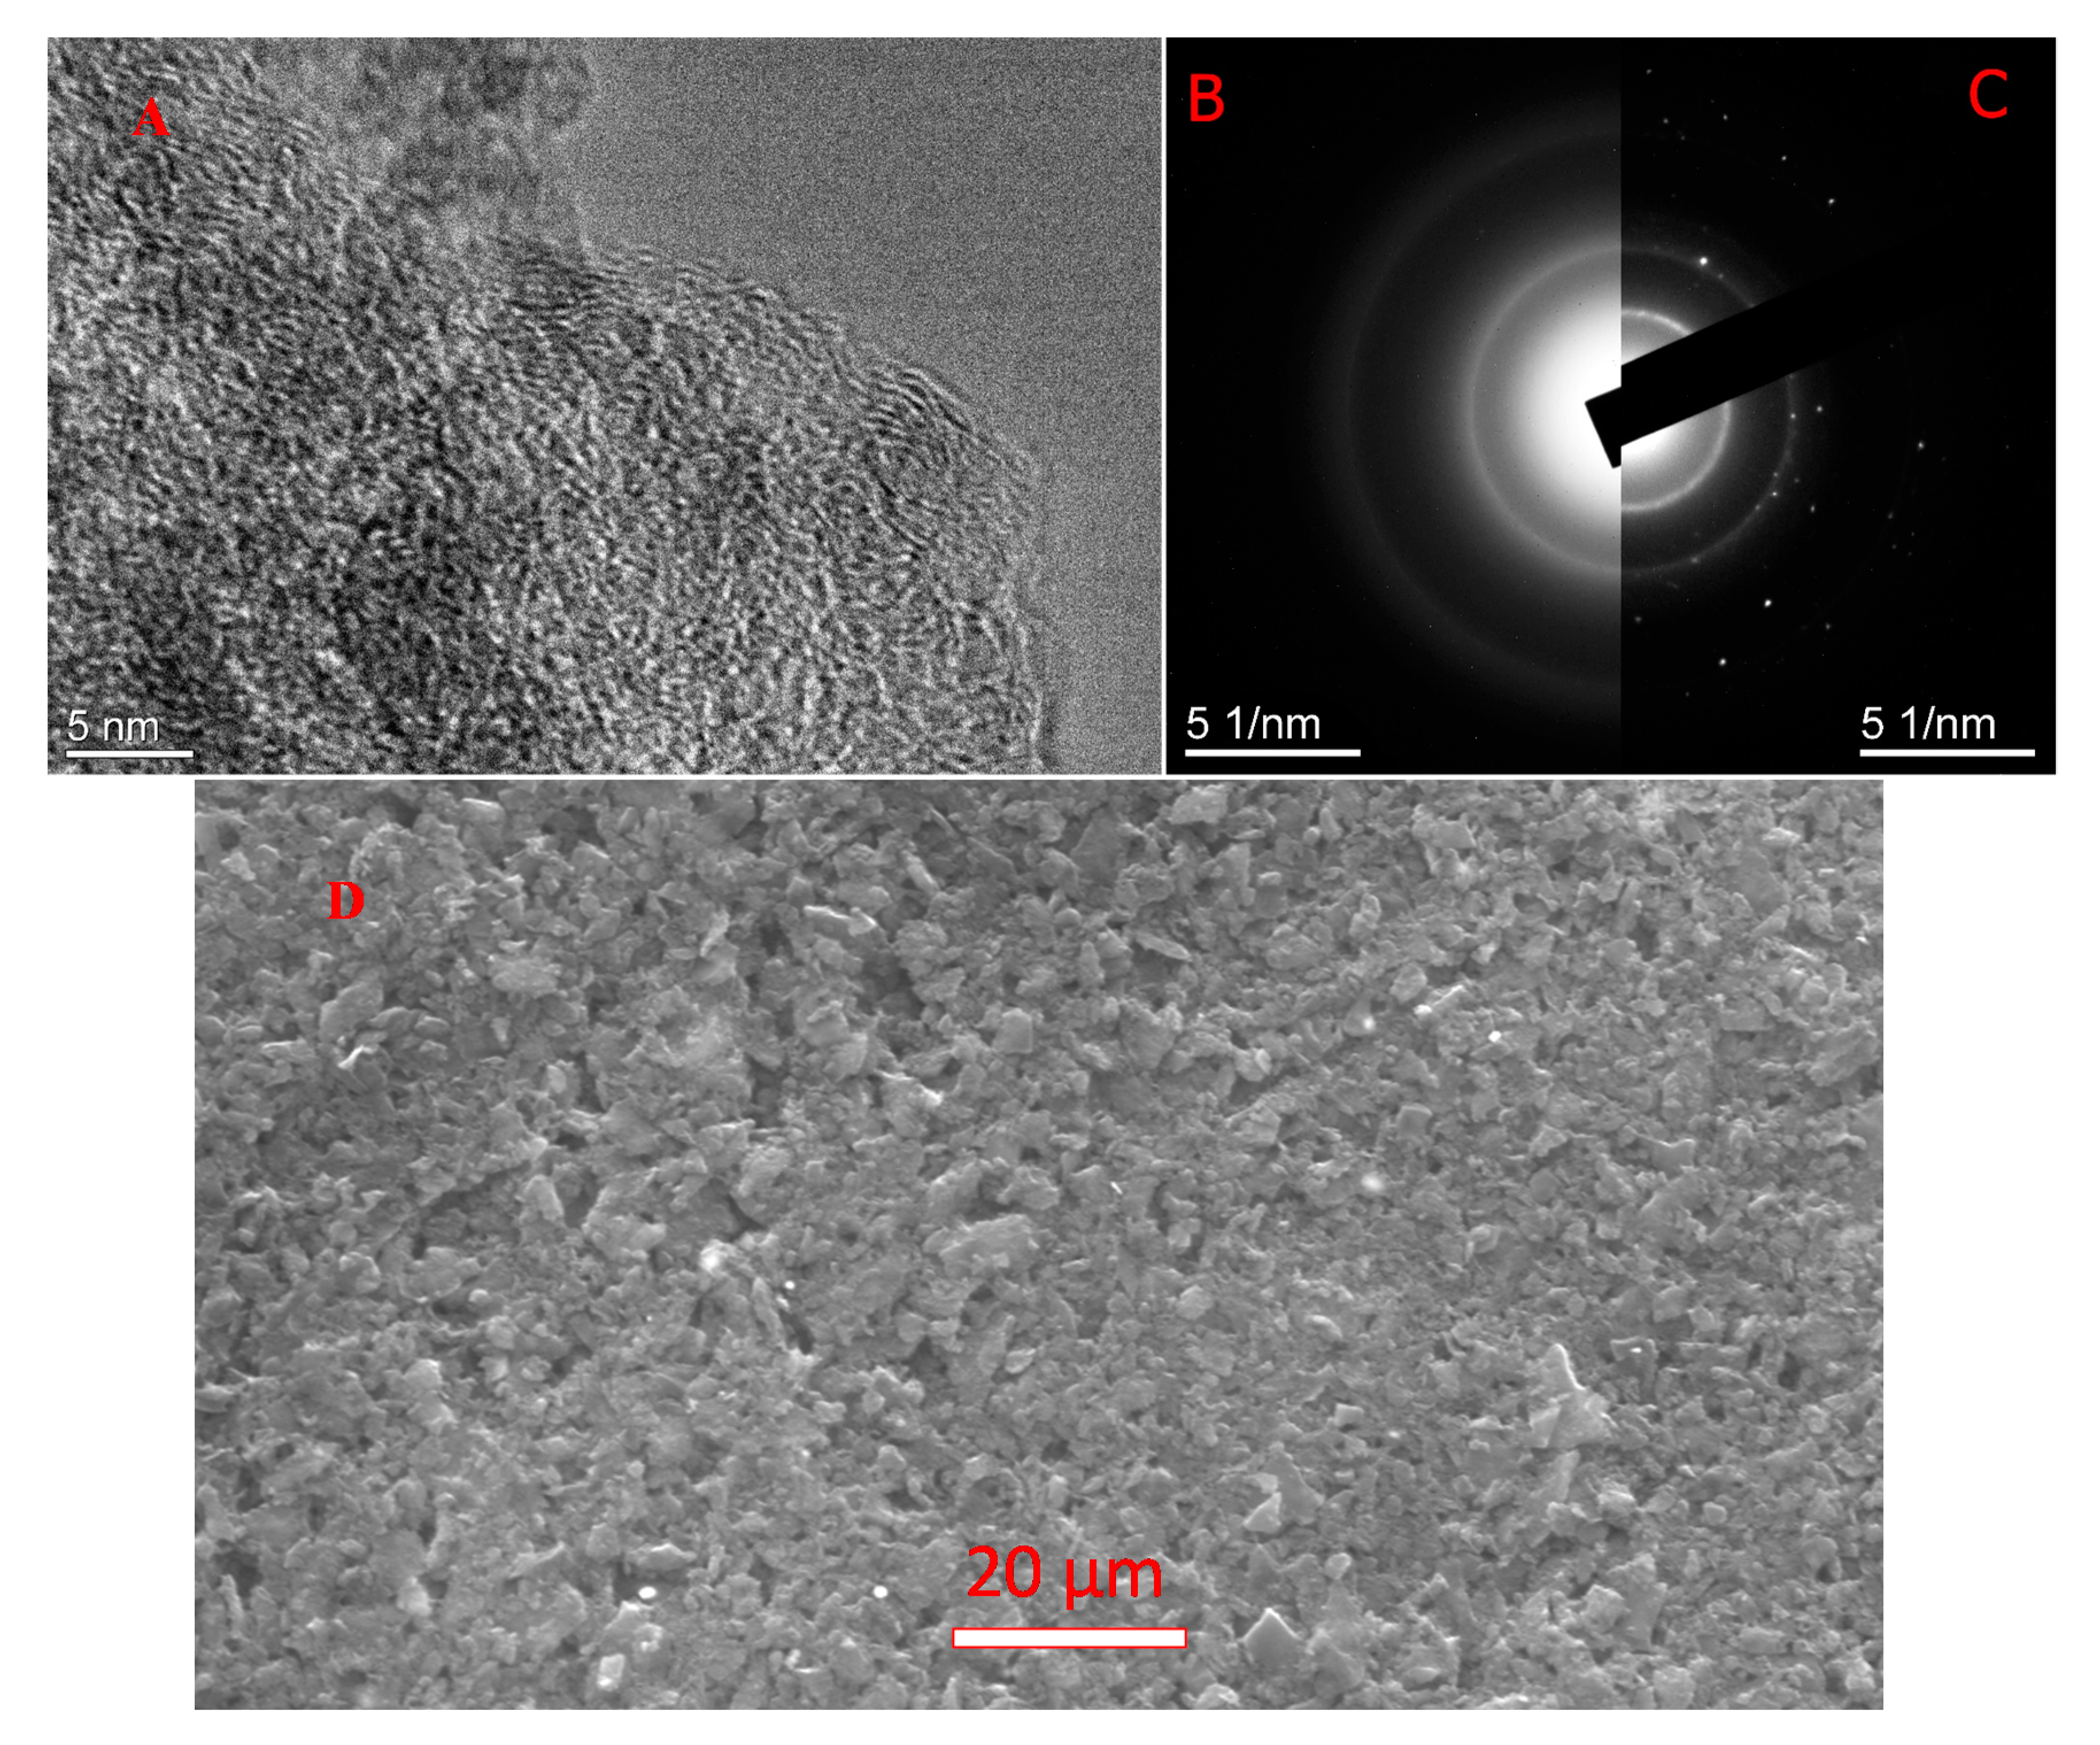
Figure 2 shows a TEM image (Figure 2A) and an electron diffraction pattern (Figure 2B) of the AC-TR sample. On the thin edges (Figure 2A), the structure consisting of the crumpled graphene-like layers is clearly resolved. Our TEM image is similar to that obtained for glassy carbon samples pyrolyzed at 600 °C [55]. In the ED pattern (Figure 2B) the first ring belongs to the (100) and (101) reflections. The (002) ring (basal planes reflections), which in polycrystalline graphite (Figure 2C) is located closer to the center of the ED pattern, in AC-TR is either absent or has a minor intensity hidden below a strong halo in the central part of the ED pattern. For comparison, an SEM image is also presented in Figure 2D.
The interplane distance d corresponding to the maximum of the first ring of the ED pattern is 0.214 nm. This d value for AC-TR is in good agreement with the reference value for graphite: d100 = ao ( 3 2 ) = 0.2131 nm at ao = 0.2461 nm. It is worth noting that there are no diffraction rings corresponding to diamond (sp3 bonds) in the ED pattern. The ED results indicate that there is no ABAB stacking, but they do not contradict the stacking itself.

3.4. XRD

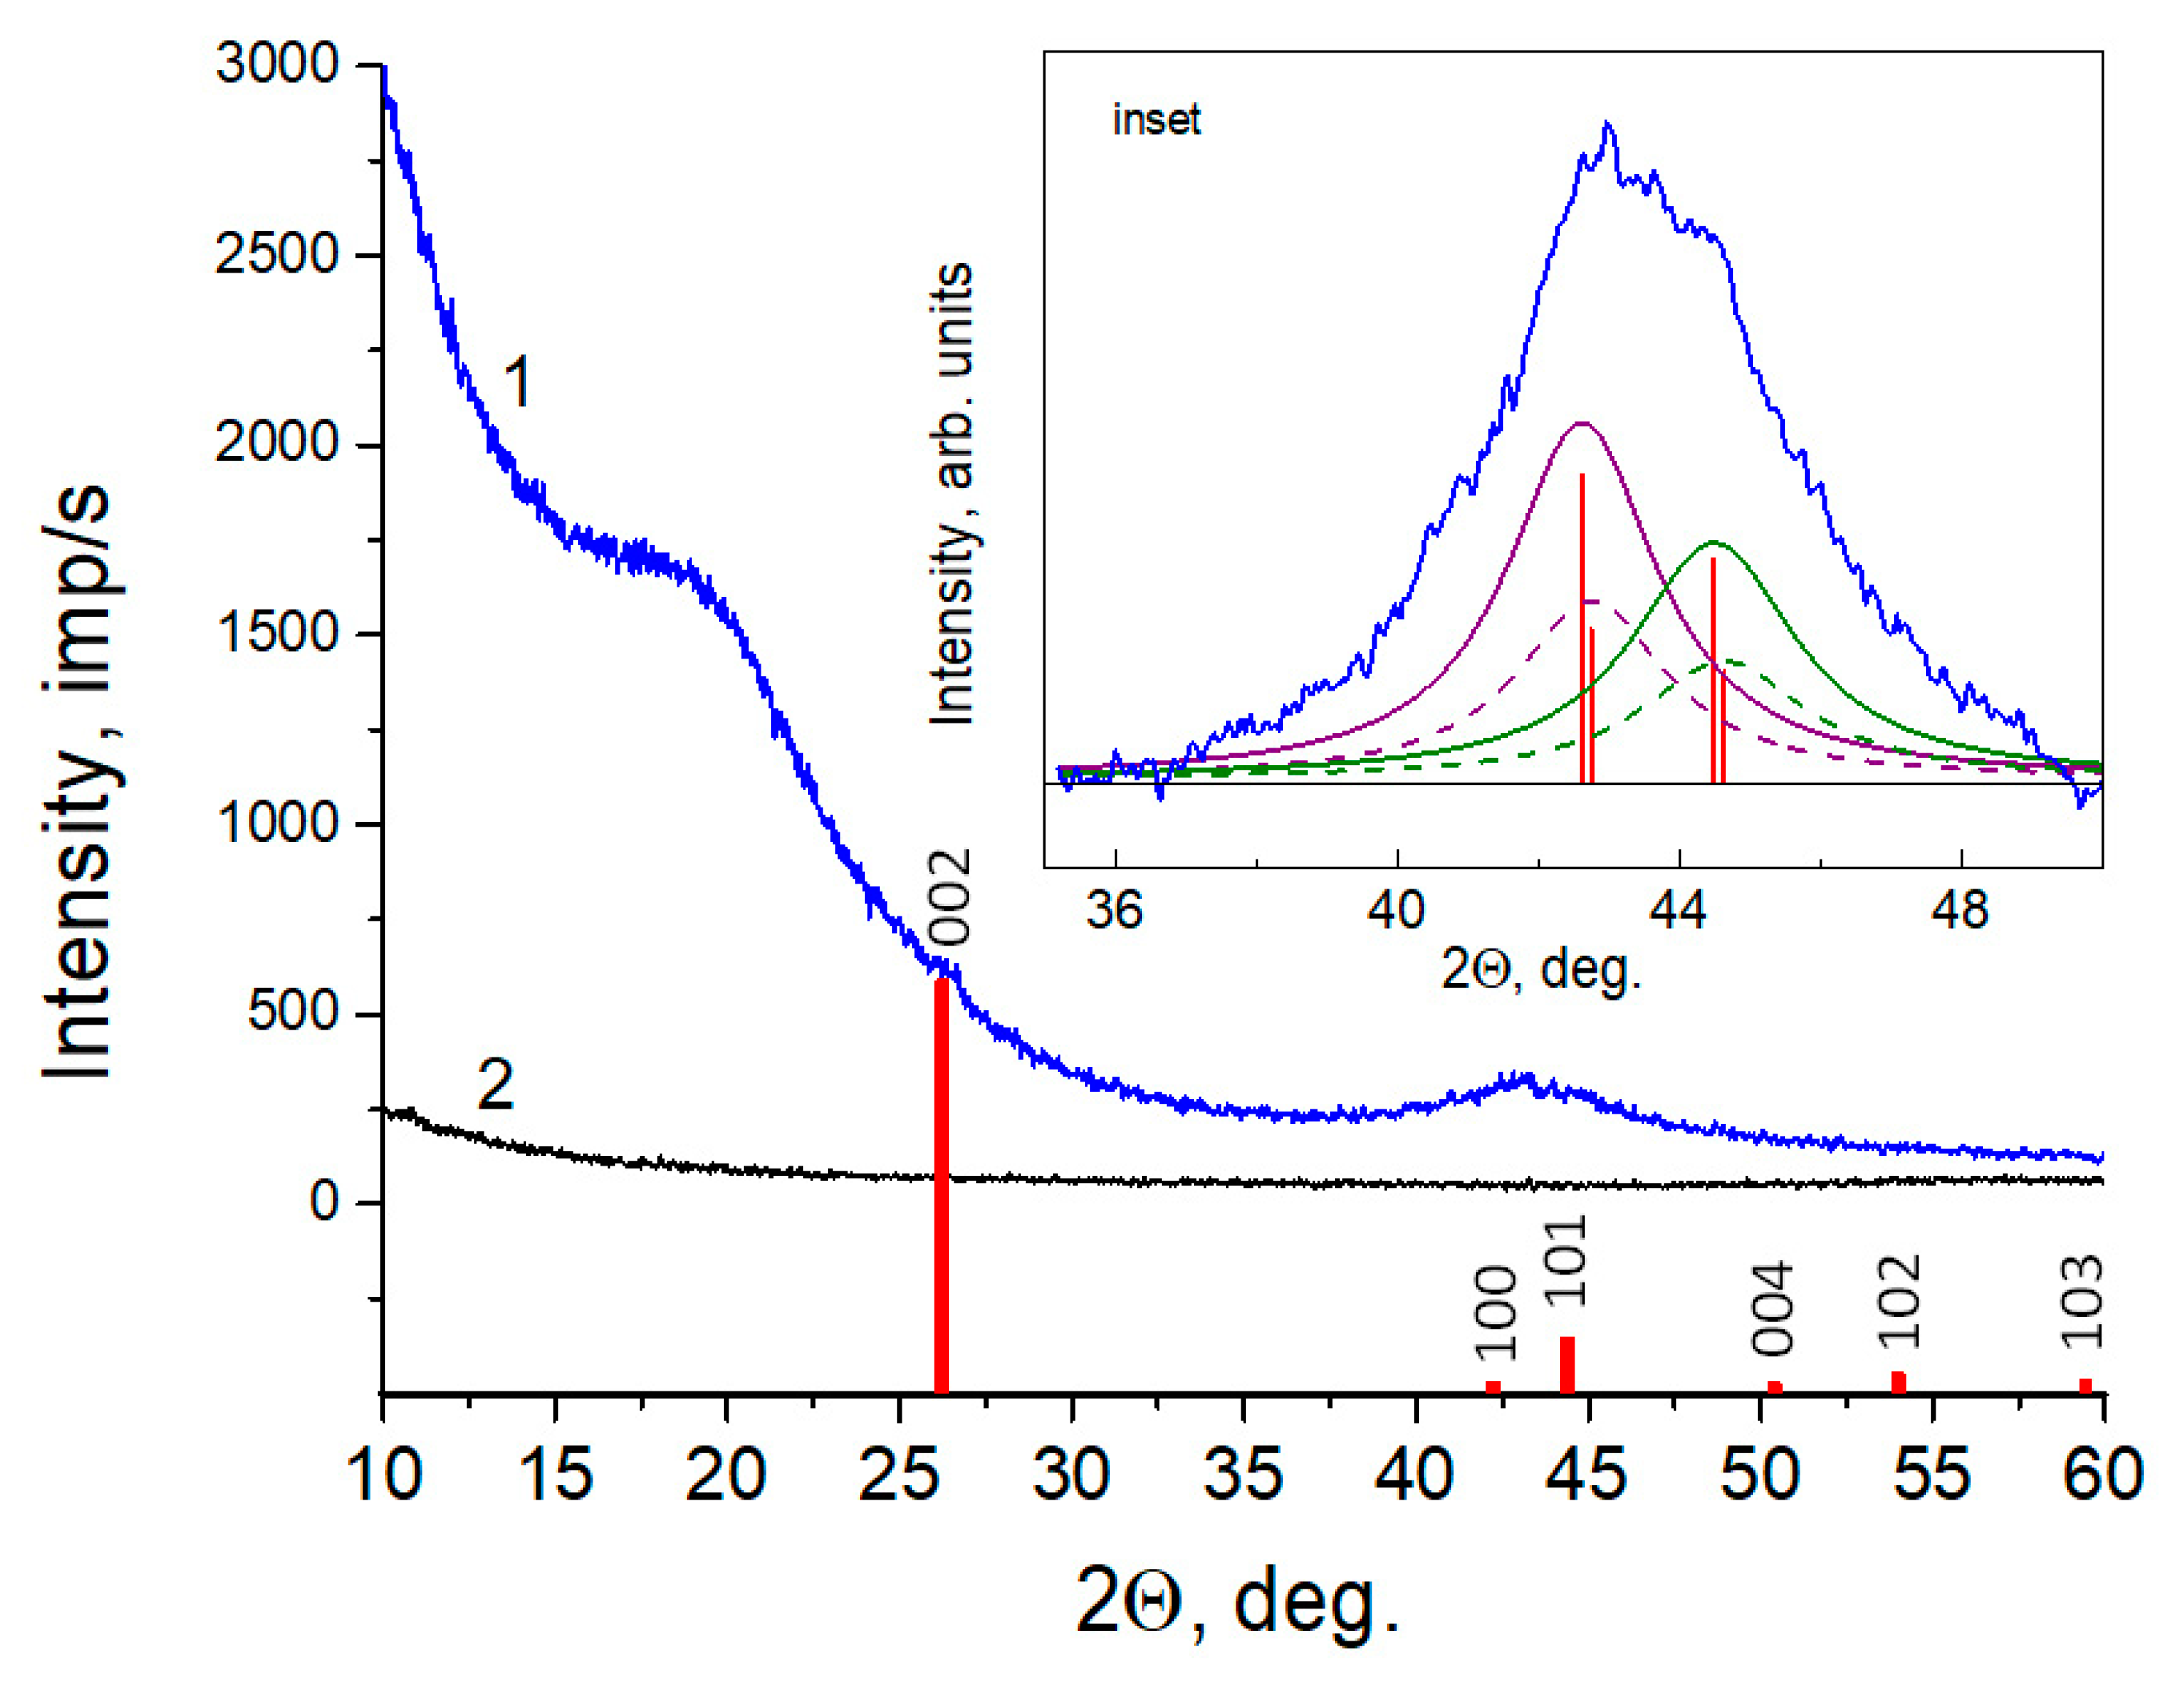
The absence of the (002) reflection, which is characteristic for sp2-carbon materials, is also confirmed by X-ray diffraction. Figure 3 shows an XRD pattern of the AC-TR powder, deposited onto a “backgroundless” plate (single crystal Si). For comparison, the graph shows the XRD patterns of the plate before the deposition. According to the patterns, there is no long-range order in the structure of the powder. There is a wide diffuse halo in the region of small angles and a broadened superposition in the range of angles 2θ = 35–55°, which is due to reflections of 100 and 101 from the carbon, belonging to the hexagonal system whose electron diffraction pattern is also presented in Figure 2 for comparison. The profile analysis of the diffraction pattern, considering the splitting of the Kα line, makes it possible to separate two reflections. The unit cell parameters of the carbon phase were estimated from the angular position to be a = 2.46 Å and c = 7.34 Å. These values are close to the carbon parameters of the PDF2 card # 000-75-1621 base (a = 2.47Å, c = 6.79Å). The size of the coherent scattering regions estimated by using the Scherrer formula with the integral half-width of (100) reflection, was 2.8 nm. It follows from the analysis of our X-ray and electron diffraction data that the resulting material appears to be structurally close to graphene and is mainly formed by carbon atoms with sp2 hybridization.

3.5. Raman Spectra

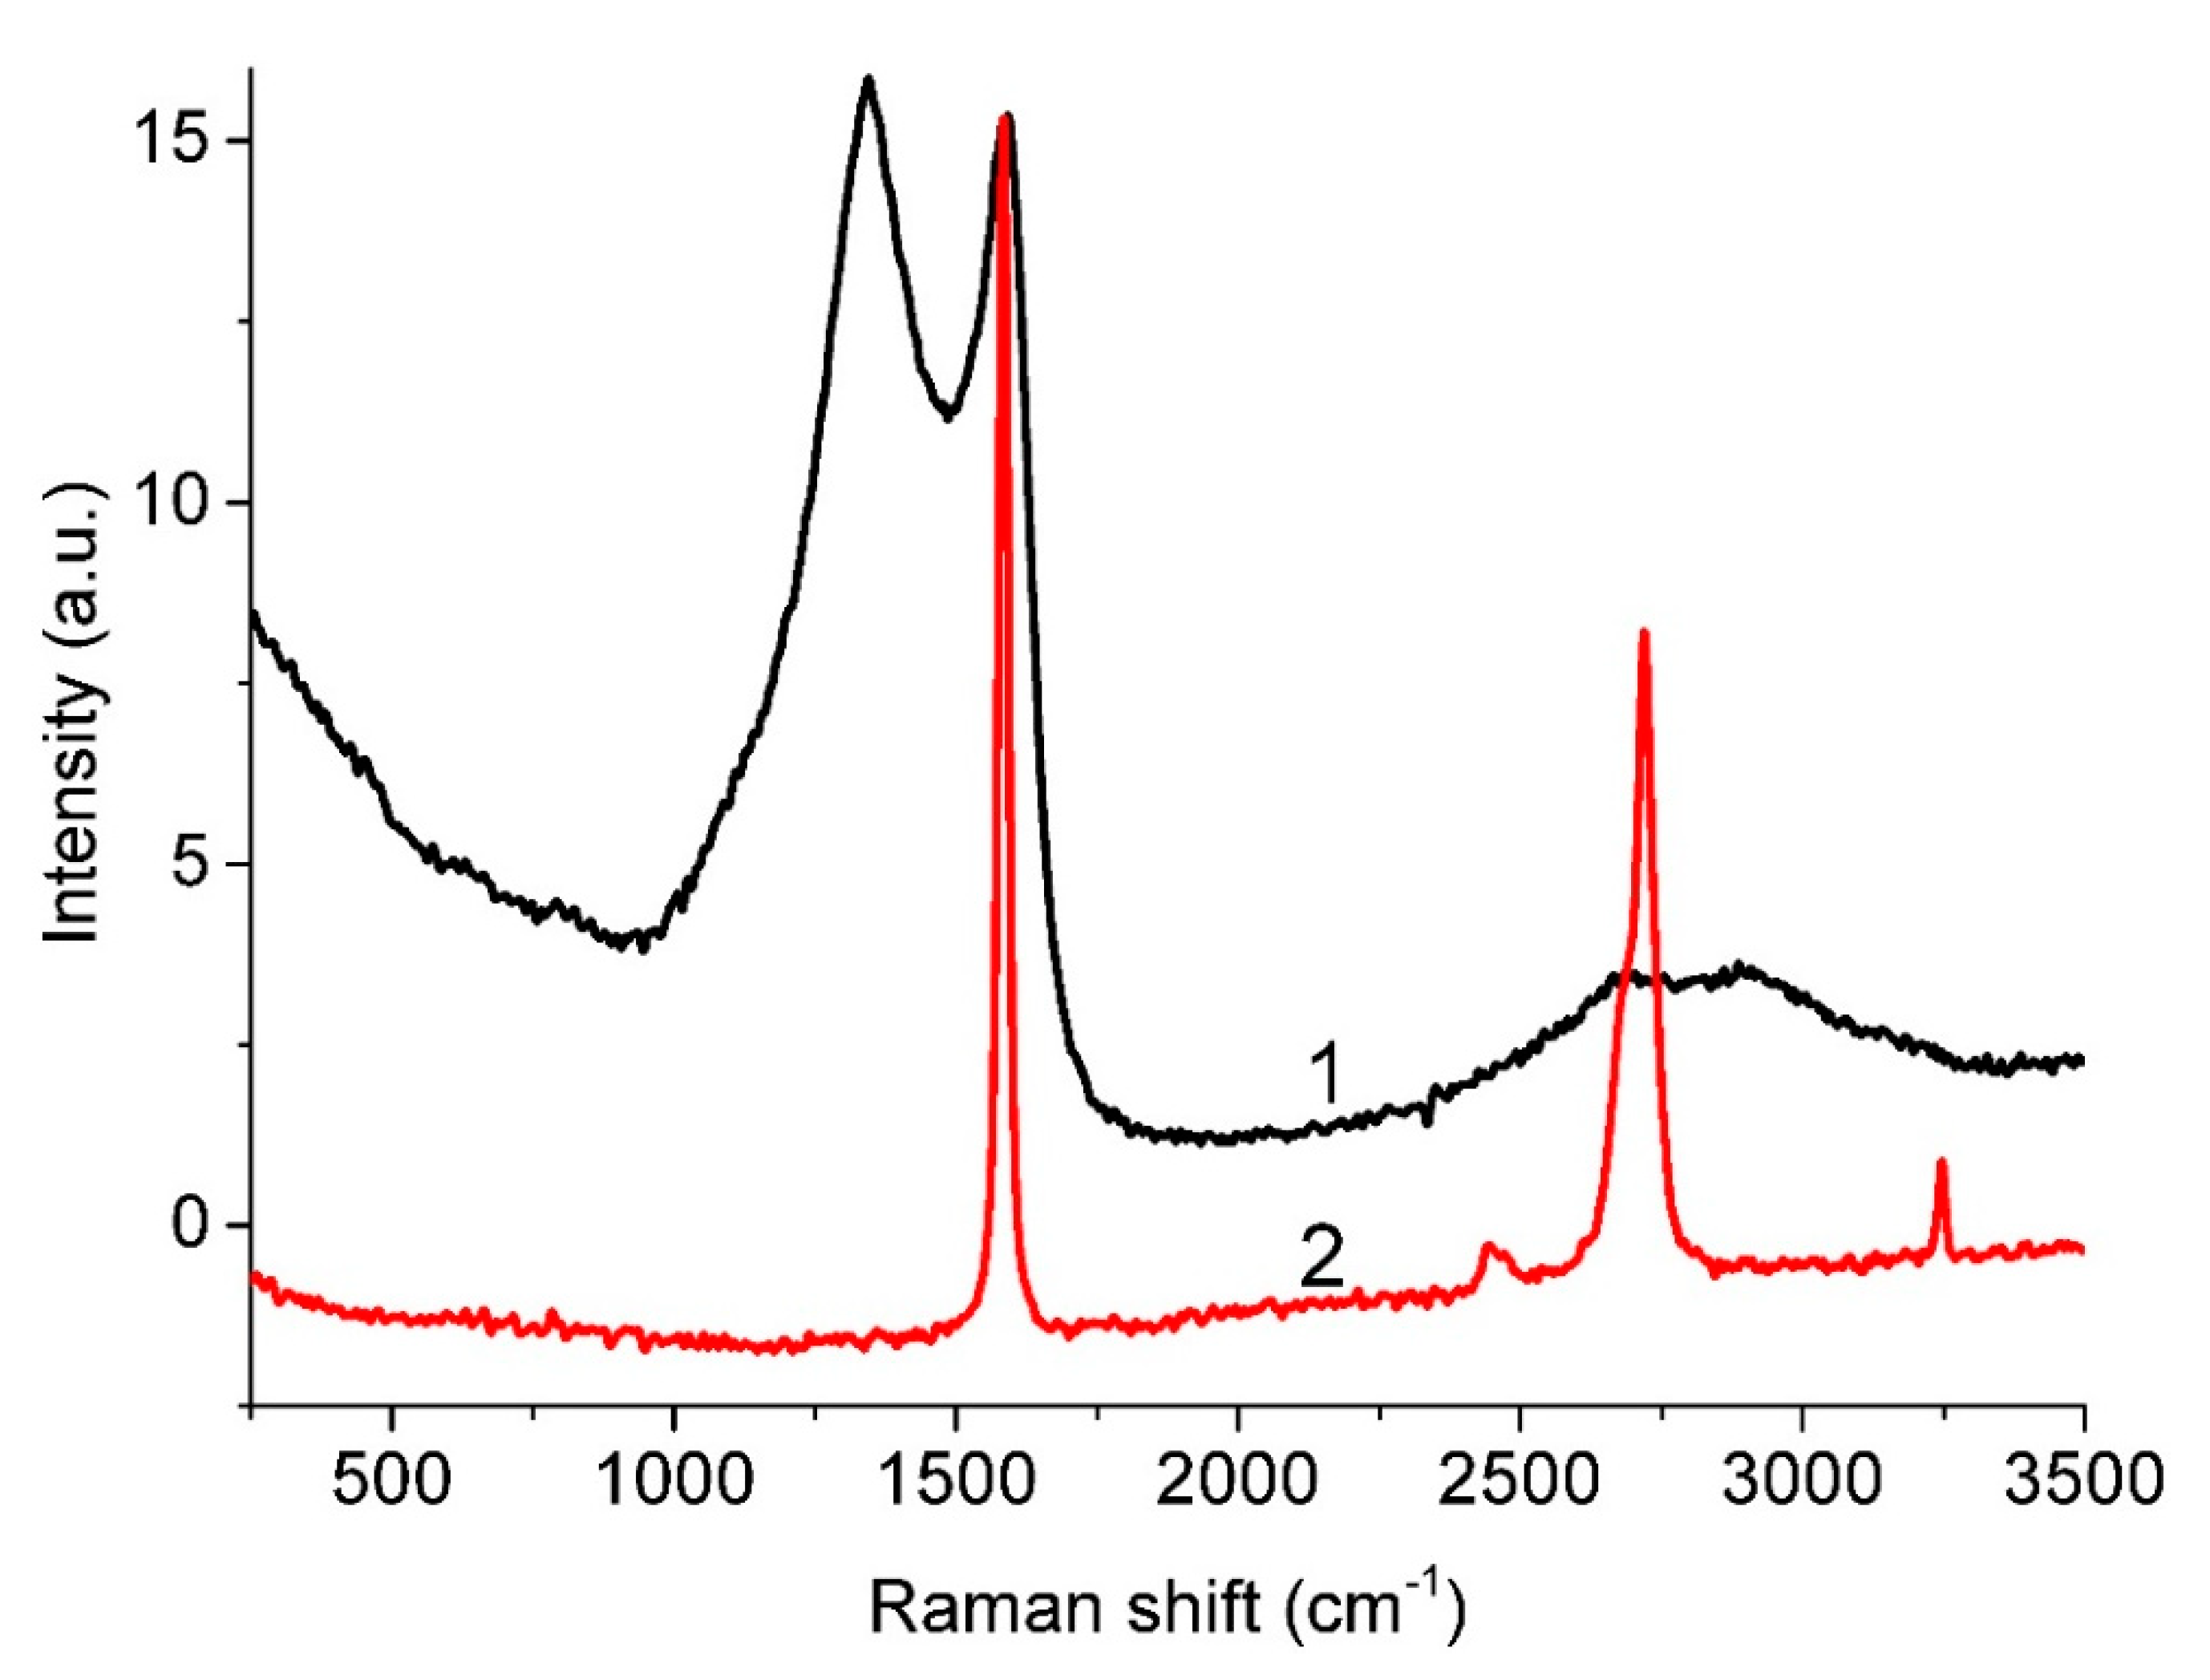
Raman spectroscopy is a powerful technique for the investigation of carbon materials [56] and can be used for the identification of different carbon structures. For example, the vibrational features related to the near-linear arrangement of carbon atoms are usually within the 1800–2200 cm−1 spectral region [57,58,59] and are well above the G and D bands (1300–1600 cm−1) [60]. Isolated sp-carbon species are linear structures with either alternating single and triple bonds (−C≡C−)n, called polyenes, or with identical double bonds (=C=C=)n, called cumulenes [61]. Zhao et al. reported on the experimental fabrication of linear carbon chains, which were shown to be inside double-walled carbon nanotubes of 0.7 nm in diameter [62]. Three characteristic Raman shift peaks were observed in the range 1790 cm−1 to 1860 cm−1. The production and characterization of a form of amorphous carbon films with sp/sp2 hybridization (the atomic fraction of sp hybridized species was ≥ 20%) has also been reported [63]. In the Raman spectra of these films, the cumulene and polyynes structures corresponded to the peaks at about 1980 cm−1 and 2100 cm−1, respectively. Figure 4 compares the spectrum of our sample and the spectrum of highly oriented pyrolytic graphite (HOPG). As can be seen, both spectra lack peaks in the range 1800–2200 cm−1; therefore, one may conclude that there are no one-dimensional carbon chains in our sample.
Furthermore, it was also reported [56] that, in the Raman spectra excited by 514.5 nm radiation, the cross section of the sp2 phase is higher, by a factor of 50–250, than the cross section of the sp3 phase. Consequently, the direct determination of the sp3/sp2 ratio from their spectrum is impossible. Since the presence of the sp3 phase can affect the G peak position, only qualitative estimates can be made.
Figure 5 presents the fitting of the observed spectrum in the region of 800–1800 cm−1 by five functions, whose parameters are given in Table 3. According to the correlation between the positions of peaks D and D* and the oxygen content given in [52,64], the oxygen content in rGO, which presents in our film, is in the range from 0 mass.% (D” position) to 17 mass.% (D* position). A relatively high uncertainty in the oxygen content estimates obtained by this technique is due to the spread of points on the correlation graph [64].
The ratio between the D and G band intensities (ID/IG) can serve as a disorder measure in the carbon lattice and can be used [65] for evaluating the size of sp2-domains La as follows:
La = (2.4 × 10⁻¹⁰) λ4L (ID/IG)1
where λL is the wavelength of the exciting laser. It is worth noting that the La value for our carbon material evaluated according to Equation (2) equals to 7 nm.
The boundaries of such domains can be considered as sp2-lattice defects, in particular, they may be formed by sp3 C atoms located nearby. In the literature, there are various estimates for the C sp3 concentration obtained from the Raman spectra in different ways. It was noted [66] that the presence of 20% C(sp3) atoms leads to a decrease in the shift of the G peak from 1600 cm−1 to 1510 cm−1 in the carbon films with a low content of hydrogen and nitrogen. In our case, the position of the G peak indicates a low fraction of sp3 carbon atoms.

3.6. XPS

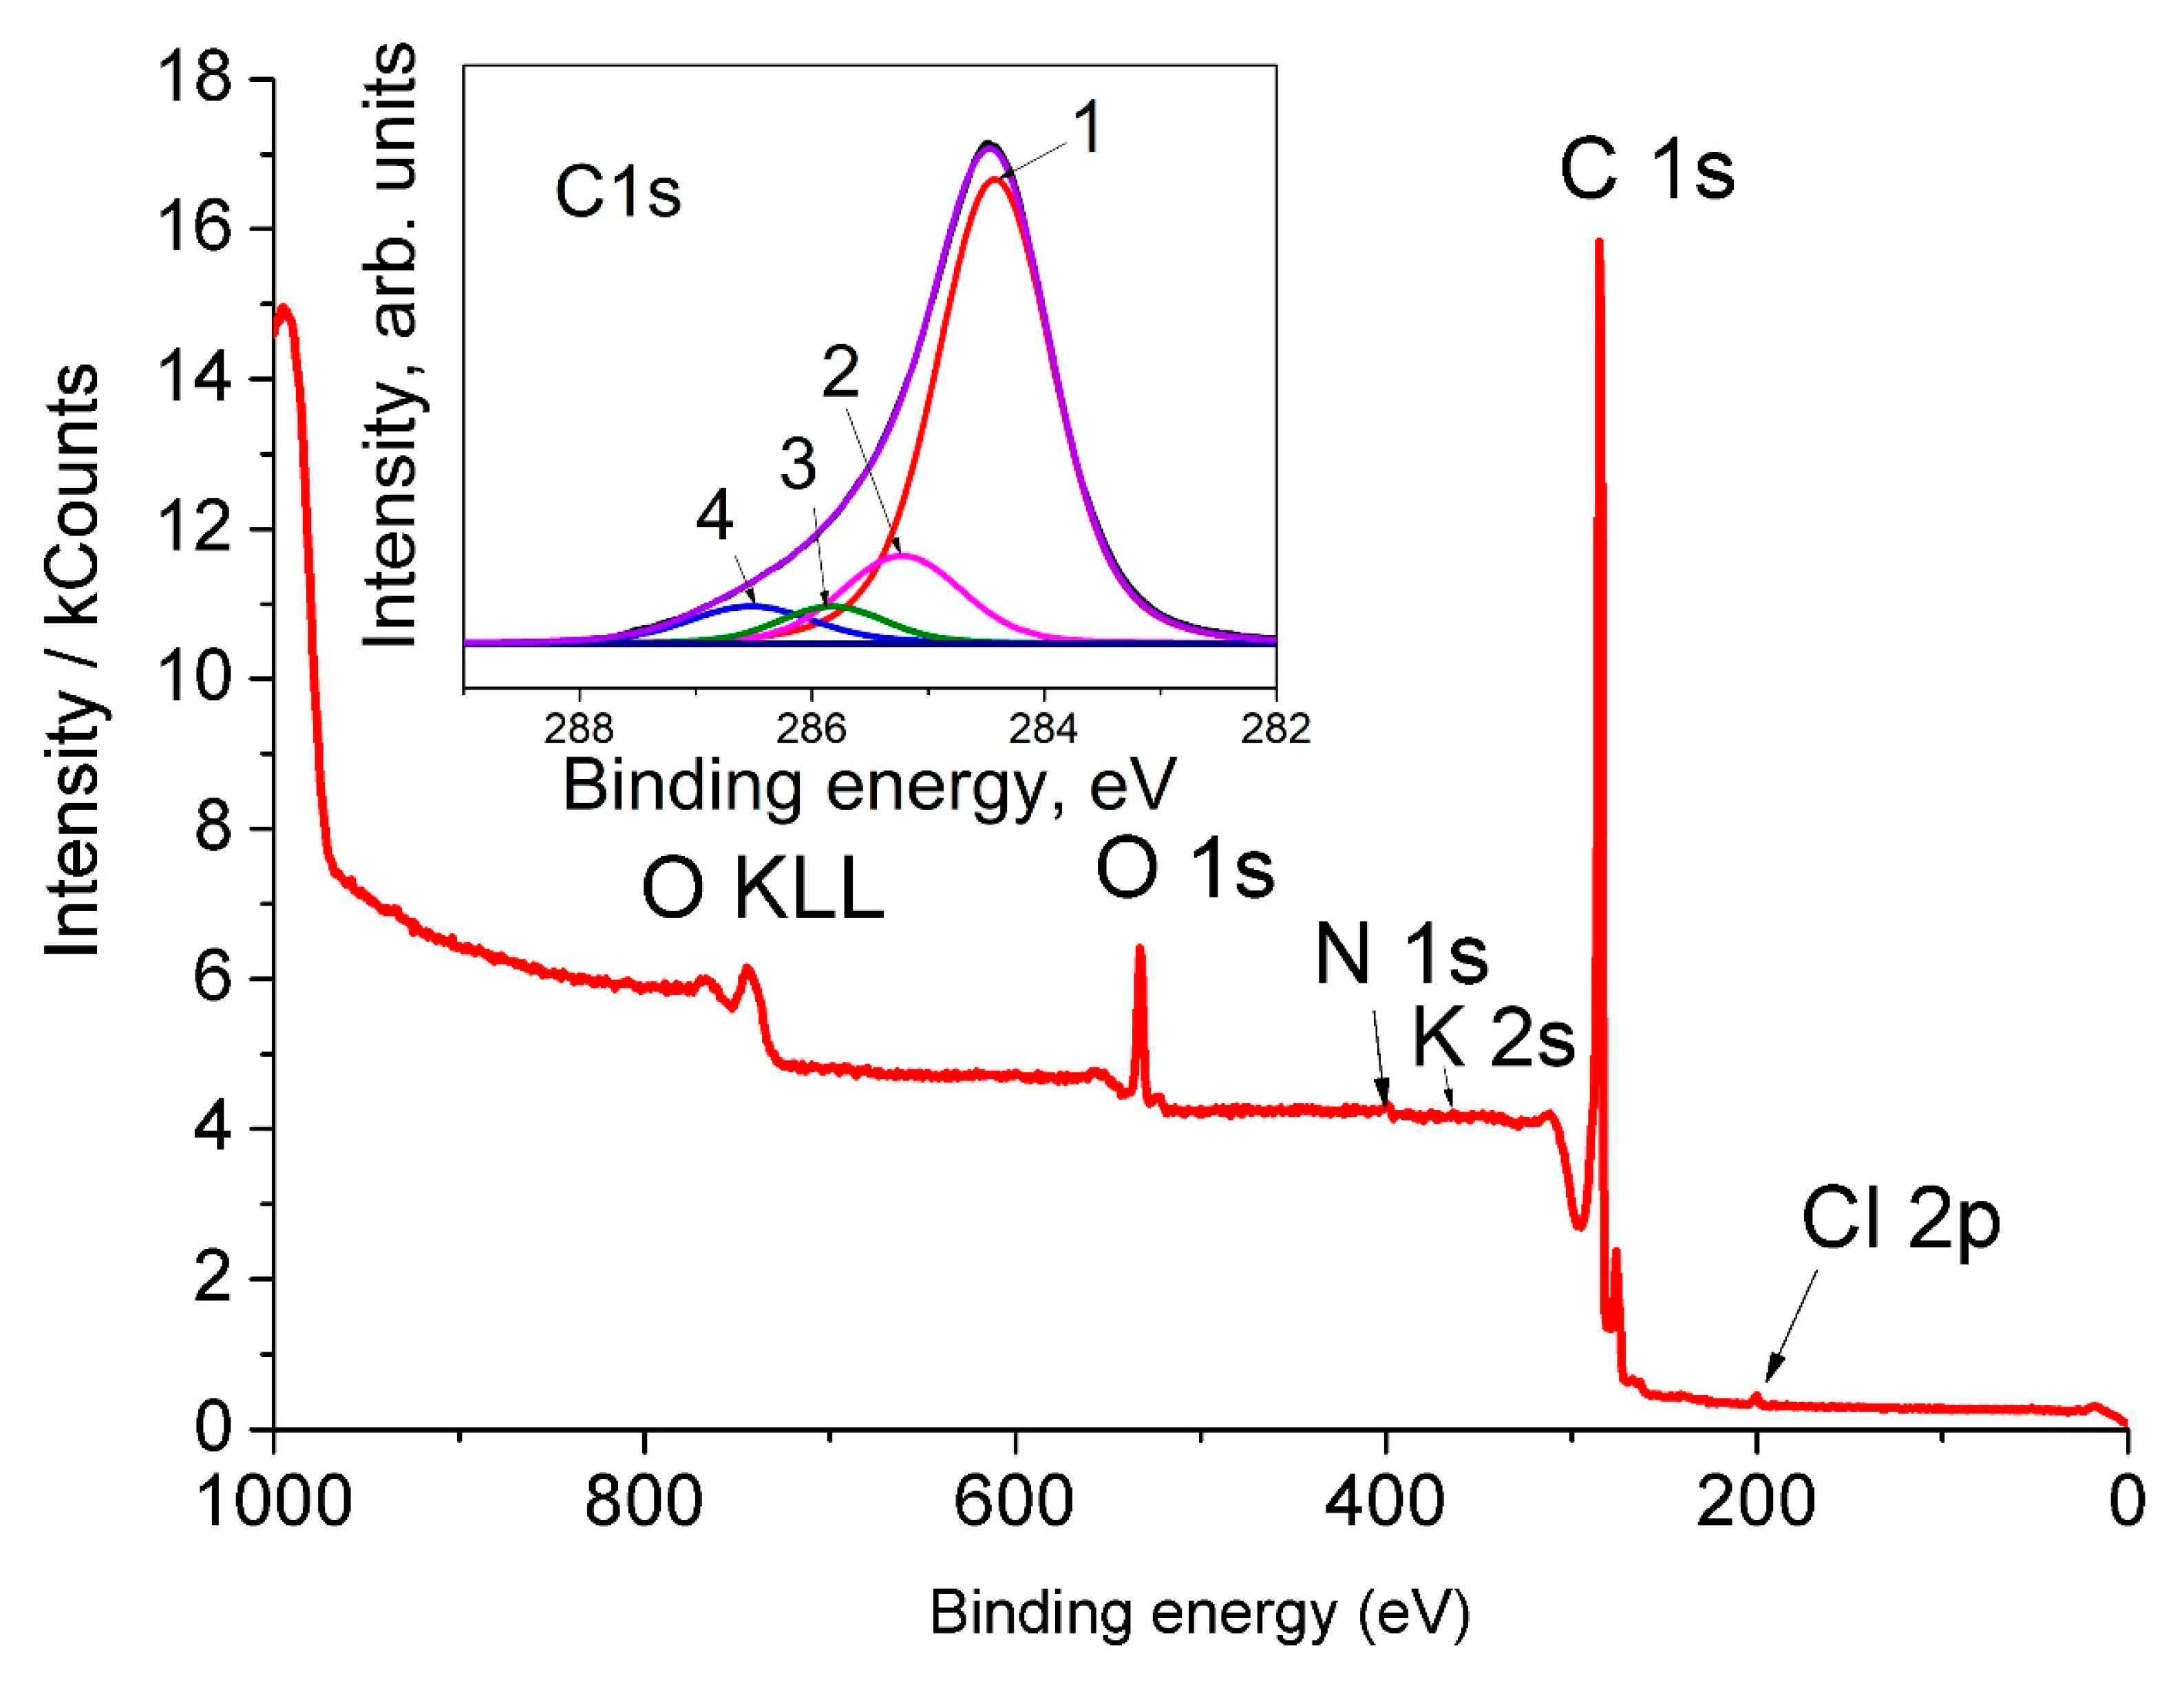
The survey XPS spectrum of AC-TR contains the peaks which are mainly due to carbon and oxygen (see Figure 6). The parameters of the C1s peak decomposition are presented in Table 2. It can be seen that oxygen in the sample can belong to various functional groups. In addition to an identification of oxygen-containing groups from an analysis of the high-resolution C1s spectra, these spectra could be used to determine the sp3/sp2 ratio because the energy intervals between the C1s peaks corresponding to the C(sp2) and C(sp3) states are in the range from 0.4 eV [56] to 0.9 eV [67]. Therefore, to determine the sp3/sp2 ratio, one should decompose the C1s peak into two or more peaks. There is no single approach to such a spectrum decomposition and, as a rule, the peak asymmetry is not considered. For example, the intensities of the peaks and the background can be varied, and the positions of the peaks and their half-widths were fixed [56]. Peaks with bond energies of more than 285.1 eV were attributed to carbon atoms, which bond with oxygen [67].
The inset in Figure 6 shows the high-energy resolution C1s spectrum of AC-TR after a background subtraction. The results of the C1s peak deconvolution performed by using mixed Gauss-Lorentzian functions are presented in Table 4. The assignment of individual peaks was done in accordance with the previous work [68]. It can be seen from Table 4 that the concentration of C(sp3) in AC-TR is 20%.

3.7. XAES

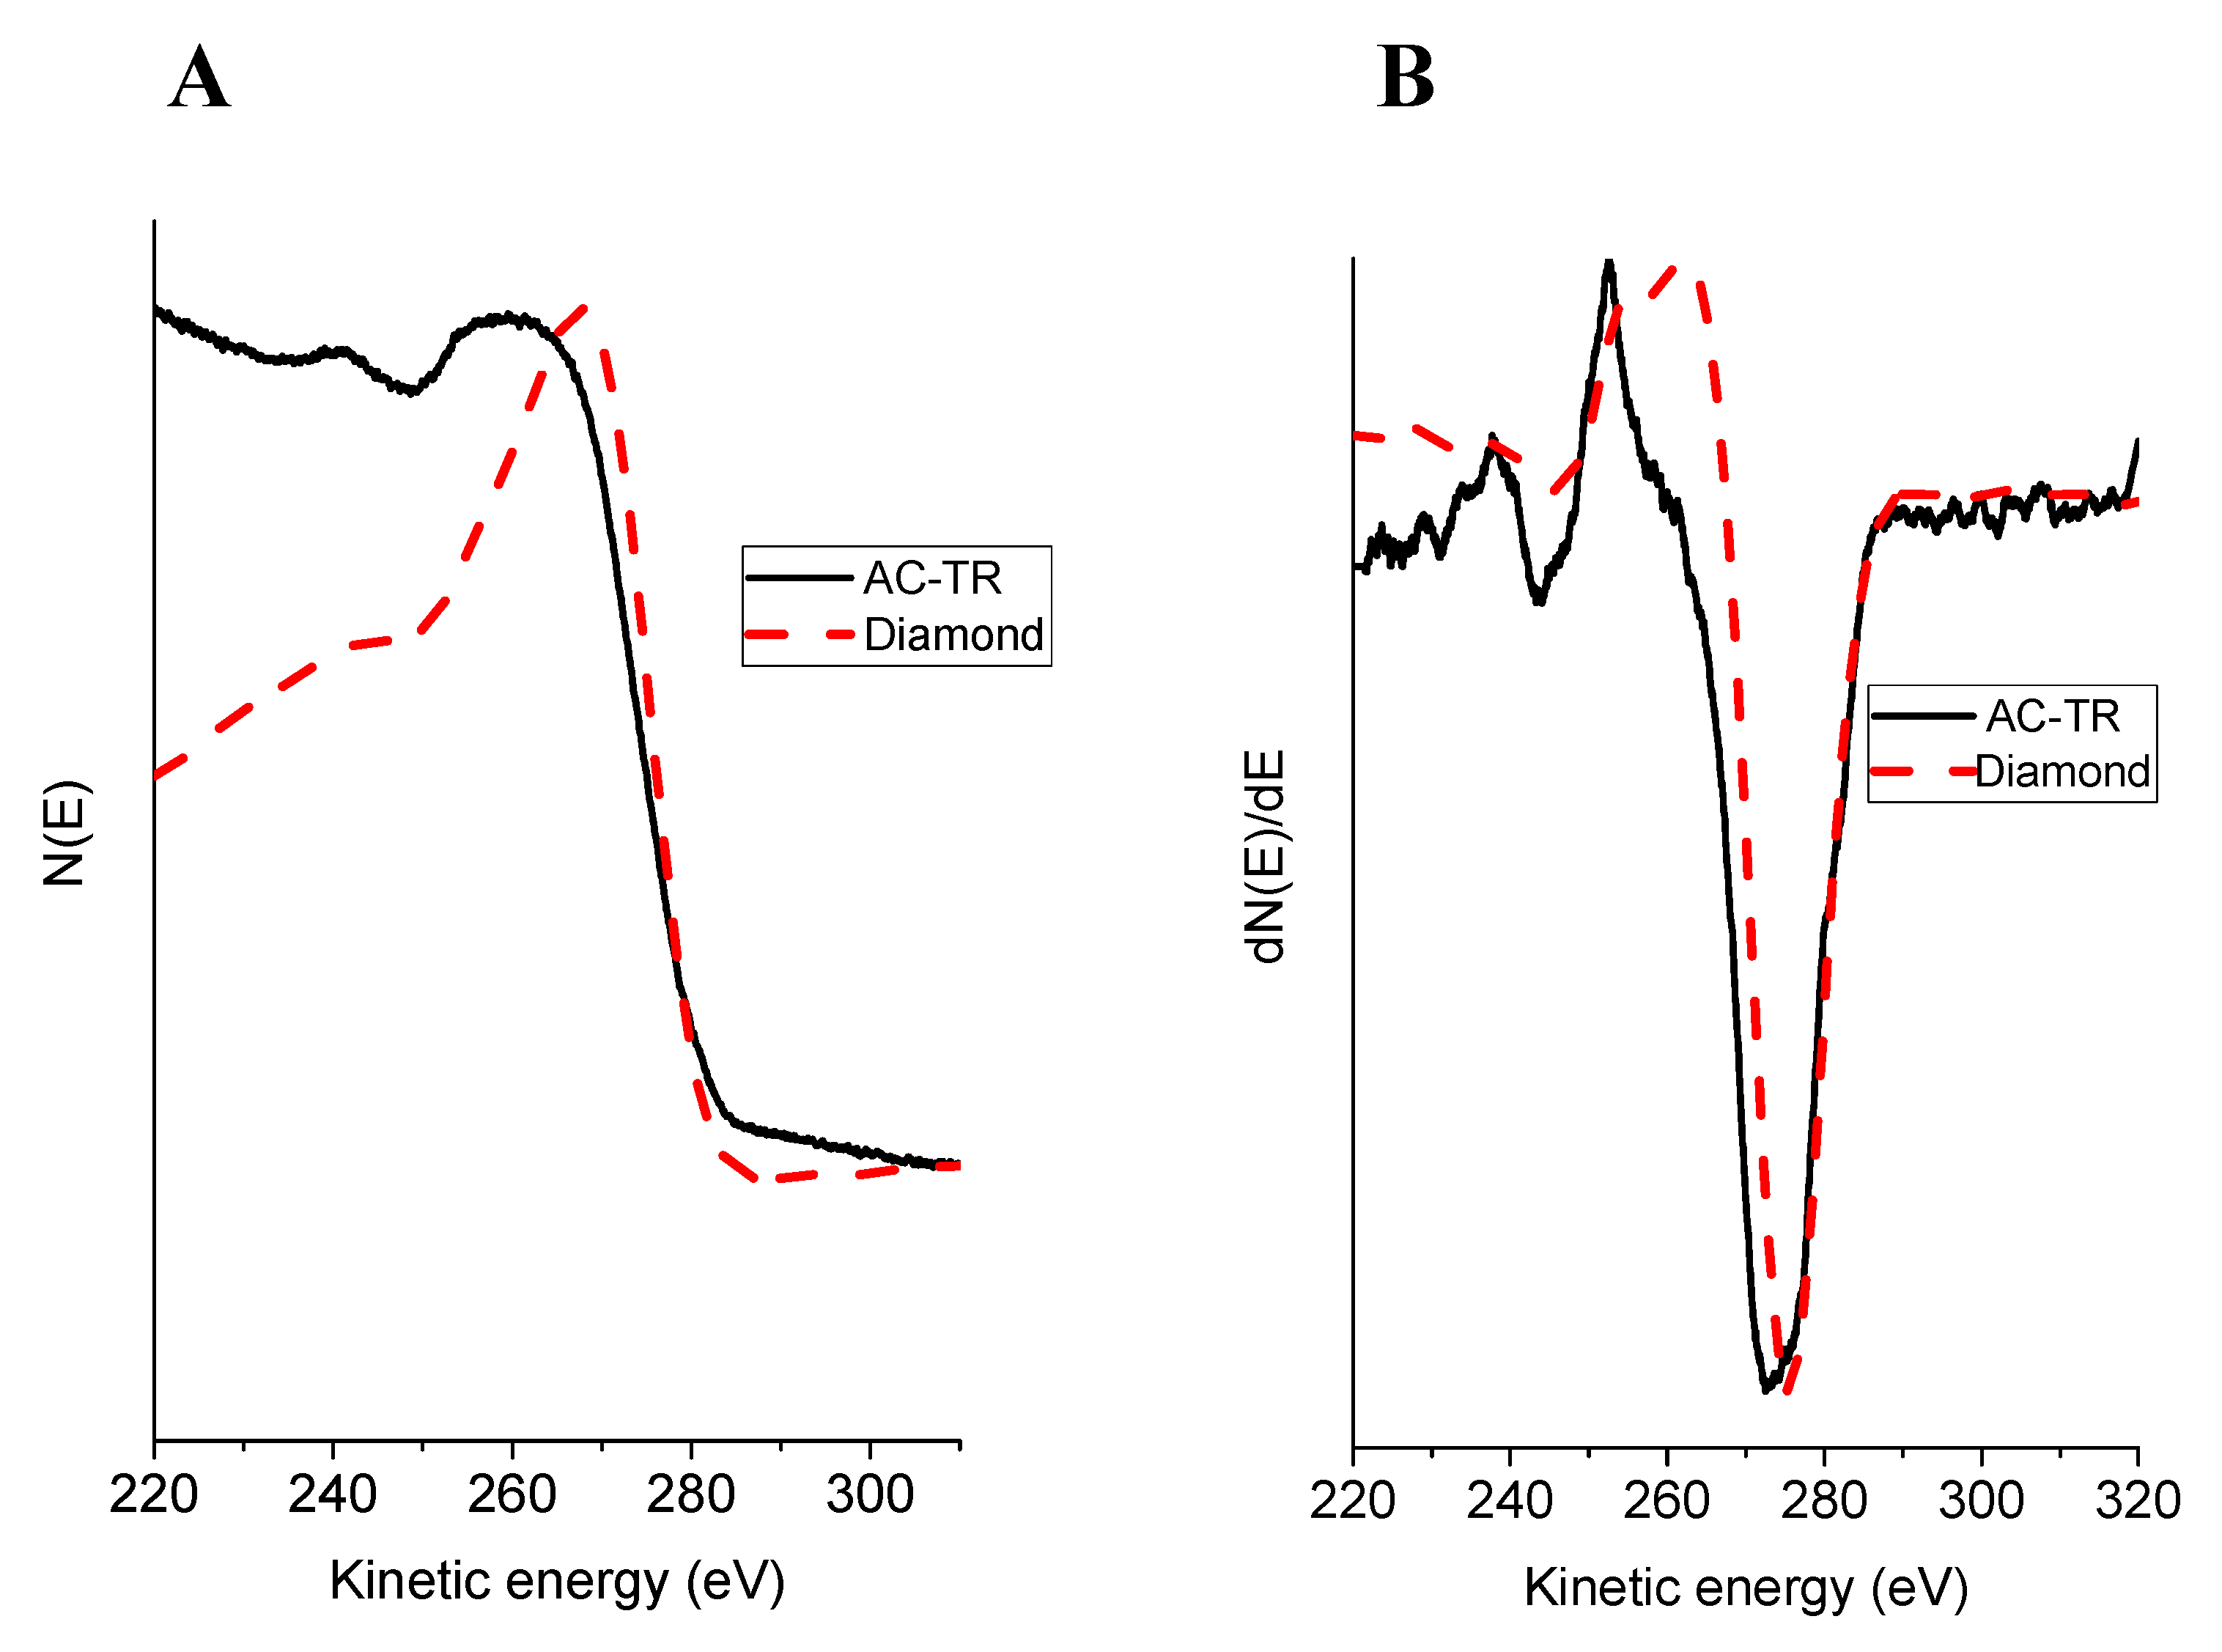
A recent method [68] for estimating the sp3/sp2 ratio in carbon materials from their C KVV Auger spectra excited by the X-ray radiation was developed based on the previously proposed method [69]. The method is based on measuring the energy difference between the maximum and the minimum of the first derivative C KVV Auger spectra. This difference, labeled as D, can be used for evaluating the sp3/sp2 ratio using a linear interpolation of the respective values for diamond (100% of sp3 bonds) and graphite (100% of sp2 bonds). The D value estimate for C (sp3) of 13.2 eV can be considered to be reliable. The D value for C(sp2) depends on the oxygen content in a sample. Thus, different D values of 23.1 eV and 18.0 eV were determined [68] for HOPG samples with the oxygen content of 0.0 at. % and 7.7 at. %, respectively.
Figure 7 displays the measured C KVV Auger spectrum and its first derivative for the sample under study. For comparison, the C KVV spectra of a diamond are shown as the dotted lines. The measured D value of 19.6 eV for the AC-TR corresponds to 65% of C(sp2) when calibrated against the HOPG sample with the oxygen content of 0 at. %. In our sample, the oxygen content according to XPS analysis is 4.69 at. % (see Table 2). Assuming a linear dependence of the slope of the calibration curve on the oxygen content, the estimate for the of C(sp2) concentration increases to 94%.

3.8. Plasmonic REELS

The AC-TR samples with SSA > 3000 m2/g were investigated using the EELS technique only in two studies [11,31]. This technique is widely used for the characterization of carbon materials. The most often studied are the losses near the C–K edge, i.e., the losses associated with the excitation from the lowest occupied level of the carbon atom to its lowest vacant level. Practical aspects of the quantification of sp2-hybridized carbon atoms in the case of diamond-like carbon by electron energy loss spectroscopy are described in [70] and the EELS spectra for carbon materials with different sp3/sp2 ratios can be found in recently published papers [55,71,72]. Note that to quantitatively determine the sp3/sp2 ratio, it is necessary to separate the loss spectrum from the usually high background (losses due to the multiple scattering). Background subtraction can be performed in different ways that makes quantitative estimates somewhat arbitrary. The magnitude of errors arising from background subtraction in the abovementioned works was not indicated.
After background subtraction, the method of ‘two-window intensity-ratio’ is commonly used for the assessments of the sp3/sp2 ratio [73]. It is believed that the ΔEπ and ΔEσ windows are entirely due to the 1s → π* and 1s → σ* transitions, respectively, and the main problem is the choice of the energy window width. There is no single approach for such a choice that makes one expect that the error in determining the sp3/sp2 ratio using this method is large. In a study [74] where a more accurate method of fitting was used for separating the π* and σ* parts of the C–K edge spectrum, it was found that the error related with the fitting parameters exceeds 10%. One can anticipate that the error is also larger than 10% if the simpler two-window method is used. Other common methods for determining the sp3/sp2 ratio from a carbon-K edge spectrum were considered in [75]. A method was proposed, which was supposed to provide good results on a wide range of samples and should be superior to routine extraction of sp2 fractions of carbon materials. This method was used [76] in combination with multi-wavelength Raman spectroscopy to study the transformations that occur during the annealing of a C–H film. This work demonstrated the importance of combining several techniques for extracting reliable information on hybridization of carbon atoms. Changes in the shape of the carbon–K edge spectrum of graphene oxide during heating in the range from 70 °C to 1200 °C was analyzed in [77]. It was found that the sp2 fraction of carbon atoms did not even exceed 85% in the sample annealed at 1200 °C. The results of evaluating the C(sp3) content in AC with SSA > 3000 m2/g (2%, see [11]) are presented above. In [31], the contents of C(sp3) for two samples of AC with SSA > 3000 m2/g estimated by this method were 5% and 6%, respectively.
Figure 8 shows the reflection EELS spectra for the sample under study and graphite near the elastic peak. The spectra were normalized to the elastic peak intensity and were not further processed. The peak assignment was carried out according to the literature data [78,79,80,81,82,83,84,85,86] and the peak positions on the energy-loss scale are given in Table 5.
As is known [87], the EELS spectrum of single-layer graphene has two maxima at 4.7 eV (π-plasmon) and 14.5 eV (σ + π-plasmon). With an increase in the number of layers, the maxima move towards higher energies. The limitation of this movement is obvious and corresponds to the position of the plasmon peaks in graphite (see Table 5). Based on these concepts, one can assert that the valence electrons of several graphene layers take part in the plasma oscillations in the sample under study. However, their density is less than that of valence electrons in graphite.
Indeed, the frequency of plasma oscillations (ωp) of all valence electrons in a solid can be calculated according to the following equation [88]:
ωp = (4 πne2/core)1/2
where n is the density of valence electrons and κcore is a parameter related to the polarizability of internal electrons. For carbon materials, the value of κcore can be assumed to be unity (for example, κcore = 1.0018 for graphite [79]) and, therefore, n ~ (ħωp)2. A decrease in the density of valence electrons is possibly associated with an increase in the interlayer distance of the material under study, compared to that in graphite.
In principle, the ratio of the π-plasmon and (σ + π)-plasmon intensities (Iπ/Iσ + π) can be used to estimate the effective number of electrons per carbon atom (Ñπ), according to the following formula:
Ñπ = k(Iπ/Iσ + π)
The k value was found with an assumption that, for graphite, Ñπ = 1. The application of Equation (4) is complicated by the absence of generally accepted rules for background subtraction. In the present work, we used background subtraction according to [53] when calculating the integral intensities of plasmons. From the data in Table 5, it is easy to find that Ñπ = 0.93 for the sample under study. Note that this value is valid to those spatial regions of the sample where plasma oscillations are localized. Indeed, the energy of 25.0 eV of the main plasmon in the sample under study does not correspond to its low specific density ρ = 0.34 g/cm3. Therefore, under the assumption
ħωσ + π~k(ρ)1/2
the value ħωσ + π = 10.3 eV, when calibrated against that of graphite, whose ρ = 2.25 g/cm3. This value may be compared to that of fullerite C60 whose ρ = 1.65 g/cm3 and the measured ħωσ + π value is 25 eV [89]. One could expect that plasma oscillations are localized on the fullerene-like pore walls in the sample under study.

4. Conclusions

Our detailed study of the AC-TR structure has shown that this material can be attributed to the sp2 class of materials with some inclusion of out-of-plane sp2-hybridized carbon atoms. The C(sp3) percentage in the AC-TR material obtained by using of the plasmonic REELS and XAES techniques is 6–7%, which is in good agreement with that of [31] and slightly exceed the estimate made in [11]. Our value of the C(sp3) content in 20%, based on the XPS measurements, seems to be overestimated because symmetric fitting functions appear to not provide a proper description of the C1s spectrum shape. To take into account this asymmetry, it is necessary to use the Doniach-Sunjic functions [90]. According to an analysis based on the Raman spectroscopy data, the content of C(sp3) atoms is significantly lower than 20%. The presence of hydrogen and oxygen atoms bonded to carbon atoms inside the graphene domains leads to the transitions from C(sp2) to C(sp3) atoms. This is a key mechanism for the formation of the sp3 hybridization of carbon atoms in the AC with SSA exceeding 3000 m2/g.
One of the most interesting results of the present work is that there is nographite-like (002) reflection in the diffraction patterns of AC-TR, which typically is the most intense for the sp2 carbon materials. This means that our sample consists mainly of small single-layered differently folded carbon sheets and does not contain multilayer graphene. According to the data obtained from our measured Raman spectra, the average size of graphene domains is about 7 nm. The plasmon peaks were found to be shifted toward lower energies compared to those of graphite, but these shifts are significantly smaller than could be expected on the basis of the measured specific density of the sample. This can be related to the substantial localization of the plasmonic oscillations.
In conclusion, we note that the electronic and spatial structure of such a promising material as highly porous activated carbon with SSA > 3000 m2/g and a sufficiently high electrical conductivity was not yet studied in detail. The results of this study of a representative of this class of materials carried out by using various experimental methods allow one to assert that the content of sp3 carbon atoms in this sp2 material is less than 10%.

Author Contributions

Y.M.S.: conceptualization, E.N.K.: visualization, V.I.K.: formal analysis, I.I.K.: investigation, D.Y.K.: formal analysis, A.V.M.: investigation, A.G.T.: investigation, G.L.G.: technical support. All authors have read and agreed to the published version of the manuscript.

Funding

This work was funded by the Ministry of Science and Higher Education of the Russian Federation in the frame of state tasks (state registration Nos AAAA-A19-119061890019-5, AAAA-A19-119032690060-9 and 075-00355-21-00), state program of basic research “For the long-term development and ensuring the competitiveness of society and the state” (47 GP) on the base of the universities, the plan of basic scientific research No. 718/20 dated 03/06/2020 (project No. 0718-2020-0036).

Data Availability Statement

Data available in a publicly accessible repository.

Acknowledgments

The authors greatly appreciate the use of the equipment of the Multi-User Analytical Center of IPCP RAS, and Chernogolovka Scientific Center RAS.

Conflicts of Interest

The authors declare no conflict of interest.

References

  1. Li, L.; Quinlivan, P.A.; Knappe, D.R.U. Effects of Activated Carbon Surface Chemistry and Pore Structure on the Adsorption of Organic Contaminants from Aqueous Solution. Carbon 2002, 40, 2085–2100. [Google Scholar] [CrossRef]
  2. Quinlivan, P.A.; Li, L.; Knappe, D.R.U. Effects of Activated Carbon Characteristics on the Simultaneous Adsorption of Aqueous Organic Micropollutants and Natural Organic Matter. Water Res. 2005, 39, 1663–1673. [Google Scholar] [CrossRef] [PubMed]
  3. Fletcher, A.J.; Yüzak, Y.; Thomas, K.M. Adsorption and Desorption Kinetics for Hydrophilic and Hydrophobic Vapors on Activated Carbon. Carbon 2006, 44, 989–1004. [Google Scholar] [CrossRef]
  4. Furuya, E.G.; Chang, H.T.; Miura, Y.; Noll, K.E. A Fundamental Analysis of the Isotherm for the Adsorption of Phenolic Compounds on Activated Carbon. Sep. Purif. Technol. 1997, 11, 69–78. [Google Scholar] [CrossRef]
  5. Gamby, J.; Taberna, P.L.; Simon, P.; Fauvarque, J.F.; Chesneau, M. Studies and Characterisations of Various Activated Carbons Used for Carbon/carbon Supercapacitors. J. Power Sources 2001, 101, 109–116. [Google Scholar] [CrossRef]
  6. Nitta, N.; Wu, F.; Lee, J.T.; Yushin, G. Li-Ion Battery Materials: Present and Future. Mater. Today 2015, 18, 252–264. [Google Scholar] [CrossRef]
  7. Du Pasquier, A.; Plitz, I.; Menocal, S.; Amatucci, G. A Comparative Study of Li-Ion Battery, Supercapacitor and Nonaqueous Asymmetric Hybrid Devices for Automotive Applications. J. Power Sources 2003, 115, 171–178. [Google Scholar] [CrossRef]
  8. Chen, J.; Gao, X.; Song, W. Effect of Various Carbon Nanofillers and Different Filler Aspect Ratios on the Thermal Conductivity of Epoxy Matrix Nanocomposites. Results Phys. 2019, 15, 102771. [Google Scholar] [CrossRef]
  9. Zhang, W.; Dehghani-Sanij, A.A.; Blackburn, R.S. Carbon Based Conductive Polymer Composites. J. Mater. Sci. 2007, 42, 3408–3418. [Google Scholar] [CrossRef]
  10. Lebedev, S.M.; Gefle, O.S. Electrical and Thermal Properties of Polymer Composites Based on Polyvinylidene Fluoride. Russ. Phys. J. 2017, 60, 115–121. [Google Scholar] [CrossRef]
  11. Zhu, Y.; Murali, S.; Stoller, M.D.; Ganesh, K.J.; Cai, W.; Ferreira, P.J.; Pirkle, A.; Wallace, R.M.; Cychosz, K.A.; Thommes, M.; et al. Carbon-Based Supercapacitors Produced by Activation of Graphene. Science 2011, 332, 1537–1541. [Google Scholar] [CrossRef] [Green Version]
  12. Matranga, K.R.; Myers, A.L.; Glandt, E.D. Storage of Natural Gas by Adsorption on Activated Carbon. Chem. Eng. Sci. 1992, 47, 1569–1579. [Google Scholar] [CrossRef]
  13. Wang, Q.; Wang, X.; Chai, Z.; Hu, W. Low-Temperature Plasma Synthesis of Carbon Nanotubes and Graphene Based Materials and Their Fuel Cell Applications. Chem. Soc. Rev. 2013, 42, 8821–8834. [Google Scholar] [CrossRef]
  14. Chae, H.K.; Siberio-Pérez, D.Y.; Kim, J.; Go, Y.; Eddaoudi, M.; Matzger, A.J.; O’Keeffe, M.; Yaghi, O.M. A Route to High Surface Area, Porosity and Inclusion of Large Molecules in Crystals. Nature 2004, 427, 523–527. [Google Scholar] [CrossRef]
  15. Kaneko, K.; Ishii, C.; Ruike, M.; Kuwabara, H. Origin of Superhigh Surface Area and Microcrystalline Graphitic Structures of Activated Carbons. Carbon 1992, 30, 1075–1088. [Google Scholar] [CrossRef]
  16. Cranford, S.W.; Buehler, M.J. Packing Efficiency and Accessible Surface Area of Crumpled Graphene. Phys. Rev. B Condens. Matter 2011, 84, 205451. [Google Scholar] [CrossRef]
  17. Gauden, P.A.; Terzyk, A.P.; Furmaniak, S.; Harris, P.J.F.; Kowalczyk, P. BET Surface Area of Carbonaceous Adsorbents—Verification Using Geometric Considerations and GCMC Simulations on Virtual Porous Carbon Models. Appl. Surf. Sci. 2010, 256, 5204–5209. [Google Scholar] [CrossRef]
  18. De Lange, M.F.; Lin, L.-C.; Gascon, J.; Vlugt, T.J.H.; Kapteijn, F. Assessing the Surface Area of Porous Solids: Limitations, Probe Molecules, and Methods. Langmuir 2016, 32, 12664–12675. [Google Scholar] [CrossRef]
  19. Murali, S.; Potts, J.R.; Stoller, S.; Park, J.; Stoller, M.D.; Zhang, L.L.; Zhu, Y.; Ruoff, R.S. Preparation of Activated Graphene and Effect of Activation Parameters on Electrochemical Capacitance. Carbon 2012, 50, 3482–3485. [Google Scholar] [CrossRef]
  20. Kierzek, K.; Frackowiak, E.; Lota, G.; Gryglewicz, G.; Machnikowski, J. Electrochemical Capacitors Based on Highly Porous Carbons Prepared by KOH Activation. Electrochim. Acta 2004, 49, 515–523. [Google Scholar] [CrossRef]
  21. Alonso, A.; Ruiz, V.; Blanco, C.; Santamaría, R.; Granda, M.; Menéndez, R.; de Jager, S.G.E. Activated Carbon Produced from Sasol-Lurgi Gasifier Pitch and Its Application as Electrodes in Supercapacitors. Carbon 2006, 44, 441–446. [Google Scholar] [CrossRef] [Green Version]
  22. Du, S.-H.; Wang, L.-Q.; Fu, X.-T.; Chen, M.-M.; Wang, C.-Y. Hierarchical Porous Carbon Microspheres Derived from Porous Starch for Use in High-Rate Electrochemical Double-Layer Capacitors. Bioresour. Technol. 2013, 139, 406–409. [Google Scholar] [CrossRef]
  23. Lillo-Ródenas, M.A.; Marco-Lozar, J.P.; Cazorla-Amorós, D.; Linares-Solano, A. Activated Carbons Prepared by Pyrolysis of Mixtures of Carbon Precursor/alkaline Hydroxide. J. Anal. Appl. Pyrolysis 2007, 80, 166–174. [Google Scholar] [CrossRef]
  24. Xu, B.; Wu, F.; Chen, R.; Cao, G.; Chen, S.; Yang, Y. Mesoporous Activated Carbon Fiber as Electrode Material for High-Performance Electrochemical Double Layer Capacitors with Ionic Liquid Electrolyte. J. Power Sources 2010, 195, 2118–2124. [Google Scholar] [CrossRef]
  25. Yang, C.-S.; Jang, Y.S.; Jeong, H.K. Bamboo-Based Activated Carbon for Supercapacitor Applications. Curr. Appl. Phys. 2014, 14, 1616–1620. [Google Scholar] [CrossRef]
  26. Gao, Y.; Zhang, W.; Yue, Q.; Gao, B.; Sun, Y.; Kong, J.; Zhao, P. Simple Synthesis of Hierarchical Porous Carbon from Enteromorpha Prolifera by a Self-Template Method for Supercapacitor Electrodes. J. Power Sources 2014, 270, 403–410. [Google Scholar] [CrossRef]
  27. Liu, X.; Zhang, C.; Geng, Z.; Cai, M. High-Pressure Hydrogen Storage and Optimizing Fabrication of Corncob-Derived Activated Carbon. Microporous Mesoporous Mater. 2014, 194, 60–65. [Google Scholar] [CrossRef]
  28. Wang, D.; Geng, Z.; Li, B.; Zhang, C. High Performance Electrode Materials for Electric Double-Layer Capacitors Based on Biomass-Derived Activated Carbons. Electrochim. Acta 2015, 173, 377–384. [Google Scholar] [CrossRef]
  29. Liu, D.; Zhang, W.; Lin, H.; Li, Y.; Lu, H.; Wang, Y. A Green Technology for the Preparation of High Capacitance Rice Husk-Based Activated Carbon. J. Clean. Prod. 2016, 112, 1190–1198. [Google Scholar] [CrossRef]
  30. Yu, Y.; Qiao, N.; Wang, D.; Zhu, Q.; Fu, F.; Cao, R.; Wang, R.; Liu, W.; Xu, B. Fluffy Honeycomb-like Activated Carbon from Popcorn with High Surface Area and Well-Developed Porosity for Ultra-High Efficiency Adsorption of Organic Dyes. Bioresour. Technol. 2019, 285, 121340. [Google Scholar] [CrossRef]
  31. Zhang, L.; Zhang, F.; Yang, X.; Long, G.; Wu, Y.; Zhang, T.; Leng, K.; Huang, Y.; Ma, Y.; Yu, A.; et al. Porous 3D Graphene-Based Bulk Materials with Exceptional High Surface Area and Excellent Conductivity for Supercapacitors. Sci. Rep. 2013, 3, 1408. [Google Scholar] [CrossRef] [Green Version]
  32. Fung, A.W.P.; Rao, A.M.; Kuriyama, K.; Dresselhaus, M.S.; Dresselhaus, G.; Endo, M.; Shindo, N. Raman Scattering and Electrical Conductivity in Highly Disordered Activated Carbon Fibers. J. Mater. Res. 1993, 8, 489–500. [Google Scholar] [CrossRef] [Green Version]
  33. Koh, K.; Wong-Foy, A.G.; Matzger, A.J. A Porous Coordination Copolymer with over 5000 m2/g BET Surface Area. J. Am. Chem. Soc. 2009, 131, 4184–4185. [Google Scholar] [CrossRef] [PubMed]
  34. Khan, J.H.; Lin, J.; Young, C.; Matsagar, B.M.; Wu, K.C.W.; Dhepe, P.L.; Islam, M.T.; Rahman, M.M.; Shrestha, L.K.; Alshehri, S.M.; et al. High Surface Area Nanoporous Carbon Derived from High Quality Jute from Bangladesh. Mater. Chem. Phys. 2018, 216, 491–495. [Google Scholar] [CrossRef]
  35. Islam, M.A.; Ahmed, M.J.; Khanday, W.A.; Asif, M.; Hameed, B.H. Mesoporous Activated Coconut Shell-Derived Hydrochar Prepared via Hydrothermal Carbonization-NaOH Activation for Methylene Blue Adsorption. J. Environ. Manag. 2017, 203, 237–244. [Google Scholar] [CrossRef]
  36. Nowicki, P.; Kazmierczak-Razna, J.; Pietrzak, R. Physicochemical and Adsorption Properties of Carbonaceous Sorbents Prepared by Activation of Tropical Fruit Skins with Potassium Carbonate. Mater. Des. 2016, 90, 579–585. [Google Scholar] [CrossRef]
  37. Reffas, A.; Bernardet, V.; David, B.; Reinert, L.; Lehocine, M.B.; Dubois, M.; Batisse, N.; Duclaux, L. Carbons Prepared from Coffee Grounds by H3PO4 Activation: Characterization and Adsorption of Methylene Blue and Nylosan Red N-2RBL. J. Hazard. Mater. 2010, 175, 779–788. [Google Scholar] [CrossRef]
  38. Furukawa, H.; Cordova, K.E.; O’Keeffe, M.; Yaghi, O.M. The Chemistry and Applications of Metal-Organic Frameworks. Science 2013, 341, 1230444. [Google Scholar] [CrossRef] [Green Version]
  39. Kumar, K.V.; Preuss, K.; Titirici, M.-M.; Rodríguez-Reinoso, F. Nanoporous Materials for the Onboard Storage of Natural Gas. Chem. Rev. 2017, 117, 1796–1825. [Google Scholar] [CrossRef]
  40. Düren, T.; Sarkisov, L.; Yaghi, O.M.; Snurr, R.Q. Design of New Materials for Methane Storage. Langmuir 2004, 20, 2683–2689. [Google Scholar] [CrossRef]
  41. Herdes, C.; Sarkisov, L. Computer Simulation of Volatile Organic Compound Adsorption in Atomistic Models of Molecularly Imprinted Polymers. Langmuir 2009, 25, 5352–5359. [Google Scholar] [CrossRef] [PubMed]
  42. Düren, T.; Millange, F.; Férey, G.; Walton, K.S.; Snurr, R.Q. Calculating Geometric Surface Areas as a Characterization Tool for Metal- Organic Frameworks. J. Phys. Chem. C 2007, 111, 15350–15356. [Google Scholar] [CrossRef]
  43. Walton, K.S.; Snurr, R.Q. Applicability of the BET Method for Determining Surface Areas of Microporous Metal- Organic Frameworks. J. Am. Chem. Soc. 2007, 129, 8552–8556. [Google Scholar] [CrossRef] [PubMed]
  44. Bae, Y.-S.; Yazaydin, A.O.; Snurr, R.Q. Evaluation of the BET Method for Determining Surface Areas of MOFs and Zeolites That Contain Ultra-Micropores. Langmuir 2010, 26, 5475–5483. [Google Scholar] [CrossRef] [PubMed]
  45. Sarkisov, L. Accessible Surface Area of Porous Materials: Understanding Theoretical Limits. Adv. Mater. 2012, 24, 3130–3133. [Google Scholar] [CrossRef]
  46. Titantah, J.T.; Lamoen, D. sp3/sp2 Characterization of Carbon Materials from First-Principles Calculations: X-Ray Photoelectron versus High Energy Electron Energy-Loss Spectroscopy Techniques. Carbon 2005, 43, 1311–1316. [Google Scholar] [CrossRef]
  47. Sun, J.; Klechikov, A.; Moise, C.; Prodana, M.; Enachescu, M.; Talyzin, A.V. Molecular Pillar Approach to Grow Vertical Covalent Organic Framework Nanosheets on Graphene: New Hybrid Materials for Energy Storage. Angew. Chem. Int. Ed. 2018, 57, 1034–1038. [Google Scholar] [CrossRef]
  48. Bellucci, L.; Tozzini, V. Engineering 3D Graphene-Based Materials: State of the Art and Perspectives. Molecules 2020, 25, 339. [Google Scholar] [CrossRef] [Green Version]
  49. William, S.; Hummers, J.R.; Offeman, R.E. Preparation of Graphitic Oxide. J. Am. Chem. Soc. 1958, 80, 1339. [Google Scholar]
  50. Shulga, Y.M.; Baskakov, S.A.; Smirnov, V.A.; Shulga, N.Y.; Belay, K.G.; Gutsev, G.L. Graphene Oxide Films as Separators of Polyaniline-Based Supercapacitors. J. Power Sources 2014, 245, 33–36. [Google Scholar] [CrossRef]
  51. Baskakov, S.A.; Baskakova, Y.V.; Lyskov, N.V.; Dremova, N.N.; Irzhak, A.V.; Kumar, Y.; Michtchenok, A.; Shulga, Y.M. Fabrication of Current Collector Using a Composite of Polylactic Acid and Carbon Nano-Material for Metal-Free Supercapacitors with Graphene Oxide Separators and Microwave Exfoliated Graphite Oxide Electrodes. Electrochim. Acta 2018, 260, 557–563. [Google Scholar] [CrossRef]
  52. Claramunt, S.; Varea, A.; López-Díaz, D.; Velázquez, M.M.; Cornet, A.; Cirera, A. The Importance of Interbands on the Interpretation of the Raman Spectrum of Graphene Oxide. J. Phys. Chem. C 2015, 119, 10123–10129. [Google Scholar] [CrossRef]
  53. Végh, J. The Shirley Background Revised. J. Electron Spectrosc. Relat. Phenom. 2006, 151, 159–164. [Google Scholar] [CrossRef]
  54. Shulga, Y.M.; Kabachkov, E.N.; Baskakov, S.A.; Baskakova, Y.V. Doping Graphene Oxide Aerogel with Nitrogen during Reduction with Hydrazine and Low Temperature Annealing in Air. Russ. J. Phys. Chem. A 2019, 93, 296–300. [Google Scholar] [CrossRef]
  55. Jurkiewicz, K.; Pawlyta, M.; Zygadło, D.; Chrobak, D.; Duber, S.; Wrzalik, R.; Ratuszna, A.; Burian, A. Evolution of Glassy Carbon under Heat Treatment: Correlation Structure–Mechanical Properties. J. Mater. Sci. 2018, 53, 3509–3523. [Google Scholar] [CrossRef] [Green Version]
  56. Ferrari, A.C.; Robertson, J. Raman Spectroscopy of Amorphous, Nanostructured, Diamond-like Carbon, and Nanodiamond. Philos. Trans. A Math. Phys. Eng. Sci. 2004, 362, 2477–2512. [Google Scholar] [CrossRef]
  57. Kūrti, J.; Magyar, C.; Balázs, A.; Rajczy, P. Vibrational Analysis for Short Carbon Chains with Alternating and Cumulenic Structure. Synth. Met. 1995, 71, 1865–1866. [Google Scholar] [CrossRef]
  58. Kavan, L.; Hlavatý, J.; Kastner, J.; Kuzmany, H. Electrochemical Carbyne from Perfluorinated Hydrocarbons: Synthesis and Stability Studied by Raman Scattering. Carbon 1995, 33, 1321–1329. [Google Scholar] [CrossRef]
  59. Lucotti, A.; Tommasini, M.; Zoppo, M.D.; Castiglioni, C.; Zerbi, G.; Cataldo, F.; Casari, C.S.; Bassi, A.L.; Russo, V.; Bogana, M.; et al. Raman and SERS Investigation of Isolated sp Carbon Chains. Chem. Phys. Lett. 2006, 417, 78–82. [Google Scholar] [CrossRef]
  60. Ferrari, A.C.; Robertson, J. Interpretation of Raman Spectra of Disordered and Amorphous Carbon. Phys. Rev. B Condens. Matter 2000, 61, 14095–14107. [Google Scholar] [CrossRef] [Green Version]
  61. Kavan, L.; Kastner, J. Carbyne Forms of Carbon: Continuation of the Story. Carbon N. Y. 1994, 32, 1533–1536. [Google Scholar] [CrossRef]
  62. Zhao, X.; Ando, Y.; Liu, Y.; Jinno, M.; Suzuki, T. Carbon Nanowire Made of a Long Linear Carbon Chain Inserted inside a Multiwalled Carbon Nanotube. Phys. Rev. Lett. 2003, 90, 187401. [Google Scholar] [CrossRef] [PubMed] [Green Version]
  63. Ravagnan, L.; Piseri, P.; Bruzzi, M.; Miglio, S.; Bongiorno, G.; Baserga, A.; Casari, C.S.; Li Bassi, A.; Lenardi, C.; Yamaguchi, Y.; et al. Influence of Cumulenic Chains on the Vibrational and Electronic Properties of S P-S p2 Amorphous Carbon. Phys. Rev. Lett. 2007, 98, 216103. [Google Scholar] [CrossRef] [PubMed] [Green Version]
  64. Liu, W.; Speranza, G. Tuning the Oxygen Content of Reduced Graphene Oxide and Effects on Its Properties. ACS Omega 2021, 6, 6195–6205. [Google Scholar] [CrossRef]
  65. Pimenta, M.A.; Dresselhaus, G.; Dresselhaus, M.S.; Cançado, L.G.; Jorio, A.; Saito, R. Studying Disorder in Graphite-Based Systems by Raman Spectroscopy. Phys. Chem. Chem. Phys. 2007, 9, 1276–1291. [Google Scholar] [CrossRef] [PubMed]
  66. Barclay, M.; Hill, S.B.; Fairbrother, D.H. Use of X-Ray Photoelectron Spectroscopy and Spectroscopic Ellipsometry to Characterize Carbonaceous Films Modified by Electrons and Hydrogen Atoms. Appl. Surf. Sci. 2019, 479, 557–568. [Google Scholar] [CrossRef]
  67. Lei, Y.; Jiang, J.; Wang, Y.; Bi, T.; Zhang, L. Structure Evolution and Stress Transition in Diamond-like Carbon Films by Glancing Angle Deposition. Appl. Surf. Sci. 2019, 479, 12–19. [Google Scholar] [CrossRef]
  68. Lesiak, B.; Kövér, L.; Tóth, J.; Zemek, J.; Jiricek, P.; Kromka, A.; Rangam, N. C sp2/sp3 Hybridisations in Carbon Nanomaterials--XPS and(X) AES Study. Appl. Surf. Sci. 2018, 452, 223–231. [Google Scholar] [CrossRef]
  69. Lascovich, J.C.; Scaglione, S. Comparison among XAES, PELS and XPS Techniques for Evaluation of Sp2 Percentage in a-C:H. Appl. Surf. Sci. 1994, 78, 17–23. [Google Scholar] [CrossRef]
  70. Bhaumik, A.; Sachan, R.; Narayan, J. Tunable Charge States of Nitrogen-Vacancy Centers in Diamond for Ultrafast Quantum Devices. Carbon 2019, 142, 662–672. [Google Scholar] [CrossRef]
  71. Haque, A.; Sachan, R.; Narayan, J. Synthesis of Diamond Nanostructures from Carbon Nanotube and Formation of Diamond-CNT Hybrid Structures. Carbon N. Y. 2019, 150, 388–395. [Google Scholar] [CrossRef]
  72. Zhang, X.; Schneider, R.; Müller, E.; Gerthsen, D. Practical Aspects of the Quantification of sp2-Hybridized Carbon Atoms in Diamond-like Carbon by Electron Energy Loss Spectroscopy. Carbon 2016, 102, 198–207. [Google Scholar] [CrossRef]
  73. Bruley, J.; Williams, D.B.; Cuomo, J.J.; Pappas, D.P. Quantitative near-Edge Structure Analysis of Diamond-like Carbon in the Electron Microscope Using a Two-Window Method. J. Microsc. 1995, 180, 22–32. [Google Scholar] [CrossRef]
  74. Titantah, J.T.; Lamoen, D. Technique for the p2p3 Characterization of Carbon Materials: Ab Initio Calculation of near-Edge Structure in Electron-Energy-Loss Spectra. Phys. Rev. B Condens. Matter 2004, 70, 075115. [Google Scholar] [CrossRef]
  75. Bernier, N.; Bocquet, F.; Allouche, A.; Saikaly, W.; Brosset, C.; Thibault, J.; Charai, A. A methodology to optimize the quantification of sp2 carbon fraction from K edge EELS spectra. J. Electron Spectrosc. Relat. Phenom. 2008, 164, 34–43. [Google Scholar] [CrossRef]
  76. Lajaunie, L.; Pardanaud, C.; Martin, C.; Puech, P.; Hu, C.; Biggs, M.J.; Arenal, R. Advanced spectroscopic analyses on a:C-H materials: Revisiting the EELS characterization and its coupling with multi-wavelength Raman spectroscopy. Carbon 2017, 112, 149–161. [Google Scholar] [CrossRef] [Green Version]
  77. Pelaez-Fernandez, M.; Bermejo, A.; Benito, A.M.; Maser, W.K.; Arenal, R. Detailed thermal reduction analyses of Graphene Oxide via in-situ TEM/EELS studies. Carbon 2021, 178, 477–487. [Google Scholar] [CrossRef]
  78. Taft, E.A.; Philipp, H.R. Optical Properties of Graphite. Phys. Rev. 1965, 138, A197–A202. [Google Scholar] [CrossRef]
  79. Liang, W.Y.; Cundy, S.L. Electron Energy Loss Studies of the Transition Metal Dichalcogenides. Philos. Mag. 1969, 19, 1031–1043. [Google Scholar] [CrossRef]
  80. Caputi, L.S.; Papagno, L. Plasmon Excitation in Graphite by Electron Energy Loss. Phys. Lett. A 1983, 93, 417–418. [Google Scholar] [CrossRef]
  81. Pflüger, J.; Fink, J.; Weber, W.; Bohnen, K.P.; Crecelius, G. Dielectric Properties of TiC X, TiN X, VC X, and VN X from 1.5 to 40 eV Determined by Electron-Energy-Loss Spectroscopy. Phys. Rev. B Condens. Matter Mater. Phys. 1984, 30, 1155. [Google Scholar] [CrossRef]
  82. Martin, P.J.; Filipczuk, S.W.; Netterfield, R.P.; Field, J.S.; Whitnall, D.F.; McKenzie, D.R. Structure and Hardness of Diamond-like Carbon Films Prepared by Arc Evaporation. J. Mater. Sci. Lett. 1988, 7, 410–412. [Google Scholar] [CrossRef]
  83. Berger, S.D.; McKenzie, D.R.; Martin, P.J. EELS Analysis of Vacuum Arc-Deposited Diamond-like Films. Philos. Mag. Lett. 1988, 57, 285–290. [Google Scholar] [CrossRef]
  84. Saito, Y.; Shinohara, H.; Ohshita, A. Bulk Plasmons in Solid C60. Jpn. J. Appl. Phys. 1991, 30, L1068. [Google Scholar] [CrossRef]
  85. Jost, M.B.; Troullier, N.; Poirier, D.M.; Martins, J.L.; Weaver, J.H.; Chibante, L.P.F.; Smalley, R.E. Band Dispersion and Empty Electronic States in Solid C60: Inverse Photoemission and Theory. Phys. Rev. B Condens. Matter 1991, 44, 1966–1969. [Google Scholar] [CrossRef]
  86. Sohmen, E.; Fink, J.; Krätschmer, W. Electron Energy-Loss Spectroscopy Studies on C 60 and C 70 Fullerite. Z. Phys. B Condens. Matter 1992, 86, 87–92. [Google Scholar] [CrossRef]
  87. Gass, M.H.; Bangert, U.; Bleloch, A.L.; Wang, P.; Nair, R.R.; Geim, A.K. Free-Standing Graphene at Atomic Resolution. Nat. Nanotechnol. 2008, 3, 676–681. [Google Scholar] [CrossRef]
  88. Kittel, C. Introduction to Solid State Physics, 7th ed.; Wiley: New York, NY, USA, 1996; p. 673. ISBN 978-0-471-11181-8. [Google Scholar]
  89. Shulga, Y.M.; Rubtsov, V.I.; Lobach, A.S. Reflection Electron Energy-Loss Spectra of the Fullerenes C 60 and C 70. Z. Phys. B Condens. Matter 1994, 93, 327–331. [Google Scholar] [CrossRef]
  90. Doniach, S.; Sunjic, M. Many-Electron Singularity in X-Ray Photoemission and X-Ray Line Spectra from Metals. J. Phys. C Solid State Phys. 1970, 3, 285. [Google Scholar] [CrossRef]
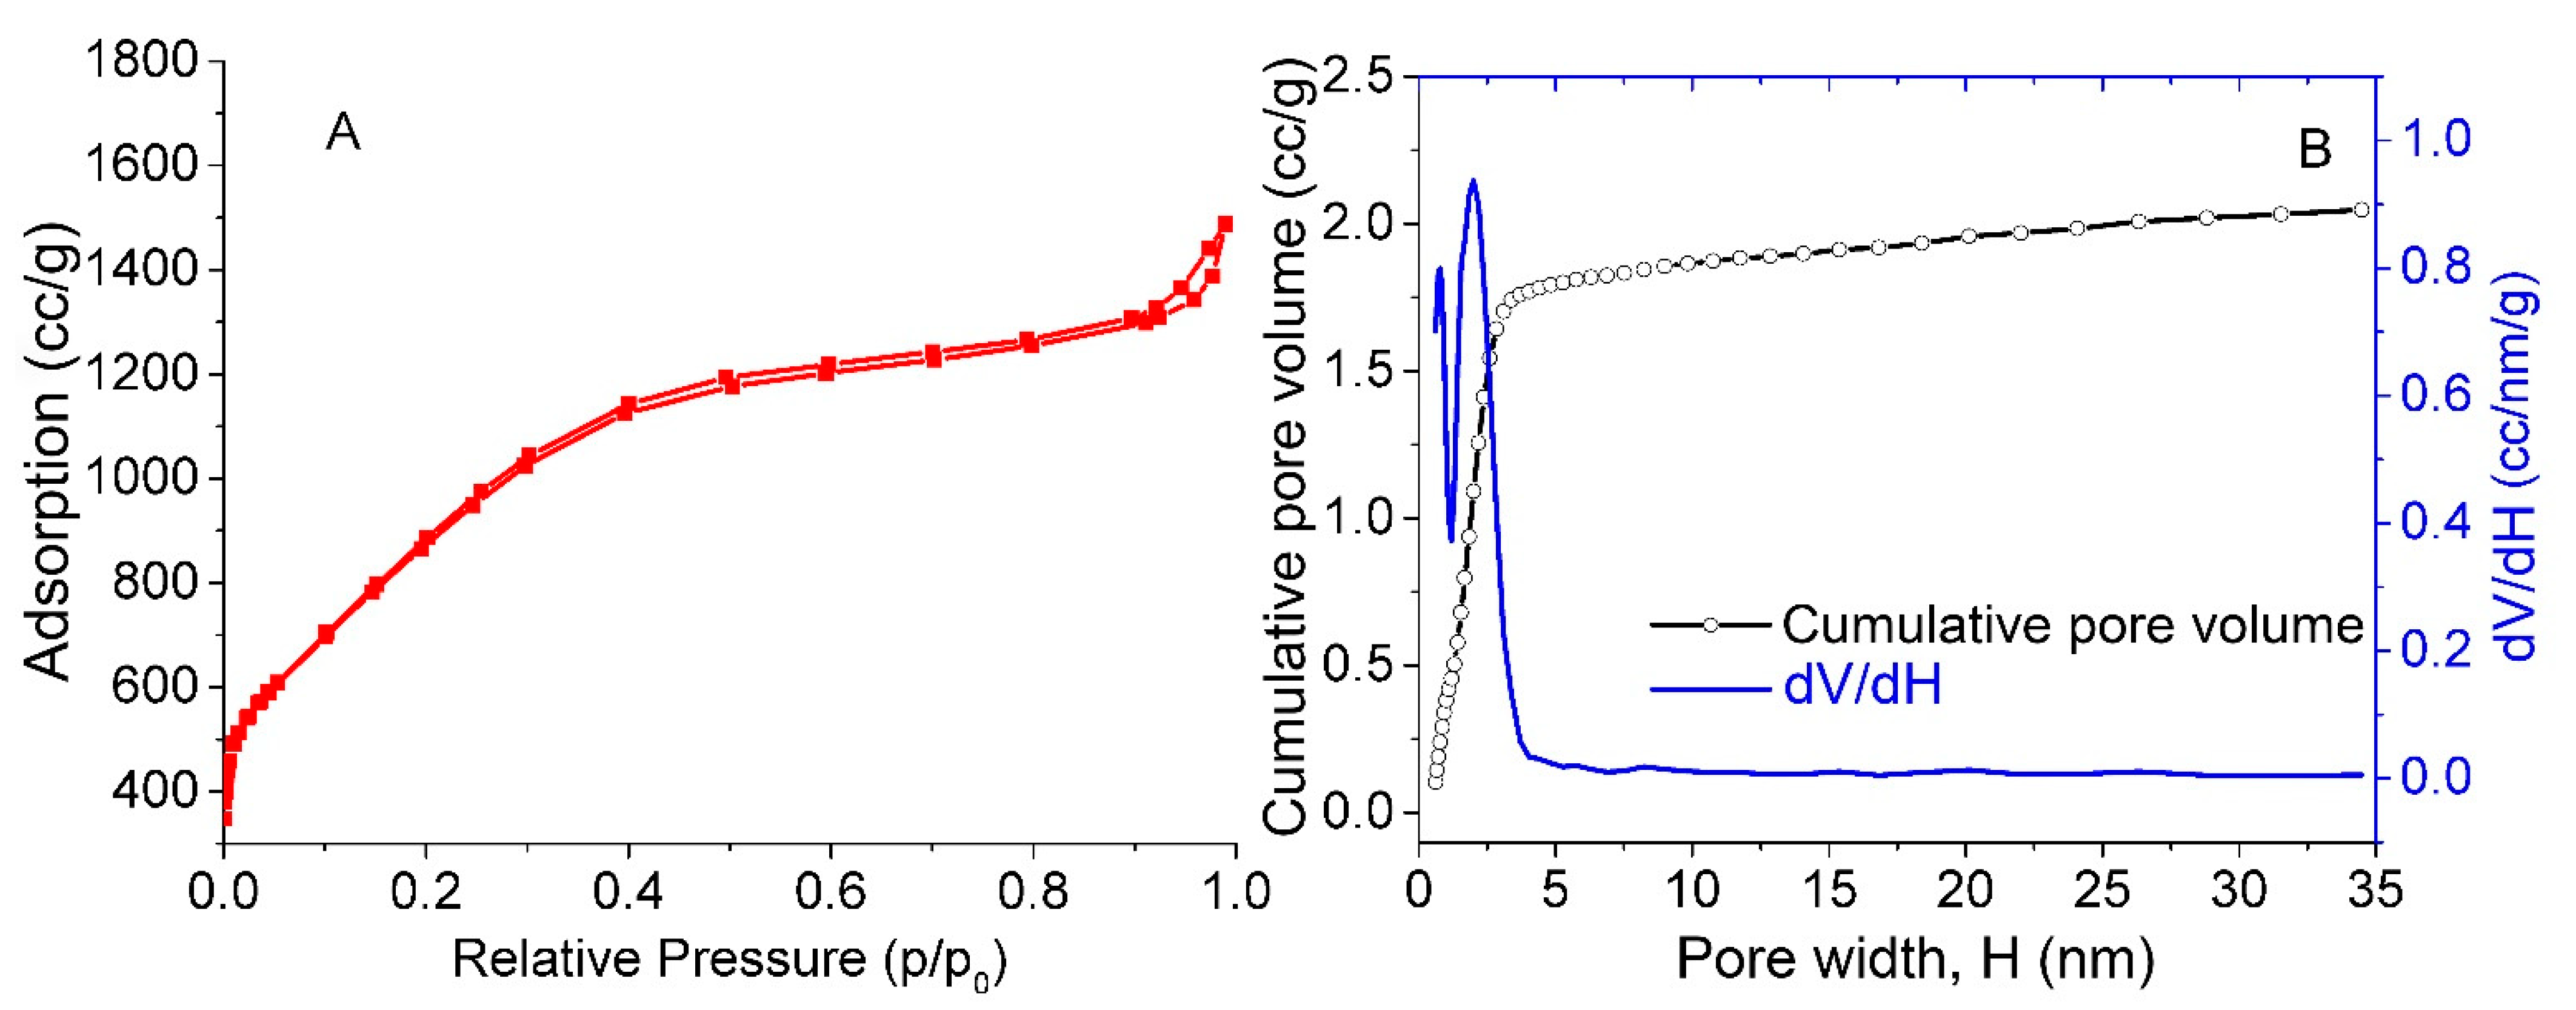
Figure 1. N2 adsorption–desorption isotherms (A) and pore size distribution curves (B) of our sample. The NLDFT method was used to obtain the pore size distribution.
Nanomaterials 11 01324 g001
Figure 2. TEM image (A) and electron diffraction patterns (B) of AC-TR. For comparison, the electron diffraction patterns of polycrystalline graphite (C) and SEM image (D) are also shown.
Nanomaterials 11 01324 g002
Figure 3. X-ray diffraction patterns of AC-TR powder (1), low background monocrystalline Si plate (2) and stick (red) Carbon PDF2 card#000-75-1621 (http://www.icdd.com (accessed on 2 February 2021)) The inset shows the profile analysis of the diffractogram section.
Nanomaterials 11 01324 g003
Figure 4. Raman spectra of AC-TR (1) and HOPG (2).
Nanomaterials 11 01324 g004
Figure 5. The AC-TR Raman spectrum in the region of 800–1900 cm−1 and its five-component deconvolution (bands D *, D, D, G, and D).
Nanomaterials 11 01324 g005
Figure 6. The AC-TR wide XPS spectrum. The inset shows the C1s spectrum of the sample and its decomposition (see the text).
Nanomaterials 11 01324 g006
Figure 7. The X-Ray exited Auger C KVV (A) and the first derivative C KVV spectra (B) for AC-TR and diamond. The spectra in (A) were recorded with a step of 0.03 eV; the spectra in (B) were obtained by differentiating the corresponding spectra (A) using the Savitzky-Golay filter.
Nanomaterials 11 01324 g007
Figure 8. The electron energy-loss spectra of the AC-TR sample (1) and graphite (2) in the reflection geometry. The energy of exciting electrons is 900 eV.
Nanomaterials 11 01324 g008
Table 1. SSA values for some carbon materials.
Material and Fabrication MethodSpecific Surface Area, m2/gReferences
alkaline activation of MEGO3100[11]
graphene (calculated data)2620–2675[12,13,14,15,16,19]
alkali-activated carbonFrom 3026 to 3708[20,21,22,23,24,25,26,27,28,29,30,31]
oxidative activation of pitch-derived carbon fiberFrom 1000 to 3000[32]
polymer derived from zinc-mediated coordination copolymerization
of a dicarboxylic and tricarboxylic acid
>5000[33]
alkaline activation of a mixture graphene oxide and dextrin
(AC-TR) carbonized at 750 °C
3167This work
AC used in supercapacitors1000–2000[34,35,36,37]
Table 2. Elemental composition of the AC-RT sample.
ContentCHNSClOK
wt % a92.97 ± 0.030.451 ± 0.0690.65 ± 0.070.164 ± 0.026
at % b94.6 5 0.15>0.10.314.69>0.2
a in weight percent; determined by elemental analysis. b in atomic percent; determined from X-ray photoelectron spectrum.
Table 3. The position (Pos), full width at half maximum (FWHM), and intensity (Int) of each peak in the Raman spectrum of AC-TR.
PeakPos, cm−1FWHM, cm−1Int, %
D *1125.2160.04.9
D1346.0220.063.1
D1537.5161.020.3
G1592.081.810.3
D1608.048.01.4
Table 4. The positions (Eb), intensities (I) and peak assignments in the C1s spectrum of AC-TR.
PeakEb, eVI, %Assignment
1284.475.87C (sp2)
2285.115.23C (sp3)
3285.94.38C (sp3)–OH
4286.54.51C (sp2) = O
Table 5. The peak position in the REELS spectra in Figure 7 and the ratio Iπ/Iσ + π of integral intensities.
Sampleπ, eV(σ + π), eVIπ/Iσ + π
AC-TR5.225.00.134
graphite6.526.50.145
Publisher’s Note: MDPI stays neutral with regard to jurisdictional claims in published maps and institutional affiliations.