
Detection of Sub-Micro- and Nanoplastic Particles on Gold Nanoparticle-Based Substrates through Surface-Enhanced Raman Scattering (SERS) Spectroscopy

 , and
, and 
Abstract
1. Introduction
2. Materials and Methods
2.1. Materials
2.2. Preparation of Gold and Plastics Particles
2.3. Fabrication of SERS Substrates
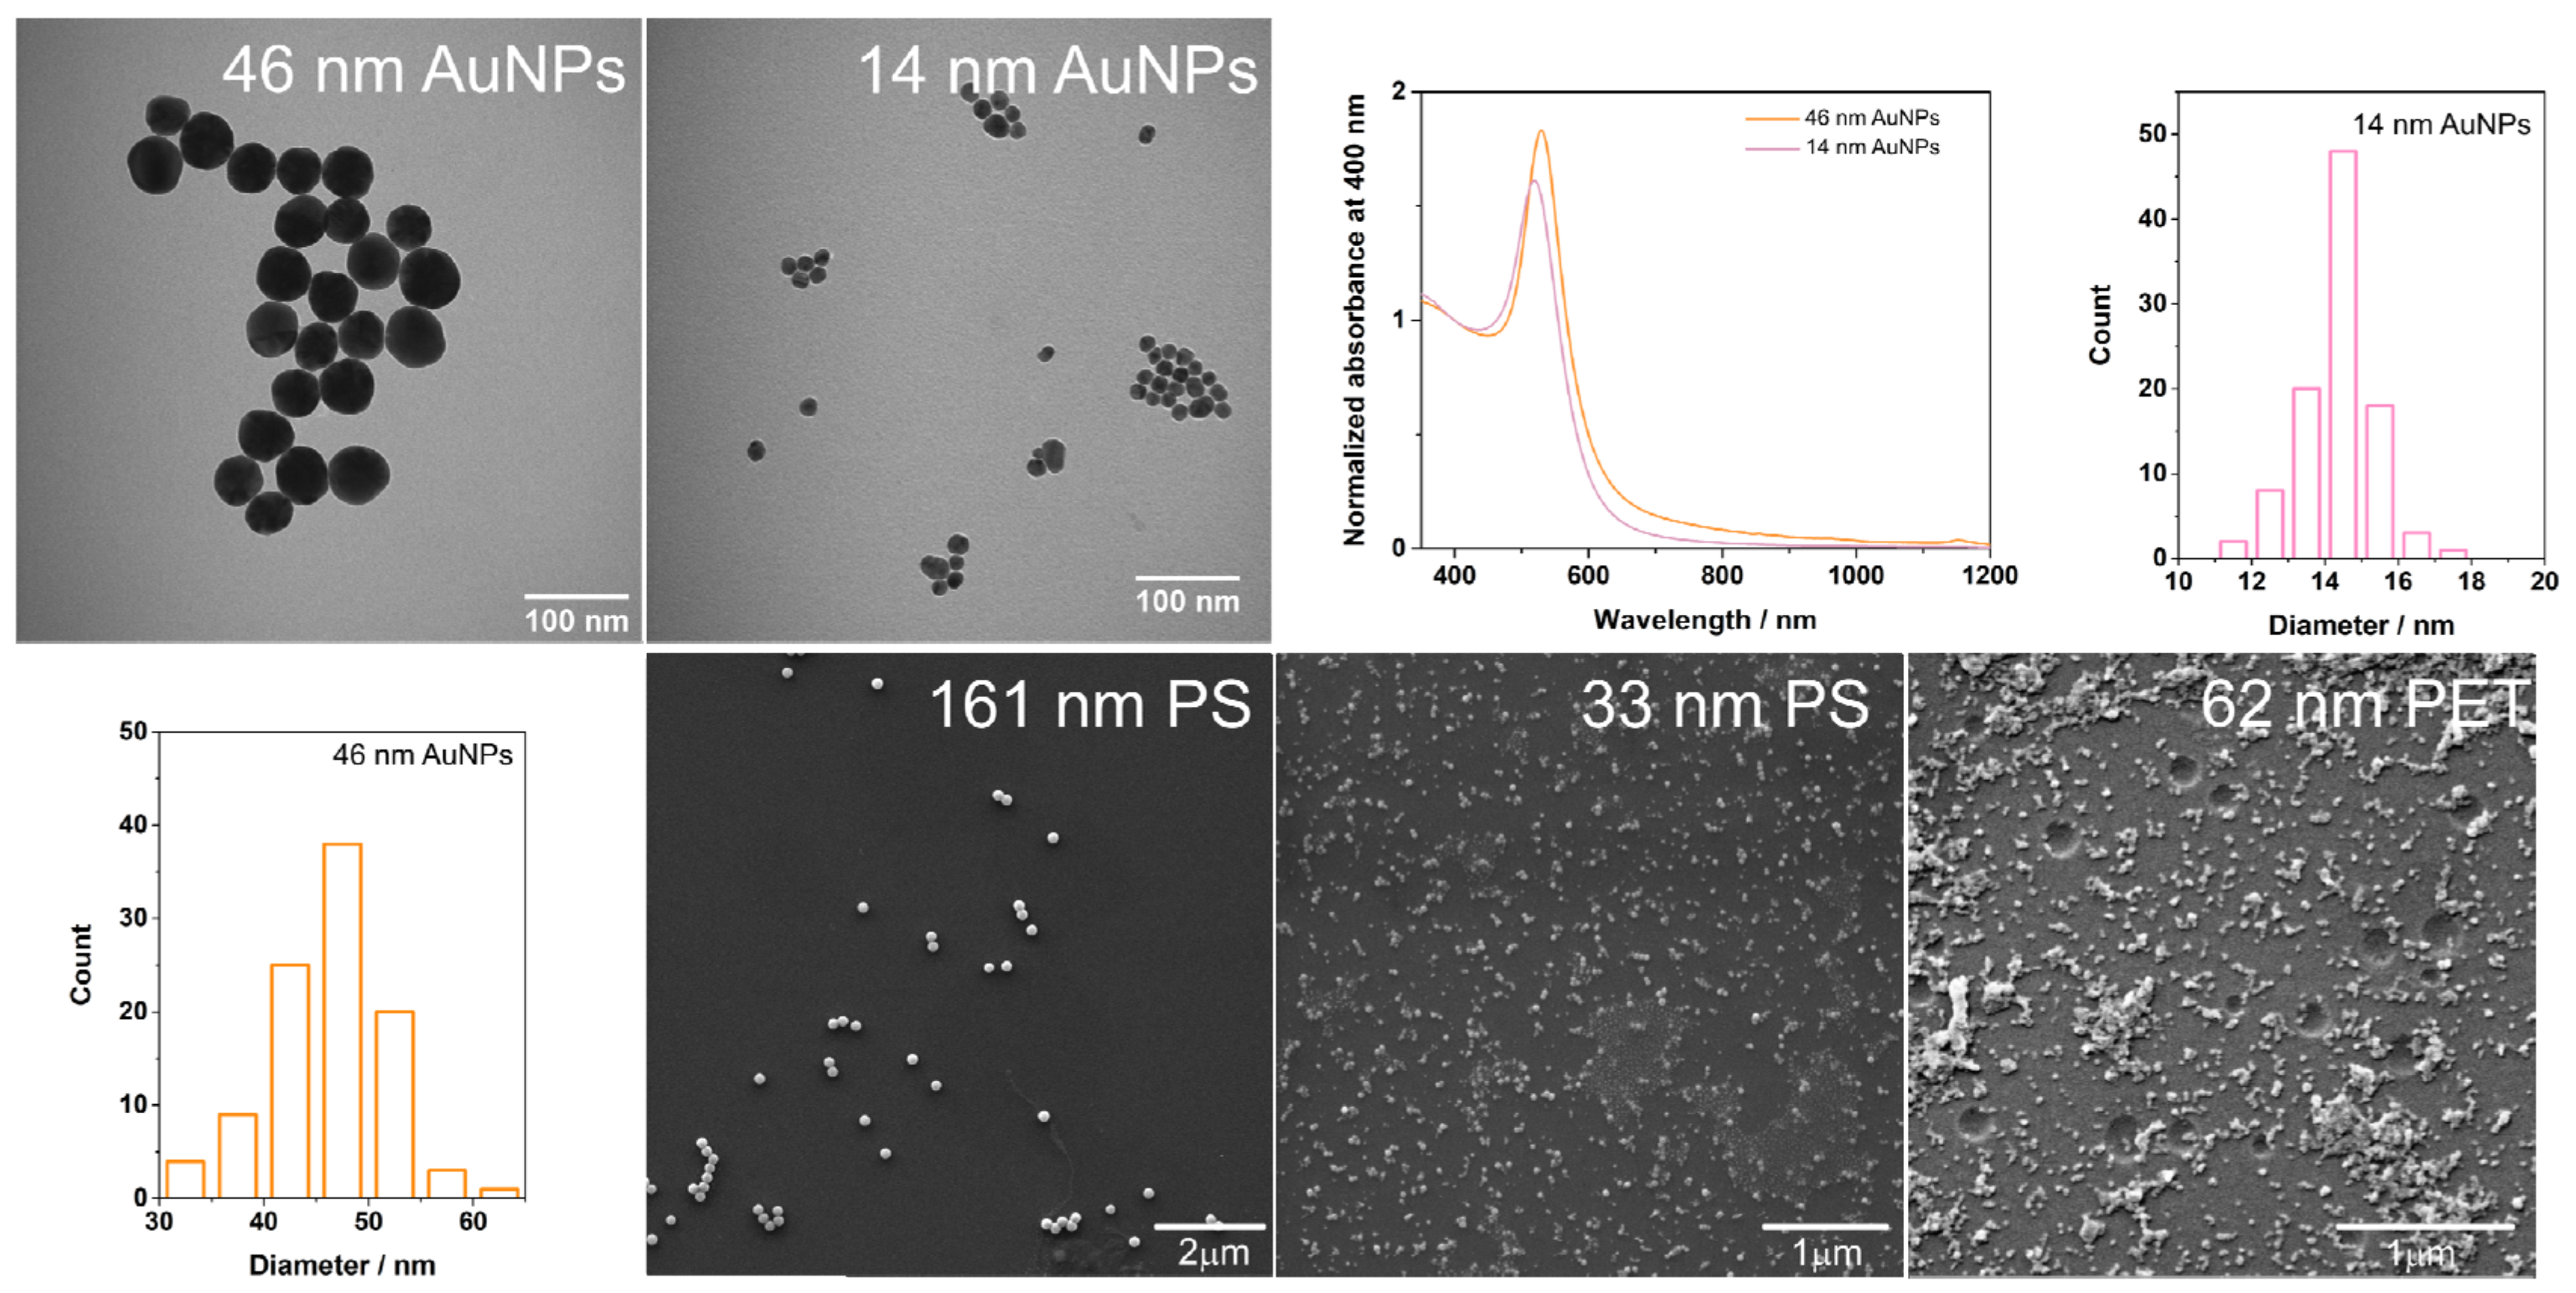
2.4. Characterization of AuNPs, PS and PET Particles, and SERS Substrates
2.5. Raman and SERS Spectroscopy
2.6. Contamination Prevention
3. Results
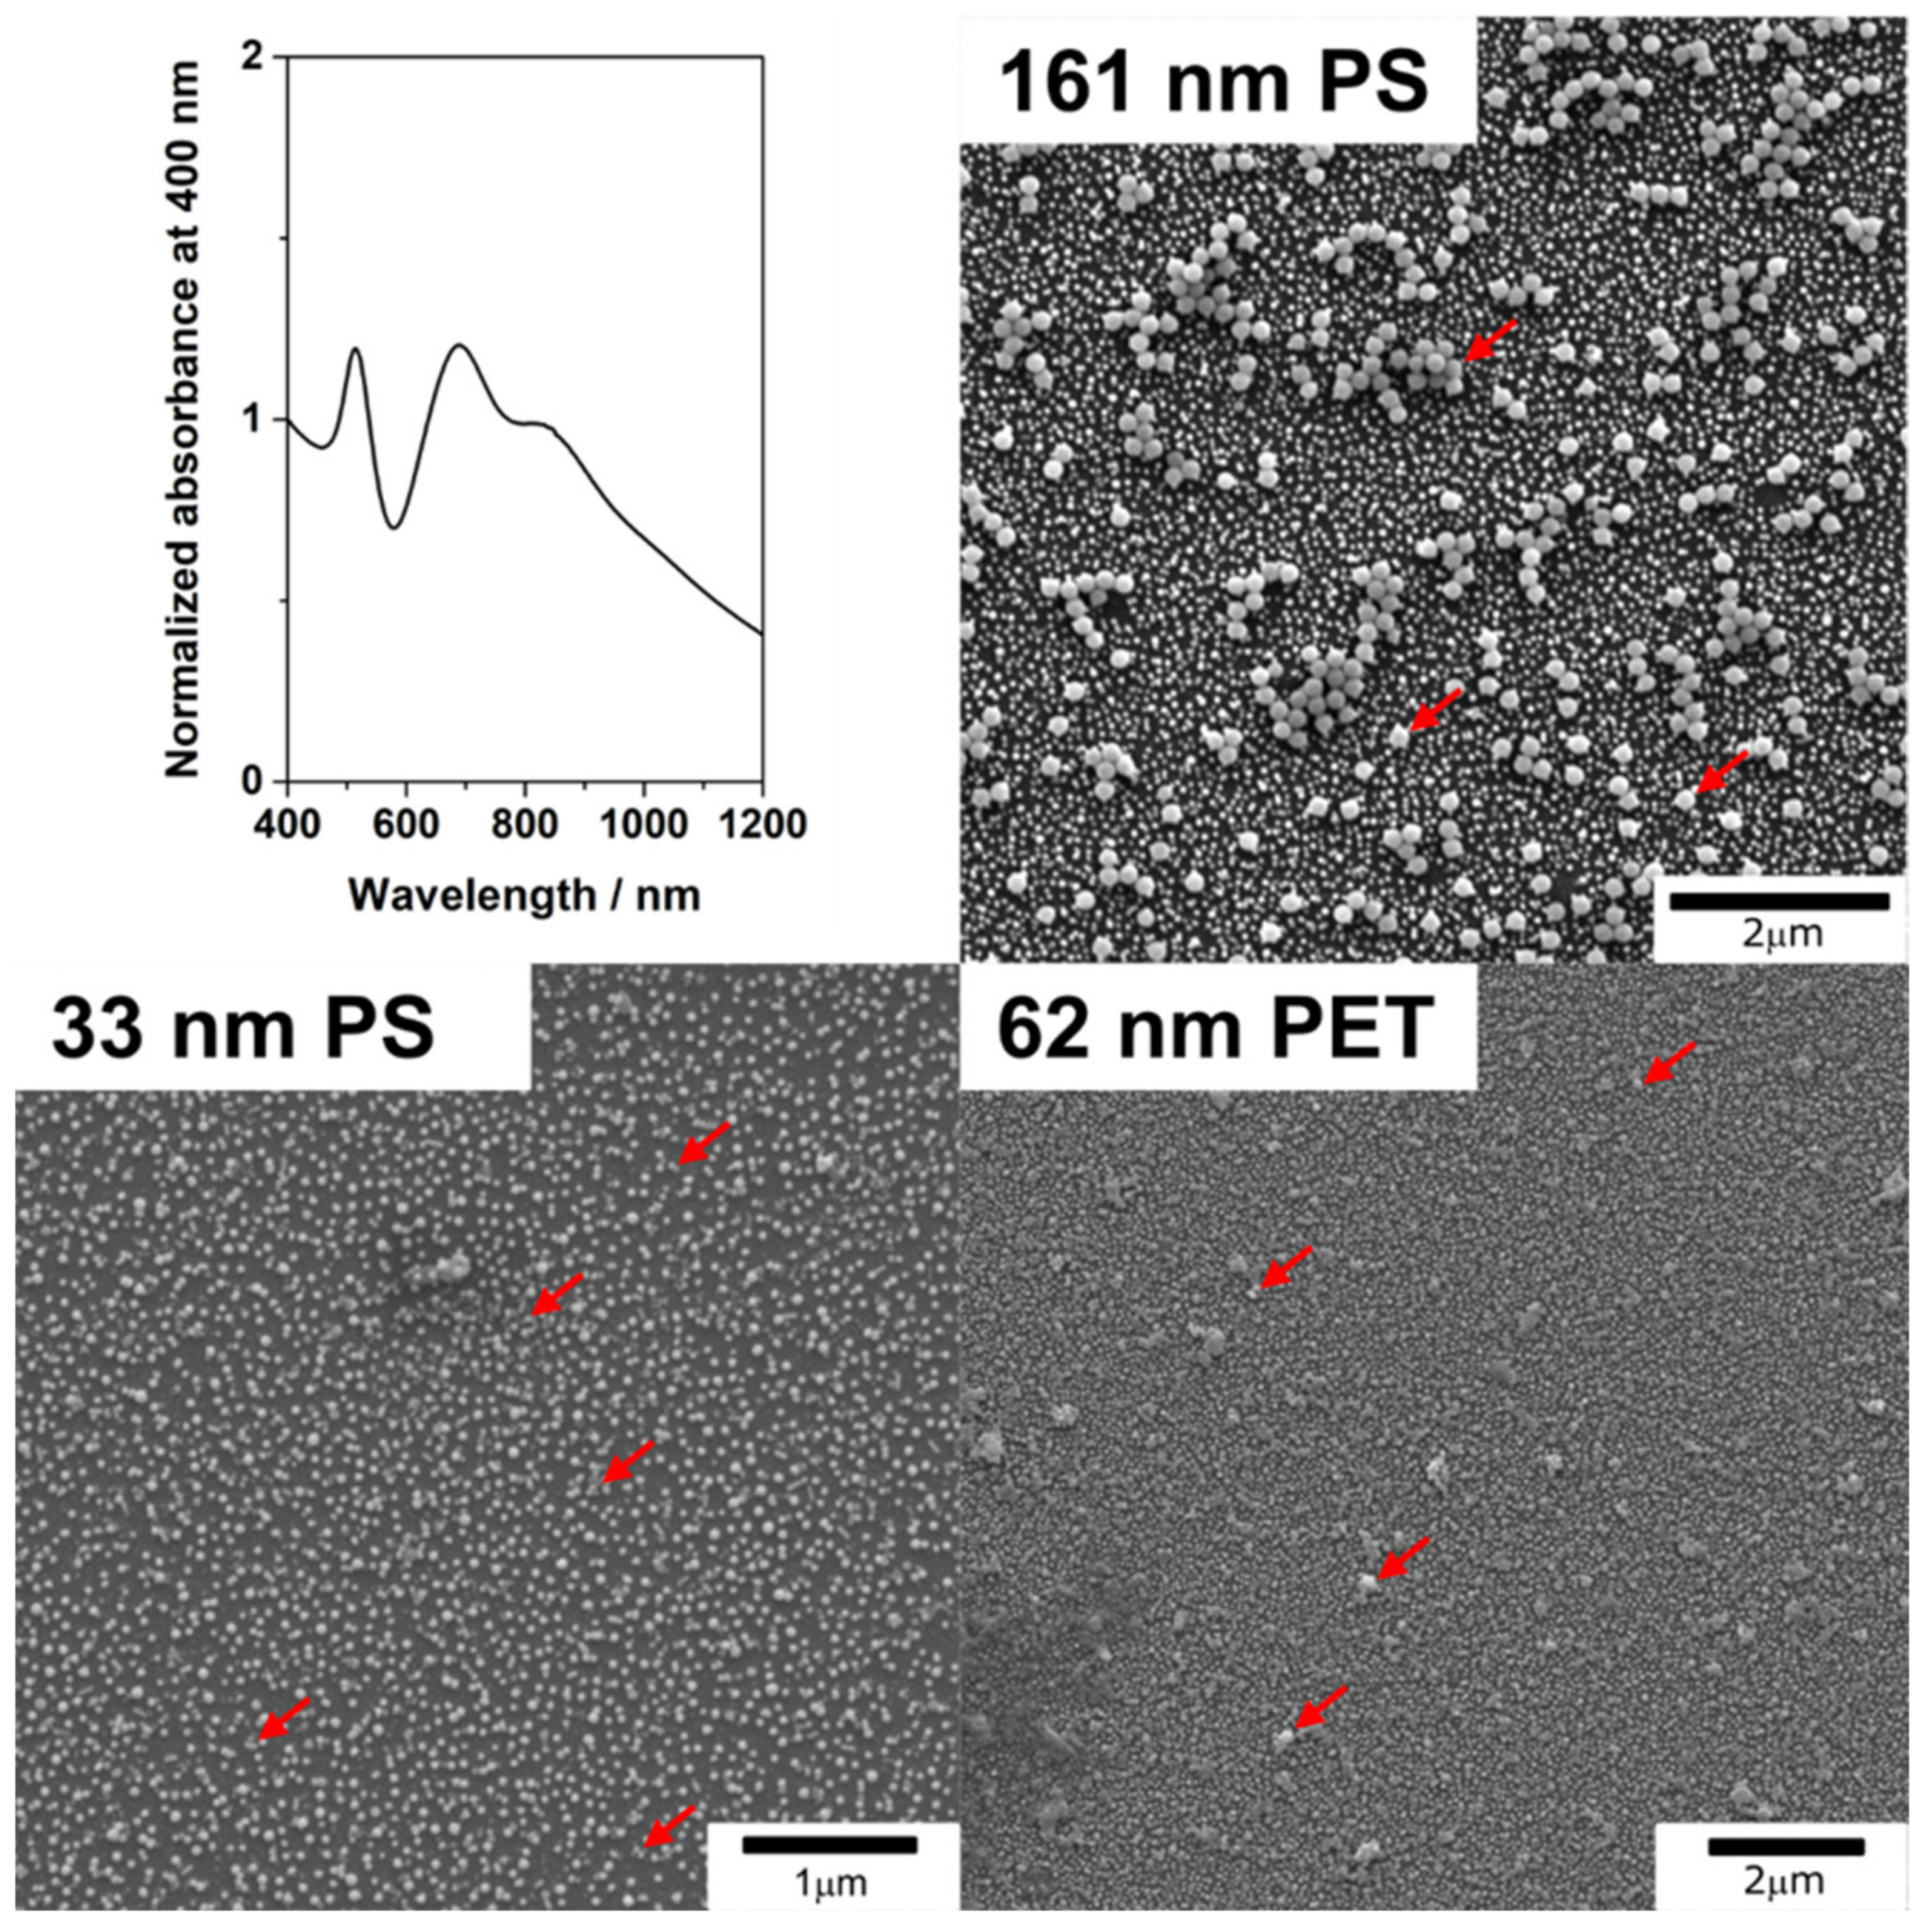
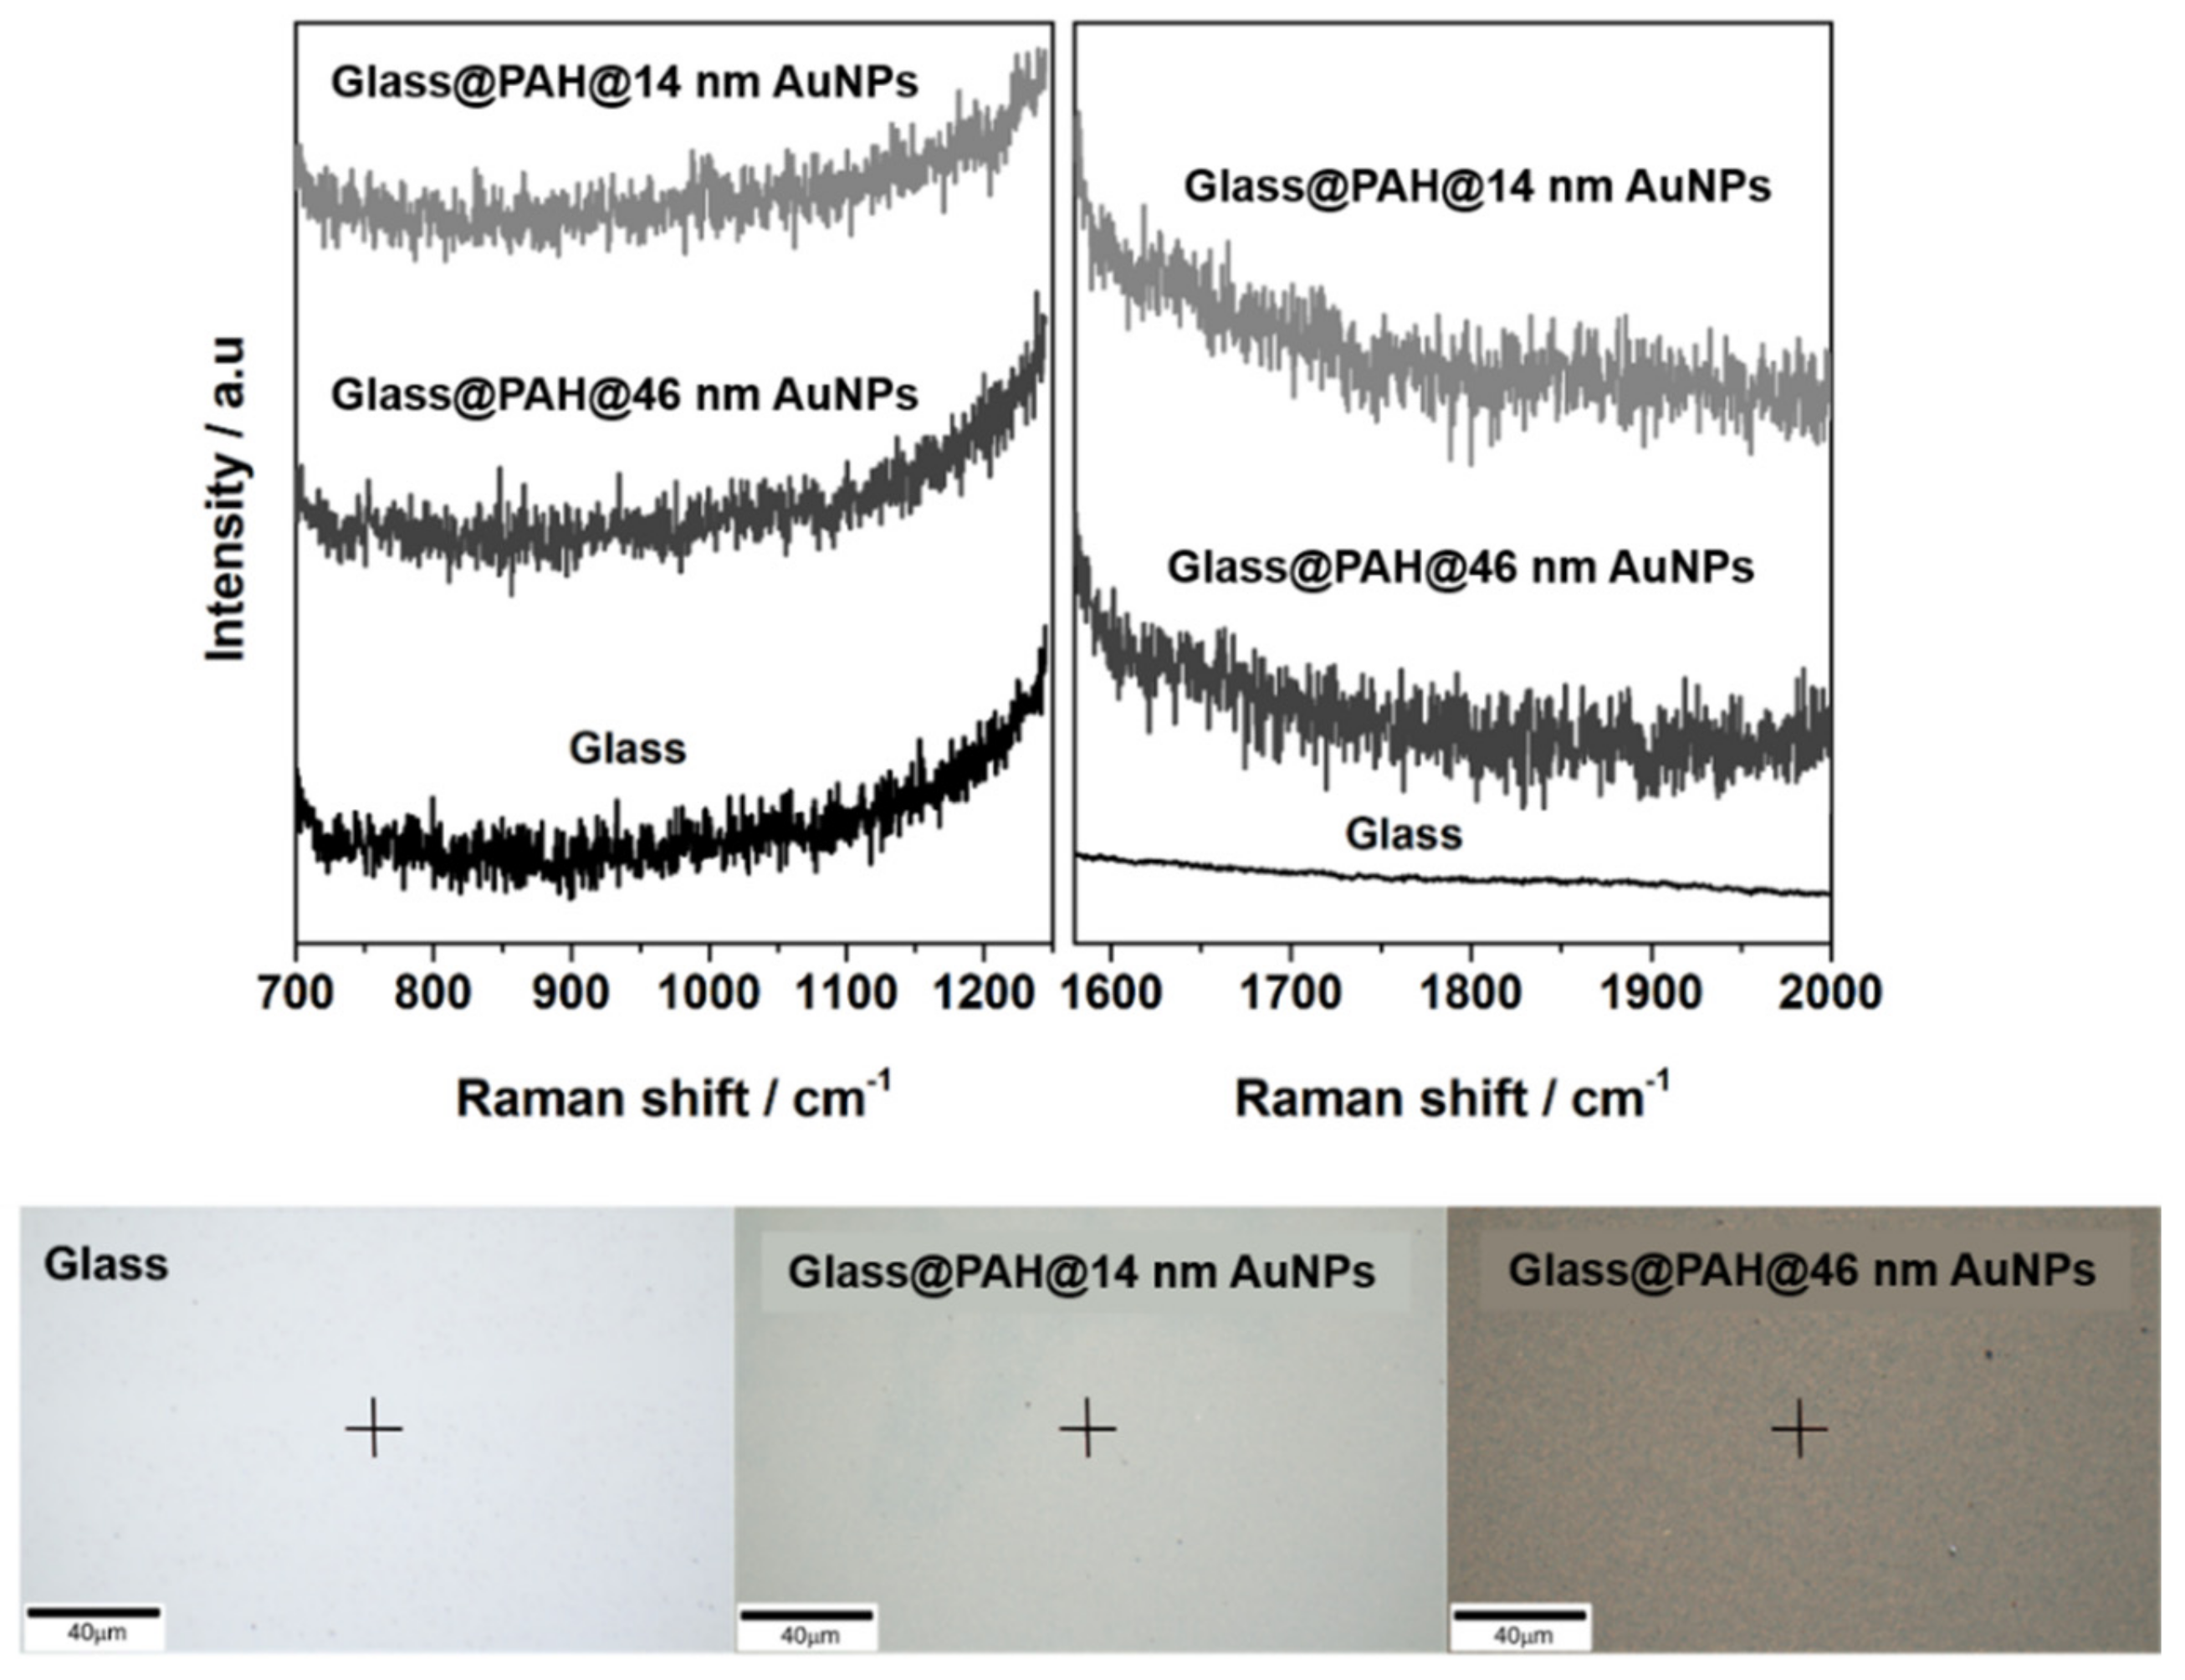
3.1. SERS Substrates
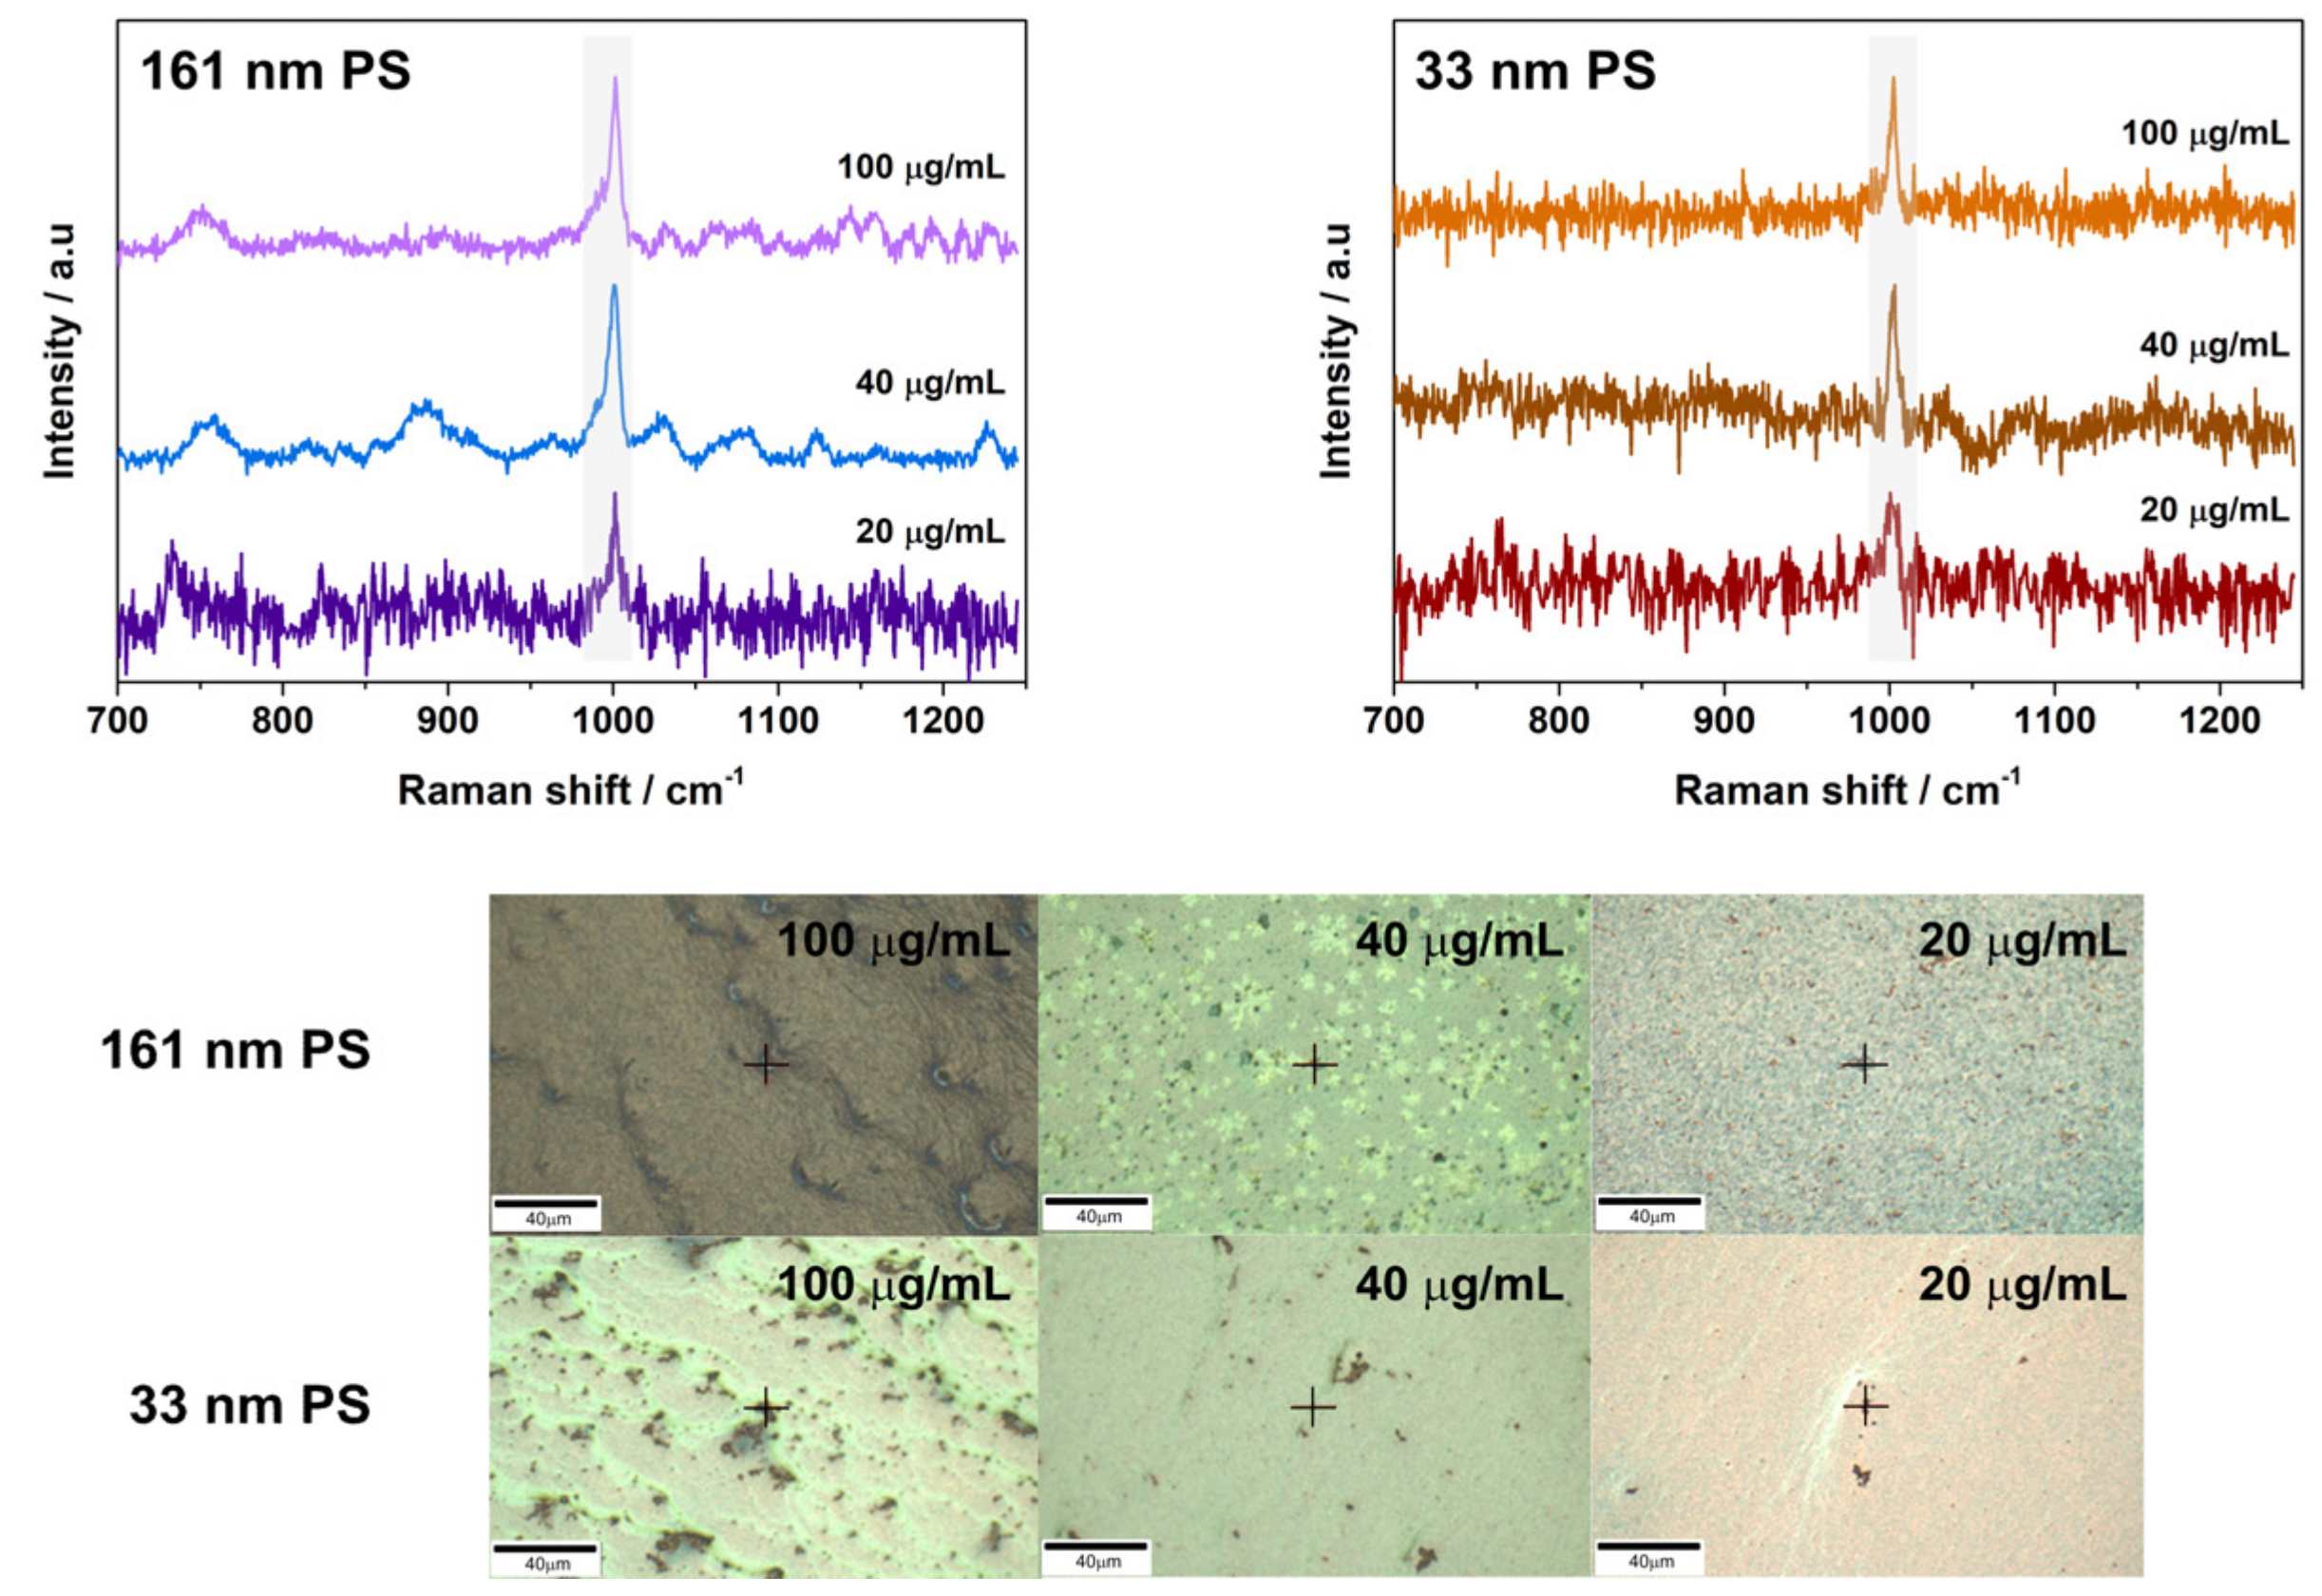
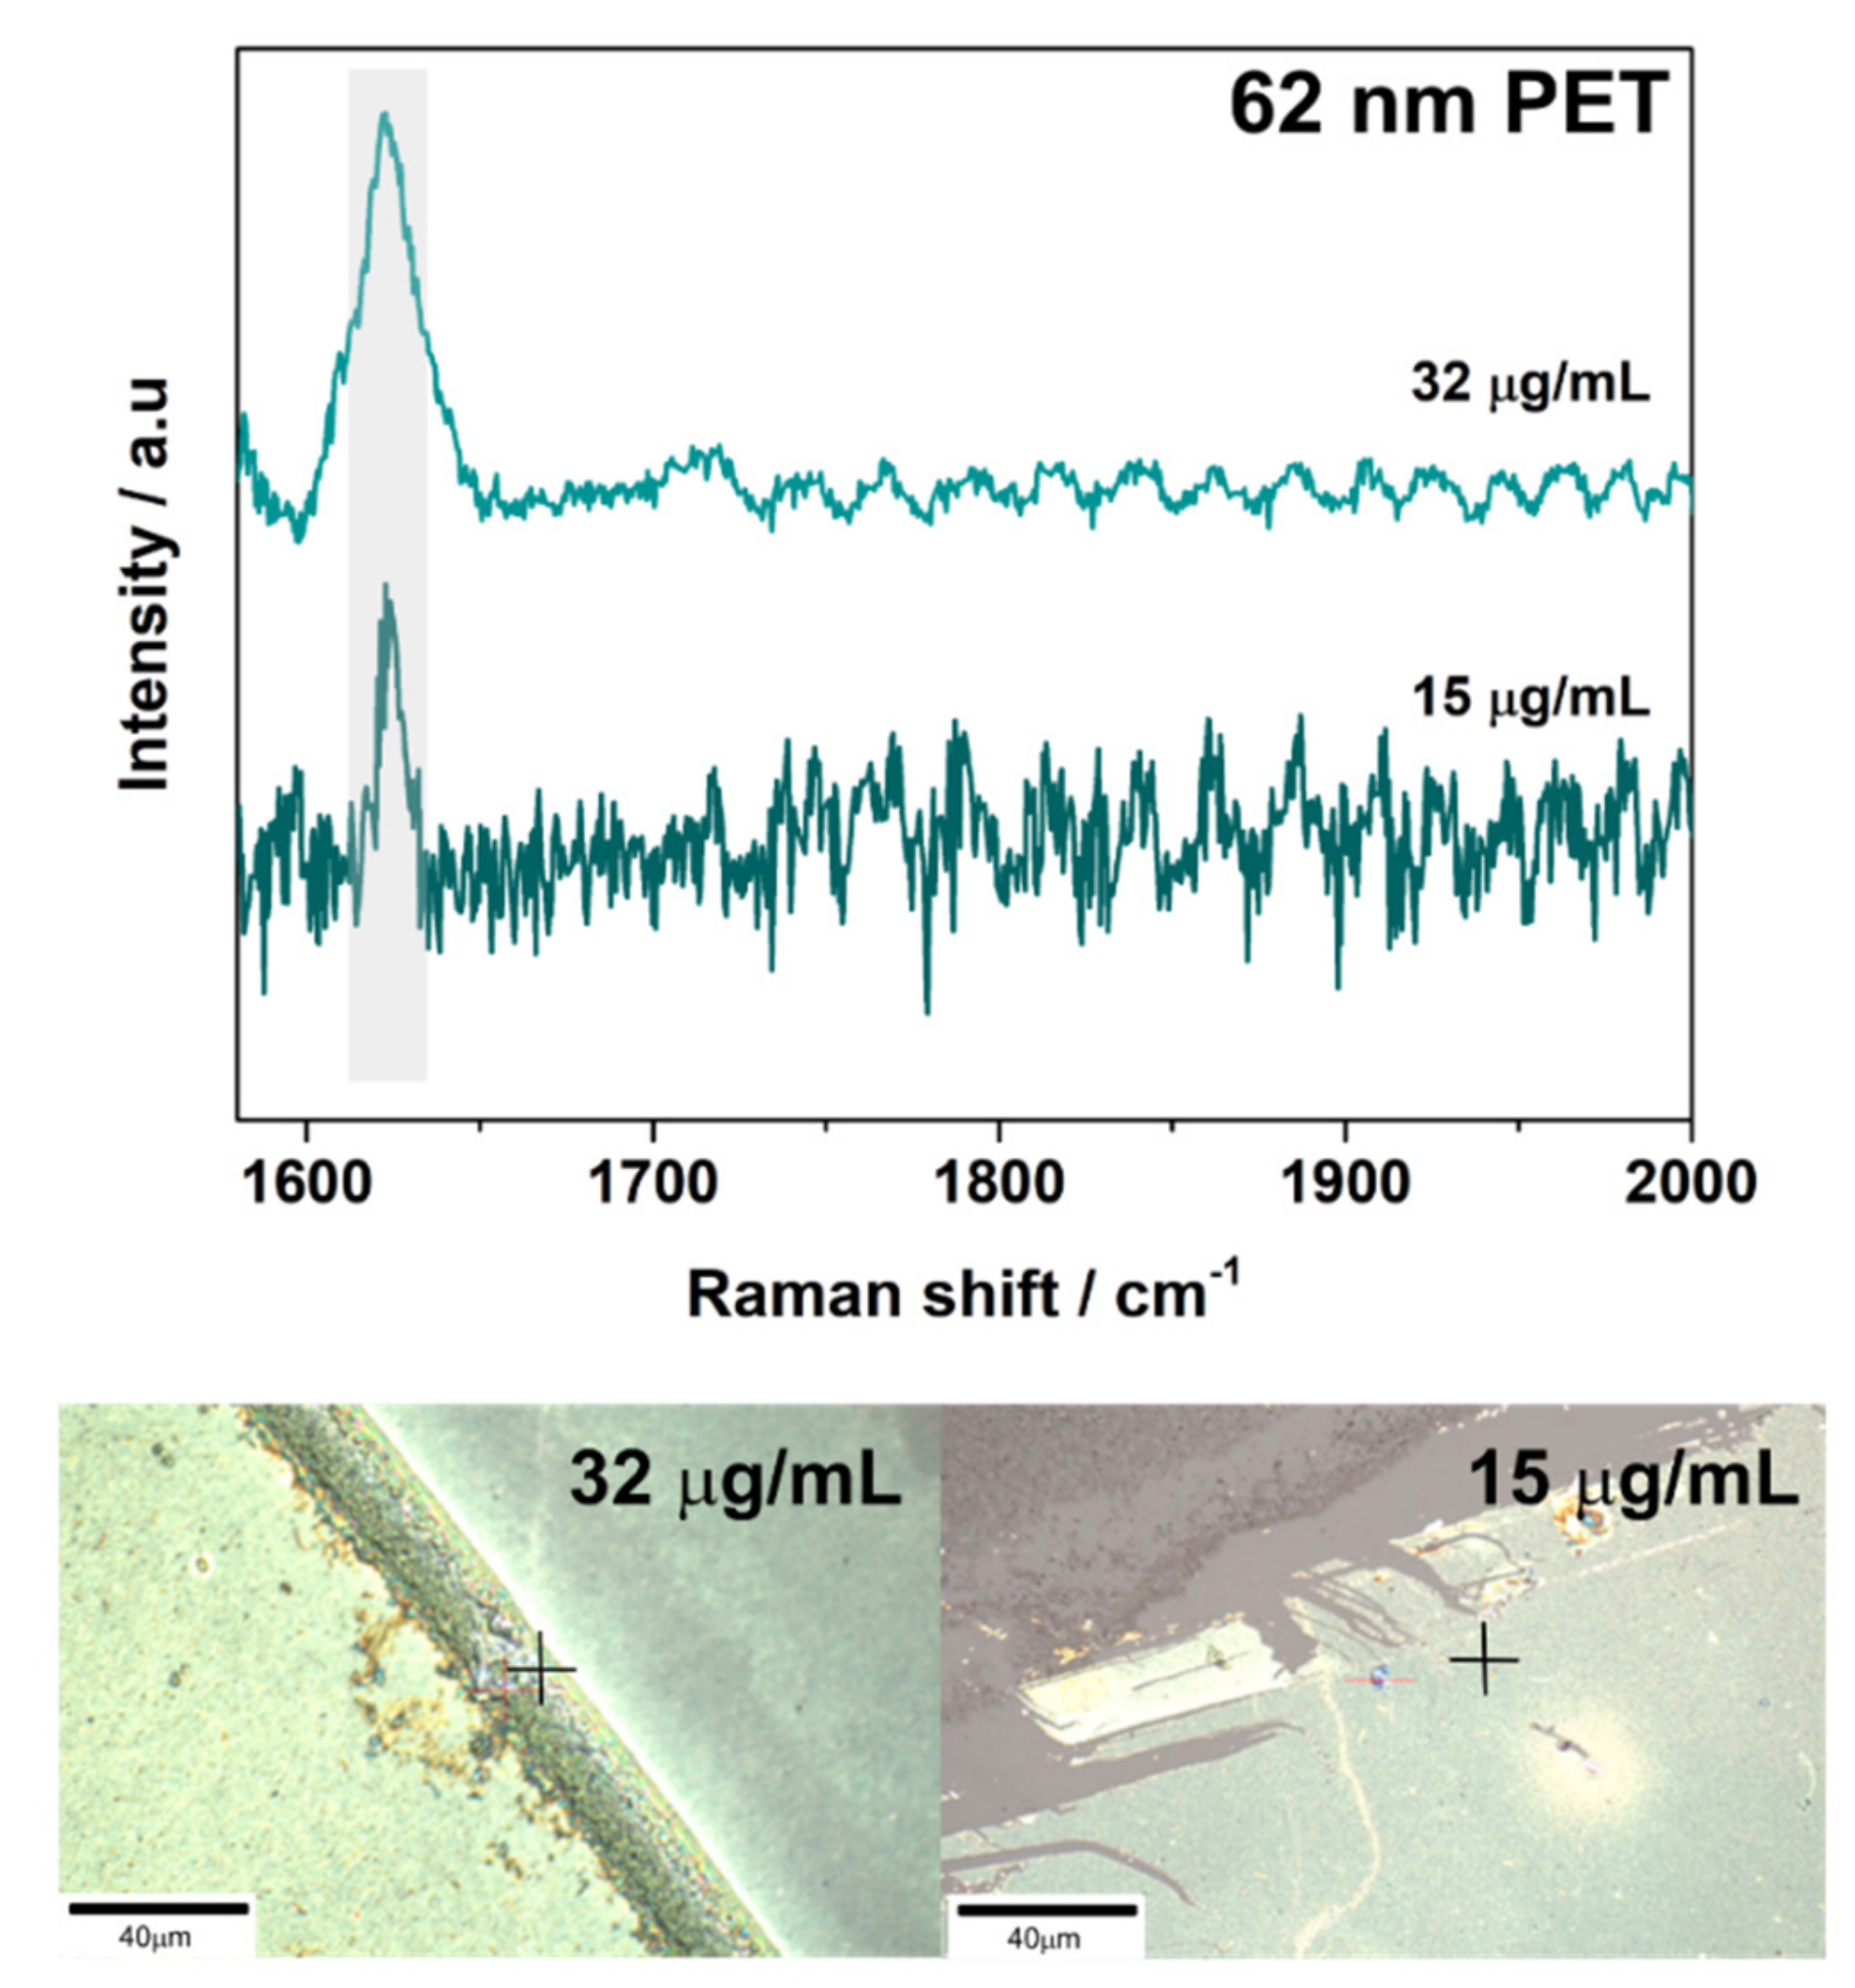
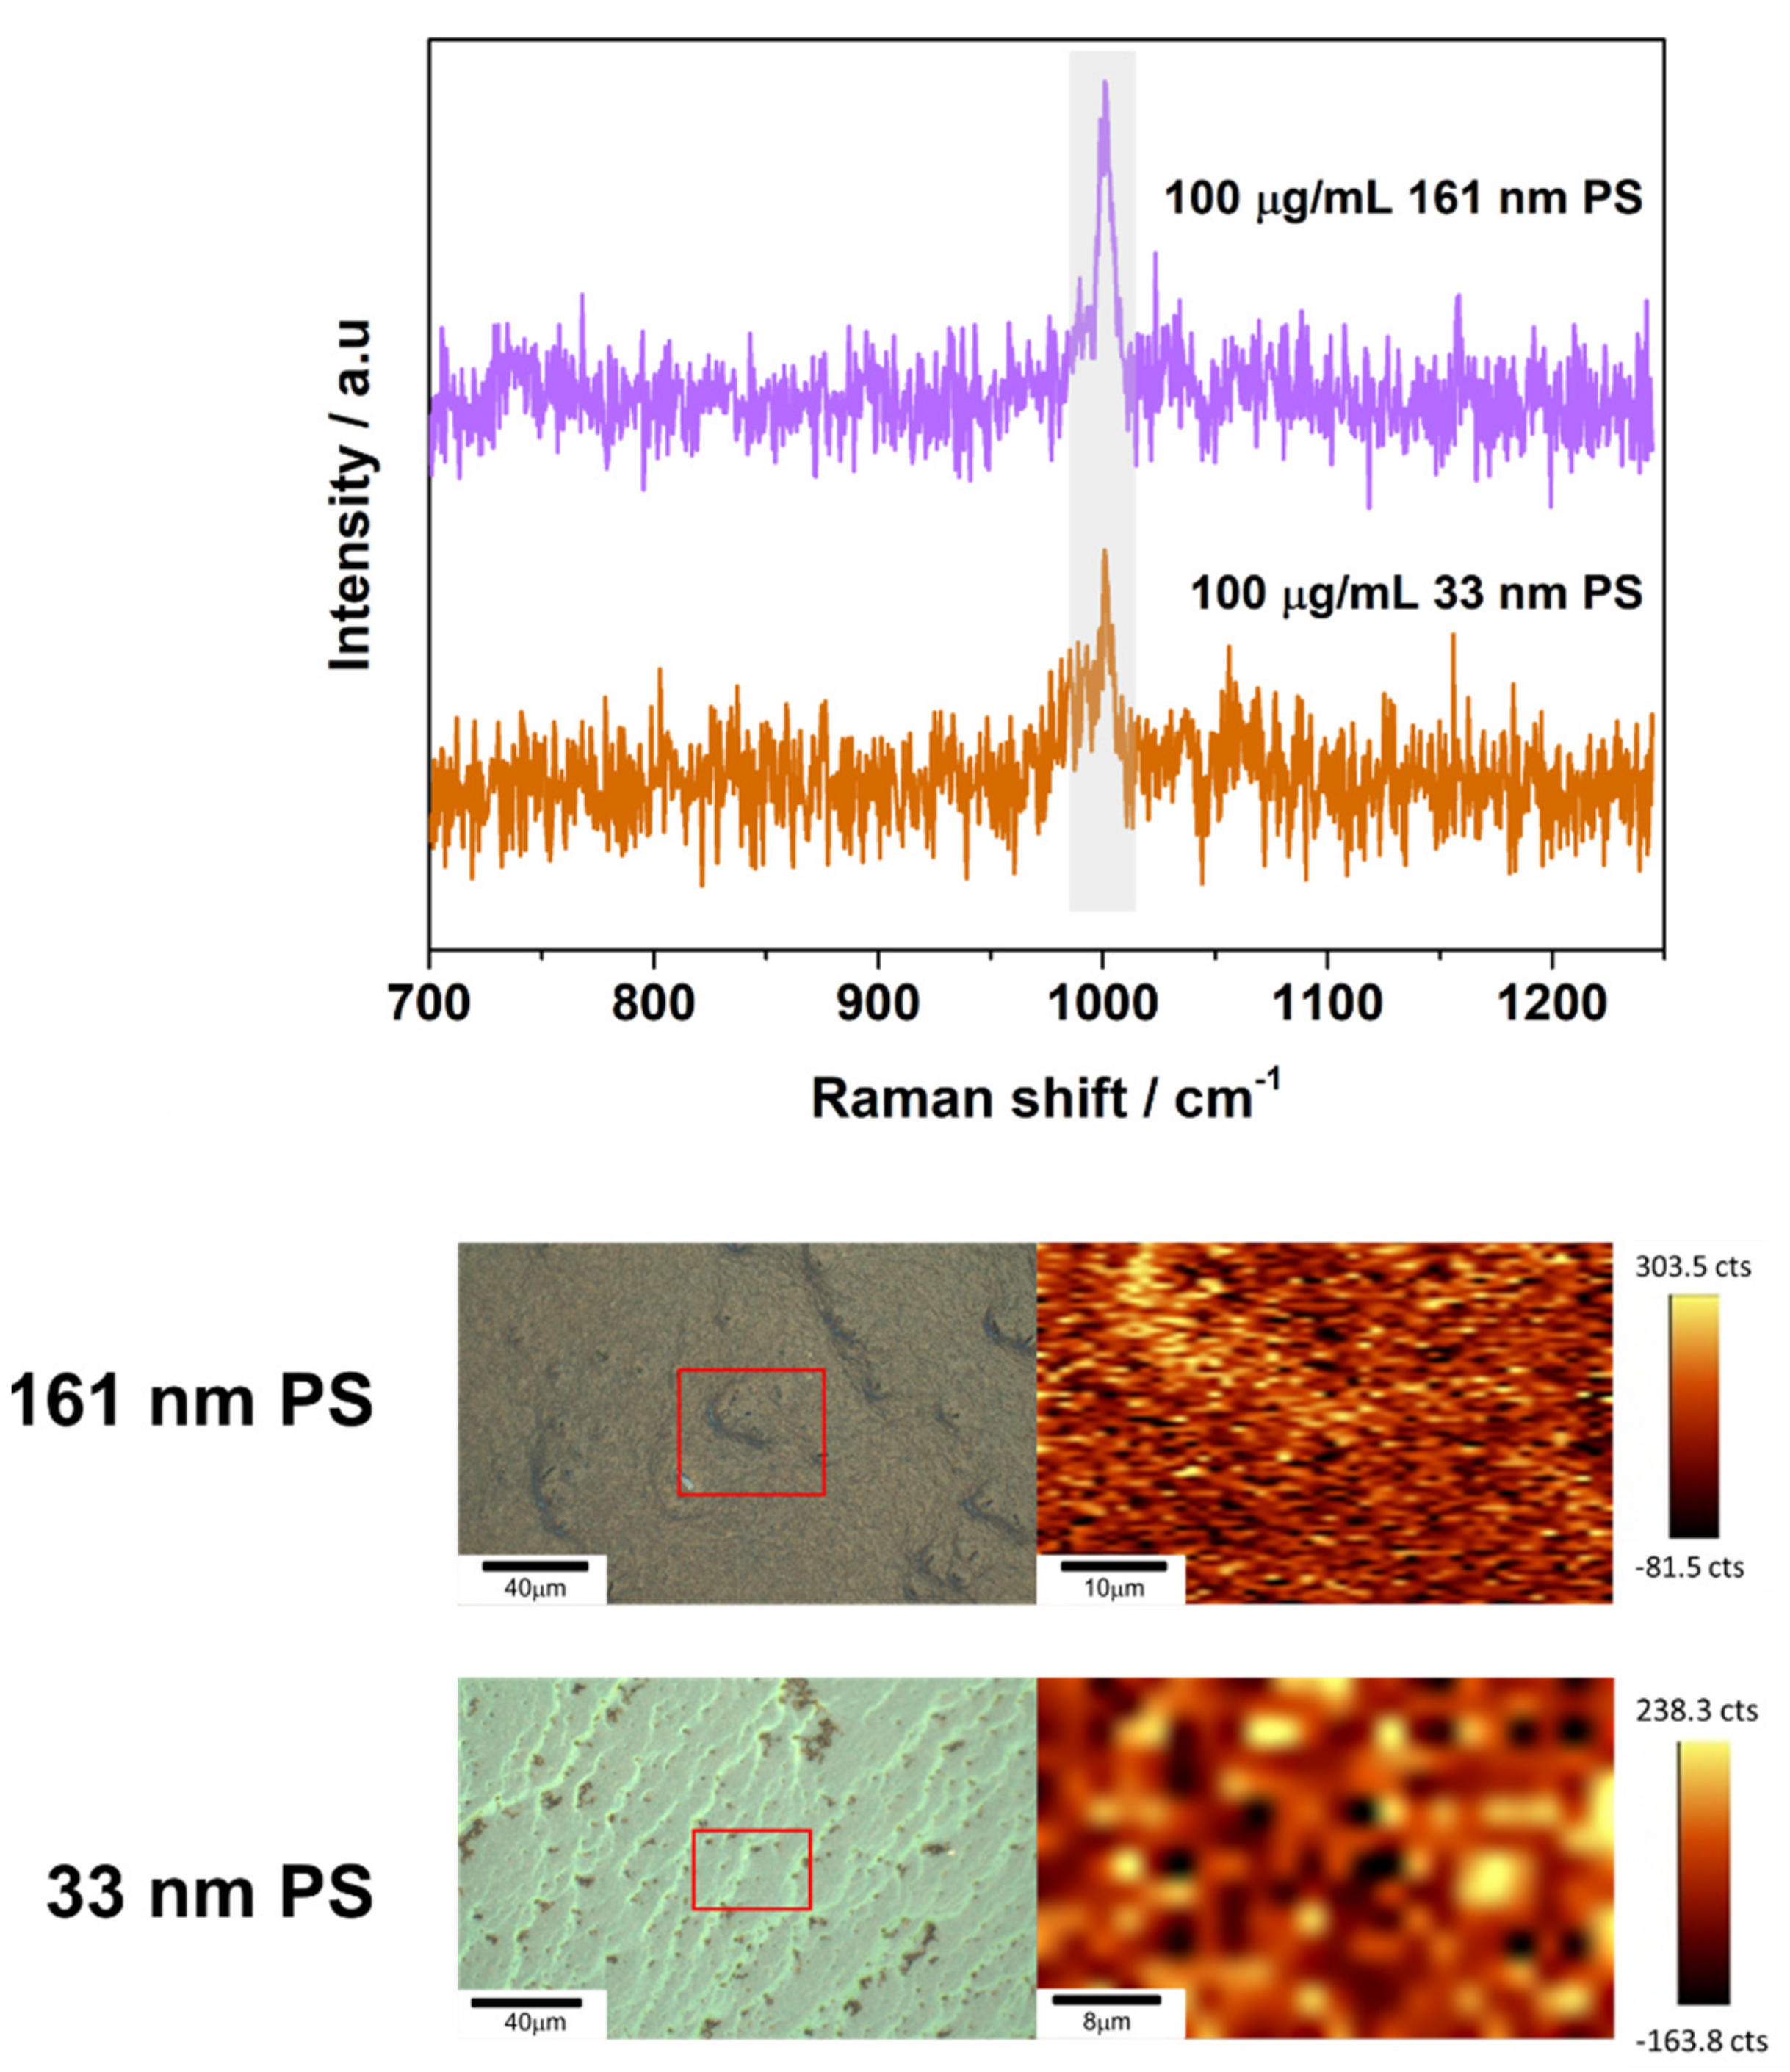
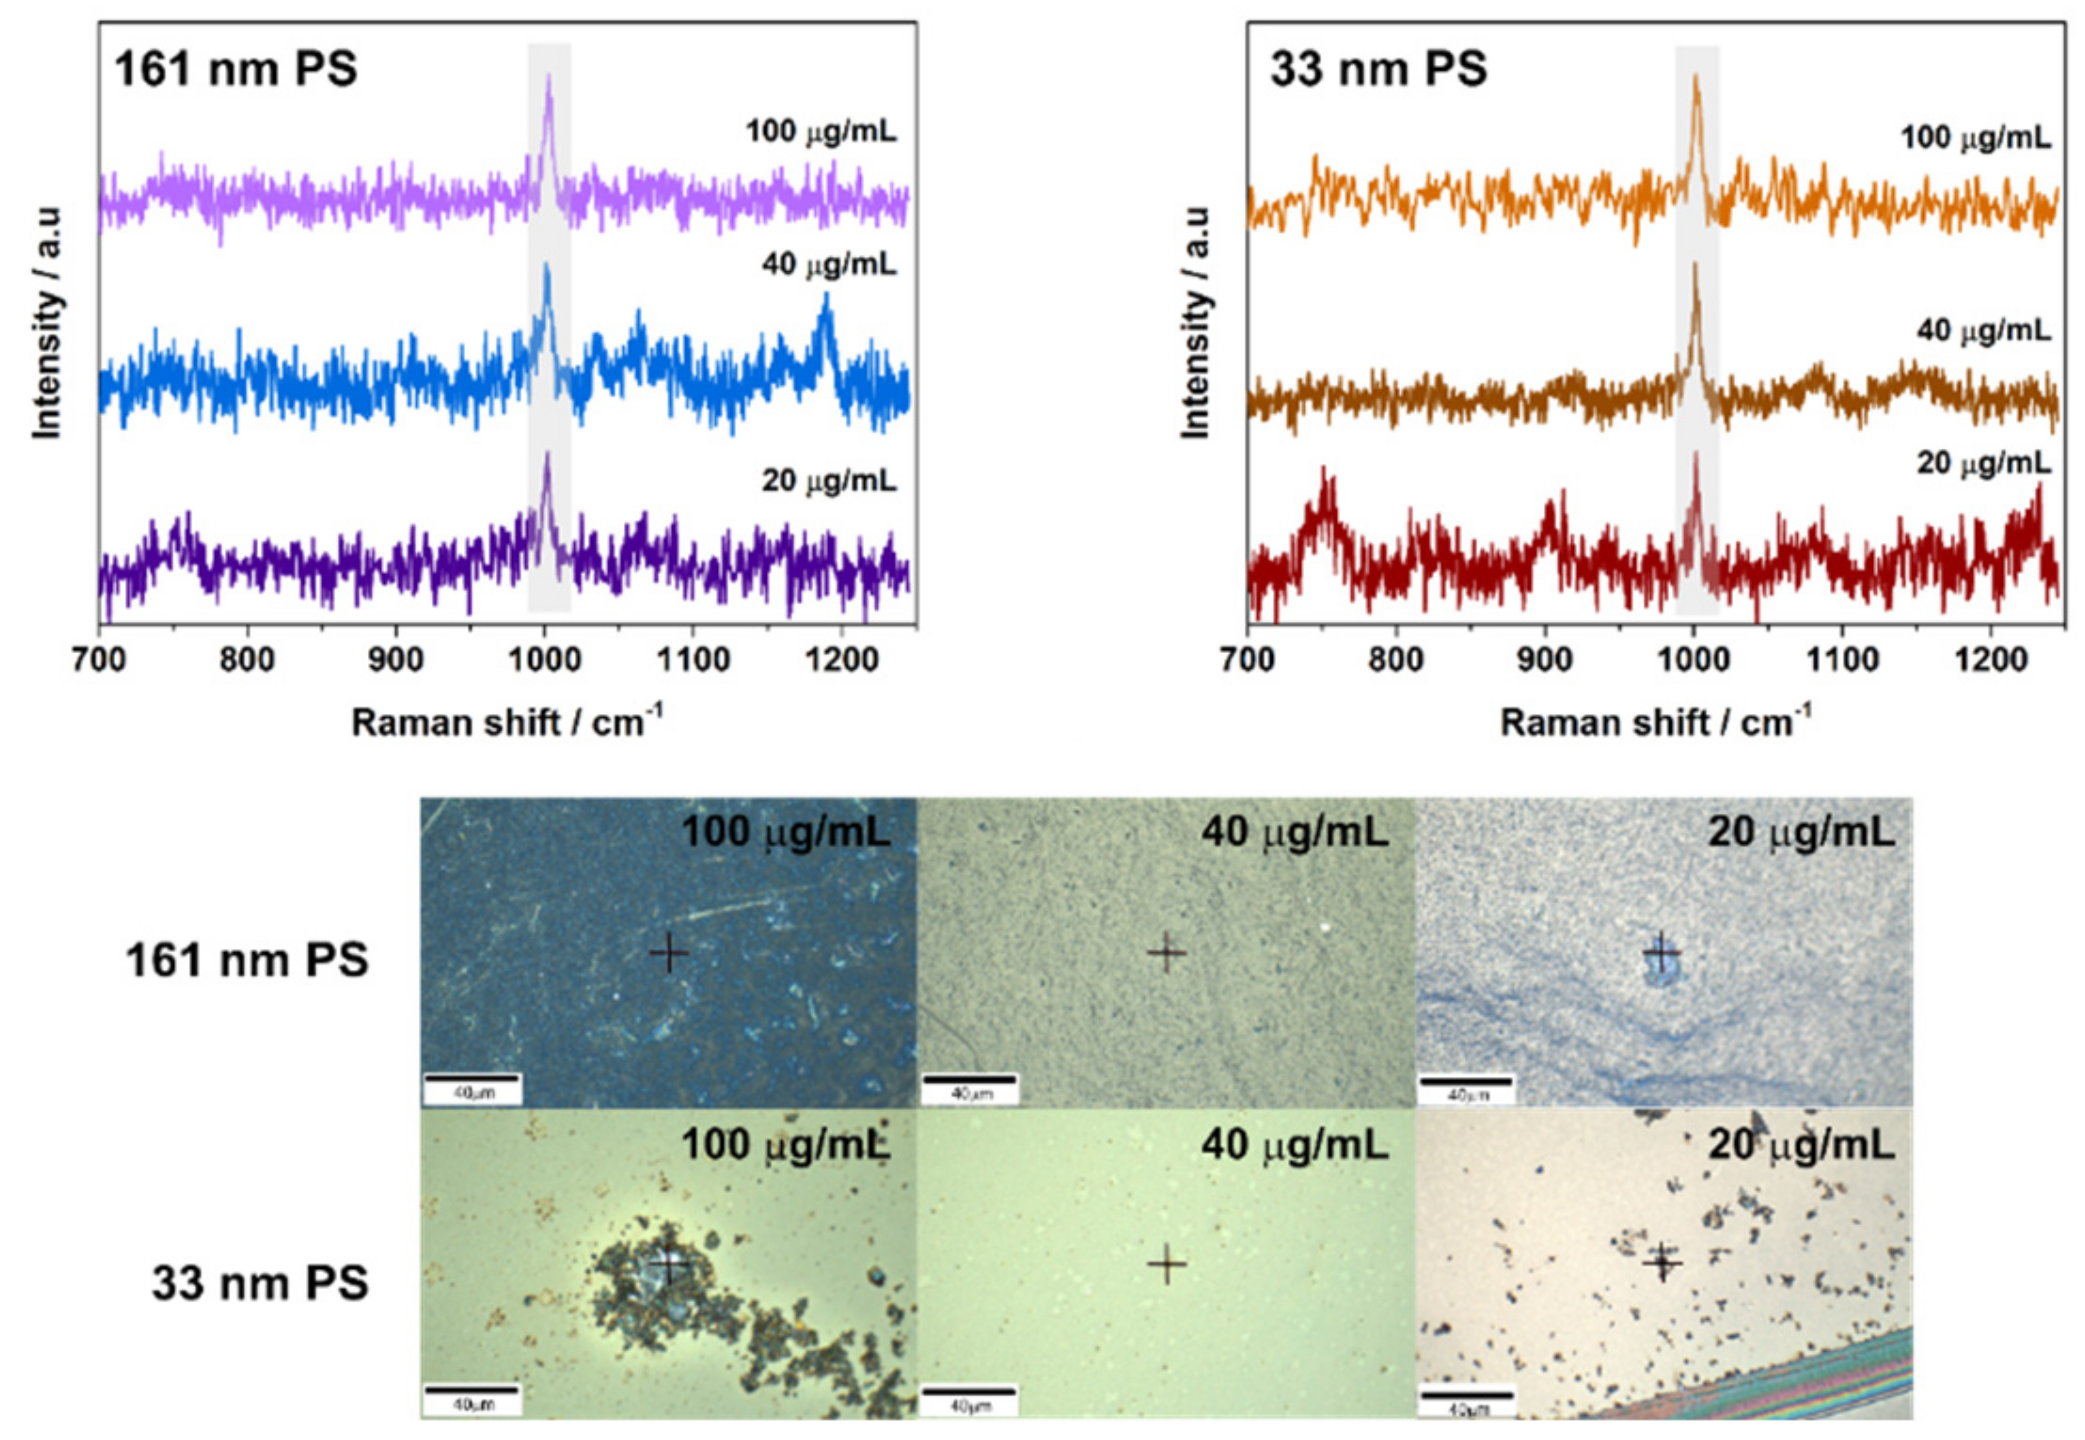
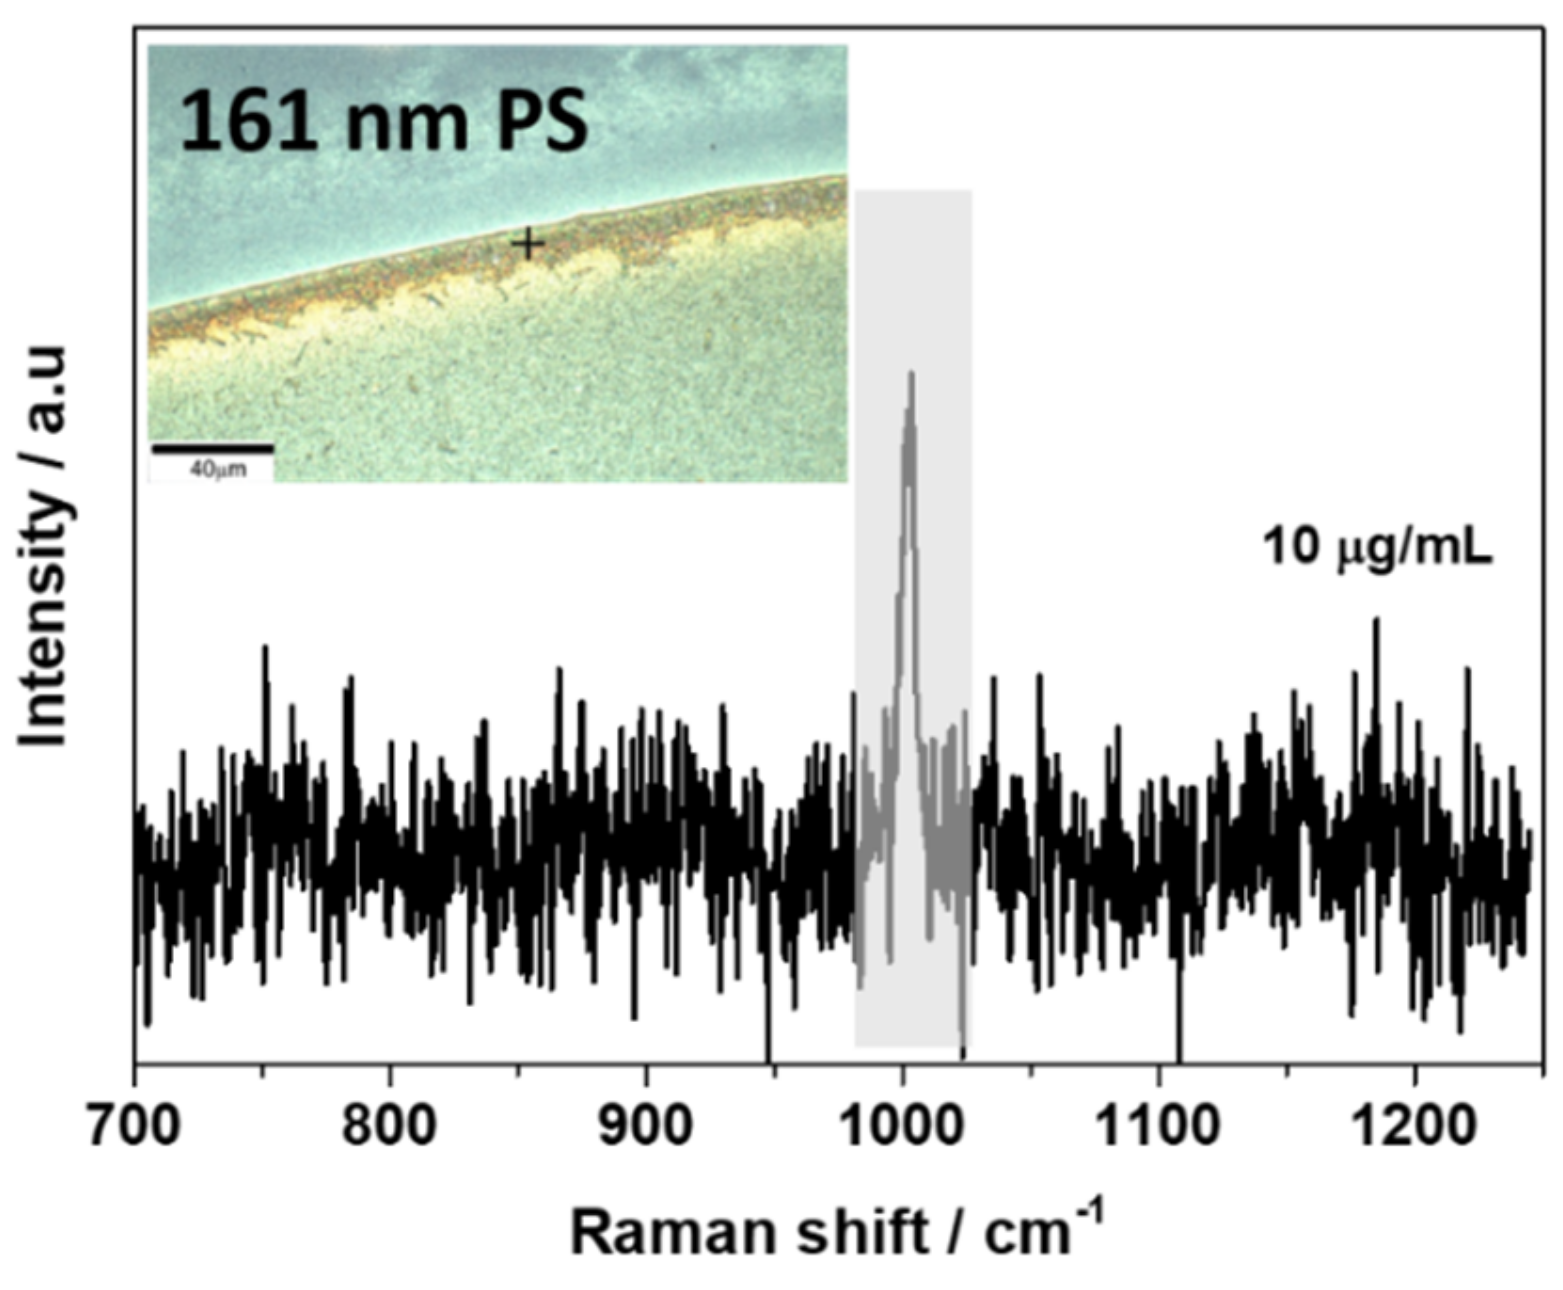
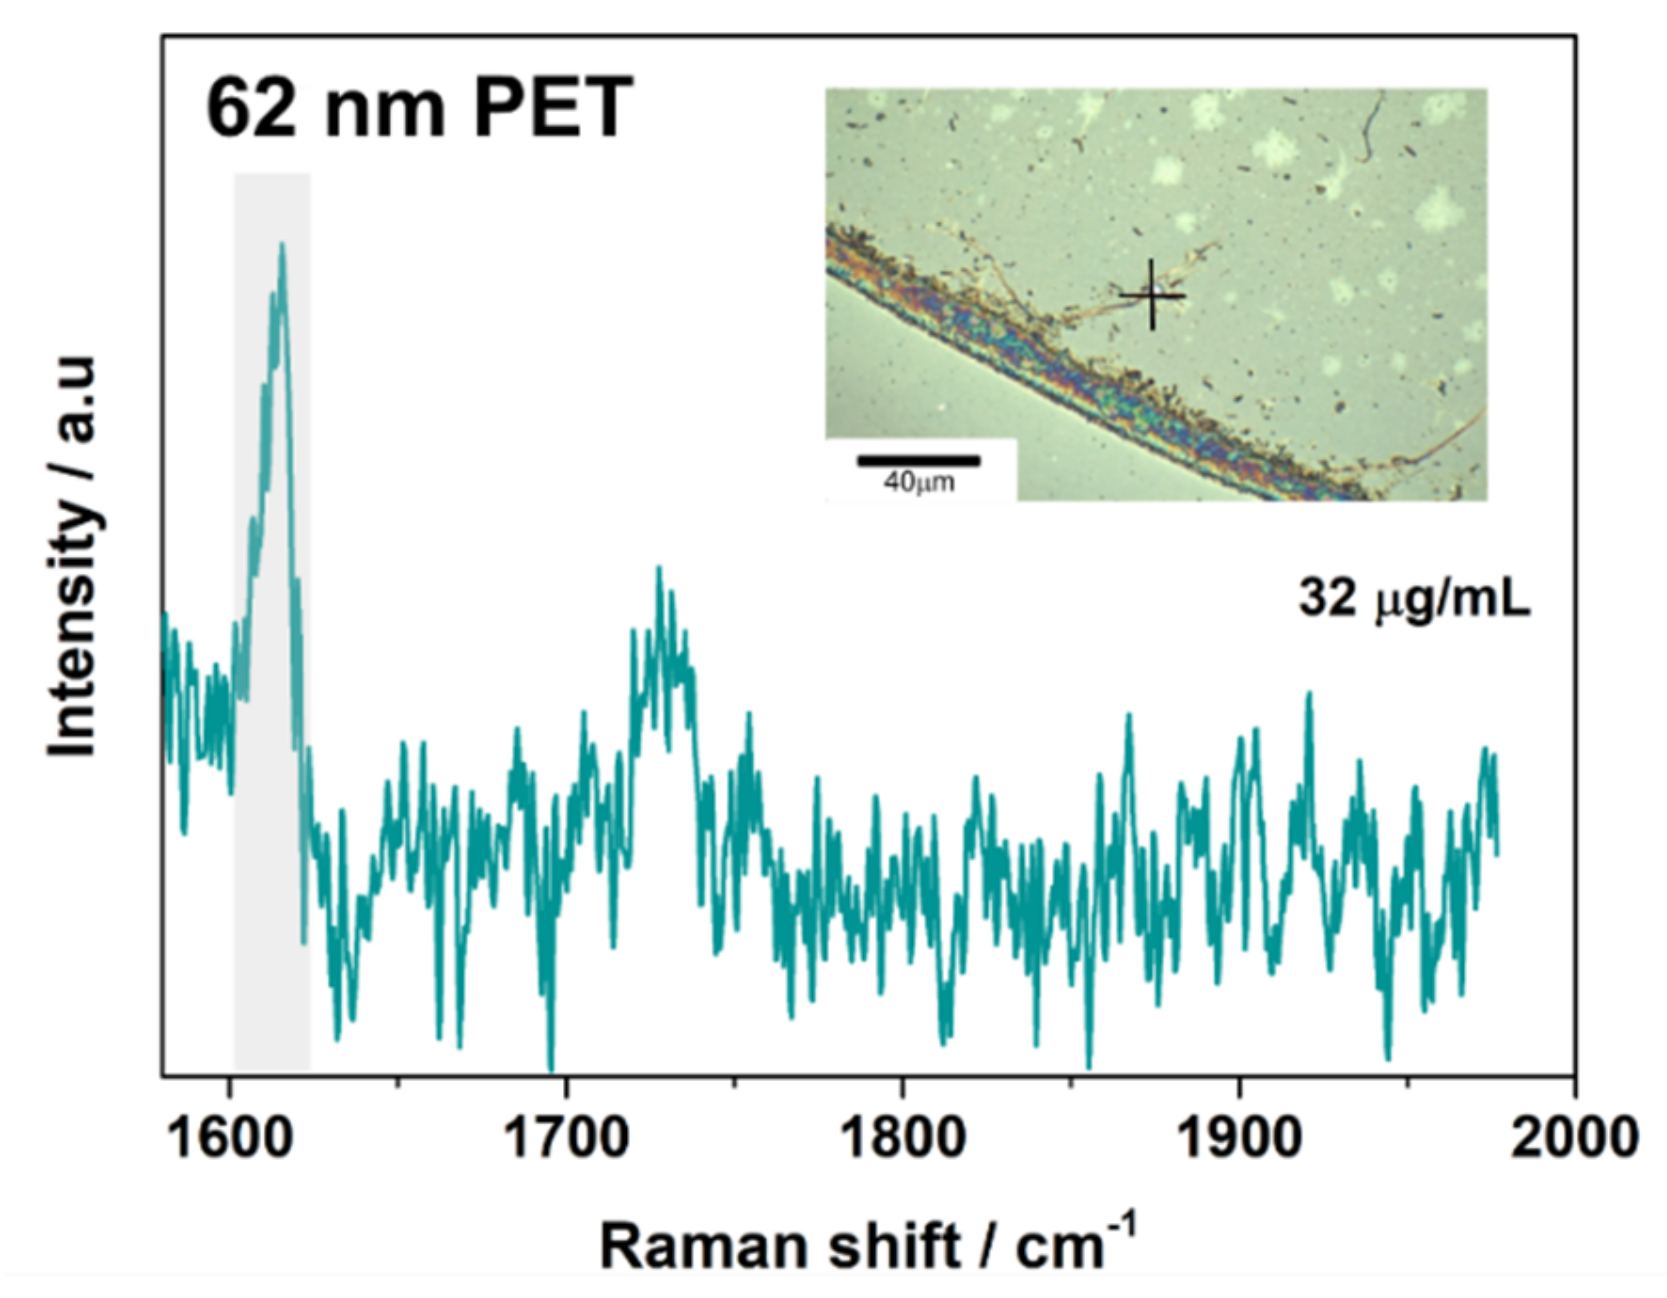
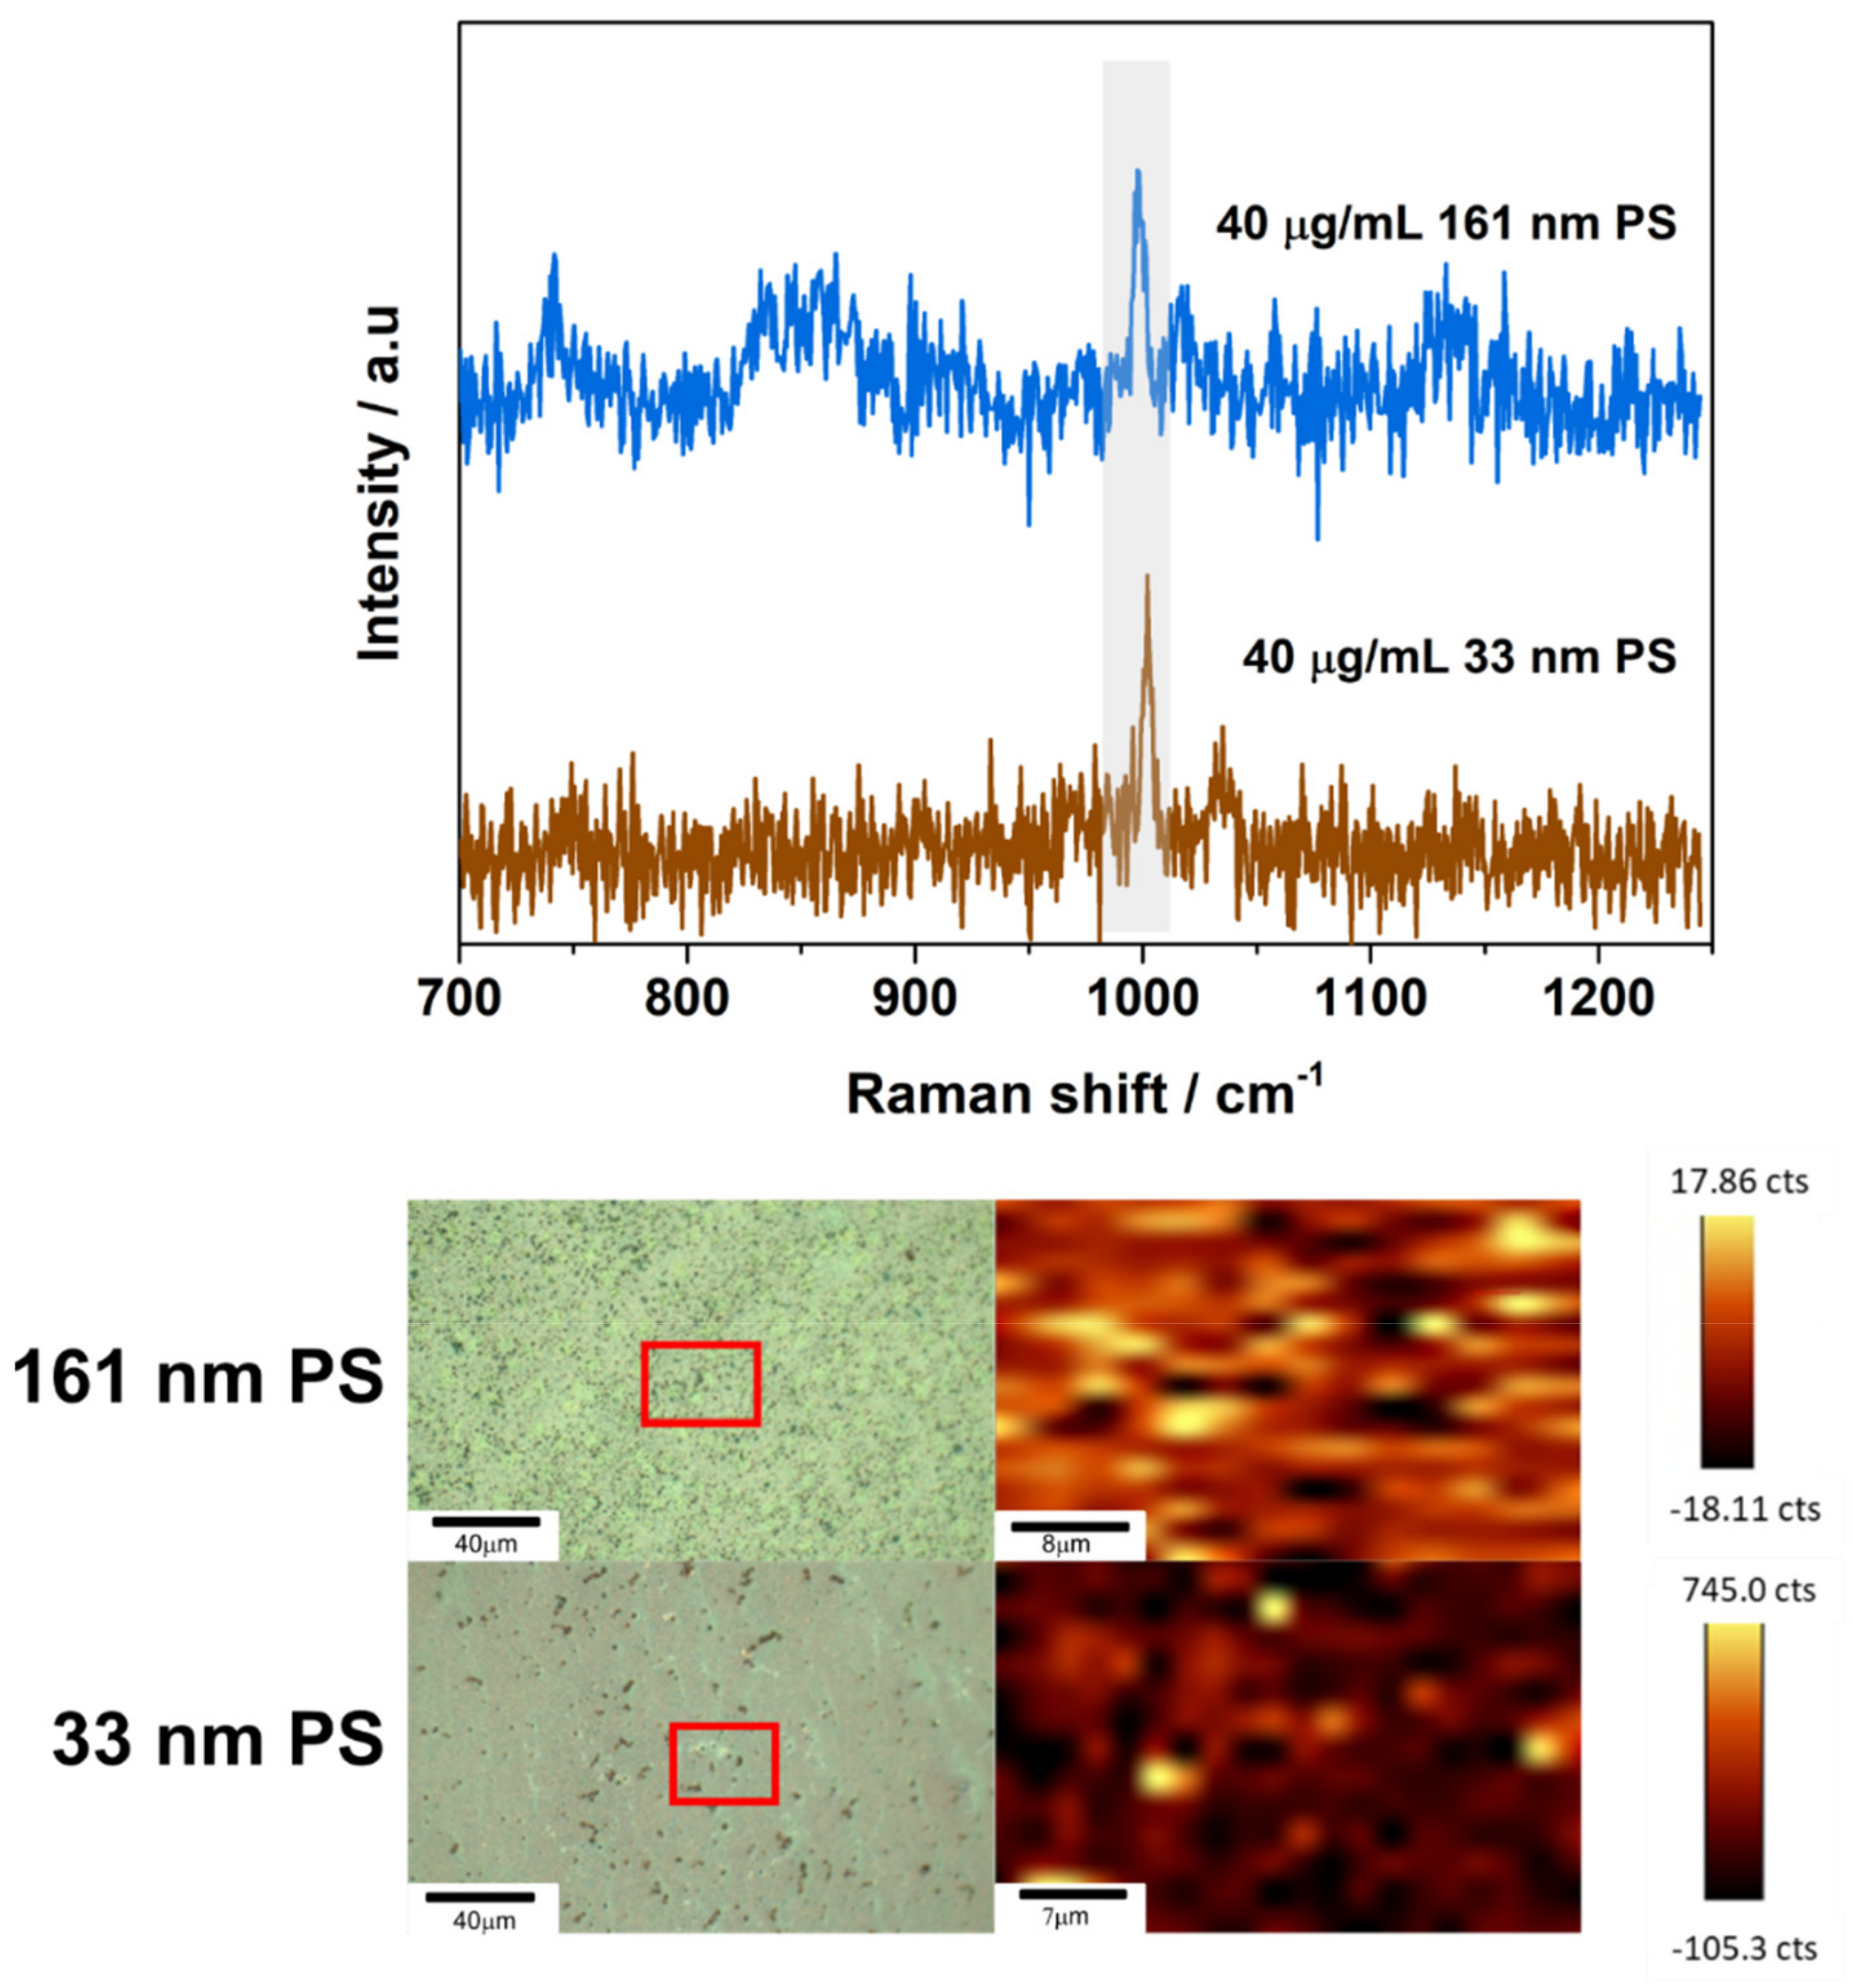
3.2. SERS Detection of 161 nm PS, 33 nm PS, and 62 nm PET Particles
3.3. Analytical Enhancement Factor (AEF)
4. Discussion and Conclusions
Author Contributions
Funding
Data Availability Statement
Acknowledgments
Conflicts of Interest
Appendix A. Expanded Characterization Details


| Sample | Substrate | Laser Power (mW) | Scan Speed (s) | Number of Accumulations |
|---|---|---|---|---|
| 161 nm PS Raman Control | Glass | 40 | 1 | 60 |
| 100 µg/mL of 161 nm PS | 46 nm AuNPs | 7 | 1 | 300 |
| 100 µg/mL of 161 nm PS-Mapping | 46 nm AuNPs | 7 | 1 | _ |
| 100 µg/mL of 161 nm PS | 14 nm AuNPs | 5 | 1 | 40 |
| 100 µg/mL of 161 nm PS | Glass | 45 | 1 | 50 |
| 40 µg/mL of 161 nm PS | 46 nm AuNPs | 7 | 1 | 100 |
| 40 µg/mL of 161 nm PS-Mapping | 46 nm AuNPs | 4 | 1 | _ |
| 40 µg/mL of 161 nm PS | 14 nm AuNPs | 4 | 1 | 40 |
| 40 µg/mL of 161 nm PS | Glass | 7 | 1 | 50 |
| 20 µg/mL of 161 nm PS | 46 nm AuNPs | 12 | 1 | 100 |
| 20 µg/mL of 161 nm PS | 14 nm AuNPs | 12 | 1 | 100 |
| 20 µg/mL of 161 nm PS | Glass | 15 | 1 | 100 |
| 10 µg/mL of 161 nm PS | 46 nm AuNPs | 7 | 1 | 100 |
| 10 µg/mL of 161 nm PS | Glass | 45 | 1 | 100 |
| 100 µg/mL of 33 nm PS | 46 nm AuNPs | 2 | 1 | 25 |
| 100 µg/mL of 33 nm PS-Mapping | 46 nm AuNPs | 2 | 1 | _ |
| 100 µg/mL of 33 nm PS | 14 nm AuNPs | 20 | 1 | 100 |
| 100 µg/mL of 33 nm PS | Glass | 2 | 1 | 50 |
| 40 µg/mL of 33 nm PS | 46 nm AuNPs | 2 | 1 | 50 |
| 40 µg/mL of 33 nm PS-Mapping | 46 nm AuNPs | 2 | 1 | _ |
| 40 µg/mL of 33 nm PS | 14 nm AuNPs | 7 | 1 | 25 |
| 40 µg/mL of 33 nm PS | Glass | 2 | 1 | 50 |
| 20 µg/mL of 33 nm PS | 46 nm AuNPs | 15 | 1 | 100 |
| 20 µg/mL of 33 nm PS | 14 nm AuNPs | 10 | 1 | 100 |
| 20 µg/mL of 33 nm PS | Glass | 45 | 1 | 100 |
| PET Microparticle Raman Control | Glass | 30 | 1 | 25 |
| 32 µg/mL of 62 nm PET | 46 nm AuNPs | 10 | 1 | 100 |
| 32 µg/mL of 62 nm PET | 14 nm AuNPs | 8 | 1 | 50 |
| 32 µg/mL of 62 nm PET | Glass | 45 | 1 | 100 |
| 15 µg/mL of 62 PET | 46 nm AuNPs | 7 | 1 | 100 |
| 15 µg/mL of 62 PET | Glass | 45 | 1 | 100 |
| Glass Slide Only Control–Raman Shift 700–1250 cm−1 | _ | 7 | 1 | 50 |
| Slide@PAH@46nmAu Control–Raman Shift 700–1250 cm−1 | _ | 7 | 1 | 50 |
| Slide@PAH@14nmAu Control–Raman Shift 700–1250 cm−1 | _ | 7 | 1 | 50 |
| Glass Slide Only Control–Raman Shift 1580–2000 cm−1 | _ | 12 | 1 | 100 |
| Slide@PAH@46nmAu Control–Raman Shift 1580–2000 cm−1 | _ | 7 | 1 | 50 |
| Slide@PAH@14nmAu Control–Raman Shift 1580–2000 cm−1 | _ | 7 | 1 | 50 |
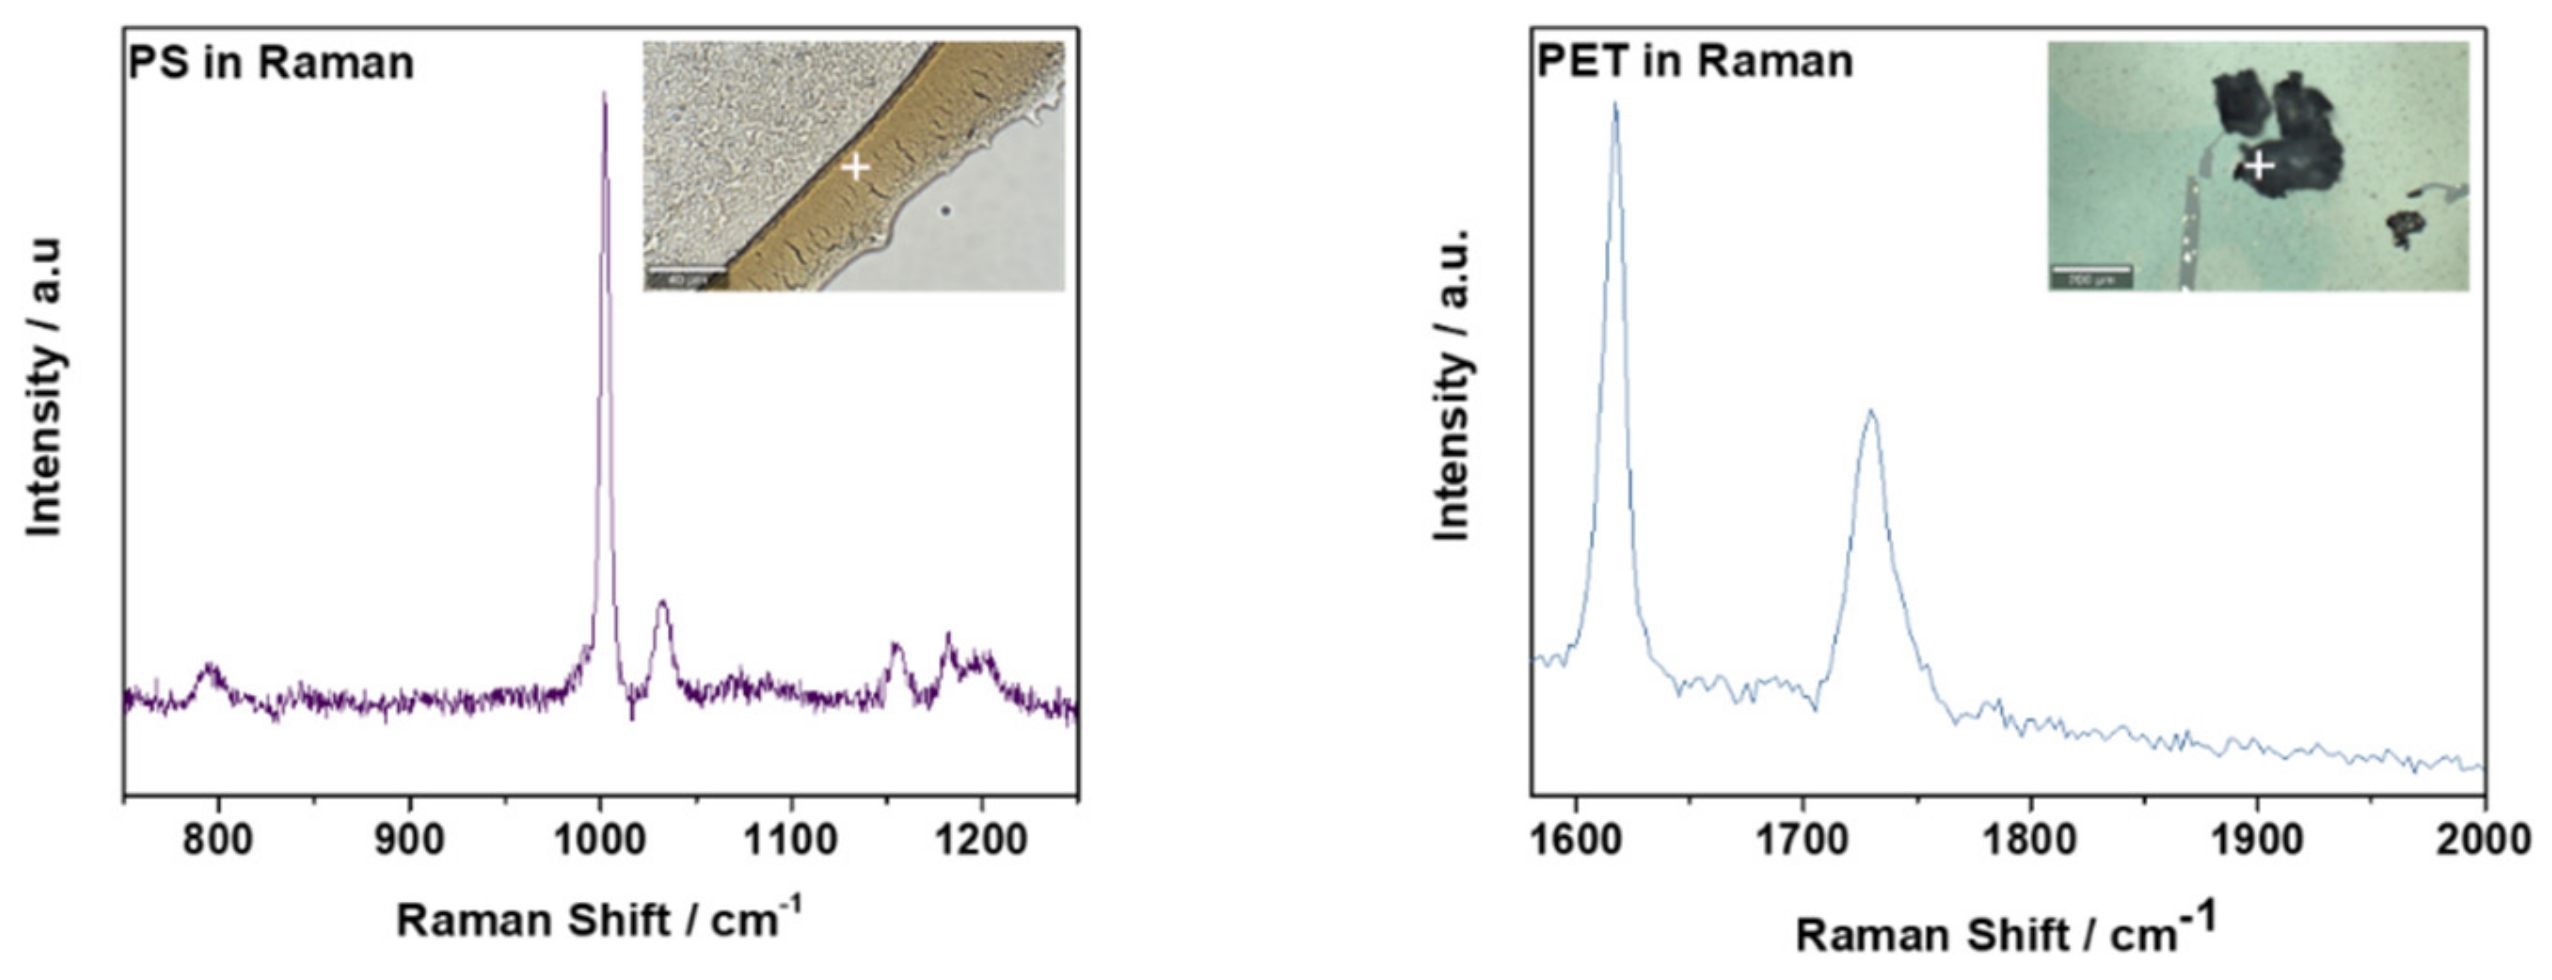
| Raman Shift (cm−1) | Assignment | |
|---|---|---|
| PS | ~1002 | C–C ring breathing mode [16] |
| ~1032 | C–H in-plane deformation, β(C–H) [16] | |
| PET | ~1615–1620 | Aromatic bending vibrations [8,39] |
| ~1730 | Carbonyl stretching mode [39,40] |


References
- Gündoğdu, S. Contamination of table salts from Turkey with microplastics. Food Addit. Contam. Part A 2018, 35, 1006–1014. [Google Scholar] [CrossRef] [PubMed]
- Van Cauwenberghe, L.; Janssen, C.R. Microplastics in bivalves cultured for human consumption. Environ. Pollut. 2014, 193, 65–70. [Google Scholar] [CrossRef] [PubMed]
- Wagner, J.; Wang, Z.-M.; Ghosal, S.; Rochman, C.; Gassel, M.; Wall, S. Novel method for the extraction and identification of microplastics in ocean trawl and fish gut matrices. Anal. Methods 2017, 9, 1479–1490. [Google Scholar] [CrossRef]
- Sobhani, Z.; Al Amin, M.; Naidu, R.; Megharaj, M.; Fang, C. Identification and visualisation of microplastics by Raman mapping. Anal. Chim. Acta 2019, 1077, 191–199. [Google Scholar] [CrossRef] [PubMed]
- Allen, S.; Allen, D.; Phoenix, V.R.; Le Roux, G.; Durántez Jiménez, P.; Simonneau, A.; Binet, S.; Galop, D. Atmospheric transport and deposition of microplastics in a remote mountain catchment. Nat. Geosci. 2019, 12, 339–344. [Google Scholar] [CrossRef]
- Lenz, R.; Enders, K.; Nielsen, T.G. Microplastic exposure studies should be environmentally realistic. Proc. Natl. Acad. Sci. USA 2016, 113, E4121–E4122. [Google Scholar] [CrossRef]
- Ter Halle, A.; Jeanneau, L.; Martignac, M.; Jardé, E.; Pedrono, B.; Brach, L.; Gigault, J. Nanoplastic in the North Atlantic Subtropical Gyre. Environ. Sci. Technol. 2017, 51, 13689–13697. [Google Scholar] [CrossRef] [PubMed]
- Käppler, A.; Fischer, D.; Oberbeckmann, S.; Schernewski, G.; Labrenz, M.; Eichhorn, K.-J.; Voit, B. Analysis of environmental microplastics by vibrational microspectroscopy: FTIR, Raman or both? Anal. Bioanal. Chem. 2016, 408, 8377–8391. [Google Scholar] [CrossRef] [PubMed]
- Renner, G.; Schmidt, T.C.; Schram, J. Analytical methodologies for monitoring micro(nano)plastics: Which are fit for purpose? Curr. Opin. Environ. Sci. Health 2018, 1, 55–61. [Google Scholar] [CrossRef]
- Gardiner, D.J. Introduction to Raman Scattering. In Practical Raman Spectroscopy; Gardiner, D.J., Graves, P.R., Eds.; Springer: Berlin/Heidelberg, Germany, 1989; pp. 1–12. [Google Scholar]
- Jones, R.R.; Hooper, D.C.; Zhang, L.; Wolverson, D.; Valev, V.K. Raman Techniques: Fundamentals and Frontiers. Nanoscale Res. Lett. 2019, 14, 231. [Google Scholar] [CrossRef]
- Rayleigh, L. On the Theory of Optical Images, with special reference to the Microscope. J. R. Microsc. Soc. 1903, 23, 474–482. [Google Scholar] [CrossRef]
- Nie, S.; Emory, S.R. Probing Single Molecules and Single Nanoparticles by Surface-Enhanced Raman Scattering. Science 1997, 275, 1102–1106. [Google Scholar] [CrossRef] [PubMed]
- Rodríguez-Lorenzo, L.; Álvarez-Puebla, R.A.; de Abajo, F.J.G.; Liz-Marzán, L.M. Surface Enhanced Raman Scattering Using Star-Shaped Gold Colloidal Nanoparticles. J. Phys. Chem. C 2010, 114, 7336–7340. [Google Scholar] [CrossRef]
- Chalabi, H.; Schoen, D.; Brongersma, M.L. Hot-Electron Photodetection with a Plasmonic Nanostripe Antenna. Nano Lett. 2014, 14, 1374–1380. [Google Scholar] [CrossRef]
- Xu, G.; Cheng, H.; Jones, R.; Feng, Y.; Gong, K.; Li, K.; Fang, X.; Tahir, M.A.; Valev, V.K.; Zhang, L. Surface-Enhanced Raman Spectroscopy Facilitates the Detection of Microplastics <1 μm in the Environment. Environ. Sci. Technol. 2020, 54, 15594–15603. [Google Scholar] [CrossRef]
- European Commission. Commission recommendation of 18 October 2011 on the definition of nanomaterial. Off. J. Eur. Union 2011, 275, 38. [Google Scholar]
- Lv, L.; He, L.; Jiang, S.; Chen, J.; Zhou, C.; Qu, J.; Lu, Y.; Hong, P.; Sun, S.; Li, C. In situ surface-enhanced Raman spectroscopy for detecting microplastics and nanoplastics in aquatic environments. Sci. Total Environ. 2020, 728, 138449. [Google Scholar] [CrossRef]
- Langer, J.; Jimenez de Aberasturi, D.; Aizpurua, J.; Alvarez-Puebla, R.A.; Auguié, B.; Baumberg, J.J.; Bazan, G.C.; Bell, S.E.J.; Boisen, A.; Brolo, A.G.; et al. Present and Future of Surface-Enhanced Raman Scattering. ACS Nano 2020, 14, 28–117. [Google Scholar] [CrossRef]
- Kneipp, K.; Kneipp, H.; Itzkan, I.; Dasari, R.R.; Feld, M.S. Ultrasensitive chemical analysis by Raman spectroscopy. Chem. Rev. 1999, 99, 2957–2976. [Google Scholar] [CrossRef]
- Steinmetz, L.; Geers, C.; Balog, S.; Bonmarin, M.; Rodriguez-Lorenzo, L.; Taladriz-Blanco, P.; Rothen-Rutishauser, B.; Petri-Fink, A. A comparative study of silver nanoparticle dissolution under physiological conditions. Nanoscale Adv. 2020, 2, 5760–5768. [Google Scholar] [CrossRef]
- Caldwell, J.; Lehner, R.; Balog, S.; Rhême, C.; Gao, X.; Septiadi, D.; Weder, C.; Fink, A.S.; Rothen-Rutishauser, B. Fluorescent Plastic Nanoparticles to Track their Interaction and Fate in Physiological Environments. Environ. Sci. Nano 2021, 8, 502–513. [Google Scholar] [CrossRef]
- Enustun, B.; Turkevich, J. Coagulation of colloidal gold. J. Am. Chem. Soc. 1963, 85, 3317–3328. [Google Scholar] [CrossRef]
- Brown, K.R.; Natan, M.J. Hydroxylamine Seeding of Colloidal Au Nanoparticles in Solution and on Surfaces. Langmuir 1998, 14, 726–728. [Google Scholar] [CrossRef]
- Schindelin, J.; Arganda-Carreras, I.; Frise, E.; Kaynig, V.; Longair, M.; Pietzsch, T.; Preibisch, S.; Rueden, C.; Saalfeld, S.; Schmid, B.; et al. Fiji: An open-source platform for biological-image analysis. Nature Methods 2012, 9, 676–682. [Google Scholar] [CrossRef]
- Bubniene, U.; Oćwieja, M.; Bugelyte, B.; Adamczyk, Z.; Nattich-Rak, M.; Voronovic, J.; Ramanaviciene, A.; Ramanavicius, A. Deposition of gold nanoparticles on mica modified by poly(allylamine hydrochloride) monolayers. Colloids Surf. A Physicochem. Eng. Asp. 2014, 441, 204–210. [Google Scholar] [CrossRef]
- Liu, Z.; Yan, Z.; Bai, L. Layer-by-layer assembly of polyelectrolyte and gold nanoparticle for highly reproducible and stable SERS substrate. Appl. Surf. Sci. 2016, 360, 437–441. [Google Scholar] [CrossRef]
- Vial, S.; Pastoriza-Santos, I.; Pérez-Juste, J.; Liz-Marzán, L.M. Plasmon Coupling in Layer-by-Layer Assembled Gold Nanorod Films. Langmuir 2007, 23, 4606–4611. [Google Scholar] [CrossRef]
- Deegan, R.D.; Bakajin, O.; Dupont, T.F.; Huber, G.; Nagel, S.R.; Witten, T.A. Capillary flow as the cause of ring stains from dried liquid drops. Nature 1997, 389, 827–829. [Google Scholar] [CrossRef]
- Yang, J.; Kim, H.; Lee, C.; Kim, S.; Wang, J.; Yoon, S.; Park, J.; Kim, J. Phase-field modeling and computer simulation of the coffee-ring effect. Theor. Comput. Fluid Dyn. 2020, 34, 679–692. [Google Scholar] [CrossRef]
- Lohani, D.; Basavaraj, M.G.; Satapathy, D.K.; Sarkar, S. Coupled effect of concentration, particle size and substrate morphology on the formation of coffee rings. Colloids Surf. A Physicochem. Eng. Asp. 2020, 589, 124387. [Google Scholar] [CrossRef]
- Le Ru, E.C.; Etchegoin, P.G. Quantifying SERS enhancements. MRS Bull. 2013, 38, 631–640. [Google Scholar] [CrossRef]
- Joseph, V.; Matschulat, A.; Polte, J.; Rolf, S.; Emmerling, F.; Kneipp, J. SERS enhancement of gold nanospheres of defined size. J. Raman Spectrosc. 2011, 42, 1736–1742. [Google Scholar] [CrossRef]
- Link, S.; El-Sayed, M.A. Size and Temperature Dependence of the Plasmon Absorption of Colloidal Gold Nanoparticles. J. Phys. Chem. B 1999, 103, 4212–4217. [Google Scholar] [CrossRef]
- Zhu, Z.; Zhu, T.; Liu, Z. Raman scattering enhancement contributed from individual gold nanoparticles and interparticle coupling. Nanotechnology 2004, 15, 357–364. [Google Scholar] [CrossRef]
- Israelsen, N.D.; Hanson, C.; Vargis, E. Nanoparticle Properties and Synthesis Effects on Surface-Enhanced Raman Scattering Enhancement Factor: An Introduction. Sci. World J. 2015, 2015, 124582. [Google Scholar] [CrossRef]
- Besseling, E.; Wang, B.; Lürling, M.; Koelmans, A.A. Nanoplastic Affects Growth of S. obliquus and Reproduction of D. magna. Environ. Sci. Technol. 2014, 48, 12336–12343. [Google Scholar] [CrossRef]
- Lê, Q.T.; Ly, N.H.; Kim, M.-K.; Lim, S.H.; Son, S.J.; Zoh, K.-D.; Joo, S.-W. Nanostructured Raman substrates for the sensitive detection of submicrometer-sized plastic pollutants in water. J. Hazard. Mater. 2021, 402, 123499. [Google Scholar] [CrossRef]
- Rebollar, E.; Pérez, S.; Hernández, M.; Domingo, C.; Martín, M.; Ezquerra, T.A.; García-Ruiz, J.P.; Castillejo, M. Physicochemical modifications accompanying UV laser induced surface structures on poly(ethylene terephthalate) and their effect on adhesion of mesenchymal cells. Phys. Chem. Chem. Phys. 2014, 16, 17551–17559. [Google Scholar] [CrossRef]
- Allen, V.; Kalivas, J.H.; Rodriguez, R.G. Post-Consumer Plastic Identification Using Raman Spectroscopy. Appl. Spectrosc. 1999, 53, 672–681. [Google Scholar] [CrossRef]


| Core Size 2 (nm) | Hydrodynamic Diameter (nm) | Zeta Potential (mV) | |
|---|---|---|---|
| 46 nm AuNPs | 46 ± 5 | 58 ± 1 | −13.3 ± 2.5 |
| 14 nm AuNPs | 14 ± 1 | 23 ± 1 | −40.2 ± 2.5 |
| 161 nm PS particles | 161 ± 15 | 192 ± 4 | −45.1 ± 2.3 |
| 33 nm PS particles | 33 ± 6 | 40 ± 1 | −16.9 ± 1.8 |
| 62 nm PET 1 particles | 62 ± 38 | 146 ± 1 | −28.6 ± 1.0 |
| AEF on 46 nm AuNPs | AEF on 14 nm AuNPs | |
|---|---|---|
| 100 µg/mL of 161 nm PS | 63.6 | 23.2 |
| 40 µg/mL of 161 nm PS | 445.7 | 50.9 |
| 20 µg/mL of 161 nm PS | 380.0 | 360.0 |
| 10 µg/mL of 161 nm PS | 37.0 | ---- |
| 100 µg/mL of 33 nm PS | 97.5 | 13.6 |
| 40 µg/mL of 33 nm PS | 53.1 | 23.0 |
| 20 µg/mL of 33 nm PS | 56.7 | 126.7 |
| 32 µg/mL of 62 nm PET | 185.4 | 63.1 |
| 15 µg/mL of 62 PET | 32.8 | ---- |
Publisher’s Note: MDPI stays neutral with regard to jurisdictional claims in published maps and institutional affiliations. |
© 2021 by the authors. Licensee MDPI, Basel, Switzerland. This article is an open access article distributed under the terms and conditions of the Creative Commons Attribution (CC BY) license (https://creativecommons.org/licenses/by/4.0/).
Share and Cite
Caldwell, J.; Taladriz-Blanco, P.; Rothen-Rutishauser, B.; Petri-Fink, A. Detection of Sub-Micro- and Nanoplastic Particles on Gold Nanoparticle-Based Substrates through Surface-Enhanced Raman Scattering (SERS) Spectroscopy. Nanomaterials 2021, 11, 1149. https://doi.org/10.3390/nano11051149
Caldwell J, Taladriz-Blanco P, Rothen-Rutishauser B, Petri-Fink A. Detection of Sub-Micro- and Nanoplastic Particles on Gold Nanoparticle-Based Substrates through Surface-Enhanced Raman Scattering (SERS) Spectroscopy. Nanomaterials. 2021; 11(5):1149. https://doi.org/10.3390/nano11051149
Chicago/Turabian StyleCaldwell, Jessica, Patricia Taladriz-Blanco, Barbara Rothen-Rutishauser, and Alke Petri-Fink. 2021. "Detection of Sub-Micro- and Nanoplastic Particles on Gold Nanoparticle-Based Substrates through Surface-Enhanced Raman Scattering (SERS) Spectroscopy" Nanomaterials 11, no. 5: 1149. https://doi.org/10.3390/nano11051149
APA StyleCaldwell, J., Taladriz-Blanco, P., Rothen-Rutishauser, B., & Petri-Fink, A. (2021). Detection of Sub-Micro- and Nanoplastic Particles on Gold Nanoparticle-Based Substrates through Surface-Enhanced Raman Scattering (SERS) Spectroscopy. Nanomaterials, 11(5), 1149. https://doi.org/10.3390/nano11051149