
Optical Platform to Analyze a Model Drug-Loading and Releasing Profile Based on Nanoporous Anodic Alumina Gradient Index Filters


Abstract

1. Introduction
2. Materials and Methods
2.1. Materials
2.2. Fabrication of NAA-GIFs
2.3. Polyelectrolytes Deposition
2.4. Rh6G Loading
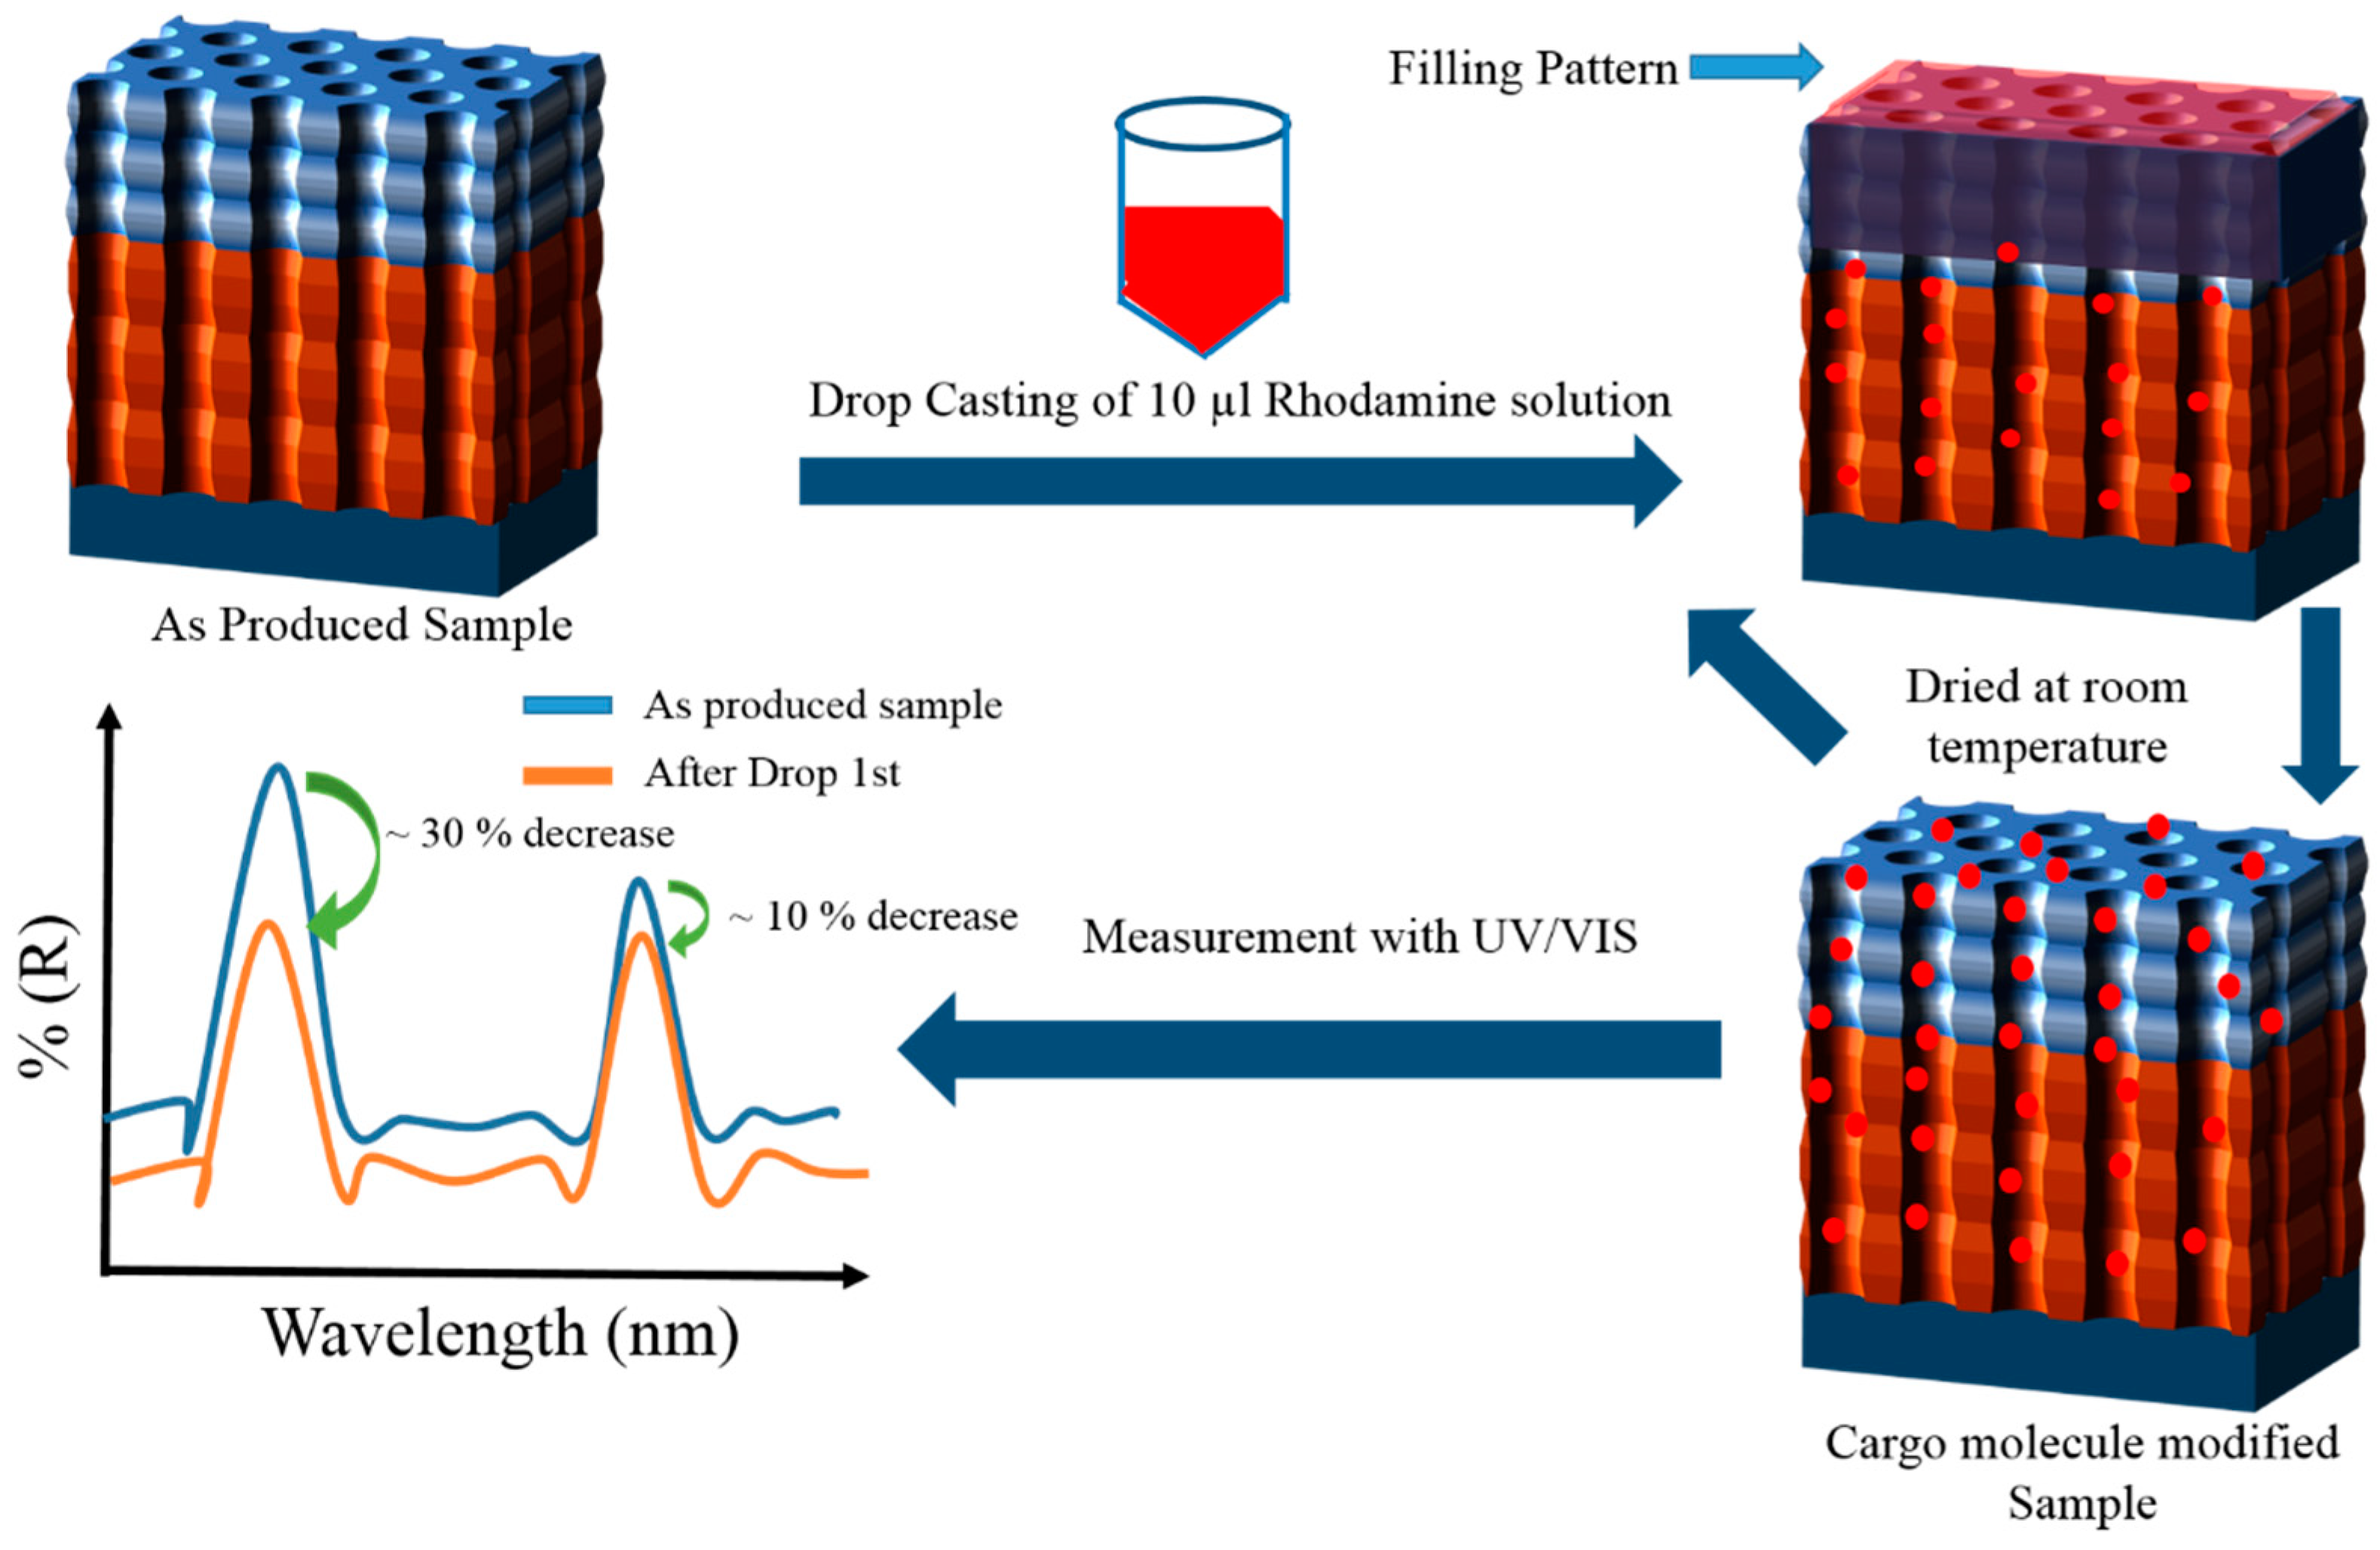
- In the first method, also denoted as the drop/dry method, the relative height of the photonic stopbands were tested and verified along with the simulations by only using Rh6G dye inside NAA-GIFs. To achieve this, 10 µL drop of the cargo molecule (1 mg/mL) in water was dropped onto the surface of NAA-GIFs and dried at room temperature. In total, 6 drop/dry cycles were performed, followed by measurement with UV-Visible spectroscopy after each cycle (Figure 3). This method does not involve the incorporation of polyelectrolytes or other modifications inside the NAA-GIFs.
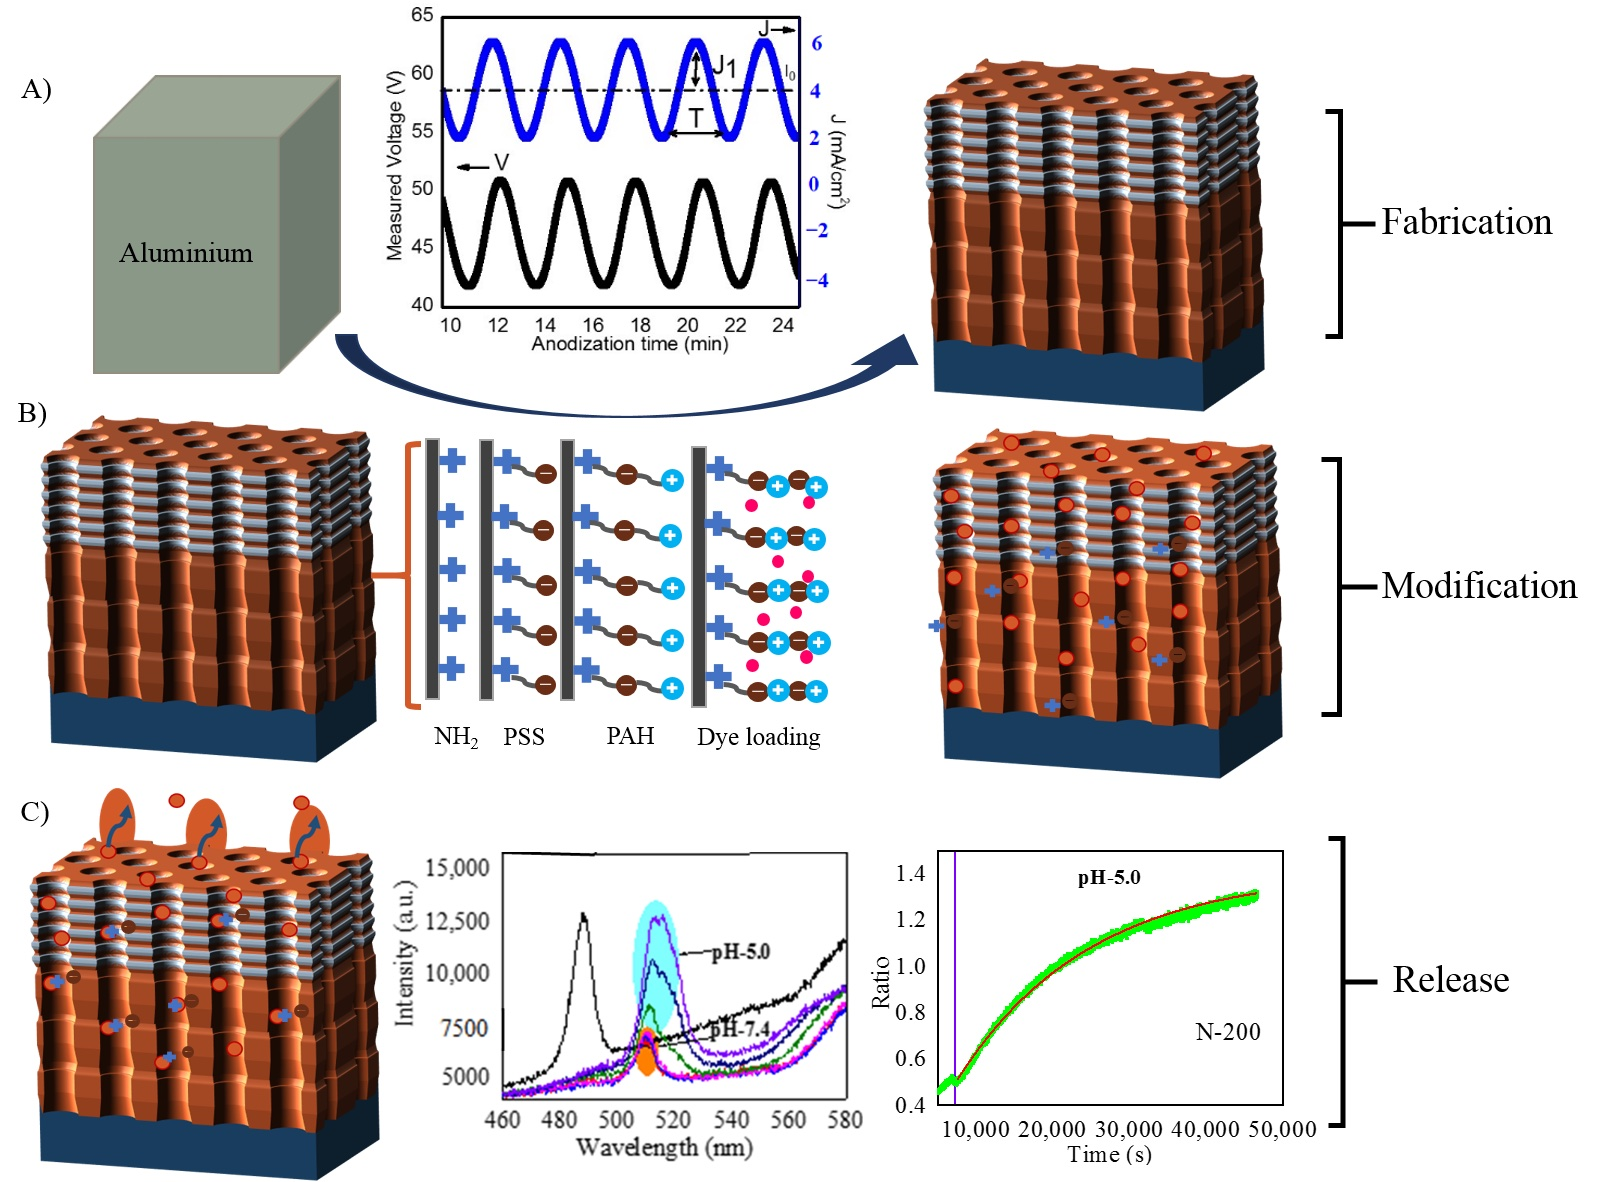
- In a separate set of experiments, keeping in mind the swelling/contraction nature of PSS/PAH polyelectrolytes at acidic and alkaline pH, respectively, NAA-GIFs after the APTES and polyelectrolyte functionalization were first placed in acidic solution of Rh6G dye in water (100 µg/mL) having pH of 2.4 with a mild stirring overnight for the incorporation of dye molecules. Afterward, the pH was changed to 8.4, and samples were stirred for another 3 h, causing molecules to be trapped inside the multilayers. After successful deposition, the samples were thoroughly washed with deionized water to remove unwanted molecules from the surface.
2.5. Optical Characterization of NAA-GIFs
2.6. Numerical Simulation
2.7. Structural Characterization
3. Results and Discussion
3.1. Fabrication and Structural Characterization of NAA-GIFs
3.2. Optical Characterization and Numerical Modelling of NAA-GIFs
3.3. Dye Release Monitoring Using RIfS
4. Conclusions
Supplementary Materials
Author Contributions
Funding
Conflicts of Interest
References
- Law, C.S.; Marsal, L.F.; Santos, A. 9-Electrochemically engineered nanoporous photonic crystal structures for optical sensing and biosensing. In Handbook of Nanomaterials in Analytical Chemistry; Mustansar Hussain, C., Ed.; Elsevier: Amsterdam, The Netherlands, 2020; pp. 201–226. [Google Scholar] [CrossRef]
- Acosta, L.K.; Bertó-Roselló, F.; Xifre-Perez, E.; Santos, A.; Ferré-Borrull, J.; Marsal, L.F. Stacked Nanoporous Anodic Alumina Gradient-Index Filters with Tunable Multispectral Photonic Stopbands as Sensing Platforms. ACS Appl. Mater. Interfaces 2019, 11, 3360–3371. [Google Scholar] [CrossRef] [PubMed]
- Ferré-Borrull, J.; Pallarès, J.; Macías, G.; Marsal, L.F. Nanostructural Engineering of Nanoporous Anodic Alumina for Biosensing Applications. Materials 2014, 7, 5225–5253. [Google Scholar] [CrossRef] [PubMed]
- Kumeria, T.; Rahman, M.M.; Santos, A.; Ferré-Borrull, J.; Marsal, L.F.; Losic, D. Structural and optical nanoengineering of nanoporous anodic alumina rugate filters for real-time and label-free biosensing applications. Anal. Chem. 2014, 86, 1837–1844. [Google Scholar] [CrossRef]
- Kumeria, T.; Gulati, K.; Santos, A.; Losic, D. Real-time and in situ drug release monitoring from nanoporous implants under dynamic flow conditions by reflectometric interference spectroscopy. ACS Appl. Mater. Interfaces 2013, 5, 5436–5442. [Google Scholar] [CrossRef] [PubMed]
- Porta-i-Batalla, M.; Eckstein, C.; Xifré-Pérez, E.; Formentín, P.; Ferré-Borrull, J.; Marsal, L.F. Sustained, Controlled and Stimuli-Responsive Drug Release Systems Based on Nanoporous Anodic Alumina with Layer-by-Layer Polyelectrolyte. Nanoscale Res. Lett. 2016, 11, 1–9. [Google Scholar] [CrossRef]
- Kapruwan, P.; Ferré-Borrull, J.; Marsal, L.F. Nanoporous Anodic Alumina Platforms for Drug Delivery Applications: Recent Advances and Perspective. Adv. Mater. Interfaces 2020, 7, 2001133. [Google Scholar] [CrossRef]
- Liu, L.; Lim, S.Y.; Law, C.S.; Jin, B.; Abell, A.D.; Ni, G.; Santos, A. Light-confining semiconductor nanoporous anodic alumina optical microcavities for photocatalysis. J. Mater. Chem. A 2019, 7, 22514–22529. [Google Scholar] [CrossRef]
- Lim, S.Y.; Law, C.S.; Markovic, M.; Kirby, J.K.; Abell, A.D.; Santos, A. Engineering the Slow Photon Effect in Photoactive Nanoporous Anodic Alumina Gradient-Index Filters for Photocatalysis. ACS Appl. Mater. Interfaces 2018, 10, 24124–24136. [Google Scholar] [CrossRef]
- López, C. Materials Aspects of Photonic Crystals. Adv. Mater. 2003, 15, 1679–1704. [Google Scholar] [CrossRef]
- Masuda, H.; Ohya, M.; Asoh, H.; Nakao, M.; Nohtomi, M.; Tamamura, T. Photonic crystal using anodic porous alumina. Jpn. J. Appl. Phys. Part 2 Lett. 1999, 38, L1403. [Google Scholar] [CrossRef]
- Wang, G.; Wang, J.; Li, S.Y.; Zhang, J.W.; Wang, C.W. One-dimensional alumina photonic crystals with a narrow band gap and their applications to high-sensitivity concentration sensor and photoluminescence enhancement. Superlattices Microstruct. 2015, 86, 546–551. [Google Scholar] [CrossRef]
- Kuplicki, K.; Rowland, J.; Holmstrom, S.A. Photonic band gap in a disordered two-dimensional structure: Transmission properties of porous anodic alumina films. In Frontiers in Optics; Optical Society of America: Tucson, Arizona, 2003; p. WB4. [Google Scholar] [CrossRef]
- Masuda, H.; Ohya, M.; Nishio, K.; Asoh, H.; Nakao, M.; Nohtomi, M.; Yokoo, A.; Tamamura, T. Photonic band gap in anodic porous alumina with extremely high aspect ratio formed in phosphoric acid solution. Jpn. J. Appl. Phys. 2000, 39, L1039. [Google Scholar] [CrossRef]
- Amouzadeh Tabrizi, M.; Ferré-Borrull, J.; Marsal, L.F. Remote biosensor for the determination of trypsin by using nanoporous anodic alumina as a three-dimensional nanostructured material. Sci. Rep. 2020, 10, 2356. [Google Scholar] [CrossRef]
- Pol, L.; Acosta, L.K.; Ferré-Borrull, J.; Marsal, L.F. Aptamer-based nanoporous anodic alumina interferometric biosensor for real-time thrombin detection. Sensors 2019, 19, 4543. [Google Scholar] [CrossRef] [PubMed]
- Yong Wang, Y.W.; Dengguo Zhang, D.Z.; Shixiang Xu, S.X.; Biaogang Xu, B.X.; Zheng Dong, Z.D.; Tan Huang, T.H. Experimental evidence of photonic crystal waveguides with wide bandwidth in two-dimensional Al2O3 rods array. Chin. Opt. Lett. 2017, 15, 062301. [Google Scholar] [CrossRef]
- Macias, G.; Ferré-Borrull, J.; Pallarès, J.; Marsal, L.F. 1-D nanoporous anodic alumina rugate filters by means of small current variations for real-time sensing applications. Nanoscale Res. Lett. 2014, 9, 315. [Google Scholar] [CrossRef]
- Santos, A.; Yoo, J.H.; Rohatgi, C.V.; Kumeria, T.; Wang, Y.; Losic, D. Realisation and advanced engineering of true optical rugate filters based on nanoporous anodic alumina by sinusoidal pulse anodisation. Nanoscale 2016, 8, 1360–1373. [Google Scholar] [CrossRef]
- Acosta, L.K.; Bertó-Roselló, F.; Xifre-Perez, E.; Law, C.S.; Santos, A.; Ferré-Borrull, J.; Marsal, L.F. Tunable Nanoporous Anodic Alumina Photonic Crystals by Gaussian Pulse Anodization. ACS Appl. Mater. Interfaces 2020, 12, 19778–19787. [Google Scholar] [CrossRef]
- Law, C.S.; Santos, A.; Nemati, M.; Losic, D. Structural Engineering of Nanoporous Anodic Alumina Photonic Crystals by Sawtooth-like Pulse Anodization. ACS Appl. Mater. Interfaces 2016, 8, 13542–13554. [Google Scholar] [CrossRef]
- Law, C.S.; Lim, S.Y.; MacAlincag, R.M.; Abell, A.D.; Santos, A. Light-Confining Nanoporous Anodic Alumina Microcavities by Apodized Stepwise Pulse Anodization. ACS Appl. Nano Mater. 2018, 1, 4418–4434. [Google Scholar] [CrossRef]
- Zhu, T.; Liu, Y.; Ding, T.; Fu, W.Y.; Jarman, J.; Ren, C.X.; Kumar, R.V.; Oliver, R.A. Wafer-scale Fabrication of Non-Polar Mesoporous GaN Distributed Bragg Reflectors via Electrochemical Porosification. Sci. Rep. 2017, 7, 45344. [Google Scholar] [CrossRef]
- Rahman, M.M.; Marsal, L.F.; Pallarès, J.; Ferré-Borrull, J. Tuning the photonic stop bands of nanoporous anodic alumina-based distributed bragg reflectors by pore widening. ACS Appl. Mater. Interfaces 2013, 5, 13375–13381. [Google Scholar] [CrossRef] [PubMed]
- Santos, A.; Kumeria, T.; Losic, D. Nanoporous Anodic Alumina: A Versatile Platform for Optical Biosensors. Materials 2014, 7, 4297–4320. [Google Scholar] [CrossRef]
- Nemati, M.; Santos, A.; Law, C.S.; Losic, D. Assessment of Binding Affinity between Drugs and Human Serum Albumin Using Nanoporous Anodic Alumina Photonic Crystals. Anal. Chem. 2016, 88, 5971–5980. [Google Scholar] [CrossRef]
- Siraji, A.A.; Zhao, Y. High-sensitivity and high-Q-factor glass photonic crystal cavity and its applications as sensors. Opt. Lett. 2015, 40, 1508. [Google Scholar] [CrossRef] [PubMed]
- Schmaljohann, D. Thermo- and pH-responsive polymers in drug delivery. Adv. Drug Deliv. Rev. 2006, 58, 1655–1670. [Google Scholar] [CrossRef] [PubMed]
- Deshmukh, P.K.; Ramani, K.P.; Singh, S.S.; Tekade, A.R.; Chatap, V.K.; Patil, G.B.; Bari, S.B. Stimuli-sensitive layer-by-layer (LbL) self-assembly systems: Targeting and biosensory applications. J. Control. Release 2013, 166, 294–306. [Google Scholar] [CrossRef] [PubMed]
- Ariga, K.; McShane, M.; Lvov, Y.M.; Ji, Q.; Hill, J.P. Layer-by-layer assembly for drug delivery and related applications. Expert Opin. Drug Deliv. 2011, 8, 633–644. [Google Scholar] [CrossRef] [PubMed]
- Pratap, D.; Mandal, P.; Ramakrishna, S.A. Plasmonic properties of gold-coated nanoporous anodic alumina with linearly organized pores. Pramana J. Phys. 2014, 83, 1025–1033. [Google Scholar] [CrossRef]
- Tiwari, A.K.; Shaik, S.; Ramakrishna, S.A. Lasing in dye-infiltrated nanoporous anodic alumina membranes. Appl. Phys. B Lasers Opt. 2018, 124, 1–8. [Google Scholar] [CrossRef]
- Hohlbein, J.; Steinhart, M.; Schiene-Fischer, C.; Benda, A.; Hof, M.; Hübner, C.G. Confined diffusion in ordered nanoporous alumina membranes. Small 2007, 3, 380–385. [Google Scholar] [CrossRef] [PubMed]
- Demuth, P.; Hurley, M.; Wu, C.; Galanie, S.; Zachariah, M.R.; Deshong, P. Mesoscale porous silica as drug delivery vehicles: Synthesis, characterization, and pH-sensitive release profiles. Microporous Mesoporous Mater. 2011, 141, 128–134. [Google Scholar] [CrossRef]
- Cruysberg, L.P.J.; Nuijts, R.M.M.A.; Geroski, D.H.; Koole, L.H.; Hendrikse, F.; Edelhauser, H.F. In vitro human scleral permeability of fluorescein, dexamethasone-fluorescein, methotrexate-fluorescein and rhodamine 6g and the use of a coated coil as a new drug delivery system. J. Ocul. Pharmacol. Ther. 2002, 18, 559–569. [Google Scholar] [CrossRef] [PubMed]
- Bosch, S.; Ferré-Borrull, J.; Sancho-Parramon, N.; Canillas, A. A general-purpose software for optical characterization of thin films: Specific features for microelectronic applications. Solid-State Electron. 2001, 45, 703–709. [Google Scholar] [CrossRef]
- Bosch, S.; Ferré-Borrull, J.; Leinfellner, N.; Canillas, A. Effective dielectric function of mixtures of three or more materials: A numerical procedure for computations. Surf. Sci. 2000, 453, 9–17. [Google Scholar] [CrossRef]
- Palik, E.D. Preface. In Handbook of Optical Constants of Solids; Palik, E.D., Ed.; Academic Press: Boston, MA, USA, 1985. [Google Scholar] [CrossRef]
- Losic, D.; Lillo, M. Porous Alumina with shaped pore geometries and complex pore architectures fabricated by cyclic anodization. Small 2009, 5, 1392–1397. [Google Scholar] [CrossRef]
- Montero-Moreno, J.M.; Belenguer, M.; Sarret, M.; Müller, C.M. Production of alumina templates suitable for electrodeposition of nanostructures using stepped techniques. Electrochim. Acta 2009, 54, 2529–2535. [Google Scholar] [CrossRef]
- Cho, Y.; Lee, W.; Jhon, Y.K.; Genzer, J.; Char, K. Polymer Nanotubules Obtained by Layer-by-Layer Deposition within AAO-Membrane Templates with Sub-100-nm Pore Diameters. Small 2010, 6, 2683–2689. [Google Scholar] [CrossRef]
- Dubas, S.T.; Schlenoff, J.B. Swelling and Smoothing of Polyelectrolyte Multilayers by Salt. Langmuir 2001, 17, 7725–7727. [Google Scholar] [CrossRef]
- Ilyas, S.; Böcking, T.; Kilian, K.; Reece, P.J.; Gooding, J.; Gaus, K.; Gal, M. Porous silicon based narrow line-width rugate filters. Opt. Mater. 2007, 29, 619–622. [Google Scholar] [CrossRef]
- Alba, M.; Formentín, P.; Ferré-Borrull, J.; Pallarès, J.; Marsal, L.F. pH-responsive drug delivery system based on hollow silicon dioxide micropillars coated with polyelectrolyte multilayers. Nanoscale Res. Lett. 2014, 9, 411. [Google Scholar] [CrossRef] [PubMed]
- Delcea, M.; Möhwald, H.; Skirtach, A.G. Stimuli-responsive LbL capsules and nanoshells for drug delivery. Adv. Drug Deliv. Rev. 2011, 63, 730–747. [Google Scholar] [CrossRef] [PubMed]
- Koehler, R.; Steitz, R.; von Klitzing, R. About different types of water in swollen polyelectrolyte multilayers. Adv. Colloid Interface Sci. 2014, 207, 325–331. [Google Scholar] [CrossRef] [PubMed]


| Samples | Wavelength (nm) Before Wetting | Wavelength (nm) After Wetting | Red Shift (nm) |
|---|---|---|---|
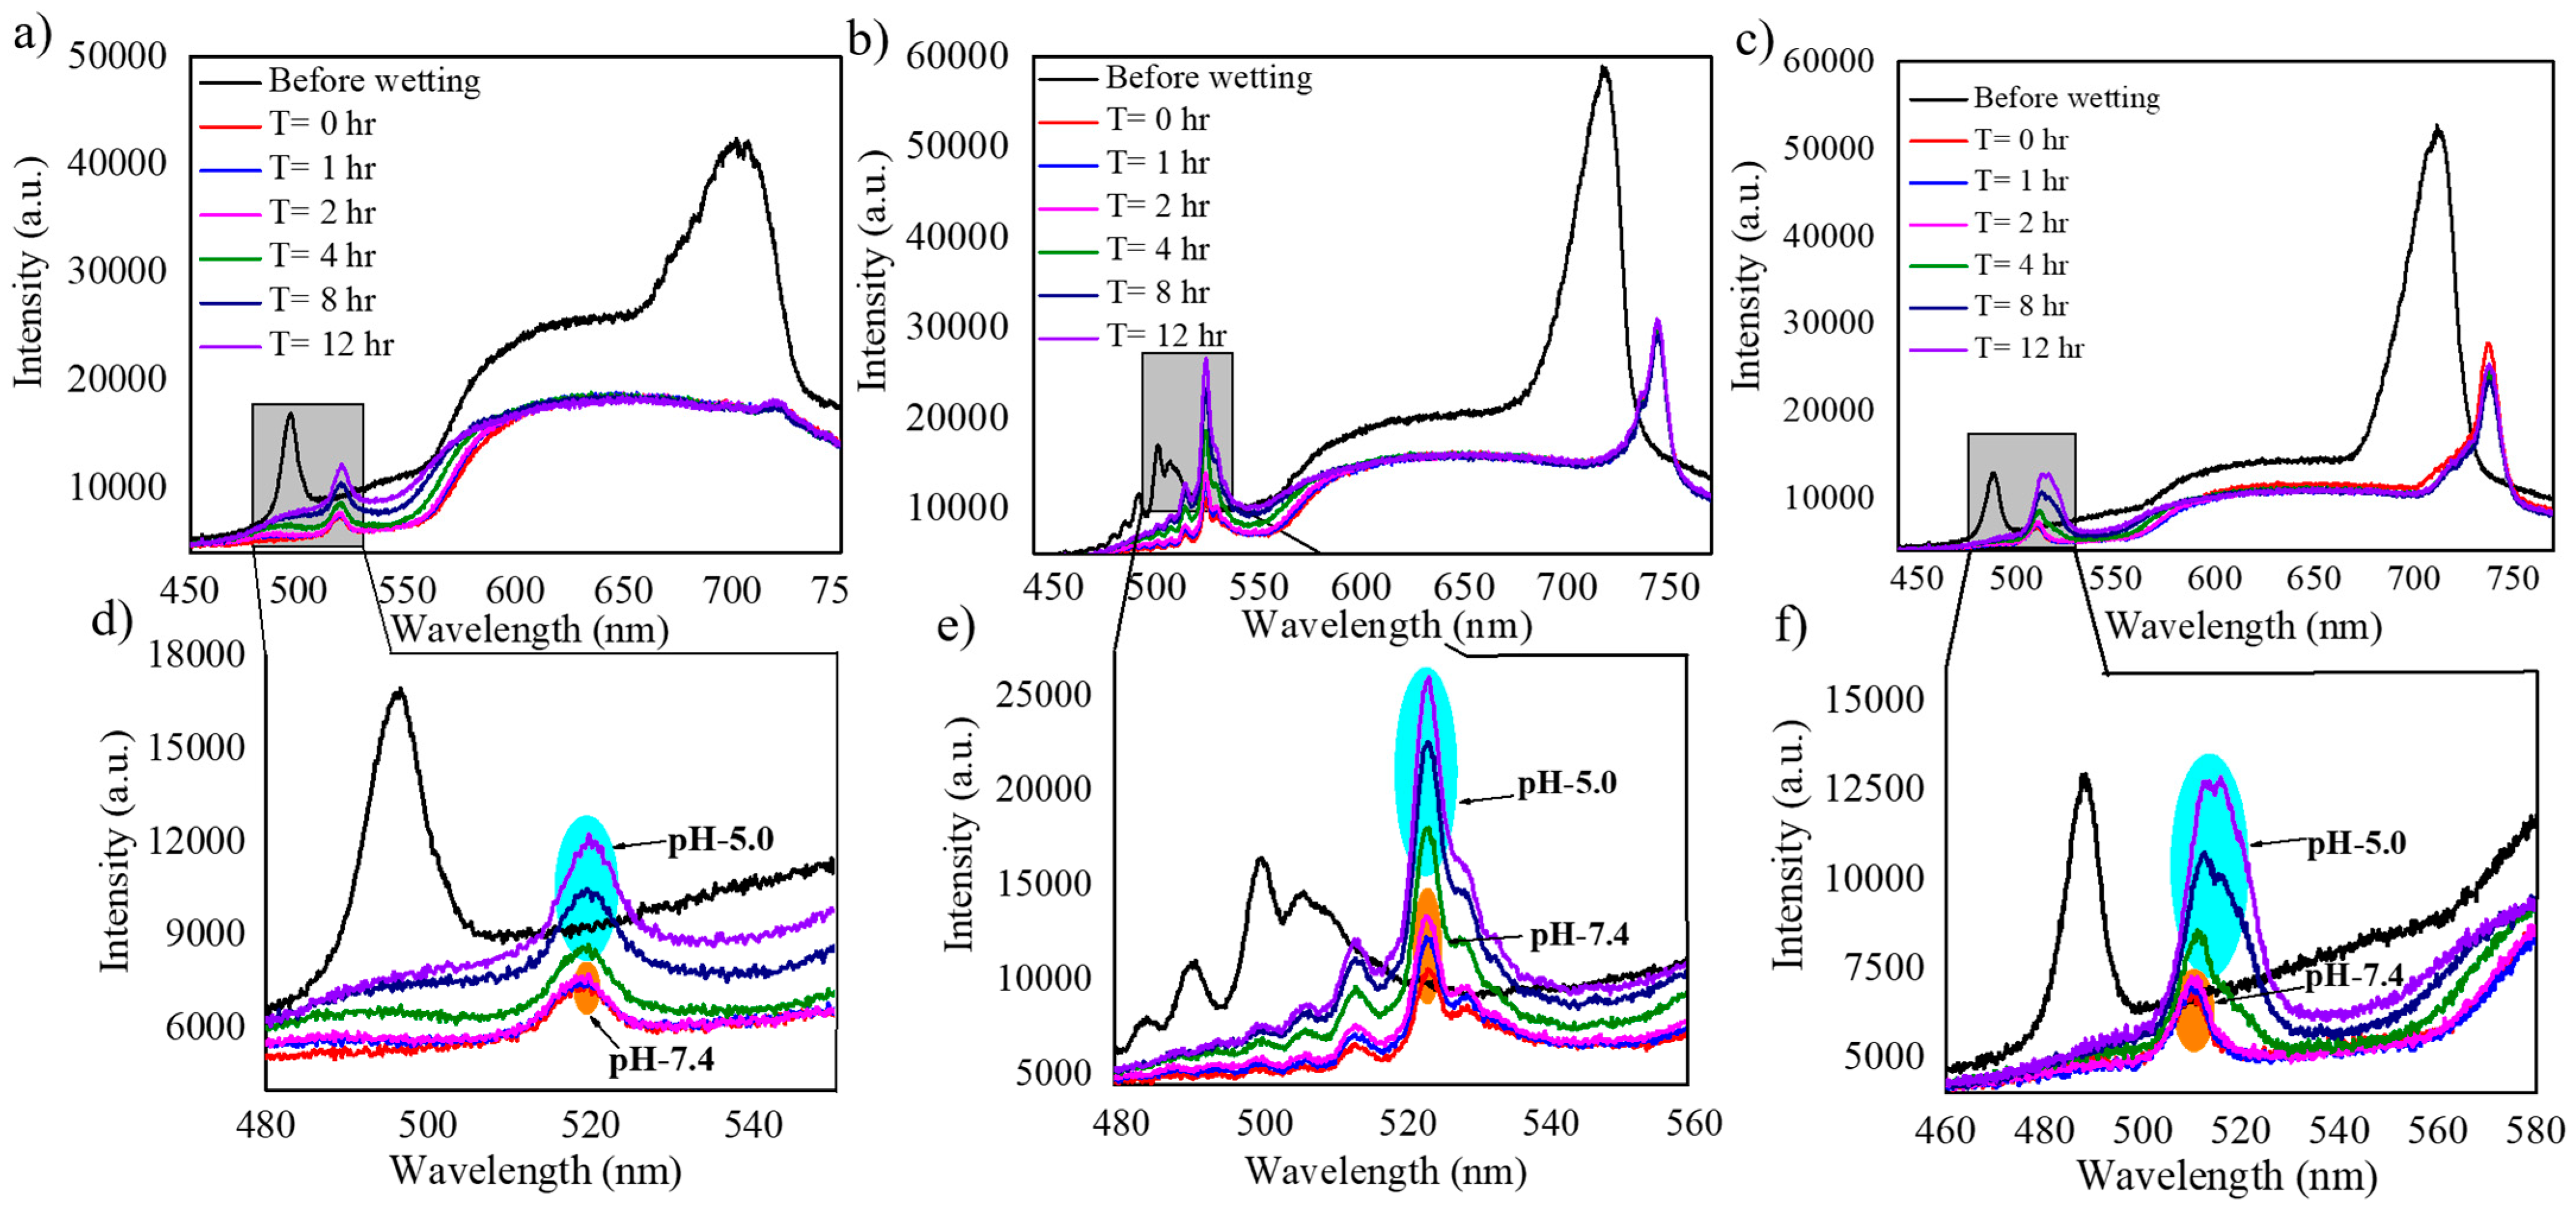
| N = 150 | 496 | 518 | 22 |
| N = 200 | 500 | 523 | 23 |
| N = 250 | 488 | 509 | 21 |
| Sample | |
|---|---|
| N = 150 | 13,588 |
| N = 200 | 17,289 |
| N = 250 | 47,038 |
Publisher’s Note: MDPI stays neutral with regard to jurisdictional claims in published maps and institutional affiliations. |
© 2021 by the authors. Licensee MDPI, Basel, Switzerland. This article is an open access article distributed under the terms and conditions of the Creative Commons Attribution (CC BY) license (http://creativecommons.org/licenses/by/4.0/).
Share and Cite
Kapruwan, P.; Acosta, L.K.; Ferré-Borrull, J.; Marsal, L.F. Optical Platform to Analyze a Model Drug-Loading and Releasing Profile Based on Nanoporous Anodic Alumina Gradient Index Filters. Nanomaterials 2021, 11, 730. https://doi.org/10.3390/nano11030730
Kapruwan P, Acosta LK, Ferré-Borrull J, Marsal LF. Optical Platform to Analyze a Model Drug-Loading and Releasing Profile Based on Nanoporous Anodic Alumina Gradient Index Filters. Nanomaterials. 2021; 11(3):730. https://doi.org/10.3390/nano11030730
Chicago/Turabian StyleKapruwan, Pankaj, Laura K. Acosta, Josep Ferré-Borrull, and Lluis F. Marsal. 2021. "Optical Platform to Analyze a Model Drug-Loading and Releasing Profile Based on Nanoporous Anodic Alumina Gradient Index Filters" Nanomaterials 11, no. 3: 730. https://doi.org/10.3390/nano11030730
APA StyleKapruwan, P., Acosta, L. K., Ferré-Borrull, J., & Marsal, L. F. (2021). Optical Platform to Analyze a Model Drug-Loading and Releasing Profile Based on Nanoporous Anodic Alumina Gradient Index Filters. Nanomaterials, 11(3), 730. https://doi.org/10.3390/nano11030730