Abstract
Oxygen evolution reaction (OER) is the key reaction for water splitting, which is used for hydrogen production. Oxygen vacancy engineering is an effective method to tune the OER performance, but the direct relationship between the concentration of oxygen vacancy and OER activity is not well understood. Herein, a series of NiyCe100−yOx with different concentration of oxygen vacancies were successfully synthesized. The larger concentration of oxygen vacancies in Ni75Ce25Ox and Ni50Ce50Ox result in their lower Tafel slopes, small mass-transfer resistance, and larger electrochemical surface areas of the catalysts, which account for the higher OER activities for these two catalysts. Moreover, with a fixed current density of 10 mA/cm2, the potential remains stable at 1.57 V for more than 100 h, indicating the long-term stability of the Ni75Ce25Ox catalyst.
1. Introduction
Hydrogen is considered as one of the clean energy to replace the traditional fossil fuel to solve the environmental and energy problem. Electrocatalytic water splitting is an effective way to produce hydrogen with high purity from intermittent renewable energy (i.e., wind and solar energy). Two half reactions including hydrogen evolution reaction (HER) and oxygen evolution reaction (OER) are at cathode and anode, respectively. The four-electron transfer steps of OER lead to the large sluggish kinetics, resulting in a high overpotential for water splitting [1,2,3,4,5,6,7]. An OER catalyst with high activity is of critical importance to reduce the overpotential so that a small bias voltage can be used and thus increase the efficiency of the OER process.
The OER activity of a catalyst can be enhanced by introducing defects, especially oxygen vacancies [8,9,10,11]. The local electron density distribution will be changed and the oxygen vacancy itself can be the OER active sites. Wang et al. [12] treated Co3O4 nanosheets by Ar-plasma to get rich oxygen vacancies. The specific activity of the Co3O4 nanosheets with oxygen vacancies was 10 times higher than that of the pristine Co3O4. Ceria is a nonstoichiometric material and the oxygen vacancies are easily formed due to the shift between Ce3+ and Ce4+ [13,14,15,16,17]. The oxygen vacancies in Ce-containing catalysts such as CeO2/Co3O4 accelerated the electron transfer, resulting in good OER activity [9]. In our previous work, oxygen vacancies in NiCeOx catalyst were proved to be the active sites for water oxidation [10]. However, the direct correlation between the concentration of oxygen vacancies and OER activity has not been identified yet.
In this work, a series of NiyCe100−yOx with different Ni/Ce ratio were synthesized on NF (nickel foam)/NiO substrate with simple dip-coating and annealing methods. The surface NiO obtained from the oxidation of NF can prohibit the diffusion of Ni atoms to the deposited NiyCe100−yOx so that the Ni/Ce ratio is not modified. Oxygen vacancy defects are formed successfully in all the NF/NiO/NiyCe100−yOx (simply referred to as NiyCe100−yOx) catalysts. The concentration of oxygen vacancy defects for Ni75Ce25Ox and Ni50Ce50Ox catalysts are larger than other NiyCe100−yOx catalysts, resulting in a similar larger electrochemically active surface area and the same lower Tafel slope of 66 mV/decade. The overpotential to achieve a current density of 10 mA/cm2 for the Ni75Ce25Ox and Ni50Ce50Ox catalysts are 338 mV and 341 mV, respectively. It is noted that these overpotentials are lower than other NiyCe100−yOx catalysts. With a fixed current density of 10 mA/cm2, the Ni75Ce25Ox catalyst exhibits an ultra-high stability of over 100 h.
2. Materials and Methods
2.1. Sample Synthesis
The synthesis of NF/NiO/NiyCe100−yOx catalysts. The first step was to prepare the NF/NiO substrate. A 10 × 15 mm2 Nickel Foam (NF, >99.99%, MTI Corporation, Richmond, CA, USA) substrate with a thickness of 0.08 mm was firstly cleaned by acetone (99%, Wako) in an ultrasonic bath for 5 min. Then the NF was rinsed by deionized water three times. Subsequently, the NF was dried in air and annealed for 2 h with a heating rate of 2 °C/min at 400 °C in a muffle furnace to obtain NF/NiO substrate. The second step is to prepare the nickel and cerium mixed precursor solution. The precursor solution was prepared by dissolving 0.3 M citric acid and 0.15 M metal ions in 20 mL ethanol. The molar ratio of Ni and Ce ions were 95:5, 90:10, 75:25, 50:50, 25:75, and 10:90 for the catalysts of Ni95Ce5Ox, Ni90Ce10Ox, Ni75Ce25Ox, Ni50Ce50Ox, Ni25Ce75Ox and Ni10Ce90Ox, respectively. Ce(NO3)3 6H2O offers the Ce ions and Ni(NO3)2 6H2O offers the Ni ions. The final step is the preparation of NF/NiO/NiyCe100−yOx catalysts, hereafter simply referred to as the NiyCe100−yOx. The prepared precursor solution was deposited onto NF/NiO by dip coating and then annealed in the same manner as the NF/NiO substrate.
2.2. Structural Characterization
A field emission Scanning electron microscope (SEM, JEOL JSM 7600 FA) was used for the measurements of SEM. A diffractometer (Rigaku Co. Ltd., SmartLab, Japan) with Cu Kα radiation (dwelling time = 2 s, incident angle = 0.5°, step size = 0.02°, λ = 1.541 Å) was used for the collecting of grazing incidence X-ray diffraction data. A Renishaw inVia Raman Microscope system was used to acquire the Raman spectra at room temperature (25 °C). A ×100 objective and a 532 nm excitation laser were used. A PHI 5000 VersaProbe (ULVAC-PHI) with an Al Kα X-ray source (1486.6 eV) was used to obtain the X-ray photoelectron spectroscopy (XPS). The pass energies of 117.4 eV and 23.5 eV were used for the electron analyzer to analyze the wide scans and narrow scans, respectively.
2.3. Electrochemical Measurements
A cylindrical glass cell with a standard three-electrode configuration was used for the electrochemical measurements. A Pt wire and a Ag/AgCl electrode were used as the counter electrode and the reference electrode, respectively. The working electrode was NiyCe100−yOx electrode. A potentiostat (Princeton Applied Research, VersaSTAT 4) was used to perform the electrochemical measurements. The potentials were calibrated against the RHE according to the following equation: (ERHE = EAg/AgCl + 0.059 pH + E0Ag/AgCl), where EAg/AgCl is the potential difference measured between the Ag/AgCl electrode and the working electrode, E0Ag/AgCl (0.1976 V at 25 °C) is the standard electrode potential for an Ag/AgCl electrode, pH is the pH of the electrolyte solution, and ERHE is the calibrated potential. The electrolytes used were saturated with oxygen before and during the OER experiments.
The polarization curves were collected through linear sweep voltammetry (LSV), and the scan rate was 10 mV/s. Controlled-current water electrolysis was performed using a chronopotentiometric technique [16]. The solution resistance Rs (~2 Ω), determined using the electrochemical impedance spectroscopy (EIS) technique [16], was used to correct the iR drop across the solution. Unless otherwise stated, all given potentials are vs. RHE and corrected for the iR drop across the electrolyte. Tafel plots obtained from the steady-state polarization curves with a scan rate of 1 mV/s. Cyclic voltammetry (CV) was used to determine the electrochemical capacitance of the samples presented in this paper [18]. The potential was swept in a range from 0.05 V above the open-circuit potential (OCP) to 0.05V below the OCP in a static solution with five different scan rates: 0.005, 0.01, 0.025, 0.05 and 0.1 V s−1. The working electrode was held for 10 s at each end of the potential sweep before continuing to the next sweep. All experiments were performed at room temperature.
3. Results and Discussion
The surface morphology information of the NF/NiO and NiyCe100−yOx samples was analyzed by SEM, and the images are shown in Figure 1. Holes with sizes varying from several nanometers to a few hundred nanometers were observed on the surface of NF/NiO. NF/NiO sample was prepared by annealing Ni substrate in the muffle furnace for 2 h with the elevating rate of 2 °C/min, and these holes were from the Ni foam substrate. The surface of NF/NiO consisted of small nanocrystals, as shown in Figure 1b. The NiyCe100−yOx samples were synthesized by depositing nickel and cerium mixed precursor solutions with different Ni/Ce ratios on NF/NiO and then annealing the samples in air. The deposited layer covers the surface of NF/NiO nanocrystals for the Ni95Ce5Ox sample, as shown in Figure 1c,d. Other NiyCe100−yOx catalysts have the similar morphologies with the Ni95Ce5Ox catalyst, as displayed in Figure S1 of the supporting information.
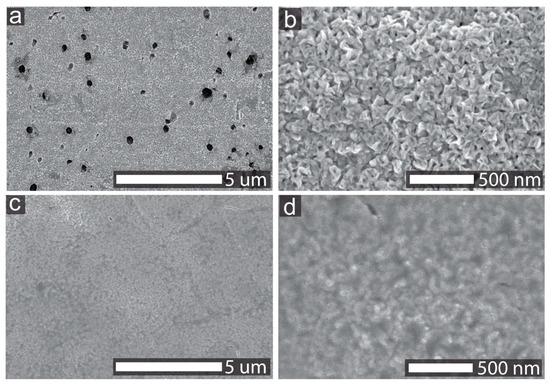
Figure 1.
SEM images of NF/NiO (a,b) and Ni95Ce5Ox (c,d) samples.
Grazing incidence XRD measurements were performed to examine the crystal structure of the NiyCe100−yOx samples, and the results are shown in Figure 2a. Only Ni and NiO related peaks were found and no CeO2 related peaks were detected for NiyCe100−yOx samples. It indicates that Ni and Ce mixed uniformly in the top layer and formed an amorphous structure. The surface element information of the NiyCe100−yOx samples was further analyzed by XPS. As shown in Figure 2b, Ce 3d peaks of CeO2 and Ni 2p peaks of NiO were observed and indicates that the deposited layers of NiyCe100−yOx catalysts are indeed composed of Ni and Ce mixed oxides. The curve fitting results of Ce 3d3/2 for NiyCe100−yOx samples are shown in Figure 2c. The peak areas of Ce 3d3/2 for Ni90Ce10Ox, Ni75Ce25Ox, Ni50Ce50Ox, Ni25Ce75Ox and Ni10Ce90Ox samples are 31.7, 55.7, 206.2, 433.0 and 603.3. For NiyCe100−yOx samples, the peak areas of Ce 3d3/2 are in proportion with the Ce content, and the higher Ce content will lead to larger peak areas of Ce 3d3/2. The sequence of the peak areas of Ce 3d3/2 of NiyCe100−yOx samples are in accordance with the Ce content in these samples (Table S1). This indicates that the designed Ni/Ce ratios remain constant for the synthesized NiyCe100−yOx samples.
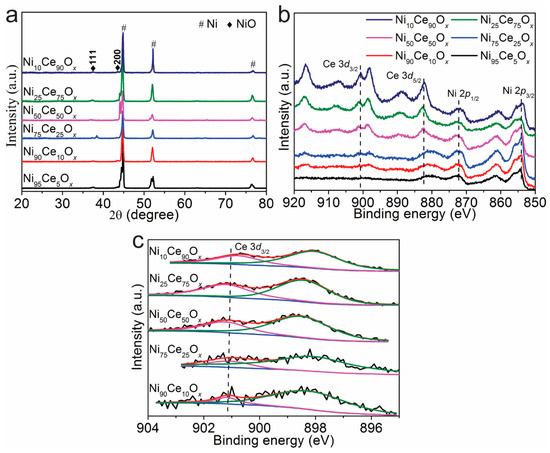
Figure 2.
(a) X-ray diffraction patterns and (b,c) XPS spectra of NiyCe100−yOx samples.
Two Raman peaks of 224 cm−1 and 563 cm−1 were observed for Ni75Ce25Ox, Ni50Ce50Ox, Ni25Ce75Ox and Ni10Ce90Ox samples, as shown in Figure 3a. For Ni95Ce5Ox and Ni90Ce10Ox samples, only the peak of 563 cm−1 was observed. Crystalline CeO2 is known to have a strong F2g Raman peak at 464 cm−1 related to its fluorite structure [19]. The presence of ions with the oxidation states lower than Ce4+ in the CeO2 has been shown to induce a Raman band, known as the D band, from 500 to 700 cm−1 [19,20,21]. This band is associated with the presence of oxygen vacancy defects created in the non-stoichiometric CeO2-y by the 3+ coordinated ions. In addition to the introduction of the D band, the F2g band will be weakened and becomes asymmetric and broad [22]. In the Raman spectra of the NiyCe100−yOx samples, there is no F2g band, which suggests that there is no crystalline CeO2 with a fluorite structure in these samples [23]. The broad peak at 563 cm−1 (D band) indicates the formation of oxygen vacancy defects. The oxygen vacancy defects should be related to the presence of Ce3+ because of the incorporation of Ni into CeO2, as suggested by the literature [19,20,23]. Furthermore, the amorphous structure of NiyCe100−yOx contributes to the broadness of the peak [22,23]. According to the areas of this peak among different NiyCe100−yOx samples, we can roughly estimate the concentration of oxygen vacancy defects in these catalysts. The peak areas of the D band have been calculated and summarized in Table S2. The peak areas of 563 cm−1 for Ni75Ce25Ox and Ni50Ce50Ox samples are similar and larger than those of other NiyCe100−yOx samples, suggesting that these two catalysts own larger concentration of oxygen vacancy defects. The peak at 224 cm−1 is related to Ce-OH vibrations which are resulted from surface defects. Different types of hydroxyl groups generated by the dissociation of surface adsorbed water and doubly bridging hydroxyl groups on reduced cerium oxide are detected in the Raman spectra [24].
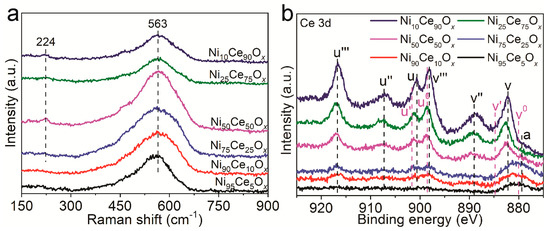
Figure 3.
(a) Raman spectra and (b) XPS spectra of NiyCe100−yOx samples. The peak labeled a in the XPS spectra is ascribed to the Ni 2p peak.
XPS was carried out on NiyCe100−yOx samples to further analyze the oxygen vacancy defects. The Ce 3d peaks of CeO2 were observed for NiyCe100−yOx samples, as shown in Figure 3b. The Ce 3d band is composed of ten individual peaks, that are labeled on Figure 3b as v, v″, v‴, u, u″, u‴, v0, v’, u0 and u’. The v, v″, v‴, u, u″ and u‴ peaks represent the 3d104f0 state of Ce4+, and the v0, v’, u0 and u’ peaks represent the 3d104f1 state of Ce3+ [13,25]. The intensities of these peaks increased with the increasing Ce content in NiyCe100−yOx samples. The concentration of Ce3+ and Ce4+ can be estimated according to the relative areas of the corresponding peaks. The major valence state of Ce was 4+, Ce3+ were also detected for NiyCe100−yOx samples. It is commonly known that the oxygen vacancy defects will be formed with the appearance of Ce3+ to maintain electrostatic balance according to Equation (1):
4Ce4+ + O2− → 4Ce4+ + 2e−/☐ + 0.5O2 → 2Ce4+ + 2Ce3+ + ☐ + 0.5O2
☐ represents the empty position by the removal of O2– from the lattice (i.e., oxygen vacancy defect). It suggests that the oxygen vacancy defects formed for the NiyCe100−yOx samples, which is consistent with the Raman results.
To test the electrochemical performance of NiyCe100−yOx catalysts, the polarization curves of these catalysts (Figure 4a) were obtained using Linear Sweep Voltammetry (LSV). The overpotentials of the catalysts for the current density of 10 mA/cm2 are listed in Table 1. The Ni10Ce90Ox catalyst showed the lowest current density for the applied potentials and had the largest overpotential of 363 mV for the current density of 10 mA/cm2. The overpotentials for the Ni75Ce25Ox and Ni50Ce50Ox catalysts were 338 mV and 341 mV to obtain the current density of 10 mA/cm2, which were lower than that of other samples. The Tafel slope results of NiyCe100−yOx catalysts were shown in Figure 4b and Table 1. The Tafel slopes of the Ni75Ce25Ox and Ni50Ce50Ox catalysts (66 mV/decade) were close to that of Ni95Ce5Ox, Ni90Ce10Ox and Ni25Ce75Ox catalysts (68 mV/decade), and were lower than that of the Ni10Ce90Ox catalyst (73 mV/decade). An electrocatalyst with a low Tafel slope will have a small kinetic barrier for electron and mass transfer [2,5]. This indicates that the transfer barriers of electron and mass in the Ni75Ce25Ox and Ni50Ce50Ox catalysts are slightly improved.
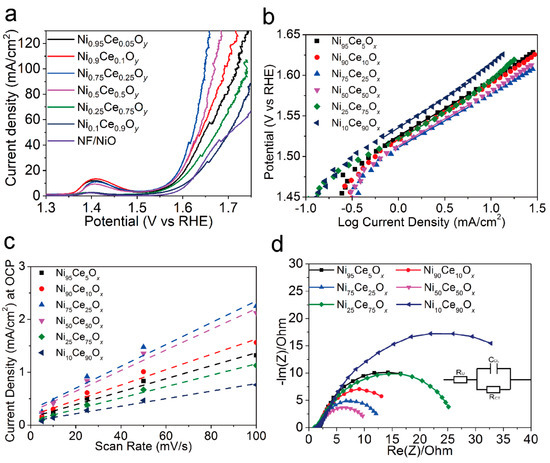
Figure 4.
(a) Polarization curves of the NF/NiO substrate and NiyCe100−yOx catalysts for the OER with a scan rate of 10 mV/s. (b) Tafel plots obtained from the steady–state polarization curves with a scan rate of 1 mV/s. (c) Current density at OCP vs. CV scan rate for NiyCe100−yOx samples. The slope of current density at OCP vs. scan rate stands for the double–layer capacitance. (d) Nyquist plots of NiyCe100−yOx samples obtained at 1.55 V vs. RHE. The inset is the electrical equivalent circuit.

Table 1.
Electrochemically active surface area (ECSA), Tafel slope, mass-transfer resistance (RCT) and the overpotential (η) for the current density of 10 mA/cm2 for each catalyst investigated in 1 M KOH.
The double-layer capacitance can be used to estimate the electrochemically active surface area (ECSA) of each sample. In order to know the double-layer capacitance, we first obtained CV curves of the capacitance current in the non-Faradaic voltage region (a 0.1 V potential range centered on the OCP) for several different scan rates (Figure 5). The rate of change in the current at OCP with respect to the scan rate corresponds to the double-layer capacitance [18]. For this reason, the current at OCP was plotted against the scan rate for the NiyCe100−yOx catalysts, and a line of best fit was fitted for each catalyst’s data set, as shown in Figure 4c. The double layer capacitance was 12.3 mF, 14.5 mF, 20.6 mF, 19.5 mF, 10.7 mF, and 7.1 mF for the Ni95Ce5Ox, Ni90Ce10Ox, Ni75Ce25Ox, Ni50Ce50Ox, Ni25Ce75Ox, and Ni10Ce90Ox samples, respectively. The ECSA can be calculated according to the formula ECSA = CDL/Cs, where a specific capacitance of Cs = 0.040 mF cm−2 was used in this work [18]. The calculated ECSA values for the NiyCe100−yOx catalysts as well as other relevant electrochemistry parameters are summarized in Table 1. The ECSAs of the Ni75Ce25Ox and Ni50Ce50Ox catalysts are similar and larger than that of other NiyCe100−yOx catalysts. This is consistent with the observed current densities, as a larger ECSA means a sample has more active sites and therefore can catalyze more reactions at once and sustain a large current.
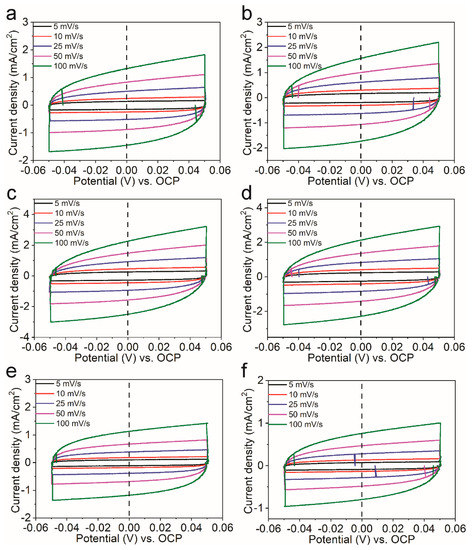
Figure 5.
Cyclic voltammograms of (a) Ni95Ce5Ox, (b) Ni90Ce10Ox, (c) Ni75Ce25Ox, (d) Ni50Ce50Ox, (e) Ni25Ce75Ox and (f) Ni10Ce90Ox catalysts tested in a region with non–Faradaic process of the voltammogram with the scan rate of 5 mV/s, 10 mV/s, 25 mV/s, 50 mV/s and 100 mV/s. The value of the open circuit potential was 1.27 V vs. RHE.
The charge transfer resistance (RCT) of the NiyCe100−yOx catalysts were obtained from their Nyquist plots, as shown in Figure 4d. As shown in Table 1, the RCT of the NiyCe100−yOx catalysts decreased firstly and then increased with the increasing Ce content in the catalysts, and the Ni50Ce50Ox catalyst had the lowest RCT of 7.5 Ω at an applied bias of 1.55 V vs. RHE. The Ni75Ce25Ox catalyst also showed a low RCT of 9.9 Ω. However, the RCT of the Ni10Ce90Ox (31.8 Ω) catalyst was much higher than other NiyCe100−yOx catalysts. The small mass-transfer resistance of the Ni75Ce25Ox and Ni50Ce50Ox catalysts stands for their favorable OER kinetics.
For the Ce-based catalysts, the oxygen mobility can be promoted by the generated oxygen vacancy defects, resulting an improved ionic conductivity [10]. Also, the oxygen vacancy defects can be act as the OER active sites to catalyze the water oxidation reaction [17]. Therefore, the larger concentration of oxygen vacancy defects results in the lower Tafel slopes, small mass-transfer resistance, and larger ECSAs of the Ni75Ce25Ox and Ni50Ce50Ox catalysts, which account for the higher OER activities for these two catalysts.
Controlled-current water electrolysis (Figure 6) was done to test the long-term performance and stability of the Ni75Ce25Ox catalyst. With a fixed current density of 10 mA/cm2, the potential remained stable at 1.57 V vs. RHE for more than 100 h. This indicates that the Ni75Ce25Ox catalyst is very stable during long-term water electrolysis.
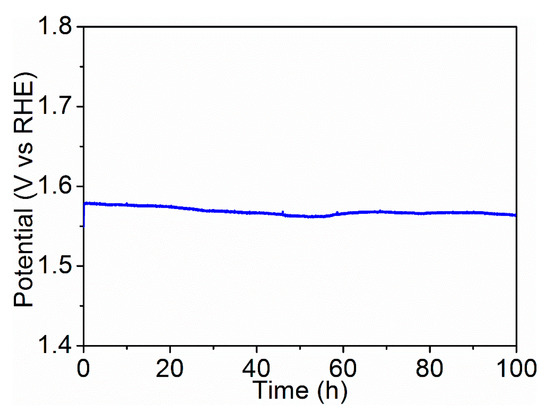
Figure 6.
Potential trace of the Ni75Ce25Ox sample obtained by fixing the current density for electrolysis at 10 mA/cm2. The electrolyte was 1 M KOH (pH ≈ 14).
4. Conclusions
In summary, a series of NF/NiO/NiyCe100−yOx catalysts were synthesized through the simple dip-coating and annealing methods. The oxygen vacancy defects are formed successfully in all the NiyCe100−yOx catalysts, and the concentration of oxygen vacancy defects for Ni75Ce25Ox and Ni50Ce50Ox catalysts are larger than other NiyCe100−yOx catalysts. This results in the larger electrochemically active surface areas for Ni75Ce25Ox and Ni50Ce50Ox catalysts because of the abundant active sites offered by the defects. The rich oxygen vacancy defects also improve the ionic conductivity so that a lower Tafel slope of 66 mV/decade is obtained for Ni75Ce25Ox and Ni50Ce50Ox catalysts. The improved ionic conductivity also results in the small mass-transfer resistance of Ni75Ce25Ox and Ni50Ce50Ox catalysts, which is favorable for their OER kinetics. Therefore, the Ni75Ce25Ox and Ni50Ce50Ox catalyst exhibit higher OER activity than other NiyCe100−yOx catalysts with the overpotential of 338 mV and 341 mV for the current density of 10 mA/cm2. With a fixed current density of 10 mA/cm2, the potential remains stable at 1.57 V for more than 100 h, indicating the long-term stability of the Ni75Ce25Ox catalyst.
Supplementary Materials
The following are available online at https://www.mdpi.com/2079-4991/11/2/437/s1, Figure S1: SEM images of Ni90Ce10Ox, Ni75Ce25Ox, Ni50Ce50Ox, Ni25Ce75Ox and Ni10Ce90Ox catalysts, Table S1: Atomic ratios of Ce, Ni and O in NiyCe100−yOx catalysts derived from XPS results, Table S2: Raman peak areas at 563 cm−1 of NiyCe100−yOx catalysts.
Author Contributions
Conceptualization, J.Y. and Q.C.; methodology, J.Y.; validation, J.Y., C.Q. and L.C.; formal analysis, J.Y.; investigation, J.Y.; resources, J.Y.; data curation, J.Y. and C.Q.; writing—original draft preparation, J.Y.; writing—review and editing, J.Y. and Q.C.; supervision, J.-J.D. and L.C.; project administration, J.Y. and Q.C.; funding acquisition, J.Y., Q.C. and J.-J.D. All authors have read and agreed to the published version of the manuscript.
Funding
Part of this research was funded by the JSPS Core-to-Core program (Advanced Research Networks type A), Japan (JSPS)-Korea (NRF) Bilateral program and Grants-in-Aids for Specially Promoted Research and KAKENHI (Grant number: 17H03229). Part of this research was funded by China Postdoctoral Science Foundation (Grant number: 2019M660297), and Fundamental Research Funds for the Central Universities of Ministry of Education of China (Southeast University).
Acknowledgments
The XRD and electron microscopy characterizations were conducted at the Advanced Characterization Nanotechnology Platform of the University of Tokyo, supported by “Nanotechnology Platform” of the Ministry of Education, Culture, Sports, Science and Technology (MEXT), Japan.
Conflicts of Interest
The authors declare no conflict of interest.
References
- Suen, N.T.; Hung, S.F.; Quan, Q.; Zhang, N.; Xu, Y.J.; Chen, H.M. Electrocatalysis for the oxygen evolution reaction: Recent development and future perspectives. Chem. Soc. Rev. 2017, 46, 337–365. [Google Scholar] [CrossRef] [PubMed]
- Li, C.; Cao, Q.; Wang, F.; Xiao, Y.; Li, Y.; Delaunay, J.-J.; Zhu, H. Engineering graphene and TMDs based van der Waals heterostructures for photovoltaic and photoelectrochemical solar energy conversion. Chem. Soc. Rev. 2018, 47, 4981–5037. [Google Scholar] [CrossRef]
- Yu, J.; Wang, J.; Long, X.; Chen, L.; Cao, Q.; Wang, J.; Qiu, C.; Lim, J.; Yang, S. Formation of FeOOH Nanosheets Induces Doping of CeO2-x with High-Valence Ni for Efficient Water Oxidation. Adv. Energy Mater. 2021, 11, 2002731. [Google Scholar] [CrossRef]
- Cao, Q.; Che, R.; Chen, N. Scalable synthesis of Cu2S double-superlattice nanoparticle systems with enhanced UV/visible-light-driven photocatalytic activity. Appl. Catal. B 2015, 162, 187–195. [Google Scholar] [CrossRef]
- Yu, J.; Cao, Q.; Feng, B.; Li, C.; Liu, J.; Clark, J.K.; Delaunay, J.-J. Insights into the efficiency and stability of Cu-based nanowires for electrocatalytic oxygen evolution. Nano Res. 2018, 11, 4323–4332. [Google Scholar] [CrossRef]
- Hao, S.; Liu, J.; Cao, Q.; Zhao, Y.; Zhao, X.; Pei, K.; Zhang, J.; Chen, G.; Che, R. In-situ electrochemical pretreatment of hierarchical Ni3S2-based electrocatalyst towards promoted hydrogen evolution reaction with low overpotential. J. Colloid Interface Sci. 2020, 559, 282–290. [Google Scholar] [CrossRef] [PubMed]
- Hao, S.; Cao, Q.; Yang, L.; Che, R. Morphology-optimized interconnected Ni3S2 nanosheets coupled with Ni(OH)2 nanoparticles for enhanced hydrogen evolution reaction. J. Alloys Compd. 2020, 827, 154163. [Google Scholar] [CrossRef]
- Yuan, K.; Cao, Q.; Lu, H.-L.; Zhong, M.; Zheng, X.; Chen, H.-Y.; Wang, T.; Delaunay, J.-J.; Luo, W.; Zhang, L.; et al. Oxygen-deficient WO3−x@TiO2−x core–shell nanosheets for efficient photoelectrochemical oxidation of neutral water solutions. J. Mater. Chem. A 2017, 5, 14697–14706. [Google Scholar] [CrossRef]
- Qiu, B.; Wang, C.; Zhang, N.; Cai, L.; Xiong, Y.; Chai, Y. CeO2-Induced Interfacial Co2+ Octahedral Sites and Oxygen Vacancies for Water Oxidation. ACS Catal. 2019, 9, 6484–6490. [Google Scholar] [CrossRef]
- Yu, J.; Cao, Q.; Li, Y.; Long, X.; Yang, S.; Clark, J.K.; Nakabayashi, M.; Shibata, N.; Delaunay, J.-J. Defect-Rich NiCeOx Electrocatalyst with Ultrahigh Stability and Low Overpotential for Water Oxidation. ACS Catal. 2019, 9, 1605–1611. [Google Scholar] [CrossRef]
- Yuan, K.; Zhu, L.-Y.; Cao, Q.; Ma, H.-P.; Tao, J.-J.; Huang, W.; Lu, H.-L. ALD-based hydrothermal facile synthesis of a dense WO3@TiO2–Fe2O3 nanodendrite array with enhanced photoelectrochemical properties. J. Mater. Chem. C 2020, 8, 6756–6762. [Google Scholar] [CrossRef]
- Xu, L.; Jiang, Q.; Xiao, Z.; Li, X.; Huo, J.; Wang, S.; Dai, L. Plasma-Engraved Co3O4 Nanosheets with Oxygen Vacancies and High Surface Area for the Oxygen Evolution Reaction. Angew. Chem. Int. Ed. 2016, 55, 5277–5281. [Google Scholar] [CrossRef]
- Yu, J.; Si, Z.; Chen, L.; Wu, X.; Weng, D. Selective catalytic reduction of NOx by ammonia over phosphate-containing Ce0.75Zr0.25O2 solids. Appl. Catal. B 2015, 163, 223–232. [Google Scholar] [CrossRef]
- Yu, J.; Si, Z.; Li, X.; Chen, L.; Wu, X.; Weng, D. Effect of lean-oxygen treatment on the adsorption and activity of zirconium phosphate @ Ce0.75Z0.25O2 for NH3-SCR deNOx. Catal. Today 2016, 267, 47–55. [Google Scholar] [CrossRef]
- Yu, J.; Si, Z.; Zhu, M.; Wu, X.; Chen, L.; Weng, D.; Zou, J. NH3-SCR activity, hydrothermal stability and poison resistance of a zirconium phosphate/Ce0.5Zr0.5O2 catalyst in simulated diesel exhaust. RSC Adv. 2015, 5, 83594–83599. [Google Scholar] [CrossRef]
- Yuan, K.; Wang, C.-Y.; Zhu, L.-Y.; Cao, Q.; Yang, J.-H.; Li, X.-X.; Huang, W.; Wang, Y.-Y.; Lu, H.-L.; Zhang, D.W. Fabrication of a Micro-Electromechanical System-Based Acetone Gas Sensor Using CeO2 Nanodot-Decorated WO3 Nanowires. ACS Appl. Mater. Interfaces 2020, 12, 14095–14104. [Google Scholar] [CrossRef] [PubMed]
- Yu, J.; Wang, Z.; Wang, J.; Zhong, W.; Ju, M.; Cai, R.; Qiu, C.; Long, X.; Yang, S. The Role of Ceria in a Hybrid Catalyst toward Alkaline Water Oxidation. ChemSusChem 2020, 13, 5273–5279. [Google Scholar] [CrossRef]
- McCrory, C.C.; Jung, S.; Peters, J.C.; Jaramillo, T.F. Benchmarking Heterogeneous Electrocatalysts for the Oxygen Evolution Reaction. J. Am. Chem. Soc. 2013, 135, 16977–16987. [Google Scholar] [CrossRef]
- Li, Q.; Huang, Z.; Guan, P.; Su, R.; Cao, Q.; Chao, Y.; Shen, W.; Guo, J.; Xu, H.; Che, R. Simultaneous Ni Doping at Atom Scale in Ceria and Assembling into Well-Defined Lotuslike Structure for Enhanced Catalytic Performance. ACS Appl. Mater. Interfaces 2017, 9, 16243–16251. [Google Scholar] [CrossRef] [PubMed]
- Guo, M.; Lu, J.; Wu, Y.; Wang, Y.; Luo, M. UV and Visible Raman Studies of Oxygen Vacancies in Rare-Earth-Doped Ceria. Langmuir 2011, 27, 3872–3877. [Google Scholar] [CrossRef] [PubMed]
- Nakajima, A.; Yoshihara, A.; Ishigame, M. Defect-induced Raman spectra in doped CeO2. Phys. Rev. B 1994, 50, 13297–13307. [Google Scholar] [CrossRef] [PubMed]
- Spanier, J.E.; Robinson, R.D.; Zhang, F.; Chan, S.-W.; Herman, I.P. Size-dependent properties of CeO2−y nanoparticles as studied by Raman scattering. Phys. Rev. B 2001, 64, 245407. [Google Scholar] [CrossRef]
- He, L.; Liang, B.; Li, L.; Yang, X.; Huang, Y.; Wang, A.; Wang, X.; Zhang, T. Cerium-Oxide-Modified Nickel as a Non-Noble Metal Catalyst for Selective Decomposition of Hydrous Hydrazine to Hydrogen. ACS Catal. 2015, 5, 1623–1628. [Google Scholar] [CrossRef]
- Filtschew, A.; Hofmann, K.; Hess, C. Ceria and Its Defect Structure: New Insights from a Combined Spectroscopic Approach. J. Phys. Chem. C 2016, 120, 6694–6703. [Google Scholar] [CrossRef]
- Liu, X.; Zhou, K.; Wang, L.; Wang, B.; Li, Y. Oxygen Vacancy Clusters Promoting Reducibility and Activity of Ceria Nanorods. J. Am. Chem. Soc. 2009, 131, 3140–3141. [Google Scholar] [CrossRef]
Publisher’s Note: MDPI stays neutral with regard to jurisdictional claims in published maps and institutional affiliations. |
© 2021 by the authors. Licensee MDPI, Basel, Switzerland. This article is an open access article distributed under the terms and conditions of the Creative Commons Attribution (CC BY) license (http://creativecommons.org/licenses/by/4.0/).