
Solid-State Dispersions of Platinum in the SnO2 and Fe2O3 Nanomaterials


 ,
,  , and
, and 
Abstract
:1. Introduction
2. Materials and Methods
2.1. Chemicals and Synthesis of the Samples
2.2. Instrumental Analysis
3. Results
4. Discussion
5. Conclusions
Supplementary Materials
Author Contributions
Funding
Data Availability Statement
Acknowledgments
Conflicts of Interest
References
- Chen, M.; Yin, H.; Li, X.; Qiu, Y.; Cao, G.; Wang, J.; Yang, X.; Wang, P. Facet- and defect-engineered Pt/Fe2O3 nanocomposite catalyst for catalytic oxidation of airborne formaldehyde under ambient conditions. J. Hazard. Mater. 2020, 395, 122628. [Google Scholar] [CrossRef]
- Lang, R.; Xi, W.; Liu, J.C.; Cui, Y.T.; Li, T.; Lee, A.F.; Chen, F.; Chen, Y.; Li, L.; Li, L.; et al. Non defect-stabilized thermally stable single-atom catalyst. Nat. Commun. 2019, 10, 234. [Google Scholar] [CrossRef]
- Ren, Y.; Tang, Y.; Zhang, L.; Liu, X.; Li, L.; Miao, S.; Su, D.S.; Wang, A.; Li, J.; Zhang, T. Unraveling the coordination structure-performance relationship in Pt1/Fe2O3 single-atom catalyst. Nat. Commun. 2019, 10, 1–9. [Google Scholar] [CrossRef] [Green Version]
- Liu, L.; Zhou, F.; Wang, L.; Qi, X.; Shi, F.; Deng, Y. Low-temperature CO oxidation over supported Pt, Pd catalysts: Particular role of FeOx support for oxygen supply during reactions. J. Catal. 2010, 274, 1–10. [Google Scholar] [CrossRef]
- Li, S.; Liu, G.; Lian, H.; Jia, M.; Zhao, G.; Jiang, D.; Zhang, W. Low-temperature CO oxidation over supported Pt catalysts prepared by colloid-deposition method. Catal. Commun. 2008, 9, 1045–1049. [Google Scholar] [CrossRef]
- Li, J.; Zhang, Y.; Yi, T.; Zhang, Z.; Miao, Z.; Sun, L.; Zhang, Z.; Yang, X. The redispersion behaviour of Pt on the surface of Fe2O3. RSC Adv. 2016, 6, 25894–25899. [Google Scholar] [CrossRef]
- D’Arienzo, M.; Armelao, L.; Cacciamani, A.; Mari, C.M.; Polizzi, S.; Ruffo, R.; Scotti, R.; Testino, A.; Wahba, L.; Morazzoni, F. One-step preparation of SnO2 and Pt-doped SnO2 as inverse opal thin films for gas sensing. Chem. Mater. 2010, 22, 4083–4089. [Google Scholar] [CrossRef]
- Dong, C.; Liu, X.; Xiao, X.; Chen, G.; Wang, Y.; Djerdj, I. Combustion synthesis of porous Pt-functionalized SnO2 sheets for isopropanol gas detection with a significant enhancement in response. J. Mater. Chem. A 2014, 2, 20089–20095. [Google Scholar] [CrossRef]
- Lee, S.H.; Galstyan, V.; Ponzoni, A.; Gonzalo-Juan, I.; Riedel, R.; Dourges, M.A.; Nicolas, Y.; Toupance, T. Finely Tuned SnO2 Nanoparticles for Efficient Detection of Reducing and Oxidizing Gases: The Influence of Alkali Metal Cation on Gas-Sensing Properties. ACS Appl. Mater. Interfaces 2018, 10, 10173–10184. [Google Scholar] [CrossRef] [PubMed]
- Prodjosantoso, A.K. Preparation and characterization of chloride-free alumina-supported platinum catalysts. Orient. J. Chem. 2018, 34, 2068–2073. [Google Scholar] [CrossRef] [Green Version]
- Pavlišič, A.; Jovanovič, J.; Šelih, V.S.; Šala, M.; Hodnik, N.; Hočevar, S.; Gaberšček, M. The influence of chloride impurities on Pt/C fuel cell catalyst corrosion. Chem. Commun. 2014, 50, 3732–3734. [Google Scholar] [CrossRef]
- Gotić, M.; Koščec, G.; Musić, S. Study of the reduction and reoxidation of substoichiometric magnetite. J. Mol. Struct. 2009. [Google Scholar] [CrossRef]
- Gotić, M.; Musić, S. Mössbauer, FT-IR and FE SEM investigation of iron oxides precipitated from FeSO4 solutions. J. Mol. Struct. 2007, 834–836, 445–453. [Google Scholar] [CrossRef]
- Gotić, M.; Musić, S. Synthesis of nanocrystalline iron oxide particles in the iron(III) acetate/alcohol/acetic acid system. Eur. J. Inorg. Chem. 2008, 6, 966–973. [Google Scholar] [CrossRef]
- Marić, I.; Gotić, M.; Jurkin, T.; Mikac, L.; Tronc, É.; Ivanda, M. Structural Properties of Iron/Titanium Oxide Nanoparticles Synthesized by Sol-gel Method in the Presence of Poly(ethylene glycol). Croat. Chem. Acta 2019, 91, 577–588. [Google Scholar] [CrossRef]
- Jurkin, T.; Gotić, M.; Štefanić, G.; Pucić, I. Gamma-irradiation synthesis of iron oxide nanoparticles in the presence of PEO, PVP or CTAB. Radiat. Phys. Chem. 2016, 124, 75–83. [Google Scholar] [CrossRef]
- Dražić, G.; Štefanić, G.; Jurkin, T.; Gotić, M. Impact of cadmium and phosphate ions on the hematite nanorings formation. J. Mol. Struct. 2017, 1251, 113–121. [Google Scholar] [CrossRef]
- Jurkin, T.; Štefanić, G.; Dražić, G.; Gotić, M. Synthesis route to δ-FeOOH nanodiscs. Mater. Lett. 2016, 173, 55–59. [Google Scholar] [CrossRef]
- Śmiechowicz, I.; Kocemba, I.; Rogowski, J.; Czupryn, K. CO oxidation over Pt/SnO2 catalysts. React. Kinet. Mech. Catal. 2018, 124, 633–649. [Google Scholar] [CrossRef] [Green Version]
- Kocemba, I.; Rynkowski, J. The influence of catalytic activity on the response of Pt/SnO2 gas sensors to carbon monoxide and hydrogen. Sens. Actuators B Chem. 2011, 155, 659–666. [Google Scholar] [CrossRef]
- Hu, J.; Wang, Y.; Wang, W.; Xue, Y.; Li, P.; Lian, K.; Chen, L.; Zhang, W.; Zhuiykov, S. Enhancement of the acetone sensing capabilities to ppb detection level by Fe-doped three-dimensional SnO2 hierarchical microstructures fabricated via a hydrothermal method. J. Mater. Sci. 2017, 52, 11554–11568. [Google Scholar] [CrossRef]
- Haschke, S.; Zhuo, Y.; Schlicht, S.; Barr, M.K.S.; Kloth, R.; Dufond, M.E.; Santinacci, L.; Bachmann, J. Enhanced Oxygen Evolution Reaction Activity of Nanoporous SnO2/Fe2O3/IrO2 Thin Film Composite Electrodes with Ultralow Noble Metal Loading. Adv. Mater. Interfaces 2019, 6, 1801432. [Google Scholar] [CrossRef] [Green Version]
- Vinayan, B.P.; Ramaprabhu, S. Platinum-TM (TM = Fe, Co) alloy nanoparticles dispersed nitrogen doped (reduced graphene oxide-multiwalled carbon nanotube) hybrid structure cathode electrocatalysts for high performance PEMFC applications. Nanoscale 2013, 5, 5109–5118. [Google Scholar] [CrossRef] [PubMed]
- Zhang, J.; Liu, X.; Guo, X.; Wu, S.; Wang, S. A general approach to fabricate diverse noble-metal (Au, Pt, Ag, Pt/Au)/Fe2O3 hybrid nanomaterials. Chem. A Eur. J. 2010, 16, 8108–8116. [Google Scholar] [CrossRef] [PubMed]
- Ouyang, S.C.; Wang, L.W.; Du, X.W.; Zhang, C.; Yang, J. In situ synthesis of highly-active Pt nanoclusters via thermal decomposition for high-temperature catalytic reactions. RSC Adv. 2016, 6, 49777–49781. [Google Scholar] [CrossRef]
- Liu, Y.; Guo, D.; Wu, K.; Guo, J.; Li, Z. Simultaneous enhanced electrochemical and photoelectrochemical properties of -Fe2O3/graphene by hydrogen annealing. Mater. Res. Express 2020, 7, 25032. [Google Scholar] [CrossRef]
- Ma, H.; Teng, K.; Fu, Y.; Song, Y.; Wang, Y.; Dong, X. Synthesis of visible-light responsive Sn-SnO2/C photocatalyst by simple carbothermal reduction. Energy Environ. Sci. 2011, 4, 3067–3073. [Google Scholar] [CrossRef]
- Taniya, K.; Yu, C.H.; Takado, H.; Hara, T.; Okemoto, A.; Horie, T.; Ichihashi, Y.; Tsang, S.C.; Nishiyama, S. Synthesis of bimetallic SnPt-nanoparticle catalysts for chemoselective hydrogenation of crotonaldehyde: Relationship between SnxPty alloy phase and catalytic performance. Catal. Today 2018, 303, 241–248. [Google Scholar] [CrossRef]
- Anenburg, M.; Wykes, J.L.; Troitzsch, U.; Le Losq, C.; Chen, J. Iron cation vacancies in Pt(iv)-doped hematite. Mater. Adv. 2021, 2, 5195–5202. [Google Scholar] [CrossRef]
- Murata, N.; Suzuki, T.; Kobayashi, M.; Togoh, F.; Asakura, K. Characterization of Pt-doped SnO2 catalyst for a high-performance micro gas sensor. Phys. Chem. Chem. Phys. 2013, 15, 17938–17946. [Google Scholar] [CrossRef] [Green Version]


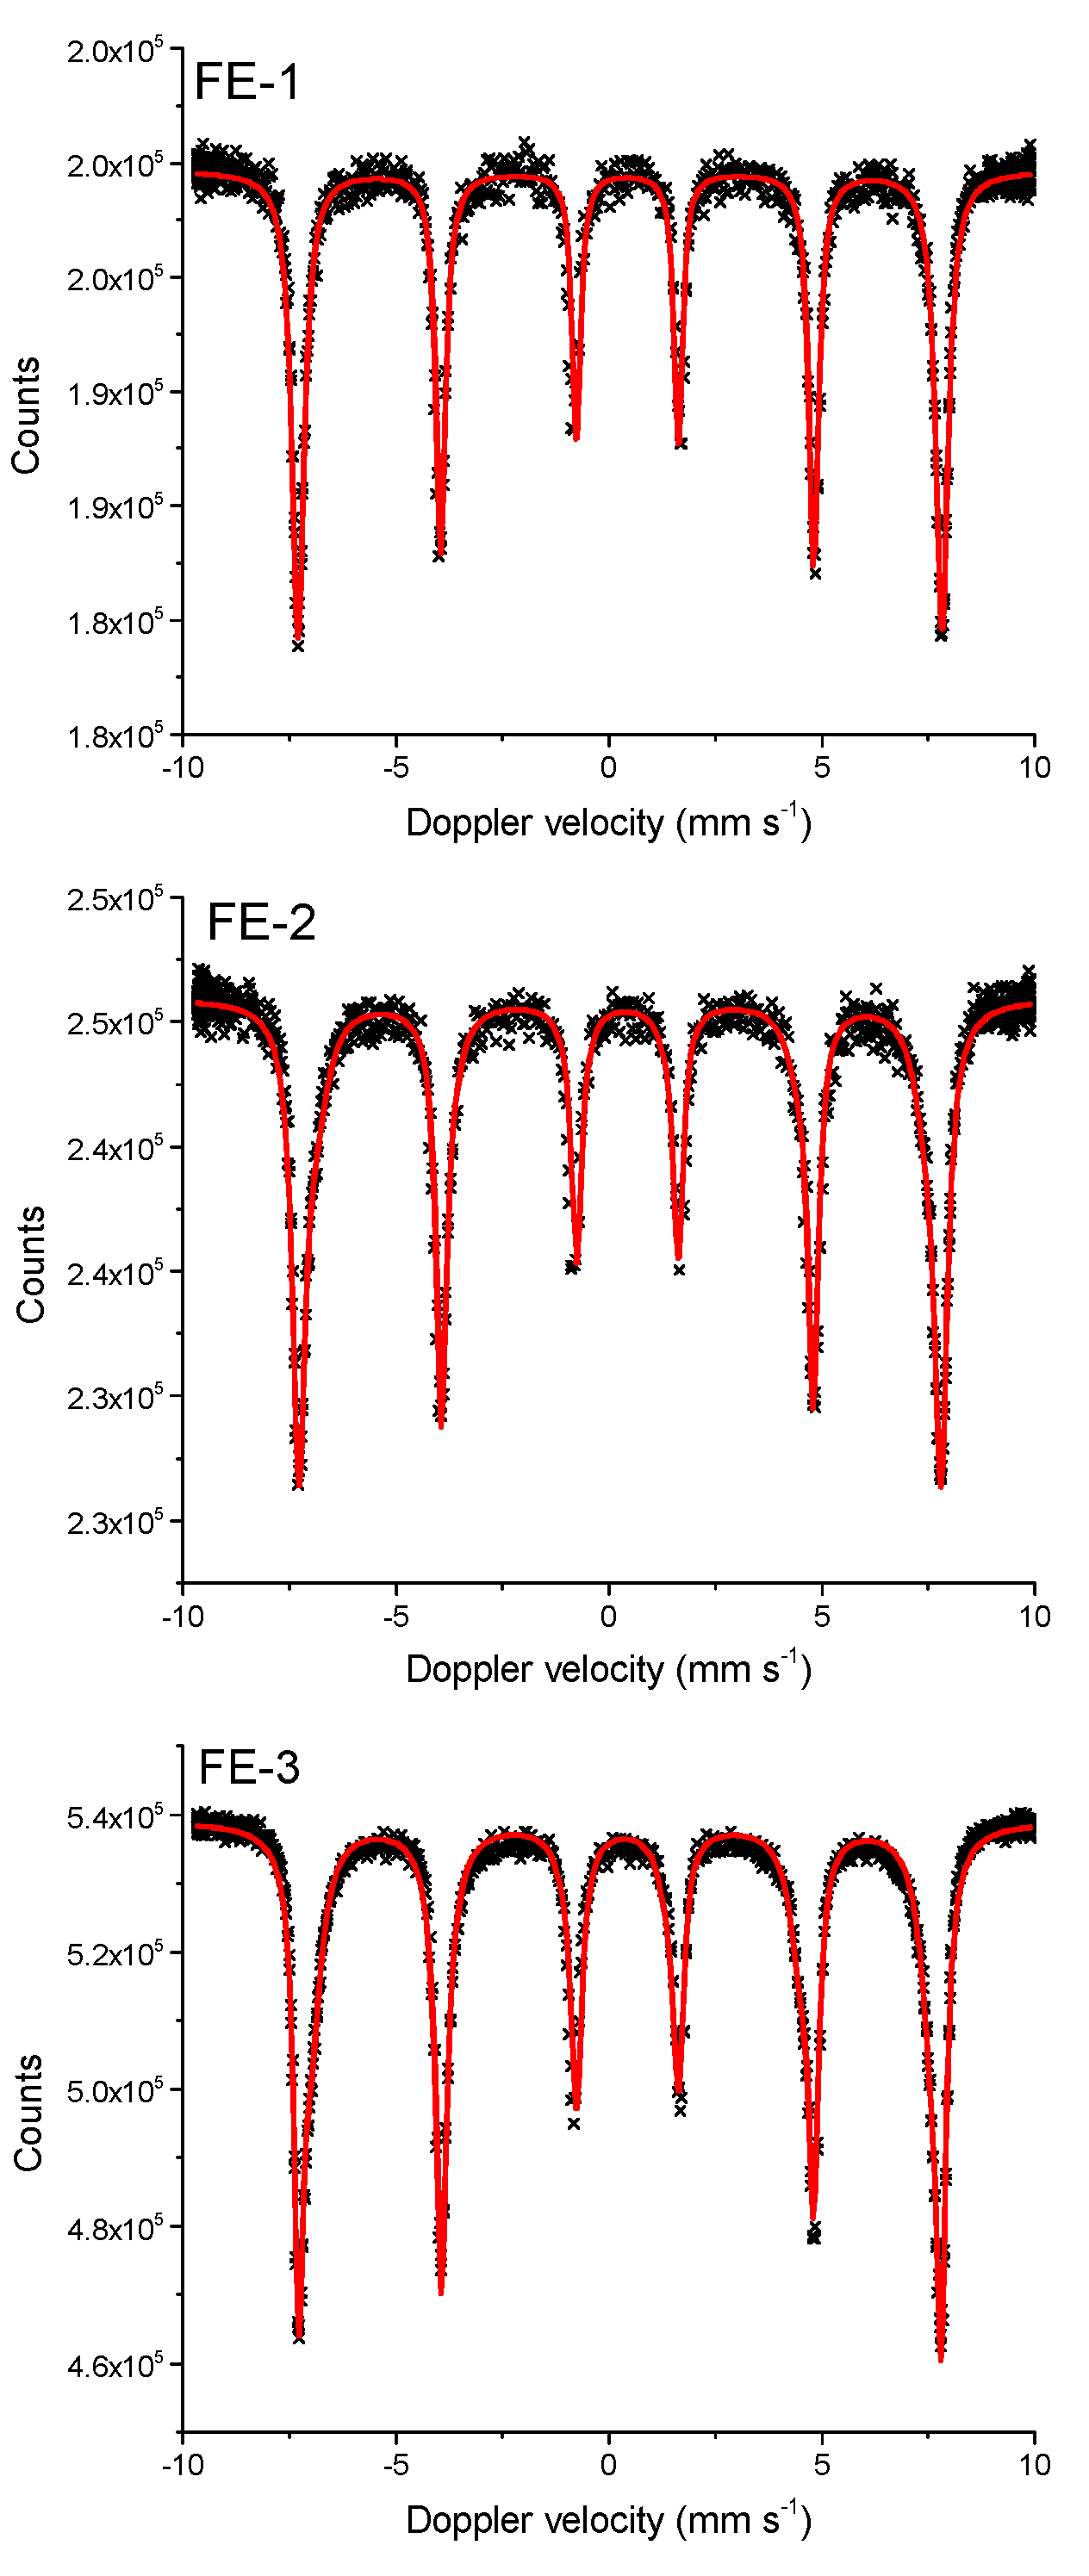
| Sample | Fitting Curve | δ/ mm s−1 | 2ε/mm s−1 | Bhf/ T | Γ/ mm s−1 | χ2 |
|---|---|---|---|---|---|---|
| FE-1 | M1 | 0.35 | −0.17 | 46.99 | 0.30 | 2.78 |
| FE-2 | M1 | 0.35 | −0.17 | 46.89 | 0.40 | 2.02 |
| FE-3 | M1 | 0.35 | −0.16 | 46.58 | 0.41 | 2.15 |
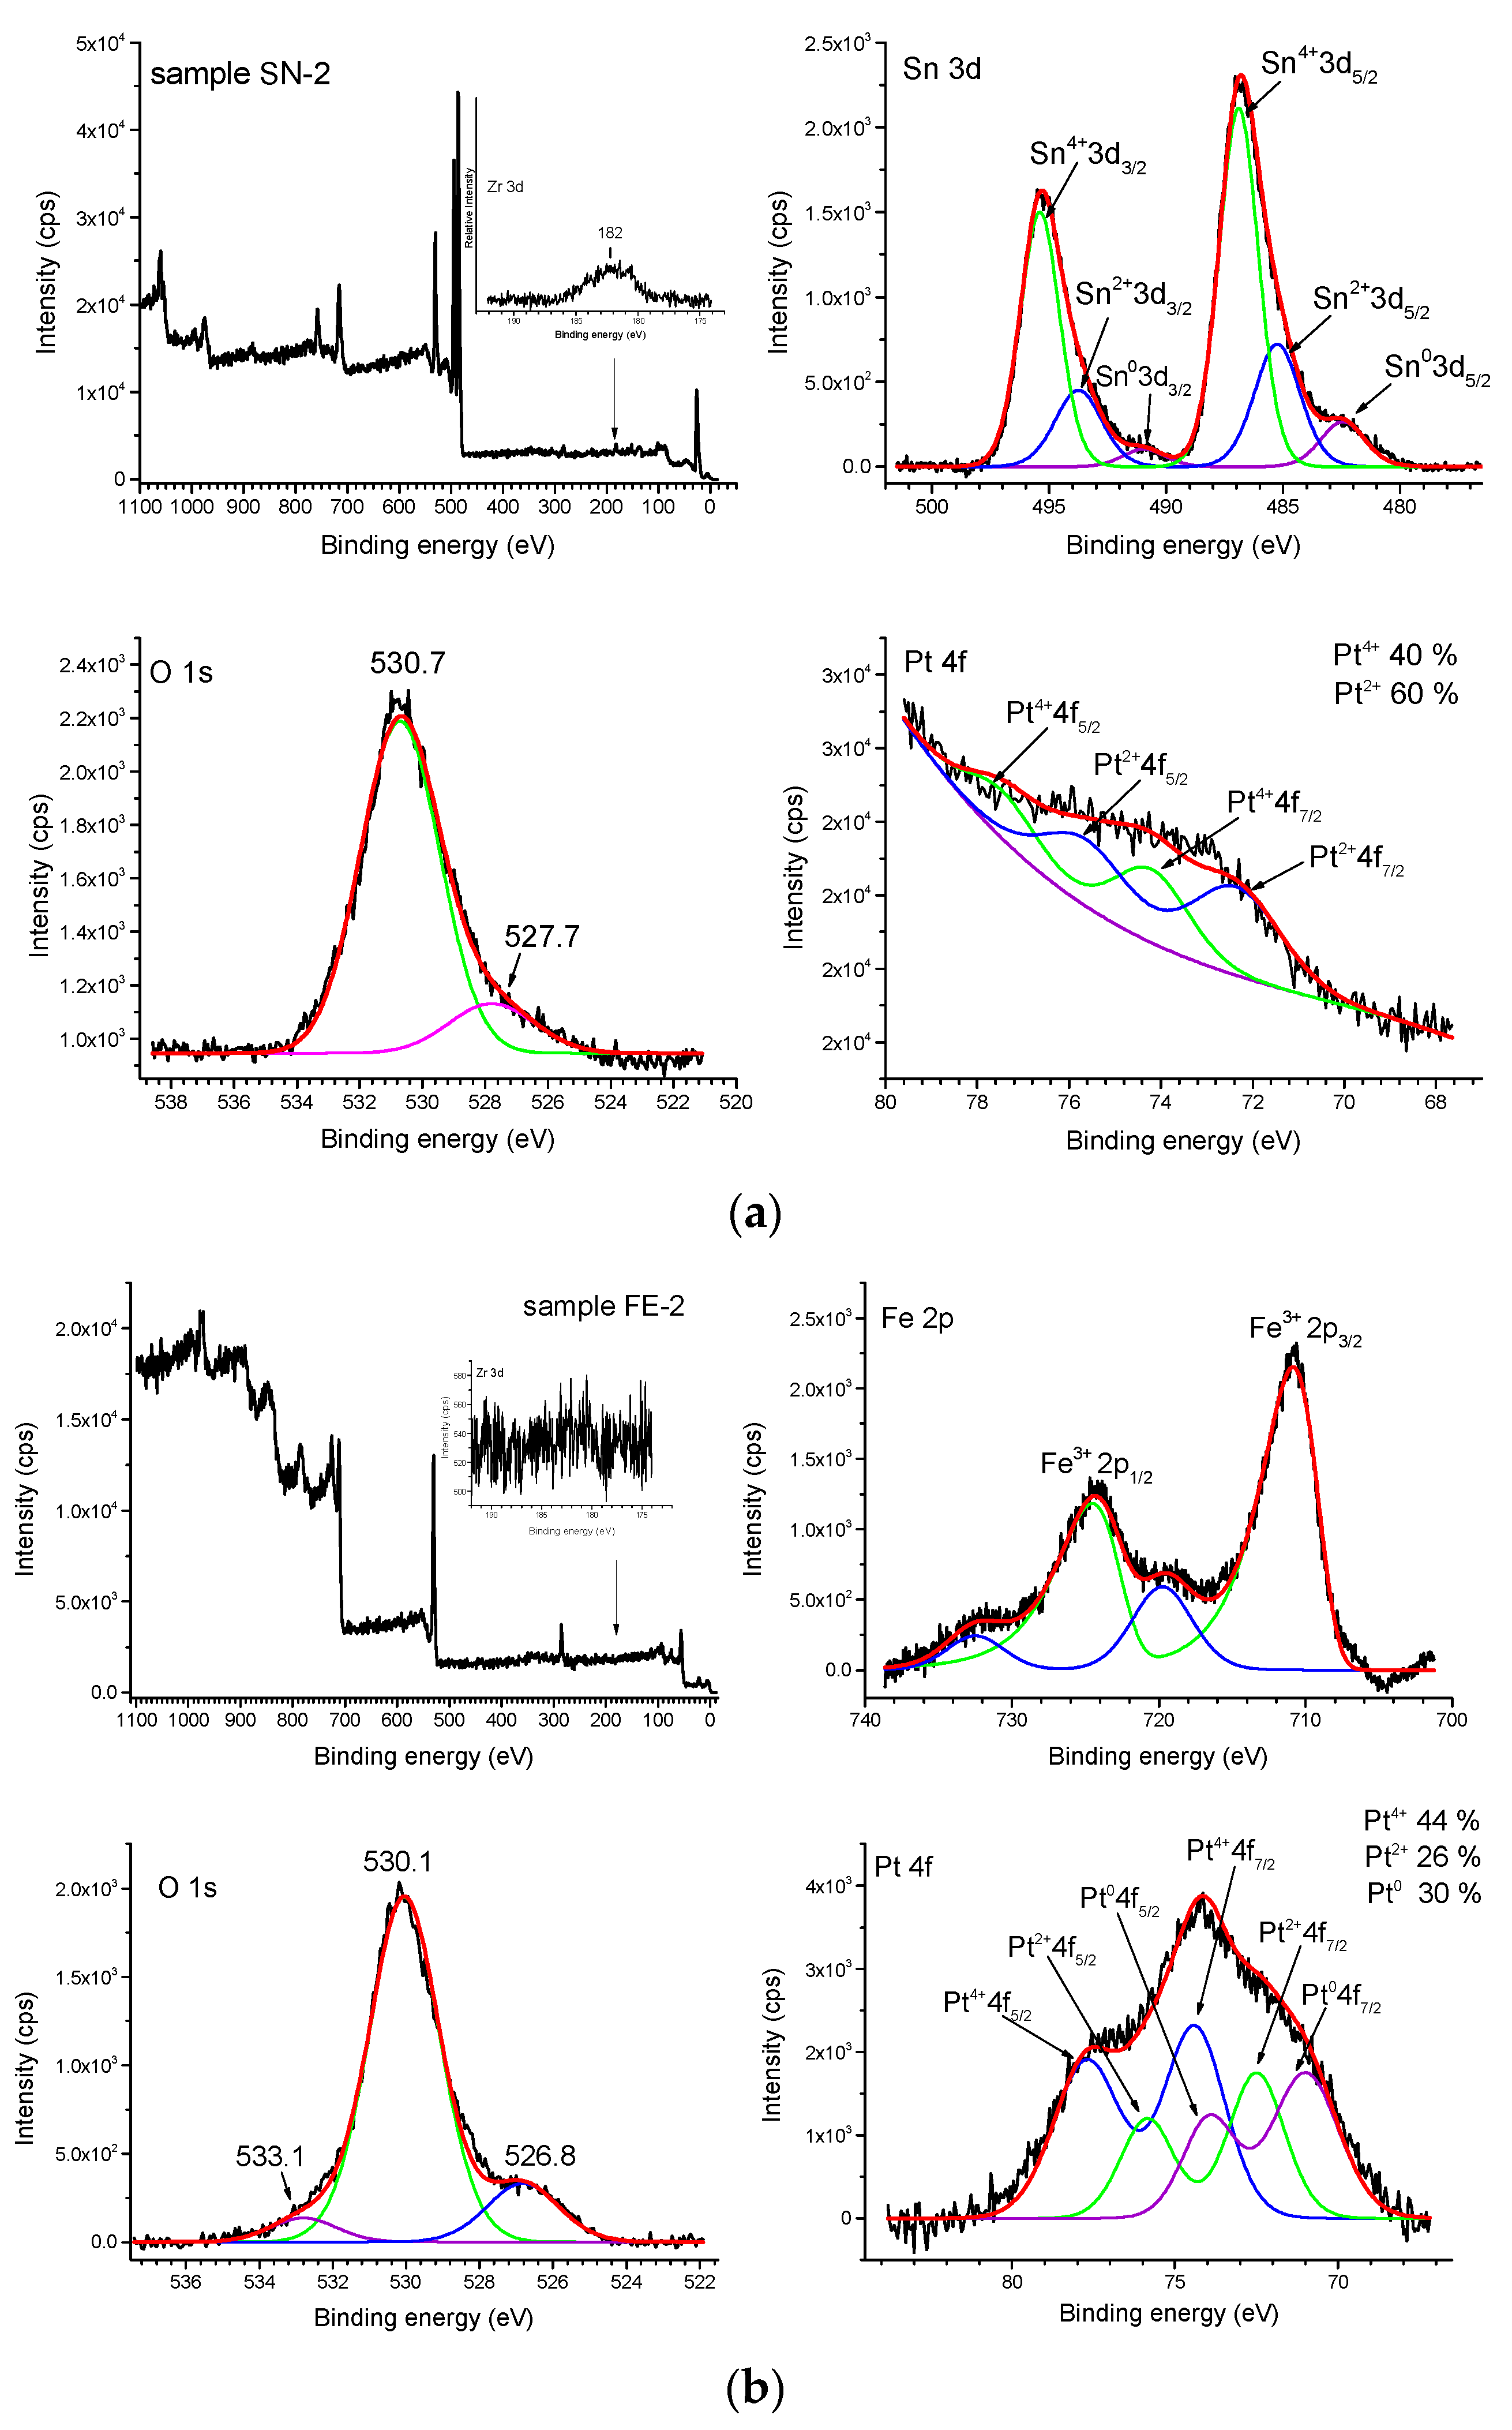
| Sample | Pt 4f/(eV) | Sn 3d/(eV) | O 1s/(eV) |
| SN-2 | Pt4+ 4f7/2/74.1 | Sn4+ 3d5/2/486.9 | O 1s/530.7 |
| Pt4+ 4f5/2/77.6 | Sn4+ 3d3/2/495.4 | O 1s/527.7 | |
| Pt2+ 4f7/2/72.3 | Sn2+ 3d5/2/485.2 | ||
| Pt2+ 4f5/2/75.8 | Sn2+ 3d3/2/493.7 | ||
| Sn0 3d5/2/482.5 | |||
| Sn0 3d3/2/490.8 | |||
| Sample | Pt 4f/(eV) | Fe 2p/(eV) | O 1s/(eV) |
| FE-2 | Pt4+ 4f7/2/74.4 | Fe3+ 3p3/2/710.8 | O 1s/526.8 |
| Pt4+ 4f5/2/77.9 | Fe3+ 3p1/2/724.7 | O 1s/530.1 | |
| Pt2+ 4f7/2/72.5 | Satellite peak/719.8 | O 1s/533.1 | |
| Pt2+ 4f5/2/75.9 | Satellite peak/732.5 | ||
| Pt0 4f7/2/70.9 | |||
| Pt0 4f5/2/73.9 |
Publisher’s Note: MDPI stays neutral with regard to jurisdictional claims in published maps and institutional affiliations. |
© 2021 by the authors. Licensee MDPI, Basel, Switzerland. This article is an open access article distributed under the terms and conditions of the Creative Commons Attribution (CC BY) license (https://creativecommons.org/licenses/by/4.0/).
Share and Cite
Radin, E.; Štefanić, G.; Dražić, G.; Marić, I.; Jurkin, T.; Pustak, A.; Baran, N.; Raić, M.; Gotić, M. Solid-State Dispersions of Platinum in the SnO2 and Fe2O3 Nanomaterials. Nanomaterials 2021, 11, 3349. https://doi.org/10.3390/nano11123349
Radin E, Štefanić G, Dražić G, Marić I, Jurkin T, Pustak A, Baran N, Raić M, Gotić M. Solid-State Dispersions of Platinum in the SnO2 and Fe2O3 Nanomaterials. Nanomaterials. 2021; 11(12):3349. https://doi.org/10.3390/nano11123349
Chicago/Turabian StyleRadin, Edi, Goran Štefanić, Goran Dražić, Ivan Marić, Tanja Jurkin, Anđela Pustak, Nikola Baran, Matea Raić, and Marijan Gotić. 2021. "Solid-State Dispersions of Platinum in the SnO2 and Fe2O3 Nanomaterials" Nanomaterials 11, no. 12: 3349. https://doi.org/10.3390/nano11123349
APA StyleRadin, E., Štefanić, G., Dražić, G., Marić, I., Jurkin, T., Pustak, A., Baran, N., Raić, M., & Gotić, M. (2021). Solid-State Dispersions of Platinum in the SnO2 and Fe2O3 Nanomaterials. Nanomaterials, 11(12), 3349. https://doi.org/10.3390/nano11123349