
Mechanical Milling: A Superior Nanotechnological Tool for Fabrication of Nanocrystalline and Nanocomposite Materials

 ,
,  , and
, and 
Abstract
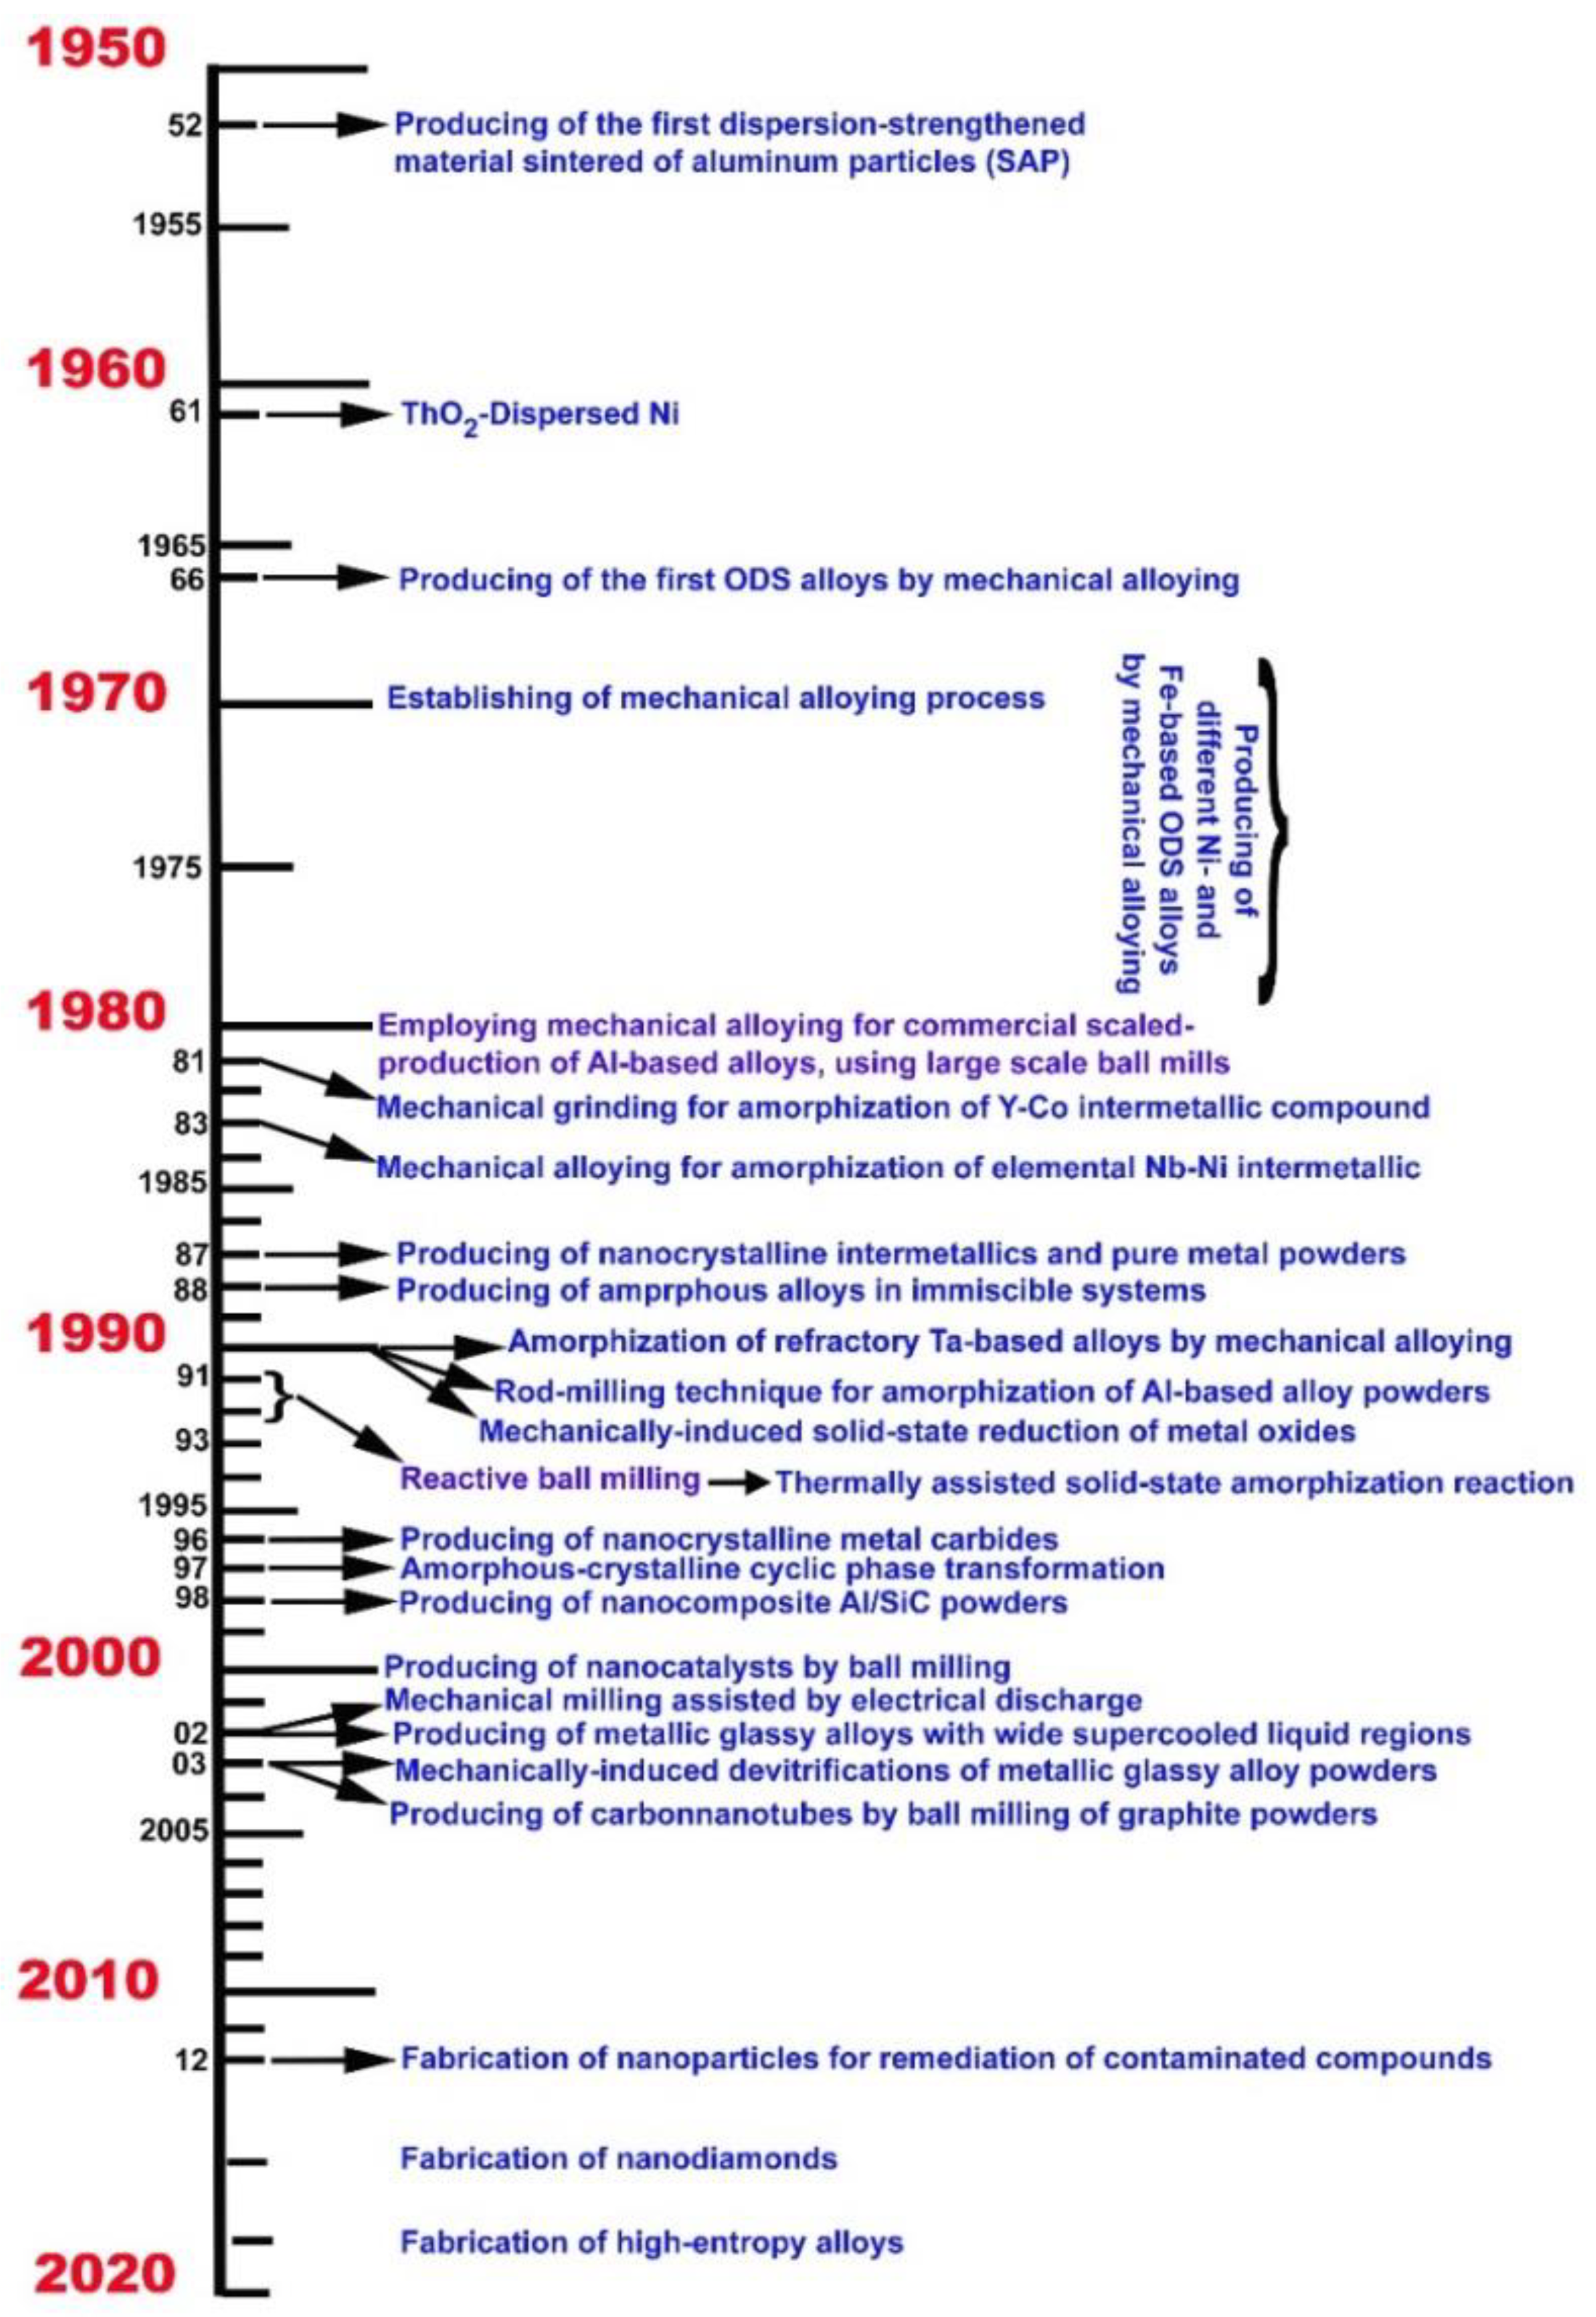
:1. Introduction
Strategies for the Development of New Material Categories
2. Mechanically-Induced Milling for Preparing Advanced Materials
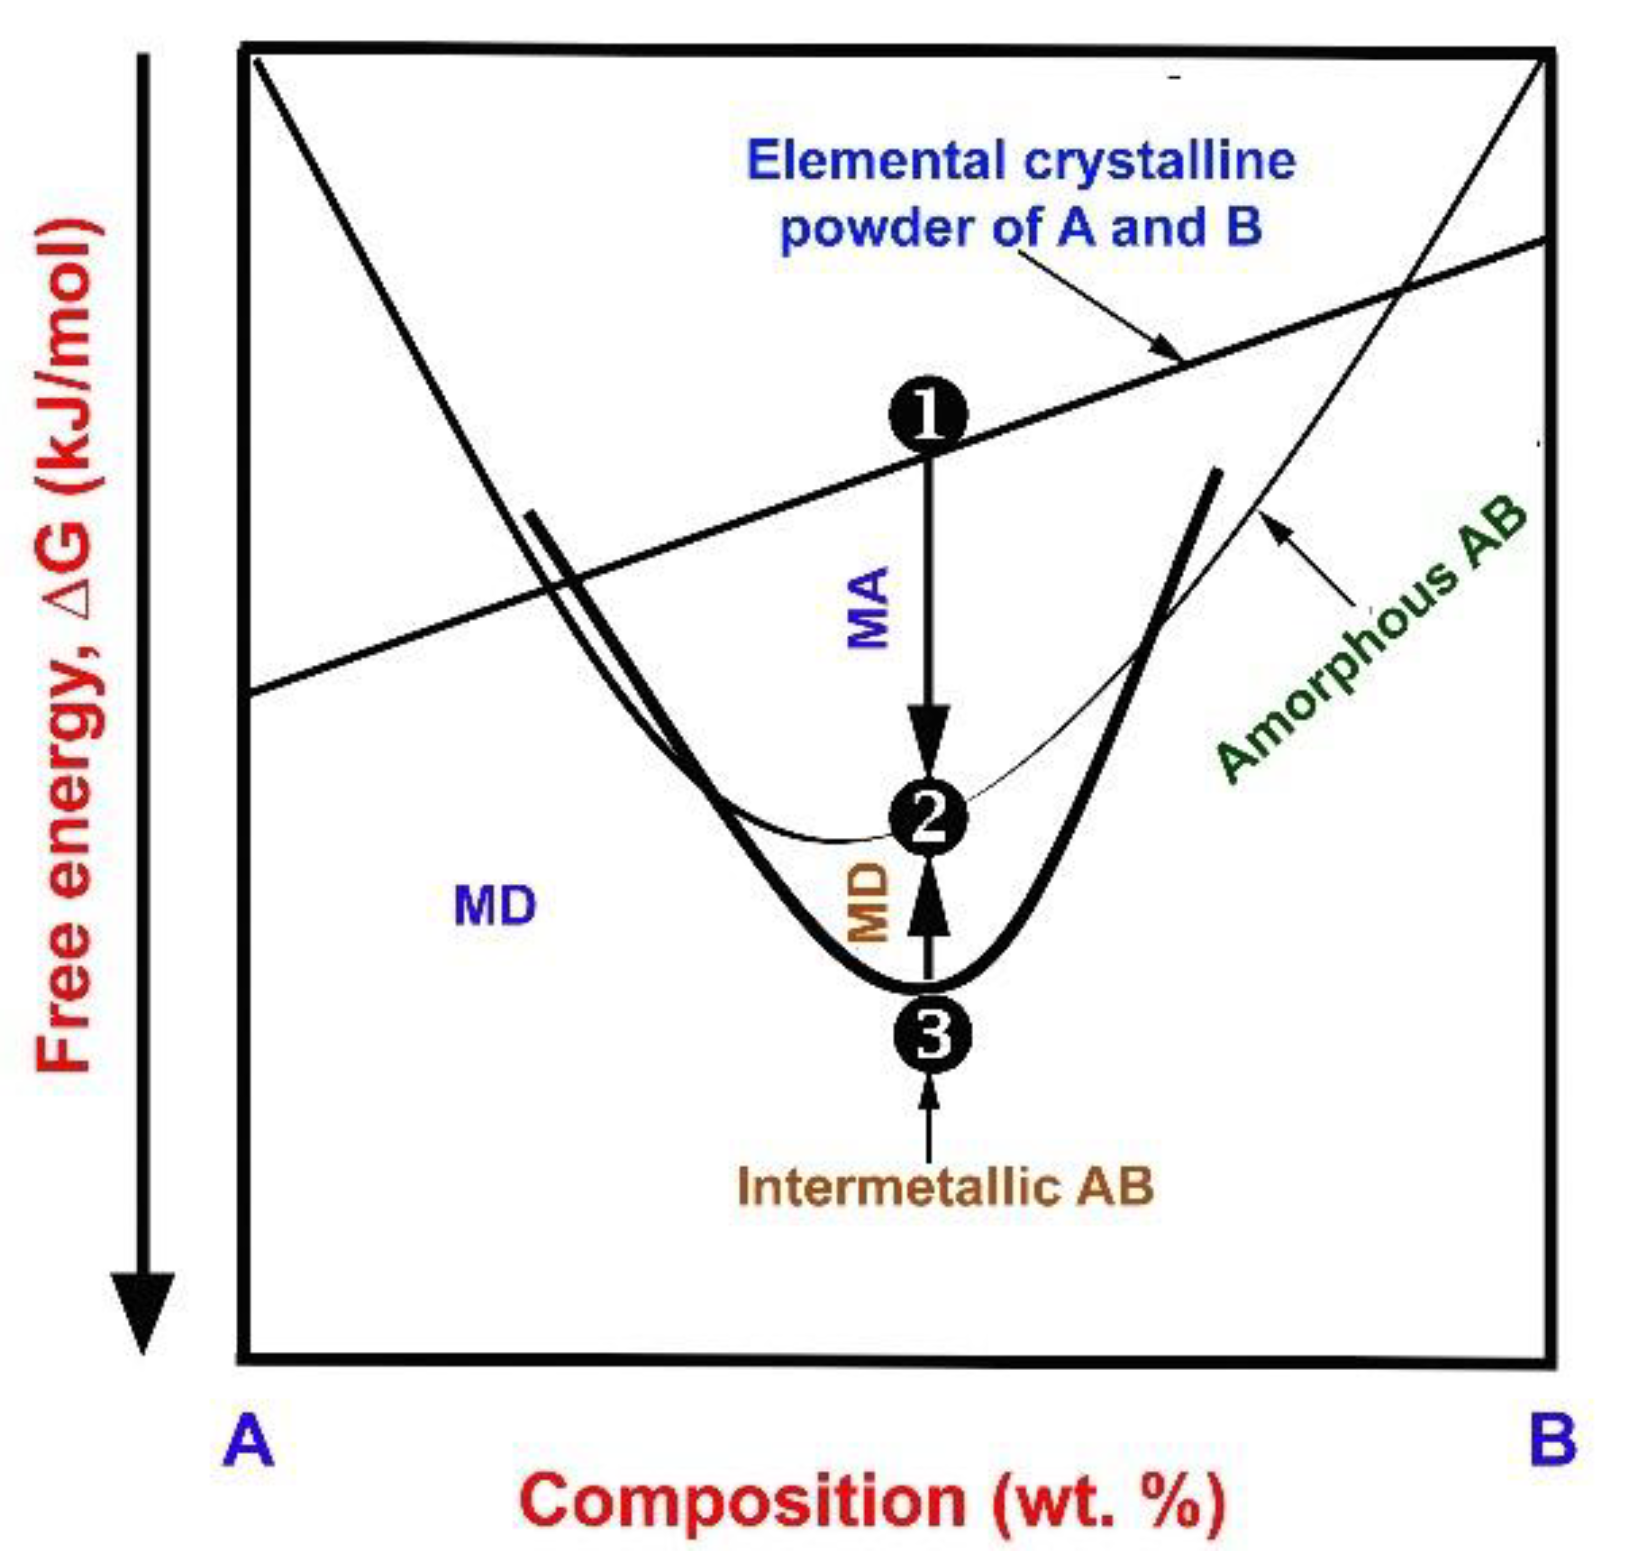
2.1. The Necessity of MA
2.2. MA and Mechanical Disordering (MD)
2.3. Types of Ball Mill
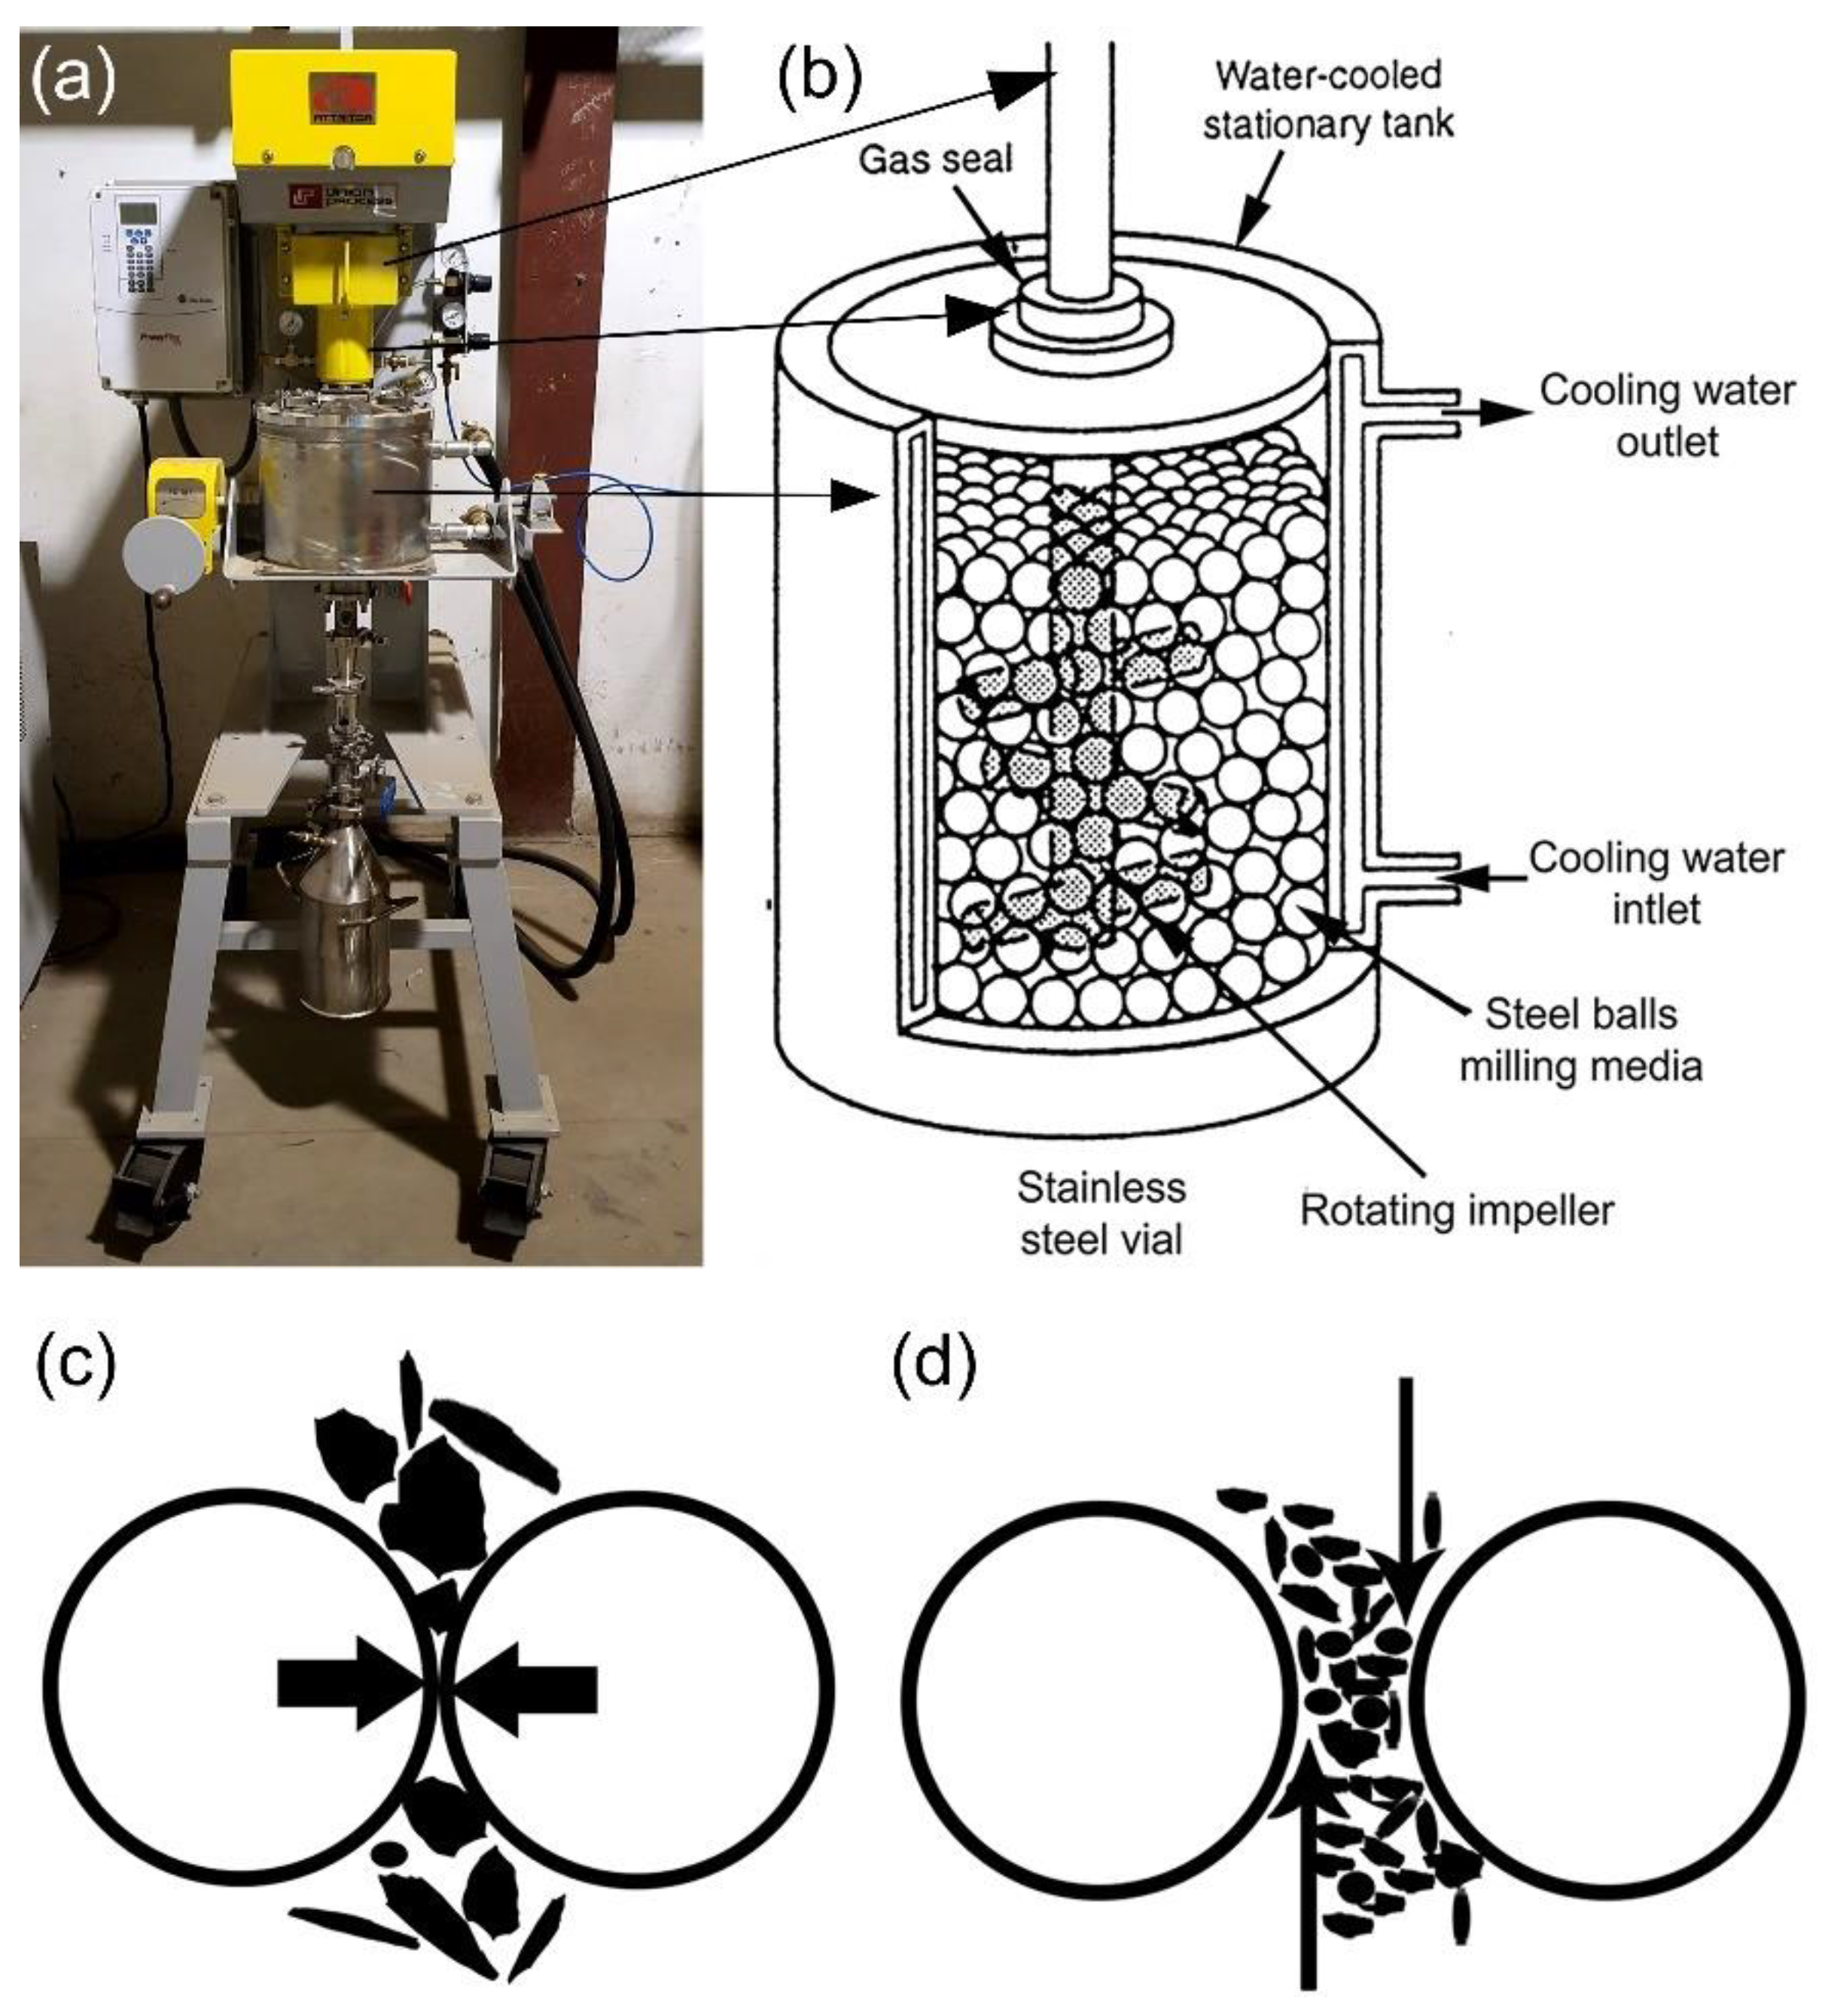
2.3.1. High Energy Ball Mills
- Attritor Ball Mill
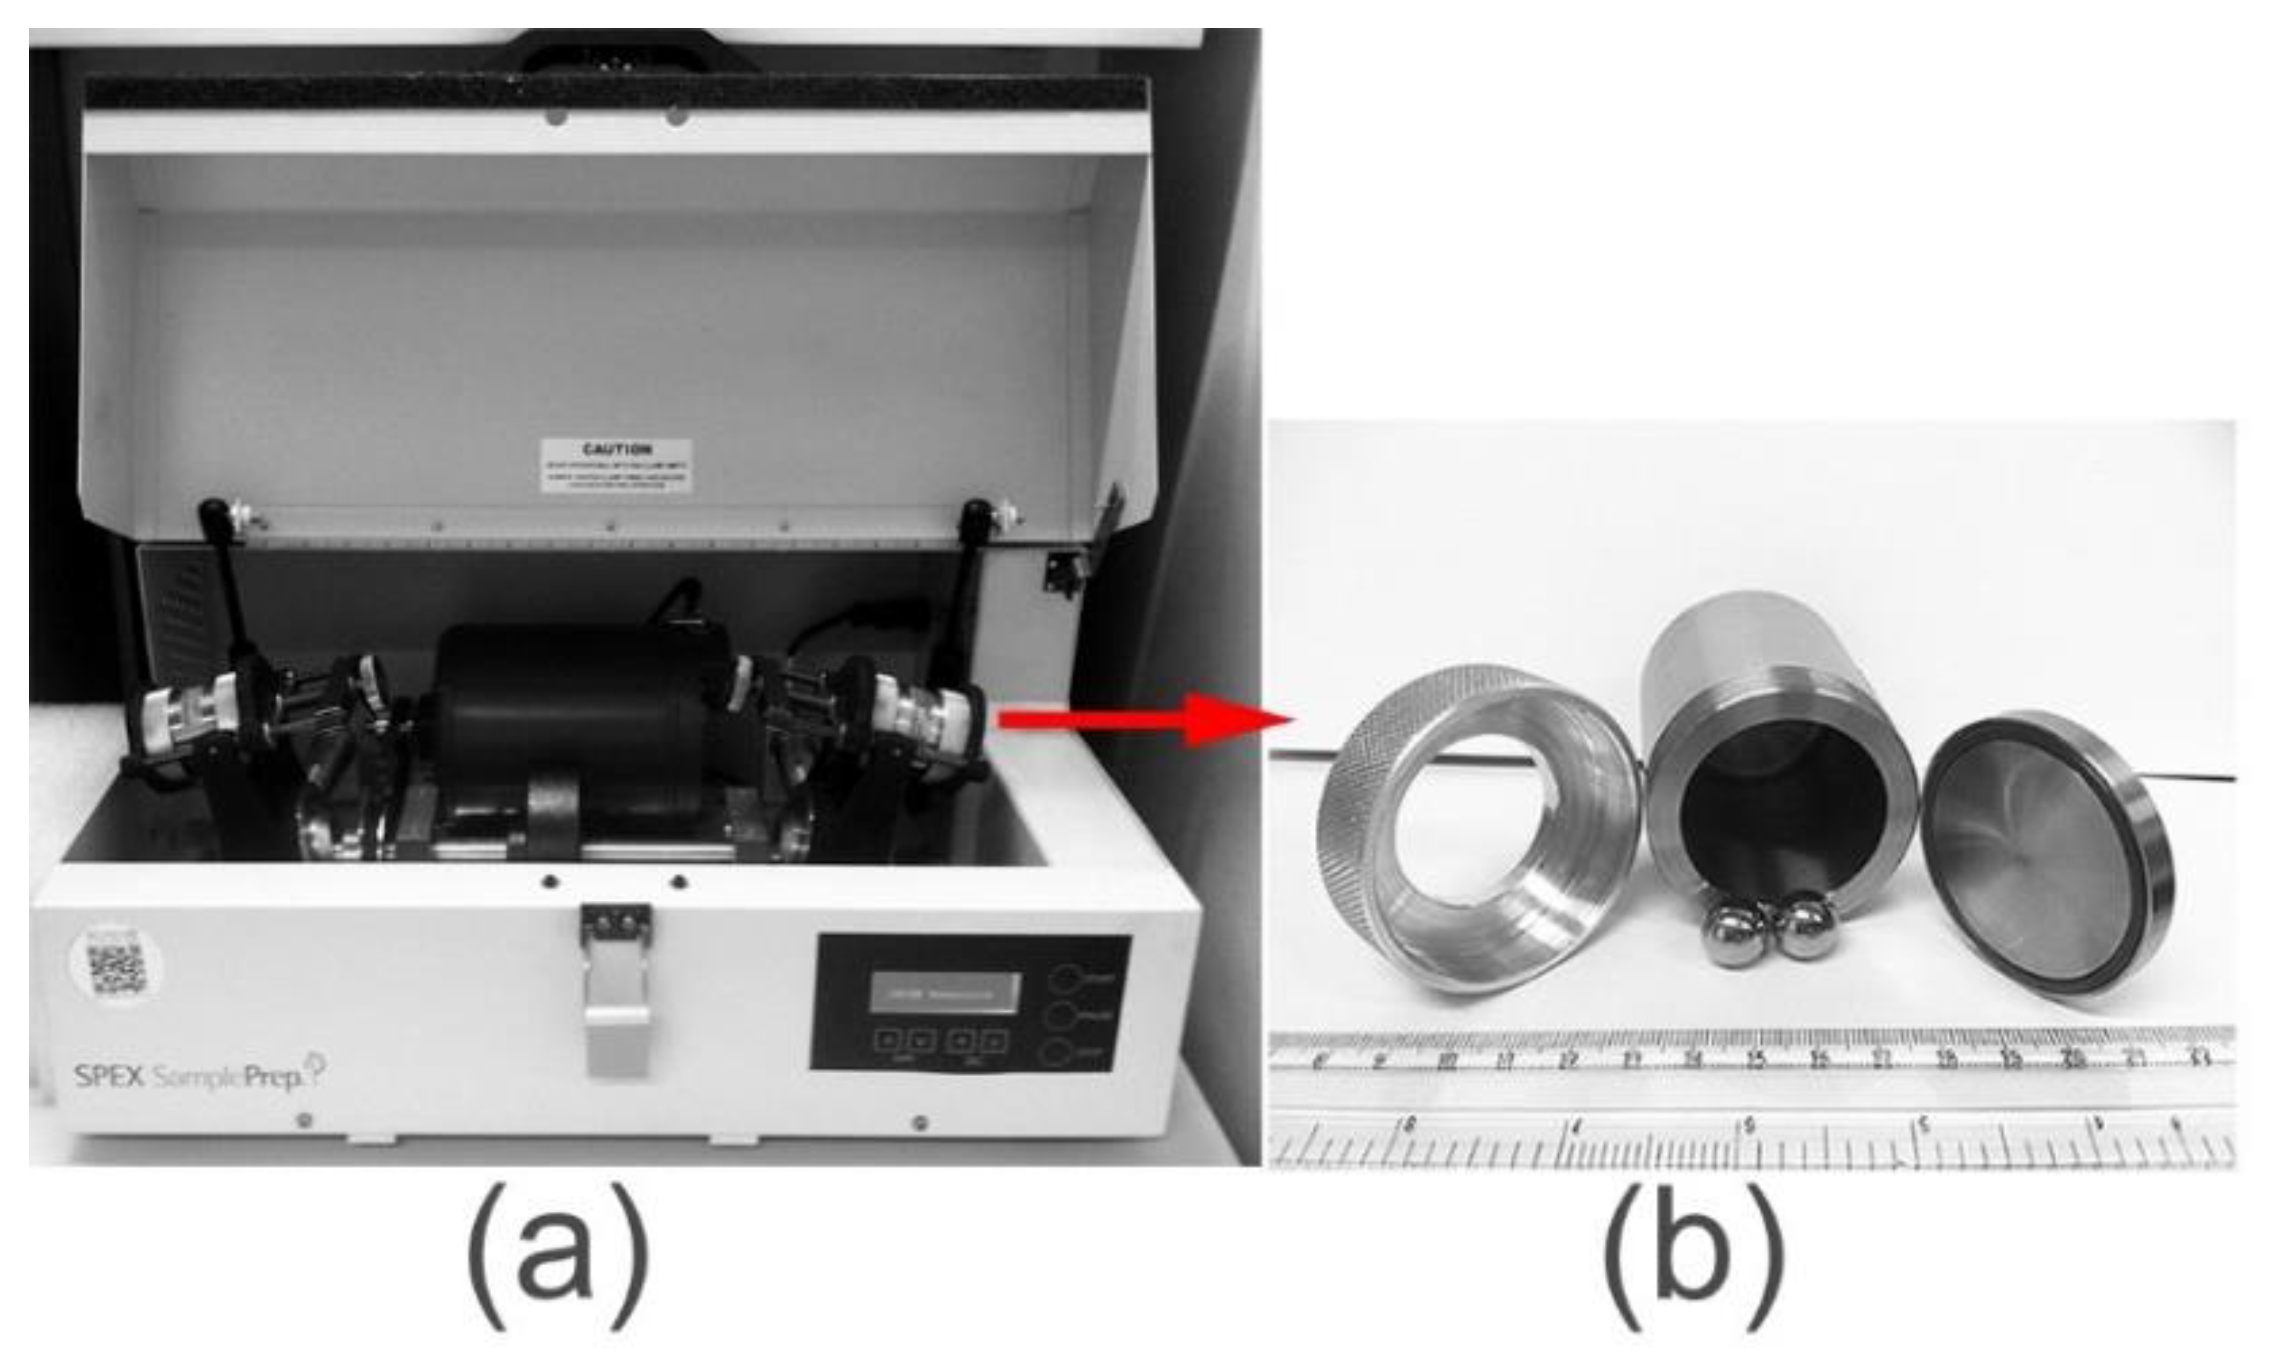
- Shaker Mills
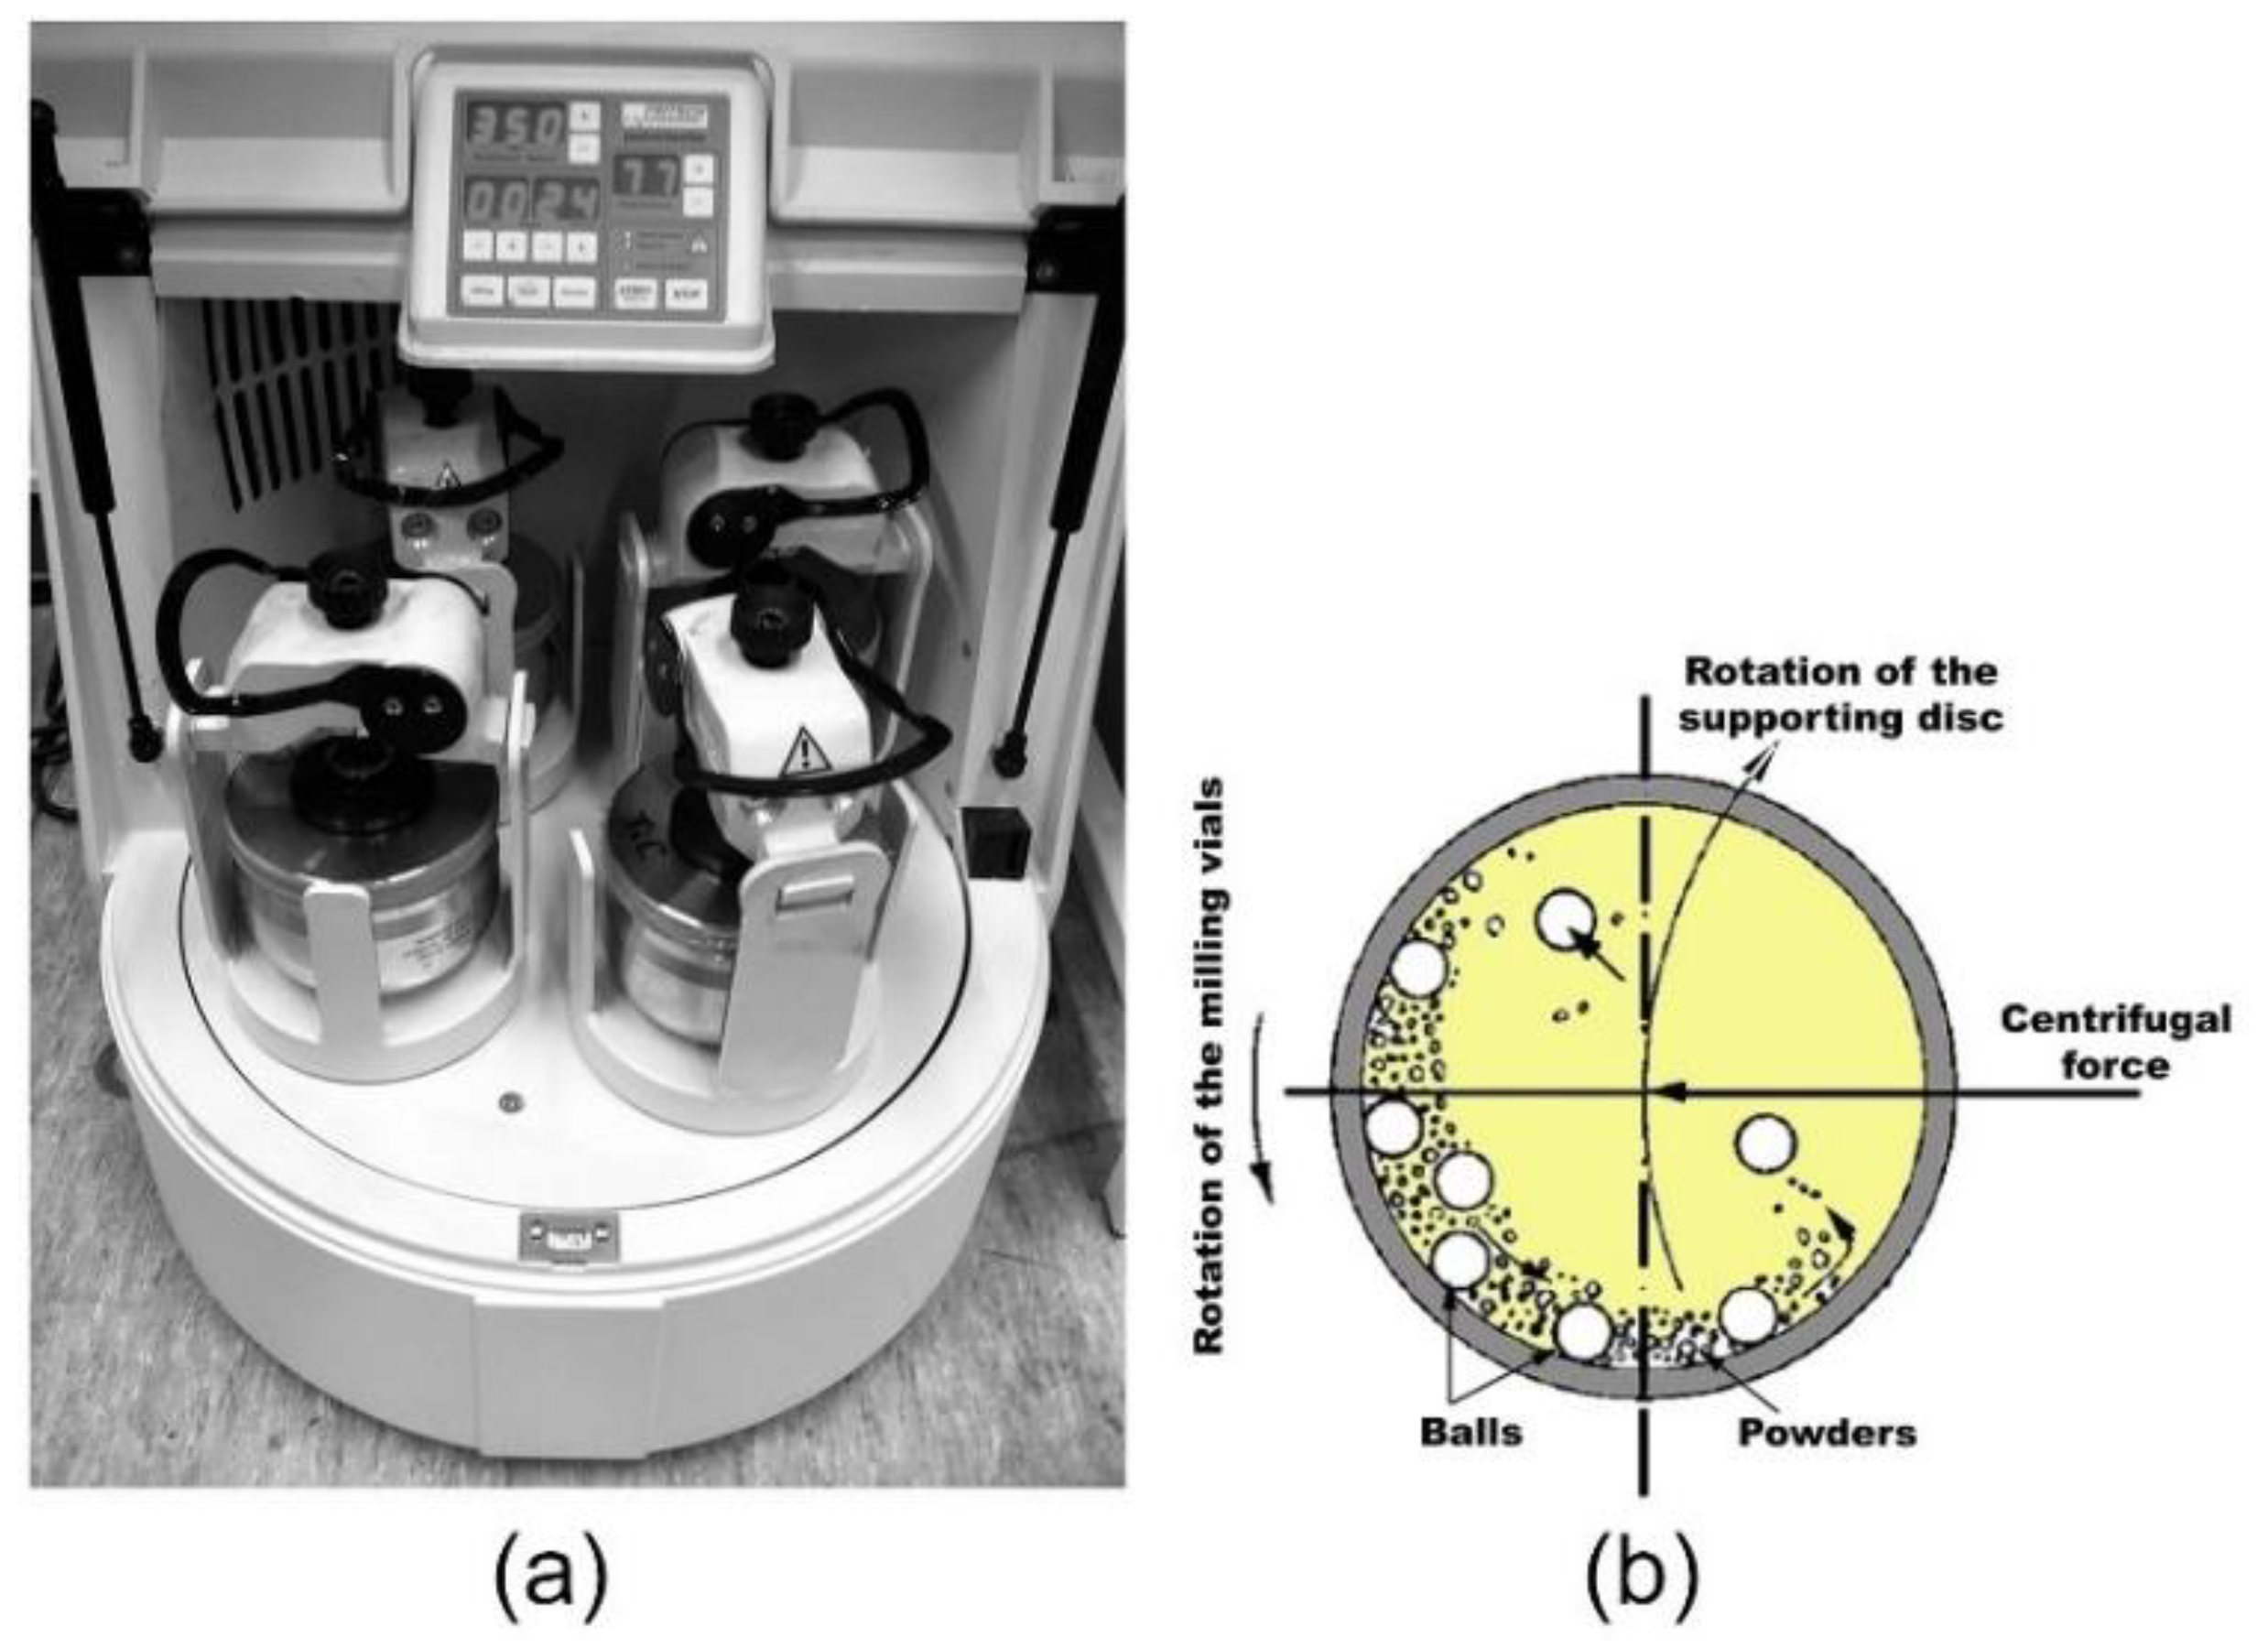
- Planetary Mall Mills
2.3.2. Low Energy Ball Mills
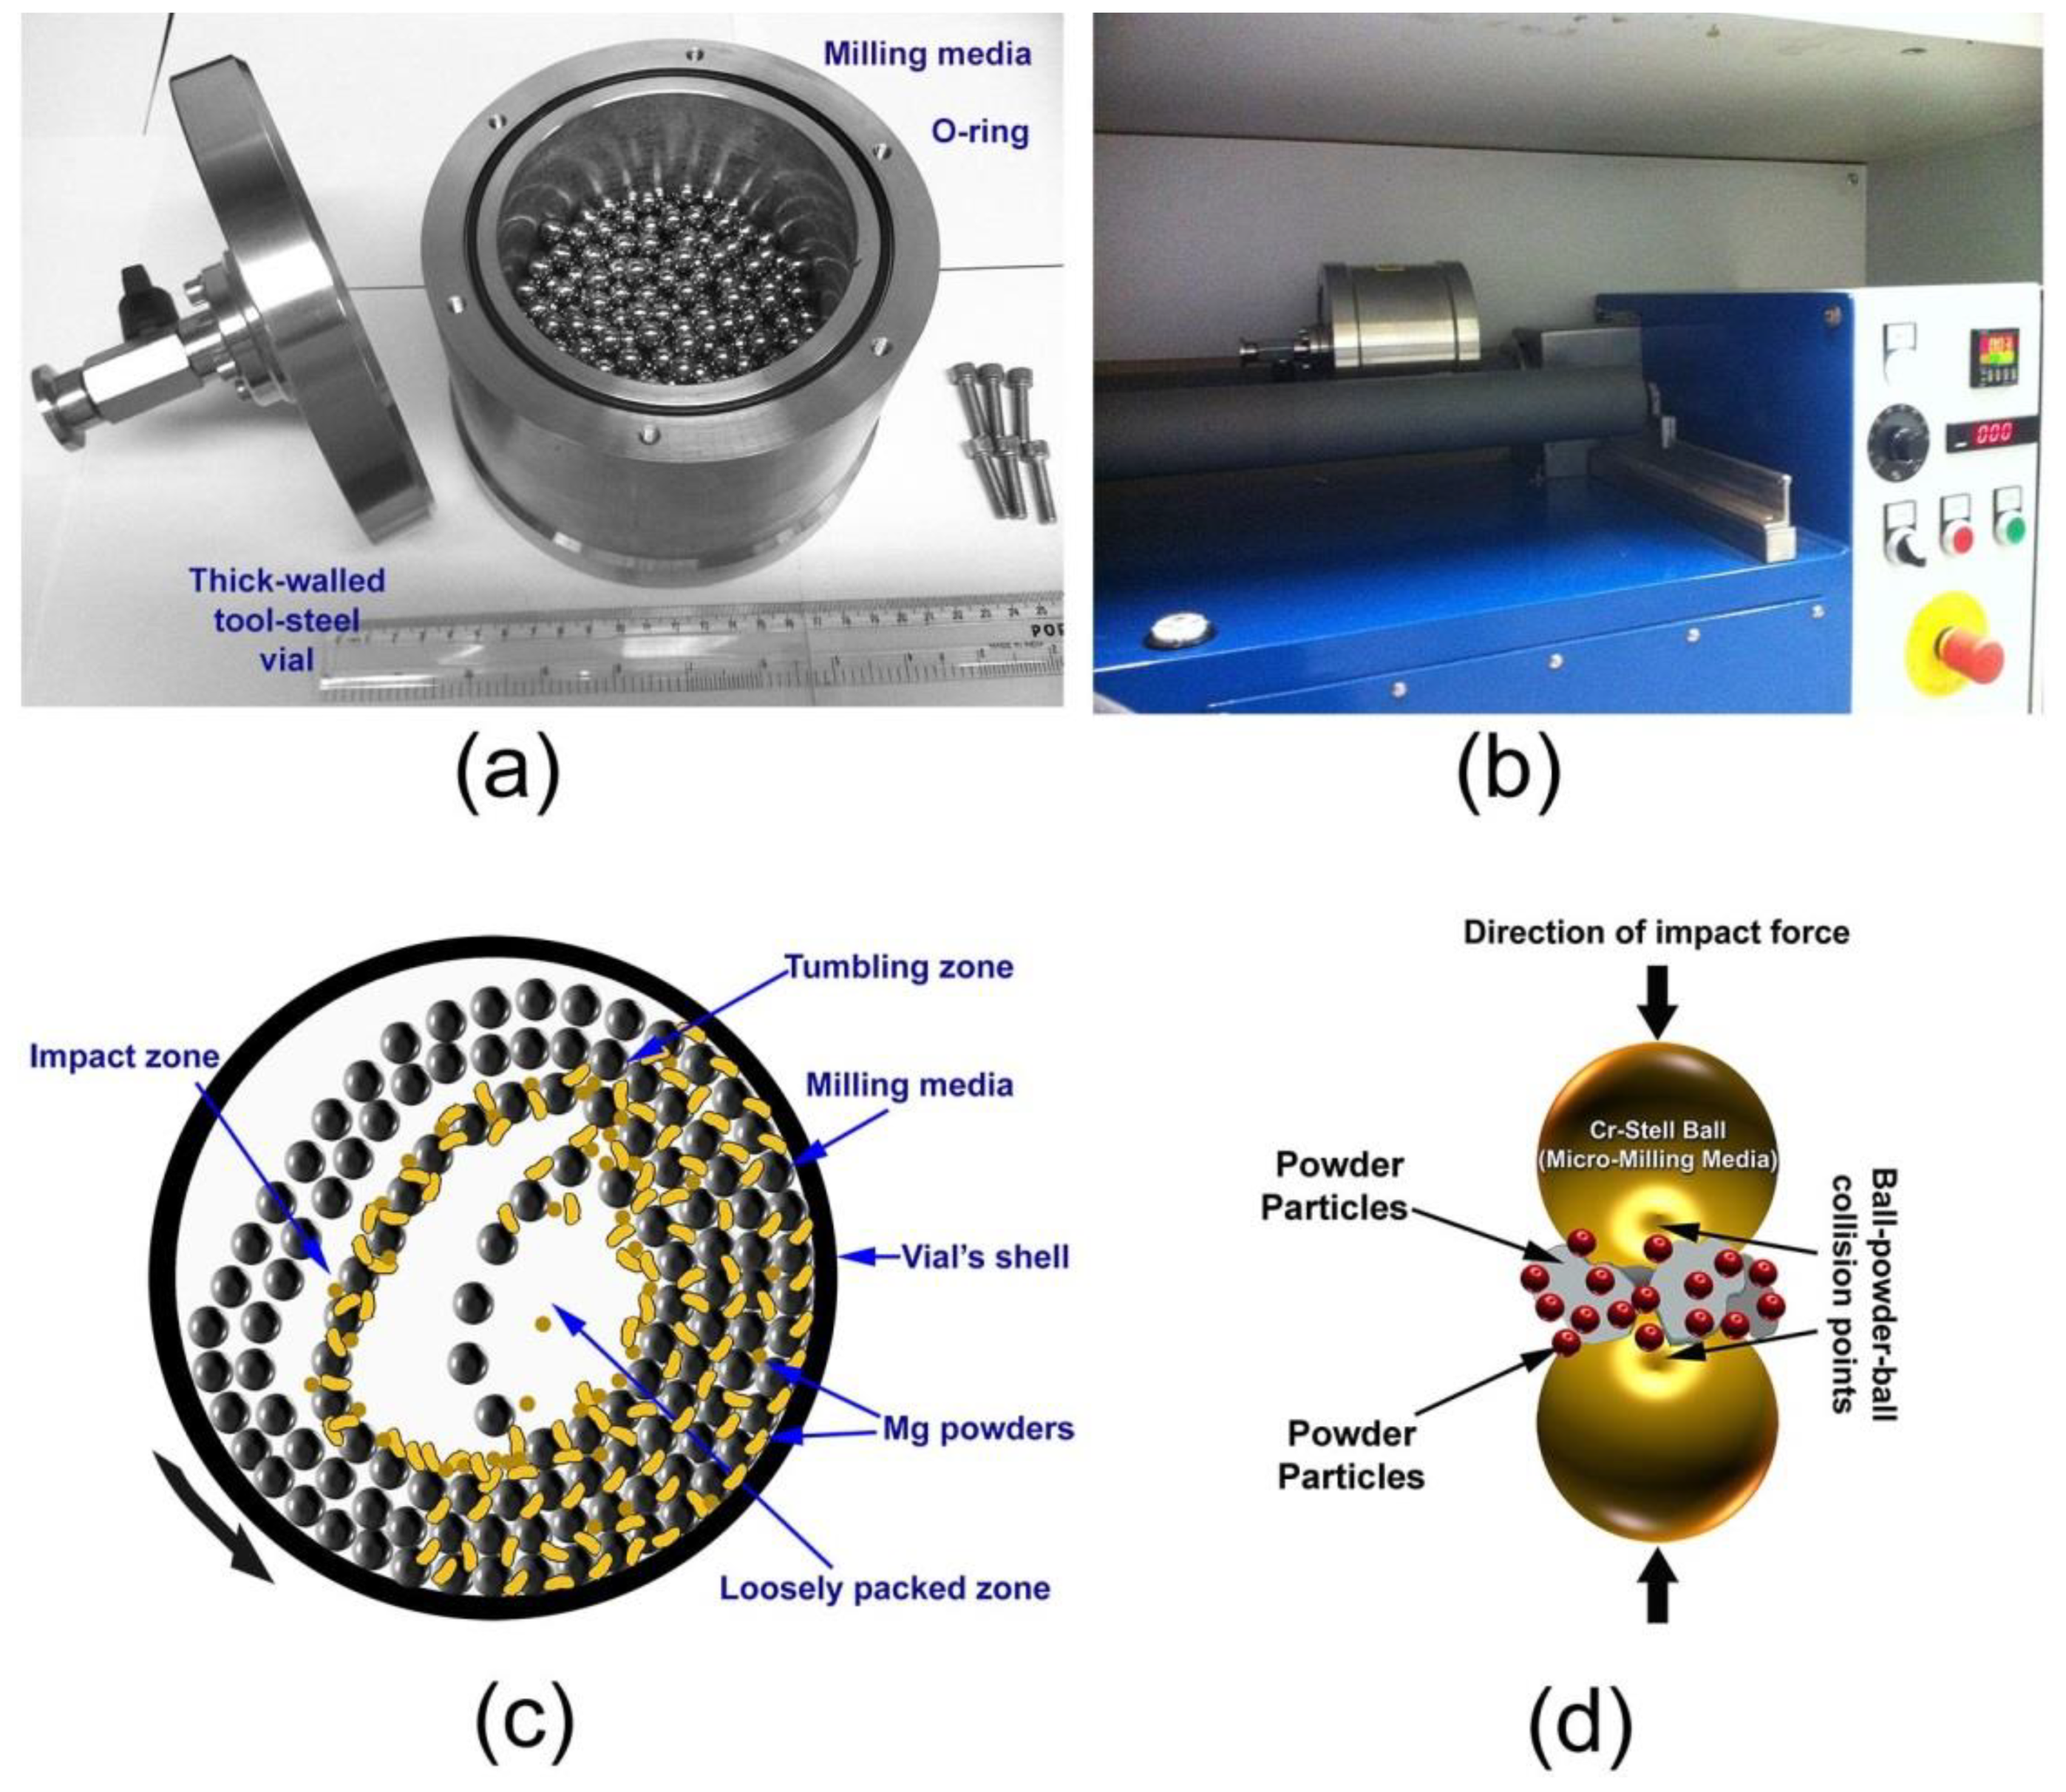
- Tumbler Ball Mill
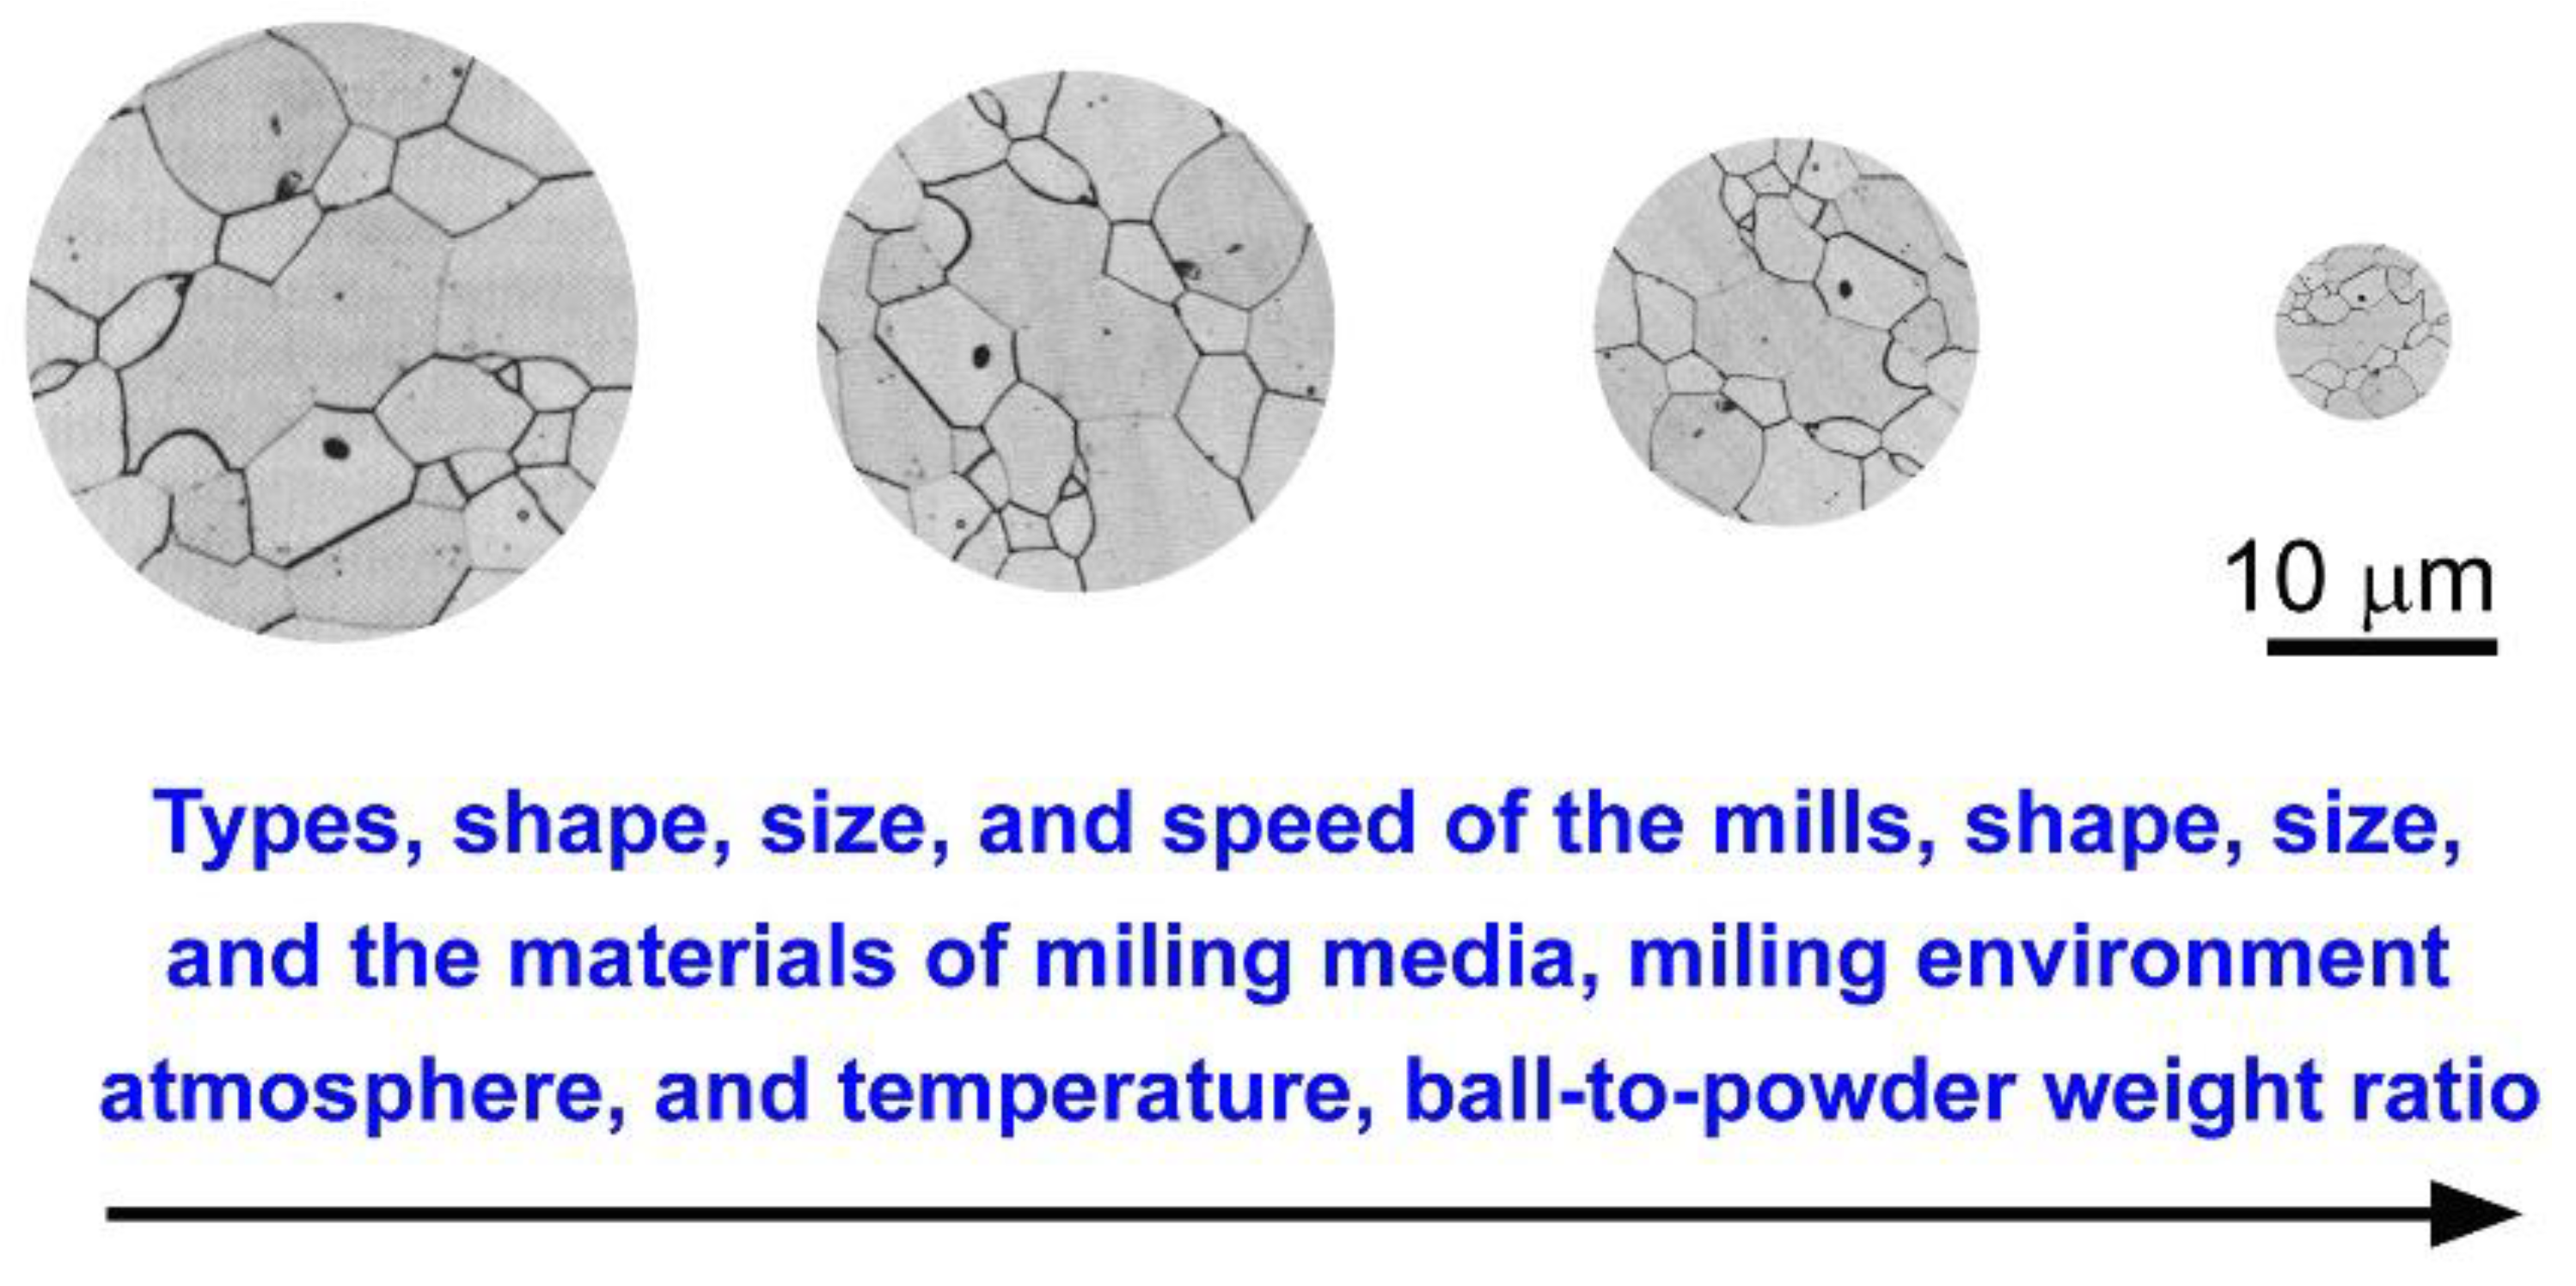
2.3.3. Factors Affecting the Milling Process
- Type of mills (low energy, high energy mills),
- Size of the milling vial,
- The materials of the milling tools (e.g., WC, steel alloys, ceramics)
- Shapes of milling media (balls or rods)
- Ball-to-powder weight ratio,
- Milling speed,
- Milling time,
- Milling atmosphere (inert gas or reactive gas such as hydrogen),
- Milling environment (dry or wet milling),
- Milling temperature,
- Impurities introduced to the powders upon using organic lubricant agents.
3. Nanocrystalline and Nanopowders Prepared by Ball Milling Technique at KISR
3.1. Background
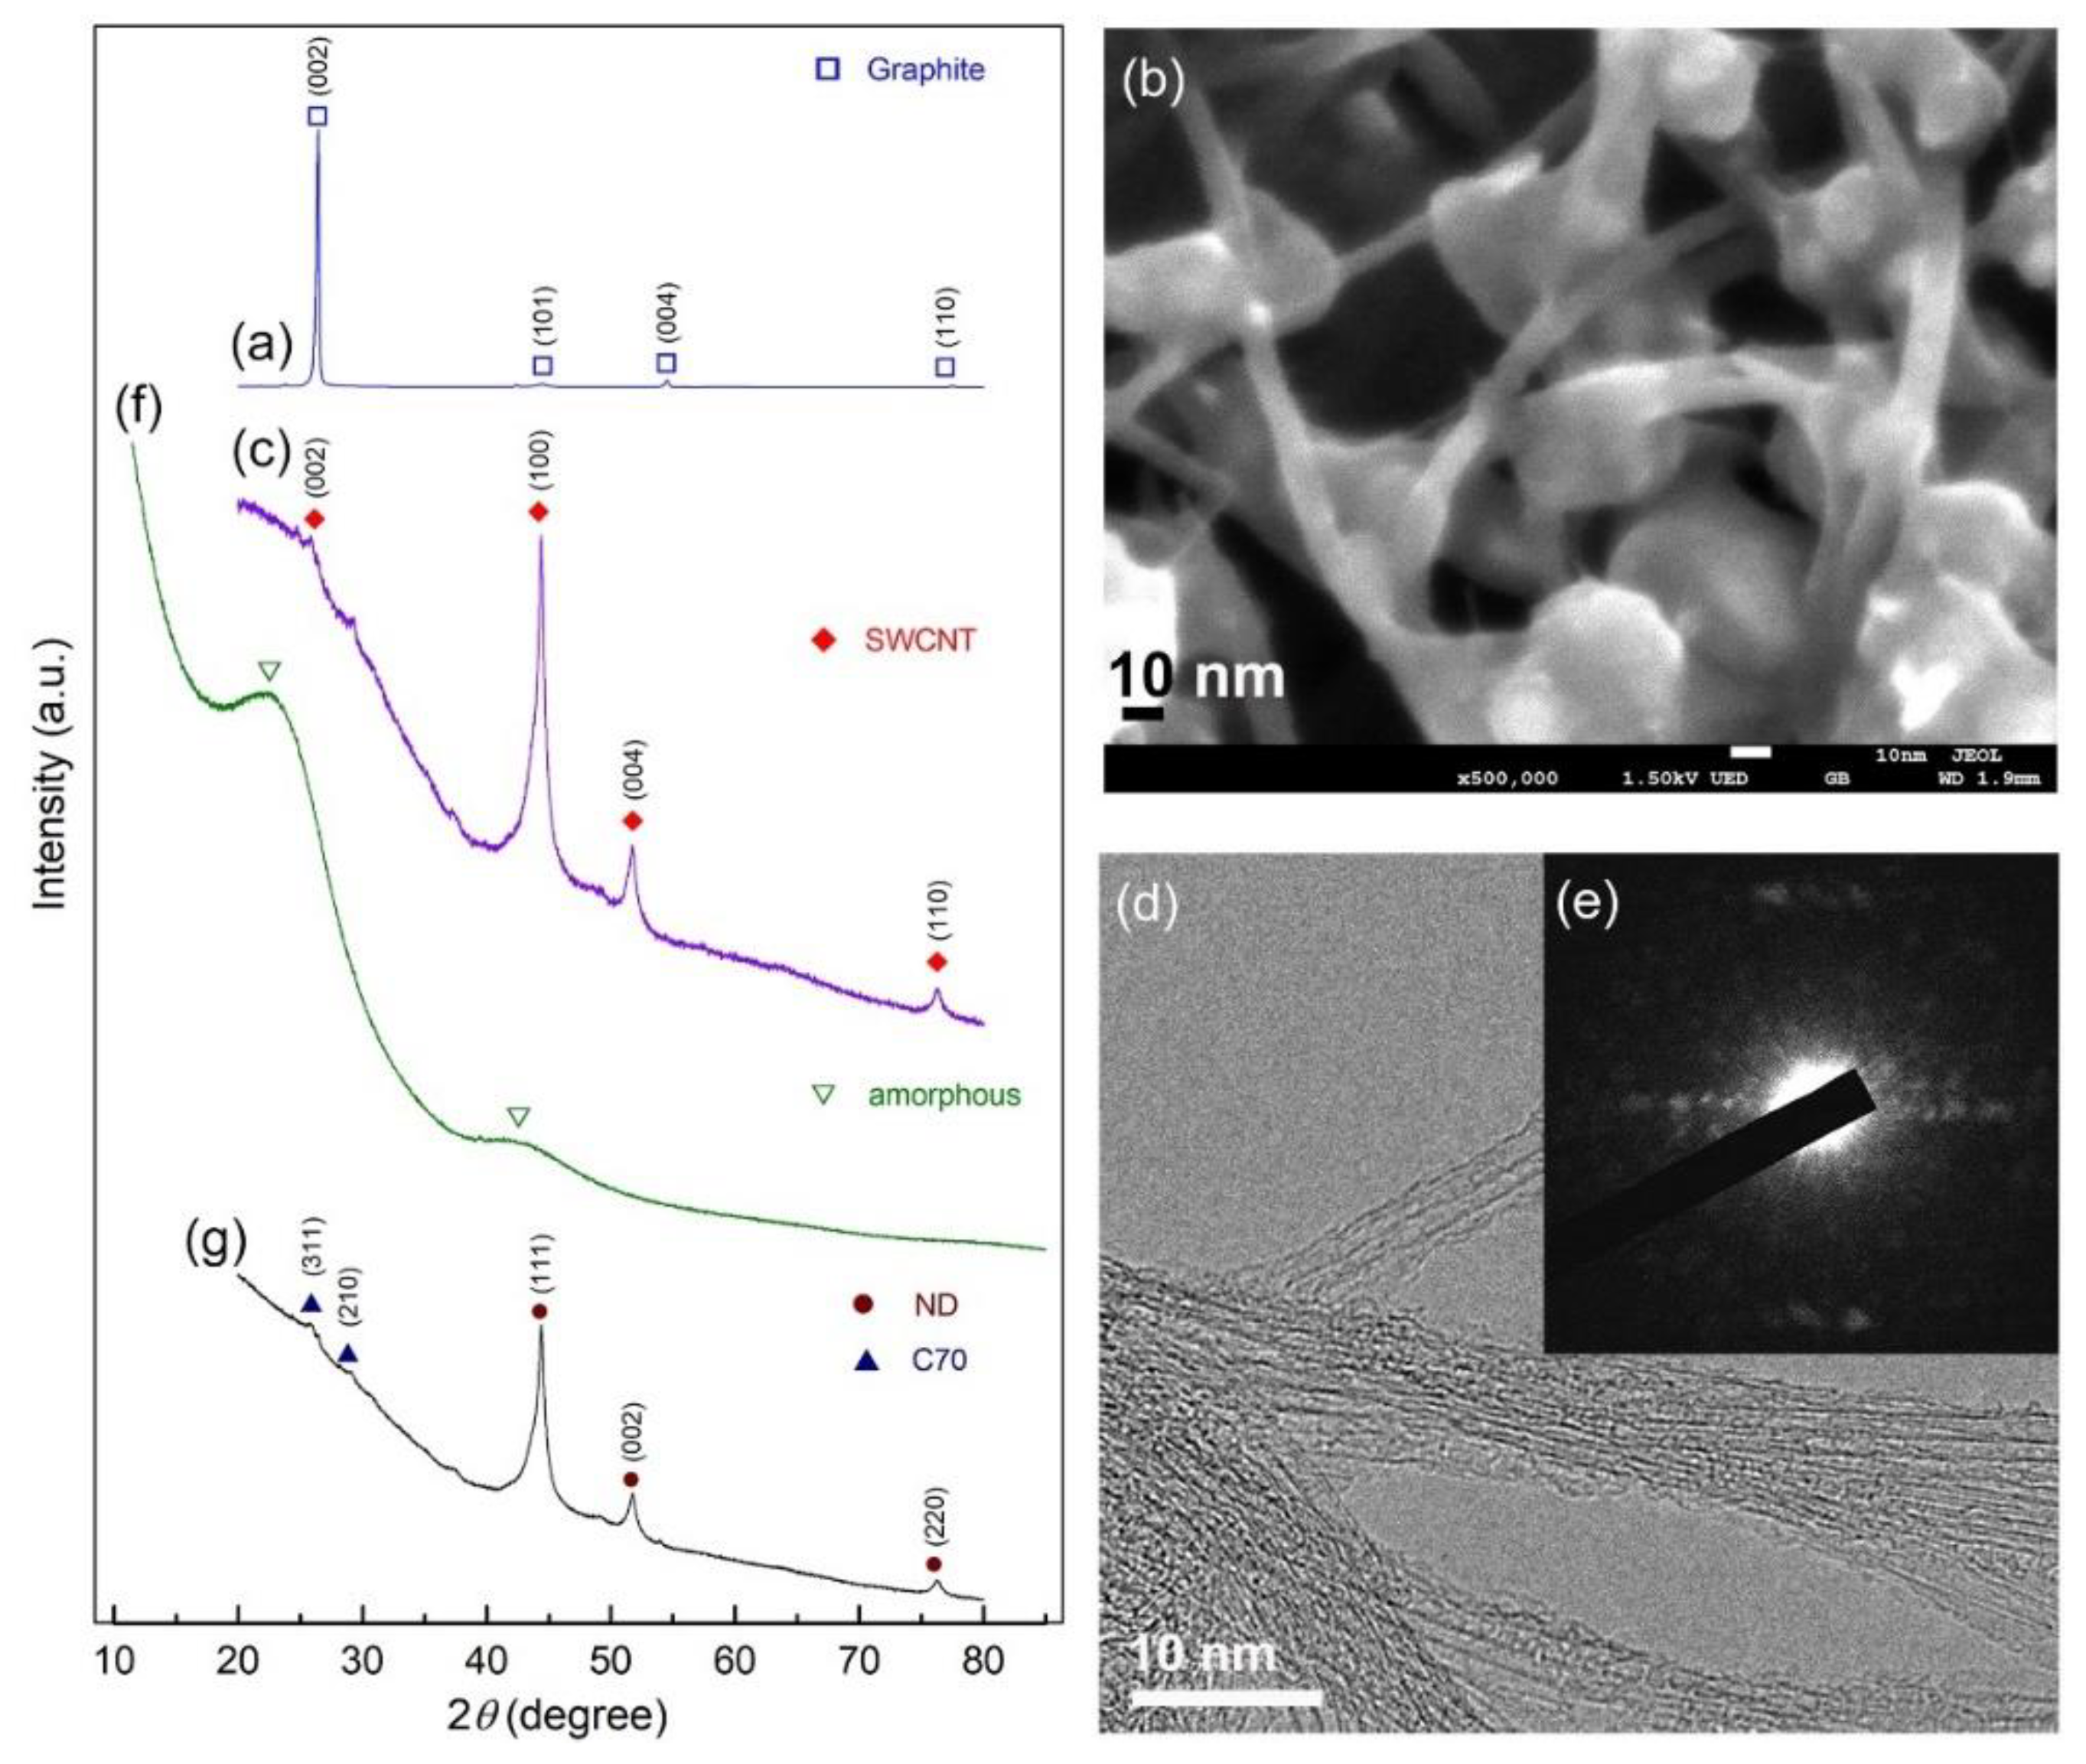
3.2. Nanodiamonds
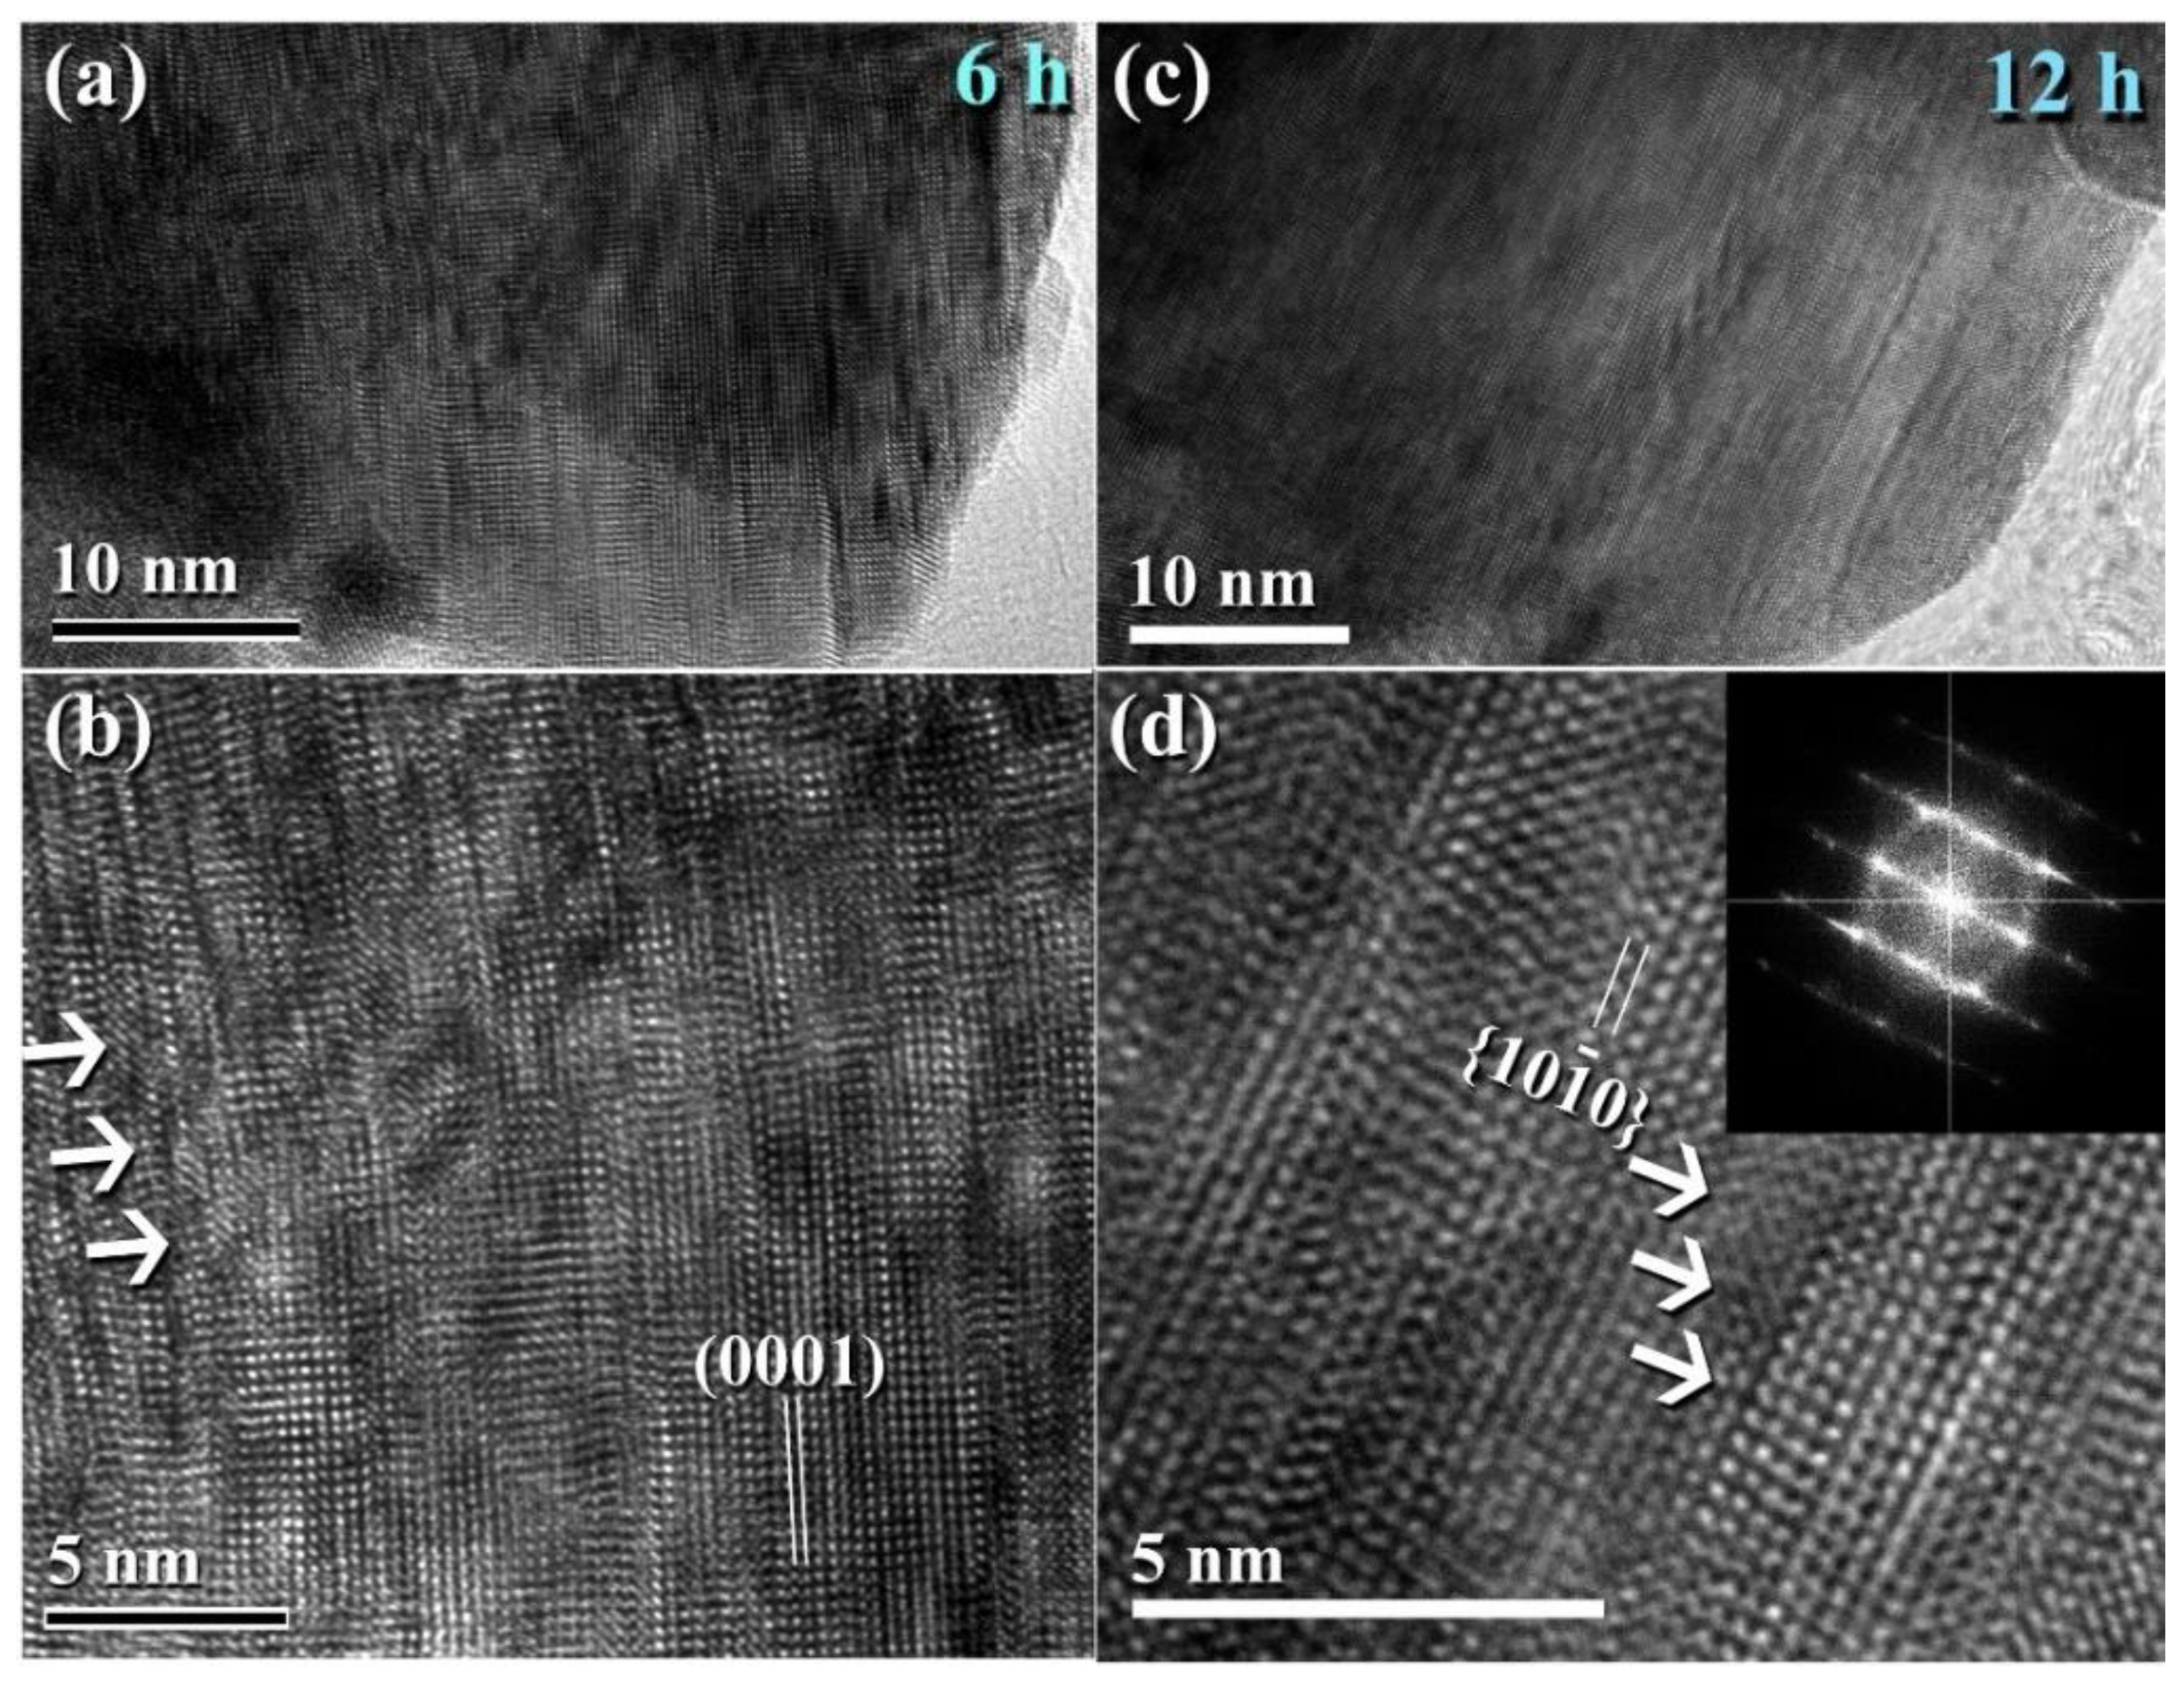
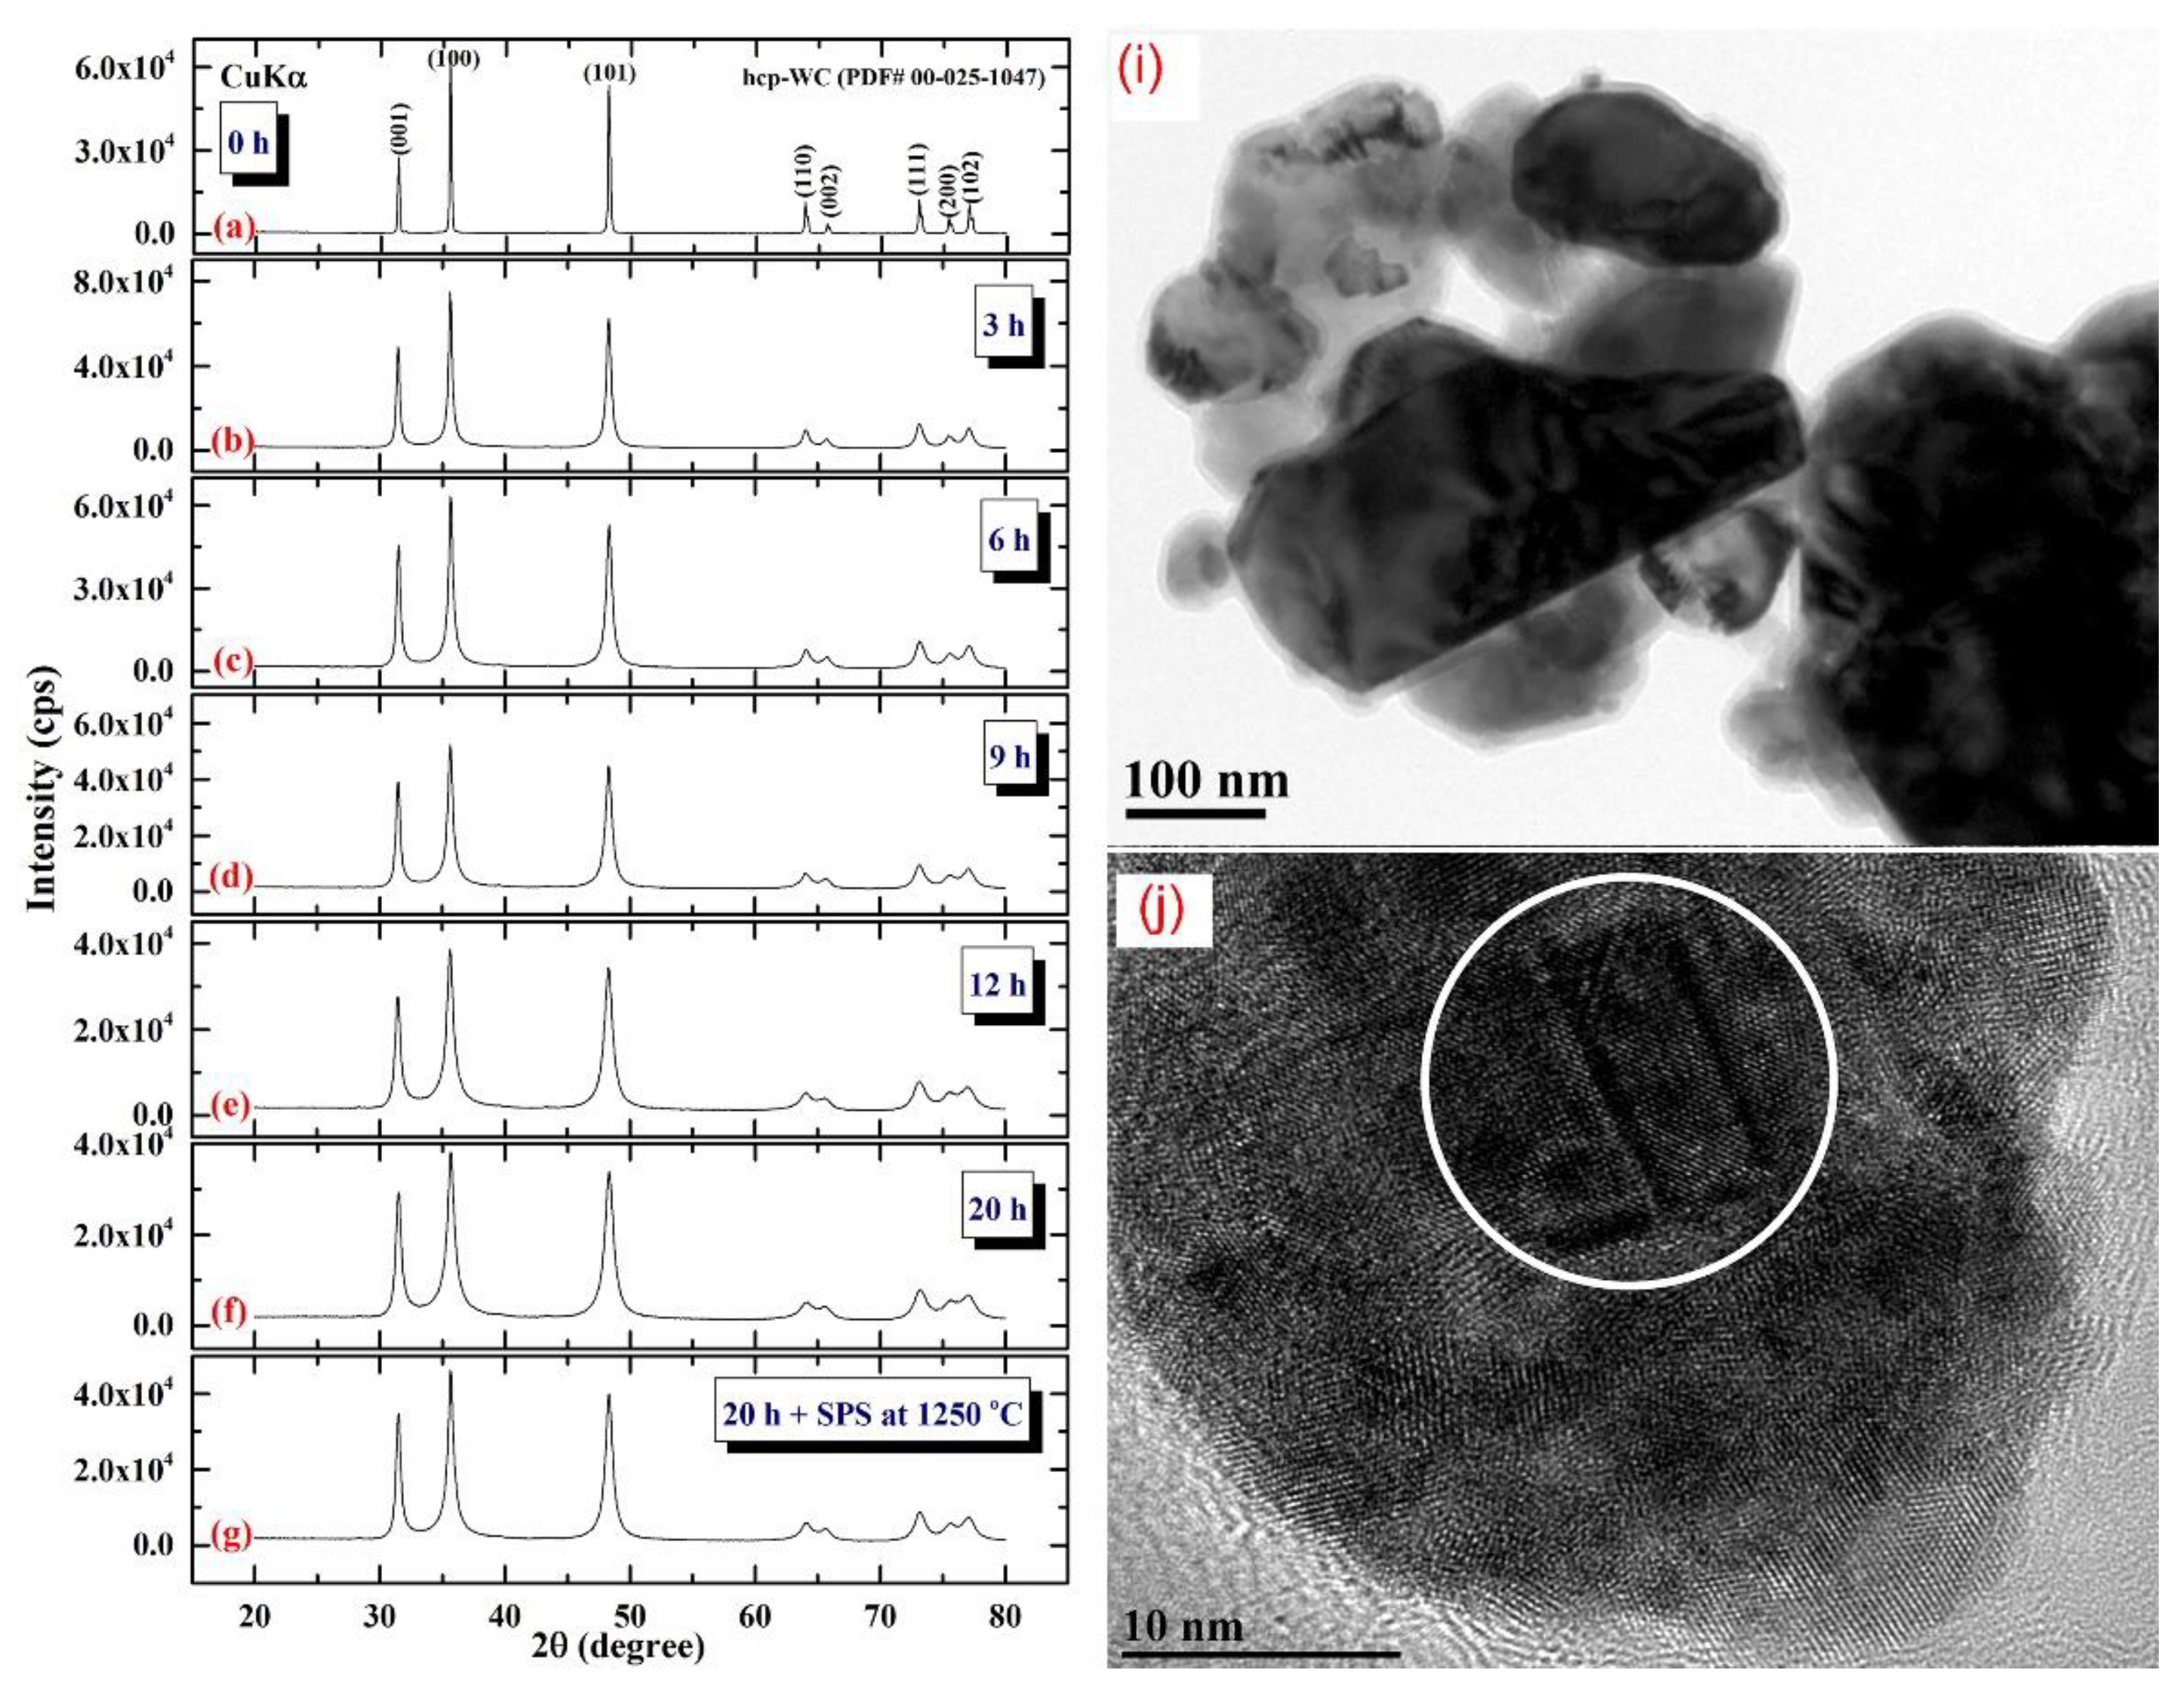
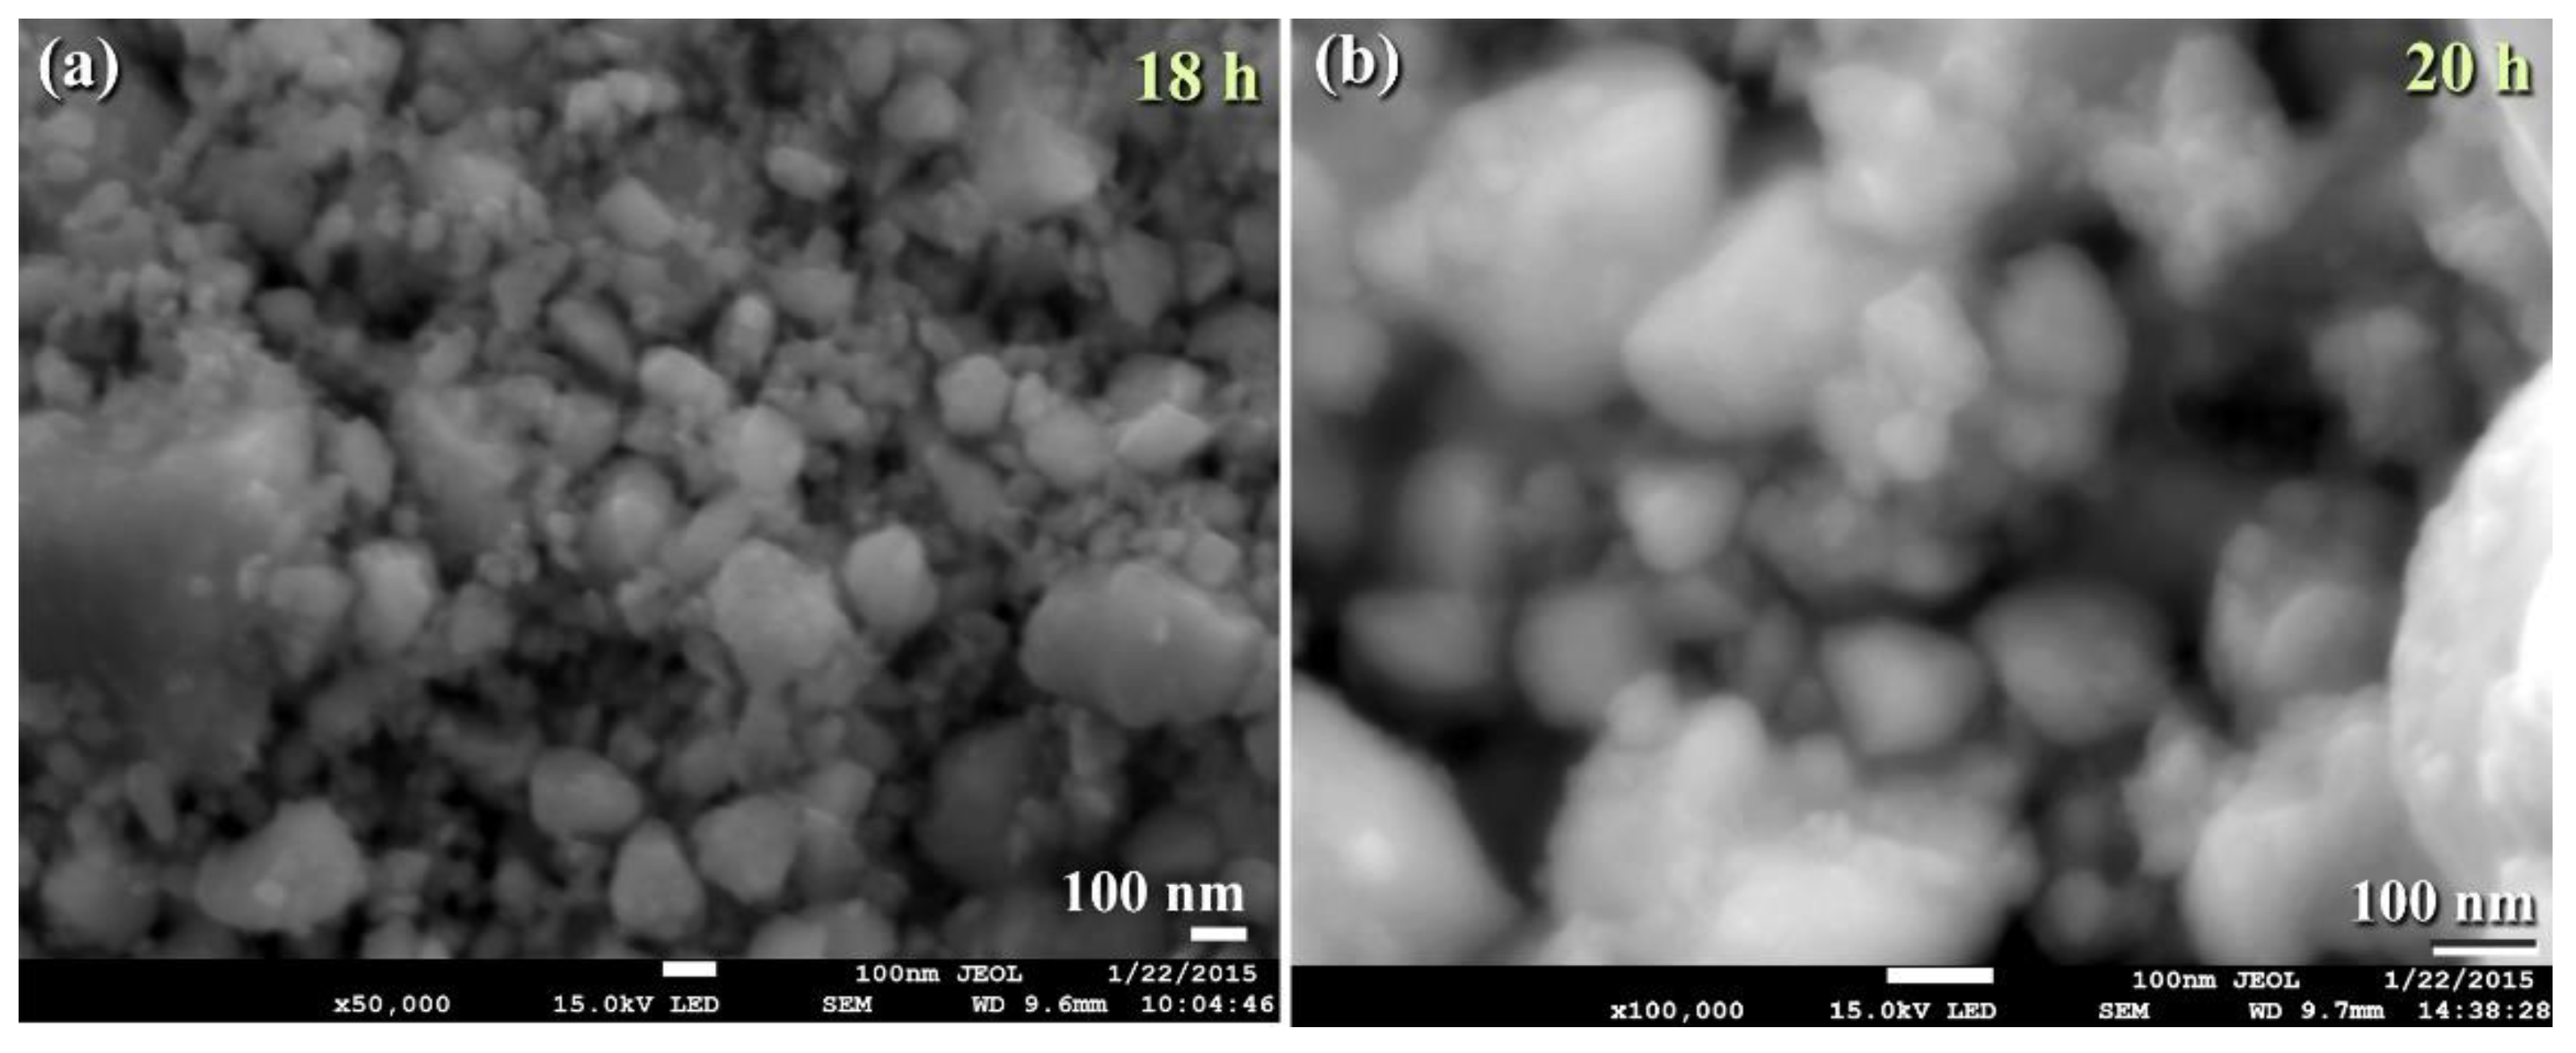
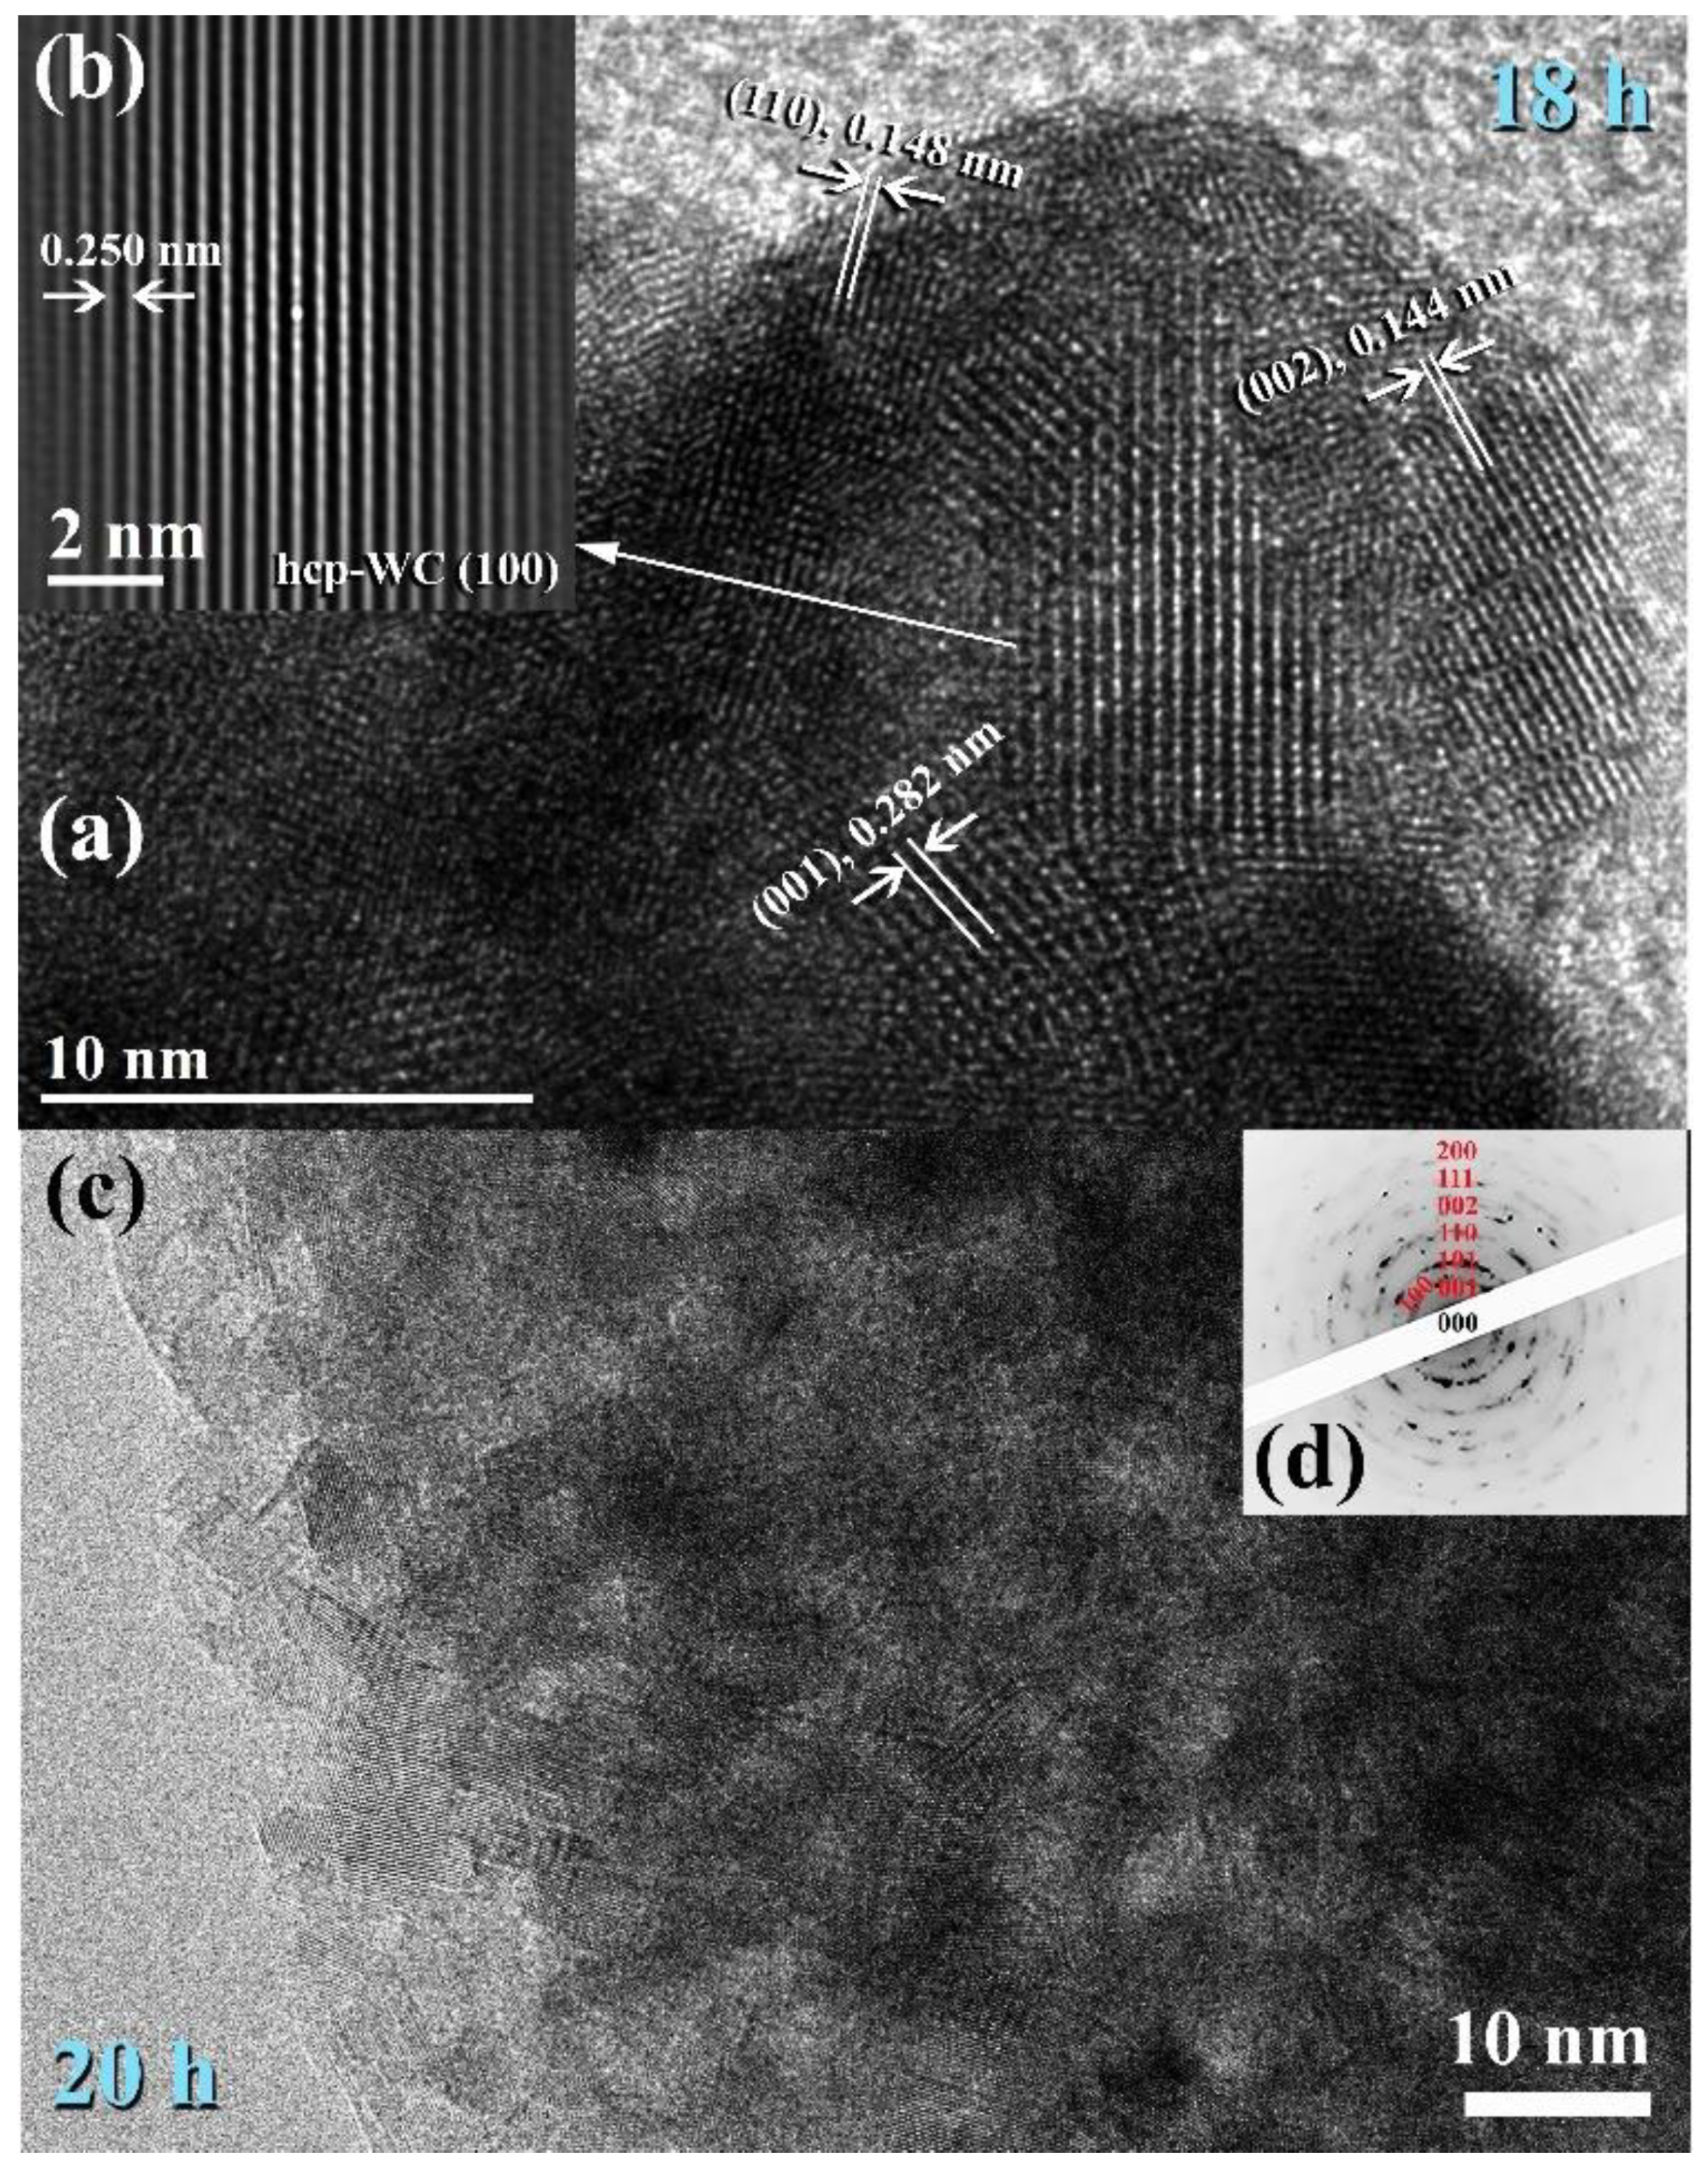
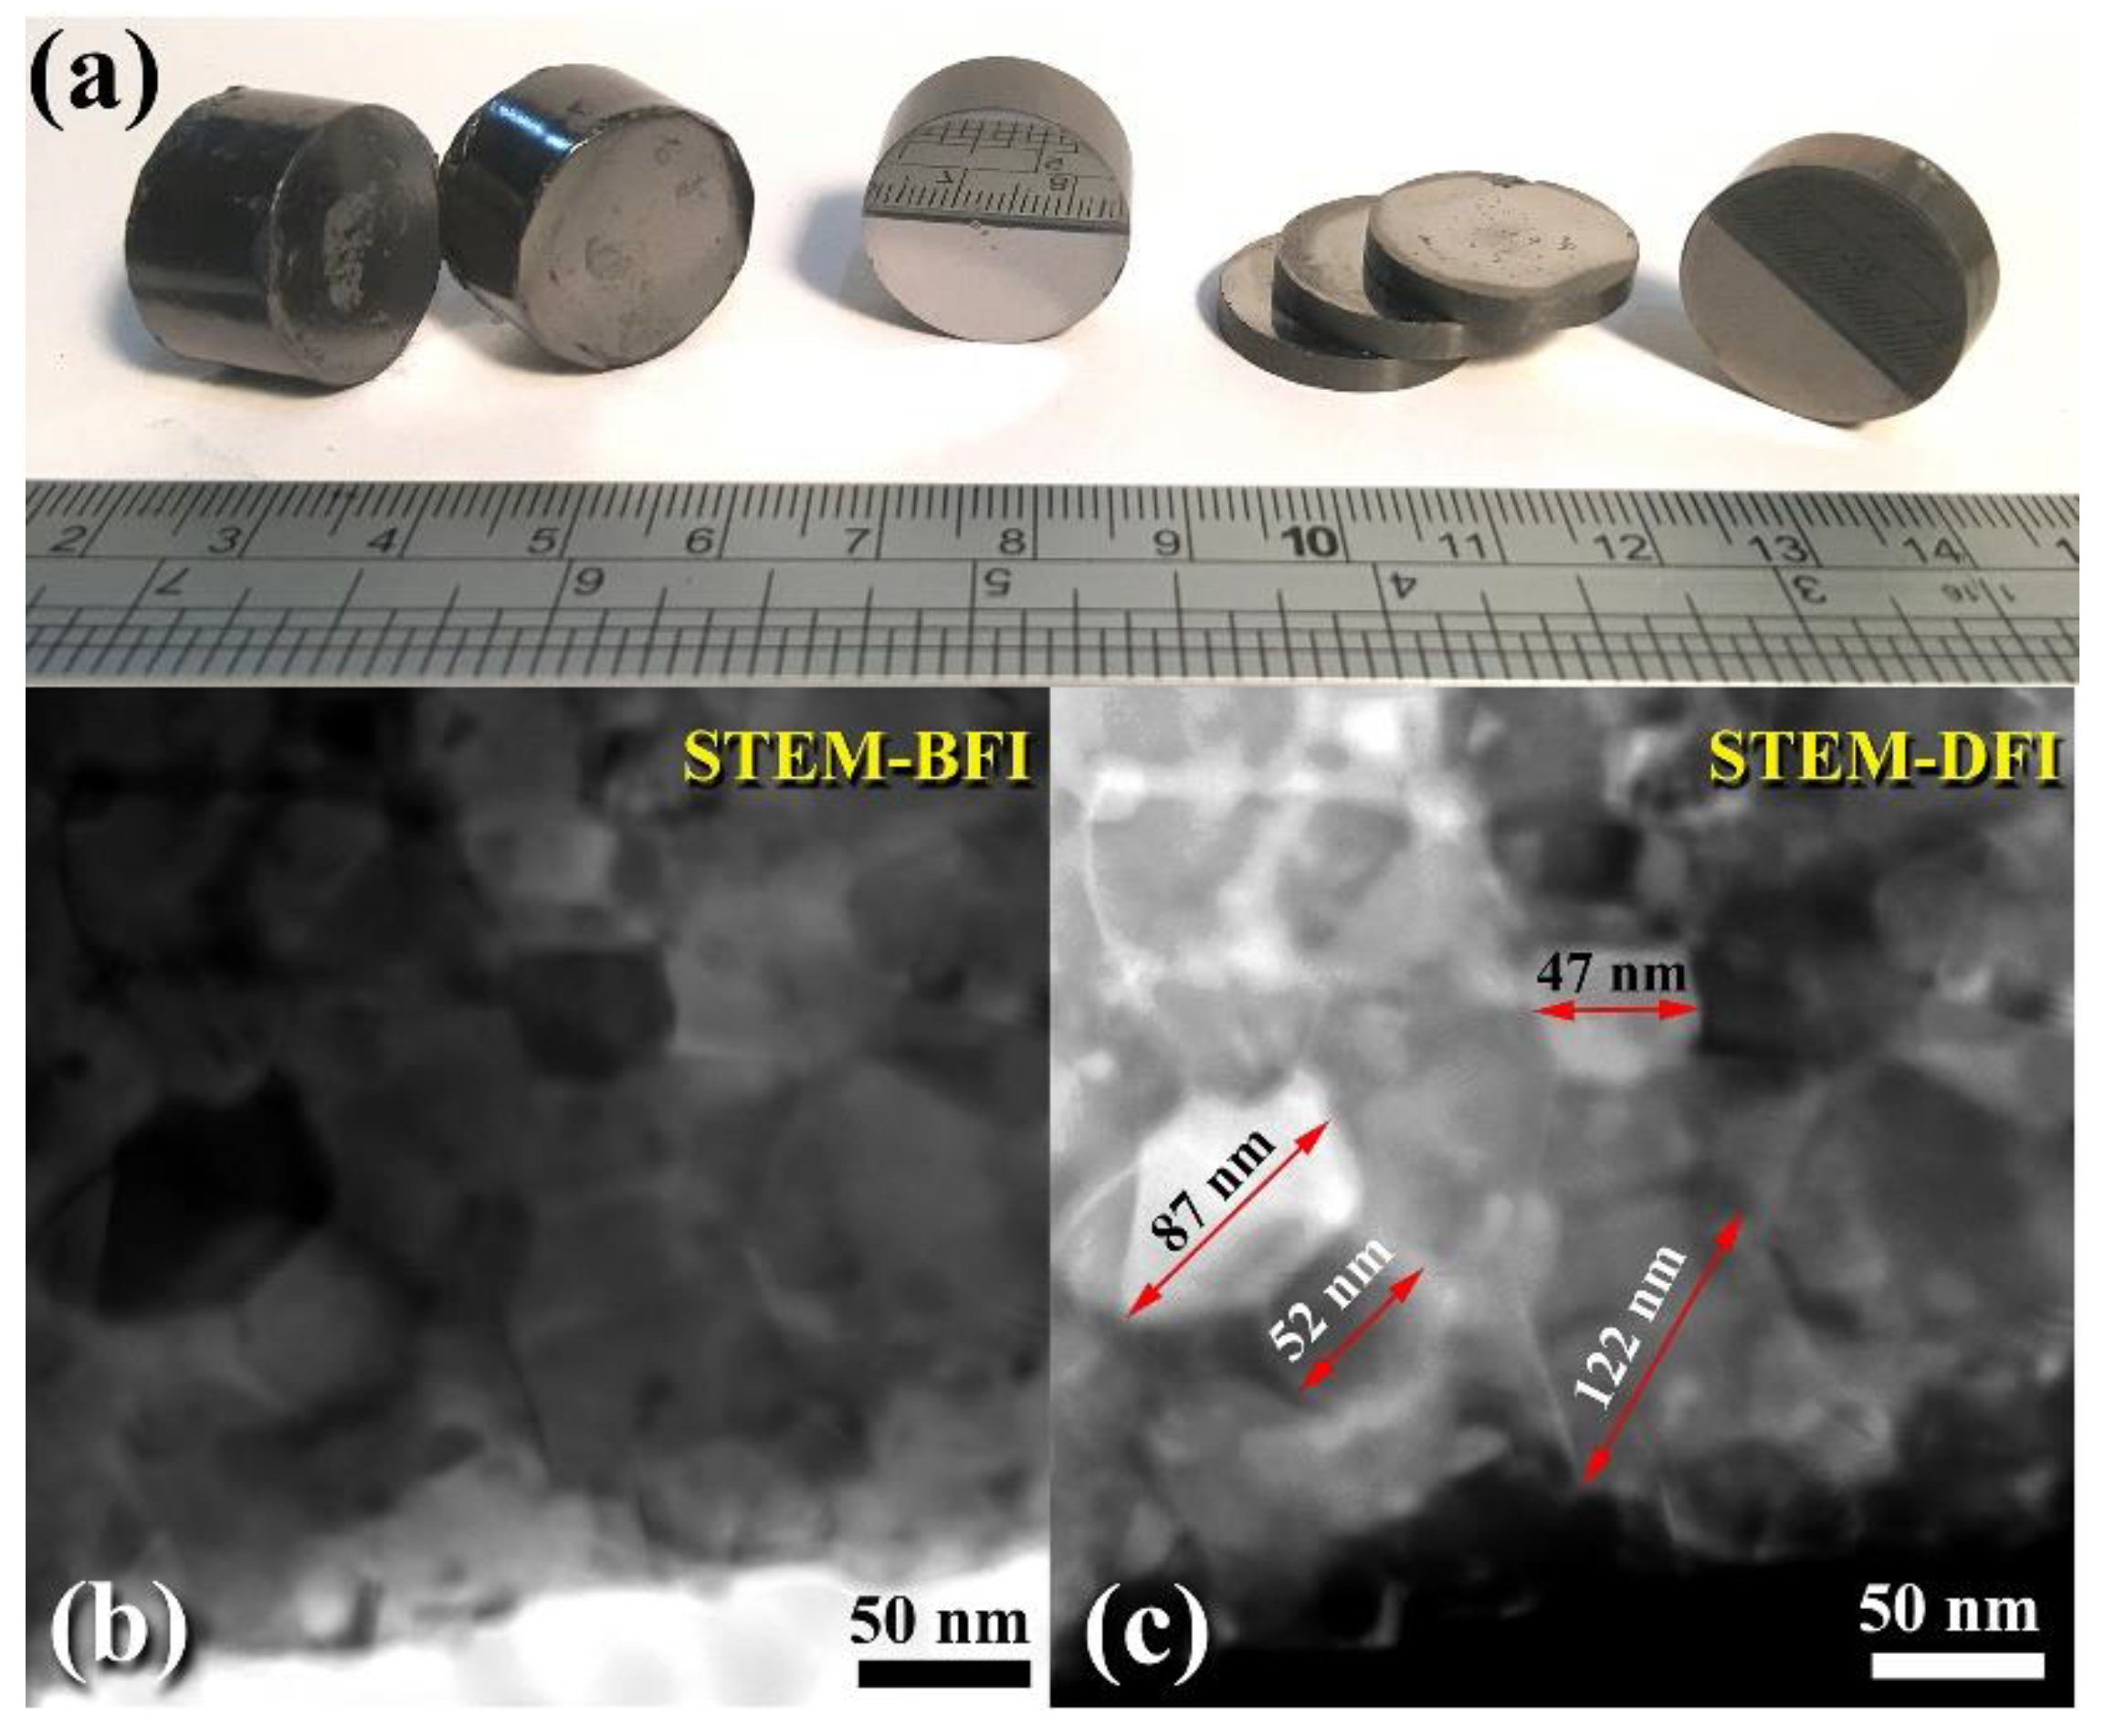
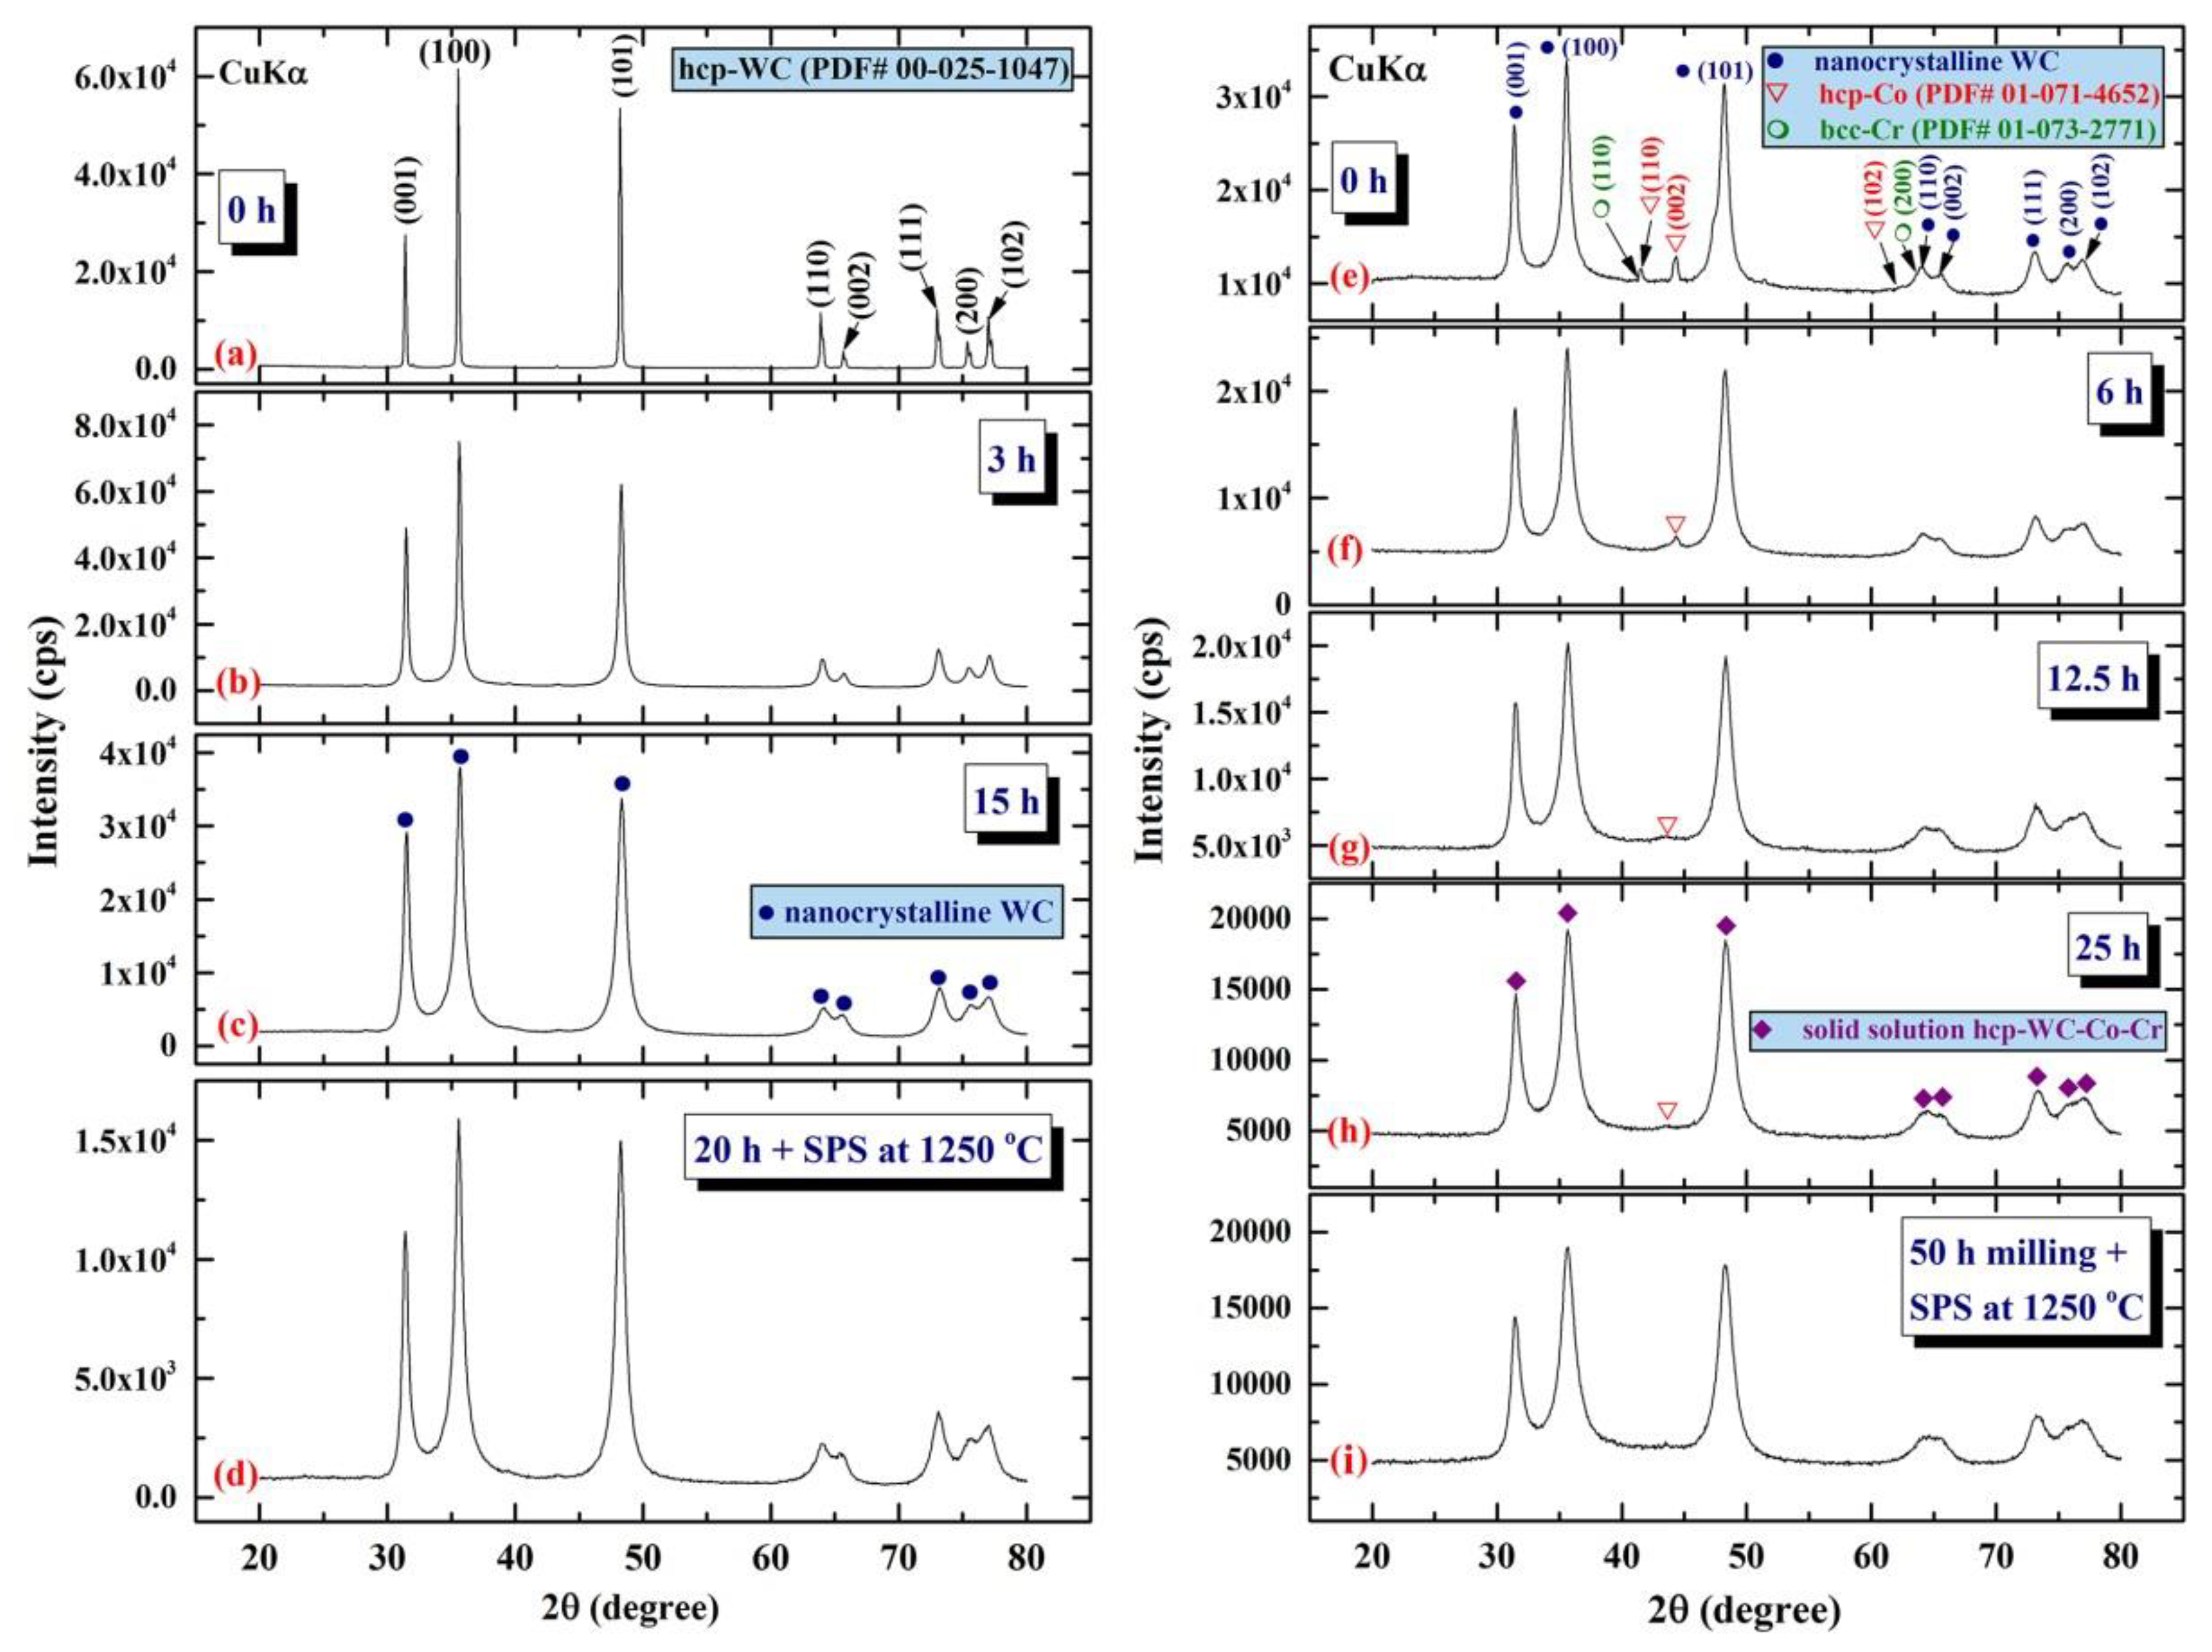
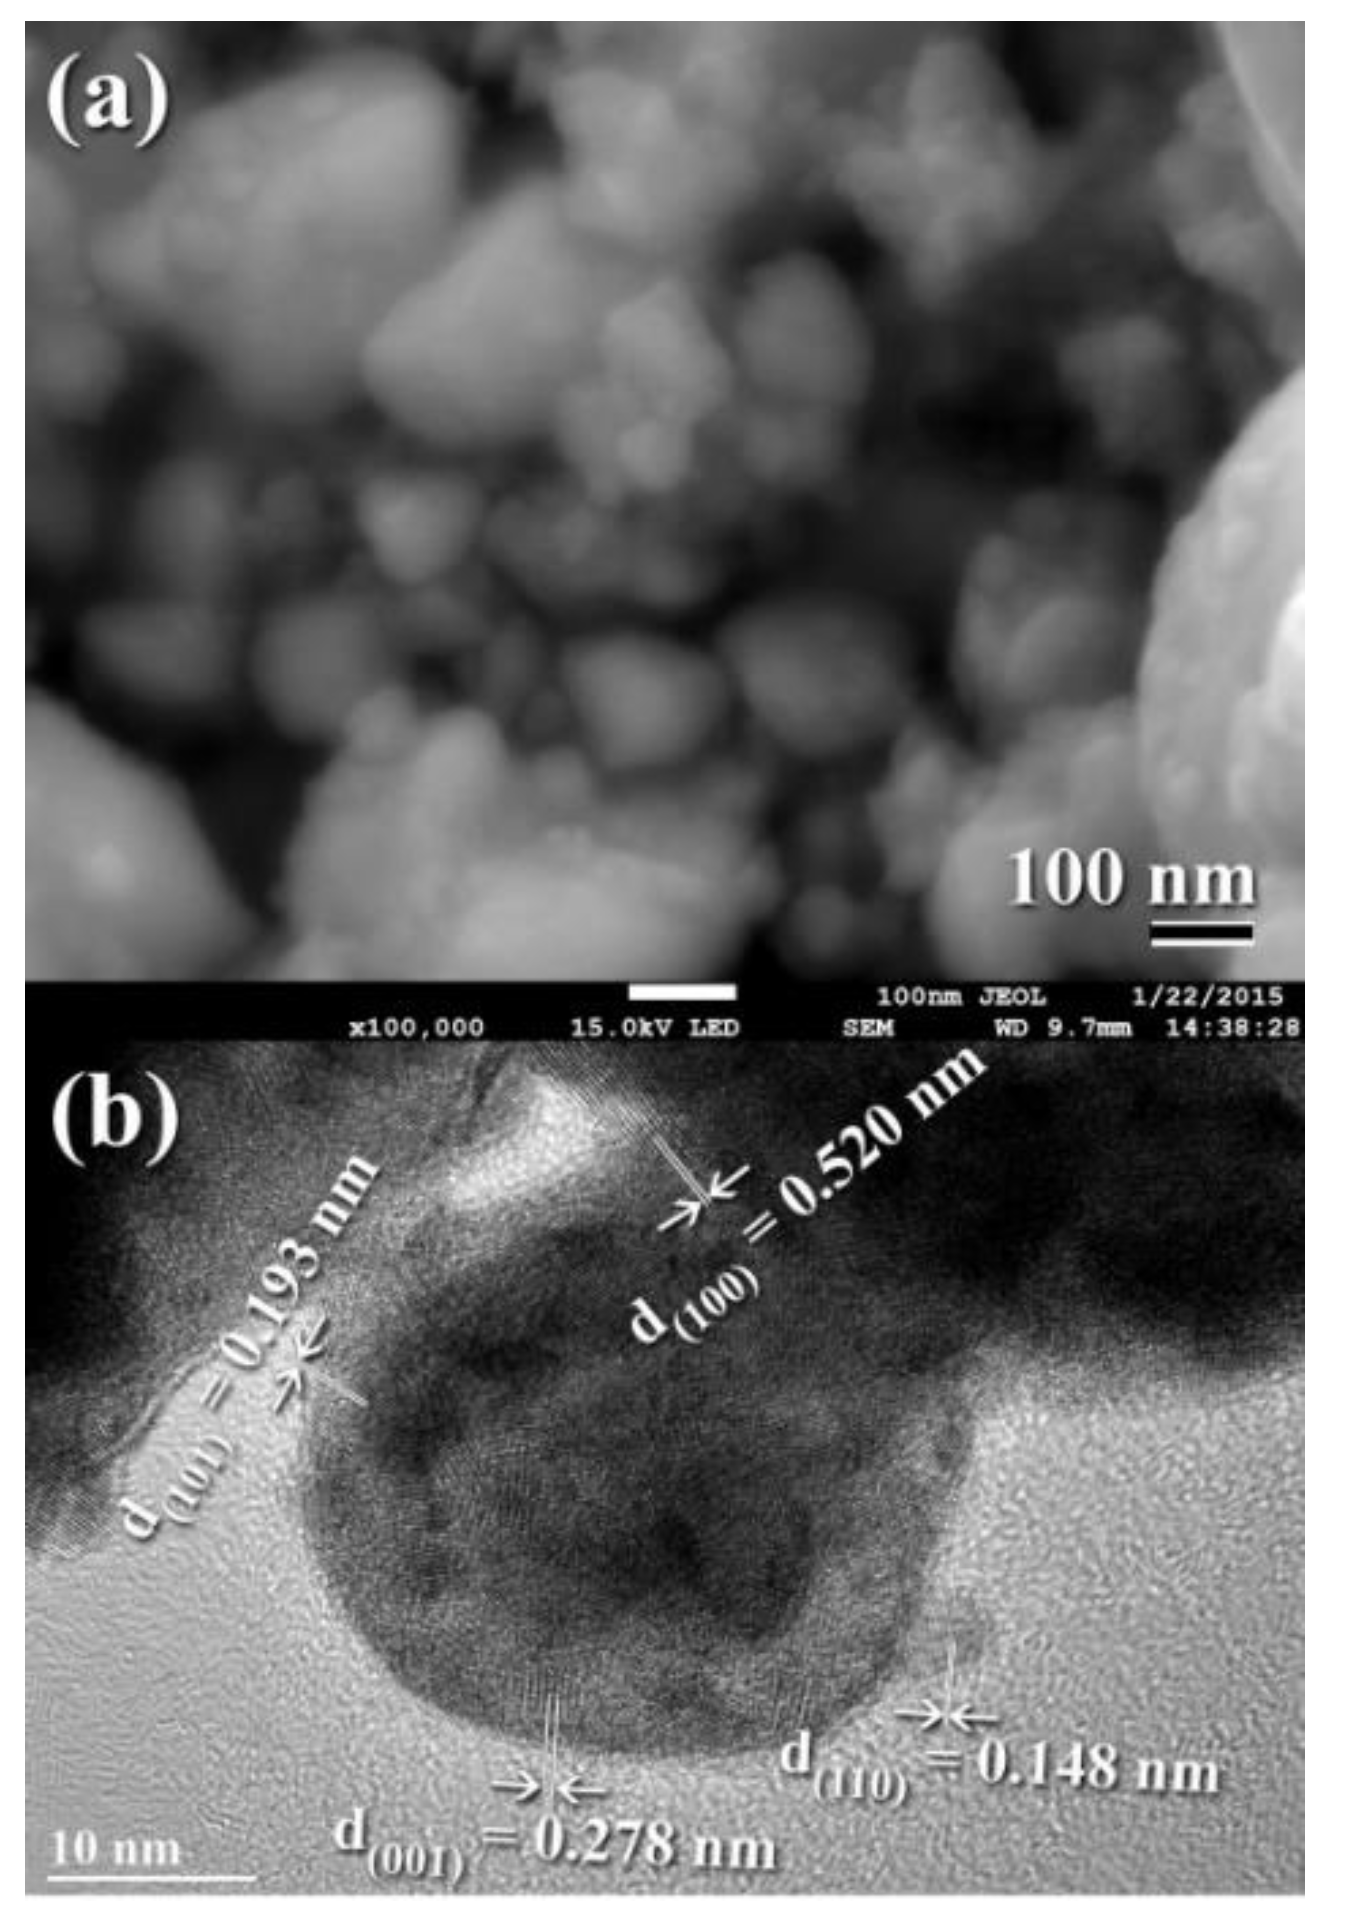
3.3. Tungsten Carbide
Consolidation of WC with Spark Plasma Sintering
4. Nanocomposites
4.1. Approaches Used for Fabrication of Metal Matrix Composites (MMCs)
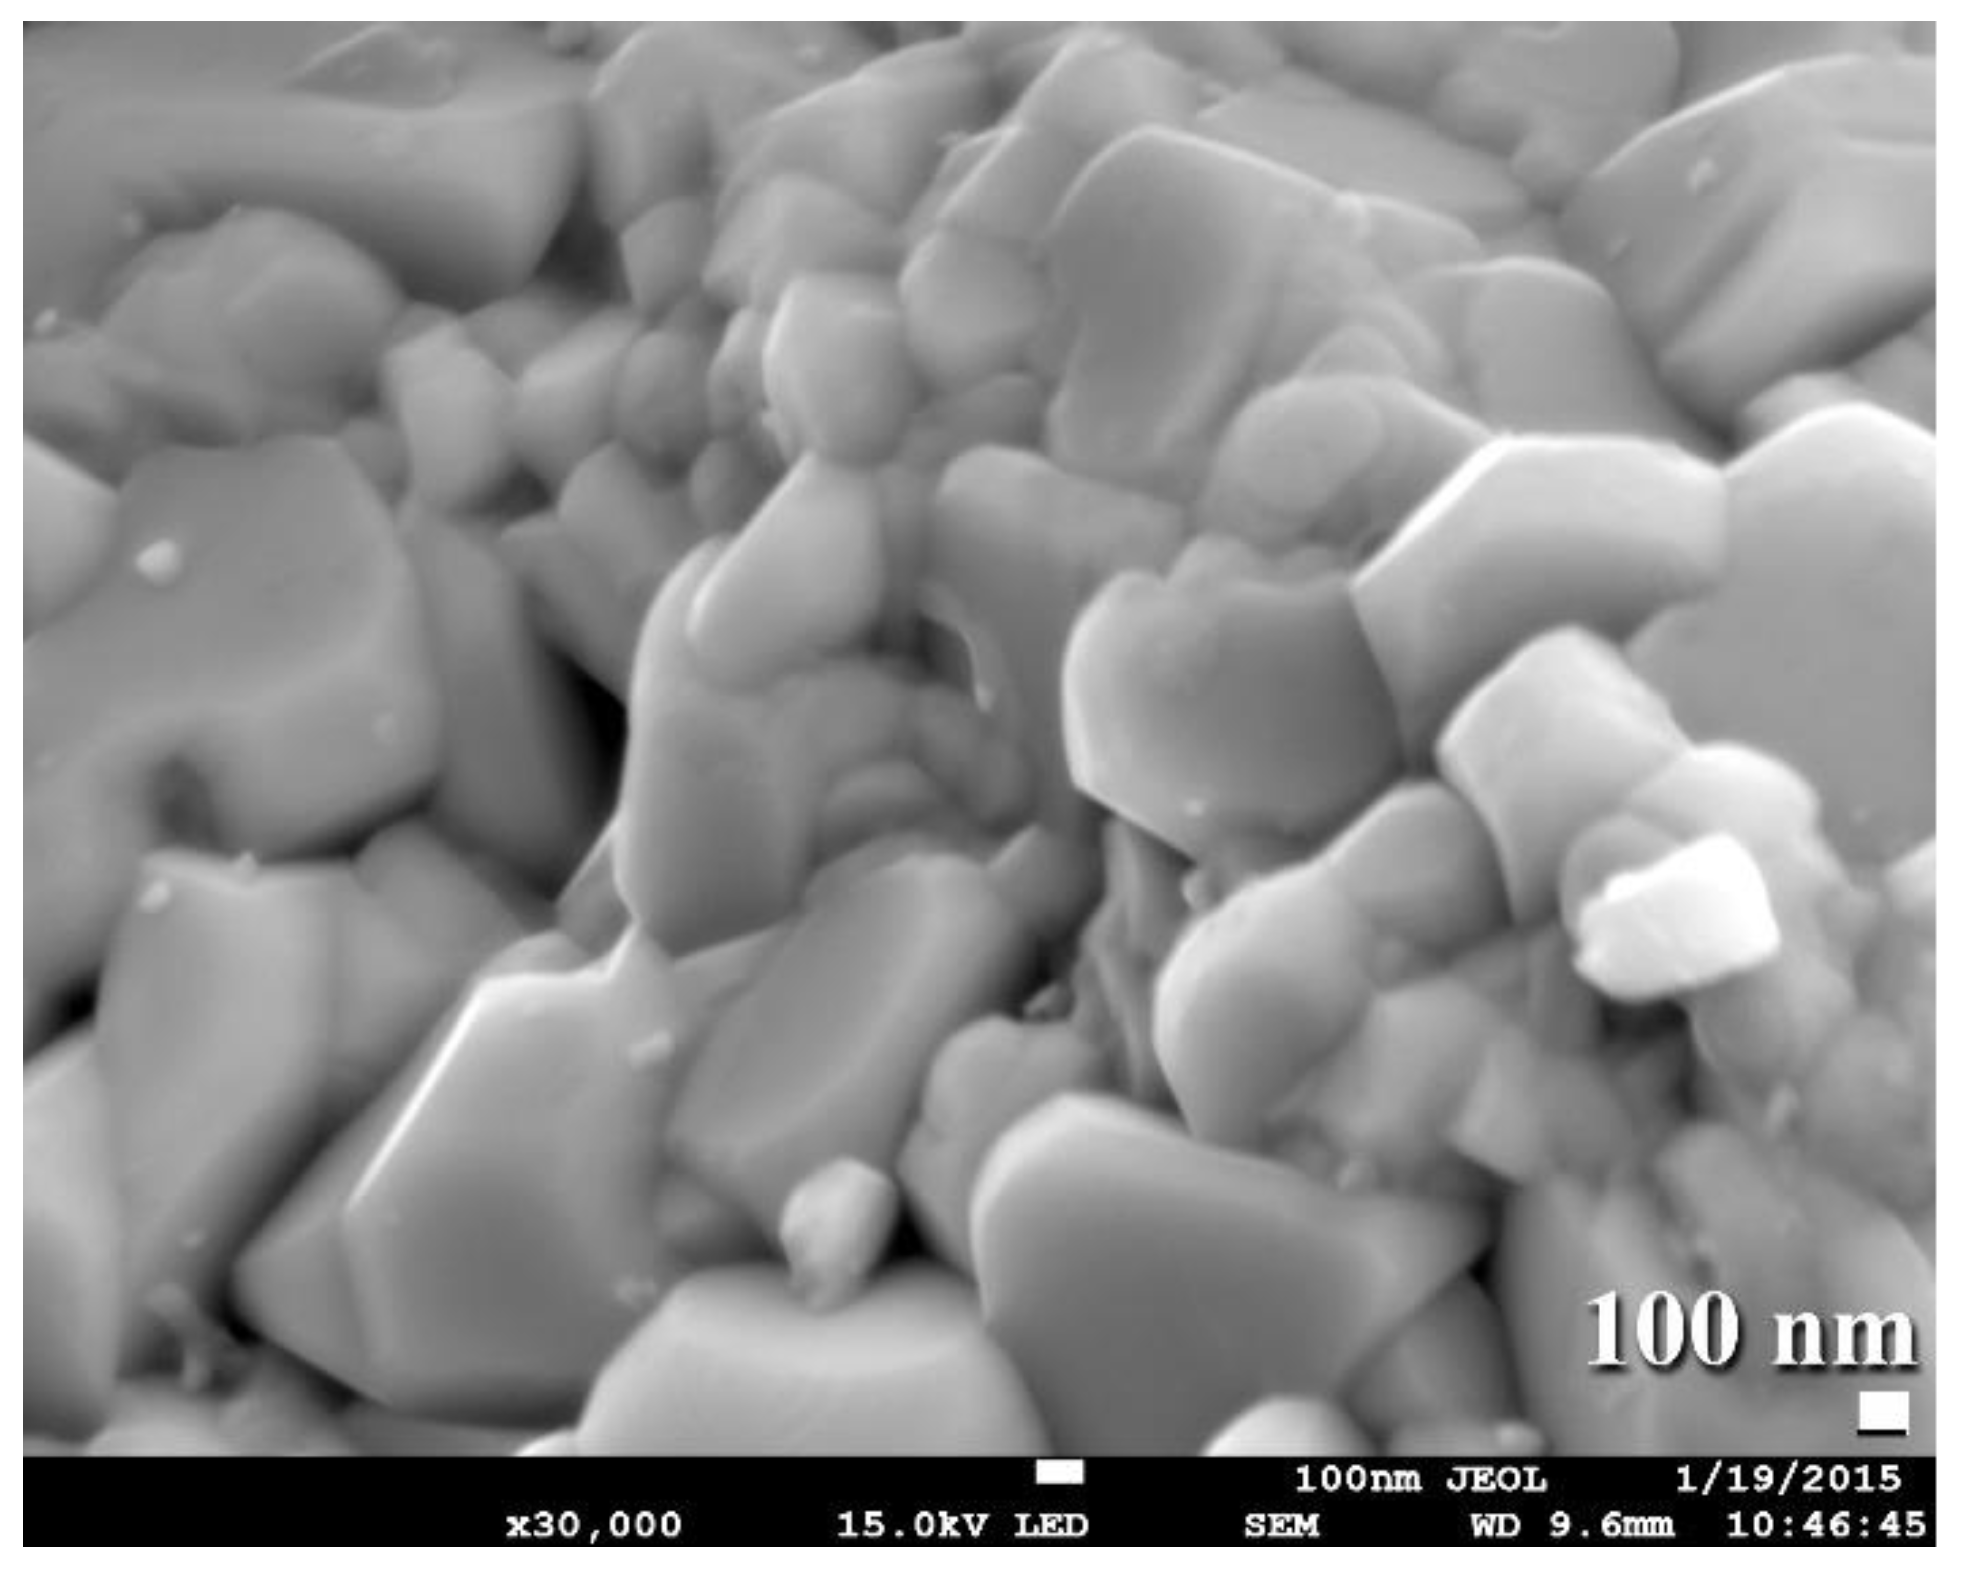
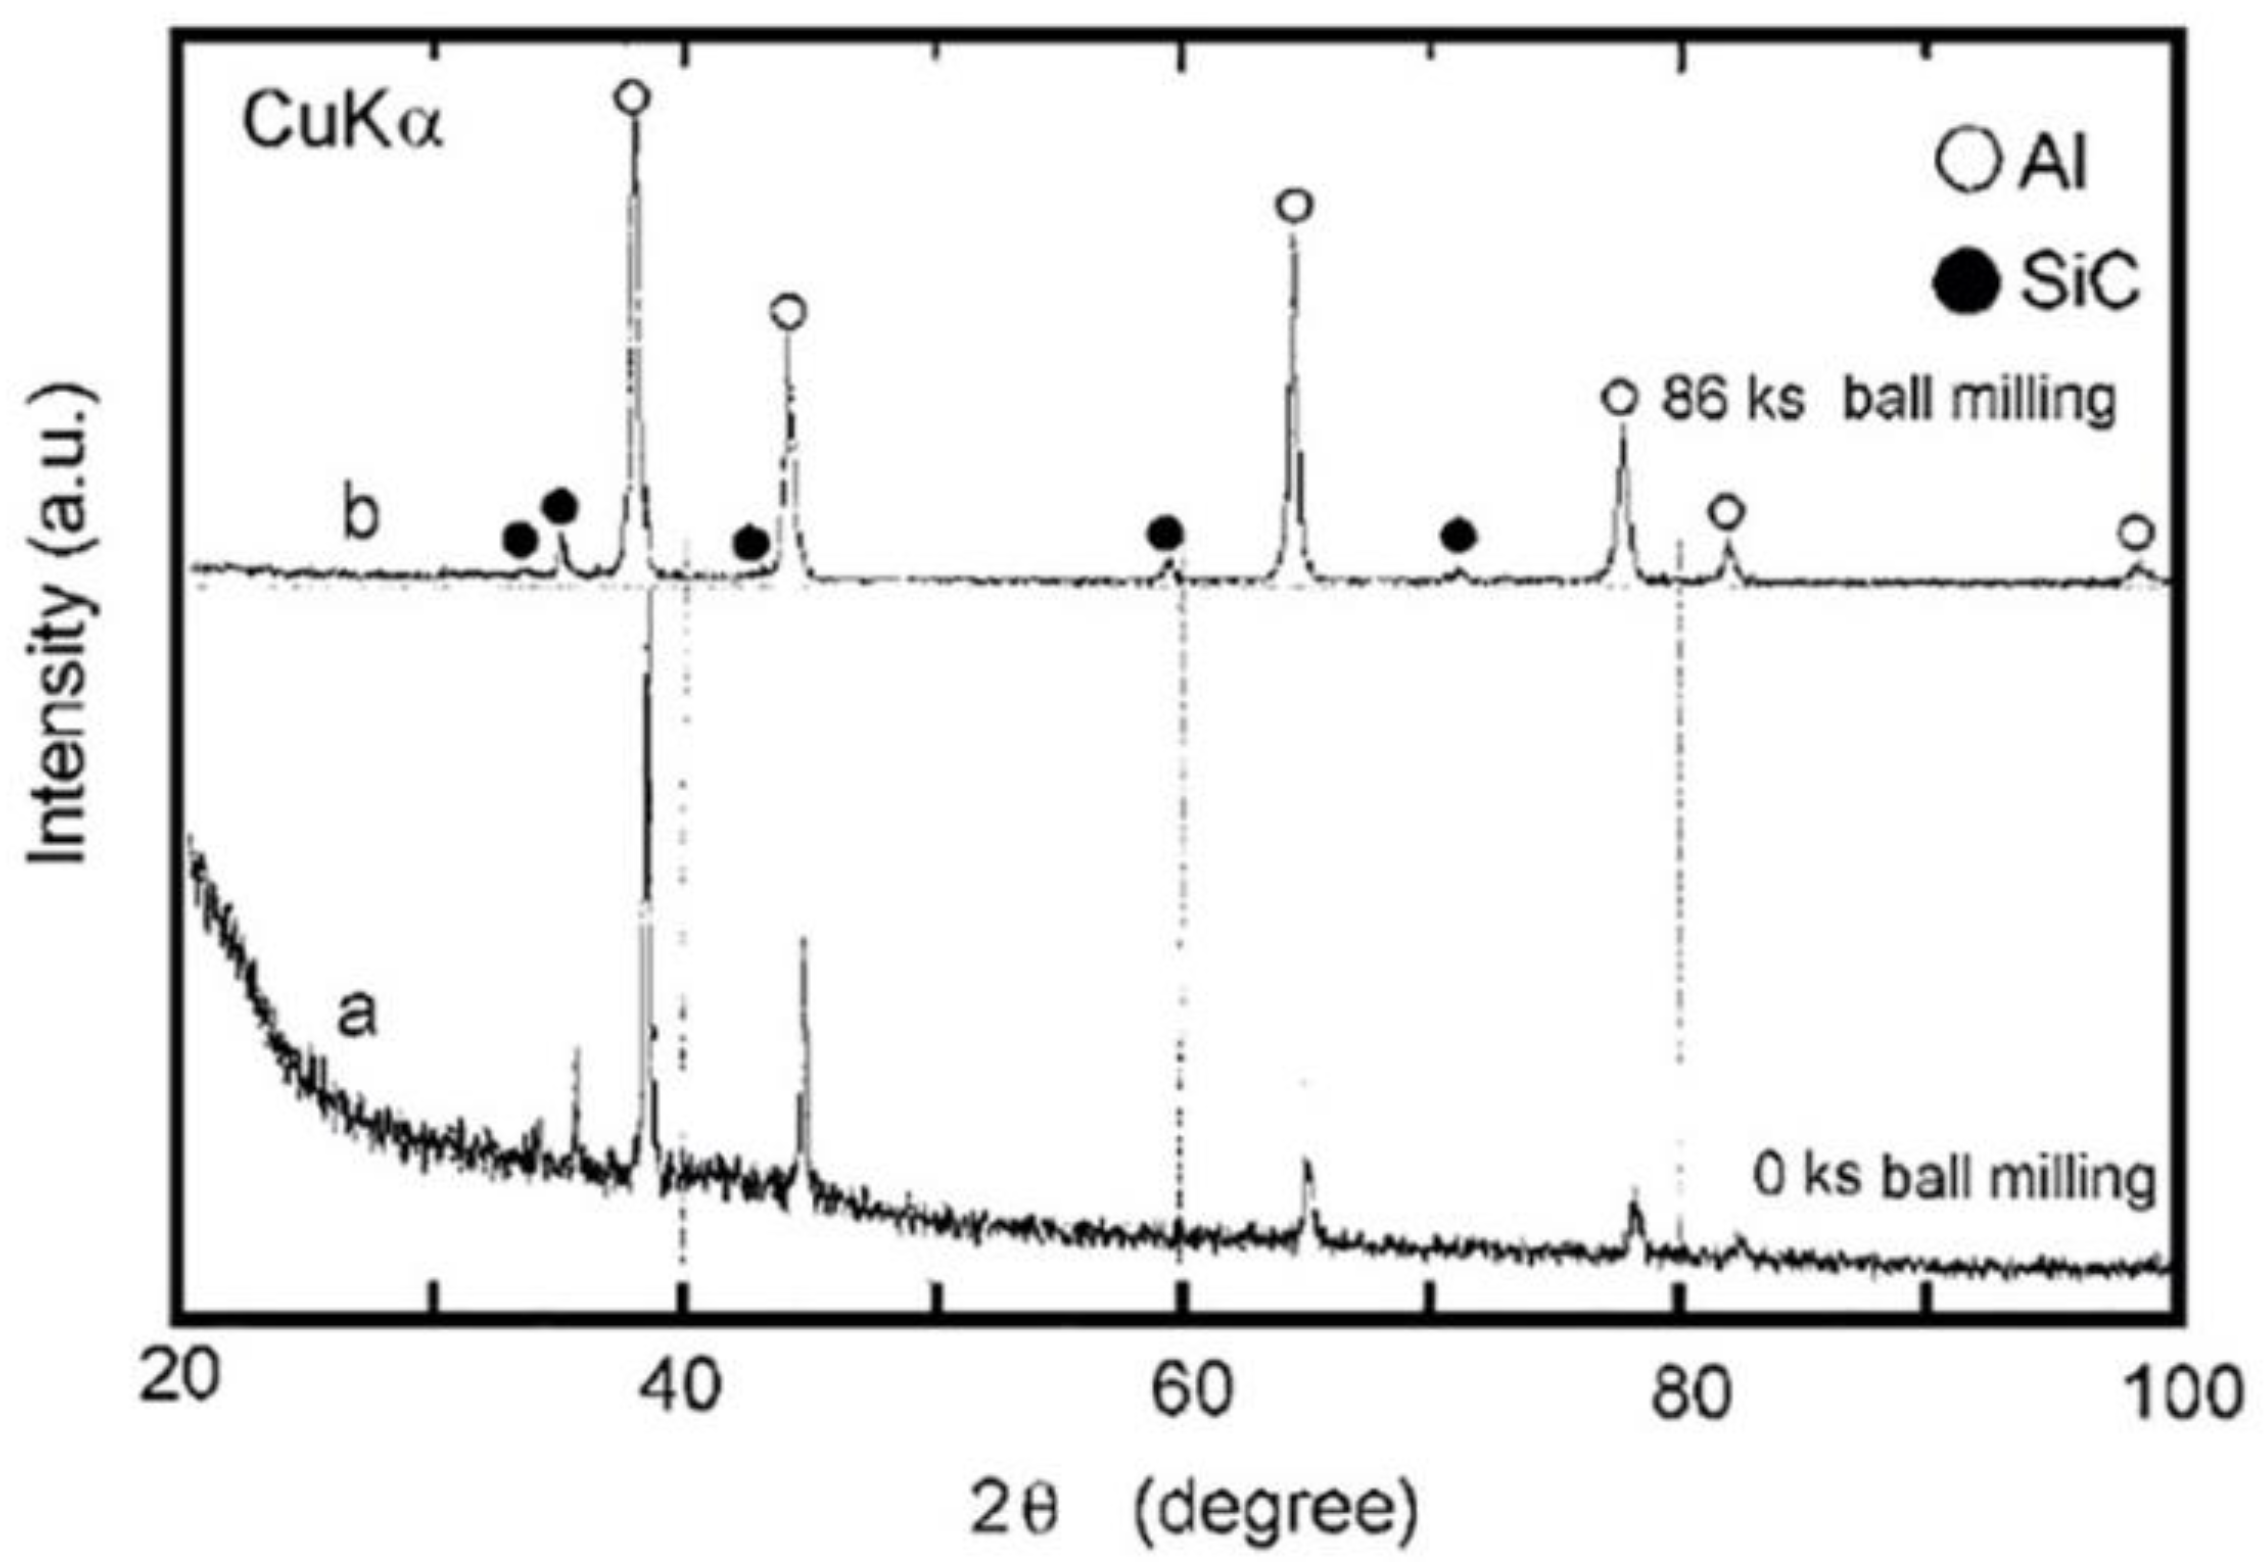
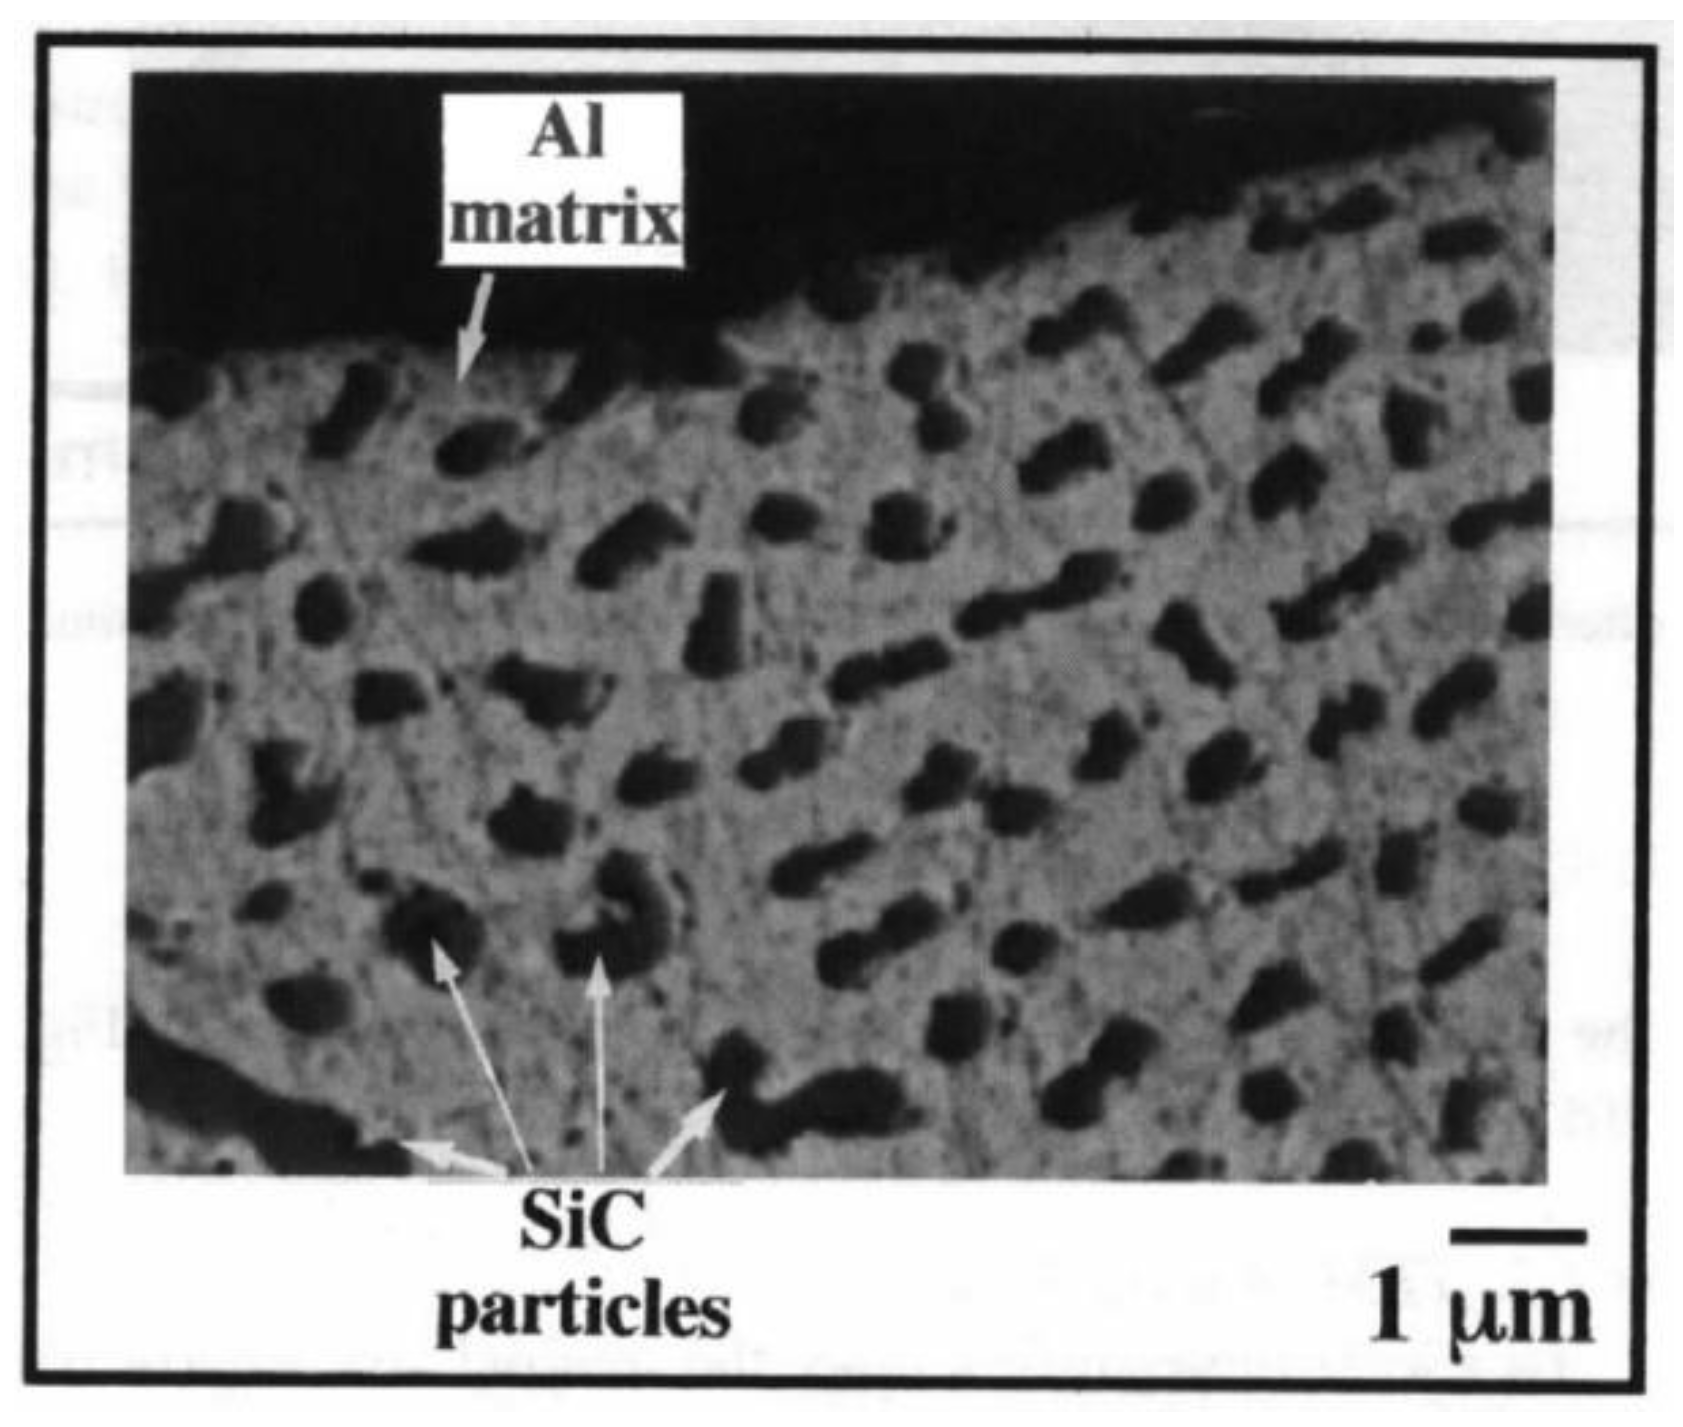
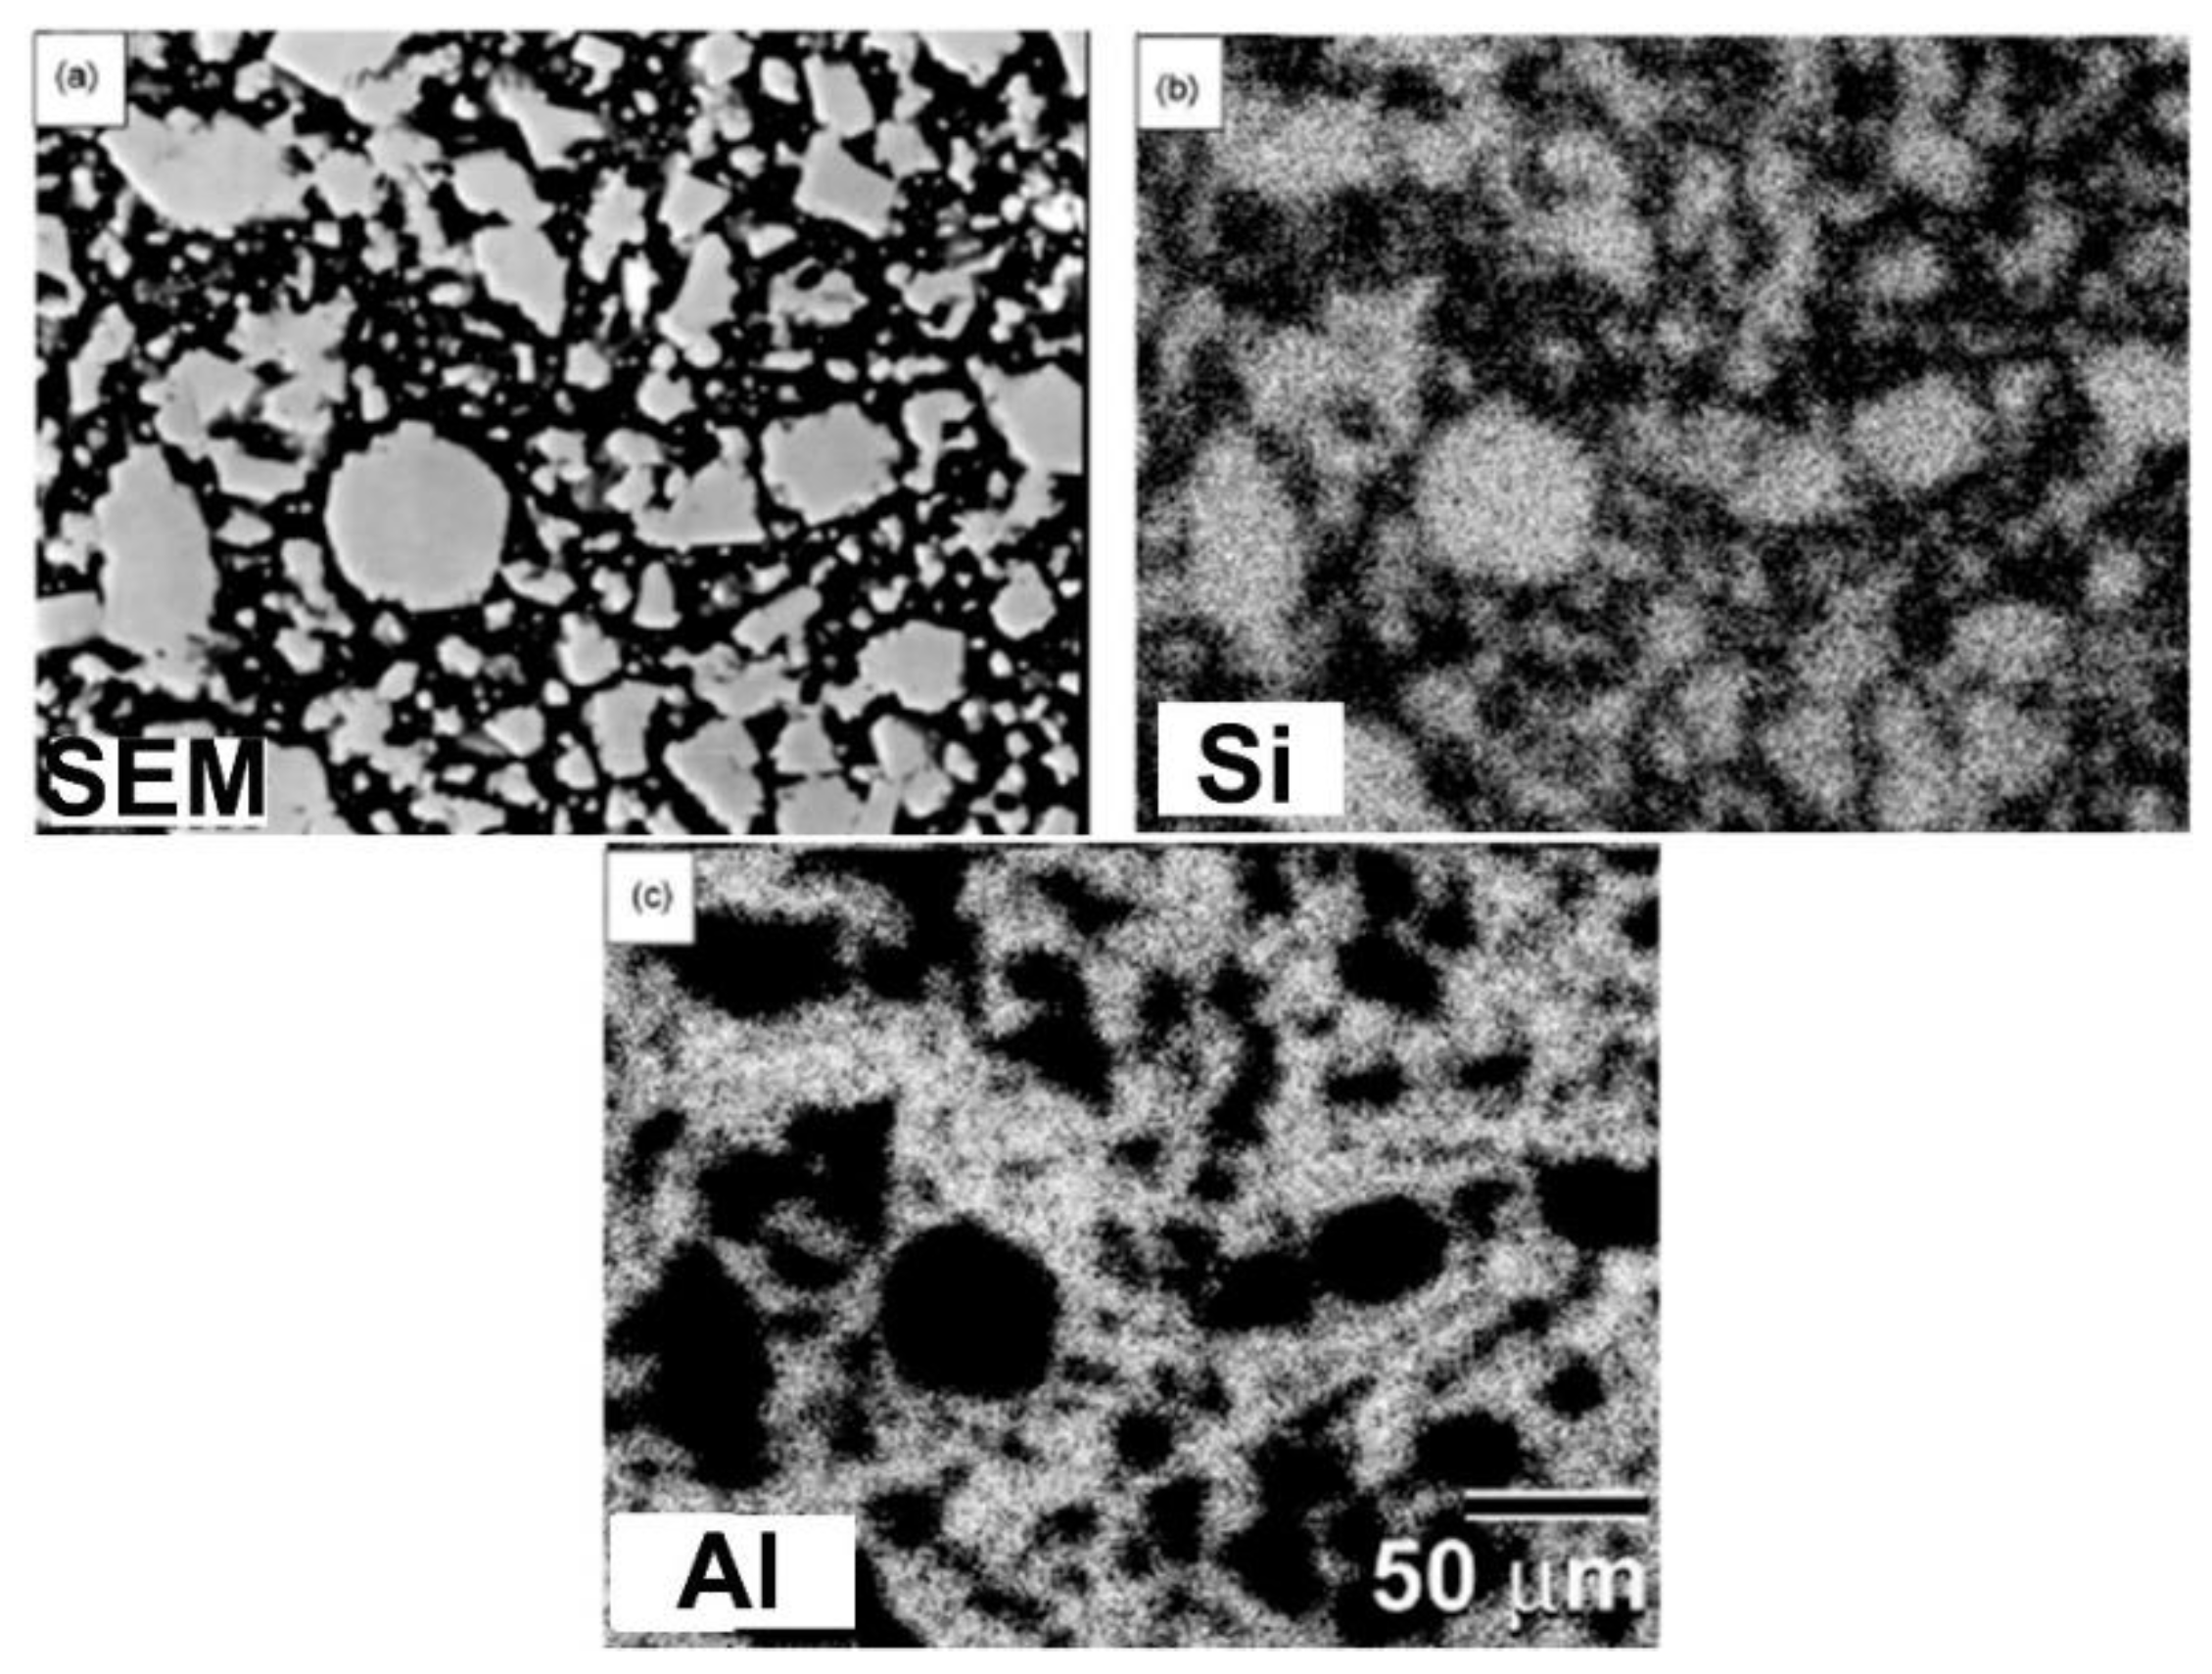
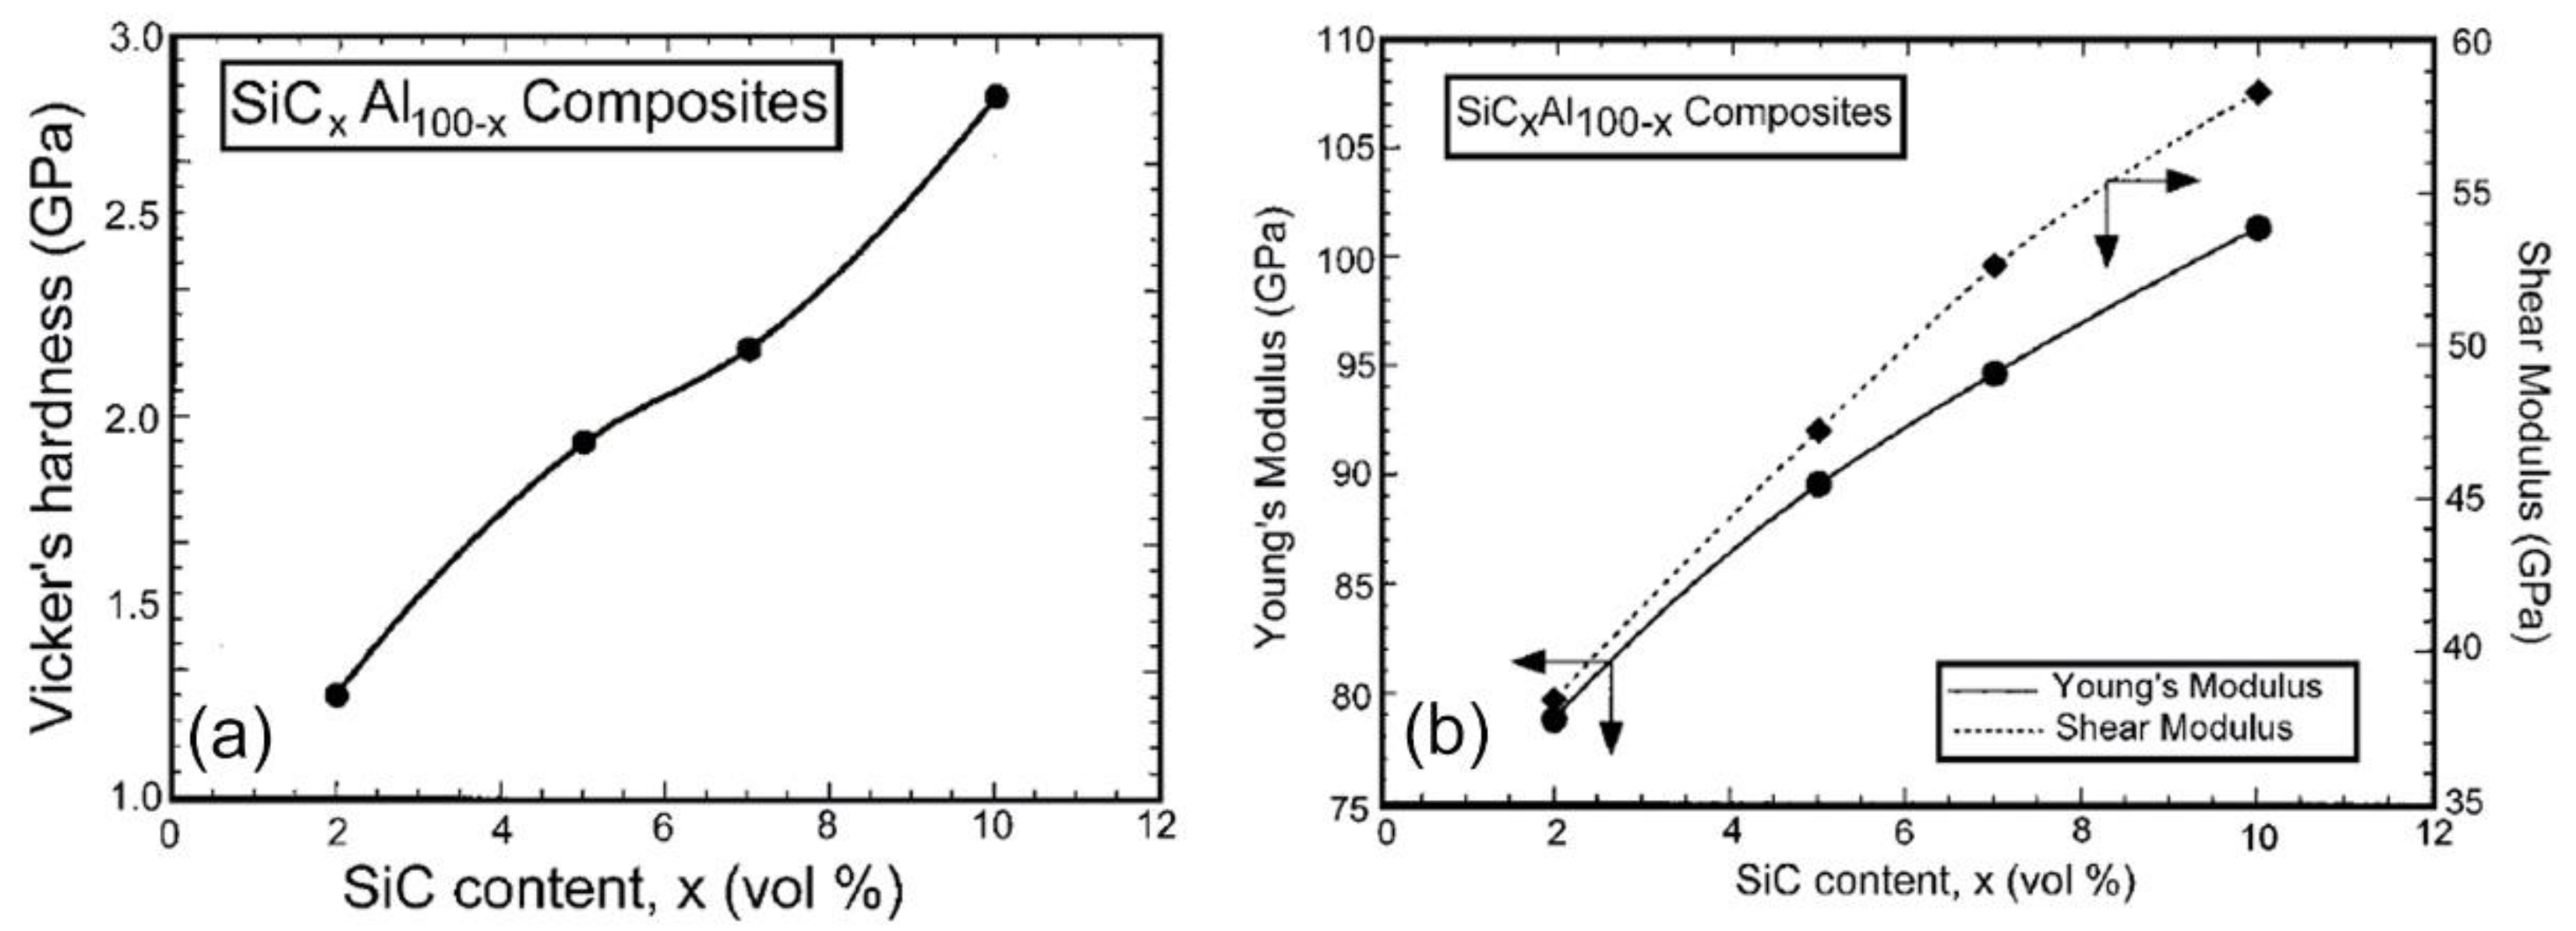
Fabrication of Al/SiC Nanocomposite Powders by Ball Milling
- -
- The mechanical properties of SiC will degrade as a result of Al4C3 synthesis.
- -
- Additionally, due to the instability of the reaction product Al4C3 in certain conditions, such as water, methanol, and hydrochloric acid, the composite may be susceptible to corrosive environments.
- -
- Additionally, Si produced as an interfacial reaction product will form Al-Si eutectic at the interface and grain boundary areas, resulting in the composite exhibiting undesirable mechanical properties.
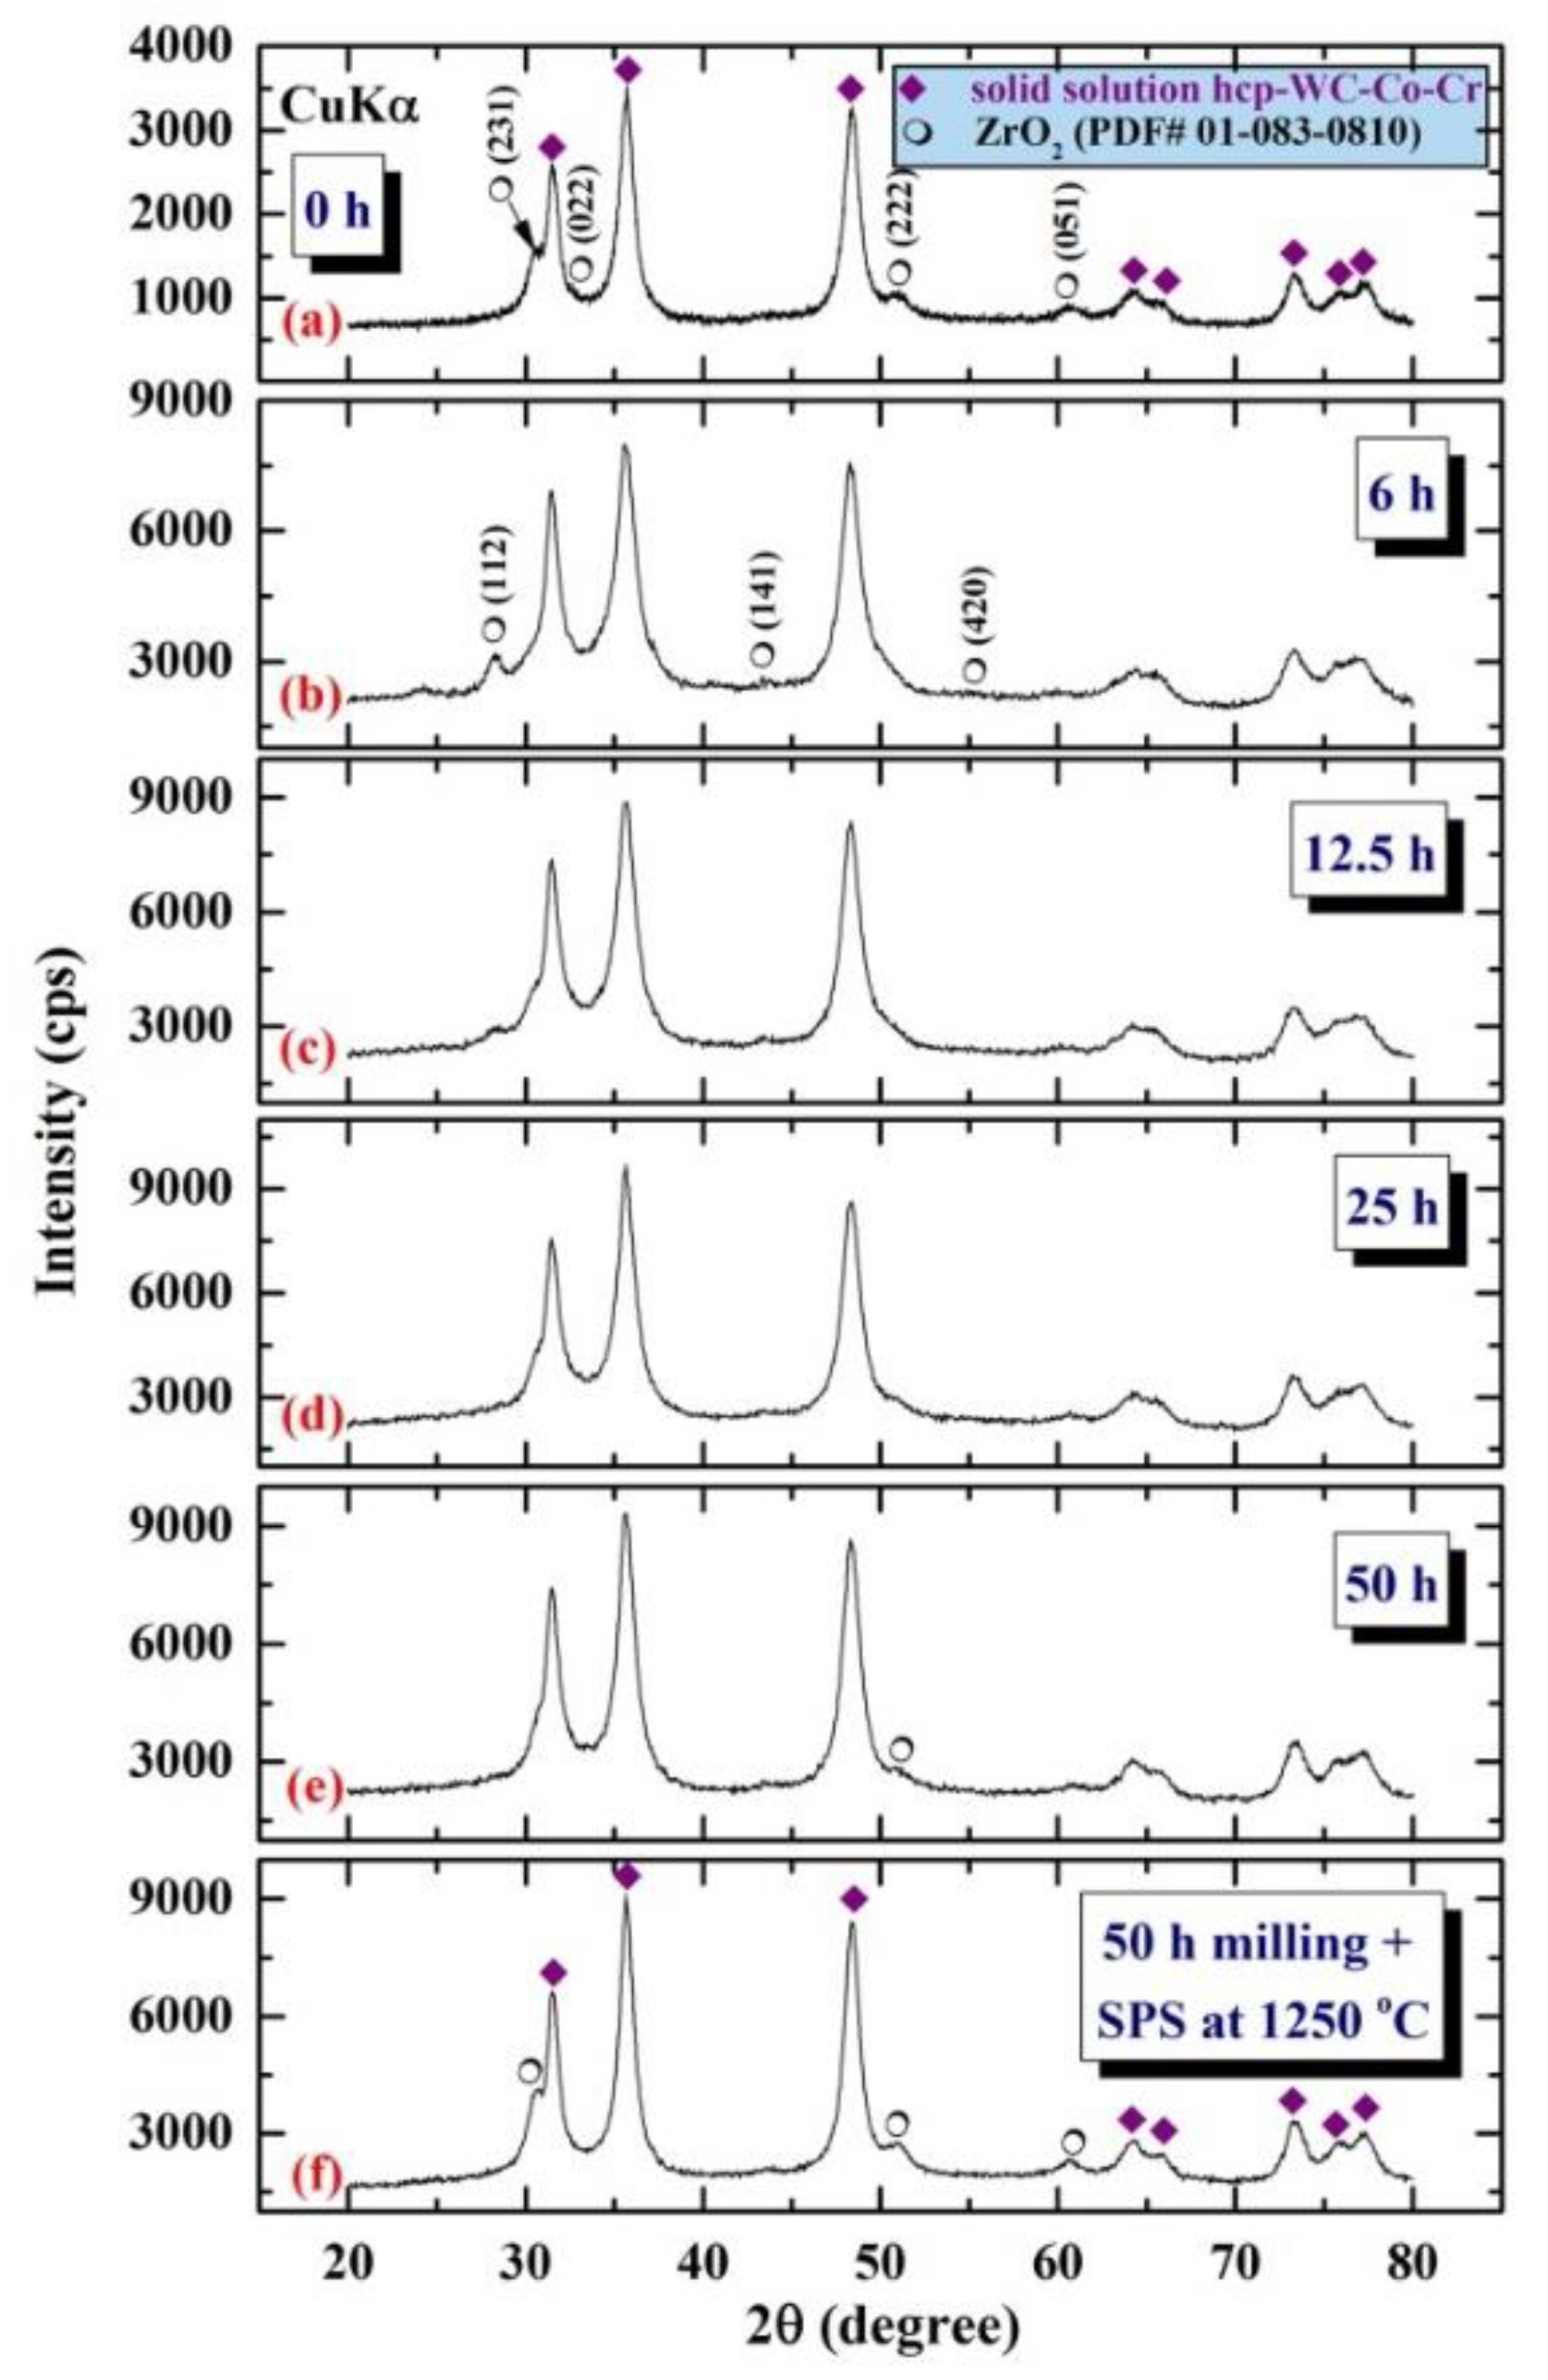
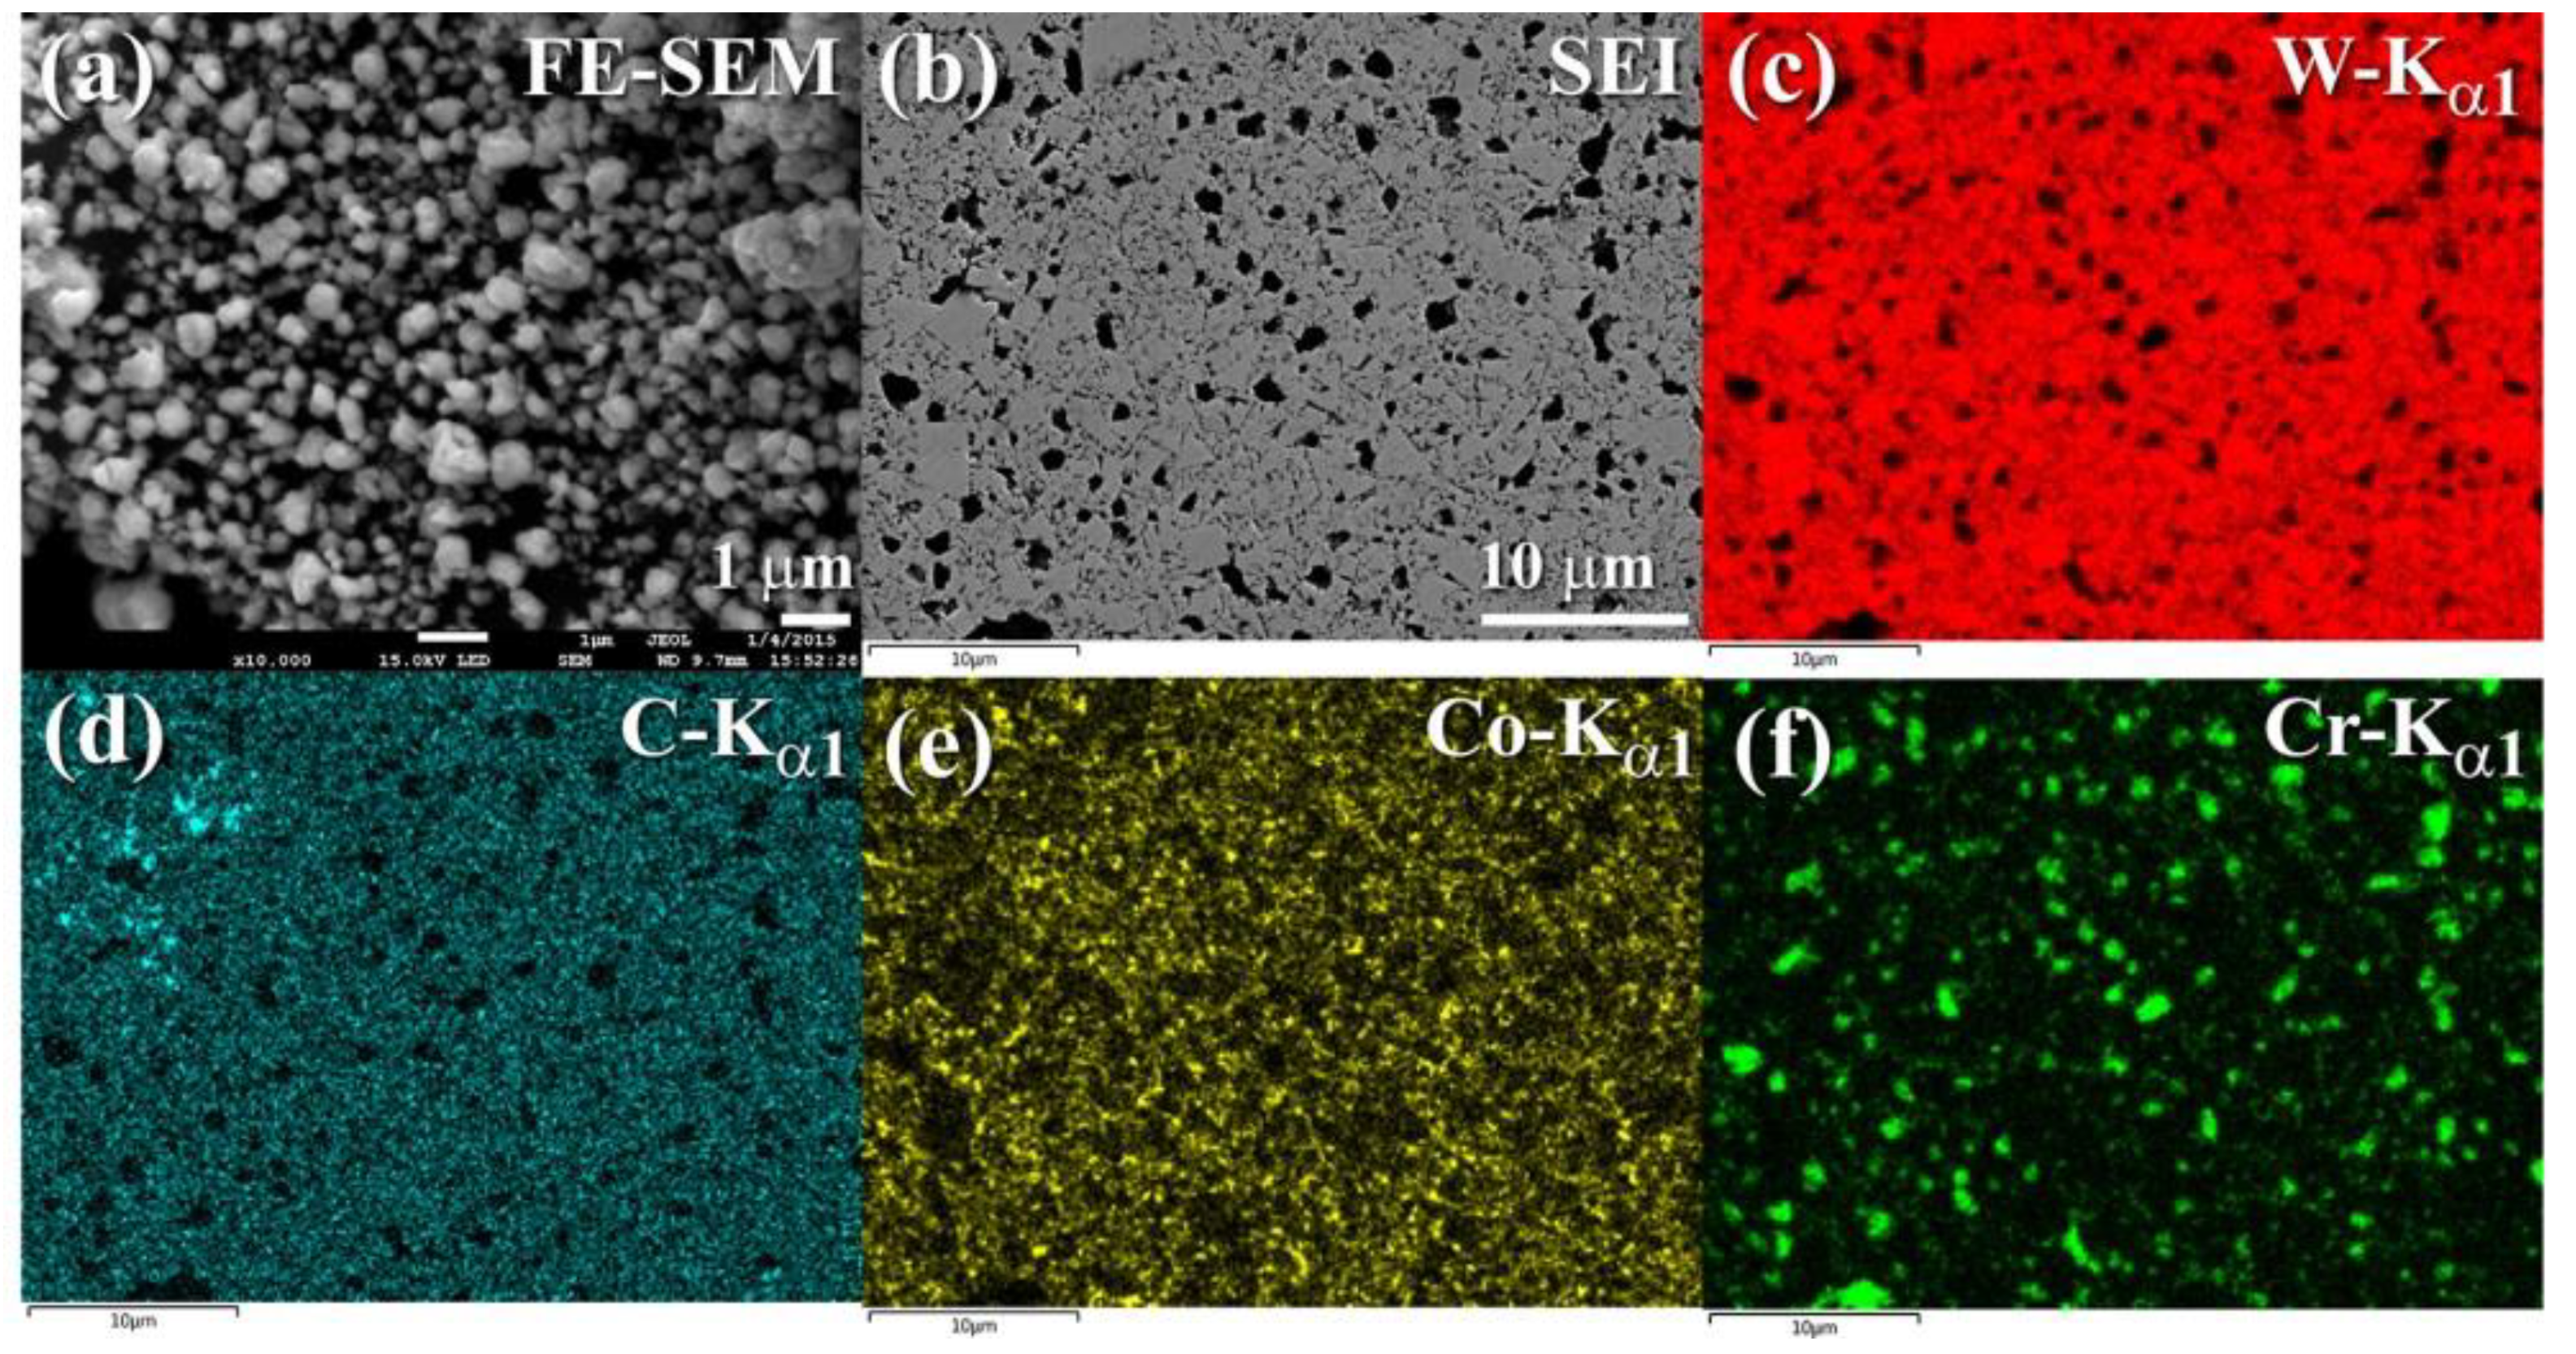
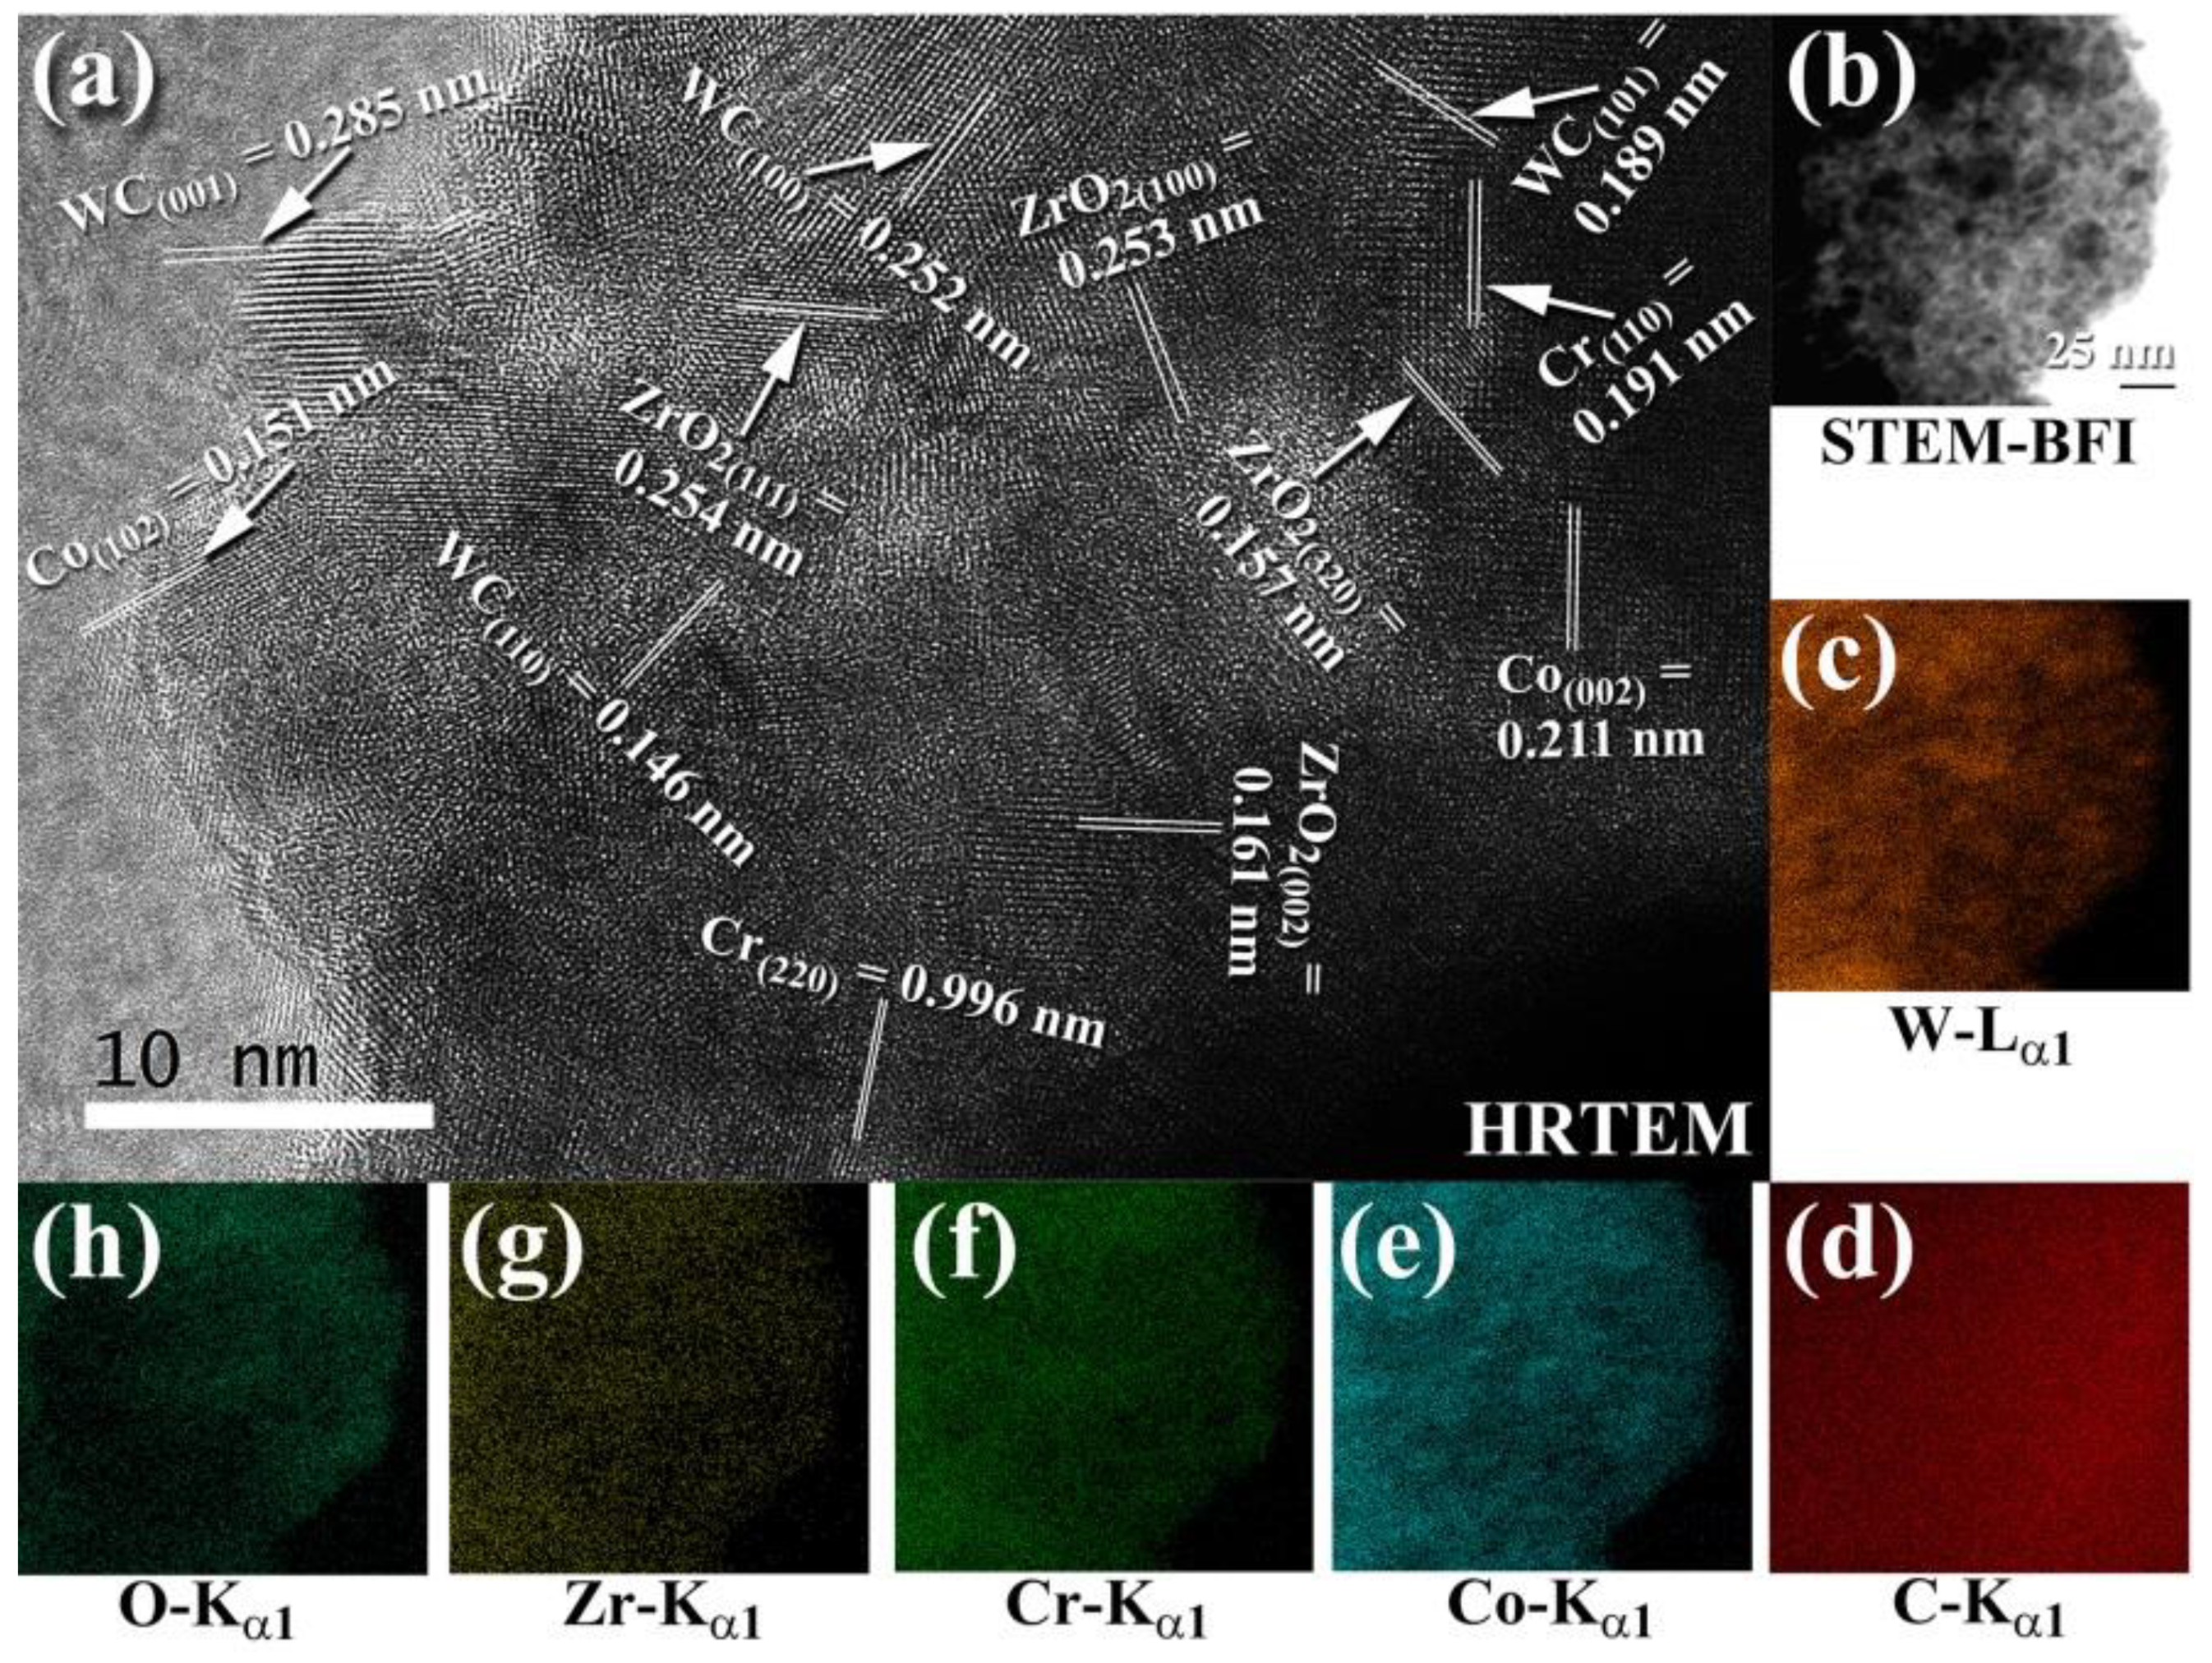
4.2. Fabrication of Ceramic Matrix Composites of 100-x(93-WC/7(10Co/4Cr))/x-ZrO2 System
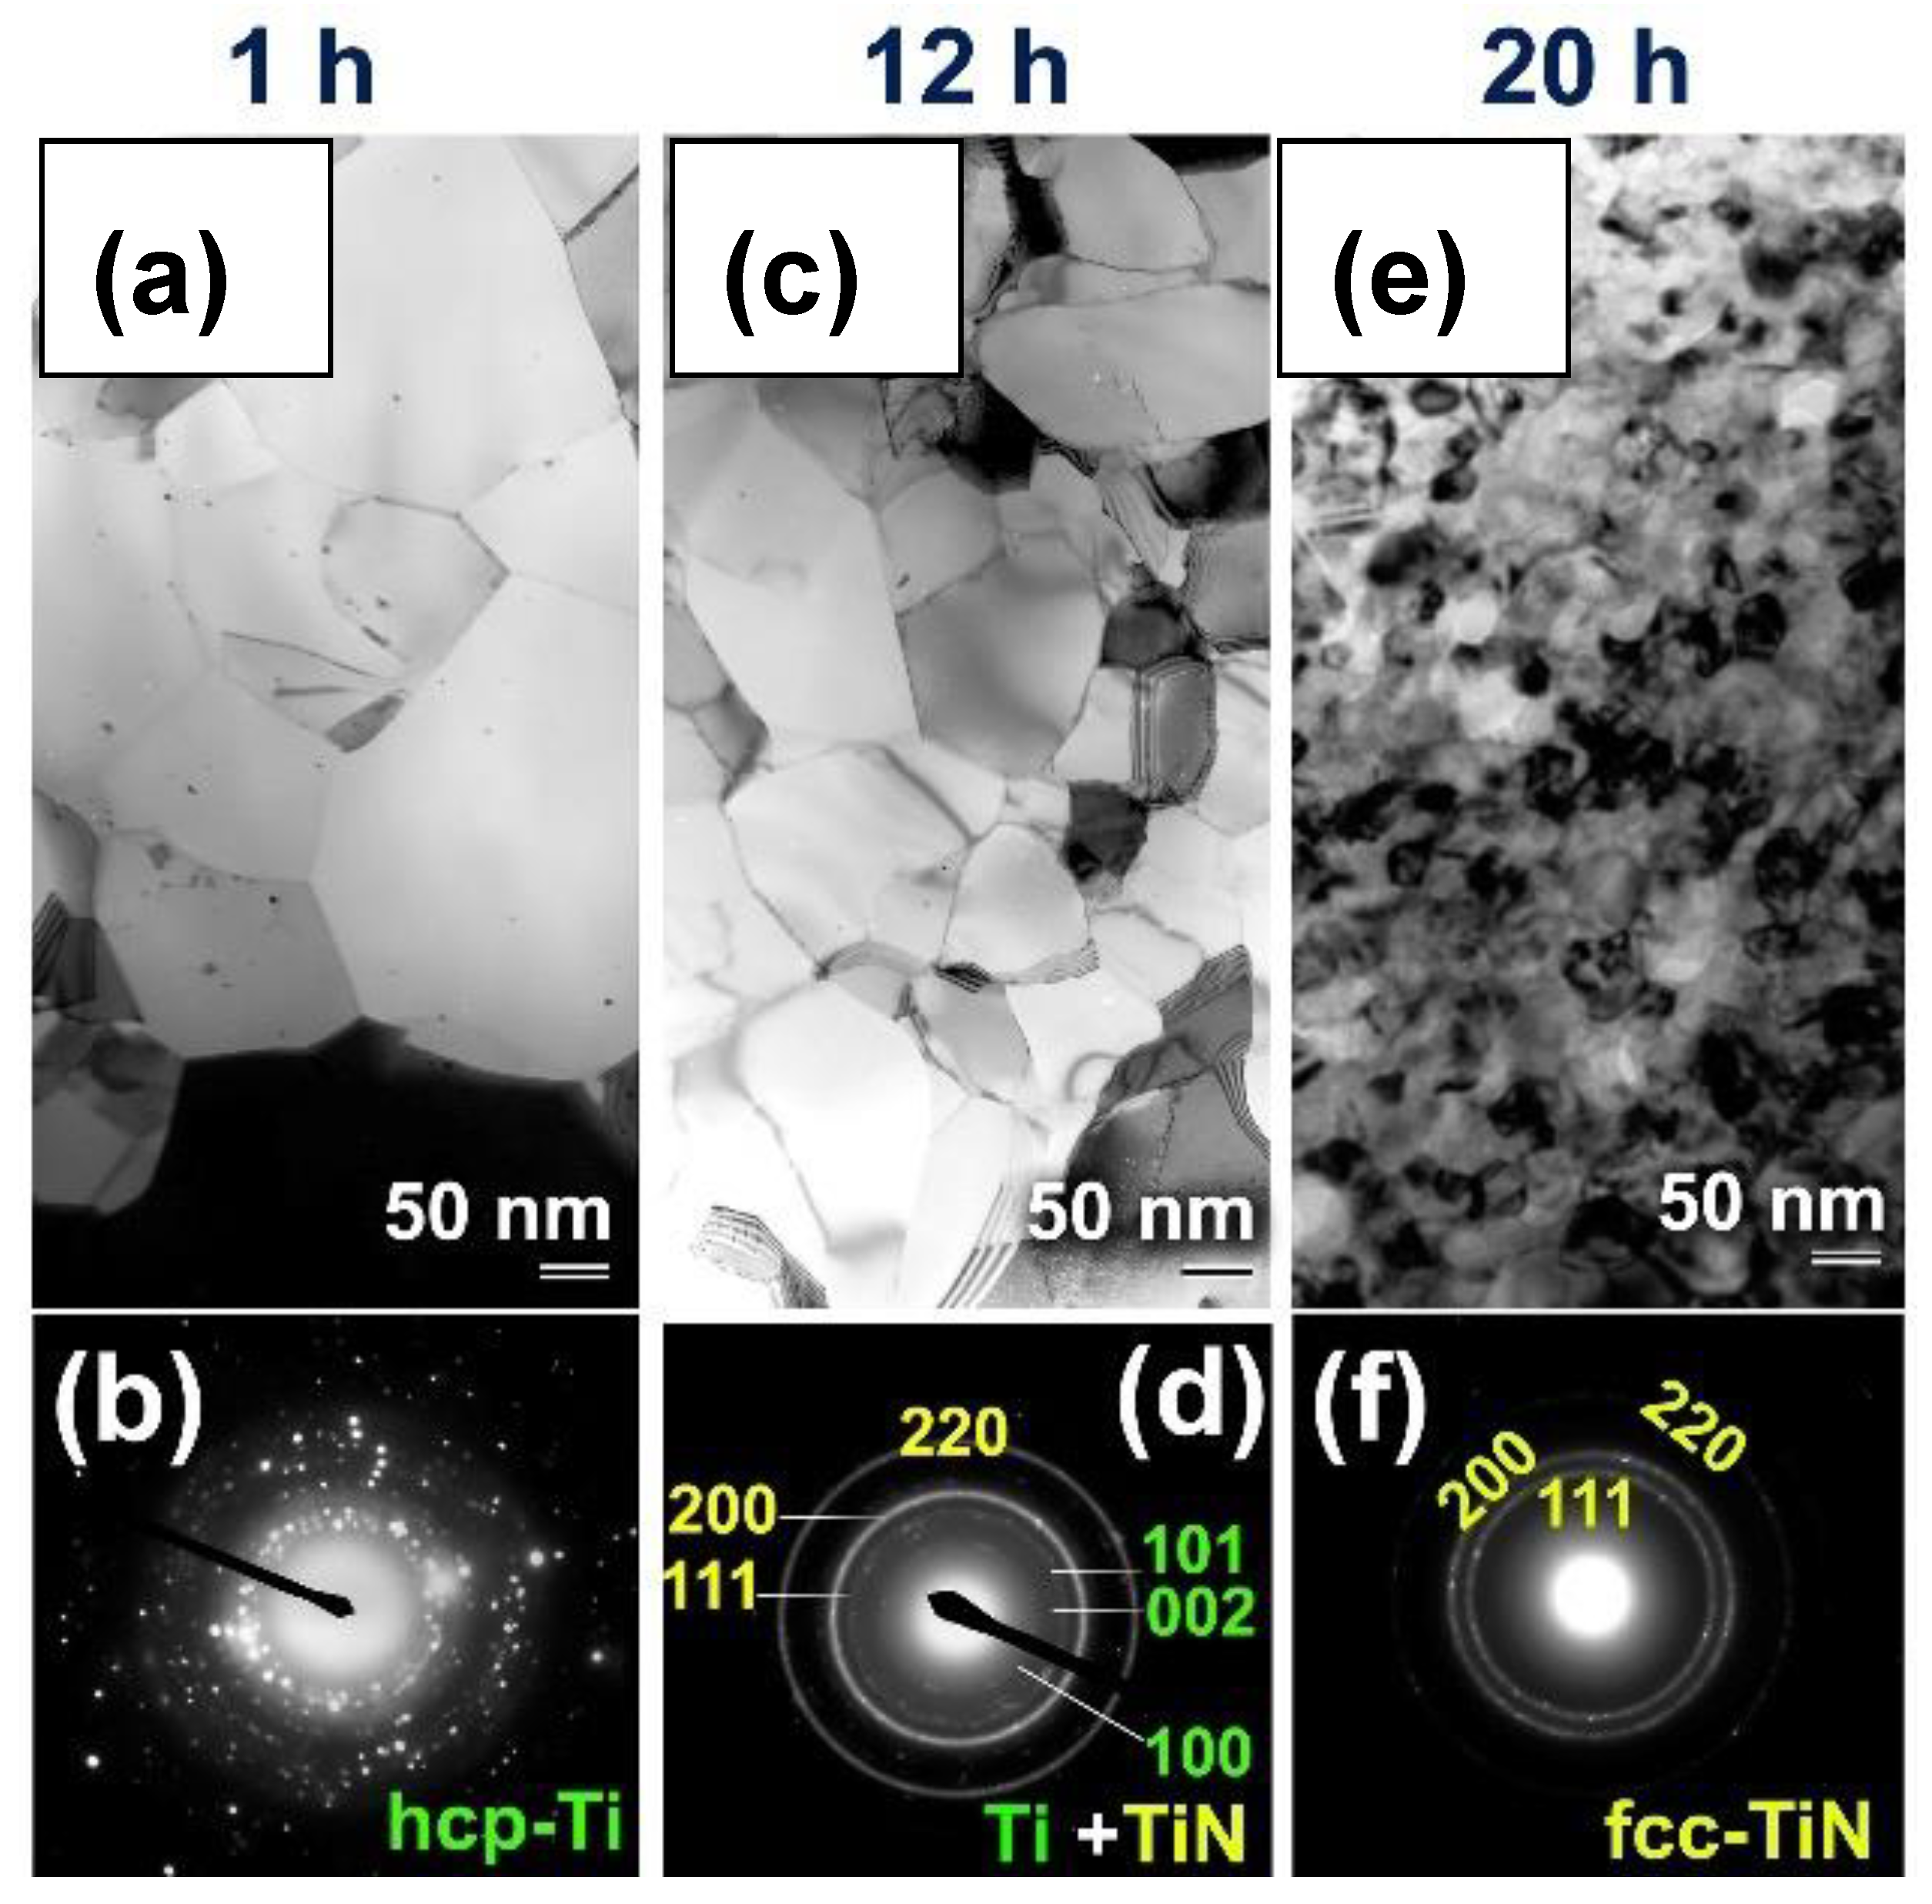
5. Reactive Ball Milling
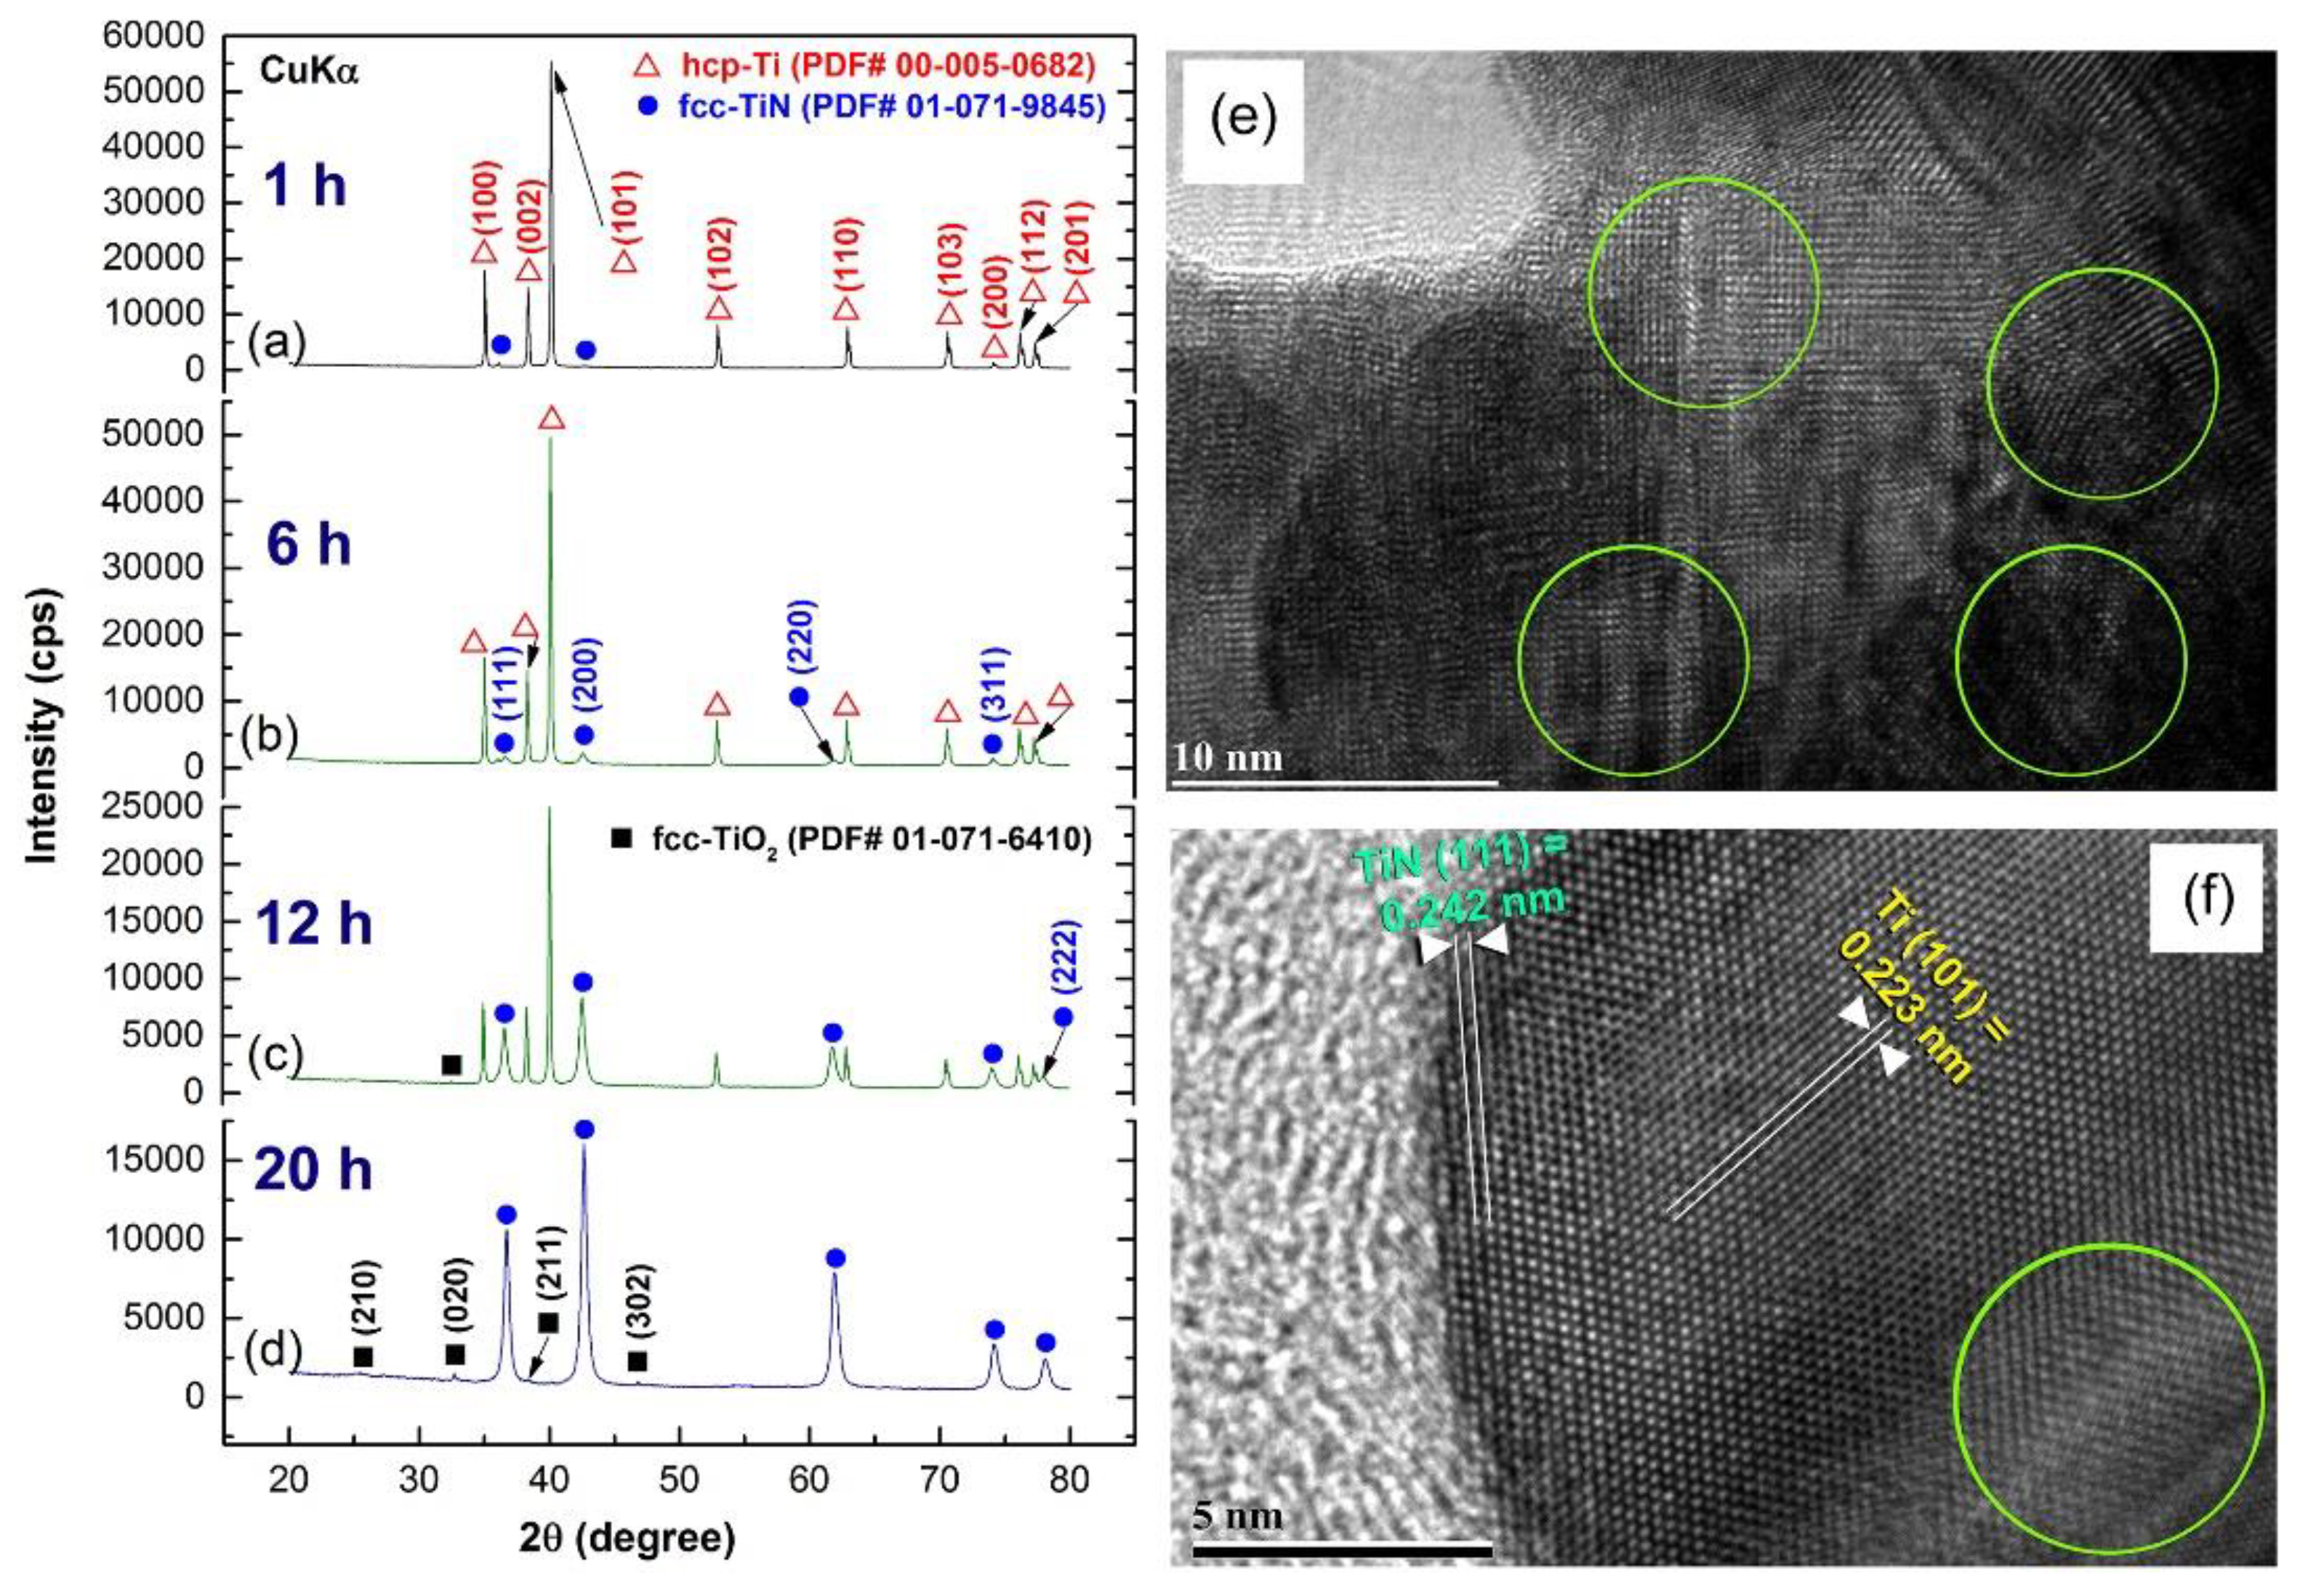
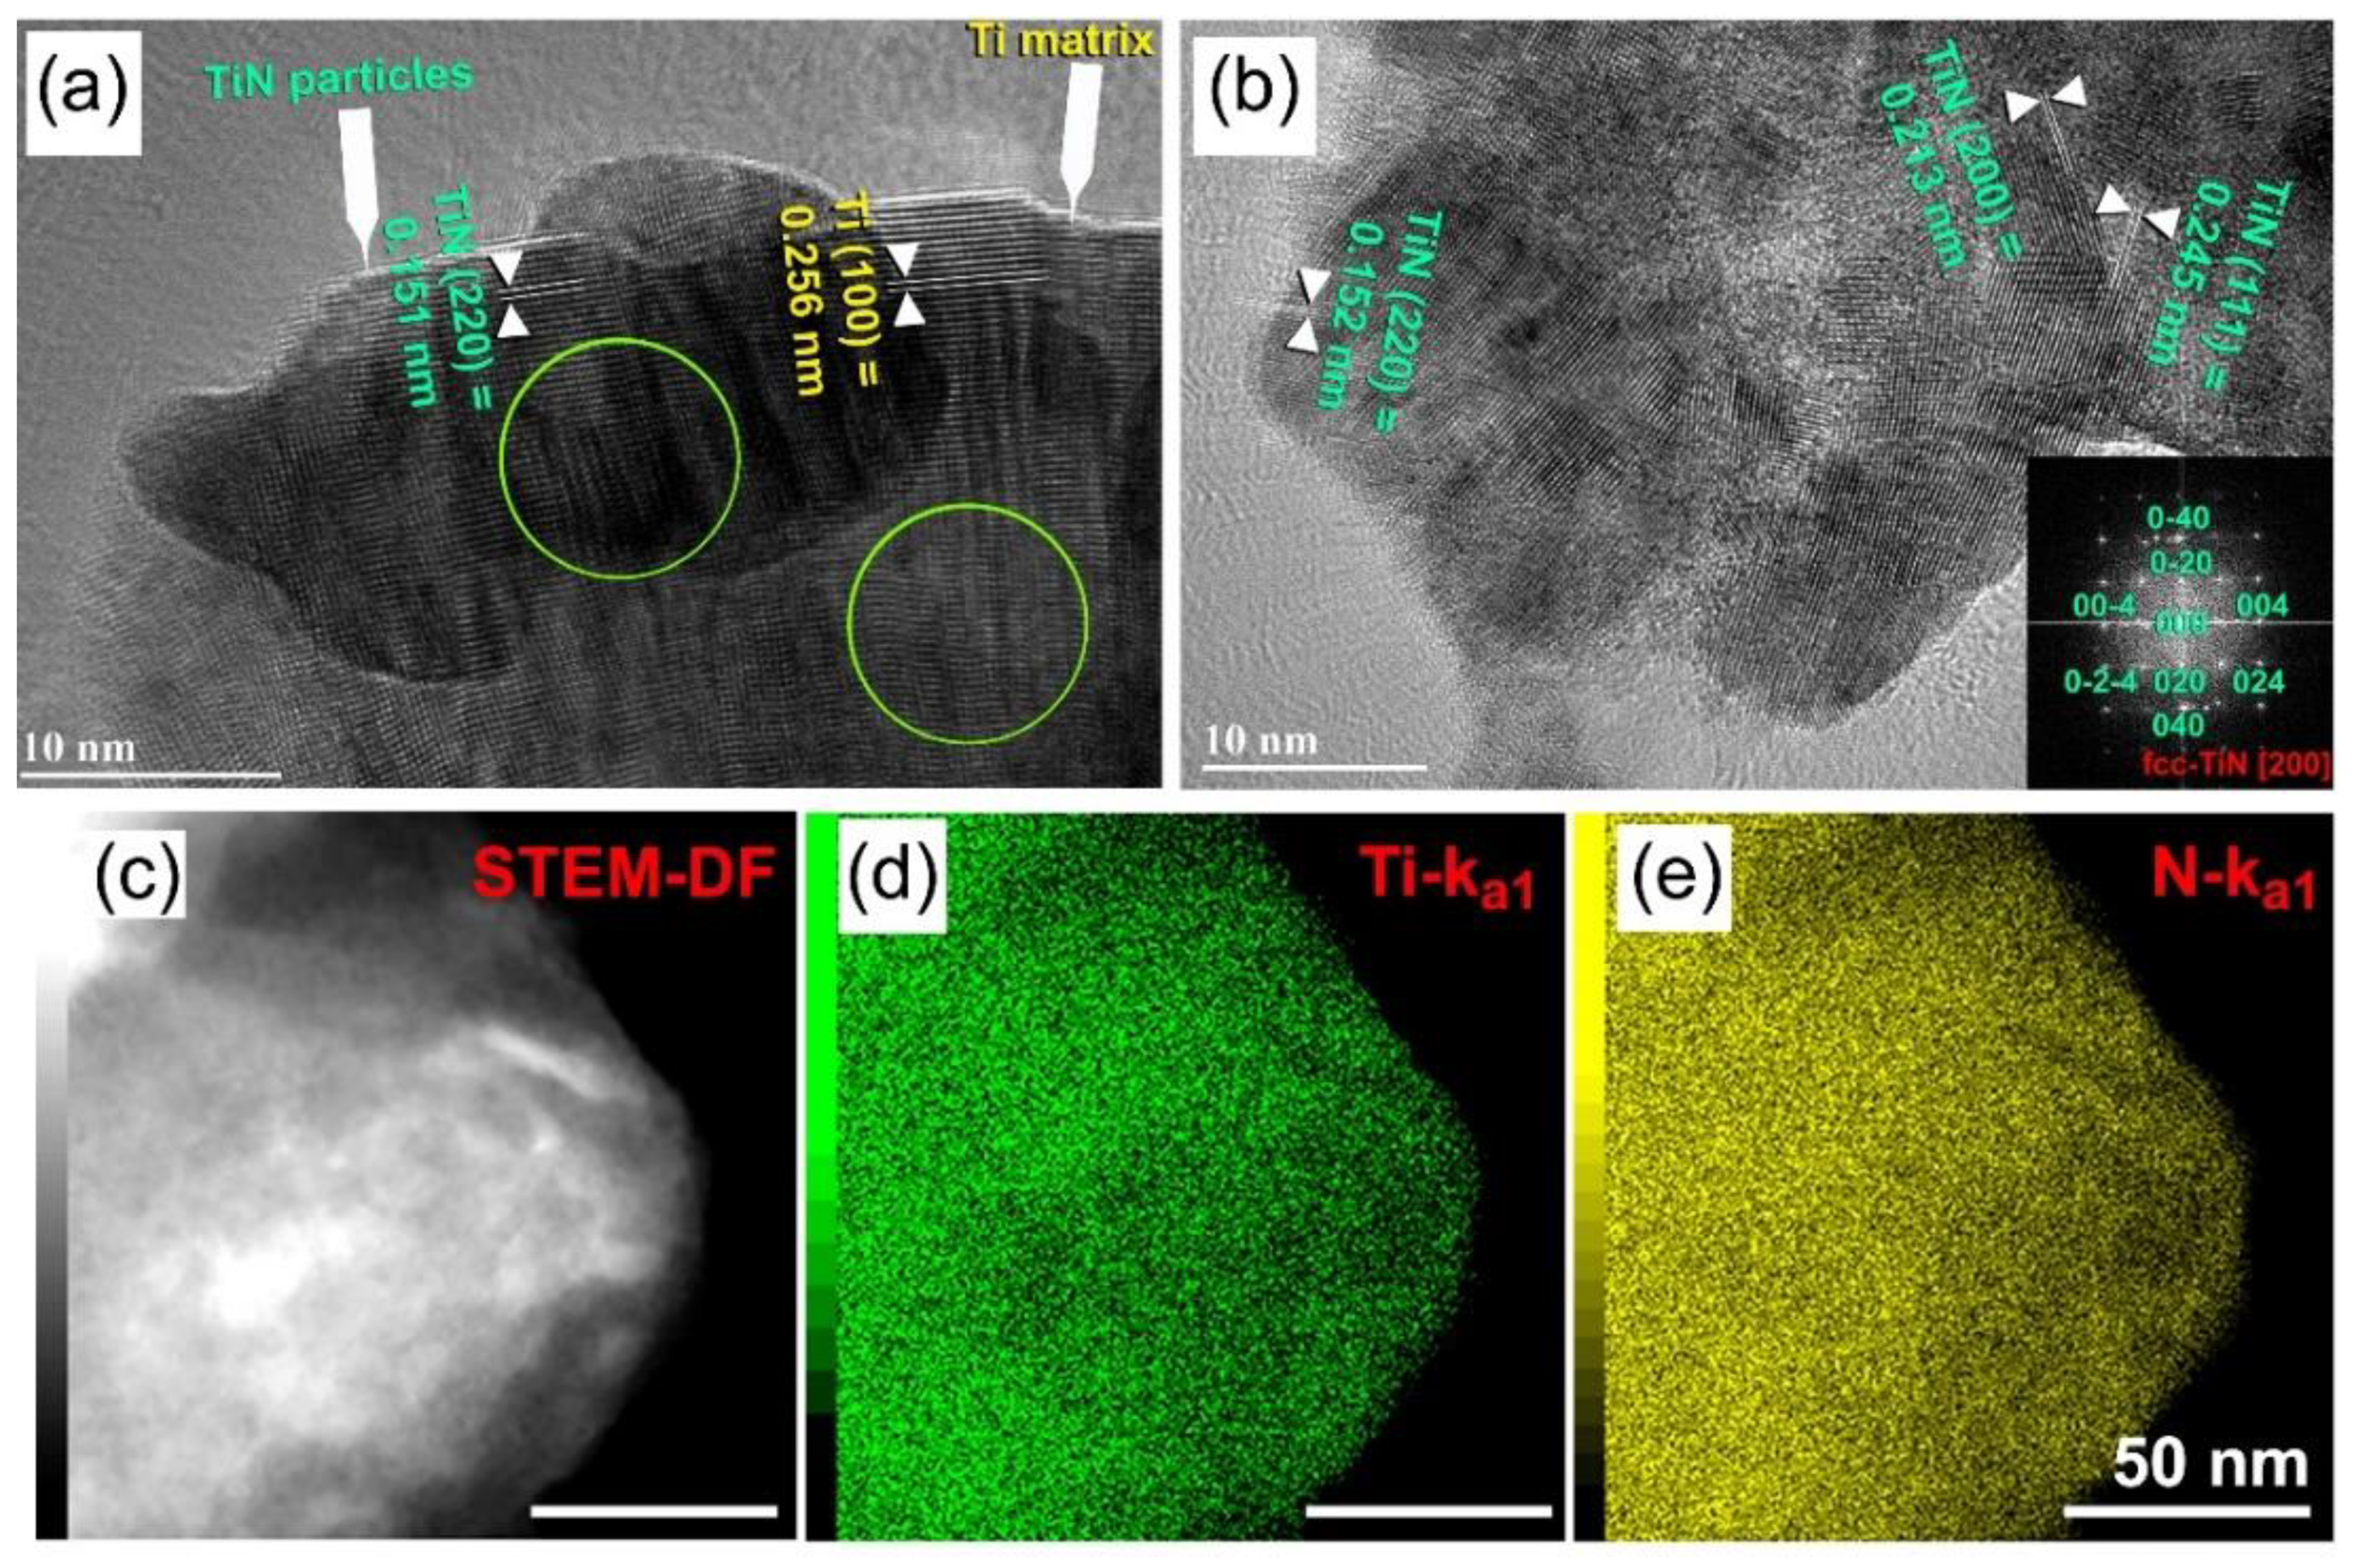
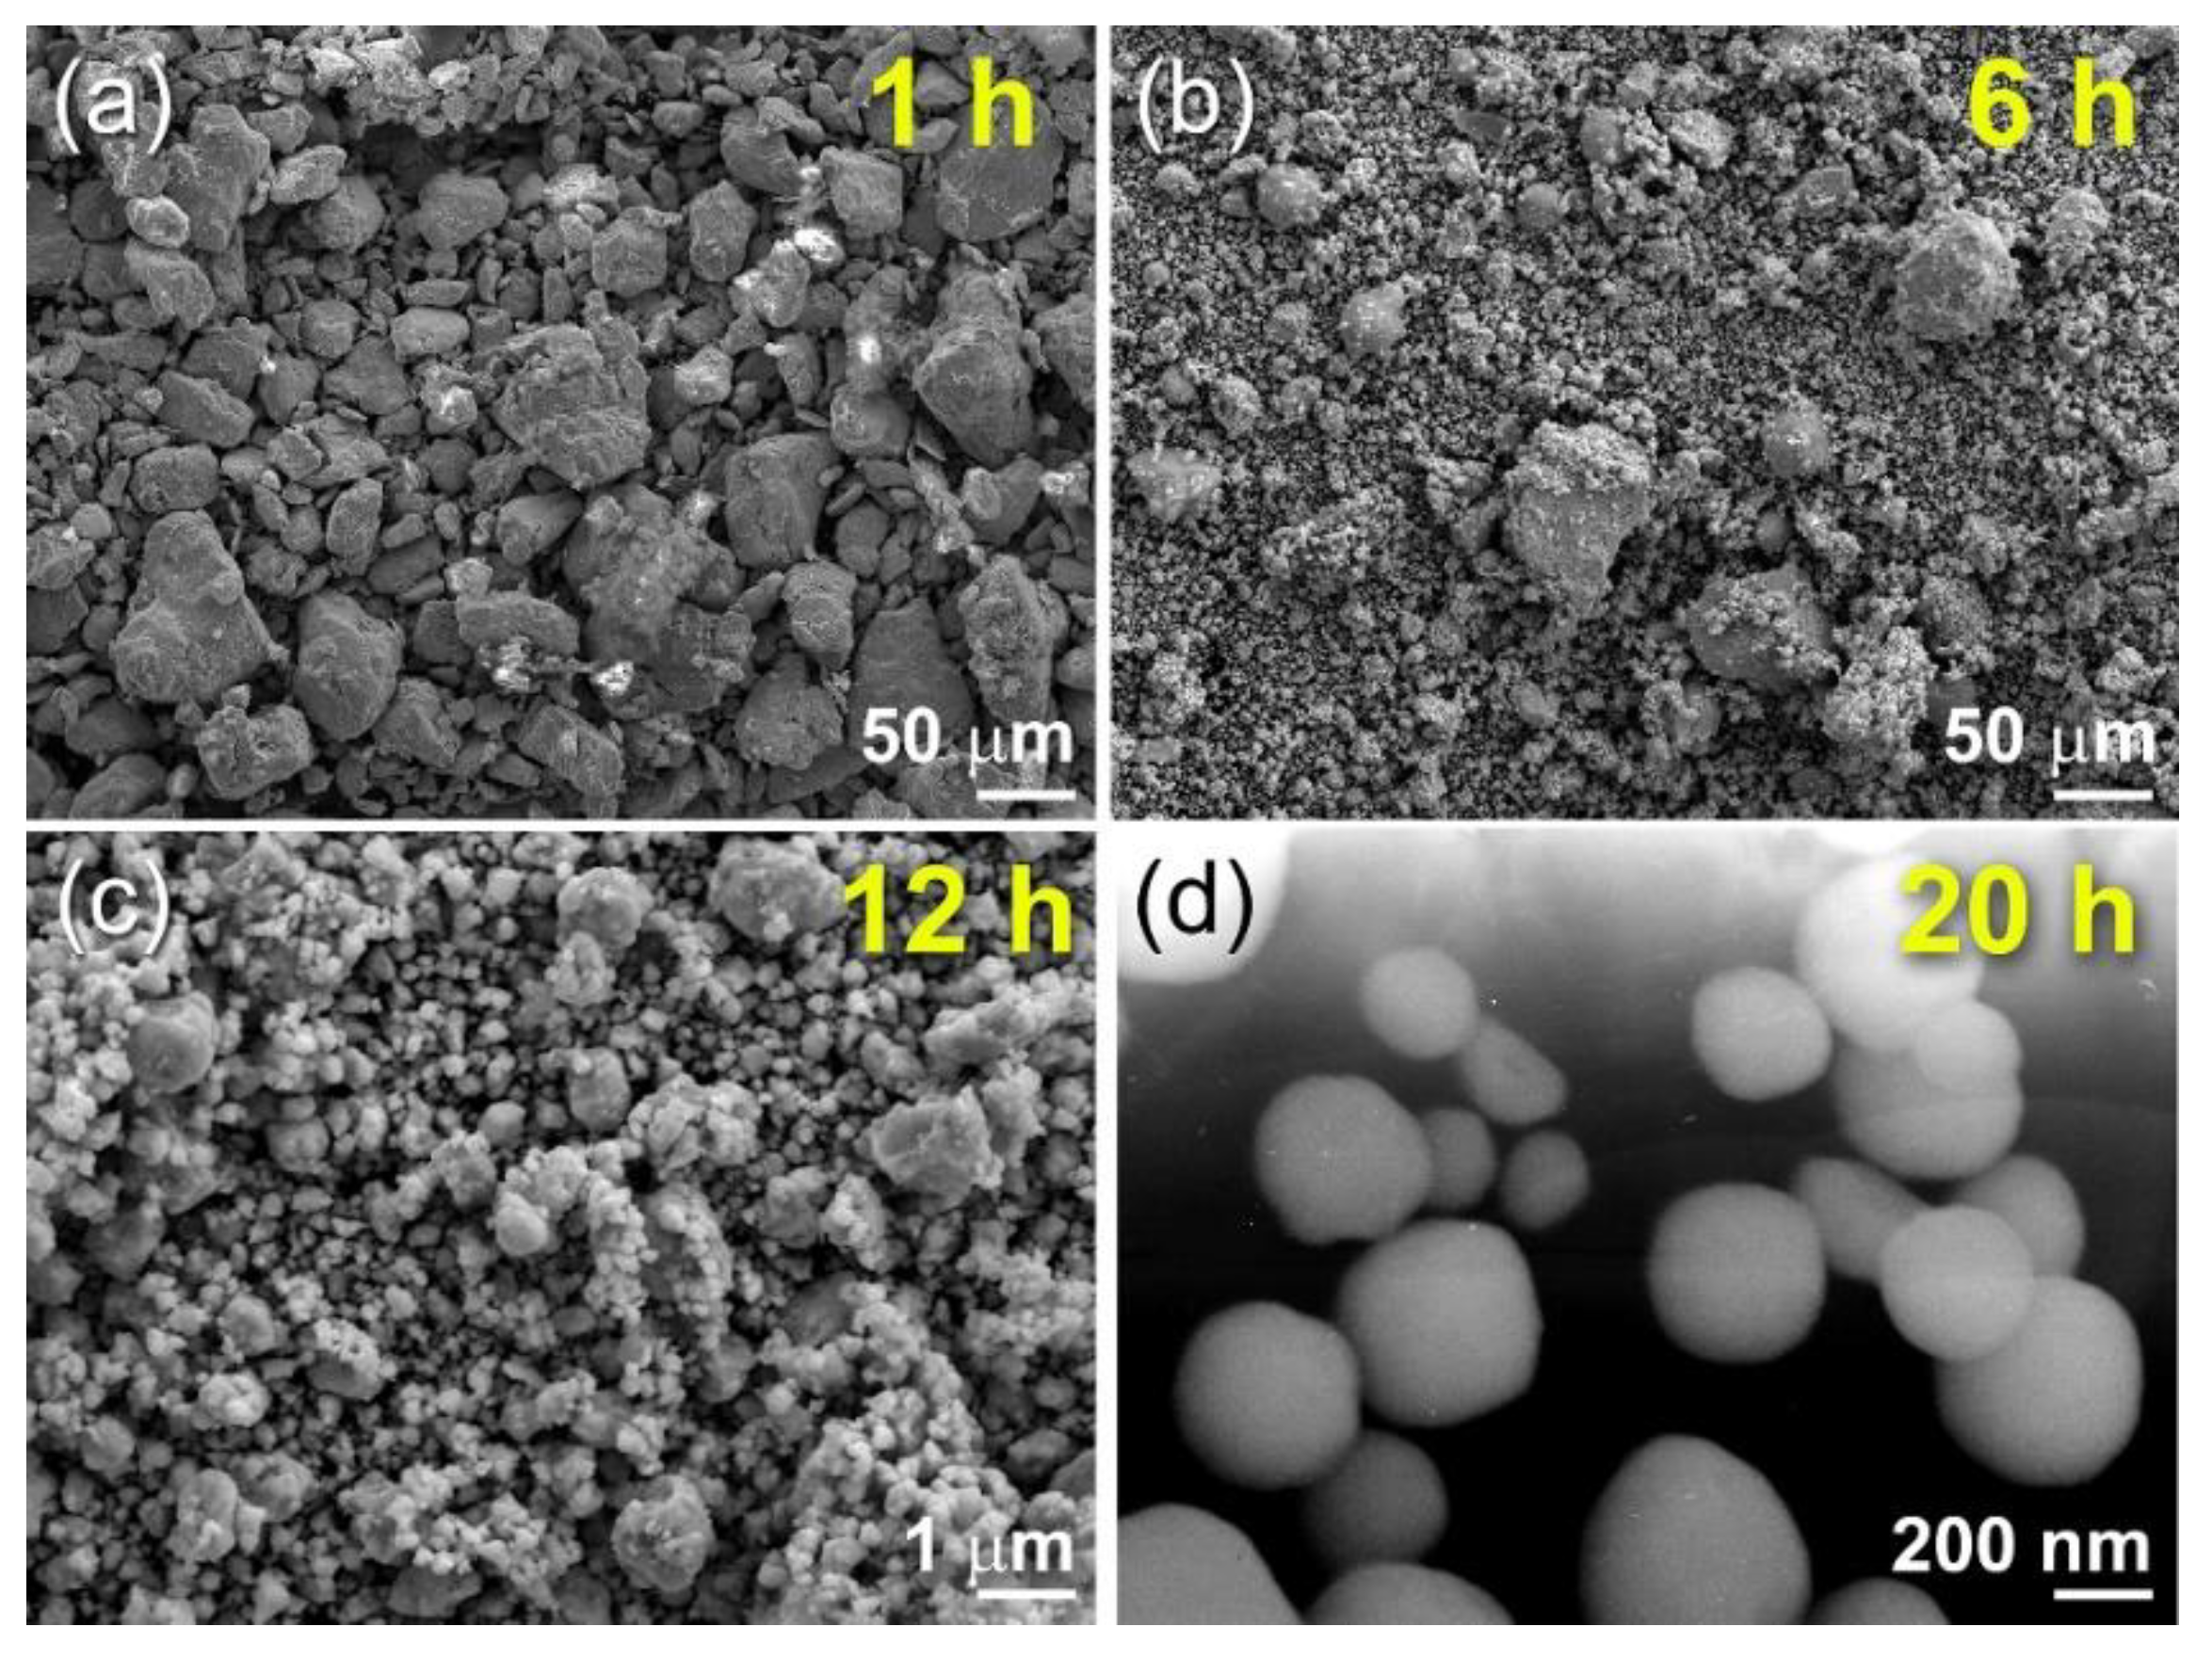
Preparations of Titanium Nitride (TiN)
6. The Drawbacks of Ball Milling and the Subsequent Solutions
Excessive of Operating Temperature
7. Conclusions
Author Contributions
Funding
Institutional Review Board Statement
Informed Consent Statement
Data Availability Statement
Acknowledgments
Conflicts of Interest
References
- El-Eskandarany, M.S. Mechanical Alloying: Energy, Surface Protective Coating and Medical Applications, 3rd ed.; Elsevier: Oxford, UK, 2020. [Google Scholar]
- El-Eskandarany, M.S. Recent developments in the fabrication, characterization and implementation of MgH2-based solid-hydrogen materials in the Kuwait Institute for Scientific Research. RSC Adv. 2019, 9, 9907. [Google Scholar] [CrossRef] [Green Version]
- Suryanarayana, C. Mechanical alloying: A novel technique to synthesize advanced materials. AAAS Res. 2019, 2019, 17. [Google Scholar] [CrossRef] [PubMed] [Green Version]
- Polmear, I.; StJohn, D.; Nie, J.F.; Qian, M. Novel Materials and Processing Methods. Light Alloys, 5th ed.; Elsevier: Oxford, UK, 2017; pp. 461–514. [Google Scholar]
- El-Eskandarany, M.S.; Ali, N. Synthesizing of novel bulk (Zr67Cu33)100-xWx(x; 5–30 at%) glassy alloys by spark plasma sintering of mechanically alloyed powders. Molecules 2020, 25, 1906. [Google Scholar] [CrossRef] [Green Version]
- El-Eskandarany, M.S.; Ali, N.; Saeed, M. Glass-forming ability and soft magnetic properties of (Co75Ti25)100-xFex(x; 0–20 at%) systems fabricated by SPS of mechanically alloyed nanopowders. Nanomaterials 2020, 10, 849. [Google Scholar] [CrossRef] [PubMed]
- ASM International Handbook Committee. Powder Metal Technologies and Applications, 1st ed.; Lee, P.W., Ed.; ASM International: Materials Park, OH, USA, 1998; Volume 7. [Google Scholar]
- El-Eskandarany, M.S. Mechanical Alloying: Nanotechnology, Materials Science and Powder Metallurgy, 2nd ed.; Elsevier: Oxford, UK, 2015. [Google Scholar]
- Suryanarayana, C. Mechanical alloying and milling. Prog. Mater. Sci. 2001, 46, 1–184. [Google Scholar] [CrossRef]
- Patil, O.M.; Khedkar, N.N.; Sachit, T.S.; Singh, T.P. A review on effect of powder metallurgy process on mechanical and tribological properties of hybrid nano composites. Mater. Today Proc. 2018, 5, 5802–5808. [Google Scholar] [CrossRef]
- Wills, B.A.; Napier-Munn, T. Will’s Mineral Processing Technology: An Introduction to the Practical Aspects of Ore Treatment and Mineral, 7th ed.; Elsevier: Oxford, UK, 2006. [Google Scholar]
- Benjamin, J.S. Dispersion strengthened superalloys by mechanical alloying. Metall. Mater Trans B 1970, 1, 2943–2951. [Google Scholar]
- Binns, C. Introduction to Nanoscience and Nanotechnology, 1st ed.; Wiley: New York, NY, USA, 2010. [Google Scholar]
- El-Eskandarany, M.S.; Aoki, K.; Suzuki, K. Rod milling for solid-state formation of Al30Ta70 amorphous alloy powder. J. Less-Common Met. 1990, 167, 113–118. [Google Scholar] [CrossRef]
- Benjamin, J.S.; Bomford, M.J. Dispersion strengthened aluminum-4 pct magnesium alloy made by mechanical alloying. Metall. Trans. A 1981, 8, 1827–1832. [Google Scholar] [CrossRef]
- Lü, L.; Lai, M.O. Introduction to Mechanical Alloying. In Mechanical Alloying, 1st ed.; Shingu, P.H., Ed.; Springer: Boston, MA, USA, 1998; Volume 1, pp. 1–9. [Google Scholar] [CrossRef]
- Gessinger, G.H. Mechanical alloying of IN-738. Metall. Mater Trans A 1976, 7, 1203–1209. [Google Scholar] [CrossRef]
- Koch, C.C.; Cavin, O.B.; McKamey, C.G.; Scarbourgh, J.O. Preparation of ‘‘amorphous’’ Ni60Nb40 by mechanical alloying. Appl. Phys. Lett. 1983, 43, 1017–1019. [Google Scholar] [CrossRef]
- El-Eskandarany, M.S.; Itoh, F.; Aoki, K.; Suzuki, K. Preparation of AlxTa1-x amorphous alloy powder by mechanical alloying. J. Non-Cryst. Solids 1990, 118, 729–732. [Google Scholar] [CrossRef]
- El-Eskandarany, M.S.; Aoki, K.; Suzuki, K. Calorimetric characterization of the amorphization process for milled Al50Nb50 alloy powders. Scr. Metall. 1991, 25, 1695–1700. [Google Scholar] [CrossRef]
- El-Eskandarany, M.S.; Aoki, K.; Suzuki, K. Calorimetric study of solid-state amorphization reaction of rod-milled AlxTa1-x alloy powders. J. Alloy. Compd. 1992, 186, 15–31. [Google Scholar] [CrossRef]
- Fukunaga, T.; Nakamura, K.; Suzuki, K.; Mizutani, U. Amorphization of immiscible CuTa system by mechanical alloying and its structure observation. J. Non-Cryst. Solids 1990, 118, 700–703. [Google Scholar] [CrossRef]
- El-Eskandarany, M.S.; Aoki, K.; Suzuki, K. Difference between mechanical alloying and mechanical disordering in the amorphization reaction of Al50Ta50 in a rod mill. J. Alloy. Compd. 1991, 177, 229–244. [Google Scholar] [CrossRef]
- Suzuki, K. A structural study of the solid state vitrification of metals and oxides by ball milling. J. Non-Cryst. Solids 1989, 112, 23–32. [Google Scholar] [CrossRef]
- Gates, B.D.; Qiaobing, X.; Stewart, M.; Ryan, D.; Willson, C.G.; Whitesides, G.M. New approaches to nanofabrication: Molding, printing, and other techniques. Chem. Rev. 2005, 105, 1171–1196. [Google Scholar] [CrossRef]
- Xiao, J.; Li, J.L.; Liu, P.; Yang, G.W. A new phase transformation path from nanodiamond to new-diamond via an intermediate carbon onion. Nanoscale 2014, 6, 15098–15106. [Google Scholar] [CrossRef] [PubMed]
- Bovenkerk, H.; Bundy, F.; Hall, H.; Strong, H.M.; Wentorf, R.H. Preparation of diamond. Nature 1959, 184, 1094–1098. [Google Scholar] [CrossRef]
- Danilenko, V.V. On the history of the discovery of nanodiamond synthesis. Phys. Solid State 2004, 46, 595–599. [Google Scholar] [CrossRef]
- Yang, G.W.; Wang, J.B.; Liu, Q.X. Preparation of nano-crystalline diamonds using pulsed laser induced reactive quenching. J. Phys. Condens. Matter 1998, 10, 7923–7929. [Google Scholar] [CrossRef]
- Frenklach, M.; Howard, W.; Huang, D.; Yuan, J.; Spear, K.E.; Koba, R. High-pressure synthesis of superhard and ultrahard materials. Appl. Phys. Lett. 1991, 59, 546–548. [Google Scholar] [CrossRef]
- Mochalin, V.N.; Shenderova, O.; Ho, D.; Gogotsi, Y. The properties and applications of nanodiamonds. Nat. Nanotechnol. 2012, 7, 11–23. [Google Scholar] [CrossRef] [PubMed]
- Welz, S.; Gogotsi, Y.; McNallan, M.J. Nucleation, growth, and graphitization of diamond nanocrystals during chlorination of carbides. Appl. Phys. 2003, 93, 4207–4209. [Google Scholar] [CrossRef]
- Daulton, T.L.; Kirk, M.A.; Lewis, R.S.; Rehn, L.E. Production of nanodiamonds by high-energy ion irradiation of graphite at room temperature. Nucl. Instrum. Methods B 2001, 175, 12–20. [Google Scholar] [CrossRef]
- Sun, L.T.; Gong, J.L.; Zhu, Z.Y.; Zhu, D.Z.; He, S.X.; Wang, Z.X.; Chen, Y.; Hu, G. Nanocrystalline diamond from carbon nanotubes. Appl. Phys. Lett. 2004, 84, 2901–2903. [Google Scholar] [CrossRef] [Green Version]
- Caudillo, R.; Troiani, H.E.; Miki-Yoshida, M.; Marques, M.A.L.; Rubio, A.; Yacaman, M.J. A viable way to tailor carbon nanomaterials by irradiation-induced transformations. Radiat. Phys. Chem. 2005, 73, 334–339. [Google Scholar] [CrossRef]
- Xiao, J.; Ouyang, G.; Liu, P.; Wang, C.X.; Yang, G.W. Reversible nanodiamond-carbon onion phase transformations. Nano Lett. 2014, 14, 3645–3652. [Google Scholar] [CrossRef]
- Du, G.; Song, C.; Zhao, J.; Feng, S.; Zhu, Z. Solid-phase transformation of glass-like carbon nanoparticles into nanotubes and the related mechanism. Carbon 2008, 46, 92–98. [Google Scholar] [CrossRef]
- Barnard, A.S.; Russo, S.P.; Snook, I.K. Coexistence of bucky diamond with nanodiamond and fullerene carbon phases. Phys. Rev. B 2003, 68, 073406. [Google Scholar] [CrossRef]
- Tyler, T.; Zhirnov, V.V.; Kvit, A.V.; Kang, D.; Hren, J.J. Electron emission from diamond nanoparticles on metal tips. Appl. Phys. Lett. 2003, 82, 2904–2906. [Google Scholar] [CrossRef]
- Frenklach, M.; Chang, R.P.H. Nucleation of diamond films on surfaces using carbon clusters. Appl. Phys. Lett. 1991, 59, 546–548. [Google Scholar] [CrossRef]
- Vandenbulcke, L.; Gries, T.; Rouzaud, J.N. Nanodiamonds in dusty low pressure plasmas. Appl. Phys. Lett. 2009, 94. [Google Scholar] [CrossRef]
- Zheng, J.; Lienhard, B.; Doerk, G.; Cotlet, M.; Bersin, E.; Kim, H.S.; Byun, Y.C.; Nam, C.Y.; Kim, J.; Black, C.T.; et al. Top-down fabrication of high-uniformity nanodiamonds by self-assembled block copolymer masks. Sci. Rep. 2019, 9, 6914. [Google Scholar] [CrossRef] [Green Version]
- Greiner, N.R.; Phillips, D.S.; Johnson, J.D.; Volk, F. Diamonds in detonation soot. Nature 1988, 333, 440–442. [Google Scholar] [CrossRef]
- Zhou, A.F.; Pacheco, E.; Zhou, B.; Feng, P.X. Size-Dependent Electrical Transport Properties in Conducting Diamond Nanostripes. Nanomaterials 2021, 11, 1765. [Google Scholar] [CrossRef] [PubMed]
- El-Eskandarany, M.S. Method for Synthesizing Nanodiamonds. US Patent 9,540, 245B1, 10 January 2017. [Google Scholar]
- Yan, Z.X.; Cai, M.; Shen, P.K. Nanosized tungsten carbide synthesized by a novel route at low temperature for high performance electrocatalysis. Sci. Rep. 2013, 3, 1646. [Google Scholar] [CrossRef] [Green Version]
- El-Eskandarany, M.S. Fabrication of nanocrystalline WC and nanocomposite refractory materials at room temperature. J. Alloy. Compd. 2000, 296, 175–182. [Google Scholar] [CrossRef]
- El-Eskandarany, M.S.; El-Mahdy, A.A.; Ahmed, H.A.; Amer, A.A. Synthesis and characterizations of ball-milled nanocrystalline wc and nanocomposite WC-Co powders and subsequent consolidations. J. Alloy. Compd. 2000, 312, 315–325. [Google Scholar] [CrossRef]
- Bicho, R.C.; Scott-Fordsm, J.J.; Mónica, J.B.A. Multigenerational Exposure to WCCo Nanomaterials—Epigenetics in the Soil Invertebrate Enchytraeus crypticus. Nanomaterials 2020, 10, 836. [Google Scholar] [CrossRef] [PubMed]
- Li, W.; Yang, X.; Xiao, J.; Hou, Q. Effect of WC mass fraction on the microstructure and friction properties of WC/Ni60 laser cladding layer of brake discs. Ceram. Int. 2021, 47, 28754–28763. [Google Scholar] [CrossRef]
- El-Eskandarany, M.S.; Al-Hazza, A.; Al-Hajji, A.A. HRTEM and nanoindentation studies of bulk WC nanocrystalline materials prepared by spark plasma sintering of ball-milled powders. J. Mater. Eng. Perform. 2017, 26, 124–133. [Google Scholar] [CrossRef]
- Maier, K.; Klünsner, T.; Krobath, M.; Pichler, P.; Marsoner, S.; Echer, W.; Czettl, C.; Schäfer, J.; Ebner, R. Creep behavior of WC-12 wt% Co hardmetals with different WC grain sizes tested in uniaxial tensile and compression step-loading tests at 700 °C and 800 °C. Int. J. Refract. Met. Hard Mater. 2021, 100, 105633. [Google Scholar] [CrossRef]
- El-Eskandarany, M.S.; Omori, M.; Ishikuro, M.; Konno, T.J.; Takada, K.; Sumiyama, K.; Hirai, T.; Suzuki, K. Synthesis of full-density nanocrystalline tungsten carbide by reduction of tungstic oxide at room temperature. Met. Trans. A 1996, 27, 4210–4213. [Google Scholar] [CrossRef]
- Enneti, R.K. Synthesis of nanocrystalline tungsten and tungsten carbide powders in a single step via thermal plasma technique. Int. J. Refract. Met. Hard Mater. 2015, 53. [Google Scholar] [CrossRef]
- Fang, Z.Z.; Wang, X.; Ryu, T.; Hwang, K.S.; Sohn, H.Y. Synthesis, sintering, and mechanical properties of nanocrystalline cemented tungsten carbide—A review. Int. J. Refract. Met. Hard Mater. 2009, 27, 288–299. [Google Scholar] [CrossRef]
- Fecht, H.J. Nanostructure formation by mechanical attrition. Nanostructured Mater. 1995, 6, 33–42. [Google Scholar] [CrossRef]
- Maizza, G.; Grasso, S.; Sakka, Y.; Noda, T.; Ohashi, O. Relation between microstructure, properties and spark plasma sintering (SPS) parameters of pure ultrafine WC powder. Sci. Technol. Adv. Mater. 2007, 8, 644–654. [Google Scholar] [CrossRef] [Green Version]
- Zhang, J.S.; Liu, X.J.; Cui, H.; Duan, X.J.; Sun, Z.Q.; Chen, G.L. Microstructure and properties of spray-deposited 2014+15 vol pct SiC particulate-reinforced metal matrix composite. Metall. Trans. A 1997, 28, 1261. [Google Scholar] [CrossRef]
- El-Eskandarany, M.S. Mechanical solid state mixing for synthesizing of SiCp/Al nanocomposites. J. Alloy. Compd. 1998, 279, 263–271. [Google Scholar] [CrossRef]
- Suryanarayana, C.; Al-Aqeeli, N. Mechanically Alloyed nanocomposites. Prog. Mater. Sci. 2013, 58, 383–502. [Google Scholar] [CrossRef]
- Guozhong, C. Nanostructures and Nanomaterials: Synthesis, Properties and Applications, 1st ed.; Imperial College Press: London, UK, 2004. [Google Scholar]
- Raihanuzzaman, R.M.; Han, S.-T.; Ghomashchi, R.; Kim, H.-S.; Hong, S.-J. Conventional sintering of WC with nano-sized Co binder: Characterization and mechanical behavior. Int. J. Refract. Met. Hard Mater. 2015, 53, 2–6. [Google Scholar] [CrossRef]
- Su, W.; Sun, Y.; Wang, H.; Zhang, X.; Ruan, J. Preparation and sintering of WC–Co composite powders for coarse grained WC–8Co hardmetals. Int. J. Refract. Met. Hard Mater. 2014, 45, 80–85. [Google Scholar] [CrossRef]
- Zheng, D.; Li, X.; Ai, X.; Yang, C.; Li, Y. WC–Si3N4 composites prepared by two-step spark plasma sintering. Int. J. Refract. Met. Hard Mater. 2015, 50, 133–139. [Google Scholar] [CrossRef]
- Engqvist, H.; Botton, G.A.; Axe’n, N.; Hogmark, S. A study of grain boundaries in a binderless cemented carbide. Int. J. Refract. Met. Hard Mater. 1998, 16, 309–313. [Google Scholar] [CrossRef]
- El-Eskandarany, M.S.; Omori, M.; Konno, T.J.; Sumiyama, K.; Hirai, T.; Suzuki, K. Synthesizing of nanocomposite WC/MgO powders by mechanical solid state reduction and subsequent plasma activated sintering. Metall. Mater. Trans. A 2001, 32, 157–164. [Google Scholar] [CrossRef]
- El-Eskandarany, M.S. Top-down approach accompanied with mechanical solid-state mixing for producing nanocomposite WC/Al2O3 materials. Int. J. Nanoparticles 2009, 2, 14–22. [Google Scholar]
- El-Eskandarany, M.S.; Al-Hazza, A.; Al-Hajji, A.A. Mechanically assisted solid-state mixing and spark plasma sintering for fabrication of bulk nanocomposite (WC/7(10Co/4Cr))-Based ZrO2 systems. J. Mater. Eng. Perform. 2017, 26, 1540–1550. [Google Scholar] [CrossRef]
- Calka, A.; Williams, J.S. Synthesis of nitrides by mechanical alloying. Mater. Sci. Forum. 1992, 88–90, 787–794. [Google Scholar] [CrossRef]
- El-Eskandarany, M.S.; Sumiyama, K.; Aoki, K.; Suzuki, K. Reactive ball mill for solid state synthesis of metal nitrides powder mater. Mater. Sci. Forum. 1992, 88–90, 801–808. [Google Scholar] [CrossRef]
- El-Eskandarany, M.S. Reactive ball milling to fabricate nanocrystalline titanium nitride powders and their subsequent consolidation using SPS. J. Mater. Eng. Perform. 2017, 26, 2954–2962. [Google Scholar] [CrossRef]
- Nakamura, K.; Inagawa, K.; Tsuruoka, K.; Komiya, S. Applications of wear-resistant thick films formed by physical vapor deposition processes. Thin Solid Film. 1977, 40, 155–167. [Google Scholar] [CrossRef]
- Deevi, S.; Munir, Z.A. The mechanism of synthesis of titanium nitride by self-sustaining reactions. J. Mater. Res. 1990, 5, 2177–2183. [Google Scholar] [CrossRef]
- Fiordalic, R.W.; Hegde, R.I.; Kawasaki, H. Orientation control of chemical vapor deposition TiN film for barrier applications. J. Electrochem. Soc. 1996, 143, 2059–2063. [Google Scholar] [CrossRef]
- Sreedhara, S.S.; Joardar, J.; Ravula, V.; Tata, N.R. Preparation and characterization of nanoboron by cryo-milling. Adv. Powder Technol. 2020, 31, 3824–3832. [Google Scholar] [CrossRef]
- Femi, O.E.; Elangovan, H.; Mukherjee, S.; Tripathi, S.; Chattopadhyay, K. Thermoelectric properties of BiSbTe-type alloys prepared by chill-casting and cryo-milling. Mater. Chem. Phys. 2021, 260. [Google Scholar] [CrossRef]
- Volnistem, E.A.; Leonardo, J.M.P.; Silva, V.S.; Silva, D.M.; Dias, G.S.; Cótica, L.F.; Santo, I.A. Tuning the magnetic response of cryo-milled BiFeO3 nanoparticles by controlling crystallite sizes and internal strain. Powder Technol. 2019, 347, 215–219. [Google Scholar] [CrossRef]
- Shanmugasundaram, T.; Guyon, J.; Monchoux, J.P.; Hazotte, A.; Bouzy, E. On grain refinement of a γ-TiAl alloy using cryo-milling followed by spark plasma sintering. Intermetallics 2015, 66, 141–148. [Google Scholar] [CrossRef]
- Niwa, T.; Nakanishi, Y.; Danjo, K. One-step preparation of pharmaceutical nanocrystals using ultra cryo-milling technique in liquid nitrogen. Eur. J. Pharm. Sci. 2010, 41, 78–85. [Google Scholar] [CrossRef]
- Genç, A. Facile synthesis of ZnO nanostructures and enhancement of their sinterability via short-time cryo-milling. Ceram. Int. 2017, 43, 1710–1715. [Google Scholar] [CrossRef]
- El-Eskandarany, M.S. Metallic glassy Zr70Ni20Pd10 powders for improving the hydrogenation/dehydrogenation behavior of MgH2. Sci. Rep. 2016, 6, 26936. Available online: www.nature.com/scientificreports (accessed on 9 September 2021). [CrossRef] [PubMed]


Publisher’s Note: MDPI stays neutral with regard to jurisdictional claims in published maps and institutional affiliations. |
© 2021 by the authors. Licensee MDPI, Basel, Switzerland. This article is an open access article distributed under the terms and conditions of the Creative Commons Attribution (CC BY) license (https://creativecommons.org/licenses/by/4.0/).
Share and Cite
El-Eskandarany, M.S.; Al-Hazza, A.; Al-Hajji, L.A.; Ali, N.; Al-Duweesh, A.A.; Banyan, M.; Al-Ajmi, F. Mechanical Milling: A Superior Nanotechnological Tool for Fabrication of Nanocrystalline and Nanocomposite Materials. Nanomaterials 2021, 11, 2484. https://doi.org/10.3390/nano11102484
El-Eskandarany MS, Al-Hazza A, Al-Hajji LA, Ali N, Al-Duweesh AA, Banyan M, Al-Ajmi F. Mechanical Milling: A Superior Nanotechnological Tool for Fabrication of Nanocrystalline and Nanocomposite Materials. Nanomaterials. 2021; 11(10):2484. https://doi.org/10.3390/nano11102484
Chicago/Turabian StyleEl-Eskandarany, M. Sherif, Abdulsalam Al-Hazza, Latifa A. Al-Hajji, Naser Ali, Ahmed A. Al-Duweesh, Mohammad Banyan, and Fahad Al-Ajmi. 2021. "Mechanical Milling: A Superior Nanotechnological Tool for Fabrication of Nanocrystalline and Nanocomposite Materials" Nanomaterials 11, no. 10: 2484. https://doi.org/10.3390/nano11102484
APA StyleEl-Eskandarany, M. S., Al-Hazza, A., Al-Hajji, L. A., Ali, N., Al-Duweesh, A. A., Banyan, M., & Al-Ajmi, F. (2021). Mechanical Milling: A Superior Nanotechnological Tool for Fabrication of Nanocrystalline and Nanocomposite Materials. Nanomaterials, 11(10), 2484. https://doi.org/10.3390/nano11102484