Graphene Nanoparticle-Based, Nitrate Ion Sensor Characteristics

 ,
,  ,
,  and
and 
Abstract
1. Introduction
2. Experimental Measurements
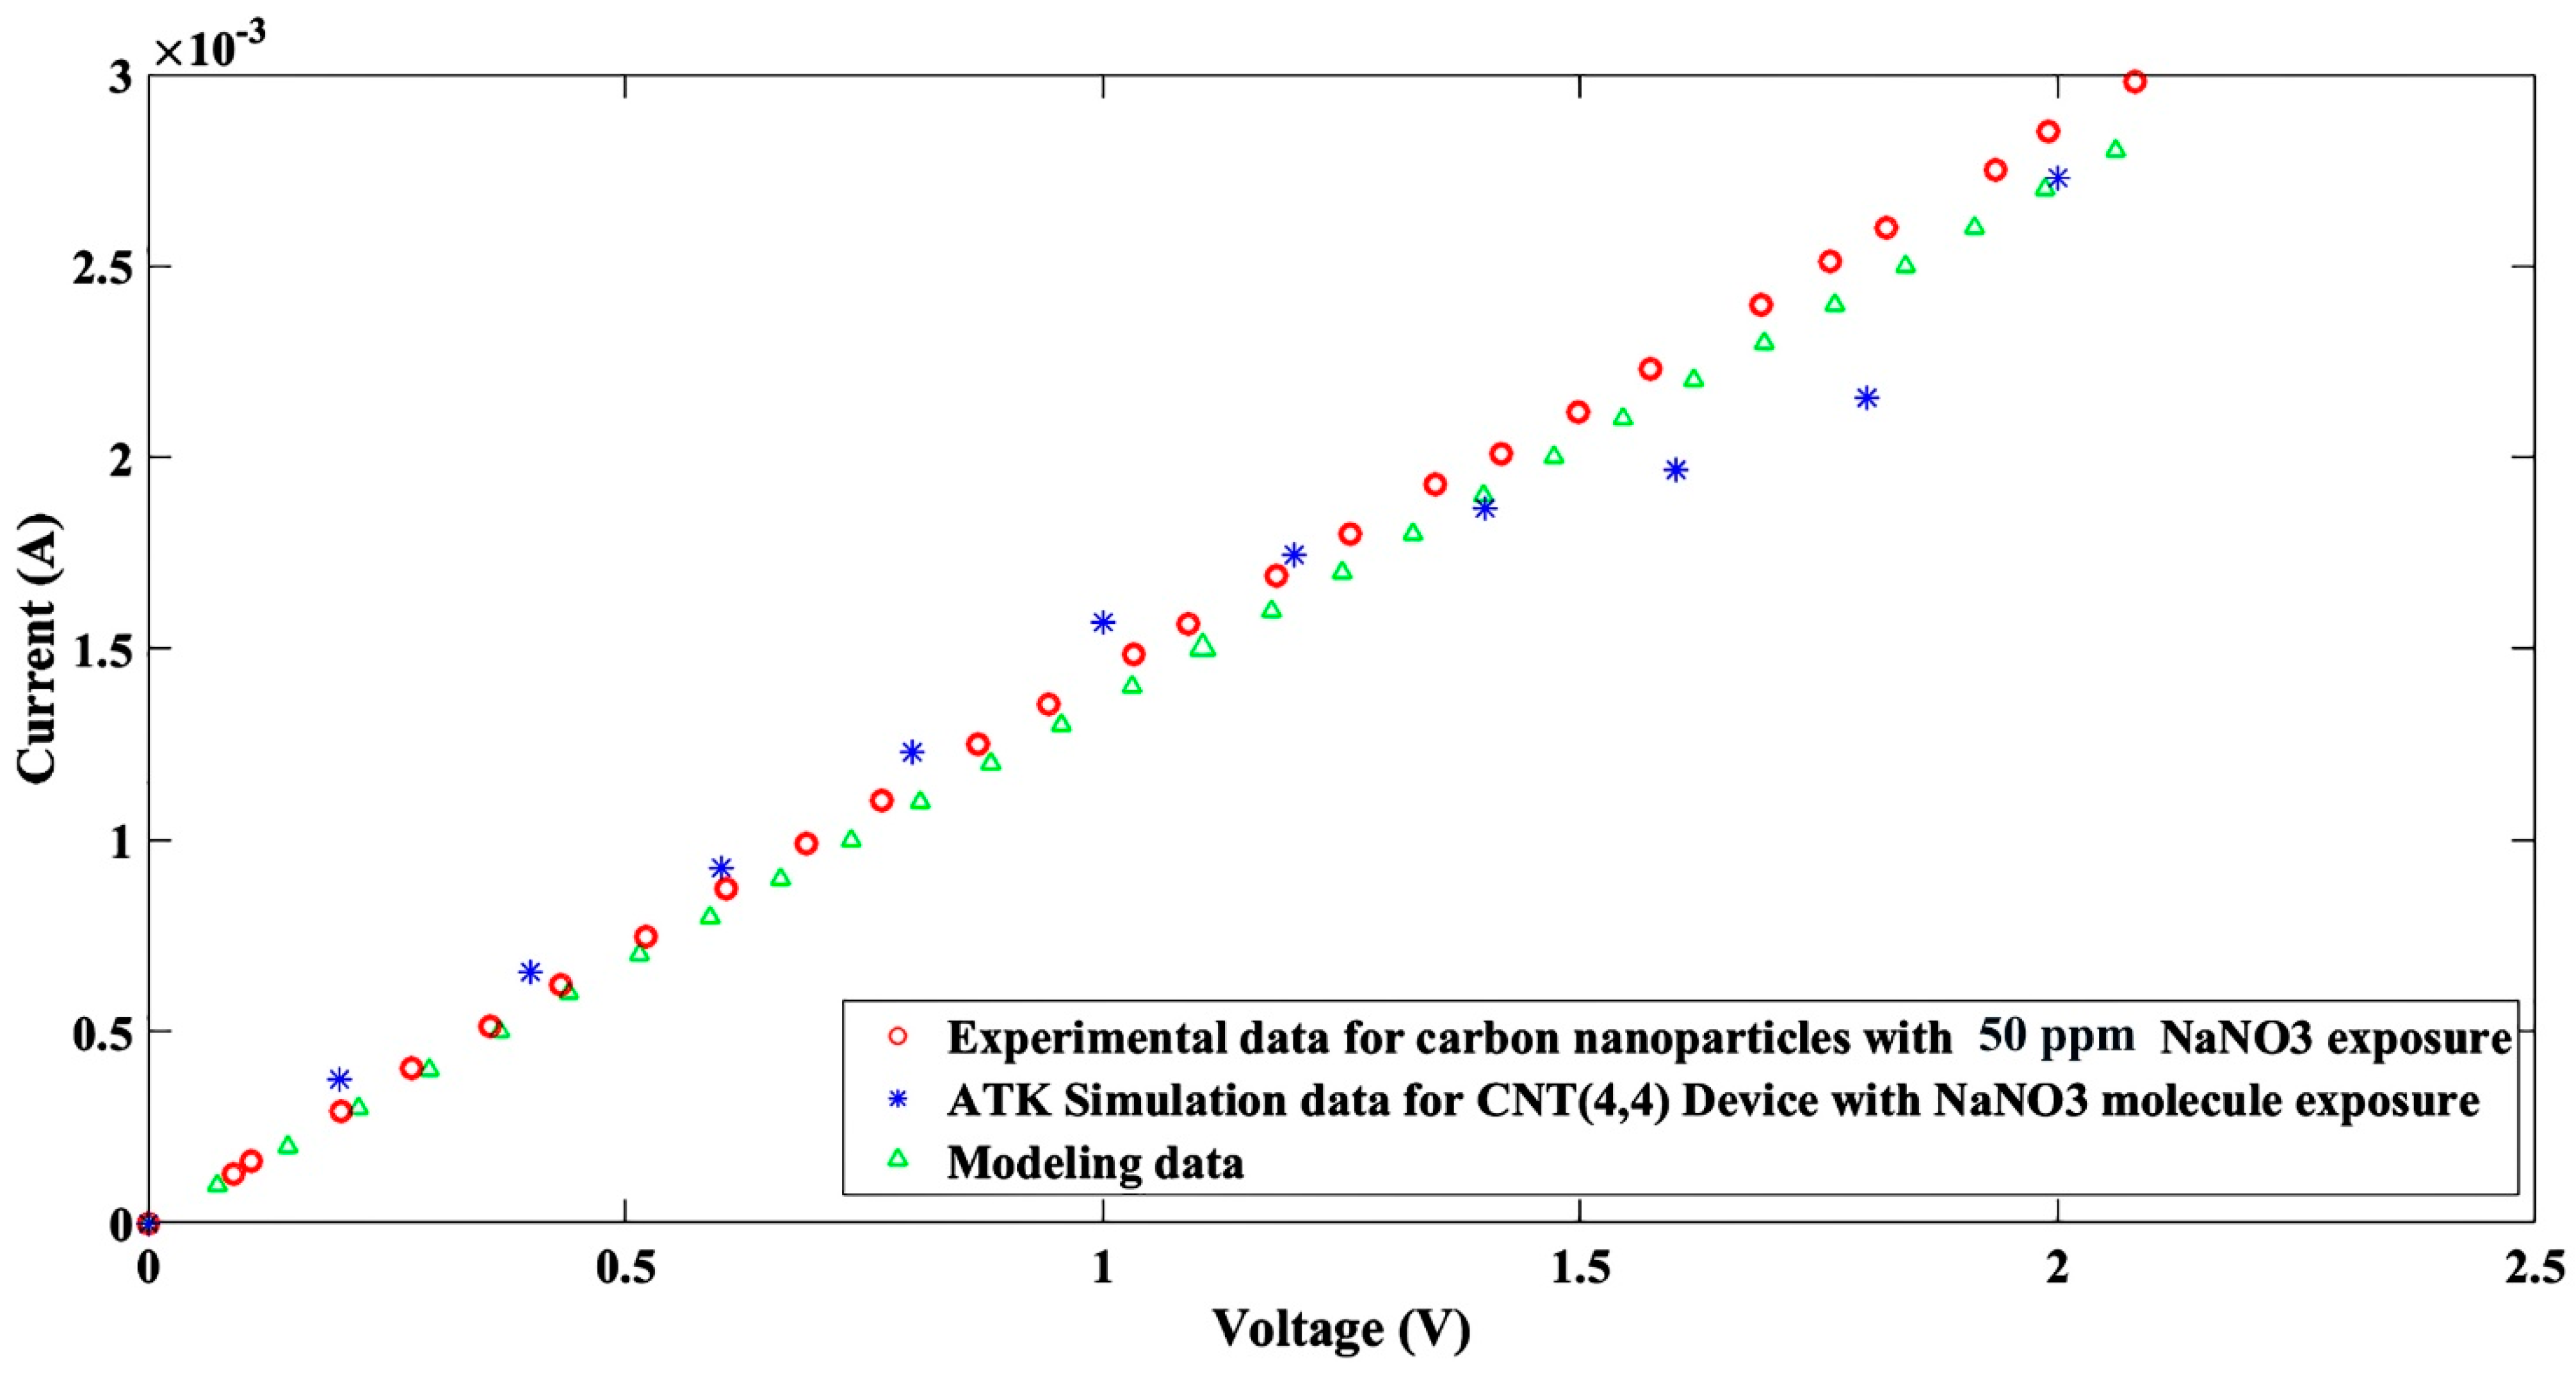
3. Simulation Study
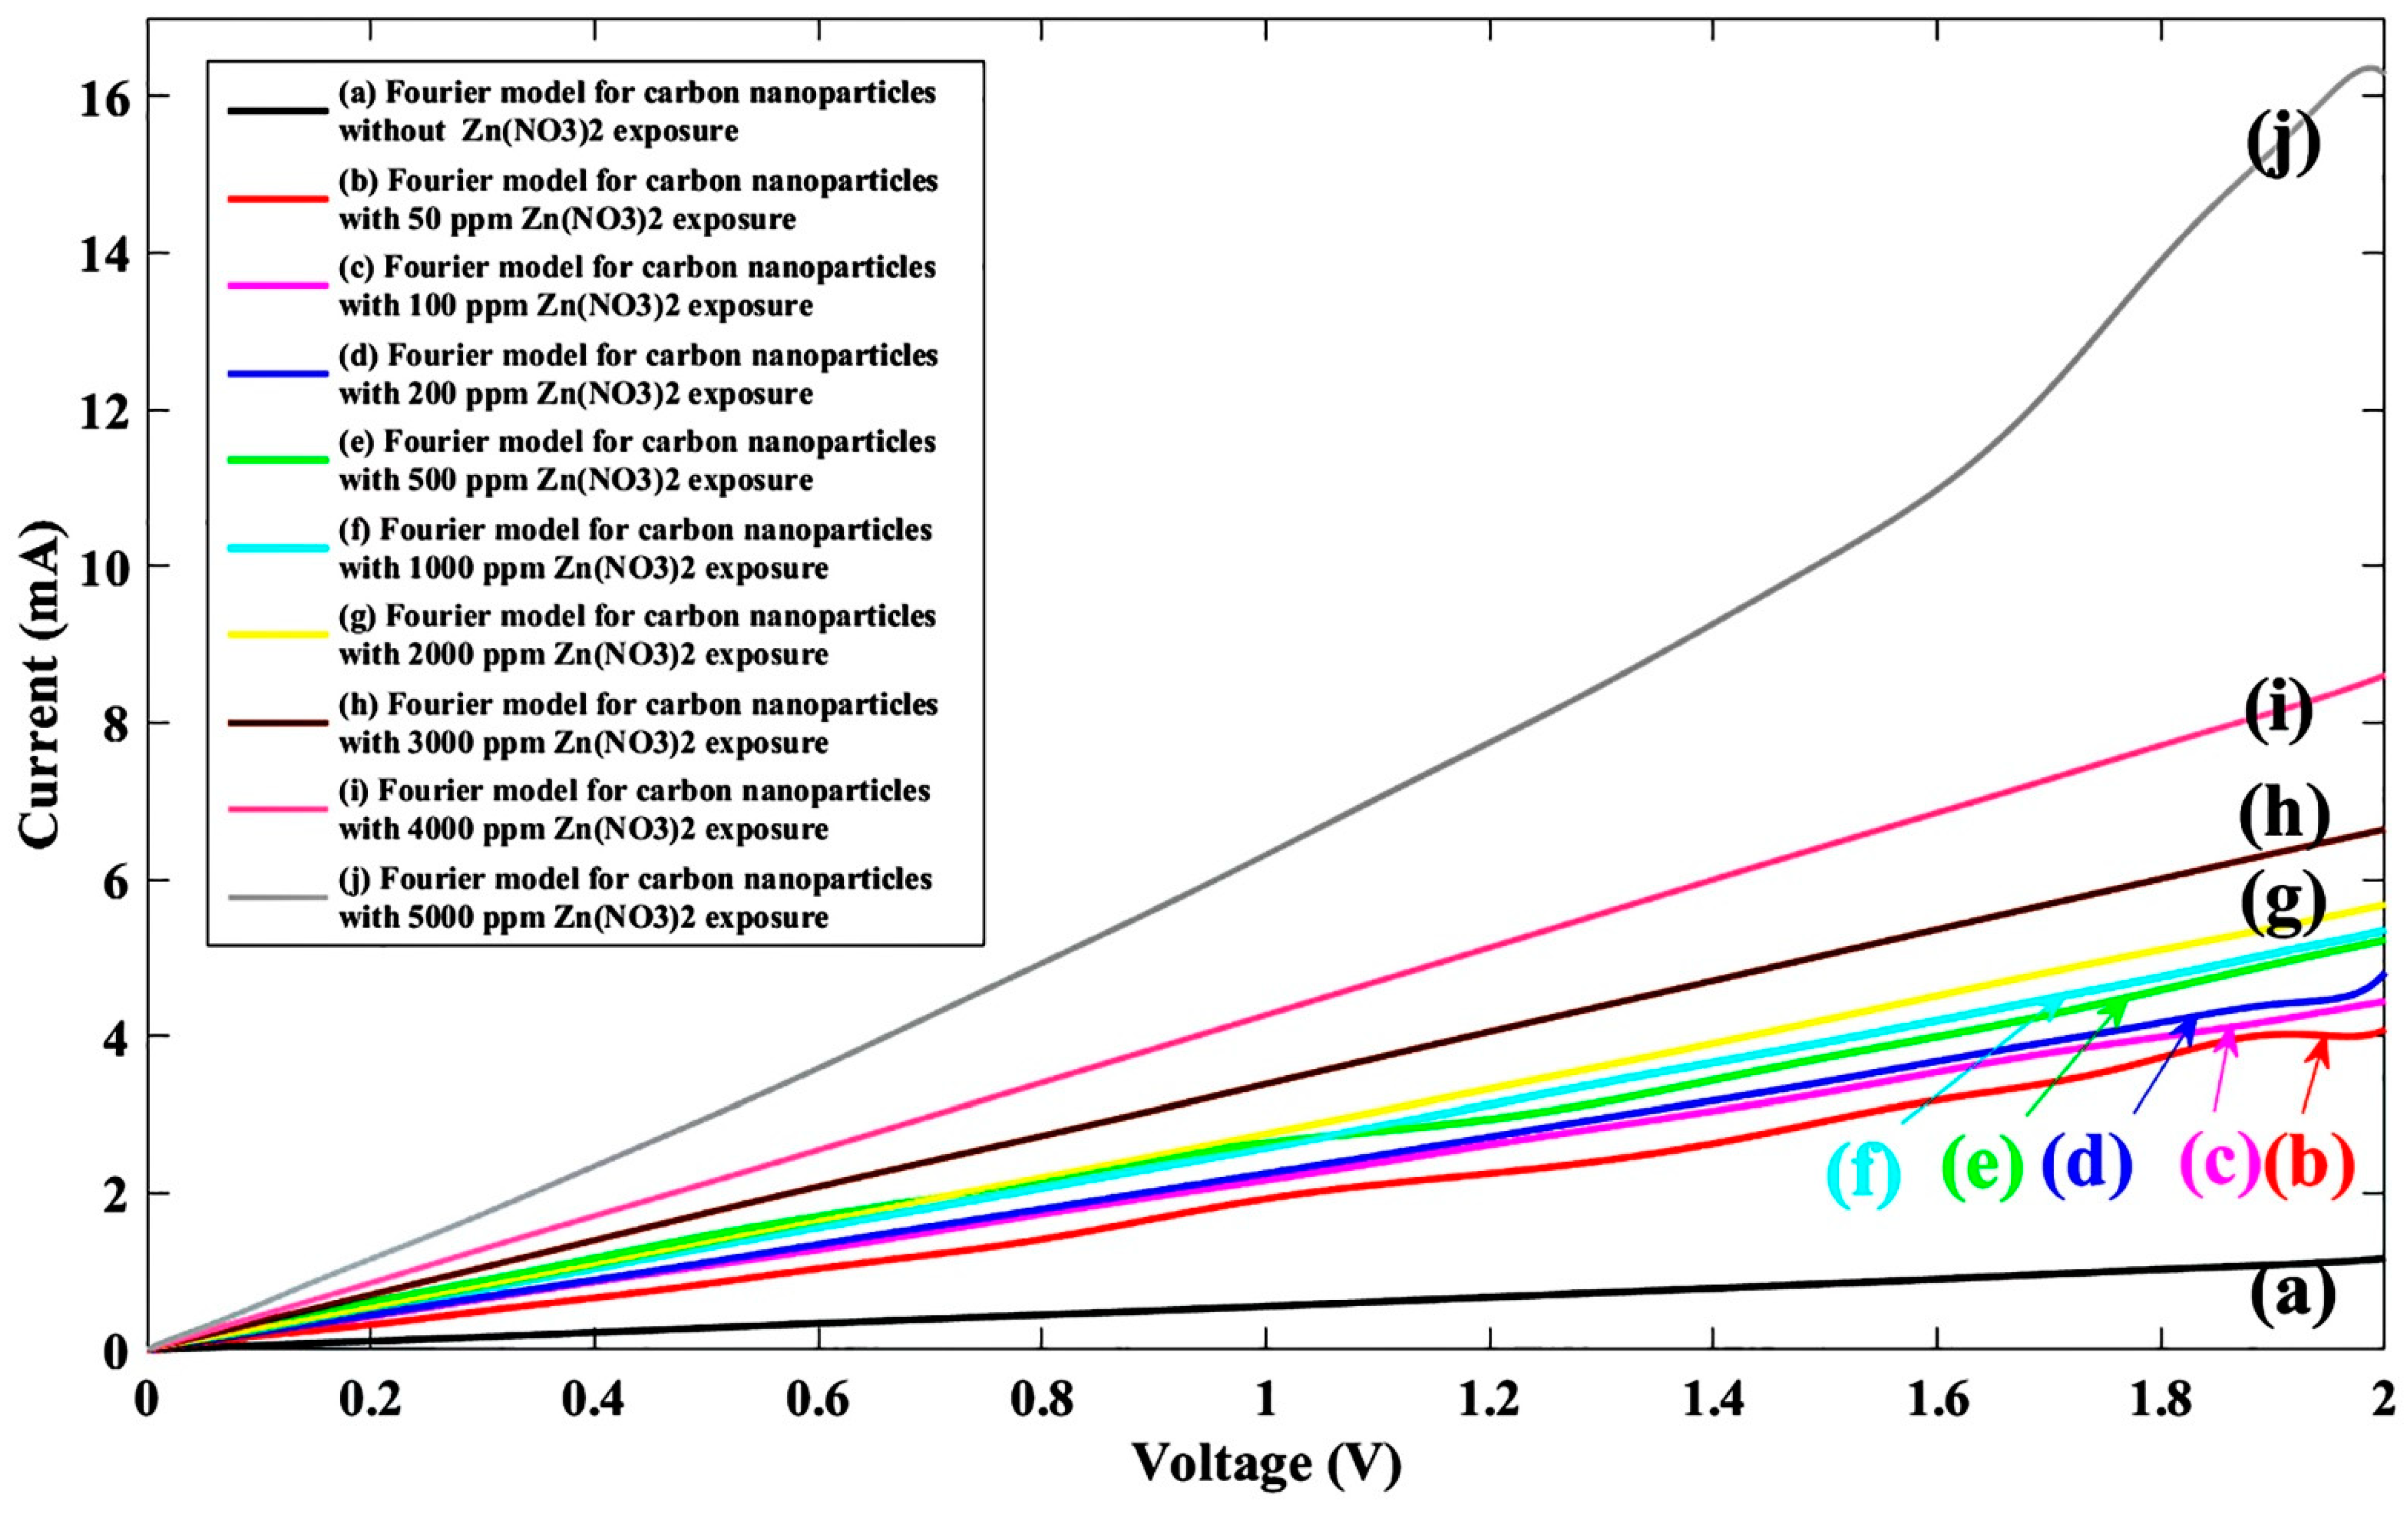
4. Results and Discussion
5. Conclusions
Author Contributions
Funding
Institutional Review Board Statement
Informed Consent Statement
Data Availability Statement
Acknowledgments
Conflicts of Interest
Abbreviations
| High-Density Polyethylene | (HDPE) |
| Nano-Particles | (GNPs) |
| Metal–Nanoparticle–Metal | (MNM) |
| Current-Voltage | (I-V) |
| Plane to Plane | (PTP) |
| Tip to Plane | (TTP) |
| Tip to Tip | (TTT) |
| Scanning Electron Microscope | (SEM) |
| Fourier-Transform Infrared spectroscopy | (FTIR) |
| Carbon Nanotubes | (CNTs) |
| Multiwall Carbon Nanotubes | (MWCNTs) |
| Ammonium Nitrate | (AN) |
| Carbon Nanotube Field Effect Transistor | (CNTFET) |
Appendix A


References
- Johnson, C.J.; Kross, B.C. Continuing importance of nitrate contamination of groundwater and wells in rural areas. Am. J. Ind. Med. 1990, 18, 449–456. [Google Scholar] [CrossRef]
- Wakida, F.T.; Lerner, D.N. Non-agricultural sources of groundwater nitrate: A review and case study. Water Res. 2005, 39, 3–16. [Google Scholar] [CrossRef]
- Alagha, O.; Manzar, M.S.; Zubair, M.; Anil, I.; Mu’Azu, N.D.; Qureshi, A. Comparative Adsorptive Removal of Phosphate and Nitrate from Wastewater Using Biochar-MgAl LDH Nanocomposites: Coexisting Anions Effect and Mechanistic Studies. Nanomaterials 2020, 10, 336. [Google Scholar] [CrossRef]
- Brender, J.D.; Olive, J.M.; Felkner, M.; Suarez, L.; Marckwardt, W.; Hendricks, K.A. Dietary Nitrites and Nitrates, Nitrosatable Drugs, and Neural Tube Defects. Epidemiology 2004, 15, 330–336. [Google Scholar] [CrossRef]
- Daniel, W.L.; Han, M.S.; Lee, J.S.; Mirkin, C.A. Colorimetric Nitrite and Nitrate Detection with Gold Nanoparticle Probes and Kinetic End Points. J. Am. Chem. Soc. 2009, 131, 6362–6363. [Google Scholar] [CrossRef]
- Greer, F.R.; Shannon, M. Infant Methemoglobinemia: The Role of Dietary Nitrate in Food and Water. Pediatrics 2005, 116, 784–786. [Google Scholar] [CrossRef]
- Squillace, P.J.; Scott, J.C.; Moran, M.J.; Nolan, B.T.; Kolpin, D.W. VOCs, Pesticides, Nitrate, and Their Mixtures in Groundwater Used for Drinking Water in the United States. Environ. Sci. Technol. 2002, 36, 1923–1930. [Google Scholar] [CrossRef]
- Focazio, M.J.; Tipton, D.; Shapiro, S.D.; Geiger, L.H. The Chemical Quality of Self-Supplied Domestic Well Water in the United States. Ground Water Monit. Remediat. 2006, 26, 92–104. [Google Scholar] [CrossRef]
- Chon, K.; Lee, Y.; Traber, J.; Von Gunten, U. Quantification and characterization of dissolved organic nitrogen in wastewater effluents by electrodialysis treatment followed by size-exclusion chromatography with nitrogen detection. Water Res. 2013, 47, 5381–5391. [Google Scholar] [CrossRef]
- Kodamatani, H.; Yamazaki, S.; Saito, K.; Tomiyasu, T.; Komatsu, Y. Selective determination method for measurement of nitrite and nitrate in water samples using high-performance liquid chromatography with post-column photochemical reaction and chemiluminescence detection. J. Chromatogr. A 2009, 1216, 3163–3167. [Google Scholar] [CrossRef]
- Afkhami, A.; Madrakian, T.; Ghaedi, H.; Khanmohammadi, H. Construction of a chemically modified electrode for the selective determination of nitrite and nitrate ions based on a new nanocomposite. Electrochim. Acta 2012, 66, 255–264. [Google Scholar] [CrossRef]
- Sachdeva, V.; Hooda, V. A new immobilization and sensing platform for nitrate quantification. Talanta 2014, 124, 52–59. [Google Scholar] [CrossRef] [PubMed]
- Kim, K.; Kim, K.L.; Shin, K.S. Selective detection of aqueous nitrite ions by surface-enhanced Raman scattering of 4-aminobenzenethiol on Au. Analyst 2012, 137, 3836–3840. [Google Scholar] [CrossRef] [PubMed]
- Ianoul, A.; Coleman, A.T.; Asher, S.A. UV Resonance Raman Spectroscopic Detection of Nitrate and Nitrite in Wastewater Treatment Processes. Anal. Chem. 2002, 74, 1458–1461. [Google Scholar] [CrossRef] [PubMed]
- Akyüz, M.; Ata, Ş. Determination of low level nitrite and nitrate in biological, food and environmental samples by gas chromatography–mass spectrometry and liquid chromatography with fluorescence detection. Talanta 2009, 79, 900–904. [Google Scholar] [CrossRef]
- Marom, H.; Popowski, Y.; Antonov, S.; Gozin, M. Toward the Development of the Direct and Selective Detection of Nitrates by a Bioinspired Mo–Cu System. Org. Lett. 2011, 13, 5532–5535. [Google Scholar] [CrossRef] [PubMed]
- Anazawa, K.; Shimotani, K.; Manabe, C.; Watanabe, H.; Shimizu, M. High-purity carbon nanotubes synthesis method by an arc discharging in magnetic field. Appl. Phys. Lett. 2002, 81, 739–741. [Google Scholar] [CrossRef]
- Iijima, S. Helical microtubules of graphitic carbon. Nat. Cell Biol. 1991, 354, 56–58. [Google Scholar] [CrossRef]
- Ötvös, Z.; Onyestyák, G.; Hancz, A.; Kiricsi, I.; Rees, L. Surface oxygen complexes as governors of neopentane sorption in multiwalled carbon nanotubes. Carbon 2006, 44, 1665–1672. [Google Scholar] [CrossRef]
- Chen, L.; Liu, C.; Liu, K.; Meng, C.; Hu, C.; Wang, J.; Fan, S. High-Performance, Low-Voltage, and Easy-Operable Bending Actuator Based on Aligned Carbon Nanotube/Polymer Composites. ACS Nano 2011, 5, 1588–1593. [Google Scholar] [CrossRef]
- Balasubramanian, K.; Burghard, M. Chemically Functionalized Carbon Nanotubes. Small 2005, 1, 180–192. [Google Scholar] [CrossRef] [PubMed]
- Marshall, M.W.; Popa-Nita, S.; Shapter, J.G. Measurement of functionalised carbon nanotube carboxylic acid groups using a simple chemical process. Carbon 2006, 44, 1137–1141. [Google Scholar] [CrossRef]
- Karousis, N.; Tagmatarchis, N.; Tasis, D. Current Progress on the Chemical Modification of Carbon Nanotubes. Chem. Rev. 2010, 110, 5366–5397. [Google Scholar] [CrossRef] [PubMed]
- Bikiaris, D.; Vassiliou, A.; Chrissafis, K.; Paraskevopoulos, K.; Jannakoudakis, A.; Docoslis, A. Effect of acid treated multi-walled carbon nanotubes on the mechanical, permeability, thermal properties and thermo-oxidative stability of isotactic polypropylene. Polym. Degrad. Stab. 2008, 93, 952–967. [Google Scholar] [CrossRef]
- Zhou, M.; Lu, Y.-H.; Cai, Y.-Q.; Zhang, C.; Feng, Y.-P. Adsorption of gas molecules on transition metal embedded graphene: A search for high-performance graphene-based catalysts and gas sensors. Nanotechnology 2011, 22, 385502. [Google Scholar] [CrossRef]
- Wen, X.; Fan, L.; Yang, S. Chemical assembly of nanostructured films for sensing applications. In Nanosensing: Materials and Devices; International Society for Optics and Photonics: Philadelphia, PA, USA, 2004; Volume 5593, pp. 152–167. [Google Scholar]
- Liu, J.B.; Chen, J.; Zhu, L.F.; She, J.C.; Deng, S.Z.; Xu, N.S. Conductivity of screen-printed carbon nanotube composite film and its sensitivity to organic gas. In Proceedings of the 2008 2nd IEEE International Nanoelectronics Conference, Shanghai, China, 24–27 March 2008; pp. 248–251. [Google Scholar]
- Akbari, E.; Buntat, Z.; Enzevaee, A.; Yazdi, M.K.; Bahadoran, M.; Nikoukar, A. Sensing and identification of carbon monoxide using carbon films fabricated by methane arc discharge decomposition technique. Nanoscale Res. Lett. 2014, 9, 402. [Google Scholar] [CrossRef]
- Neamen, D.A. Semiconductor Physics, and Devices: Basic Principles; McGraw-Hill: New York, NY, USA, 2012. [Google Scholar]
- Jilani, B.S.; Malathesh, P.; Mruthyunjayachari, C.D.; Reddy, K.V. Cobalt (II) tetra methyl-quinoline oxy bridged phthalocyanine carbon nano particles modified glassy carbon electrode for sensing nitrite: A voltammetric study. Mater. Chem. Phys. 2020, 239, 121920. [Google Scholar] [CrossRef]
- Hanane, K.; Messaoud, B.; Barhoumi, H.; Moncef, T. Highly sensitive modified glassy carbon sensor based on TDAN for nitrate detection in real water. Mon. Chem.—Chem. Mon. 2020, 151, 153–158. [Google Scholar] [CrossRef]
- SM Hassan, S.; Galal Eldin, A.; E Amr, A.E.G.; A Al-Omar, M.; H Kamel, A.; Khalifa, N.M. Improved Solid-Contact Nitrate Ion Selective Electrodes Based on Multi-Walled Carbon Nanotubes (MWCNTs) as an Ion-to-Electron Transducer. Sensors 2019, 19, 3891. [Google Scholar] [CrossRef]
- Wu, L.; Zhang, X.; Wang, M.; He, L.; Zhang, Z. Preparation of Cu2O/CNTs composite and its application as sensing platform for detecting nitrite in water environment. Measurement 2018, 128, 189–196. [Google Scholar] [CrossRef]
- Zhang, Y.; Nie, J.; Wei, H.; Xu, H.; Wang, Q.; Cong, Y.; Tao, J.; Chu, L.; Zhou, Y.; Wu, X. Electrochemical detection of nitrite ions using Ag/Cu/MWNT nanoclusters electrodeposited on a glassy carbon electrode. Sens. Actuators B Chem. 2018, 258, 1107–1116. [Google Scholar] [CrossRef]
- Hameed, R.A.; Medany, S.S. Sensitive nitrite detection at core-shell structured Cu@Pt nanoparticles supported on graphene. Appl. Surf. Sci. 2018, 458, 252–263. [Google Scholar] [CrossRef]
- Ghanei-Motlagh, M.; Taher, M.A. A novel electrochemical sensor based on silver/halloysite nanotube/molybdenum disulfide nanocomposite for efficient nitrite sensing. Biosens. Bioelectron. 2018, 109, 279–285. [Google Scholar] [CrossRef]
- Wan, Y.; Zheng, Y.F.; Wan, H.T.; Yin, H.Y.; Song, X.C. A novel electrochemical sensor based on Ag nanoparticles decorated multi-walled carbon nanotubes for applied determination of nitrite. Food Control. 2017, 73, 1507–1513. [Google Scholar] [CrossRef]
- Bagheri, H.; Hajian, A.; Rezaei, M.; Shirzadmehr, A. Composite of Cu metal nanoparticles-multiwall carbon nanotubes-reduced graphene oxide as a novel and high performance platform of the electrochemical sensor for simultaneous determination of nitrite and nitrate. J. Hazard. Mater. 2017, 324, 762–772. [Google Scholar] [CrossRef]
- Menart, E.; Jovanovski, V.; Hočevar, S.B. Silver particle-decorated carbon paste electrode based on ionic liquid for improved determination of nitrite. Electrochem. Commun. 2015, 52, 45–48. [Google Scholar] [CrossRef]
- Moon, Y.K.; Lee, J.; Lee, J.K.; Kim, T.K.; Kim, S.H. Synthesis of Length-Controlled Aerosol Carbon Nanotubes and Their Dispersion Stability in Aqueous Solution. Langmuir 2009, 25, 1739–1743. [Google Scholar] [CrossRef]
- Ding, W.; Eitan, A.; Fisher, F.T.; Chen, X.; Dikin, D.A.; Andrews, R.; Brinson, L.C.; Schadler, L.S.; Ruoff, R.S. Direct Observation of Polymer Sheathing in Carbon Nanotube−Polycarbonate Composites. Nano Lett. 2003, 3, 1593–1597. [Google Scholar] [CrossRef]
- Fadel, T.R.; Sharp, F.A.; Vudattu, N.; Ragheb, R.; Garyu, J.; Kim, D.; Hong, E.; Li, N.; Haller, G.L.; Pfefferle, L.D.; et al. A carbon nanotube–polymer composite for T-cell therapy. Nat. Nanotechnol. 2014, 9, 639–647. [Google Scholar] [CrossRef]
- Kasani, H.; Khodabakhsh, R.; Ahmadi, M.T.; Ochbelagh, D.R.; Ismail, R. Electrical Properties of MWCNT/HDPE Composite-Based MSM Structure Under Neutron Irradiation. J. Electron. Mater. 2017, 46, 2548–2555. [Google Scholar] [CrossRef]
- Ahmed, D.S.; Haider, A.J.; Mohammad, M. Comparesion of Functionalization of Multi-Walled Carbon Nanotubes Treated by Oil Olive and Nitric Acid and their Characterization. Energy Procedia 2013, 36, 1111–1118. [Google Scholar] [CrossRef]
- Tucureanu, V.; Matei, A.; Avram, A.M. FTIR Spectroscopy for Carbon Family Study. Crit. Rev. Anal. Chem. 2016, 46, 502–520. [Google Scholar] [CrossRef] [PubMed]
- Celia, E.; De Givenchy, E.T.; Amigoni, S.; Guittard, F. Three steps to organic–inorganic hybrid films showing superhydrophilic properties. Soft Matter 2011, 7, 10057–10062. [Google Scholar] [CrossRef]
- Cunha, C.; Panseri, S.; Iannazzo, D.; Piperno, A.; Pistone, A.; Fazio, M.; Russo, A.; Marcacci, M.; Galvagno, S. Hybrid composites made of multiwalled carbon nanotubes functionalized with Fe3O4nanoparticles for tissue engineering applications. Nanotechnology 2012, 23, 465102. [Google Scholar] [CrossRef] [PubMed]
- Stobinski, L.; Lesiak, B.; Kövér, L.; Tóth, J.; Biniak, S.; Trykowski, G.; Judek, J. Multiwall carbon nanotubes purification and oxidation by nitric acid studied by the FTIR and electron spectroscopy methods. J. Alloys Compd. 2010, 501, 77–84. [Google Scholar] [CrossRef]
- Goyanes, S.; Rubiolo, G.; Salazar, A.; Jimeno, A.; Corcuera, M.; Mondragon, I. Carboxylation treatment of multiwalled carbon nanotubes monitored by infrared and ultraviolet spectroscopies and scanning probe microscopy. Diam. Relat. Mater. 2007, 16, 412–417. [Google Scholar] [CrossRef]
- World Health Organization. Guidelines for Drinking-Water Quality: Incorporating First Addendum; World Health Organization: Geneva, Switzerland, 2017. [Google Scholar]


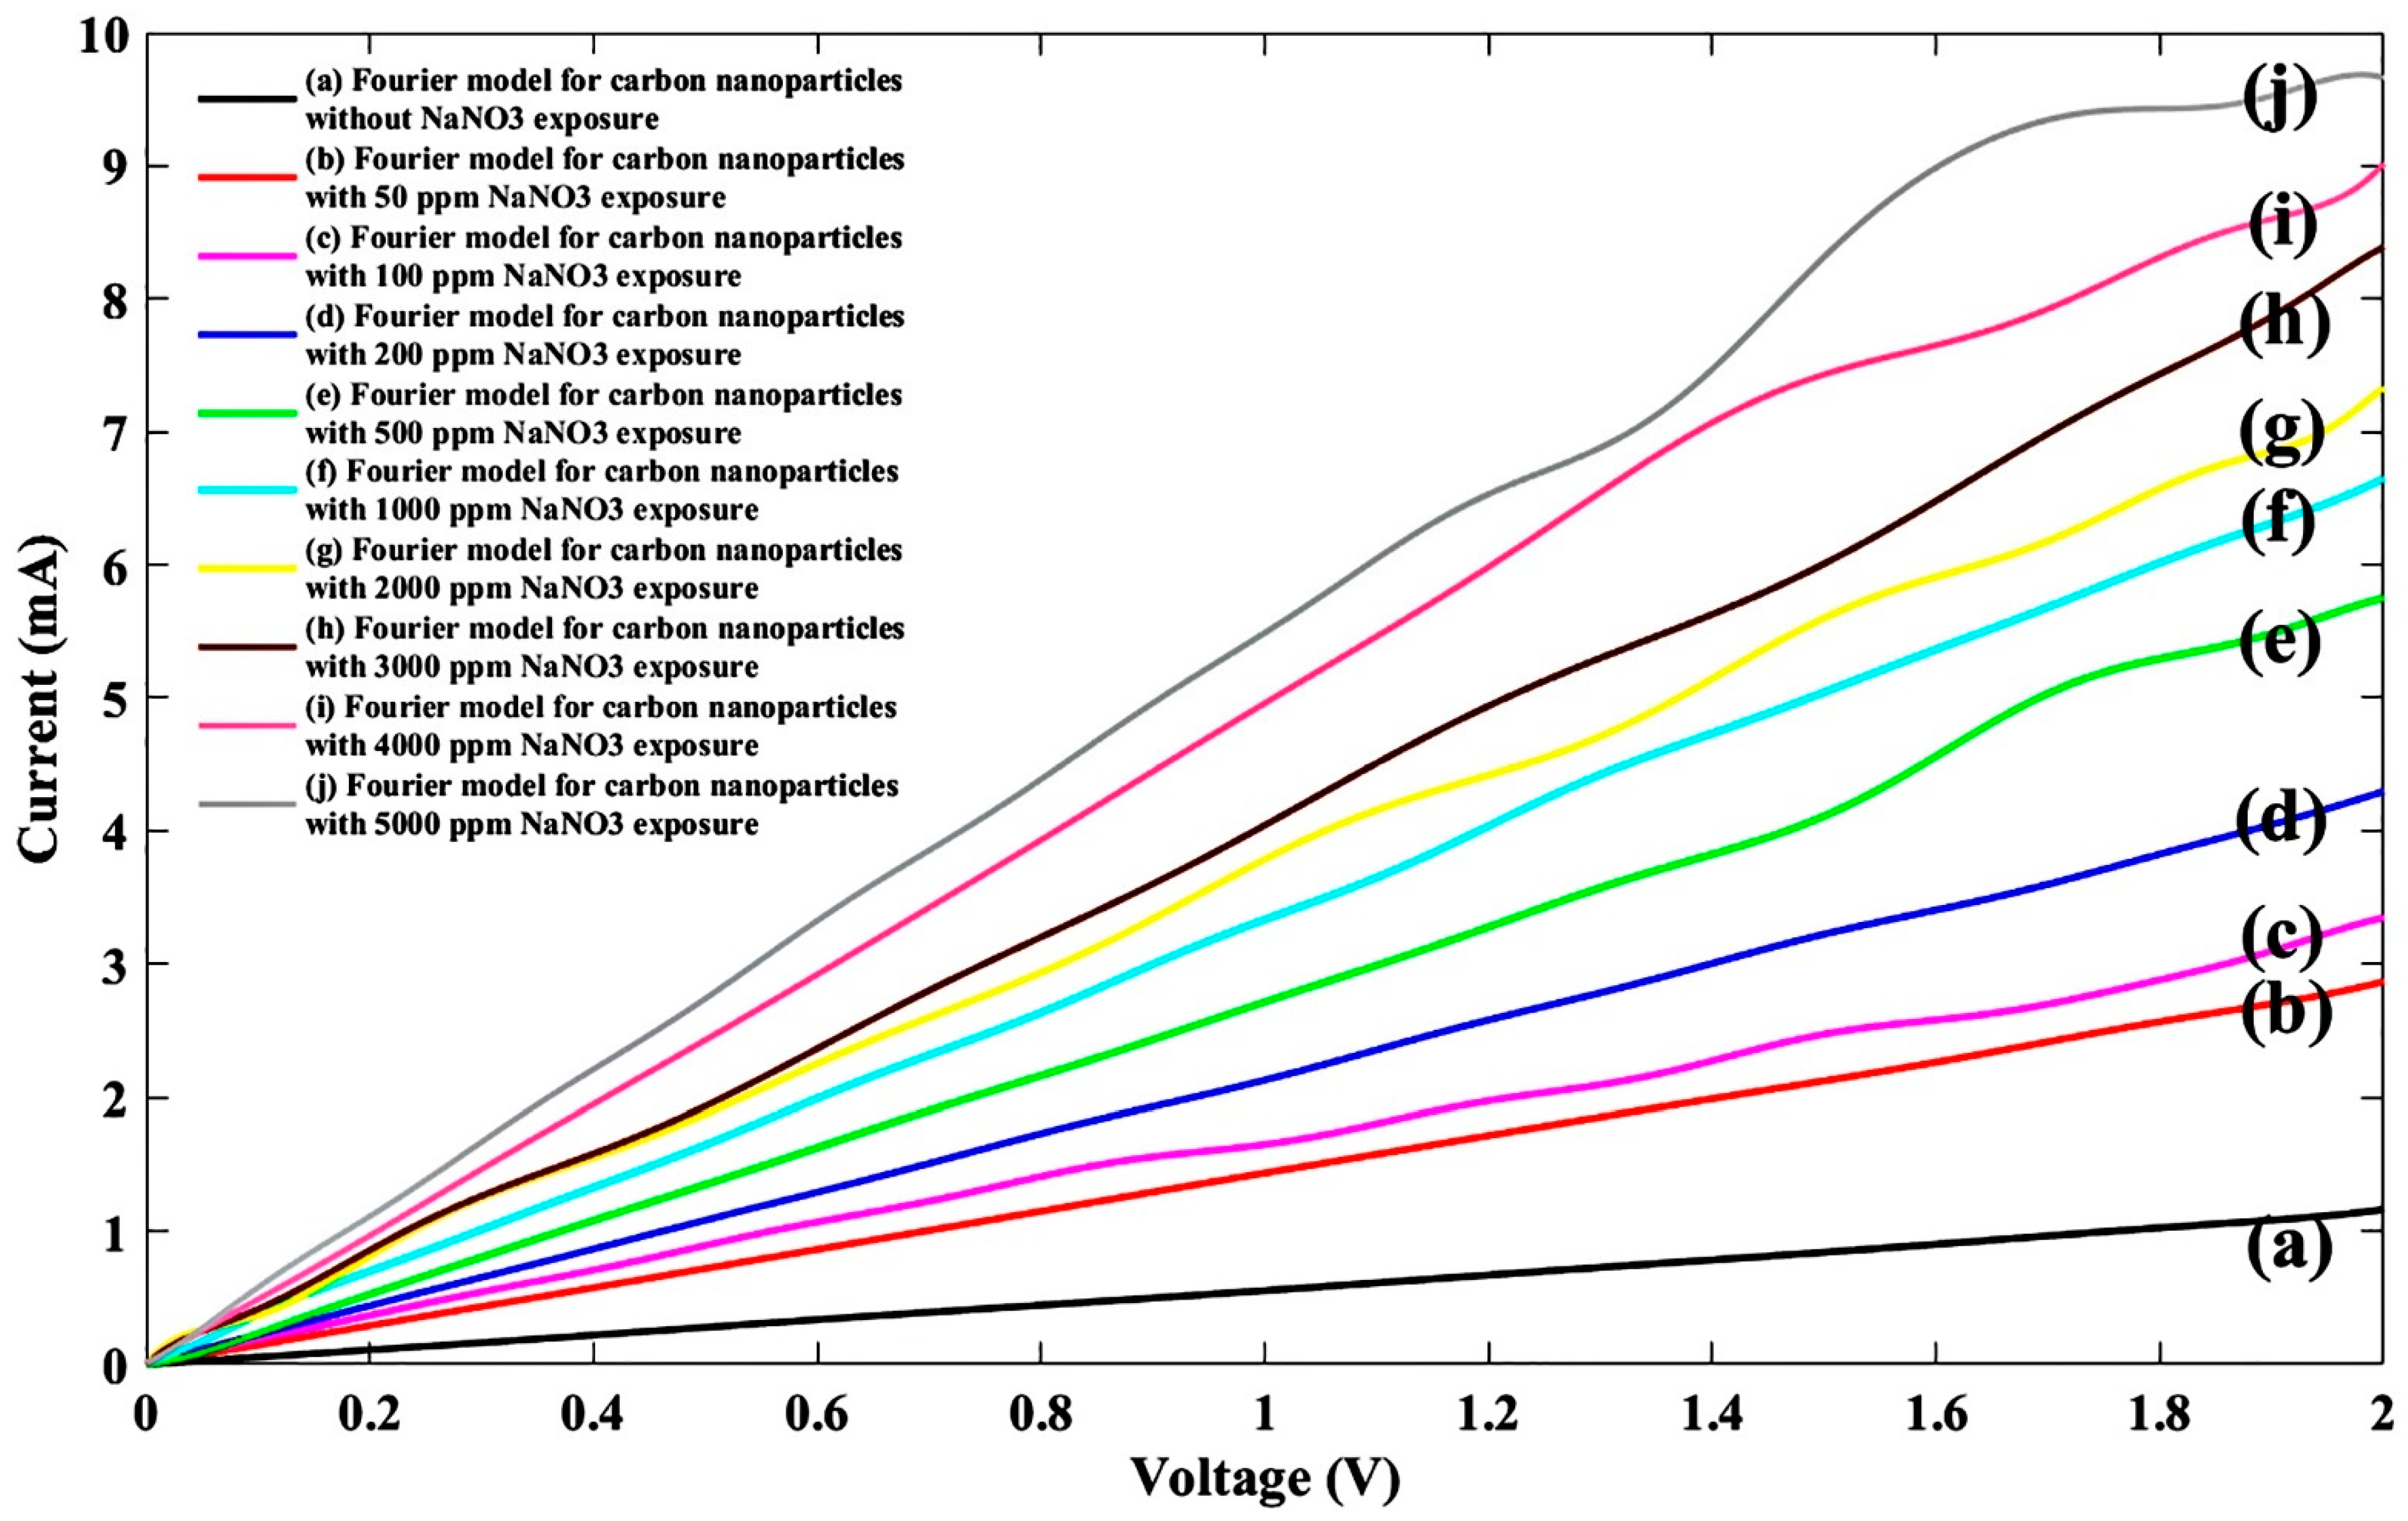
| General Model Fourier: f(x) = a0 + a1cos(xw) + b1sin(xw) + a2cos(2xw) + b2sin(2xw) + a3cos(3xw) + b3sin(3xw) + a4cos(4xw) + b4sin(4xw) + a5cos(5xw) + b5sin(5xw) + a6cos(6xw) + b6sin(6xw) + a7cos(7xw) + b7sin(7xw) + a8cos(8xw) + b8sin(8xw) | ||||||||||
|---|---|---|---|---|---|---|---|---|---|---|
| Without NaNO3 | 50 ppm NaNO3 | 100 ppm NaNO3 | 200 ppm NaNO3 | 500 ppm NaNO3 | 1000 ppm NaNO3 | 2000 ppm NaNO3 | 3000 ppm NaNO3 | 4000 ppm NaNO3 | 5000 ppm NaNO3 | |
| a0 | 2577 | −4.365 × 10⁹ | 1.645 | 2.049 | 2.825 | 3.492 | −6.718 × 10¹⁰ | −7.474 × 10⁴ | 24.02 | 5.223 |
| a1 | −3251 | 6.984 × 10⁹ | −0.7392 | −1.475 | −1.272 | −1.534 | 1.079 × 10¹¹ | 6.264 × 10⁴ | −4.804 | −2.429 |
| b1 | −2916 | 3.161 × 10⁹ | −0.9671 | −1.044 | −1.855 | −2.201 | 5.253 × 10¹⁰ | 1.172 × 10⁵ | −36.7 | −3.127 |
| a2 | 283.3 | −3.409 × 10⁹ | −0.575 | −0.7861 | −1.003 | −1.122 | −5.268 × 10¹⁰ | 5.174 × 10⁴ | −29.84 | −1.644 |
| b2 | 2608 | −3.881 × 10⁹ | −0.1857 | 0.267 | −0.265 | −0.4149 | −6.713 × 10¹⁰ | −7.71 × 10⁴ | 1.621 | −0.4729 |
| a3 | 624.7 | 7.667 × 10⁸ | −0.3277 | −0.1439 | −0.4805 | −0.6901 | 1.012 × 10¹⁰ | −4.992 × 10⁴ | 0.7631 | −0.8112 |
| b3 | −869.5 | 2.515 × 10⁹ | 0.1074 | 0.4591 | 0.2145 | 0.1724 | 4.668 × 10¹⁰ | −5352 | 20.6 | 0.2365 |
| a4 | −261.9 | 1.259 × 10⁸ | −0.1208 | 0.18 | −0.1587 | −0.2735 | 4.854 × 10⁹ | 7346 | 11.74 | −0.4314 |
| b4 | 57.75 | −9.719 × 10⁸ | 0.1971 | 0.2272 | 0.2232 | 0.3322 | −2.006 × 10¹⁰ | 1.899 × 10⁴ | −0.3351 | 0.3087 |
| a5 | 27.35 | −1.329 × 10⁸ | 0.02184 | 0.1596 | −0.01027 | −0.0307 | −4.223 × 10⁹ | 3940 | −0.1503 | −0.1108 |
| b5 | 15.43 | 2.152× 10⁸ | 0.1266 | −0.007545 | 0.1752 | 0.2552 | 5.149 × 10⁹ | −4321 | −5.373 | 0.3882 |
| a6 | 0 | 3.356 × 10⁷ | 0.05205 | 0.04654 | 0.07374 | 0.07706 | 1.372 × 10⁹ | −1017 | −1.795 | 0.09396 |
| b6 | 0 | −2.263 × 10⁷ | 0.0422 | −0.07136 | 0.06253 | 0.1278 | −6.39 × 10⁸ | −314.9 | 0.1281 | 0.1743 |
| a7 | 0 | −2.985 × 10⁶ | 0.03 | −0.01211 | 0.02794 | 0.05692 | −2.166 × 10⁸ | 8.98 | 0.06285 | 0.07132 |
| b7 | 0 | 5.101 × 10⁵ | 0.01038 | −0.03823 | −0.01528 | 0.02353 | −2.25 × 10⁶ | 92.4 | 0.3141 | 0.05917 |
| a8 | 0 | 0 | 0.01524 | −0.01777 | 0 | 0.03133 | 1.321 × 10⁷ | 0 | 0 | 0.05525 |
| b8 | 0 | 0 | −0.0199 | 0.0005103 | 0 | −0.008749 | 6.461 × 10⁶ | 0 | 0 | −0.001115 |
| w | 0.7738 | 0.4315 | 2.524 | 2.289 | 2.485 | 2.428 | 0.5159 | 1.027 | 1.76 | 2.592 |
| R2 | 0.9998 | 1 | 0.9996 | 1 | 0.9998 | 0.9999 | 0.9998 | 0.9998 | 1 | 0.9998 |
| SSE | 0.0005779 | 0.0001708 | 0.0185 | 0.002341 | 0.04767 | 0.02591 | 0.08688 | 0.09976 | 0.03064 | 0.153 |
| RMSE | 0.006207 | 0.003941 | 0.02368 | 0.007057 | 0.02628 | 0.01823 | 0.03316 | 0.03329 | 0.01835 | 0.03764 |
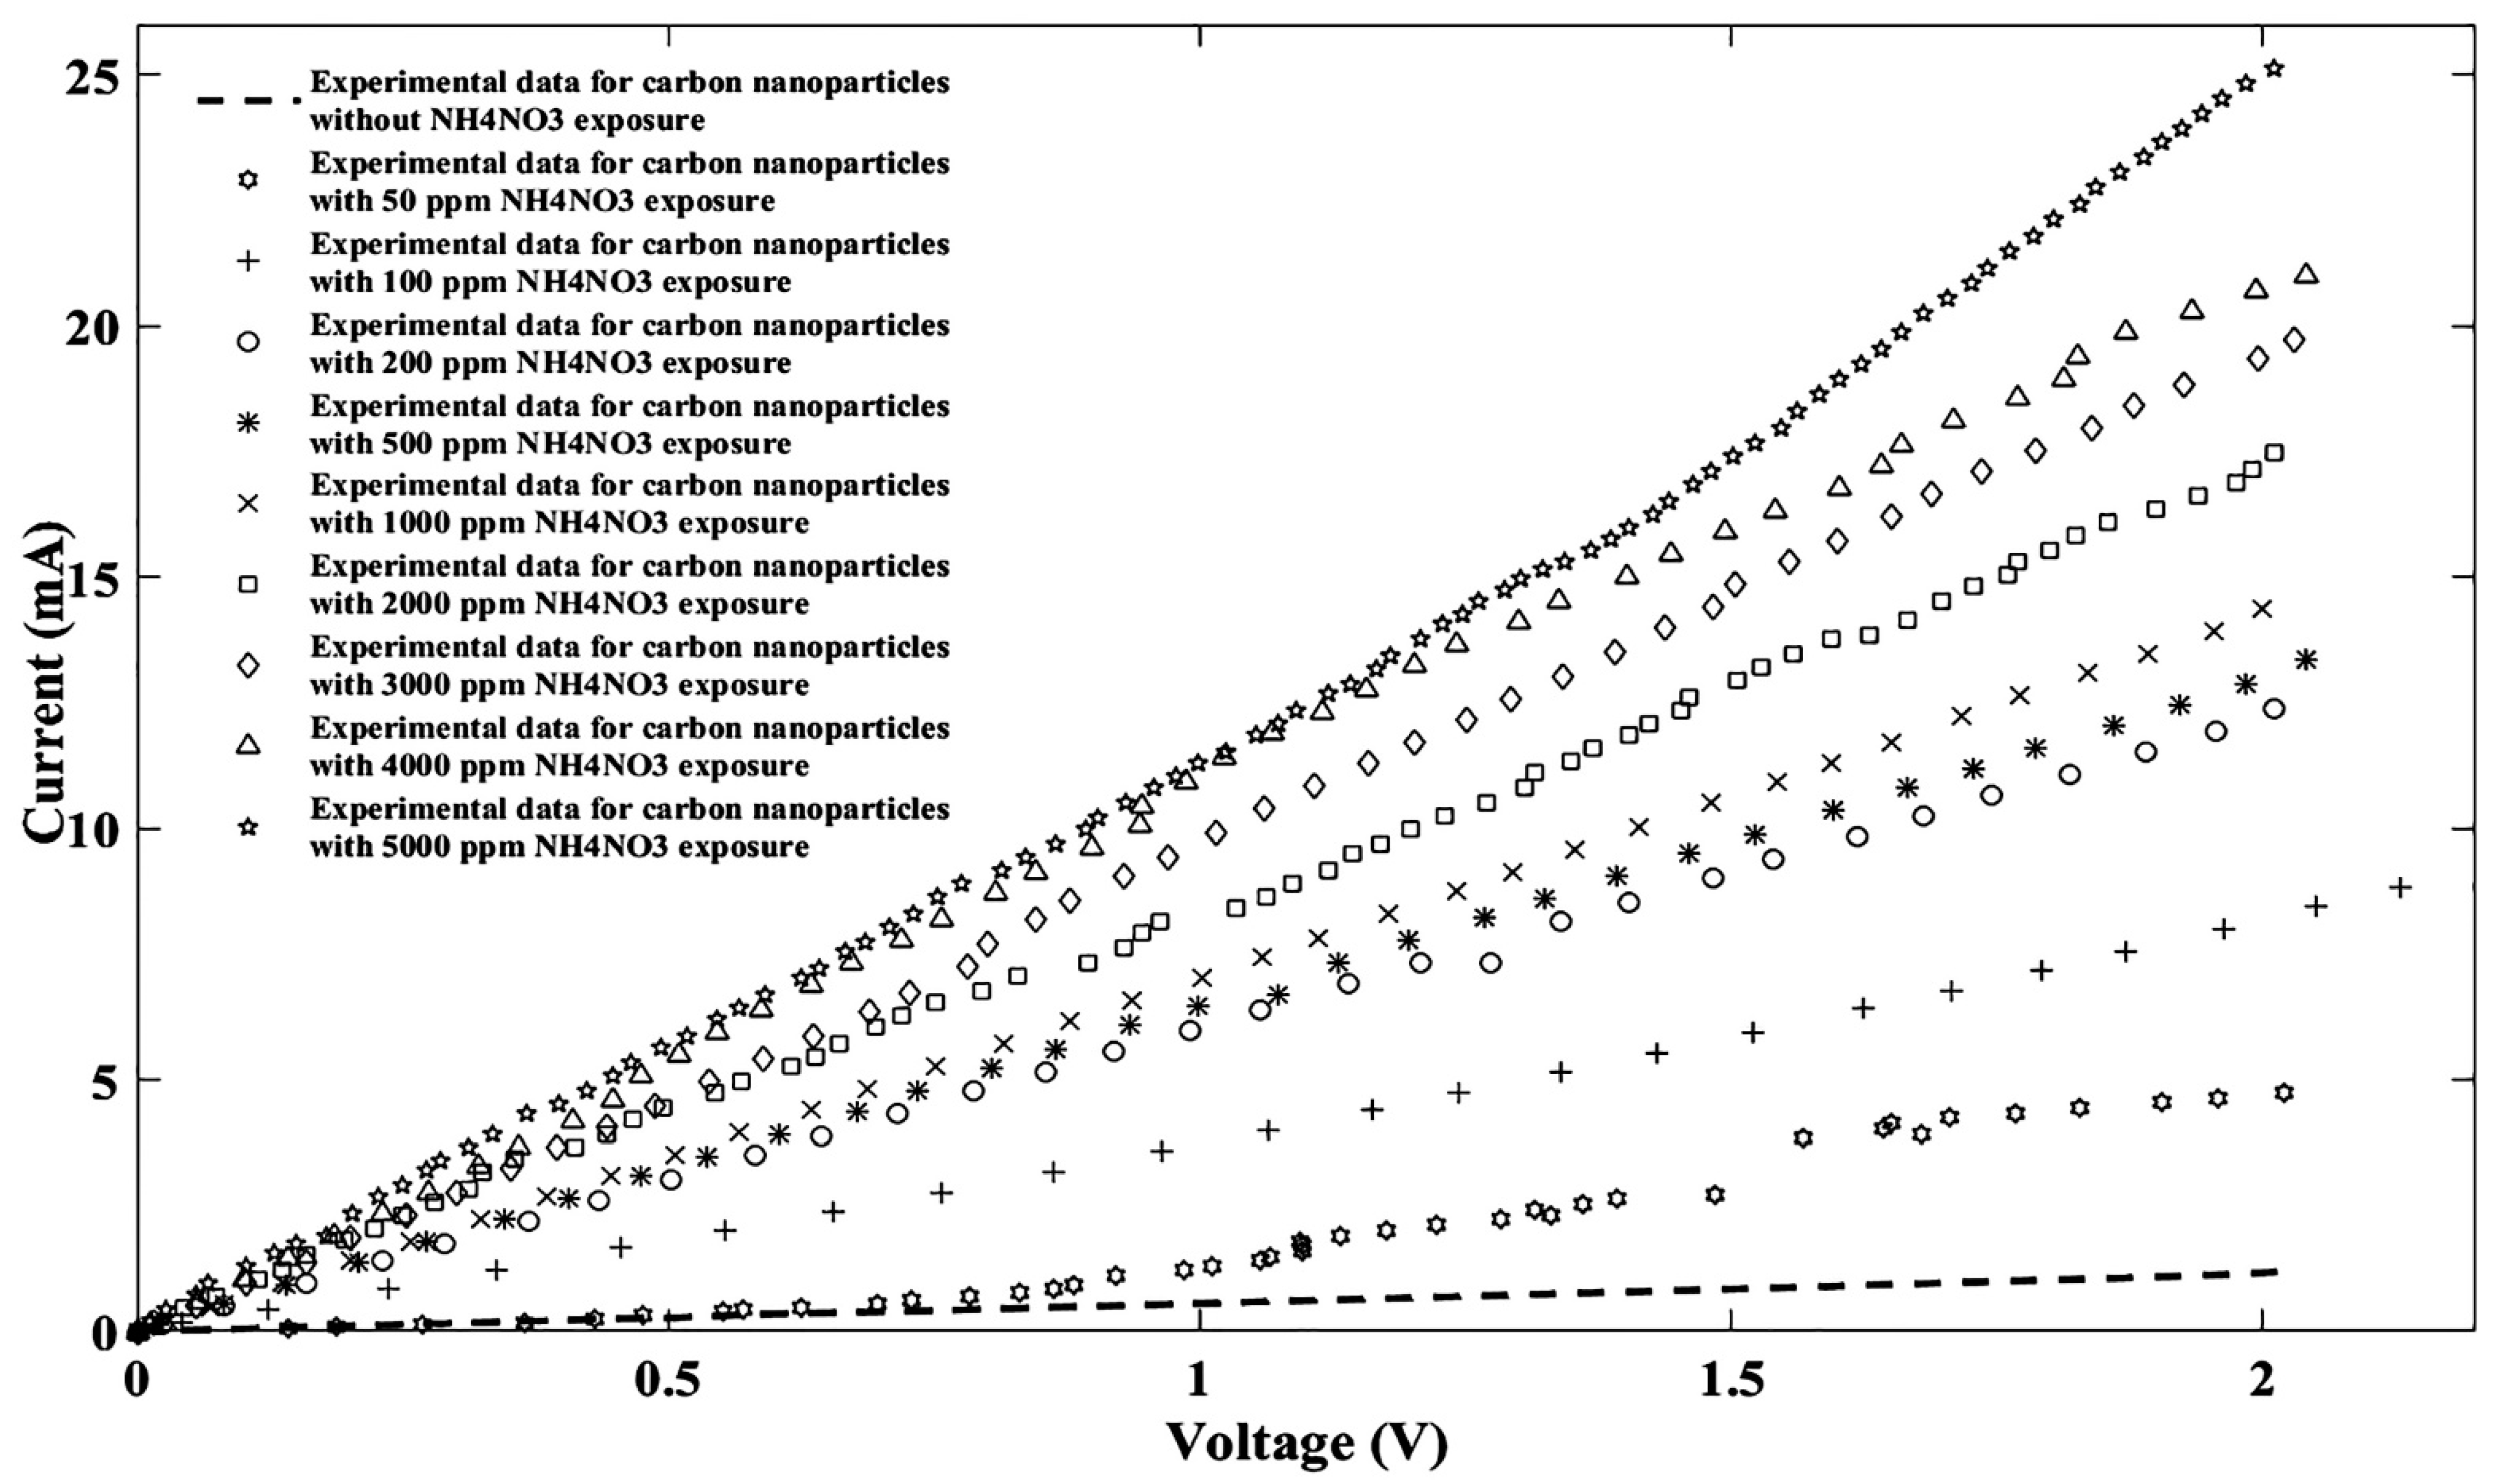
| General Model Fourier: f(x) = a0 + a1cos(xw) + b1sin(xw) + a2cos(2xw) + b2sin(2xw) + a3cos(3xw) + b3sin(3xw) + a4cos(4xw) + b4sin(4xw) + a5cos(5xw) + b5sin(5xw) + a6cos(6xw) + b6sin(6xw) + a7cos(7xw) + b7sin(7xw) + a8cos(8xw) + b8sin(8xw) | ||||||||||
|---|---|---|---|---|---|---|---|---|---|---|
| Without NH4NO3 | 50 ppm NH4NO3 | 100 ppm NH4NO3 | 200 ppm NH4NO3 | 500 ppm NH4NO3 | 1000 ppm NH4NO3 | 2000 ppm NH4NO3 | 3000 ppm NH4NO3 | 4000 ppm NH4NO3 | 5000 ppm NH4NO3 | |
| a0 | 2577 | 1.907 | −5.103 × 10⁹ | 6.266 | 6.715 | 6.618 | −4.655 × 10⁶ | 7.381 | 11.73 | 11.23 |
| a1 | −3251 | −0.5533 | 8.1 × 10⁹ | −2.979 | −4.666 | −6.012 | 4.44× 10⁶ | −10.42 | −7.343 | −8.179 |
| b1 | −2916 | −2.046 | 3.832 × 10⁹ | −3.901 | −3.432 | −2.714 | 7.164 × 10⁶ | −1.082 | −5.883 | −6.337 |
| a2 | 283.3 | −0.7164 | −3.829 × 10⁹ | −2.174 | −2.345 | −2.283 | 2.773 × 10⁶ | −2.319 | −3.641 | −4.802 |
| b2 | 2608 | −0.3164 | −4.668 × 10⁹ | −0.5321 | 0.7776 | 2.101 | −5.586 × 10⁶ | 5.58 | 0.2512 | 1.815 |
| a3 | 624.7 | −0.4016 | 7.452 × 10⁸ | −1.108 | −0.3724 | 0.5924 | −3.716 × 10⁶ | 2.811 | −1.127 | −0.6932 |
| b3 | −869.5 | 0.07183 | 2.98 × 10⁹ | 0.5151 | 1.196 | 1.732 | 3.543 × 10⁵ | 3.226 | 1.258 | 2.86 |
| a4 | −261.9 | −0.1694 | 2.241 × 10⁸ | −0.3338 | 0.4025 | 1.112 | 1.076 × 10⁶ | 2.83 | −0.119 | 1.024 |
| b4 | 57.75 | 0.06762 | −1.123 × 10⁹ | 0.6515 | 0.4651 | 0.1004 | 1.409 × 10⁶ | −0.4364 | 0.8636 | 1.368 |
| a5 | 27.35 | −0.1128 | −1.762 × 10⁸ | 0.1117 | 0.2453 | 0.3058 | 2.282 × 10⁵ | 0.6937 | 0.3434 | 0.9994 |
| b5 | 15.43 | 0.1618 | 2.372 × 10⁸ | 0.3757 | −0.02259 | −0.5612 | −6.053 × 10⁵ | −1.674 | 0.3403 | 0.1117 |
| a6 | 0 | 0.04741 | 4.171 × 10⁷ | 0.1399 | 0.02285 | −0.211 | −1.678 × 10⁵ | −0.4929 | 0.1789 | 0.3885 |
| b6 | 0 | 0.07607 | −2.222 × 10⁷ | 0.1197 | −0.08791 | −0.2558 | 3.396 × 10⁴ | −0.813 | 0.03491 | −0.3732 |
| a7 | 0 | 0 | −3.531 × 10⁶ | 0.09189 | 0 | −0.1269 | 2.033 × 10⁴ | −0.4073 | 0 | 0.05043 |
| b7 | 0 | 0 | 1.672 × 10⁵ | −0.01911 | 0 | 0.04976 | 2.13 × 10⁴ | −0.01703 | 0 | −0.2131 |
| a8 | 0 | 0 | 0 | 0 | 0 | 0.005272 | 598.9 | −0.07972 | 0 | −0.02578 |
| b8 | 0 | 0 | 0 | 0 | 0 | 0.03742 | −2411 | 0.1107 | 0 | −0.08339 |
| w | 0.7738 | 2.586 | 0.4214 | 2.403 | 2.129 | 2.125 | 1.032 | 2.102 | 2.044 | 2.291 |
| R2 | 0.9998 | 0.9971 | 1 | 0.9998 | 0.9999 | 1 | 0.9998 | 1 | 0.9999 | 1 |
| SSE | 0.0005779 | 0.2887 | 0.0001825 | 0.09508 | 0.05321 | 0.000866 | 0.274 | 0.07641 | 0.295 | 0.1916 |
| RMSE | 0.006207 | 0.09978 | 0.004776 | 0.07962 | 0.05292 | 0.007137 | 0.07477 | 0.05224 | 0.0918 | 0.05089 |
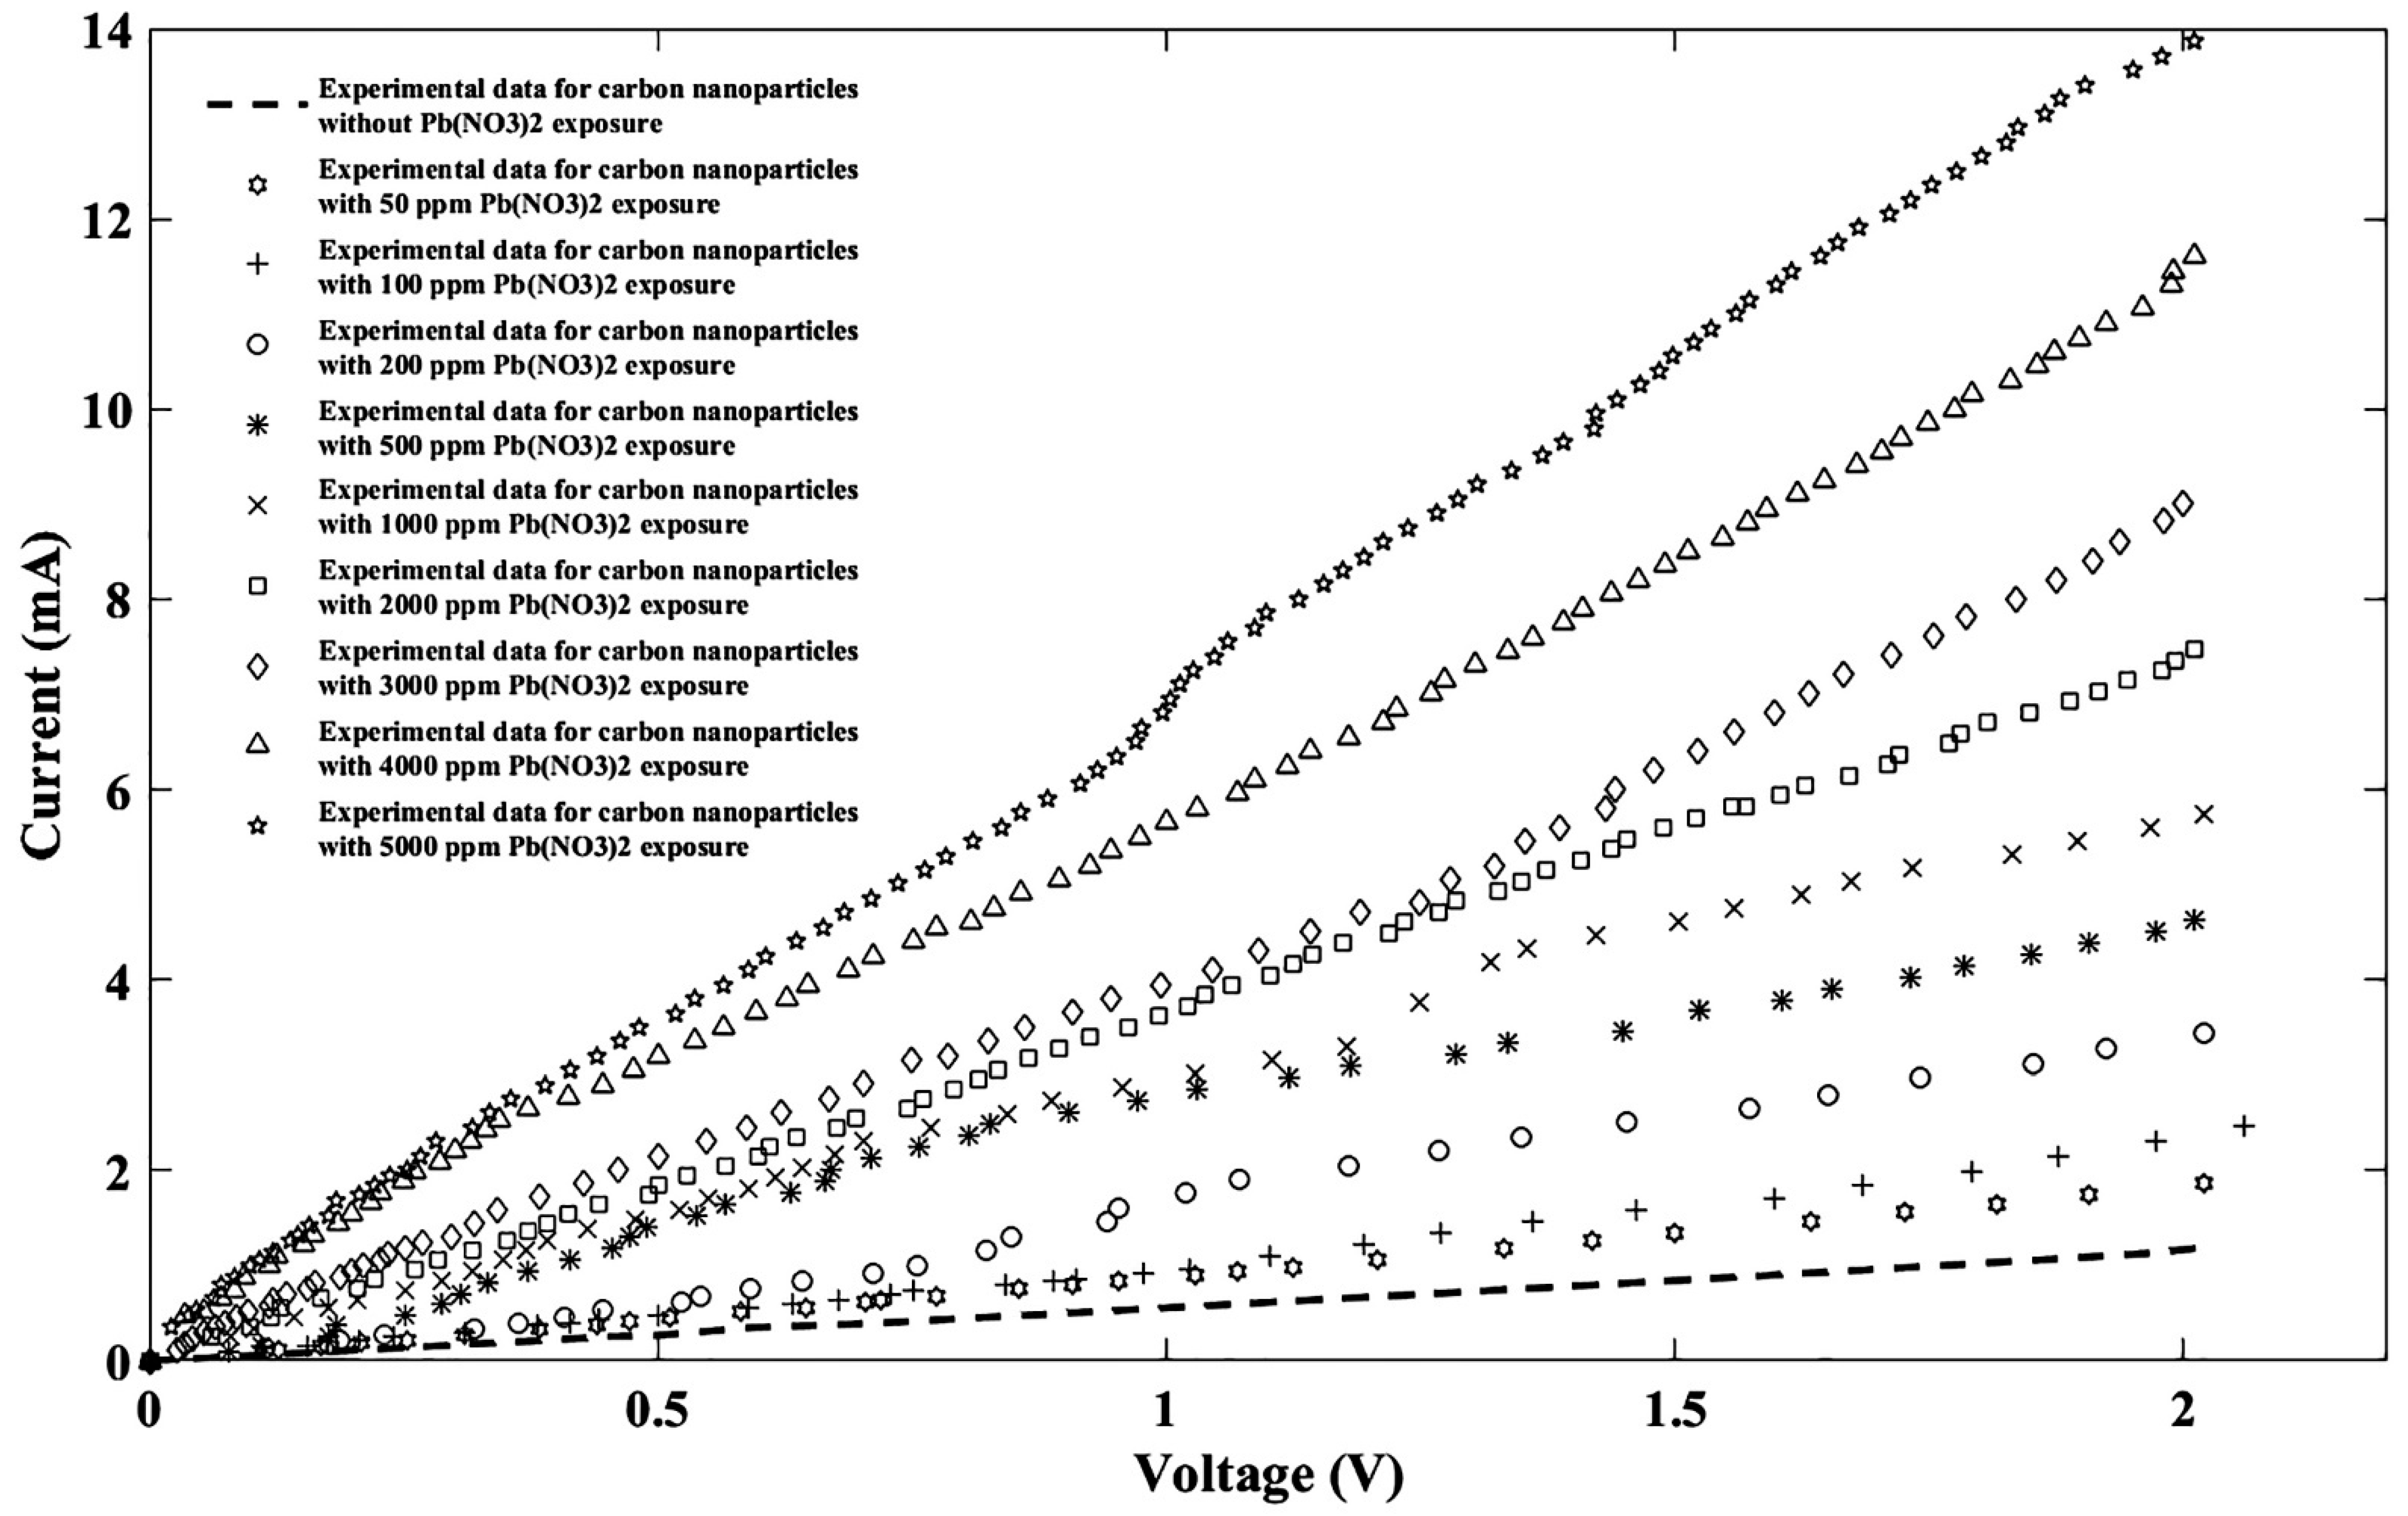
| General Model Fourier: f(x) = a0 + a1cos(xw) + b1sin(xw) + a2cos(2xw) + b2sin(2xw) + a3cos(3xw) + b3sin(3xw) + a4cos(4xw) + b4sin(4xw) + a5cos(5xw) + b5sin(5xw) + a6cos(6xw) + b6sin(6xw) + a7cos(7xw) + b7sin(7xw) + a8cos(8xw) + b8sin(8xw) | ||||||||||
|---|---|---|---|---|---|---|---|---|---|---|
| Without Pb(NO3)2 | 50 ppm Pb(NO3)2 | 100 ppm Pb(NO3)2 | 200 ppm Pb(NO3)2 | 500 ppm Pb(NO3)2 | 1000 ppm Pb(NO3)2 | 2000 ppm Pb(NO3)2 | 3000 ppm Pb(NO3)2 | 4000 ppm Pb(NO3)2 | 5000 ppm Pb(NO3)2 | |
| a0 | 2577 | −9.734 × 10⁸ | −192.8 | 1.571 | 5.862 | 3.13 | 5.437 | 4.367 | 7.275 | 9.145 |
| a1 | −3251 | 1.461 × 10⁹ | 73.86 | −0.9443 | 0.7388 | −1.163 | −1.114 | −2.161 | −2.69 | −6.585 |
| b1 | −2916 | 9.46 × 10⁸ | 338.7 | −1.085 | −6.503 | −1.938 | −4.589 | −2.807 | −5.421 | −6.735 |
| a2 | 283.3 | −5.082 × 10⁸ | 222.6 | −0.5231 | −4.109 | −0.8636 | −2.563 | −1.751 | −3.8 | −6.326 |
| b2 | 2608 | −1.132 × 10⁹ | −104.2 | −0.06866 | −3.632 | −0.4929 | −1.831 | −0.1014 | −1.165 | 1.942 |
| a3 | 624.7 | −1.054 × 10⁸ | −83.05 | −0.2765 | −3.572 | −0.5539 | −2.153 | −0.7292 | −2.509 | −0.4802 |
| b3 | −869.5 | 6.893 × 10⁸ | −106.6 | 0.2509 | 1.209 | −0.1498 | 0.6529 | 0.5688 | 1.685 | 5.391 |
| a4 | −261.9 | 2.008 × 10⁸ | −34.67 | −0.01229 | −0.286 | −0.354 | −0.4248 | −0.1055 | −0.05805 | 3.412 |
| b4 | 57.75 | −2.268 × 10⁸ | 42.77 | 0.1986 | 2.28 | 0.1775 | 1.335 | 0.5735 | 2.125 | 1.687 |
| a5 | 27.35 | −9.469 × 10⁷ | 13.63 | 0.1012 | 0.9668 | −0.1713 | 0.4745 | 0.1827 | 1.086 | 1.597 |
| b5 | 15.43 | 2.661 × 10⁷ | 6.547 | 0.1031 | 0.6424 | 0.1267 | 0.5844 | 0.2369 | 0.7821 | −1.619 |
| a6 | 0 | 2.152 × 10⁷ | 0.4214 | 0.06874 | 0.4006 | −0.0414 | 0.3186 | 0.1304 | 0.6822 | −0.4063 |
| b6 | 0 | 6.588 × 10⁶ | −2.137 | 0.007466 | −0.2295 | 0.1633 | −0.03974 | 0.02699 | −0.2572 | −0.9014 |
| a7 | 0 | −2.098 × 10⁶ | 0 | 0.02841 | −0.0006677 | 0.01672 | 0.02892 | 0.05148 | 0.08045 | −0.3317 |
| b7 | 0 | −2.471 × 10⁶ | 0 | −0.03931 | −0.1262 | 0.0548 | −0.07618 | −0.02689 | −0.3162 | 0.0615 |
| a8 | 0 | 2.989 × 10⁴ | 0 | −0.01232 | 0 | 0.003648 | 0 | 0 | −0.04208 | 0 |
| b8 | 0 | 2.194 × 10⁵ | 0 | −0.01392 | 0 | 0.0655 | 0 | 0 | −0.08274 | 0 |
| w | 0.7738 | 0.5184 | 1.245 | 2.495 | 2.003 | 2.516 | 2.132 | 2.356 | 2.175 | 1.911 |
| R2 | 0.9998 | 1 | 0.9999 | 0.9996 | 0.9996 | 0.9999 | 0.9999 | 0.9999 | 0.9999 | 0.9999 |
| SSE | 0.0005779 | 1.203 × 10⁵ | 0.001487 | 0.01478 | 0.03313 | 0.01241 | 0.0406 | 0.04764 | 0.06905 | 0.158 |
| RMSE | 0.006207 | 0.001001 | 0.009354 | 0.03371 | 0.03715 | 0.02323 | 0.02717 | 0.03087 | 0.03285 | 0.04364 |
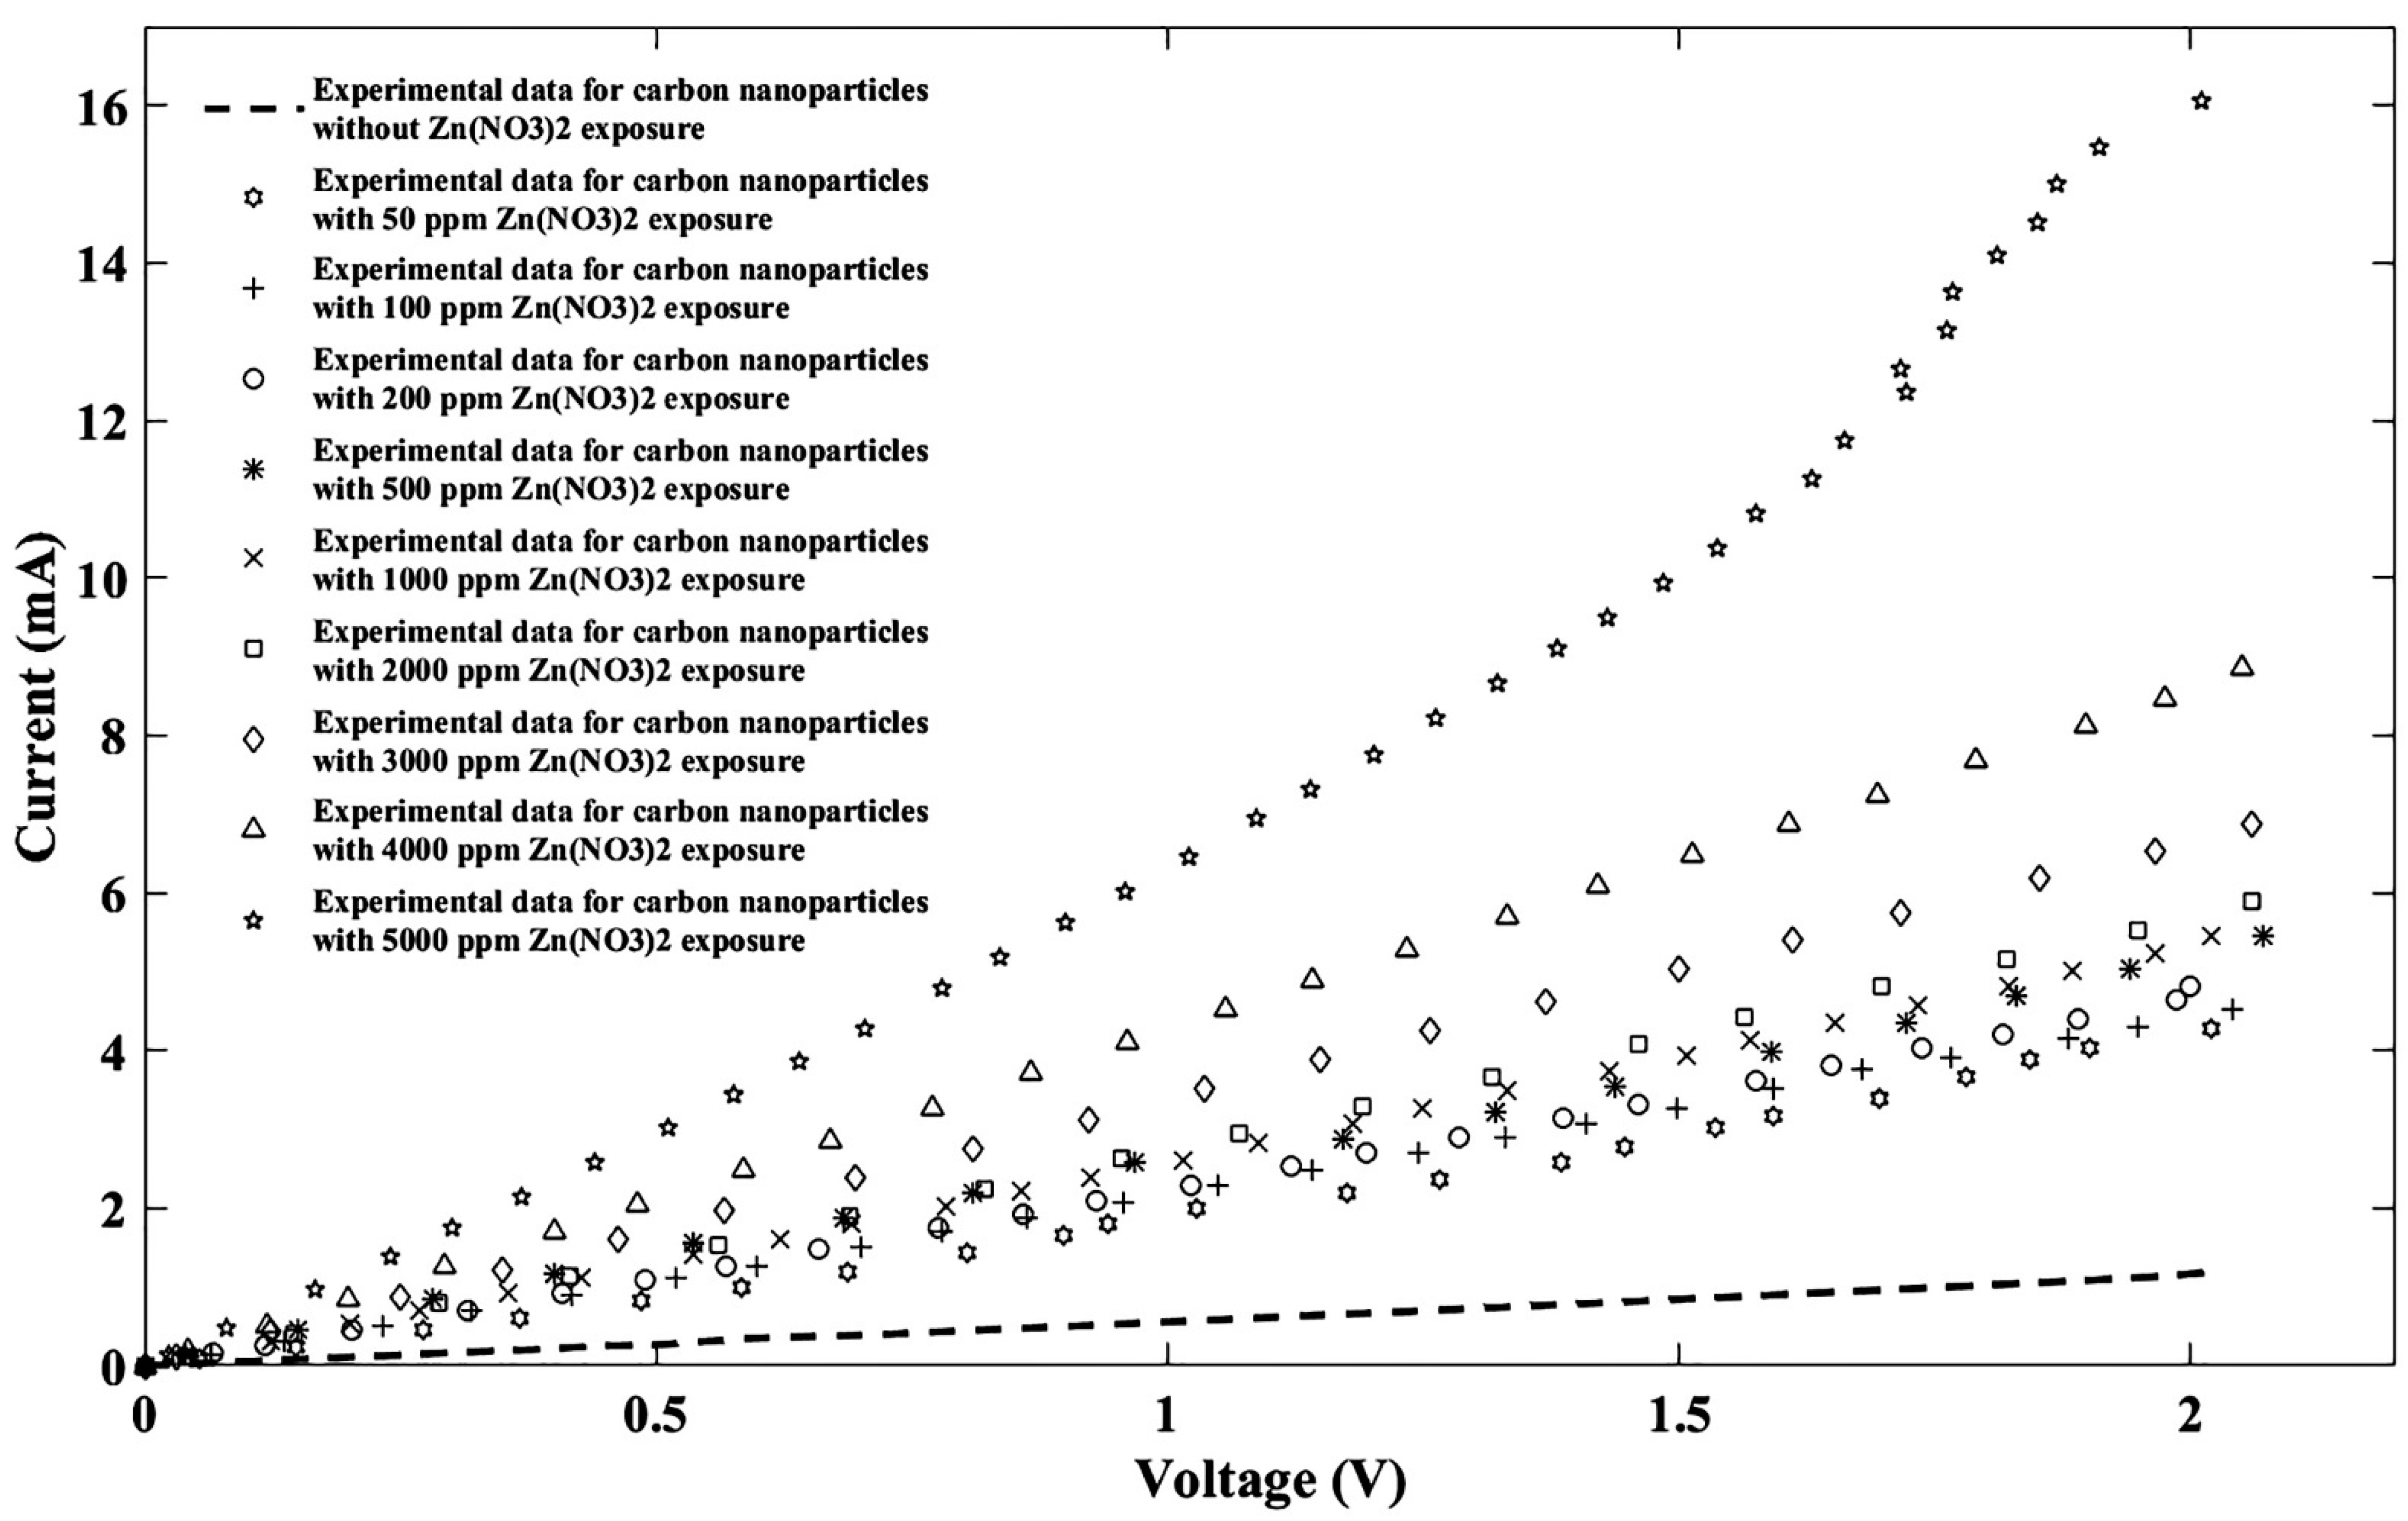
| General Model Fourier: f(x) = a0 + a1cos(xw) + b1sin(xw) + a2cos(2xw) + b2sin(2xw) + a3cos(3xw) + b3sin(3xw) + a4cos(4xw) + b4sin(4xw) + a5cos(5xw) + b5sin(5xw) + a6cos(6xw) + b6sin(6xw) + a7cos(7xw) + b7sin(7xw) + a8cos(8xw) + b8sin(8xw) | ||||||||||
|---|---|---|---|---|---|---|---|---|---|---|
| Without Zn(NO3)2 | 50 ppm Zn(NO3)2 | 100 ppm Zn(NO3)2 | 200 ppm Zn(NO3)2 | 500 ppm Zn(NO3)2 | 1000 ppm Zn(NO3)2 | 2000 ppm Zn(NO3)2 | 3000 ppm Zn(NO3)2 | 4000 ppm Zn(NO3)2 | 5000 ppm Zn(NO3)2 | |
| a0 | 2577 | 129.5 | 2.106 | 5.493 × 10¹⁰ | 2.852 | −1.08 × 10⁸ | 3.183 | −1.369 × 10⁸ | 2.712 × 10⁹ | −2.359 × 10¹¹ |
| a1 | −3251 | 40.08 | −1.696 | −8.591 ×10¹⁰ | −1.577 | 9.435 × 10⁷ | −2.801 | 1.66 × 10⁸ | −3.726 × 10⁹ | 3.699 × 10¹¹ |
| b1 | −2916 | −234.8 | −0.9627 | −4.728 × 10¹⁰ | −1.581 | 1.999 × 10⁸ | −1.246 | 2.148 × 10⁸ | −3.254 × 10⁹ | 2.015 × 10¹¹ |
| a2 | 283.3 | −181.1 | −0.7006 | 3.718 × 10¹⁰ | −1.103 | 1.012 × 10⁸ | −0.851 | 2.335 × 10⁷ | 5.598 × 10⁸ | −1.62 × 10¹¹ |
| b2 | 2608 | −66.26 | 0.4566 | 5.871 × 10¹⁰ | 0.07772 | −1.798 × 10⁸ | 0.917 | −2.338 × 10⁸ | 3.68 × 10⁹ | −2.509 × 10¹¹ |
| a3 | 624.7 | −67.73 | 0.03618 | −2.378 × 10⁹ | −0.3309 | −1.469 × 10⁸ | 0.2801 | −1.025 × 10⁸ | 1.135 × 10⁹ | 1.243 × 10¹⁰ |
| b3 | −869.5 | 116.4 | 0.4209 | −3.862 × 10¹⁰ | 0.3919 | 3.64 × 10⁷ | 0.4845 | 1.153 × 10⁸ | −1.956 × 10⁹ | 1.66 × 10¹¹ |
| a4 | −261.9 | 61.06 | 0.1922 | −7.092 × 10⁹ | 0.02523 | 7.287 × 10⁷ | 0.2012 | 6.899 × 10⁷ | −9.907 × 10⁸ | 2.94 × 10¹⁰ |
| b4 | 57.75 | 51.31 | 0.09011 | 1.5 × 10¹⁰ | 0.2749 | 3.957 × 10⁷ | −0.06968 | −2.066 × 10⁷ | 4.143 × 10⁸ | −6.517 × 10¹⁰ |
| a5 | 27.35 | 29.6 | 0.07581 | 4.294 × 10⁹ | 0.08147 | −1.199 × 10⁷ | −0.01192 | −2.204 × 10⁷ | 3.722 × 10⁸ | −1.823 × 10¹⁰ |
| b5 | 15.43 | −25.25 | −0.06483 | −3.107 × 10⁹ | 0.06808 | −3.061 × 10⁷ | −0.05002 | −4.96 × 10⁶ | 8.636 × 10⁷ | 1.382 × 10¹⁰ |
| a6 | 0 | −7.76 | −0.01349 | −1.18 × 10⁹ | 0.05804 | −2.676 × 10⁶ | 0 | 3.251 × 10⁶ | −6.438 × 10⁷ | 5.083 × 10⁹ |
| b6 | 0 | −12.73 | −0.03419 | 1.466 × 10⁸ | −0.001936 | 8.545 × 10⁶ | 0 | 2.794 × 10⁶ | −7.057 × 10⁷ | −7.723 × 10⁸ |
| a7 | 0 | −3.72 | 0 | 1.554 × 10⁸ | 0 | 1.239 × 10⁶ | 0 | −1.41 × 10⁵ | 2.277 × 100 | −6.823 × 10⁸ |
| b7 | 0 | 1.581 | 0 | 6.189 × 10⁷ | 0 | −8.571 × 10⁵ | 0 | −3.456 × 10⁵ | 1.477 × 100 | −2.467 × 10⁸ |
| a8 | 0 | 0.1458 | 0 | −7.082 × 10⁶ | 0 | −1.185 × 10⁵ | 0 | 0 | 4.499 × 10⁵ | 3.216 × 10⁷ |
| b8 | 0 | 0.5853 | 0 | −8.59 × 10⁶ | 0 | −5640 | 0 | 0 | −1.006 × 10⁶ | 3.62 × 10⁷ |
| w | 0.7738 | 1.796 | 2.162 | 0.5236 | 2.13 | 0.6221 | 1.758 | 0.4357 | 0.5108 | 0.521 |
| R2 | 0.9998 | 1 | 0.9999 | 1 | 1 | 1 | 1 | 1 | 1 | 0.9998 |
| SSE | 0.0005779 | 0.001893 | 0.001079 | 0.0003017 | 0.0007112 | 0.0002698 | 0.0002816 | 3.573 × 10⁻⁵ | 7.98 × 10⁻⁵ | 0.2171 |
| RMSE | 0.006207 | 0.01946 | 0.01039 | 0.006565 | 0.0154 | 0.005195 | 0.006851 | 0.002989 | 0.003647 | 0.1042 |
Publisher’s Note: MDPI stays neutral with regard to jurisdictional claims in published maps and institutional affiliations. |
© 2021 by the authors. Licensee MDPI, Basel, Switzerland. This article is an open access article distributed under the terms and conditions of the Creative Commons Attribution (CC BY) license (http://creativecommons.org/licenses/by/4.0/).
Share and Cite
Ahmadi, M.T.; Bodaghzadeh, M.; Rahimian Koloor, S.S.; Petrů, M. Graphene Nanoparticle-Based, Nitrate Ion Sensor Characteristics. Nanomaterials 2021, 11, 150. https://doi.org/10.3390/nano11010150
Ahmadi MT, Bodaghzadeh M, Rahimian Koloor SS, Petrů M. Graphene Nanoparticle-Based, Nitrate Ion Sensor Characteristics. Nanomaterials. 2021; 11(1):150. https://doi.org/10.3390/nano11010150
Chicago/Turabian StyleAhmadi, Mohammad Taghi, Morteza Bodaghzadeh, Seyed Saeid Rahimian Koloor, and Michal Petrů. 2021. "Graphene Nanoparticle-Based, Nitrate Ion Sensor Characteristics" Nanomaterials 11, no. 1: 150. https://doi.org/10.3390/nano11010150
APA StyleAhmadi, M. T., Bodaghzadeh, M., Rahimian Koloor, S. S., & Petrů, M. (2021). Graphene Nanoparticle-Based, Nitrate Ion Sensor Characteristics. Nanomaterials, 11(1), 150. https://doi.org/10.3390/nano11010150