Article

Coating Effect on the 1H—NMR Relaxation Properties of Iron Oxide Magnetic Nanoparticles

1
Dipartimento di Fisica and INFN, Università degli Studi di Pavia, Via Bassi 6, 27100 Pavia, Italy
2
Dipartimento di Fisica and INFN, Università degli Studi di Milano, Via Celoria 16, 20133 Milano, Italy
3
ICCOM-CNR, via Madonna del Piano 10, 50019 Sesto Fiorentino (FI), Italy
4
Dipartimento di Chimica “U. Schiff” and INSTM, Università degli Studi di Firenze, Via della Lastruccia 3-13, 50019 Sesto Fiorentino (FI), Italy
5
CNRS, CEISAM UMR 6230, Université de Nantes, F-44000 Nantes, France
6
CSPBAT-UMR CNRS 7244, Université Sorbonne Paris Nord, 74 rue Marcel Cachin, 93017 Bobigny, France
7
CNRS, Laboratoire de Physico-chimie des Electrolytes et Nanosystèmes Interfaciaux, Sorbonne Université, PHENIX—UMR 8234, CEDEX 05 F-75252 Paris, France
*
Author to whom correspondence should be addressed.
Nanomaterials 2020, 10(9), 1660; https://doi.org/10.3390/nano10091660
Submission received: 24 June 2020 / Revised: 13 August 2020 / Accepted: 19 August 2020 / Published: 24 August 2020
(This article belongs to the Special Issue Applications and Properties of Magnetic Nanoparticles)

Abstract

:
We present a 1H Nuclear Magnetic Resonance (NMR) relaxometry experimental investigation of two series of magnetic nanoparticles, constituted of a maghemite core with a mean diameter dTEM = 17 ± 2.5 nm and 8 ± 0.4 nm, respectively, and coated with four different negative polyelectrolytes. A full structural, morpho-dimensional and magnetic characterization was performed by means of Transmission Electron Microscopy, Atomic Force Microscopy and DC magnetometry. The magnetization curves showed that the investigated nanoparticles displayed a different approach to the saturation depending on the coatings, the less steep ones being those of the two samples coated with P(MAA-stat-MAPEG), suggesting the possibility of slightly different local magnetic disorders induced by the presence of the various polyelectrolytes on the particles’ surface. For each series, 1H NMR relaxivities were found to depend very slightly on the surface coating. We observed a higher transverse nuclear relaxivity, r2, at all investigated frequencies (10 kHz ≤ νL ≤ 60 MHz) for the larger diameter series, and a very different frequency behavior for the longitudinal nuclear relaxivity, r1, between the two series. In particular, the first one (dTEM = 17 nm) displayed an anomalous increase of r1 toward the lowest frequencies, possibly due to high magnetic anisotropy together with spin disorder effects. The other series (dTEM = 8 nm) displayed a r1 vs. νL behavior that can be described by the Roch’s heuristic model. The fitting procedure provided the distance of the minimum approach and the value of the Néel reversal time (τ ≈ 3.5 ÷ 3.9·10−9 s) at room temperature, confirming the superparamagnetic nature of these compounds.

1. Introduction

Imaging techniques play a fundamental role in every branch of medicine [1,2,3,4,5,6]. Among these, Magnetic Resonance Imaging (MRI) has played a leading role, as it combines the possibility of obtaining 3D images with a spatial resolution down to a few micrometers, the absence of limits for the penetration depth and the use of non-ionizing electromagnetic radiation [7]. The reconstruction of MRI acquisitions is mainly based on the analysis of the Nuclear Magnetic Resonance (NMR) signal coming from the water protons of different liquids/organs/tissues, on which appropriate magnetic field gradients are applied. The search for a higher sensitivity and the continuous optimization of methods and tools in MRI requires the development of efficient contrast agents (CAs) (i.e., biocompatible and biodegradable materials properly designed in terms of geometry, interactions with water and magnetic properties) that can be injected into the body to produce an optimized image contrast [8,9,10,11,12,13,14]. The presence of CAs, in fact, induces a decrease in the nuclear relaxation times T1 and T2 of protons, producing a local increase (T1-relaxing CAs) or decrease (T2-relaxing CAs) of the NMR signal in areas of the body that contain the agent, making them appear with unequal brightness/darkness in the MRI image [15]. Approximately 10 years after the first application on humans of the paramagnetic MRI CAs (Young et al. in 1981 [16]), more complex magnetic nanostructures based on iron oxide particles, typically magnetite Fe3O4 or maghemite γ-Fe2O3, were introduced into the market (Endorem®/Feridex®, Feraheme®, Combidex®, Clariscan® and Resovist®) [17,18,19]. Most of them were withdrawn from the market; nevertheless, Resovist® is still sold in a few countries, and Feraheme® is approved for the treatment of iron deficiency in adult chronic kidney disease patients. However, superparamagnetic properties (which mainly lead to a reduction of the T2 of the solvent nuclei), low toxicity and the improved synthesis control on the size, shape and surface of the magnetic nanoparticles (MNPs) (due to recently developed synthesis procedures) make them very versatile from an applicative point of view [20].
The efficiency of such particles for diagnostics has indeed been demonstrated to depend on several magnetic (nature of metal ion, spin topology, magnetic anisotropy), morphological/structural (core diameter, shape, crystallinity degree, coating thickness) and chemical (water exchange dynamics, principally due to coating hydrophilicity, permeability and thickness) parameters [21,22,23,24,25,26]. Moreover, a great potential of MNPs relies on their reactive surface, which can be exploited for the anchorage of several molecules with different functionalities. Indeed, over the last two decades, several research groups have tried to functionalize the nanoparticle surface with specific targeting agents, such as antigens and antibodies, or load them with cargo such as drugs, fluorescent dyes, radiotracers, etc. [27]. Ideally, these nanosystems could selectively reach the targeted tissues and organs, increase the image contrast and, at the same time, release a drug or heat that region (through Magnetic Fluid Hyperthermia [28,29,30,31]) to induce cell death. Thus, these nanoparticles can combine properties useful in diagnostics with other properties compatible with therapy, thus becoming potential theranostic agents.
This paper studies the morpho-dimensional, magnetic and relaxometric properties of aqueous dispersions of two series of γ-Fe2O3 superparamagnetic nanoparticles (with mean diameters dTEM ≈ 17 ± 2.5 nm and ≈ 8 ± 0.4 nm) coated with four different types of biocompatible negative polyelectrolytes. The purpose of our study is to investigate how the different kinds of polymer coatings can influence the behavior of the longitudinal (T1) and transverse (T2) 1H NMR relaxation times of MNP suspensions, which have also been shown to depend on the size of the magnetic core.

2. Materials and Methods

2.1. Tuning the Coating of Maghemite Nanoparticles

2.1.1. Polyelectrolytes Serving as MNP Coatings

We used four different MNP polyelectrolyte coatings: (i) Poly(acrylic acid), named PAA-A (average Mn = 1800 g·mol−1), purchased from Sigma–Aldrich (St. Louis, MO, USA) and used as received; (ii) a copolymer issued from the random esterification of poly(methacrylic acid) (PMAA) chains with polyethylene glycol (PEG2000), PMAA-g-PEG2000, named PEG-B (Mn = 5.86 × 10⁴ g·mol−1); (iii) and (iv), two comb-like polymers fabricated by reversible addition-fragmentation chain transfer (RAFT) based on PMMA and poly(ethylene glycol) methyl ether methacrylate (MAPEG2000) with two different chain transfer agents, P(MAA-stat-MAPEG2000), named respectively PEG-C for the hydrophobic transfer agent (Mn = 3.99 × 10⁴ g·mol−1) and PEG-D for the hydrophilic transfer agent (Mn = 2.87 × 10⁴ g·mol−1) [32,33].

2.1.2. Fabrication Procedure of Magnetic Nanoparticles

Low diameter (average magnetic core size dTEM ≈ 8 ± 0.4 nm) maghemite-based MNPs (samples A-8, B-8, C-8 and D-8, with PAA-A, PEG-B, PEG-C and PEG-D coatings, respectively) were synthesized following Massart’s protocol relying on the coprecipitation of iron(II) and iron(III) chloride salts in the presence of ammonium hydroxide [34]. High-diameter (average magnetic core dTEM ≈ 17 ± 2.5 nm) maghemite-based nanoparticles (samples A-17, B-17, C-17 and D-17, with PAA-A, PEG-B, PEG-C and PEG-D coatings, respectively) were prepared by a modified Massart’s method [35]. Briefly, iron chloride salt was dissolved in HCl acidic solutions (2 mol·L−1) and deoxygenated. Subsequently, 6.6 mL of FeCl3·6H2O solution (1 mol·L−1) and 1.7 mL of FeCl2·4H2O solution (2 mol·L−1) were mixed together and heated up to 70 °C under an argon atmosphere. Under vigorous stirring, a tetrapropylammonium hydroxide solution (1 mol·L−1, 64.4 mL) was injected at a 0.7 mL·min−1 rate using a syringe pump and then mixed for an additional 20 min. The two suspensions were oxidized to maghemite by an acidic solution of iron nitrate and redispersed in nitric acid [34]. Purification of the dispersion was performed by successive magnetic decantation steps. A size sorting by selective precipitation was conducted to obtain a narrow polydispersity [36]. Coating with the different polyelectrolytes, chosen for their biocompatibility from the perspective of in cellulo MRI, was achieved after a protocol already described in the literature [33]. The polymer powder was added to the targeted acidic dispersion of maghemite MNPs (0.06 wt.%) (for example, for 2.5 mL of iron oxide suspension, 5 mg of PAA-A or 15 mg of PEG-B, C, D were added). A 1.4 mol·L−1 solution of ammonium hydroxide was added dropwise under stirring to reach a final pH above 8. Dialysis against Millipore water using Spectra/PorTM membrane (regenerated cellulose) with an 8–10 kDa or 300 kDa cut-off was performed for 48 h to remove the excess of polyelectrolytes, while the solution pH reached around 7 after neutralization.

2.2. Characterization Methods

Experimental Details

The nanoparticle morphology was investigated by transmission electron microscopy (TEM). Images were recorded using a MO-Jeol 123S0 (80 kV) TEM equipped with a GATAN Orius 11 Megapixel Camera. A few drops of suspensions of the nanosystems were deposited onto holey carbon-coated copper grids (300 mesh) purchased from Agar Oxford Instruments.
Atomic Force Microscopy (AFM), performed by means of a Bruker Nanoscope Multimode IIId AFM system operating in tapping mode in air, was used to estimate the total size of the MNPs (core plus organic coating). The measurements were performed using a silicon rectangular cantilever (NSG01, NT_MDT, length of 120 μm, spring constant of 2.5 N/m and a resonance frequency of about 130 kHz). The samples were prepared by drying a drop of very diluted aqueous solution of MNPs on a mica substrate.
The hydrodynamic diameters of the nanosystems were measured with a Zetasizer Nano ZS ZEN 3600 (Malvern Instruments, Worcestershire, UK). Measurements were collected at 25 °C and averaged over three acquisitions, and correlograms were fitted with a Cumulant algorithm. The results presented are given after a lognormal fitting of the mean size volume histogram.
The electrophoretic mobility of the nanosytems was determined with a Zetasizer Nano ZS ZEN 3600 (Malvern Instruments, Worcestershire, UK). From the electrophoretic mobility, the zeta potential, ζ, was deduced using Smoluchowski’s approximation. All the measurements were performed at 25 °C in disposable folded capillary cells (DTS1070) and repeated three times.
The DC magnetic measurements were carried out by a VSM magnetometer (PPMS Quantum Design Ltd., San Diego, CA, USA) and a SQUID magnetometer (MPMS by Quantum Design Ltd., San Diego, CA, USA) operating in the 2–300 K temperature range and −5 ≤ μ0H ≤ +5 Tesla magnetic field range. Zero Field Cooled/Field Cooled magnetizations were acquired in a 5 milliTesla probe magnetic field after cooling the sample without (ZFC) and with (FC) the applied field. Due to the small quantity of synthetized products, the magnetic material content in the samples could not be estimated with accuracy. This inaccuracy and the large experimental error in the sample weight only allowed us to assume a rough estimate of the saturation magnetization.
The NMR-dispersion profiles were collected at room temperature by measuring the T1 and the T2 relaxation times, varying the Larmor frequency of the investigated nuclei (2πνL = γB0, where γ = 2.67513 × 10⁸ rad s−1 T−1 is the gyromagnetic factor of 1H, from 10 kHz up to 60 MHz). For low-frequency relaxation measurements (from 0.01 MHz to 7.2 MHz), the Fast-Field-Cycling technique was used by means of a Smartracer Stelar NMR relaxometer. High-frequency relaxation measurements (up to 60 MHz) were performed using a Stelar Spinmaster Fourier transform nuclear magnetic resonance spectrometer. For νL < 7.2 MHz, pre-polarized Saturation Recovery (for T1) and spin-echo (for T2) sequences were adopted. For frequencies νL > 7.2 MHz, non-pre-polarized Saturation Recovery (SR) and Carr Purcell Meiboom Gill (CPMG) pulse sequences were used for the T1 and T2 measurements, respectively.

3. Results and Discussion

3.1. Nanoparticles Synthesis

The coatings of maghemite MNPs were chosen so that they met three main objectives: easy synthetic access, biocompatibility and hydrophilicity. The structures of the four used polyelectrolytes (PAA-A, PEG-B, PEG-C and PEG-D) are sketched in Figure 1. To confer stealth properties to the coated NPs, PEGylated chains, well known to help nanoparticles evade the mononuclear phagocytic system after in vivo injection, were added to the polymer backbone by using post-esterification (PEG-B) or reversible addition-fragmentation chain transfer polymerization (PEG-C and PEG-D). Two series of coated MNPs, differing by the size of the inorganic core, were actually generated by adding an excess of each polyelectrolyte to an acidic solution of maghemite nanoparticles. After dialysis against Millipore water, alkalinization using ammonium hydroxide was performed so as to favor the anchoring of the polyelectrolyte carboxylate units to the naked surface of the iron oxide nanoparticles.

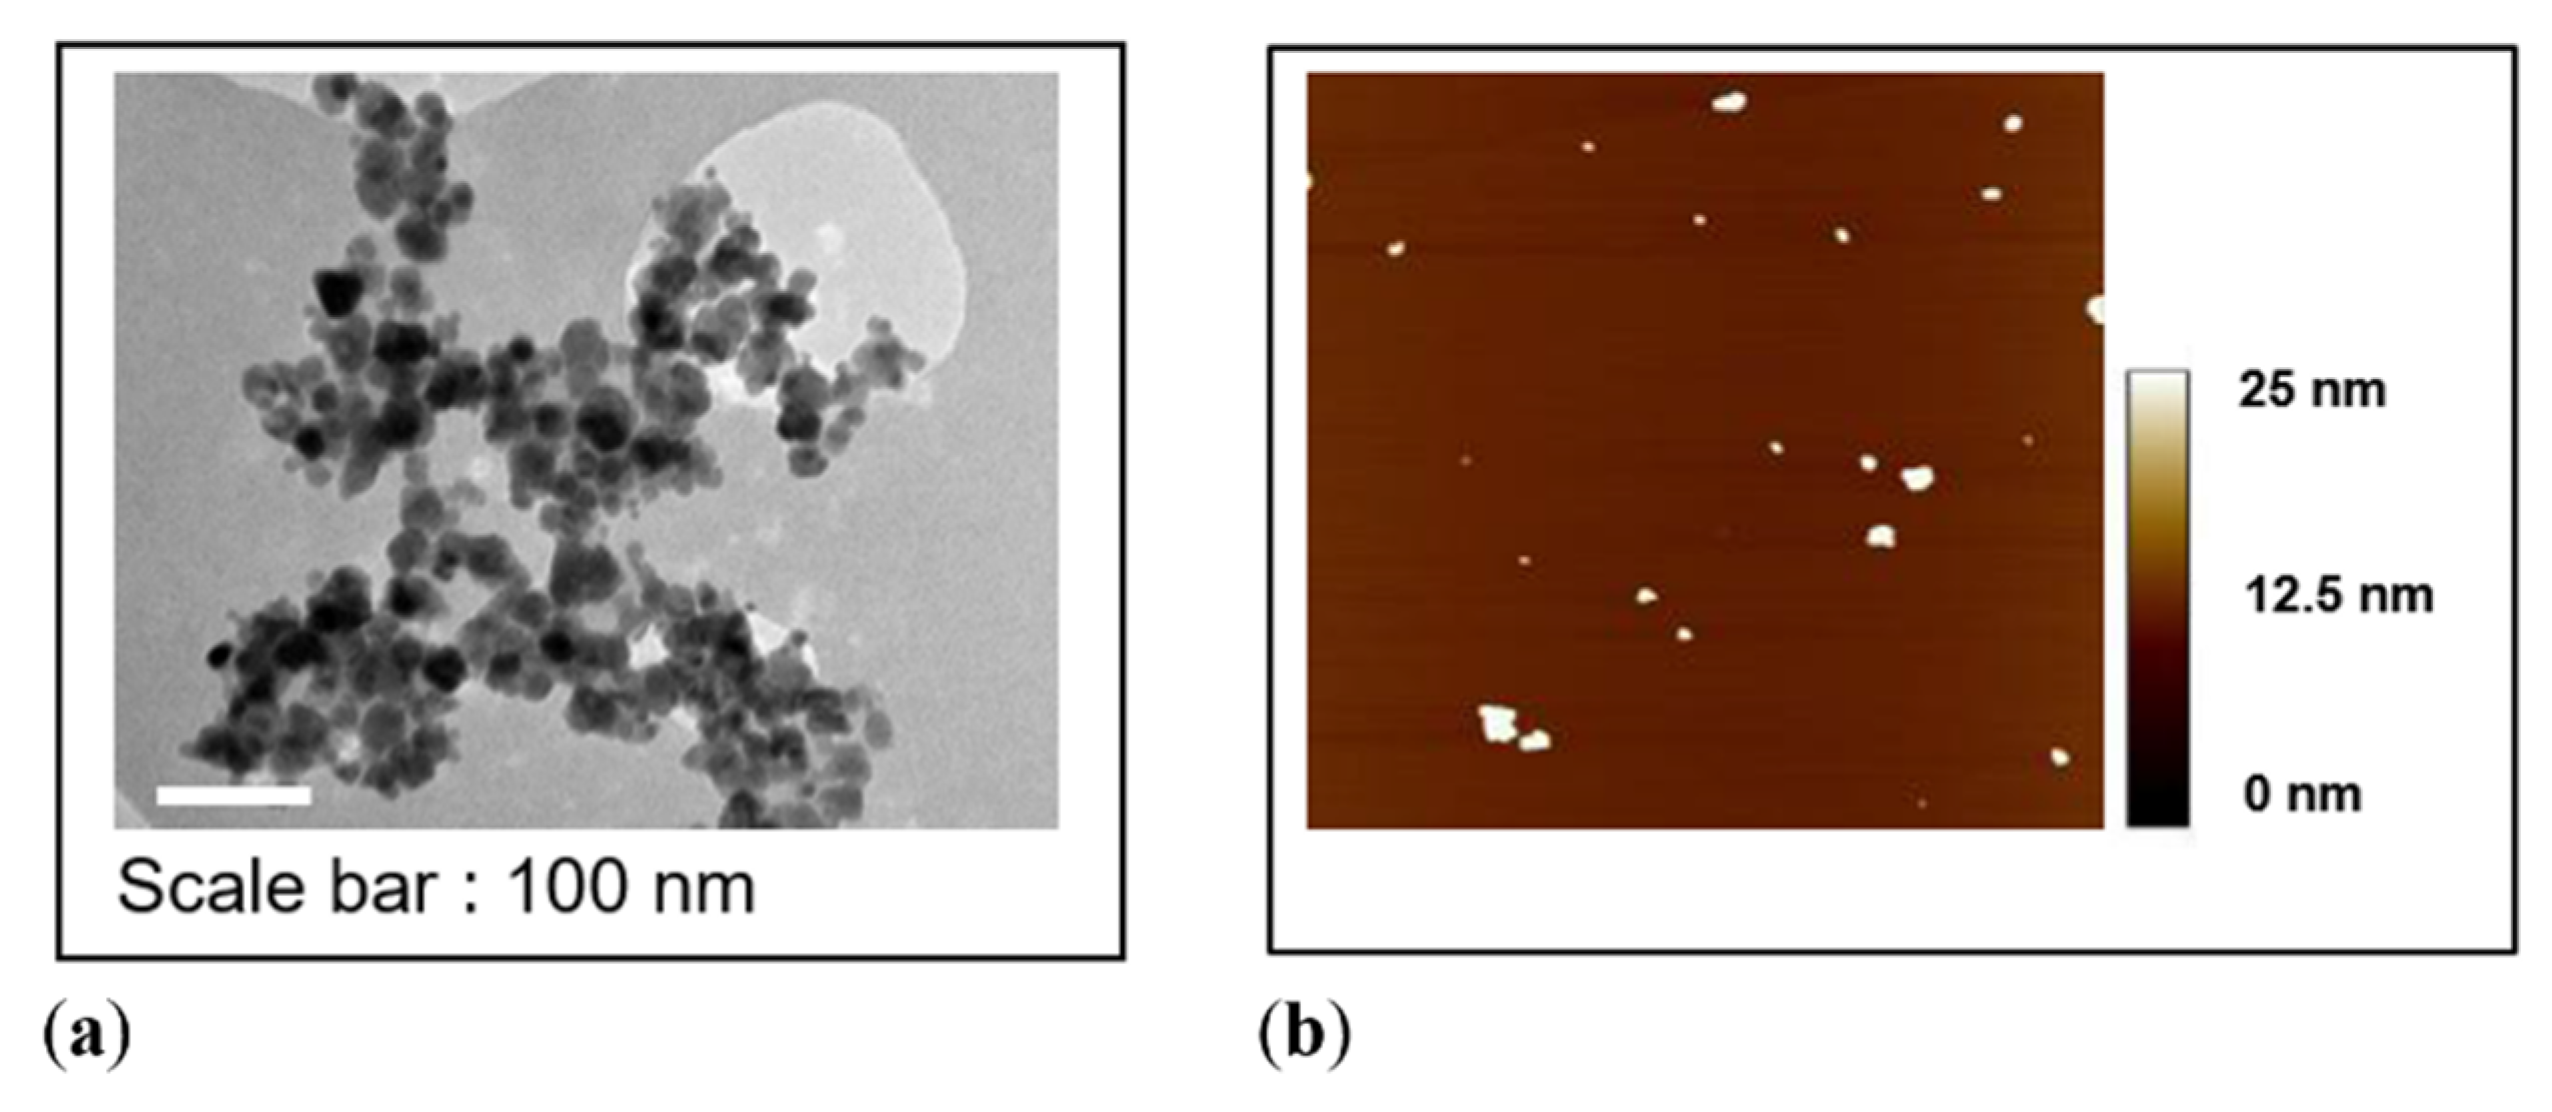
3.2. Morphological Characterization

Both series of samples consist of spherical MNPs, as deduced from the TEM and AFM images, which are presented in Figure 2a,b for A-17. Representative histograms of the core size for A-17 (first series) and A-8 (second series) are reported in Figure 3, while the average and standard deviation of the core diameter distribution are reported in Table 1. After statistical counting of more than 300 nanoparticles, performed using the ImageJ software, the average diameter and the standard deviation were determined by fitting the data to a log-normal distribution:
p x ( x , μ y , σ y )   =   1 2 π σ y x exp [ 1 2 ( lnx     μ y σ y ) 2 ]
where x represents the different values of the diameter, μy = ln(dTEM), where dTEM is the mean diameter, and σy is the standard deviation. The size distribution for each sample is within 16% around the mean value for both series (Table 1), i.e., large enough to include the mean values of the others samples of the same series.
For the samples of the first series (high diameter), the MNPs’ morphology was also investigated by Tapping Mode Atomic Force Microscopy, which allowed for the evaluation of the overall size of the MNPs, i.e., the diameter of the magnetic core together with its coating. Besides, AFM can distinguish the presence of MNP agglomerates and single MNPs, as shown in the topographic image of Figure 2b. As expected, the MNPs’ average diameter dAFM obtained by AFM is greater than the diameter estimated from the TEM data, due to the presence of the polymeric coating, whose thickness, as calculated from the difference of the diameters obtained through the two different techniques [(dAFM − dTEM)/2 (data not reported)], is in the order of 1 ÷ 1.5 nm, depending on the sample.
All of the samples have a negative zeta potential due to the presence of acrylate units on the various polyelectrolytes. Each sample has a zeta potential in the −28 to −48 mV range, indicating a good colloidal stability. The hydrodynamic diameters of the magnetic nanoparticles with a core of 17 nm vary little with the nature of the stabilizing polyelectrolyte and remain within a range of 71 to 85 nm. The increase in diameter, when compared with that obtained by TEM, is consistent with the presence of the polyelectrolyte and a solvation layer on the surface of the nanoparticles. Likewise, the value of 21 nm for the hydrodynamic diameter of the 8-nm nanoparticles samples stabilized by the PAA is coherent with the presence of the polyelectrolyte and of the solvation layer.

3.3. Magnetic Measurements

The ZFC/FC magnetization curves are reported in Figure 4a for the samples A-17 and A-8, which were measured in the form of powders. The temperature of the maximum in the ZFC curve, commonly identified as the blocking temperature of the system, occurs at TB ~45 K for the smaller diameter MNPs. For the larger diameter MNPs, the maximum is broadened around the end of the measuring temperature range (TB ≥ 260–300 K), suggesting that this latter series of samples is in a sort of transition between “blocked/unblocked” (superparamagnetic) regimes at room temperature. As a reminder, TB is proportional to the competition between the magnetic energy barrier (Ea ≈ KeffV) and the magnetization reversal process, which, in turn, increases with the effective anisotropy constant (Keff) and the volume (V) of the MNPs. Thus, the large difference observed in the TB values of the two series reflects this dependence.
The magnetization curves acquired at low (2.5 K) and high (300 K) temperatures are shown in Figure 5 for the 17-nm series. The curves are normalized to the corresponding saturation magnetization (Ms) value to better compare their shape features. Samples of the 17-nm series present a similar coercivity (µ0HC = 35 milliTesla) at a low temperature, a similar magnetic remanence, MR/Ms = 0.3 at 2.5 K, and a similar susceptibility, χ, at 300 K, with the exception of D-17, which displays slightly higher MR and χ values. On the contrary, a different approach to saturation (high field region), particularly evident at a low temperature, is observed among the samples; these can be ordered, from slowest to fastest to reach saturation, in the following sequence: C-17, B-17, A-17 and D-17.
A linear approach to saturation is commonly reported in nanoparticle systems and is related to the spin disorder on the particle surface, which affects the magnetization alignment upon increasing the field. In the present case, the different approach that was observed could thus be ascribed to the different modifications of the particle surface induced by: (i) slight variations in the synthesis procedure and/or (ii) the presence of different coatings. Due to their interconnection, distinguishing between these two contributions is not an easy task and will require a more detailed analysis, which is beyond the scope of this work. Interestingly, we can note that a negligible coercivity is recorded in the magnetization curves at room temperature (300 K) for all the samples, suggesting that the transition to the “unblocked” state mentioned above occurred for most of the particles of the 17 nm series at this temperature. The magnetization curves for the second series (not shown) present roughly similar features among the samples at low fields, with µ0HC = 25 milliTesla and MR/Ms = 0.4 at 2.5 K. A comparison of the low field hysteresis at 2.5 K for representative samples of the two series is shown in Figure 4b.

3.4. 1H NMR Relaxation

Proton NMR relaxation in superparamagnetic colloids occurs because of the fluctuations of the dipolar magnetic coupling between nanoparticle magnetization and proton spins. The relaxation rate is described by an outer sphere model that includes the Curie relaxation, where the dipolar interaction fluctuates because of both the translational diffusion process and the Néel reversal (i.e., the flip of the magnetization vector from one direction of the easy magnetization axis to the opposite one). The sensitivity of MNPs as contrast agents was evaluated through the nuclear relaxivities r1 (longitudinal relaxivity) and r2 (transverse relaxivity), which were calculated by means of the following equation:
ri = [(1/Ti)meas − (1/Ti)dia ]/C  i = 1, 2
where (1/Ti)meas is the value measured on the samples, (1/Ti)dia is the relaxation rate of the dispersant in the absence of superparamagnetic nanoparticles and C is the iron molar concentration within the sample.

3.4.1. Experimental Data

17 nm MNPs (1st Series)

The experimental longitudinal relaxivity profile (r1) of the 17-nm series of MNPs is represented in Figure 6a. All samples show a continuous increase of the longitudinal relaxivity lowering the Larmor frequencies, with no detectable maximum. This behavior can be explained qualitatively by taking into account the energy related to the crystal’s internal magnetic anisotropy at a low frequency. The absence of a maximum is common for spherical maghemite-based particles with diameters dTEM above approximately 15 nm. However, here the flattening of the r1(ν) curves at a low frequency, which is expected for high anisotropy systems, is not observed [37].
The transverse relaxivity vs. frequency behavior (Figure 6b) is similar for all samples, and at a high magnetic field μ0H ~1.41 Tesla (close to the clinical one), r2 reaches the value ~285 mM−1s−1 for sample B-17 and ~400 mM−1s−1 for samples A-17, C-17 and D-17. At Larmor frequencies νL > 5–10 MHz, sample B-17 shows r2 values smaller than those of the other samples, also slightly reflecting differences in r1. The spin disorder, induced by the different polymer and/or the agglomeration effects, possibly generate a lower magnetization value in the case of sample B-17. Table 2 summarizes the r1, r2 and r2/r1 values at the two frequencies, namely 60 MHz and 15 MHz. The values are compared to those of Endorem, a commercial T2 contrast agent, no longer used since 2012, but which still remains a good reference for assessing the relaxation efficiency of relaxing T2 superparamagnetic nanoparticles. The r2/r1 value is greater than 2, indicating that all the ferrofluids act as negative contrast agents, this value being the threshold conventionally used to distinguish T1-relaxing agents and T2-relaxing agents [38].

8 nm MNPs (2nd Series)

The relaxivity profiles of the 8-nm series of MNPs are presented in Figure 7. From Figure 7a, it is possible to observer that the longitudinal relaxivity r1 of this series of MNPs behaves as expected for ultrasmall superparamagnetic particles. The maximum of the longitudinal relaxivity is located between 1 and 20 MHz, and diminishes just by a factor of ~4 at 60 MHz. For sample A-8, the maximum is shifted towards a higher frequency, suggesting slightly smaller sizes. At low fields, all samples present a slight dispersion at 300–400 kHz, indicating that, at room temperature, their magnetization is not completely locked along the magnetic ‘easy’ axis.
In Table 3, the relaxivities of γ-Fe2O3 nanoparticles are compared to those of Endorem.
The transverse relaxivity vs. frequency behavior (Figure 7b) is similar for all samples, and at a high magnetic field μ0H ~1.41 Tesla, r2 reaches the value ~125 mM−1s−1. Then, the transverse relaxometric performance of these samples at the typical clinical frequency ~60 MHz (crucial for darkening the MRI images and thus increasing the sensitivity) is comparable to that of the commercial CA. Additionally, one can note that the frequency behavior of the r2 relaxation curve is also similar to that of the commercial compound, although the latter shows lower values for ν < 7 MHz.
It is interesting to note that the r2/r1 ratio at 60 MHz assumes a value of ~8 for our MNPs and ~11 for Endorem®. The r2/r1 values at 60 and 15.1 MHz are comparable to those of Endorem, indicating that the two substances have a very similar efficiency as T2 contrast agents.

3.4.2. Analysis of NMR Results

To analyze the NMR longitudinal relaxivity profiles (i.e., r1 vs. frequency) at room temperature, the heuristic model of Roch et al. [37] was employed. We were able to use this model (valid for an ensemble of single nanoparticles) because the coincidence of r1 and r2 values for each sample at low frequencies, approximately ν < 0.1 MHz, ensured the absence of particle aggregation at the dilution used for the NMR measurements. In more detail, the longitudinal NMRD profiles were fitted using the following expression:
1 T 1   =   32 π 135,000 μ SP 2   γ I 2   N A   C RD 7 P L ( x ) x J F   [ Ω ( ω S , ω 0 ) , τ D , τ N   ]   +   [ 7 Q L ( x ) x   +   3 ( 1     L 2   ( x )     2 L ( x ) x ) ] ·   J F   ( ω L , τ D , τ N )   +   3 L 2 ( x ) · J A ( 2 ω I   τ D )
where μ S P is the effective magnetic moment of the MNPs experienced by the 1H nuclei, γ I is the proton gyromagnetic ratio, N A is the Avogadro’s number, C is the molar concentration of iron in the MNPs, R is the minimum approach distance between the protons and MNPs, L(x) is the Langevin’s function (L(x) = cothx-1, where x = μ S P B 0 k B T ), D is the diffusion coefficient of the medium, τ D   = R2/D is the diffusion time that characterizes the fluctuation of the hyperfine interaction between the nuclear magnetic moments of the 1H nuclei of the solvent (here water) and the nanoparticle magnetic moment, τ N = τ 0 e K V k B T is the Néel relaxation time at room temperature, and ω S and ω I are the electron and proton transition frequencies, respectively. The parameters P and Q are related to the degree of magnetic anisotropy of the system, being the weight of the spectral density functions JA (Ayant, high fields) and JF (Freed, low fields), respectively. In particular, P = 0 and Q = 1 for highly anisotropic systems, while P = 1 and Q = 0 for weakly anisotropic systems.
For the 17-nm samples, we were not able to fit the experimental data because their size was at the limit of validity of the Roch’s heuristic model (for which nanoparticles should have a mean diameter < 20 nm). Moreover, the fitting process was made difficult by the broad size distribution for all samples (see Figure 3). The non-applicability of the Roch’s model to this series of MNPs was confirmed by the fact that it did not predict any r1 increase at the lowest frequencies, as displayed by our experimental data.
Conversely, for the smaller MNPs (second series of samples), we were able to fit the experimental r1 data. In Figure 8, the r1 fitting curves obtained by means of the Roch model for samples A-8, B-8, C-8 and D-8 are shown. The parameters of physical interest, obtained by the fit of the experimental data of Figure 8 to Equation (3) (deduced from the Roch’s model), are the saturation magnetization Ms, the magnetic core radius r, the distance R of minimum approach (of the bulk water protons to the MNP magnetic center) and the Néel relaxation time τN.
In the fitting procedure, we let the saturation magnetization MS parameter vary between 60 and 70 Am2/kgγ-Fe2O3, as expected from the literature data for particles with a similar size and substantially confirmed by our magnetic measurements for our samples. For the particle radius, by considering the size distribution width, we fixed an upper limit of r ≈ 5 nm. For the water diffusion coefficient, we used the theoretical value D = 2.3   ×   10 9   m 2 s 1 at 293 K.
For all samples, we observed the following: (i) The saturation values, constrained in the range specified above, allowed for the fitting procedure convergence, obtaining Ms = 70 ± 4 Am2/kgγ-Fe2O3; (ii) The core radius r was slightly higher than the one estimated by TEM (r = 5.0 ± 0.4 nm), a result possibly consistent with the width of the size distributions (Figure 3); (iii) The distance of the minimum approach was 1 ÷ 2 nm greater than the core radius. This latter result points out the tendency of the coating to prevent the diffusion of water inside itself; (iv) The values of τN were consistent with the ones typical for nanoparticles of this size, in particular τN ≈ 3.5 ÷ 3.9 × 10⁻⁹ s.

4. Conclusions

In this work, we employed NMR relaxometry to investigate the dependence of the MRI contrast efficiency (i.e., the nuclear relaxivities) on the organic coating of maghemite-based MNPs. In particular, we studied MNPs dispersed in water with two different diameters (dTEM ≈ 8 ± 0.4 nm and ≈ 17 ± 2.5 nm) and four different coatings, i.e., PAA, PMAA-g-PEG and two P(MAA-stat-MAPEG) with different transfer agents. A structural, morpho-dimensional and magnetic characterization of the nanoparticles was performed by means of Transmission Electron Microscopy (TEM), Atomic Force Microscopy (AFM) and DC magnetometry. The magnetization curves, particularly at a low temperature, displayed a different approach to saturation depending on the coating, the Ms approaching rate of the sample coated with hydrophobic P(MAA-stat-MAPEG) being the slowest one, followed by that coated with PMAA-g-PEG. These results seem to suggest that the hydrophobic P(MAA-stat-MAPEG) and PMAA-g-PEG coatings favor a higher spin disorder at the particle surface. The r1-NMRD profiles show the same behavior for samples with the same core size but with different coatings, indicating that the type of coating used in this work does not evidently influence the longitudinal relaxometric properties. For the transverse relaxivity, we observed a similar trend, except for the sample of the 17-nm series coated with PMAA-g-PEG, which had a lower r2, in particular for νL > 5–10 MHz. Remarkably, all samples showed high r2 values at 60 MHz (~120 mM−1s−1 for dTEM ≈ 8 nm and 300–400 mM−1s−1 for dTEM ≈ 17 nm), which were comparable to or higher than the transverse relaxivity of the commercial compound Endorem®. Thus, our samples are promising superparamagnetic T2 contrast agents for MRI, especially in the case of dTEM ≈ 17 nm. This conclusion is supported by the values of the r2/r1 ratio, which generally provides an indication as to how magnetic nanoparticles may behave in their application as contrast-enhancing agents. In our case, for the larger diameter series and at the most used clinical frequency (νL~60 MHz), the r2/r1 values were three times larger than the one for Endorem, allowing us to envision a possible superparamagnetic CA dose reduction in clinical use.

Author Contributions

Investigation, F.B., M.B., M.A., F.O., P.A., C.S., C.I., A.G., J.B., E.I., M.L., J.F. and L.L.; Resources, E.I., M.L., J.F. and L.L.; Supervision, A.L.; Writing—original draft, F.B.; Writing—review & editing, F.O., P.A., C.S., C.I., E.I., L.L. and A.L. Acquisition and/or analysis, interpretation of NMR data, P.A., M.A., M.B., F.B.; synthesis and/or characterization of MNPs, J.B., E.I., M.L., J.F., L.L., C.S., C.I., A.G.; AFM measurements, F.O.; supervision, A.L. All authors have read and agreed to the published version of the manuscript.

Funding

This research received no external funding.

Acknowledgments

Région des Pays de la Loire is gratefully acknowledged for its strong support through the PhD program of LUMOMAT RFI (ONASSIS project) as well as CNRS through the MITI program “Nano Challenge: Health and Welfare” (ETHICAM project) and grant number PICS07354. The INSTM-Regione Lombardia projects MAGNANO and MOTORSPORT, the EU-COST projects RADIOMAG TD-1402 and EURELAX CA-15209, and the INFN project HADROMAG are gratefully acknowledged. Julien Poly (Université de Haute-Alsace, IS2M UMR CNRS 7361) is warmly acknowledged for the synthesis of polyelectrolytes PEG-B to PEG-D and his very rich and extremely stimulating discussions. The authors strongly acknowledge Carole La and Marion Rivoal (LPGN-CNRS 6112, University of Nantes) for the iron content titrations using ICP-OES. TEM experiments were performed in the BIBS microscopy platform (UR1268 BIA, INRA).

Conflicts of Interest

The authors declare no conflict of interest.

References

  1. Bremer, C.; Ntziachristos, V.; Weissleder, R. Optical-based molecular imaging: Contrast agents and potential medical applications. Eur. Radiol. 2003, 13, 231–243. [Google Scholar] [CrossRef] [PubMed]
  2. Britz-Cunningham, S.H.; James Adelstein, S. Molecular targeting with radionuclides: State of the science. J. Nucl. Med. 2003, 44, 1945–1961. [Google Scholar] [PubMed]
  3. Wu, D.; Huang, L.; Jiang, M.S.; Jiang, H. Contrast agents for photoacoustic and thermoacoustic imaging: A review. Int. J. Mol. Sci. 2014, 15, 23616–23693. [Google Scholar] [CrossRef] [PubMed]
  4. Gambhir, S.S. Molecular imaging of cancer with positron emission tomography. Nat. Rev. Cancer 2002, 2, 683–693. [Google Scholar] [CrossRef]
  5. Ring, E.F.J.; Ammer, K. Infrared thermal imaging in medicine. Physiol. Meas. 2012, 33, R33. [Google Scholar] [CrossRef]
  6. Mettler, F.; Guiberteau, M. Essentials of Nuclear Medicine Imaging; Elsevier Saunders: Philadelphia, PA, USA, 2012; ISBN 9781455701049. [Google Scholar]
  7. Chan, R.W.; Lau, J.Y.C.; Lam, W.W.; Lau, A.Z. Magnetic resonance imaging. In Encyclopedia of Biomedical Engineering; Elsevier Inc.: Amsterdam, The Netherlands, 2018; ISBN 9780128051443. [Google Scholar]
  8. Xiao, Y.D.; Paudel, R.; Liu, J.; Ma, C.; Zhang, Z.S.; Zhou, S.K. MRI contrast agents: Classification and application (Review). Int. J. Mol. Med. 2016, 38, 1319–1326. [Google Scholar] [CrossRef] [Green Version]
  9. Hao, D.; Ai, T.; Goerner, F.; Hu, X.; Runge, V.M.; Tweedle, M. MRI contrast agents: Basic chemistry and safety. J. Magn. Reson. Imaging 2012, 36, 1060–1071. [Google Scholar] [CrossRef]
  10. Na, H.B.; Hyeon, T. Nanostructured T1 MRI contrast agents. J. Mater. Chem. 2009, 19, 6267–6273. [Google Scholar] [CrossRef]
  11. Caravan, P.; Ellison, J.J.; McMurry, T.J.; Lauffer, R.B. Gadolinium(III) chelates as MRI contrast agents: Structure, dynamics, and applications. Chem. Rev. 1999, 99, 2293–2352. [Google Scholar] [CrossRef]
  12. Shokrollahi, H. Contrast agents for MRI. Mater. Sci. Eng. C 2013, 33, 4485–4497. [Google Scholar] [CrossRef]
  13. Taylor, P.M. Contrast agents. In Imaging and Technology in Urology: Principles and Clinical Applications; Springer: London, UK, 2012; ISBN 9781447124221. [Google Scholar]
  14. Na, H.B.; Song, I.C.; Hyeon, T. Inorganic nanoparticles for MRI contrast agents. Adv. Mater. 2009, 21, 2133–2148. [Google Scholar] [CrossRef]
  15. Merbach, A.; Helm, L.; Tóth, É. The Chemistry of Contrast Agents in Medical Magnetic Resonance Imaging, 2nd ed.; John Wiley & Sons: Chichester, UK, 2013; ISBN 9781119991762. [Google Scholar]
  16. Young, I.R.; Clarke, G.J.; Baffles, D.R.; Pennock, J.M.; Doyle, F.H.; Bydder, G.M. Enhancement of relaxation rate with paramagnetic contrast agents in NMR imaging. J. Comput. Tomogr. 1981, 5, 543–547. [Google Scholar] [CrossRef]
  17. Wang, Y.X.J. Current status of superparamagnetic iron oxide contrast agents for liver magnetic resonance imaging. World J. Gastroenterol. 2015, 21, 13400. [Google Scholar] [CrossRef] [PubMed]
  18. Bobo, D.; Robinson, K.J.; Islam, J.; Thurecht, K.J.; Corrie, S.R. Nanoparticle-Based Medicines: A Review of FDA-Approved Materials and Clinical Trials to Date. Pharm. Res. 2016, 33, 2373–2387. [Google Scholar] [CrossRef] [PubMed]
  19. Reimer, P.; Balzer, T. Ferucarbotran (Resovist): A new clinically approved RES-specific contrast agent for contrast-enhanced MRI of the liver: Properties, clinical development, and applications. Eur. Radiol. 2003, 13, 1266–1276. [Google Scholar] [CrossRef]
  20. González-Gómez, M.A.; Belderbos, S.; Yañez-Vilar, S.; Piñeiro, Y.; Cleeren, F.; Bormans, G.; Deroose, C.M.; Gsell, W.; Himmelreich, U.; Rivas, J. Development of superparamagnetic nanoparticles coated with polyacrylic acid and aluminum hydroxide as an efficient contrast agent for multimodal imaging. Nanomaterials 2019, 9, 1626. [Google Scholar] [CrossRef] [Green Version]
  21. Casula, M.F.; Floris, P.; Innocenti, C.; Lascialfari, A.; Marinone, M.; Corti, M.; Sperling, R.A.; Parak, W.J.; Sangregorio, C. Magnetic resonance imaging contrast agents based on iron oxide superparamagnetic ferrofluids. Chem. Mater. 2010, 22, 1739–1748. [Google Scholar] [CrossRef]
  22. Basini, M.; Guerrini, A.; Cobianchi, M.; Orsini, F.; Bettega, D.; Avolio, M.; Innocenti, C.; Sangregorio, C.; Lascialfari, A.; Arosio, P. Tailoring the magnetic core of organic-coated iron oxides nanoparticles to influence their contrast efficiency for Magnetic Resonance Imaging. J. Alloys Compd. 2019, 770, 58–66. [Google Scholar] [CrossRef]
  23. Orlando, T.; Albino, M.; Orsini, F.; Innocenti, C.; Basini, M.; Arosio, P.; Sangregorio, C.; Corti, M.; Lascialfari, A. On the magnetic anisotropy and nuclear relaxivity effects of Co and Ni doping in iron oxide nanoparticles. J. Appl. Phys. 2016, 119, 134301. [Google Scholar] [CrossRef] [Green Version]
  24. Johnson, N.J.J.; He, S.; Nguyen Huu, V.A.; Almutairi, A. Compact Micellization: A Strategy for Ultrahigh T1 Magnetic Resonance Contrast with Gadolinium-Based Nanocrystals. ACS Nano 2016, 10, 8299–8307. [Google Scholar] [CrossRef]
  25. Fresnais, J.; Ma, Q.Q.; Thai, L.; Porion, P.; Levitz, P.; Rollet, A.L. NMR relaxivity of coated and non-coated size-sorted maghemite nanoparticles. Mol. Phys. 2019, 117, 990–999. [Google Scholar] [CrossRef]
  26. Vangijzegem, T.; Stanicki, D.; Panepinto, A.; Socoliuc, V.; Vekas, L.; Muller, R.N.; Laurent, S. Influence of experimental parameters of a continuous flow process on the properties of very small iron oxide nanoparticles (VSION) designed for T1-weighted magnetic resonance imaging (MRI). Nanomaterials 2020, 10, 757. [Google Scholar] [CrossRef] [PubMed] [Green Version]
  27. Magro, M.; Vianello, F. Bare iron oxide nanoparticles: Surface tunability for biomedical, sensing and environmental applications. Nanomaterials 2019, 9, 1608. [Google Scholar] [CrossRef] [PubMed] [Green Version]
  28. Dutz, S.; Buske, N.; Landers, J.; Gräfe, C.; Wende, H.; Clement, J.H. Biocompatible magnetic fluids of co-doped iron oxide nanoparticles with tunable magnetic properties. Nanomaterials 2020, 10, 1019. [Google Scholar] [CrossRef] [PubMed]
  29. Murgulescu, I.; Ababei, G.; Stoian, G.; Danceanu, C.; Lupu, N.; Chiriac, H. Fe-Cr-Nb-B magnetic nanoparticles prepared by arc discharge for hyperthermia. J. Optoelectron. Adv. Mater. 2019, 21, 733–739. [Google Scholar]
  30. Ortega, D.; Pankhurst, Q.A. Magnetic hyperthermia. Nanoscience 2013, 1, e88. [Google Scholar] [CrossRef]
  31. Bonvin, D.; Arakcheeva, A.; Millán, A.; Piñol, R.; Hofmann, H.; Mionić Ebersold, M. Controlling structural and magnetic properties of IONPs by aqueous synthesis for improved hyperthermia. RSC Adv. 2017, 7, 13159–13170. [Google Scholar] [CrossRef] [Green Version]
  32. Linot, C.; Poly, J.; Boucard, J.; Pouliquen, D.; Nedellec, S.; Hulin, P.; Marec, N.; Arosio, P.; Lascialfari, A.; Guerrini, A.; et al. PEGylated Anionic Magnetofluorescent Nanoassemblies: Impact of Their Interface Structure on Magnetic Resonance Imaging Contrast and Cellular Uptake. ACS Appl. Mater. Interfaces 2017, 9, 14242–14257. [Google Scholar] [CrossRef]
  33. Faucon, A.; Maldiney, T.; Clément, O.; Hulin, P.; Nedellec, S.; Robard, M.; Gautier, N.; De Meulenaere, E.; Clays, K.; Orlando, T.; et al. Highly cohesive dual nanoassemblies for complementary multiscale bioimaging. J. Mater. Chem. B 2014, 2, 7747–7755. [Google Scholar] [CrossRef] [Green Version]
  34. Ménager, C.; Sandre, O.; Mangili, J.; Cabuil, V. Preparation and swelling of hydrophilic magnetic microgels. Polymer 2004, 45, 2475–2481. [Google Scholar] [CrossRef]
  35. Santoyo Salazar, J.; Perez, L.; De Abril, O.; Truong Phuoc, L.; Ihiawakrim, D.; Vazquez, M.; Greneche, J.M.; Begin-Colin, S.; Pourroy, G. Magnetic iron oxide nanoparticles in 10-40 nm range: Composition in terms of magnetite/maghemite ratio and effect on the magnetic properties. Chem. Mater. 2011, 23, 1379–1386. [Google Scholar] [CrossRef]
  36. Lefebure, S.; Dubois, E.; Cabuil, V.; Neveu, S.; Massart, R. Monodisperse magnetic nanoparticles: Preparation and dispersion in water and oils. J. Mater. Res. 1998, 13, 2975–2981. [Google Scholar] [CrossRef]
  37. Roch, A.; Muller, R.N.; Gillis, P. Theory of proton relaxation induced by superparamagnetic particles. J. Chem. Phys. 1999, 110, 5403–5411. [Google Scholar] [CrossRef]
  38. Umut, E. Surface Modification of Nanoparticles Used in Biomedical Applications. In Modern Surface Engineering Treatments; InTech: Rijeka, Croatia, 2013; pp. 185–208. [Google Scholar]
Figure 1. Structures of the investigated MNPs as a function of their core diameter and polyelectrolyte coating, depicted as PAA-A, PEG-B, PEG-C and PEG-D.
Nanomaterials 10 01660 g001
Figure 2. Representative images of sample A-17 obtained by means of: (a) bright field TEM and (b) AFM over an area of 3 × 3 µm2.
Nanomaterials 10 01660 g002
Figure 3. Histograms reporting the distribution of the core sizes for the two series of MNPs, as obtained from TEM analysis (A-17, left and A-8, right). The distributions are fitted to a log-normal function; the mean value and the standard deviation are reported in Table 1.
Nanomaterials 10 01660 g003
Figure 4. (a) ZFC/FC magnetization curves collected with a magnetic field μ0H = 5 × 10⁻³ Tesla and (b) low field hysteresis loops at 2.5 K for A-17 and A-8.
Nanomaterials 10 01660 g004
Figure 5. Magnetization curves at 2.5 K (left panel) and 300 K (right panel) for the first series. In the insets, details of the curves at low magnetic fields are shown.
Nanomaterials 10 01660 g005
Figure 6. (a) Longitudinal r1 and (b) transverse r2 NMRD profiles collected at room temperature in the Larmor frequency range 0.01 ν L 60   MHz for the first series of polymer-coated MNPs. For comparison, the relaxivity values of Endorem, as reported by Basini et al., are shown [22].
Nanomaterials 10 01660 g006
Figure 7. (a) Longitudinal r1 and (b) transverse r2 NMRD profiles collected at room temperature in the Larmor frequency range 0.01 ν L 60   MHz for the second series of polymer-coated MNPs. For comparison, the relaxivity values of Endorem, as reported by Basini et al., are shown [22].
Nanomaterials 10 01660 g007
Figure 8. Longitudinal r1 NMRD profiles (symbols) collected at room temperature in the Larmor frequency range 0.01 ν L 60   MHz for the 8-nm series of polymer-coated MNPs. The solid lines represent the best fit obtained by applying the Roch’s model (see text).
Nanomaterials 10 01660 g008
Table 1. Mean diameters ± standard deviation of the inorganic cores for the first and second series, obtained by TEM.
SampledTEM
nm
first series samples17.0 ± 2.5
second series samples8.0 ± 0.4
Table 2. Longitudinal and transverse relaxivity values and their ratio at 15 and 60 MHz, for the 1st series of MNPs aqueous dispersions at room temperature.
SampleFrequencyr1
(s−1mM−1)
r2
(s−1mM−1)
r2/r1
A-1760 MHz12.4 (1.0)396.8 (31.7)32
15 MHz48.4 (3.9)396.8 (31.7)8.2
B-1760 MHz11.3 (0.9)285.7 (22.8)25.3
15 MHz47.1 (3.8)314.9 (25.2)6.7
C-1760 MHz10.9 (0.9)398.7 (31.9)36.6
15 MHz44.5 (3.6)365.5 (29.2)8.2
D-1760 MHz12.6 (1.0)401.8 (32.1)31.9
15 MHz49.9 (4.0)381.7 (30.5)7.6
Endorem60 MHz12.3 (1.0)131.6 (10.5)10.7
15 MHz27.5 (2.2)138.9 (11.1)5
Table 3. Longitudinal and transverse relaxivity values and their ratio at 15 and 60 MHz, for the 2nd series of MNPs aqueous dispersions at room temperature.
SampleFrequencyr1
(s−1mM−1)
r2
(s−1mM−1)
r2/r1
A-860 MHz14.7 (1.2)121.0 (9.7)8.2
15.1 MHz42.5 (3.4)116.7 (9.3)2.7
B-860 MHz14.7 (1.2)123.7 (9.9)8.4
15.1 MHz45.1 (3.6)121.1 (9.7)2.7
C-860 MHz14.5 (1.2)123.1 (9.9)8.5
15.1 MHz43.6 (3.5)122.13 (9.8)2.8
D-860 MHz14.9 (1.2)126.7 (10.1)8.5
15.1 MHz46.2 (3.7)131.9 (10.6)2.9
Endorem60 MHz12.3 (1.0)131.6 (10.5)10.7
15 MHz27.5 (2.2)138.9 (11.1)5

