Article

Two-Dimensional Tungsten Disulfide-Based Ethylene Glycol Nanofluids: Stability, Thermal Conductivity, and Rheological Properties

by
Syed Nadeem Abbas Shah
1,2,
Syed Shahabuddin
3,*,
Mohd Faizul Mohd Sabri
1,*,
Mohd Faiz Mohd Salleh
4,
Suhana Mohd Said
4,
Khaled Mohamed Khedher
5,6 and
Nanthini Sridewi
7,*
1
Department of Mechanical Engineering, Faculty of Engineering, University of Malaya, Kuala Lumpur 50603, Malaysia
2
Department of Mechanical Engineering (Main Campus Lahore), University of Engineering and Technology, Lahore 54890, Pakistan
3
Department of Science, School of Technology, Pandit Deendayal Petroleum University, Knowledge Corridor, Raisan Village, Gandhinagar 382007, Gujarat, India
4
Department of Electrical Engineering, Faculty of Engineering, University of Malaya, Kuala Lumpur 50603, Malaysia
5
Department of Civil Engineering, College of Engineering, King Khalid University, Abha 61421, Saudi Arabia
6
Department of Civil Engineering, High Institute of Technological Studies, Mrezgua University Campus, Nabeul 8000, Tunisia
7
Department of Maritime Science and Technology, Faculty of Defence Science and Technology, National Defence University of Malaysia, Kuala Lumpur 57000, Malaysia
*
Authors to whom correspondence should be addressed.
Nanomaterials 2020, 10(7), 1340; https://doi.org/10.3390/nano10071340
Submission received: 15 May 2020 / Revised: 29 June 2020 / Accepted: 4 July 2020 / Published: 9 July 2020
(This article belongs to the Special Issue Nanofluids and Nanofluidics)

Abstract

:
Developing stable nanofluids and improving their thermo-physical properties are highly important in heat transfer applications. In the present work, the stability, thermal conductivity, and rheological properties of tungsten disulphide (WS2) nanoparticles (NPs) with ethylene glycol (EG) were profoundly examined using a particle size analyzer, zeta-sizer, thermal property analyzer, rheometer, and pH measuring system. WS2 NPs were characterized by various techniques, such as XRD (X-Ray Diffraction), FTIR (Fourier Transform Infrared Spectroscopy), FESEM (Field emission scanning electron microscopy), and high-resolution transmission electron microscopy (HRTEM). The nanofluids were obtained with the two-step method by employing three volume concentrations (0.005%, 0.01%, and 0.02%) of WS2. The influence of different surfactants (Sodium dodecyl sulphate (SDS), Sodium dodecylbenzenesulfonate (SDBS), Cetyltrimethylammonium bromide (CTAB)) with various volume concentrations (0.05–2%) on the measured properties has also been evaluated. Pristine WS2/EG nanofluids exhibit low zeta potential values, i.e., −7.9 mV, −9.3 mV, and −5 mV, corresponding to 0.005%, 0.01%, and 0.02% nanofluid, respectively. However, the zeta potential surpassed the threshold (±30 mV) and the maximum values reached of −52 mV, −45 mV, and 42 mV for SDS, SDBS, and CTAB-containing nanofluids. This showed the successful adsorption of surfactants onto WS2, which was also observed through the increased agglomerate size of up to 1720 nm. Concurrently, particularly for 0.05% SDS with 0.005% WS2, thermal conductivity was enhanced by up to 4.5%, with a corresponding decrease in viscosity of up to 10.5% in a temperature range of 25–70 °C, as compared to EG. Conversely, the viscoelastic analysis has indicated considerable yield stress due to the presence of surfactants, while the pristine nanofluids exhibited enhanced fluidity over the entire tested deformation range. The shear flow behavior showed a transition from a non-Newtonian to a Newtonian fluid at a low shear rate of 10 s−1. Besides this, the temperature sweep analysis has shown a viscosity reduction in a range of temperatures (25–70 °C), with an indication of a critical temperature limit. However, owing to an anomalous reduction in the dynamic viscosity of up to 10.5% and an enhancement in the thermal conductivity of up to 6.9%, WS2/EG nanofluids could be considered as a potential candidate for heat transfer applications.

Graphical Abstract

1. Introduction

Various engineering applications—for instance, solar thermal, automobile engine cooling, and electronic cooling—employ heat exchanging systems to dissipate heat between two or more than two fluids [1,2]. The common heat transfer fluids used in many commercial heating and cooling processes include water, ethylene glycol, and oils [3,4]. Owing to their low thermal conductivity as compared to bulk metals, they exhibit poor heat dissipation capabilities. Since the development of nanofluids, these are presumed to be an alternative heat transfer carrier fluid. The thermo-physical properties of nanofluids, such as thermal conductivity and viscosity, play a vital role in improving the flow thermal system’s efficiency [5,6]. The viscosity is the internal resistance between the layers of fluids, which increases the pumping power [7]. In this context, the flow curve analysis can give sufficient information about the storage stability and pumping power required for the flow systems. Therefore, the rheological properties of nanofluids should be evaluated in the first instance [8]. Such rheological characteristics of nanofluids are attributed to the structural properties of the nanomaterials dispersed within the base fluid network [9]. Moreover, the thermal conductivity enhancement with the addition of nanoparticles (NPs) in the base fluid has been reported by many researchers, along with viscosity enhancement [10,11]. However, only a few studies are available in the literature which have reported a reduction in viscosity and an enhancement in thermal conductivity using colloidal solutions [12,13]. Therefore, a more rigorous investigation is required in order to identify the colloidal suspensions for flow thermal systems which not only improve thermal transport but also reduce the viscosity. The reduced viscosity can significantly mitigate the frictional losses during fluid flow. Thus, the reduced viscosity can add value in the efficiency improvement of flow thermal systems by decreasing the input pumping power.
As nanofluids have become next generation heat transfer fluids, with improved thermo-physical properties, many multifunctional nanomaterials have been utilized to exploit their potential in nanofluids. Currently, the two-dimensional, layered materials are of great concern for scientists and engineers due to their remarkable electrical, thermal, super-lubrication, optical, and catalytic properties [12,14,15,16]. In addition to graphene, transition metal chalcogenides (TMDCs) have attracted researchers due to their tremendous semiconducting and metallic properties, ascribed to their layered structure which is similar to that of graphene [15]. WS2 has shown better lubricity because of the weak intermolecular interactions among the sheets, which causes easy shearing with a fullerene-like structure [17,18]. Research has also focused on transition metal oxides in order to study their transport properties. Karimi-Nazarabad et al. have reported ~46.9% reduction in viscosity and 6.7% thermal conductivity enhancement using WO3-glycerol nanofluids, along with about two weeks of stability. In addition, an increase in viscosity for WO3-glycol and WO3-ethylene glycol nanofluids was also witnessed [8]. Recently, Kamel and Lezsovits demonstrated that WO3/water-based nanofluids improve the boiling heat transfer performance of horizontal heated copper tubes. However, a ~15% decline in the boiling heat transfer coefficient was observed as a result of nanoflake deposition on the wall of the tube, corresponding to a higher concentration. This suggests that the stability of the nanofluids is of great importance and should also be investigated parallel to the thermal and flow characteristics [19]. In addition, Paloma Martínez-Merino et al. have shown that the dispersion of MoS2 and WS2 increases the thermal conductivity of a typical concentrated solar plant (CSP) thermal oil. A maximum 45.6% and ~34.5% improvement in thermal conductivity was achieved corresponding to MoS2 nanowires and WS2 nanosheets, respectively, at an operating temperature of 90 °C [20]. Chen et al. have shown that the viscosity of EG-CNT nanofluids decreases at a particular concentration of carbon nanotube (CNT) due to the self-lubrication characteristics of CNTs [12]. In another report, transformer oil-based Ag-WO3 hybrid nanofluids have shown a 41% increase in thermal conductivity at a temperature of 100 °C [3]. Zhu et al.’s results revealed ~60.78% thermal conductivity enhancement using 0.75 vol% of CuO nanowires, along with a 6.41% increase in viscosity [21]. Pal et al. have elucidated up to 10% thermal conductivity improvement and three days of stability with a SiO2 coating over WO3 NPs in an aqueous phase. Moreover, the WO3 aqueous suspensions have displayed ~13.8% thermal conductivity enhancement without any coating material. This suggested that the coatings may reduce the thermal conductivity due to kapitza resistance at the solid–liquid interface [4]. Recently, two dimensional (2D) WS2 nanomaterial-based nanofluids have been characterized for concentrating solar power plants. It was reported that WS2 sheet incorporation did not alter the surface tension, viscosity, and specific heat capacity to a larger extent. However, the thermal conductivity improvement (~30%) reached a substantial value when compared to the typical heat transfer base fluid pertinent to CSP applications. There has also been observed no marked variation in the friction factor in comparison to the base fluid, suggesting no increase in pressure drop [22]. Additionally, the transport properties of nanofluids are also significantly affected by the shape, size, concentration of NPs, base fluid properties, pH, presence of surfactants, and the interface interaction between the base fluid and NPs [6]. Moreover, another long standing challenge for the commercial use of nanofluids is the colloidal instability [4,8]. The precipitation of colloidal suspensions is obvious due to the aging effect, which causes coagulation [23]. To re-disperse such coagulates is difficult in base fluids due to the high surface energy [24]. Consequently, it reduces the thermal conductivity of the nanofluids. Therefore, it has become necessary to prevent agglomeration and sedimentation by improving the surface charge of nanoparticles. Researchers have utilized various techniques, such as covalent (chemical structure modification) and non-covalent (using surfactants) functionalization, to improve surface activity. In addition, plasma functionalization has also been used to achieve high dispersion stability [25]. However, the process’ complexity and high cost still remains a limitation. Thus, surfactants are still an economical and facile choice to develop stable colloidal suspensions. Saterlie et al. reported the effect of surfactants (Polyvinylpyrrolidone (PVP), SDBS, oleic acid, and CTAB) on the thermal conductivity and dispersion stability of Cu-H2O colloidal suspensions. They found that the charge imbalance with time causes nanoparticle coagulation, which reduces the thermal conductivity [23].
The aforementioned studies have revealed that only a few experimental investigations have been carried out that are related to the stability and thermo-physical properties of TMDC-based nanofluids. However, the super-lubricity of TMDCs has the potential to improve the rheological properties of nanofluids, whereas the thermal, semiconducting, and metallic characteristics may also improve the thermal conductivity, leading to the better performance of heat transfer systems. In addition, to the best of the author’s knowledge, the literature has not reported much on the tungsten disulphide (WS2)/EG nanofluid’s stability, thermal conductivity, and rheological properties in the presence of different surfactants as stabilizers and rheology modifiers. As reported earlier, besides improvements in the dispersion stability, the surfactant can also reduce the viscosity. For instance, Zhou et al. have shown that the analogous micelle effect of SDS can lower the viscosity of water-based TiO2 nanofluids on top of the lubrication effect of nanoparticles [26]. As previously stated, SDBS and CTAB have not been explored in terms of their synergistic rheological property modifications. Therefore, in the present work, various surfactants, such as anionic (SDS, SDBS) and cationic (CTAB) surfactants, were chosen as an economical means for two reasons: firstly, to exploit their steric hindrance effect for the better dispersion of WS2/EG nanofluids [27]; secondly, the interfacial tension lowering characteristics may also contribute towards viscosity reduction [26]. Therefore, in the present work, a comprehensive experimental evaluation of WS2/EG nanofluids’ dispersion stability at 25 °C and the thermal conductivity in a particular temperature range (25–70 °C) has been carried out. The shear flow and viscoelastic behavior was evaluated at 25 °C, while the temperature sweep dynamic viscosity was studied between 25 and 70 °C. Furthermore, the influence of anionic (SDS, SDBS) and cationic (CTAB) surfactants on stability, thermal conductivity, and rheological properties have also been investigated. In addition, the rheological experimental results have also been correlated with suitable models to develop conceivable synergies. The objective of the present experimental study was to incorporate a novel 2D WS2 in EG-based nanofluids in order to explore their stability and thermo-physical properties for potential flow thermal systems.

2. Materials and Methods

2.1. Materials

All the materials in the experimental examinations were used without further modifications. The specifications of the nanoparticles and the surfactants and base fluid are shown in Table 1 and Table 2, respectively.

2.2. Methods

2.2.1. Material Characterization Techniques

The phase identification and purity of the WS2 nanoparticles were carried out by observing the X-ray diffraction patterns using an Empyrean X-ray powder diffractometer (Malvern Panalytical Ltd., Malvern, UK) with Cu-Kα radiations with a wavelength of 1.54 Å over 2θ range 10–80°. Fourier transform infrared (FTIR) spectra were captured on a FT/IR-100 spectrophotometer (Perkin Elmer, Billerica, MA, USA) within the wavenumber range of 450–4000 cm−1 using KBr pellets. The morphology was confirmed by employing field emission scanning electron microscopy (FESEM, JSM-7600F, operated at 10 kV by JEOL Ltd., Tokyo, Japan) and high-resolution transmission electron microscopy (HRTEM, JEM-2100F by JEOL Ltd., Tokyo, Japan).

2.2.2. Nanofluid Preparation

The WS2/EG nanofluids were prepared using a two-step method. The WS2 NPs were weighed corresponding to volume concentrations of 0.005% (0.375 mg/mL), 0.01% (0.7502 mg/mL), and 0.02% (1.5 mg/mL) and mixed with the base fluid along with various volume concentrations (0.05%, 0.5%, 1%, and 2%) of SDS, SDBS, and CTAB surfactants. The volume fraction of NPs and surfactants in liquid were obtained from the weight of the dry powder(s) and the total volume of the mixture. The mixture suspension was subjected to magnetic stirring (40 °C and 250 rpm) in order to break the agglomeration for 30 min. Finally, the colloidal suspension was sonicated (45 kHz) for 90 min to obtain homogeneous and stable nanofluids.

2.2.3. Nanofluid Measurement Instruments/Techniques

The stability of the WS2/EG nanofluids was measured with the Litesizer 500 (Anton Paar, Graz, Austria) by estimating the zeta potential. It employs the electrophoretic light scattering (ELS) technique, as per ISO 13099-2:2012. The Litesizer 500 is also capable of measuring particle sizes within a range of 0.3 nm–10 µm with a minimum sample requirement of ~20µL. The measurement accuracy and repeatability for the reference material (polystyrene latex) is ~±10% and ~±2%, respectively. The particle size distribution was analyzed to determine the polydispersity index (PDI) of the solution and the hydrodynamic diameter of the particle(s). The particle size estimation is based on the dynamic light scattering technique, as per ISO 22412:2017. To estimate the particle size, supernatant liquid was used to dilute the samples. Supernatant liquid was prepared from the parent sample using a tabletop centrifuge (Anton Paar, Graz, Austria) at 5000 rpm for 3 min. The auto detection angle mode was used to avoid the effect of multiple scattering in the particle size measurements. However, the relative standard deviation of the particle size distribution for the three measurements was found to be less than 2%, with around 6% error. Furthermore, to correlate stability with the isoelectric point (IEP), the pH of all samples was measured using pH 700 (Thermo Fisher Scientific, Waltham, MA, USA). The calibration of the apparatus was done using buffer solutions with known pH of 4, 7, and 10. All measurements for stability evaluation were performed at 25 °C.
The thermal conductivity measurements of the WS2/EG nanofluids were conducted with a KD2 thermal conductivity meter (Decagon Devices Inc., Pullman, WA, USA), as per ASTM D5334 and IEEE 442-1981 [28]. The KS-1 sensor probe was used, with an accuracy of ±5% within 0.2–2 W/m.K [29]. Before starting measurements, the KS-1 sensor was calibrated with the standard glycerin solution, distilled water, and ethylene glycol. The calibration results were obtained within instrumental measurement uncertainty. The nanofluid thermal conductivity data were taken in a range of temperatures (25–70 °C). The samples were maintained at a constant temperature by employing the thermostat water bath (Daihan Scientific, Wonju-si, South Korea) for 30 min to minimize the influence of micro-convection on the measured results. In total, 10 measurements were recorded, and an average was given in the analysis. Finally, the uncertainty analysis of the thermal conductivity data showed that the standard deviation from the mean was less than ±5% and results were presented in the form (mean ± margin of error) with a 95% confidence interval. The absolute uncertainty of the thermal conductivity data is computed using Equation (1), considering a 95% confidence interval [30].
x = x ¯   ±   2.262 × σ n
x ¯ is the mean thermal conductivity, 2.262 is the factor taken from the t-distribution table (t-statistics) for the two-tail test against a 95% confidence interval, corresponding to a degree of freedom of nine, σ is the standard deviation of the measurement set, and n is the number of measurements.
Rheological measurements of the prepared WS2/EG nanofluids were carried out with the MCR series rheometer (Model 302-SN82171186, Anton Paar Asia Pacific Laboratory, Kuala Lumpur, Malaysia). The double-gap measuring geometry (DG 26.7-SN39066) with a 1 mm gap was chosen to test the low viscosity samples [31]. The small gaps between the concentric cylinders allow measurements with sample volumes as small as 3 mL. Before commencing the measurements, the motor torque was adjusted with a quick air check for reliable and repeatable measurements. In addition, the rheometer was calibrated with water and ethylene glycol. The maximum error was computed at ~5% in a temperature range of 10–70 °C, with ~4% relative standard deviation. Nevertheless, Yu et al. have already revealed the maximum errors to be ~3% and ~5% in rotational and oscillation measurements, respectively, for DG (double gap) measuring geometry [31]. To minimize the pre-shear history effects, samples were placed static inside the holder at constant temperature for 10 min. The shear flow behavior of the nanofluids was examined at 25 °C in a shear rate range (1–1000 s−1) in order to determine the dynamic viscosity and flow behavior. The temperature sweep test (25–70 °C) was performed at a constant shear rate (50 s−1 with pre-shear for 180 s), with a temperature ramp of 2 °C/min. Furthermore, the direct strain oscillation (DSO) test was conducted to study the structural behavior of the nanofluids (viscoelastic behavior) at a constant frequency (1 Hz) and variable strain/deformation (0.01–1000%). This test allows an insight into the nanofluids’ structural linearity in the form of the linear viscoelastic region (LVER), flow point, true yield point, G’ (storage modulus), and G” (loss modulus). Finally, the Rheo Compass software (V1.22.435, Anton Paar, Graz, Austria) was employed to record and analyze the rheological data.

3. Results

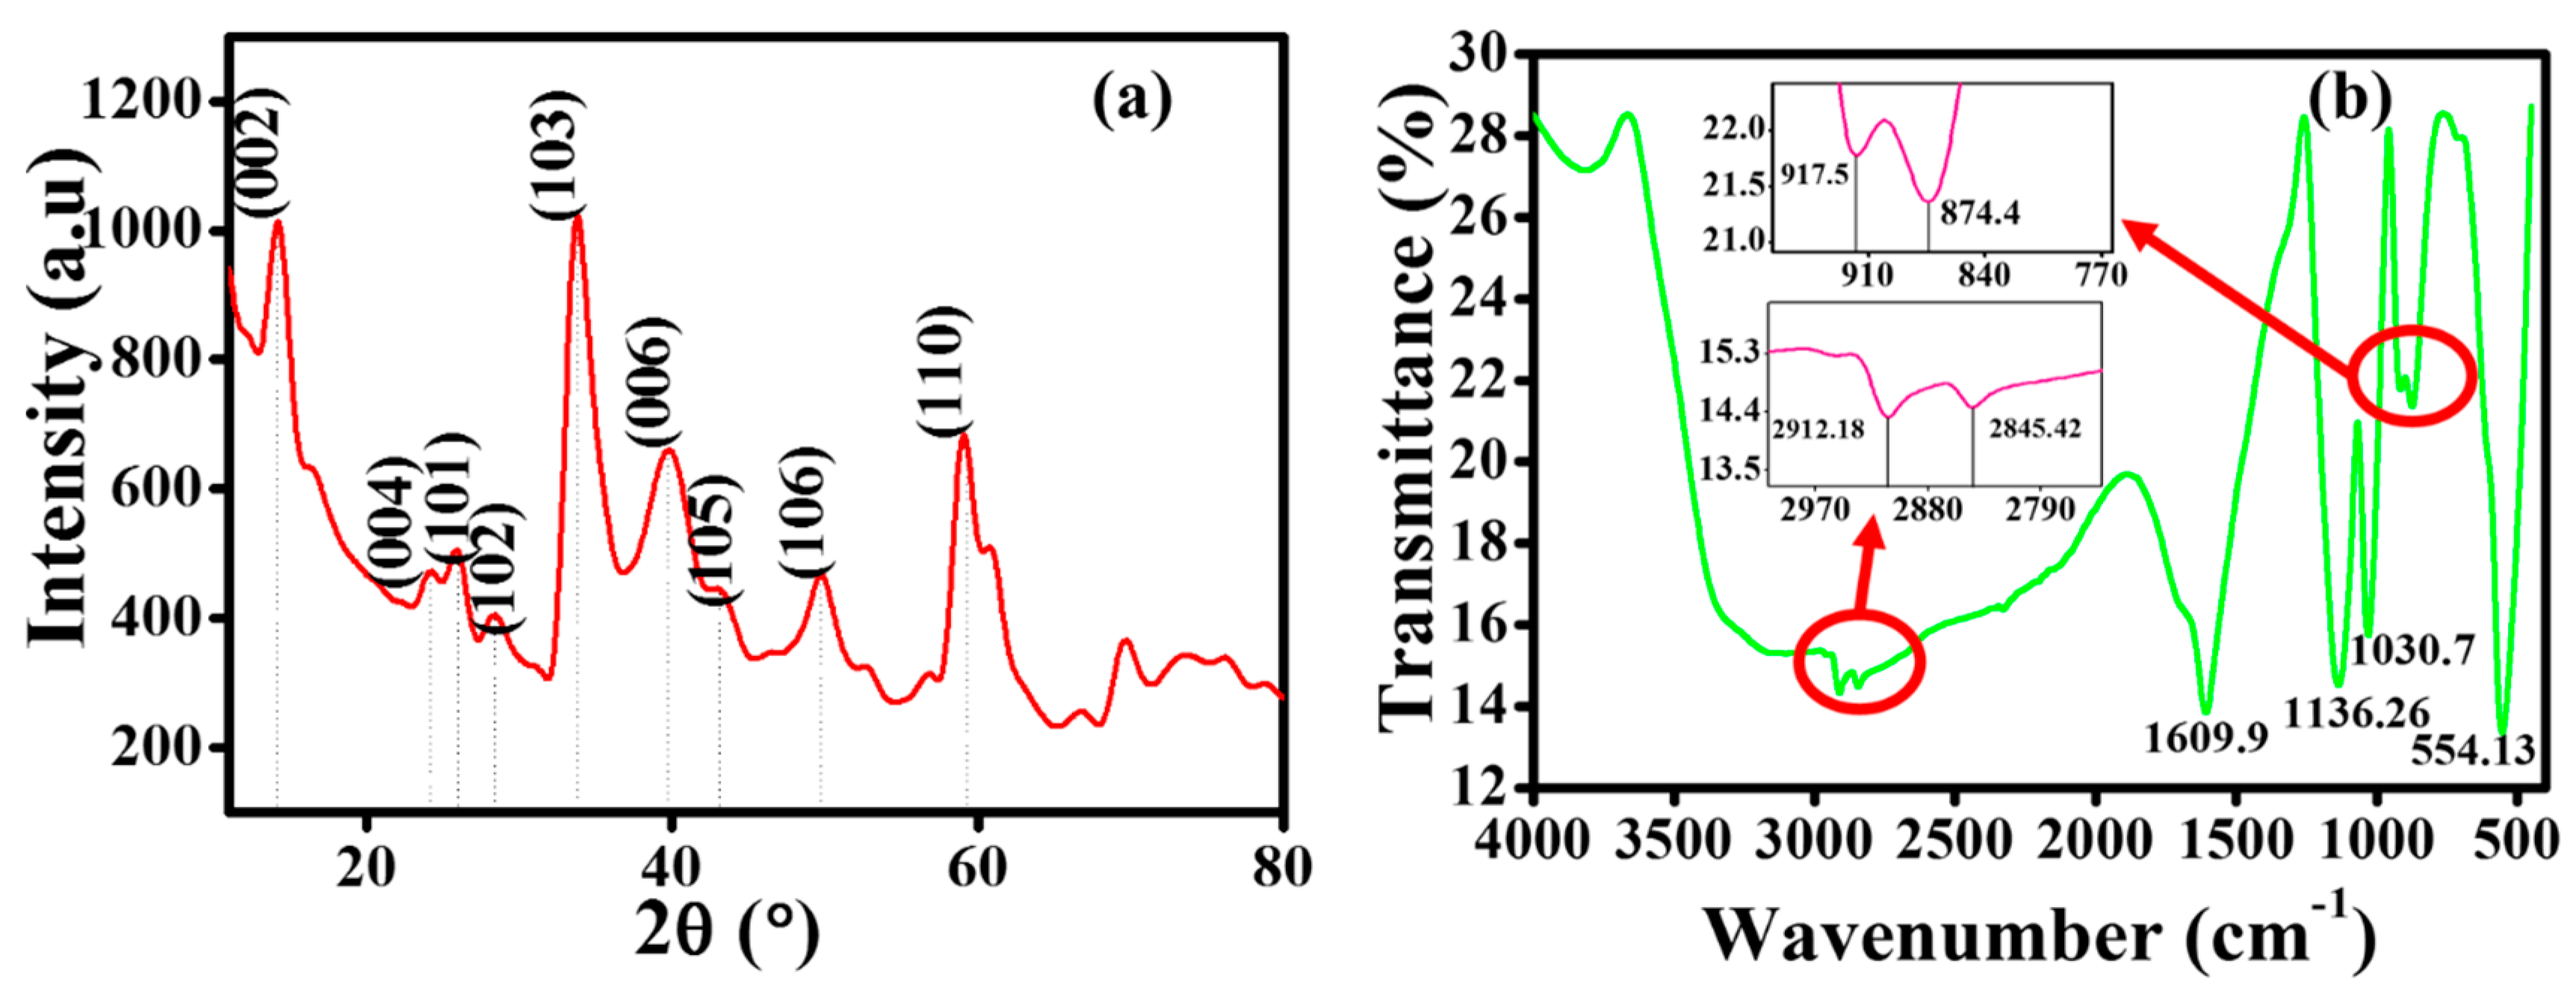
3.1. Material Characterization Analysis

XRD was performed to investigate the crystallinity of the WS2 nanostructure. Though it was challenging to utilize powder XRD for WS2, the diffraction pattern exhibited nine sufficiently resolved peaks. Figure 1a shows the XRD pattern of WS2 nano powder; the first peak appeared at 2θ ~14.3°, which has been ascribed to the (002) plane. This particular plane (002) represents the hexagonal structure of the WS2 [32]; it also indicates the multilayer structure of the WS2 nano powder [33]. The inter-plane distance (d-spacing) at 2θ ~14.3° was calculated as ~6 Å (using Bragg’s Law), which is typical for TMDCs [15,18]. The successive peaks were located at 2θ ~24.4° (004), 2θ ~25.9° (101), 2θ ~28.4° (102), 2θ ~33.4° (103), 2θ ~39.3° (006), 2θ ~43.2° (105), 2θ ~49.9° (106), and 2θ ~58.9° (110), with their corresponding reflection planes. These XRD peaks were well matched with 2H–WS2–JCPDS (Joint Committee on Powder Diffraction Standards) number (84–1398) [15]. Additionally, the presence of (002), (101), and (110) planes confirmed the multilayer 2D structure of WS2 nano powder [16].
Furthermore, the morphology of WS2, as obtained from FESEM and HRTEM, is shown in Figure 2. It can be seen from the morphology results that the WS2 nano powder has a sheet or plate-like structure [16]. The mean size was approximately 90 nm according to the supplier, which was well in agreement with the Debye–Scherrer calculations (~93 nm) [34]. Subsequently, the FTIR spectra were recorded to identify the chemical bonds in the molecules, with the assistance of infrared absorption bands. This analytical tool distinguishes the functional groups and offers an insight into the covalent bonds. Figure 1b clearly highlights the distinct peaks of the vibrational modes for WS2 nano powder. The peak that appeared at around 554.13 cm−1 was attributed to the W-S bond, whereas the one at around 917.5 cm−1 was ascribed to the S–S bond. On the other hand, the peak position at around 1609.9 cm−1 was referred to as the stretching deformation of the hydroxyl group, and 2912.18 cm−1 corresponded to the O–H vibration [18,35].

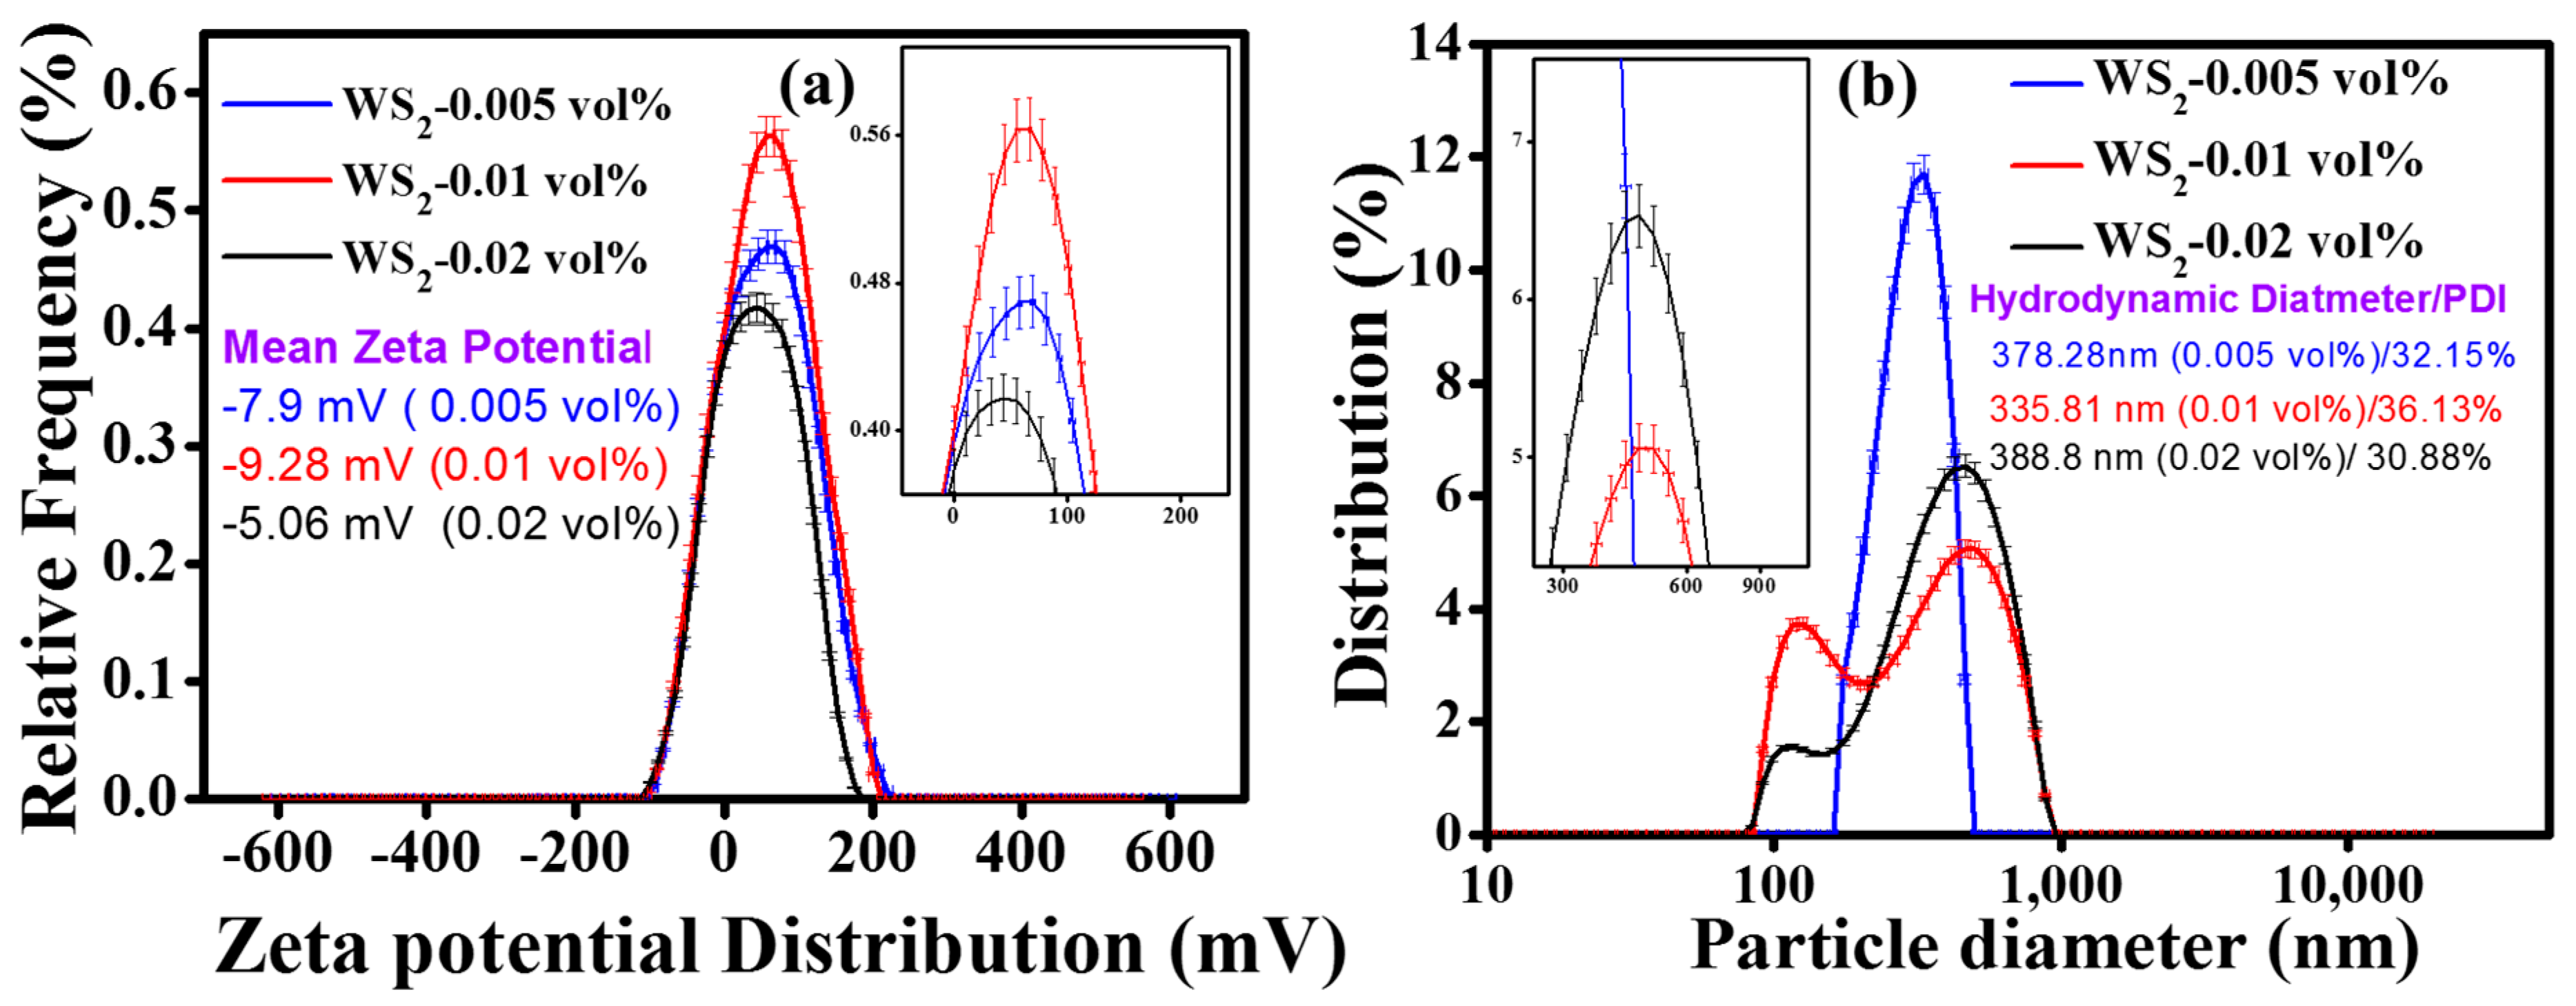
3.2. Stability and Particle Size Distribution Analysis

Figure 3a shows the zeta potential distribution of pristine WS2/EG nanofluids. The mean zeta potential was obtained to be −7.9 mV, −9.28 mV, −5.06 mV, corresponding to 0.005%, 0.01%, and 0.02% volume concentrations, respectively. Contrary to the zeta potential distribution, the particle size distribution in Figure 3b shows that the mean particle diameter was about 378.28 nm, 335.81 nm, and 388.8 nm, corresponding to mean zeta potential values of −7.9 mV, −9.28 mV, and −5.06 mV, respectively. Here, it is interesting to note that the particle size was well-linked with the zeta potential. For instance, the higher mean zeta potential corresponded to a smaller mean particle diameter. Nevertheless, at the moment, this was the case of pristine nanofluids (without surfactant) only. However, the particle size distribution at higher concentrations (0.01 and 0.02 vol%) of WS2 showed bi-modal peaks, which indicated the agglomeration tendency of colloids, leading to different aggregate sizes in the WS2/EG nanofluids. In fact, the Van der Waals interaction among the co-particles caused this behavior, as the higher concentration reduced the inter-particle spacing. All in all, the zeta potential and particle size distribution suggested the optimum concentration of WS2/EG nanofluids, as the 0.005% volume concentration of pristine WS2/EG nanofluids showed intermediate zeta potential (−7.9 mV) and a unimodal particle size distribution peak of around 378.28 nm. Thus, this can be regarded as the optimum concentration, with no significant tendency of agglomeration, even though 0.01 vol% nanofluid showed a high mean zeta potential (−9.28 mV) but bi-modal distribution peaks. Such observations have also been reported in the literature, where the mean particle size decreased as the zeta potential increased [36]. Previous investigations on nanofluids have demonstrated a threshold value of zeta potential (>±30 mV), for which nanofluids are regarded as stable [37,38]. In the current work, three different surfactants, such as SDS, SDBS, and CTAB were added in order to surpass the zeta potential threshold.

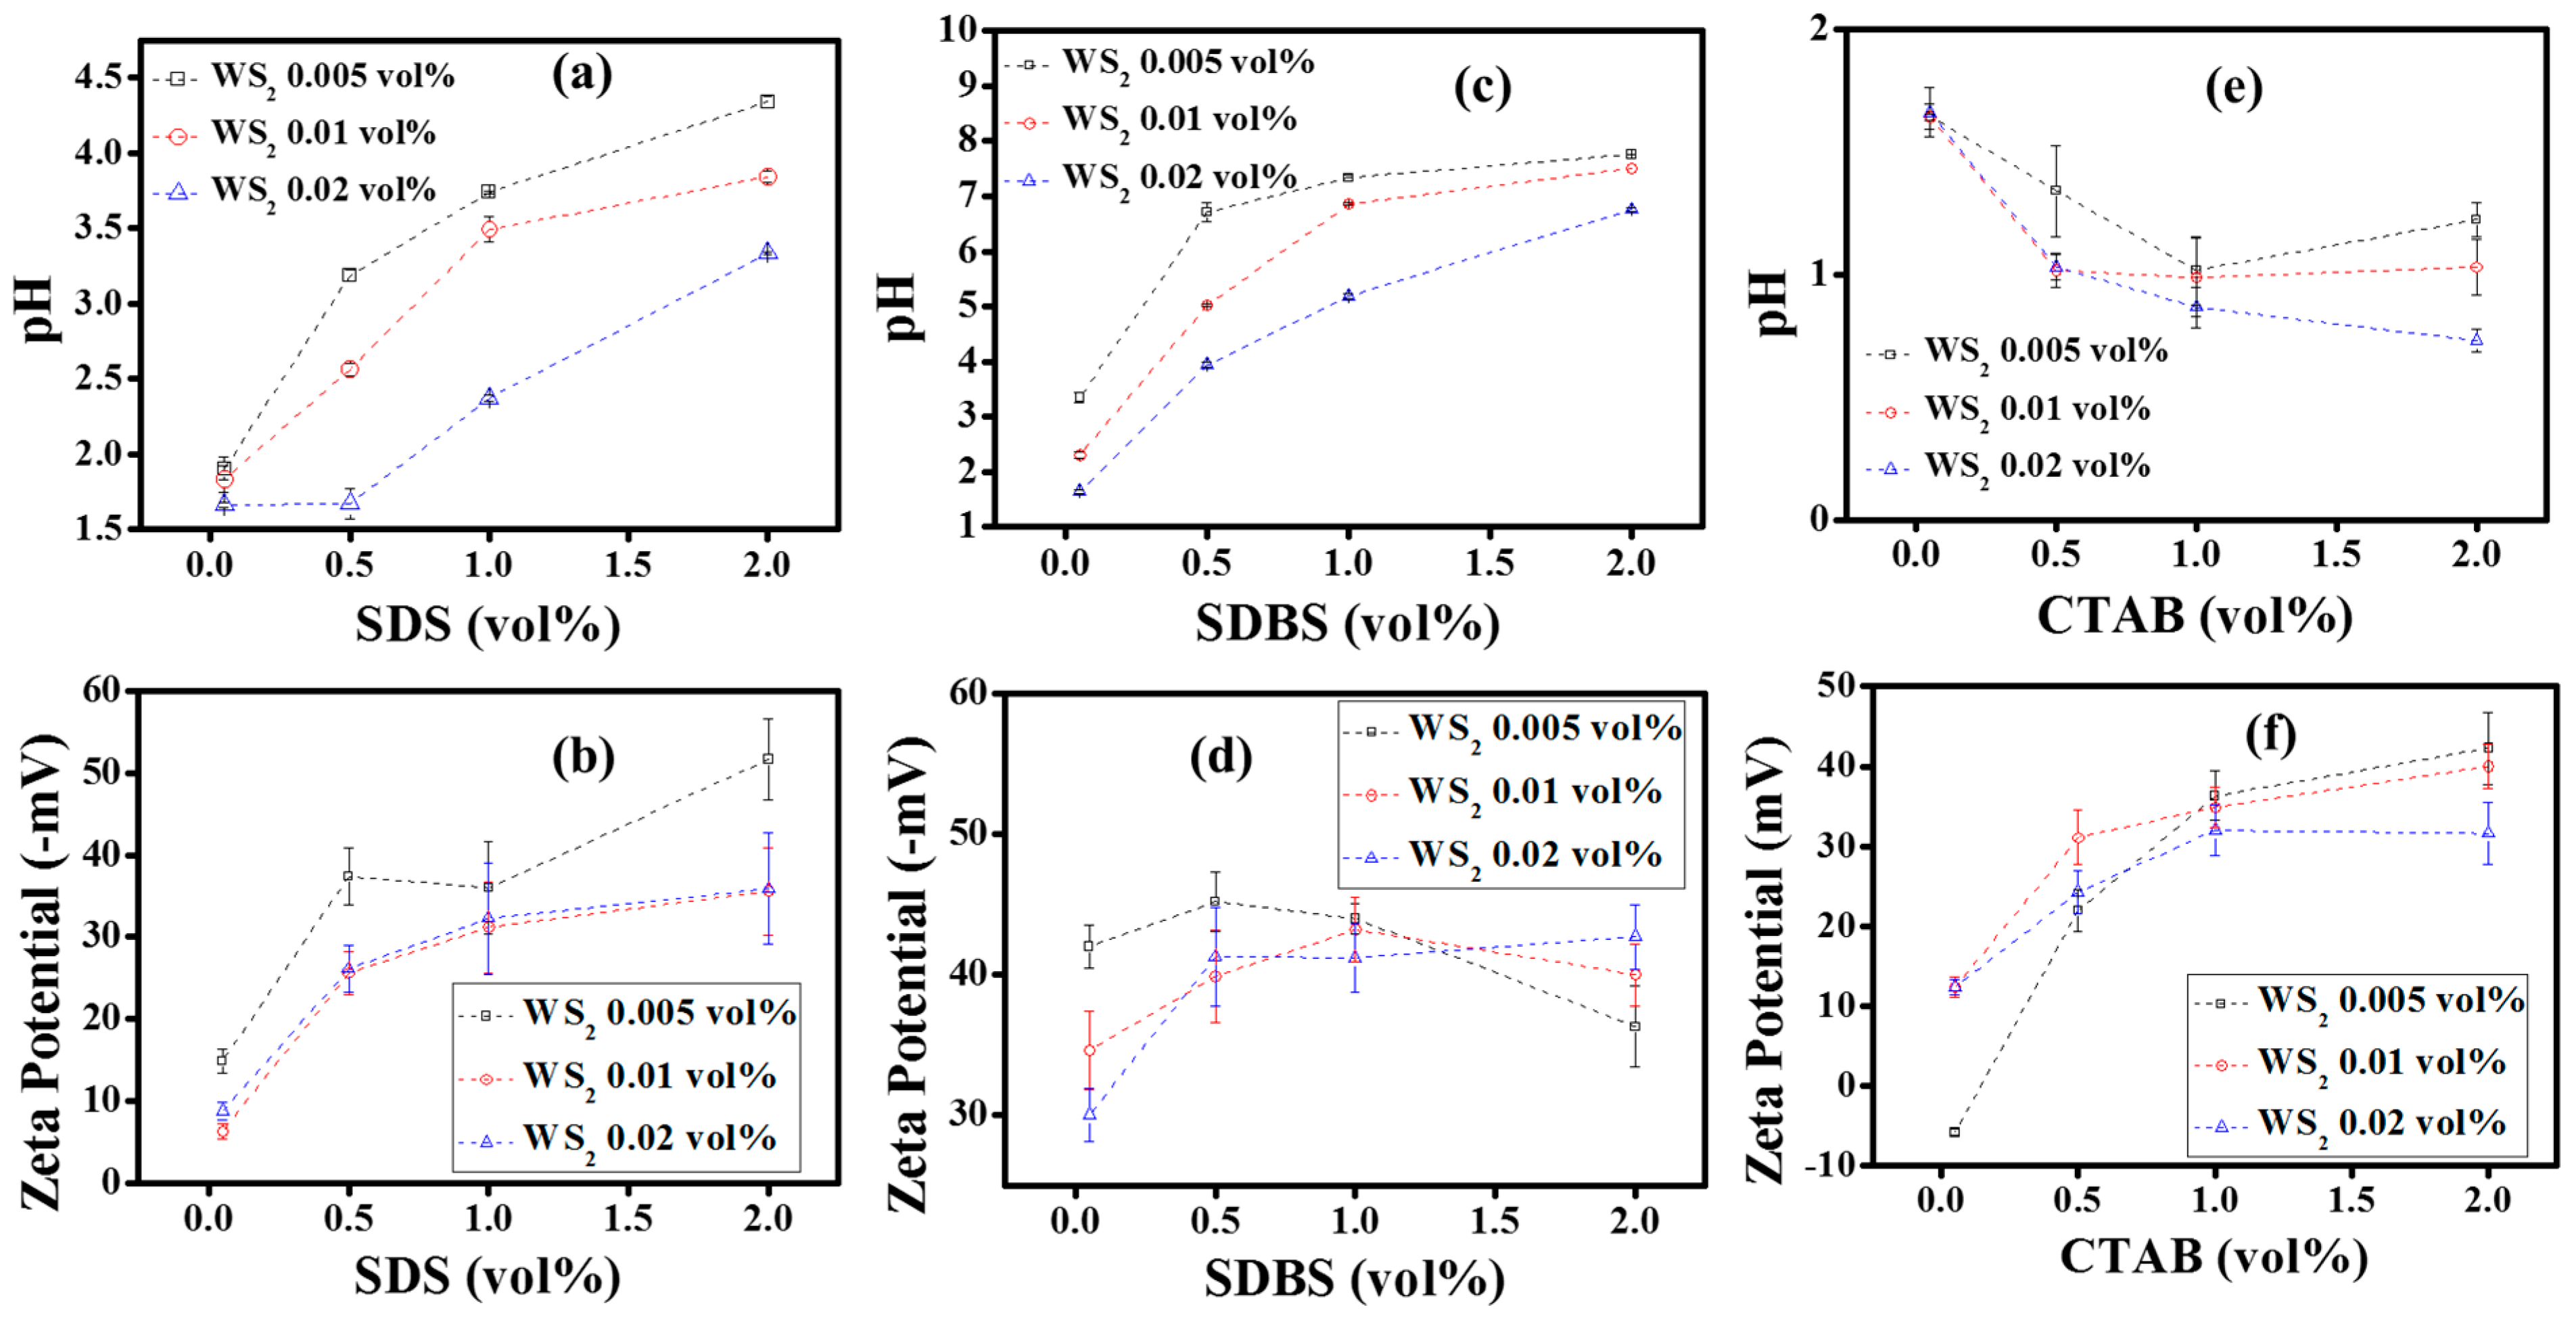
Effect of Surfactants on Stability of WS2/EG Nanofluids

Figure 4 shows the influence of surfactants on the mean zeta potential and pH of WS2/EG nanofluids. It can be observed from Figure 4b that, in contrast to pristine WS2/EG nanofluids, the SDS surfactant showed an increasing trend of mean zeta potential with concentration dependency. The mean zeta potential value shifted from −14.9 to −51.7 mV for 0.005% of WS2/EG nanofluid as the SDS surfactant concentration varied from 0.05 to 2 vol%. Similar behavior of SDS with 0.01% and 0.02% Ws2/EG nanofluids was also observed, but only the higher concentrations (1 and 2 vol%) of SDS crossed the threshold limit of mean zeta potential. On the other hand, SDBS’ response to WS2/EG nanofluids was rather interesting, as the mean zeta potential exceeded the threshold limit for all concentrations of nanofluids, as shown in Figure 4d. This may be due to the fact that the aromatic characteristics of SDBS have a strong tendency towards steric hindrance for better colloidal dispersion [38]. However, the CTAB surfactant’s interaction with the WS2/EG nanofluids was quite similar to that of SDS, but the zeta potential inversion (negative to positive) became significant at small concentrations of nanofluids, as shown in Figure 4f. A summary of the maximum mean zeta potential corresponding to the optimum surfactant concentrations for all nanofluid concentrations is shown in Table 3. These high zeta potentials were attributed to the surfactant layers being adsorbed onto the particle’s surface, which weakens the Van der Waals forces and prevents aggregation. Moreover, the stability of nanofluids is also dependent on the pH value, because the magnitude of the surface charge is also indicated by the pH value of the colloidal system [39]. Therefore, the pH of all samples was measured and correlated with the zeta potential, as shown in Figure 4a,c,e. The surfactant’s addition showed an exponential increasing trend in pH value with concentration, which indicated a gradual increase in the surface charge. This increasing trend in pH was found to be proportional to the mean zeta potential in a similar manner for most of the nanofluids which contained surfactants.
Apart from the mean zeta potential enhancement due to the steric hindrance effect, the increase in particle size was also noticeable. This size increment was attributed to the adsorption of surfactant molecules onto the particles’ surfaces, as shown in Figure 5a. Furthermore, the particle size distribution did not show much influence due to the surfactant’s adsorption, as the polydispersity index (PDI) was found to be sufficiently below 30, indicating the mono-dispersed state of most of the tested samples, as shown in Figure 5b. This means that the adsorption of surfactants increases the particle size but is less likely to form different sized aggregates in the WS2/EG nanofluids. However, PDI depends on the morphology of particles as well, and, according to ISO 22412:17, any value <7% is regarded as having a mono-dispersed state for spherical shaped particles. However, in the present case, the morphology was sheet-like, as shown in Figure 2. Therefore, it could be postulated that any PDI value <30% can be regarded as a mono-dispersed state for the non-spherical particles.
The WS2/EG nanofluids remained mono-dispersed for most of the formulations, and all the tested samples showed a secondary minimum potential energy behavior, according to DLVO theory. This means that the aging effect may cause the weak agglomeration of dispersions, which can be re-dispersed with an external agitation mechanism. Here, it is also worth mentioning that the density of particles is higher than the base fluid, as presented in the Materials section. This might cause the sedimentation of particles with time under the influence of gravity, irrespective of the type of surfactant. Nonetheless, the long-term colloidal instability of nanofluids is an unresolved mystery, as the aging effect is obvious from the present work. Consequently, a continuous investigation of colloidal stability is on its way as a recent development has introduced a novel three-step interface-based method to improve the stability of nanofluids. The newly developed technique works on the balance of the polar and dispersive components of the base fluid, which is well-suited to nanomaterial dispersion. Such adjustment leads to a minimum tension at the solid–liquid interface by using the non-ionic surfactant Triton X-100 (Panreac Quimica SLU, Barcelona, Spain). This approach showed better stability and an anomalous enhancement in thermo-physical properties based on the molecular dynamic simulation, even at 70 °C [40]. Meanwhile, in another recent report, Li et al. have shown the spacer length optimization of cationic Gemini surfactant that improved the colloidal stability of aqua-based Au and Ag nanofluids, along with the pH dependency of stability. It was also noted that at high temperatures, the bilayer coating of the surfactant becomes looser, which results in the poor stability of the nanofluids due to less surface charge density [41]. Conclusively, the long-term colloidal stability is presumed to be a crucial factor in determining the improvement in the thermo-physical properties of nanofluids.
As demonstrated by Liu et al., the convective heat transfer coefficient is strongly related to the particle size and dispersion stability [36]. Among many techniques, zeta potential is commonly used in the estimation of a nanofluid’s colloidal stability. It estimates the surface charge between the dispersed phase (nanoparticles) and continuous phase (base fluid). This surface charge determines how strong the repulsive force is that exists among the dispersed phase for long-term stability [42]. Conversely, the Van der Waals forces attract the particles, leading to agglomeration. This phenomenon is described by the colloidal theory (DLVO theory). The DLVO theory is an archetype to comprehend the balance between the Van der Waals and electrostatic forces, which determines the colloidal stability. On the other hand, the robust Van der Waals forces on the nanoparticle’s surface tries to attract other co-particles, which causes aggregation [43]. As a result, the large agglomerates/clusters undergo quick sedimentation under the influence of gravity. This instability owing to agglomeration can cause chocking in micro-channels and can decrease the thermal performance of nanofluids. Therefore, the understanding of the interfacial interactive forces (particle–liquid) are of considerable importance regarding the stability of nanofluids [44]. Generally, the colloidal stability is controlled by the pH value, surfactant, temperature, and viscosity of the nanofluid [41]. Therefore, it can be concluded from the findings of the present work that the addition of surfactants has sufficiently improved the mean zeta potential and the pH value, but it has also increased the aggregate size of the colloids.
More precisely, for 0.005% WS2, the addition of SDS (0.05%) increased zeta potential by ~88% in comparison to pristine nanofluid. This rate of improvement was reduced to 37% per 0.05% SDS addition when 0.5% SDS was incorporated, but the absolute value of the zeta potential increased. Similarly, for other nanofluid combinations with SDS, the absolute zeta potential values improved, but the rate of improvement with regards to surfactant concentrations became slow as the amount of surfactant increased. This also suggests that analogous micelles have been formed in the nanofluid formulations, which could be visualized in the form of increased agglomerate size as well. In case of SDS addition, the maximum increments in agglomerate size appeared at ~172%, ~245%, and 261%, corresponding to 0.005% WS2 + 2% SDS, 0.01% WS2 + 2% SDS, and 0.02% WS2 + 0.05% SDS, respectively. On the other hand, 0.05% SDBS increased the zeta potential to 431% for 0.005% WS2 nanofluid. Subsequently, the rate of increment was reduced to 47% per 0.05% SDS addition when 0.5% SDBS was added. At the same time, the maximum enhancement in agglomerate size was observed at ~108%, 233%, and 254%, corresponding to 0.005% WS2 + 1% SDBS, 0.01% WS2 + 2% SDBS, and 0.02% WS2 + 2% SDBS, respectively. However, for 0.05% CTAB, no significant variation in zeta potential was observed for 0.005% WS2 nanofluid, but for higher concentrations of CTAB, beyond 0.5%, the maximum enhancement was observed to be ~178%. Like SDS and SDBS, the enhancement rate was reduced to 18% per 0.05% CTAB when the concentration of CTAB was increased to 1%. In addition, the agglomerate size grew to ~67%, 410%, and 408%, corresponding to 0.005% WS2 + 2% CTAB, 0.01% WS2 + 2% CTAB, and 0.02% WS2 + 0.05% CTAB, respectively.

3.3. Thermal Conductivity Analysis

Based on the stability evaluation, the prepared samples have shown a reversible nature. Therefore, to deeply understand their potential towards thermal performance enhancement, all samples were tested and compared for thermal conductivity. The mean thermal conductivity data of the WS2/EG nanofluids, based on the uncertainty analysis with a 95% confidence level, is presented in Table S1 (Supplementary Materials). Meanwhile, Figure 6 shows the relationship between the relative thermal conductivity (knf/kbf) of WS2/EG nanofluids and surfactant concentration over different temperatures. Initially, the relative thermal conductivity of pristine WS2/EG nanofluids was computed from the mean thermal conductivity data and compared with the surfactant-containing nanofluids.
Figure 6a–c represents the effect of SDS surfactant on relative thermal conductivity at 25 °C, 50 °C, and 70 °C, respectively. At 25 °C, the relative thermal conductivity increased with the addition of SDS, which was found to be a maximum of ~2.8% more when compared to the base fluid, corresponding to a minimum volume concentration of SDS (0.05 vol%). Moreover, the maximum thermal conductivity enhancement for SDS-containing nanofluids was observed to be around 2.8%, 1.9%, and 2.2%, corresponding to 0.005%, 0.01%, and 0.02% WS2, respectively. Meanwhile, the corresponding improvements without surfactants were 1.6% (0.005% nanofluids) and 1.2% (0.01 and 0.02% nanofluids). Furthermore, the results revealed that any successive volume concentration of SDS beyond 0.05% also improved the thermal conductivity, but it had a lesser effect when compared to the former. Such a thermal conductivity enhancement trend was noted for the 0.005% and 0.01% nanofluids, while 0.02% nanofluids showed a decrease in thermal conductivity at a 2% SDS volume concentration. This may be attributed to the fact that the higher concentration of surfactant adsorbed onto the particle’s surface may offer additional resistance to heat conduction. Consequently, a decrease in thermal conductivity was observed at a higher concentration of surfactant. However, at elevated temperatures, the behavior of the nanofluids was interesting. For instance, at 50 °C, the performance of the nanofluids decreased significantly, except for 0.005% nanofluids with SDS volume concentrations of up to 1%. However, the overall thermal conductivity improvement was significant when compared to the base fluid. On the other hand, the pristine nanofluids showed thermal conductivity reductions of about 1.4%, 1.6%, and 1.9%, corresponding to 0.005%, 0.01%, and 0.02% nanofluids, respectively, as compared to the base fluid. Such behavior at a temperature of 50 °C can be ascribed to the possible flocculation of aggregates under the influence of gravity due to the reduction in the buoyancy force in case of pristine nanofluids. The temperature rise is supposed to intensify the Brownian motion, which results in more collision as well as a reduction in the viscosity. Besides this, at a higher temperature, the surfactant adsorption might start dissociating, leading to aggregation and instability, which affects the thermal performance [45]. In contrast to pristine nanofluids, the surfactant induced steric effect competes to balance the gravity effect and suppresses the quick flocculation up to certain concentrations (of SDS) beyond which flocculation might happen. This might decrease the thermal conductivity for any successive SDS concentration. Therefore, the SDS-containing nanofluids showed a thermal conductivity enhancement for certain concentrations. However, interestingly, at a temperature of 70 °C, the pristine nanofluids again showed significant improvements in thermal conductivity up to values of 3.9%, 3.5%, and 0.4%, corresponding to 0.005%, 0.01%, and 0.02% of WS2, respectively. Possibly, this intriguing behavior occurred due to the enhanced Brownian motion of the suspended, small-sized particles within the base fluid network at 70 °C. In addition to pristine nanofluids, SDS-containing formulations also showed thermal conductivity enhancements of about 4.5%, 4.6%, and 3%, corresponding to 0.005%, 0.01%, and 0.02% nanofluids, respectively, at certain SDS concentrations of 0.05%, 1%, and 2%, respectively. The possible reason for this enhancement at the elevated temperature of 70 °C could be the Brownian motion and the steric stabilization of small-sized colloids in the case of SDS-containing nanofluids. However, a fundamental investigation is further proposed in order to more deeply understand the physical mechanism behind this behavior of nanofluids. Similarly, the addition of SDBS and CTAB also reflected a synergistic improvement in the thermal conductivity of WS2/EG nanofluids, which also showed a concentration dependency, as depicted in Figure 6d–i, respectively. Thus, due to the concentration dependency, an oscillatory behavior was observed for the nanofluids, which suggested the optimized formulations that might influence the thermal conductivity the most.
Here, it is also noteworthy that the present data show similar behavior to those reported by Xia et al. The reason behind the oscillatory behavior of the tested samples against surfactant concentration was the critical micelle concentration (CMC). The lower surfactant amount may provide an insufficient steric effect, and a higher concentration may cause flocculation, leading to coagulation and sedimentation. Under such conditions, the thermal performance of nanofluids may be reduced [46]. Another plausible reason for the deterioration of thermal performance at an elevated temperature is related to the foaming formation due to the presence of surfactants [47]. Concurrently, the influence of buoyancy forces cannot be overlooked regarding the long-term stability of colloidal systems, especially at elevated temperatures. The elevated temperature weakens the inter-layer friction forces of nanofluids which assist in increasing the aggregates’ terminal velocity under the influence of gravity. This happens due to reduced viscosity, density, and buoyancy forces [48]. Therefore, the colloidal system becomes unstable, which might affect the thermal performance of nanofluids. In addition, many thermal conductivity enhancement mechanisms have been demonstrated in previous studies, such as percolation networks, clustering, interfacial liquid layering, and the Brownian motion [49]. However, the accurate measurement of thermal conductivity also requires better stability, specifically at elevated temperatures. In this context, Sooraj et al. have demonstrated that PVA surfactant-coated CuO nanoparticles showed small crystallite sizes, which improved their stability as well as their thermal conductivity [50]. Recently, Ebrahimi et al. have proposed the use of gelling agents in order to prevent the micro-convection effect during the thermal conductivity measurement of nanofluids. They showed better measurement accuracy with this approach over a range of temperatures [51]. Likewise, a molecular dynamic simulation investigation of the Triton X-100 surfactant has also shown ~79.5% enhancement in thermal conductivity for aqua-based carbon nanotube nanofluids at 70 °C. This enhancement was attributed to the better colloidal stability with the inclusion of a surfactant which lowers the interfacial tension between the solid–liquid network [40].
Unlike the current investigation, previous studies have not shown any significant temperature dependence of nanofluids relative to thermal conductivity in the presence of surfactants. However, the increase in the absolute thermal conductivity of nanofluids has been referred to as the intrinsic behavior of base fluids [45]. In addition, it has also been reported that the addition of surfactants into the base fluid network may affect the thermal conductivity and viscosity [47]. To gain insights into such behaviors, all the studied surfactants at targeted concentrations and temperatures were tested for thermal conductivity (Figure S1 Supplementary Materials). The results revealed that the surfactants’ inclusion reduced the thermal conductivity of the base fluid at all targeted concentrations and temperatures, except for the 25 °C temperature. A similar effect of surfactants on a base fluid was also reported in the literature [52]. Moreover, it was also observed that the samples with high values of zeta potential did not show more thermal conductivity enhancement. This may be due to the utilization of high concentrations of surfactants to induce the steric hindrance effect. On one hand, the high concentration improved the zeta potential, as discussed earlier, but, on the other hand, the high concentration also mitigates thermal conduction at the solid–liquid interface. This particular thermal conduction hindrance is termed the kapitza resistance. Such behavior of nanofluids was also reported in a previous study related to nanofluids, conducted by Leong et al. [53]. Contrary to the present and investigation and that of Leong at al., Liu et al. showed that small-sized particles are not necessary to show better thermal performance. Instead, it is the stability of the colloidal system in terms of the mean zeta potential and the mean particle size which determines the thermal performance enhancement of nanofluid systems [36].
In summary, it could be postulated that the WS2/EG nanofluids did not show any consistent trend of thermal conductivity based on concentration and temperature. It has to be noted that there is no study related to WS2/EG nanofluids reported in the literature to which we can compare the current data. However, an improvement in thermal conductivity was observed with surfactant addition, due to the better dispersion stability [45]. Therefore, for a detailed comparison, more rigorous experimental work is proposed in order to build the database before drawing a final conclusion. Most importantly, the stability should be studied quantitatively at higher temperatures to further understand the behavior of thermal conductivity.
Furthermore, the quantitative results can be summarized as follows: the maximum thermal conductivity enhancements were observed to be ~2.8%, 1.9%, and 4.5% for the combination of 0.05% SDS + 0.005% WS2, corresponding to operating temperatures of 25 °C, 50 °C, and 70 °C, respectively. Subsequently, the increased concentration of SDS decreased the thermal conductivity, which is a common observation for higher concentrations of surfactants. Like 0.005% WS2, the higher concentrations, such as 0.01% WS2 and 0.02% WS2, also showed higher enhancement corresponding to lower surfactant concentrations. However, the elevated temperature behavior showed an oscillating response and the reason for this may lie within the detachment of surfactant molecules and their interaction with the WS2 sheets. Consequently, this needs to be explored further. Therefore, the current work contributes to the production of optimum WS2/EG nanofluid formulations that have improved thermal conductivity and stability. Hence, the optimum nanofluid formulations in terms of improved thermal conductivity that were obtained as a result of the current research work are shown in Table 4.

3.4. Rheological Analysis

The rheological analysis was carried out based on the optimized samples obtained from the thermal conductivity analysis and compared with the pristine WS2/EG nanofluids. In total, 12 samples were selected from three groups (SDS, SDBS, and CTAB) of nanofluids based on the maximum thermal conductivity enhancement. The selected nanofluids were then subjected to oscillation and rotational rheological measurements to gain an insight into their structural and flow behavior.

3.4.1. Oscillation Measurements (Strain Sweep Test)

In flow thermal systems, the viscous nature dominates while the fluid is flowing, but sometimes the nature of the fluid alters due to structural changes, which may put an additional load on the system in terms of pumping power. Although, EG is known to be the Newtonian fluid, the addition of nanoparticles might change its nature from viscous to elastic [54]. Therefore, to predict and analyze the structural changes in nanofluids in the presence of nanoparticles and surfactants, an oscillation strain sweep test was performed. In fact, the strain sweep test is very sensitive and can give upfront information about the structural changes in nanofluids. Figure 7a,b represents the storage (G’) and loss modulus (G”) for pristine WS2/EG nanofluids at the tested volume concentrations (0.005%, 0.01%, 0.02%). It can be seen from the results shown in Figure 7a,b that the storage modulus (G’) was lower compared to the loss modulus (G”) over the entire deformation range for EG as well as for the pristine WS2/EG nanofluids. Thus, the oscillatory strain sweep results verify the pure viscous nature of the EG base fluid. However, it is noticeable from the figure that the addition of the WS2 NPs significantly changed both G’ and G”, but still the viscous nature remained prominent. Overall, the loss factor (G”/G’) was very high, indicating the pure viscous flow behavior of pristine WS2/EG nanofluids over the entire tested deformation range. These results confirmed the super-fluidity of the pristine WS2/EG nanofluids.
Apart from the loss factor, the complex viscosity (η) was also an indicator for the structural changes in the nanofluids due to the addition of NPs. As shown in Figure 8d, the NPs’ addition increased the complex viscosity (η) as compared to the EG base fluid. Like the pristine WS2/EG nanofluids, surfactant-containing nanofluids also showed a substantial variation in η, which indicated the structural changes in the nanofluids, as shown in Figure 8a–c. The highest η means that the nanofluids may require more input energy to initiate the motion of nanofluids as compared to the EG base fluid. Furthermore, the pristine nanofluids showed a concentration dependency on the structured network. It can be seen from the figure that the elastic nature of the pristine nanofluids increased with the concentration of WS2 NPs. This means that the higher the concentration, the higher the pumping pressure that will be required to initiate the flow. Besides this, the surfactant-containing nanofluids transformed the structural arrangement of nanofluids and shifted it to the highest elastic domain.
As Figure 9 displays, the surfactant-containing nanofluids showed a hallmarked plateau of storage modulus (G’) over the loss modulus (G”), which highlighted the dependency on the type and concentration of surfactant as well as on the interaction between surfactants and NPs. Possibly, this was due to the complex formations which occurred because of the physical interactions between the NPs and surfactant molecules in the nanofluids. As shown in Figure 9, the storage (G’) and loss (G”) modulus were parallel to each other over a certain range of deformation. This region is referred to as the linear viscoelastic range (LVER). In this region, the nanofluid behaves like a gel, with a pronounced elastic modulus, and the stress value that corresponds to the storage (G’) modulus in this limiting region is referred to as the true static yield stress [55]. It can also be observed from Figure 9 that, after a certain value of deformation, the structure breakdown started, followed by the nanofluid flow. The intersection of the storage (G’) and loss (G”) modulus corresponded to the flow point and the stress value mimicked the minimum force needed to initiate the flow of the colloidal suspension. Before the flow point, the stress value could not initiate the flow, which highlighted the existence of a critical stress value, and the fluid behavior was fully elastic. Beyond the flow point, the viscous nature became dominant, which indicated the liquid-like behavior of the nanofluids [56]. The similar phenomenon of structured nanofluids has also been observed in previous studies for exfoliated graphite nanoplatelets and titanium nitride-based EG nanofluids [54,55].
Furthermore, our results revealed that the overall behavior of nanofluids was highly dependent on the loss factor (LF). A low LF value gave rise to the gel-like behavior, which must be avoided in the case of flow thermal systems. Therefore, a high LF is needed so that the pumping power can be controlled to be as minimal as possible. In short, the strain sweep test could be exploited for the nanofluid’s preliminary structural evaluation. However, a detailed oscillation investigation is needed for samples which show a clear LVER state with very low LF value. In such cases, usually, frequency sweep and 3ITT tests are performed within the LVER range. In the present study, only a few samples showed an LVER state but without a low LF value. Therefore, the study was kept limited to the strain sweep test in order to gain an insight into the nanofluids’ structural behavior. In addition to the viscoelastic structure information of nanofluids, the strain sweep test also gives insights about the colloidal systems’ interactive forces, which determine the stability. The sterically stabilized colloidal systems have typical critical strain values of ~1% to 5% [56]. In the present study, surfactant-containing nanofluids have shown such a critical strain range. However, low critical strain values were also observed for some nanofluid formulations, probably due to weak colloidal stability. The results of nanofluid formulations which did not show a distinct LVER state are shown in Figures S2–S4 (Supplementary Materials). Thus, in the present work, for the tested nanofluids, the viscous flow behavior prevailed over the entire deformation range, along with the indication of a weak elastic nature in some cases. A detailed summary of the oscillation evaluation of the nanofluids is presented in Table 5.

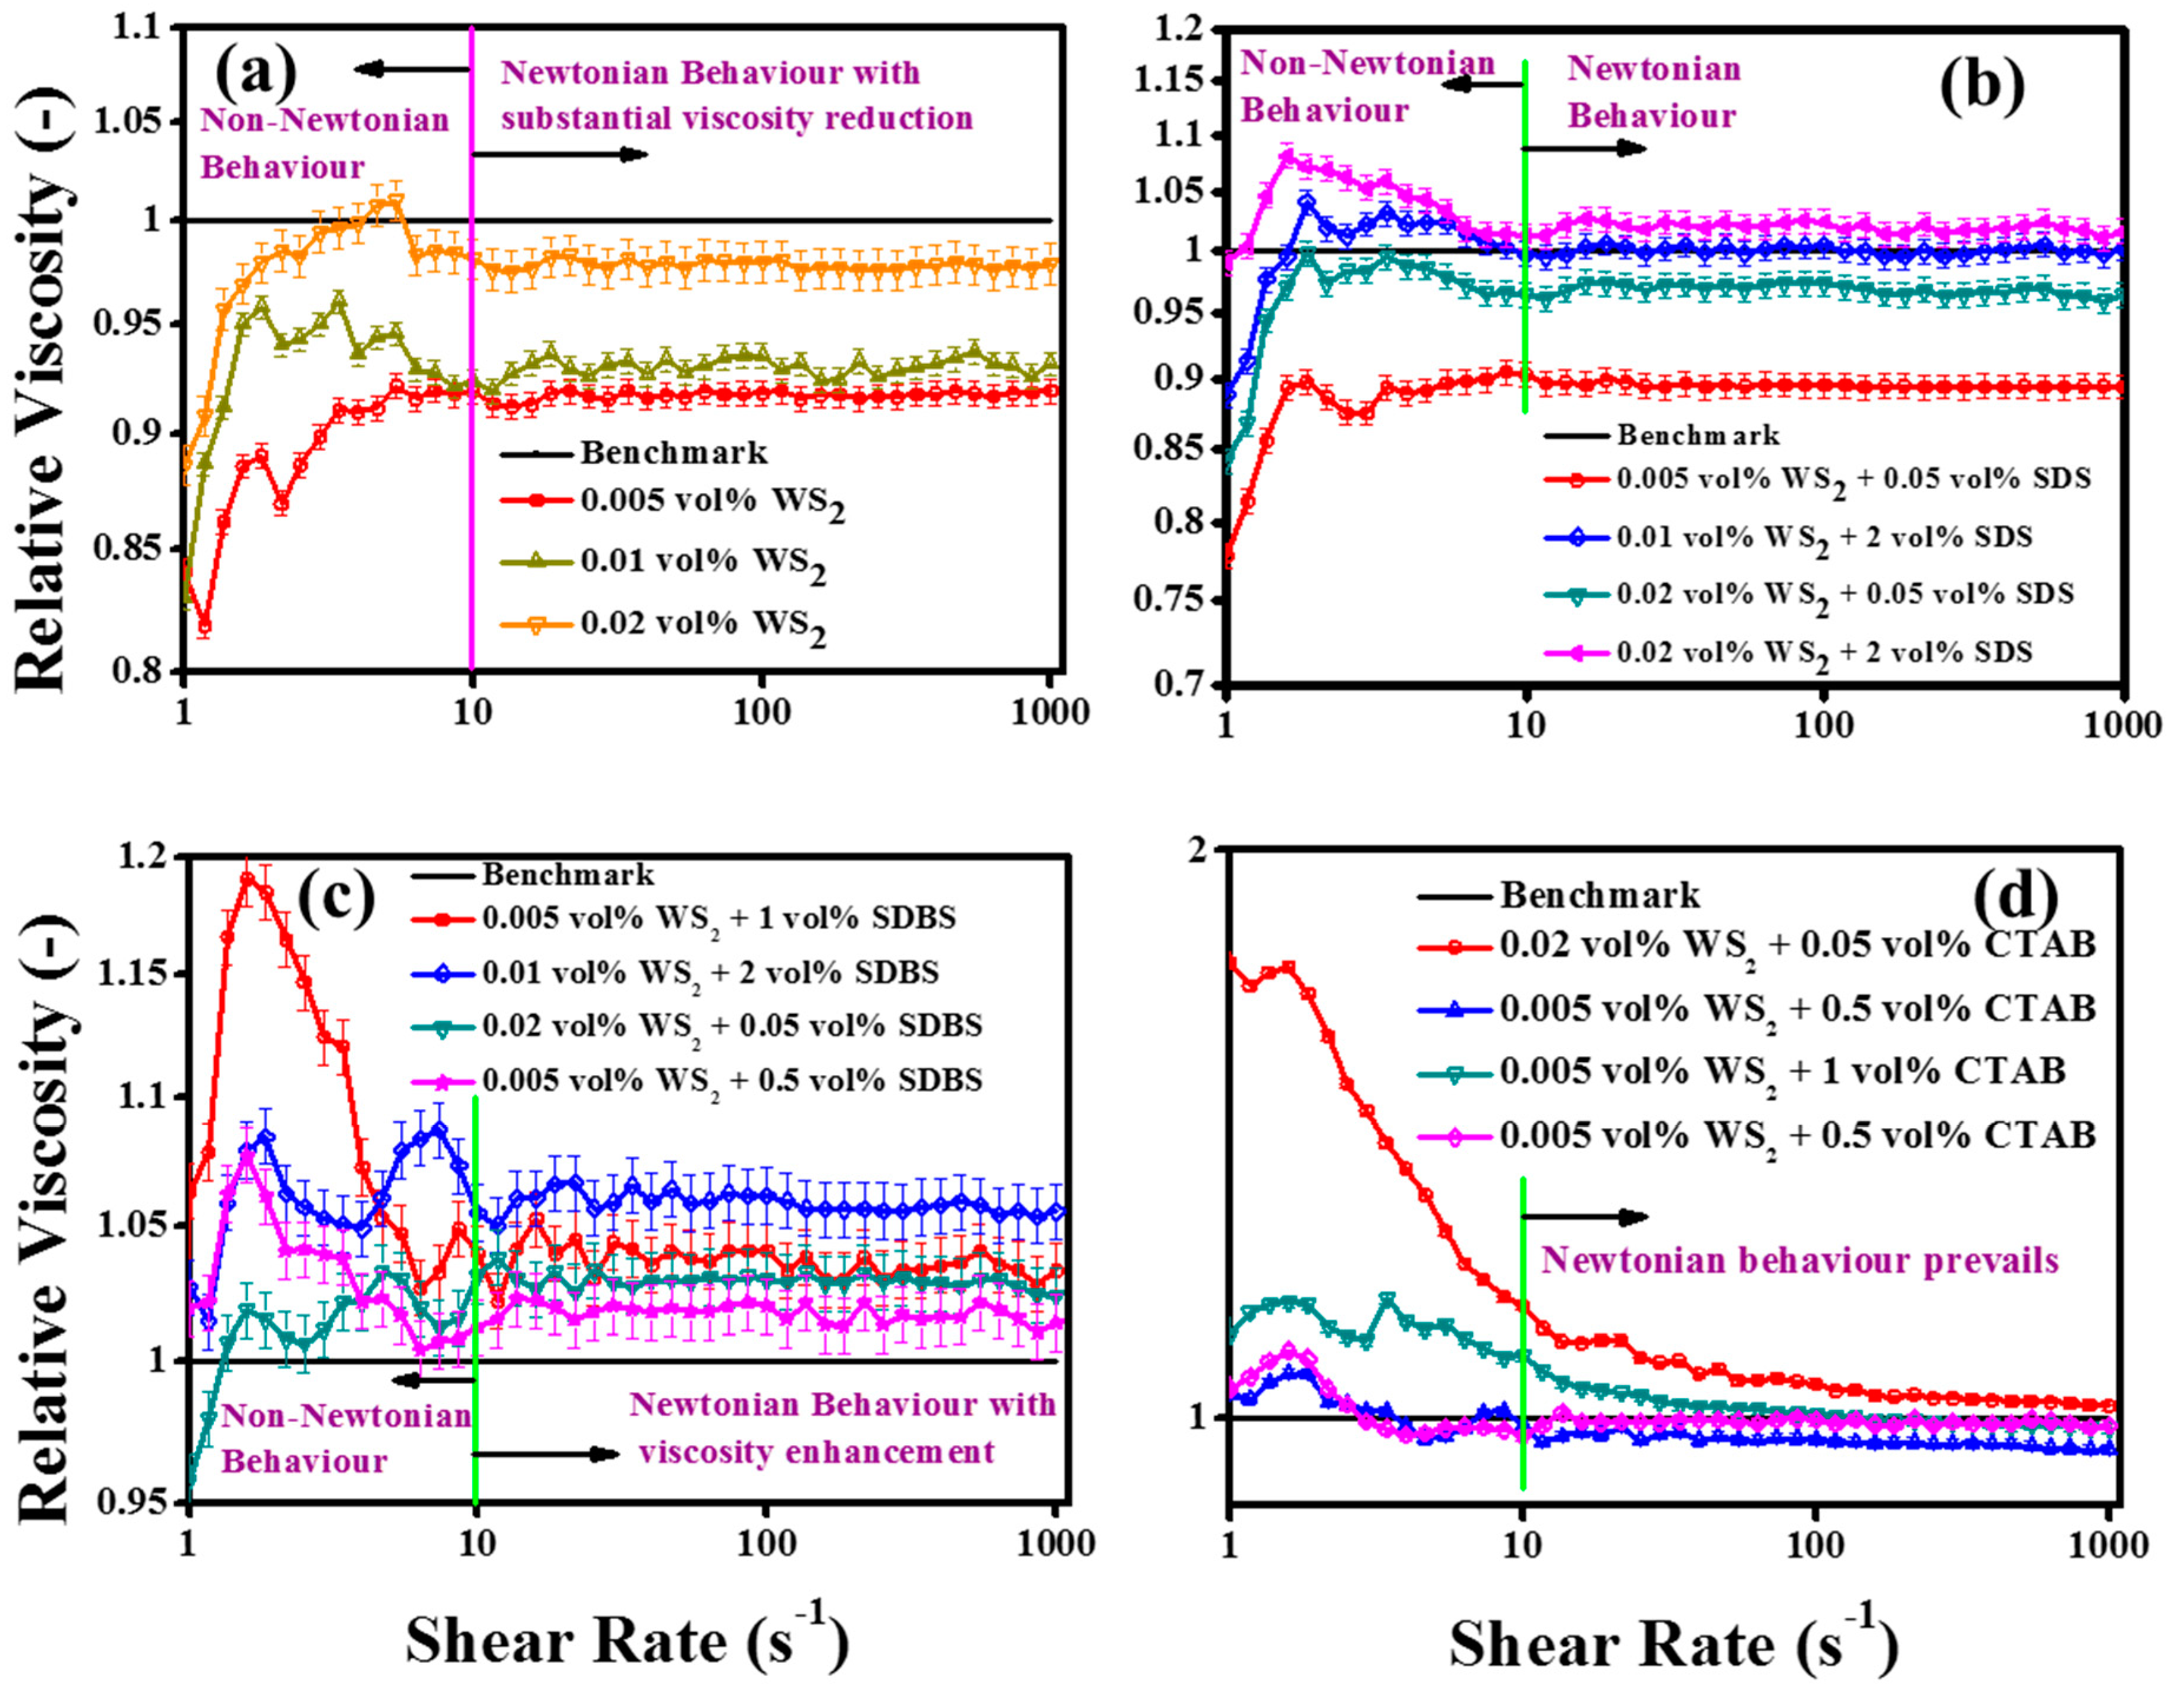
3.4.2. Rotational Measurements (Shear Flow Behavior)

As the pumping flow may cause a variety of shear rates, the pumping performance of nanofluids was also evaluated with the rotational rheology by analyzing the shear flow behavior [56]. The base fluid dynamic viscosity was measured and found to be independent of shear rates between 10 and 1000 s−1. The pristine and surfactant-containing WS2/EG nanofluids’ viscosities are presented in terms of relative viscosity in Figure 10a–d, respectively.
The results revealed that all the nanofluids showed transformation from non-Newtonian to Newtonian behavior at a shear rate of 10 s−1. As shown in Figure 10a, the pristine nanofluids showed a substantial dynamic viscosity reduction with the addition of WS2 nanoparticles as compared to the base fluid (EG). Interestingly, the low concentration of WS2 showed the maximum viscosity reduction, followed by concentration dependent increments with higher concentrations (>0.005 vol%). These results were well in agreement with the strain sweep results, as the pristine nanofluids showed super-fluidity with high LF values. The lubricating effect of the NPs’ addition into the base fluid was witnessed. The NPs’ inclusions between base fluid layers caused the easy movement of the base fluid layers, which reduced the viscosity at all targeted temperatures and concentrations [57]. On the other hand, the SDS surfactant-containing nanofluids in the present work have also shown concentration dependency (Figure 10b). The small concentration of SDS did not much alter the dynamic viscosity, whereas the higher concentration increased the viscosity due to the formation of complexes. Unlike the SDS surfactant, the SDBS (Figure 10c) and CTAB (Figure 10d) surfactants significantly increased the viscosity of nanofluids, even at small concentrations, as compared to the pristine nanofluids, with the exception of 0.5 vol% of CTAB. Such distinct observations of dynamic viscosity can be attributed to physical structural modifications and the interfacial interaction of colloids [58].
As in a low shear rate regime, the colloids may be relatively unstable, and they may orient themselves in the flow direction at a high shear rate regime along with uniform distribution, with the breakdown of the large agglomerates. This might also cause fluctuations in the measuring system’s monitoring and recording capability of the force experienced by the spindle. Therefore, non-Newtonian behavior dominated at low shear rates (<10 s−1). More recently, such observations have been made that the hydrodynamic slip effects become more prominent at higher shear rates. Consequently, the nanosheets within the colloidal dispersions align themselves in the flow direction [59]. Therefore, together with nanosheet alignment in the flow direction, the lubricity of WS2 contributed to lowering the dynamic viscosity by minimizing the interfacial tension, as evident by the pristine nanofluids’ rheology. Thus, the hypothesis of the current research work came true as the anti-friction properties of WS2 were reflected well in the nanofluids in the form of reduced viscosity. Moreover, the synergistic effect of small concentrations of the SDS surfactant with WS2 NPs was also observed and found to be well in agreement with the results reported by Zhou et al. [26]. The pristine nanofluids showed ~8.2% less viscosity when compared with the EG base fluid, while with the addition of 0.05 vol% SDS, it was further reduced to ~10.5% for the 0.005% WS2/EG nanofluids. Such a viscosity reduction phenomenon may be attributed to the lubricating effect of NPs and analogous micelles of SDS surfactant. The present results revealed that the addition of the surfactant might significantly change the nature of the fluid, as the high concentrations of surfactants showed a viscosity enhancement effect. Like the oscillation evaluation of the nanofluids, the shear flow behavior also indicated similar rheology behavior in the presence of surfactants. Eventually, the oscillation and rotational measurements detected the structural variation with NPs and surfactant concentrations. Therefore, to compute the yield stress for structured fluids, many models have been proposed, such as Herschel–Bulkley (H–B) [54] and Bingham [55].
Equations (2) and (3) represent the H–B and Bingham models, respectively.
τ = τ o + K γ ˙ n
τ = τ o + μ γ ˙
where τ, τo, μ,   γ ˙ , K, and n are the shear stress, yield stress, Newtonian viscosity, shear rate, consistency, and the flow index, respectively. The experimental data of the measured samples were fitted with the above-mentioned models, and details of the flow parameters are given in Table 6. The model fitting results of yield stress were in good agreement with the strain sweep measurements for most of the samples, which showed significant concentration dependency. However, the Bingham model fit most of the tested samples well, compared to H–B. It can be seen from Table 6 that, for the Bingham model, the τo value for EG was ~1.08, which reduced with the addition of NPs. This could be a rational indication of the super-lubricity of the pristine WS2/EG nanofluids, as observed in the dynamic viscosity measurements.

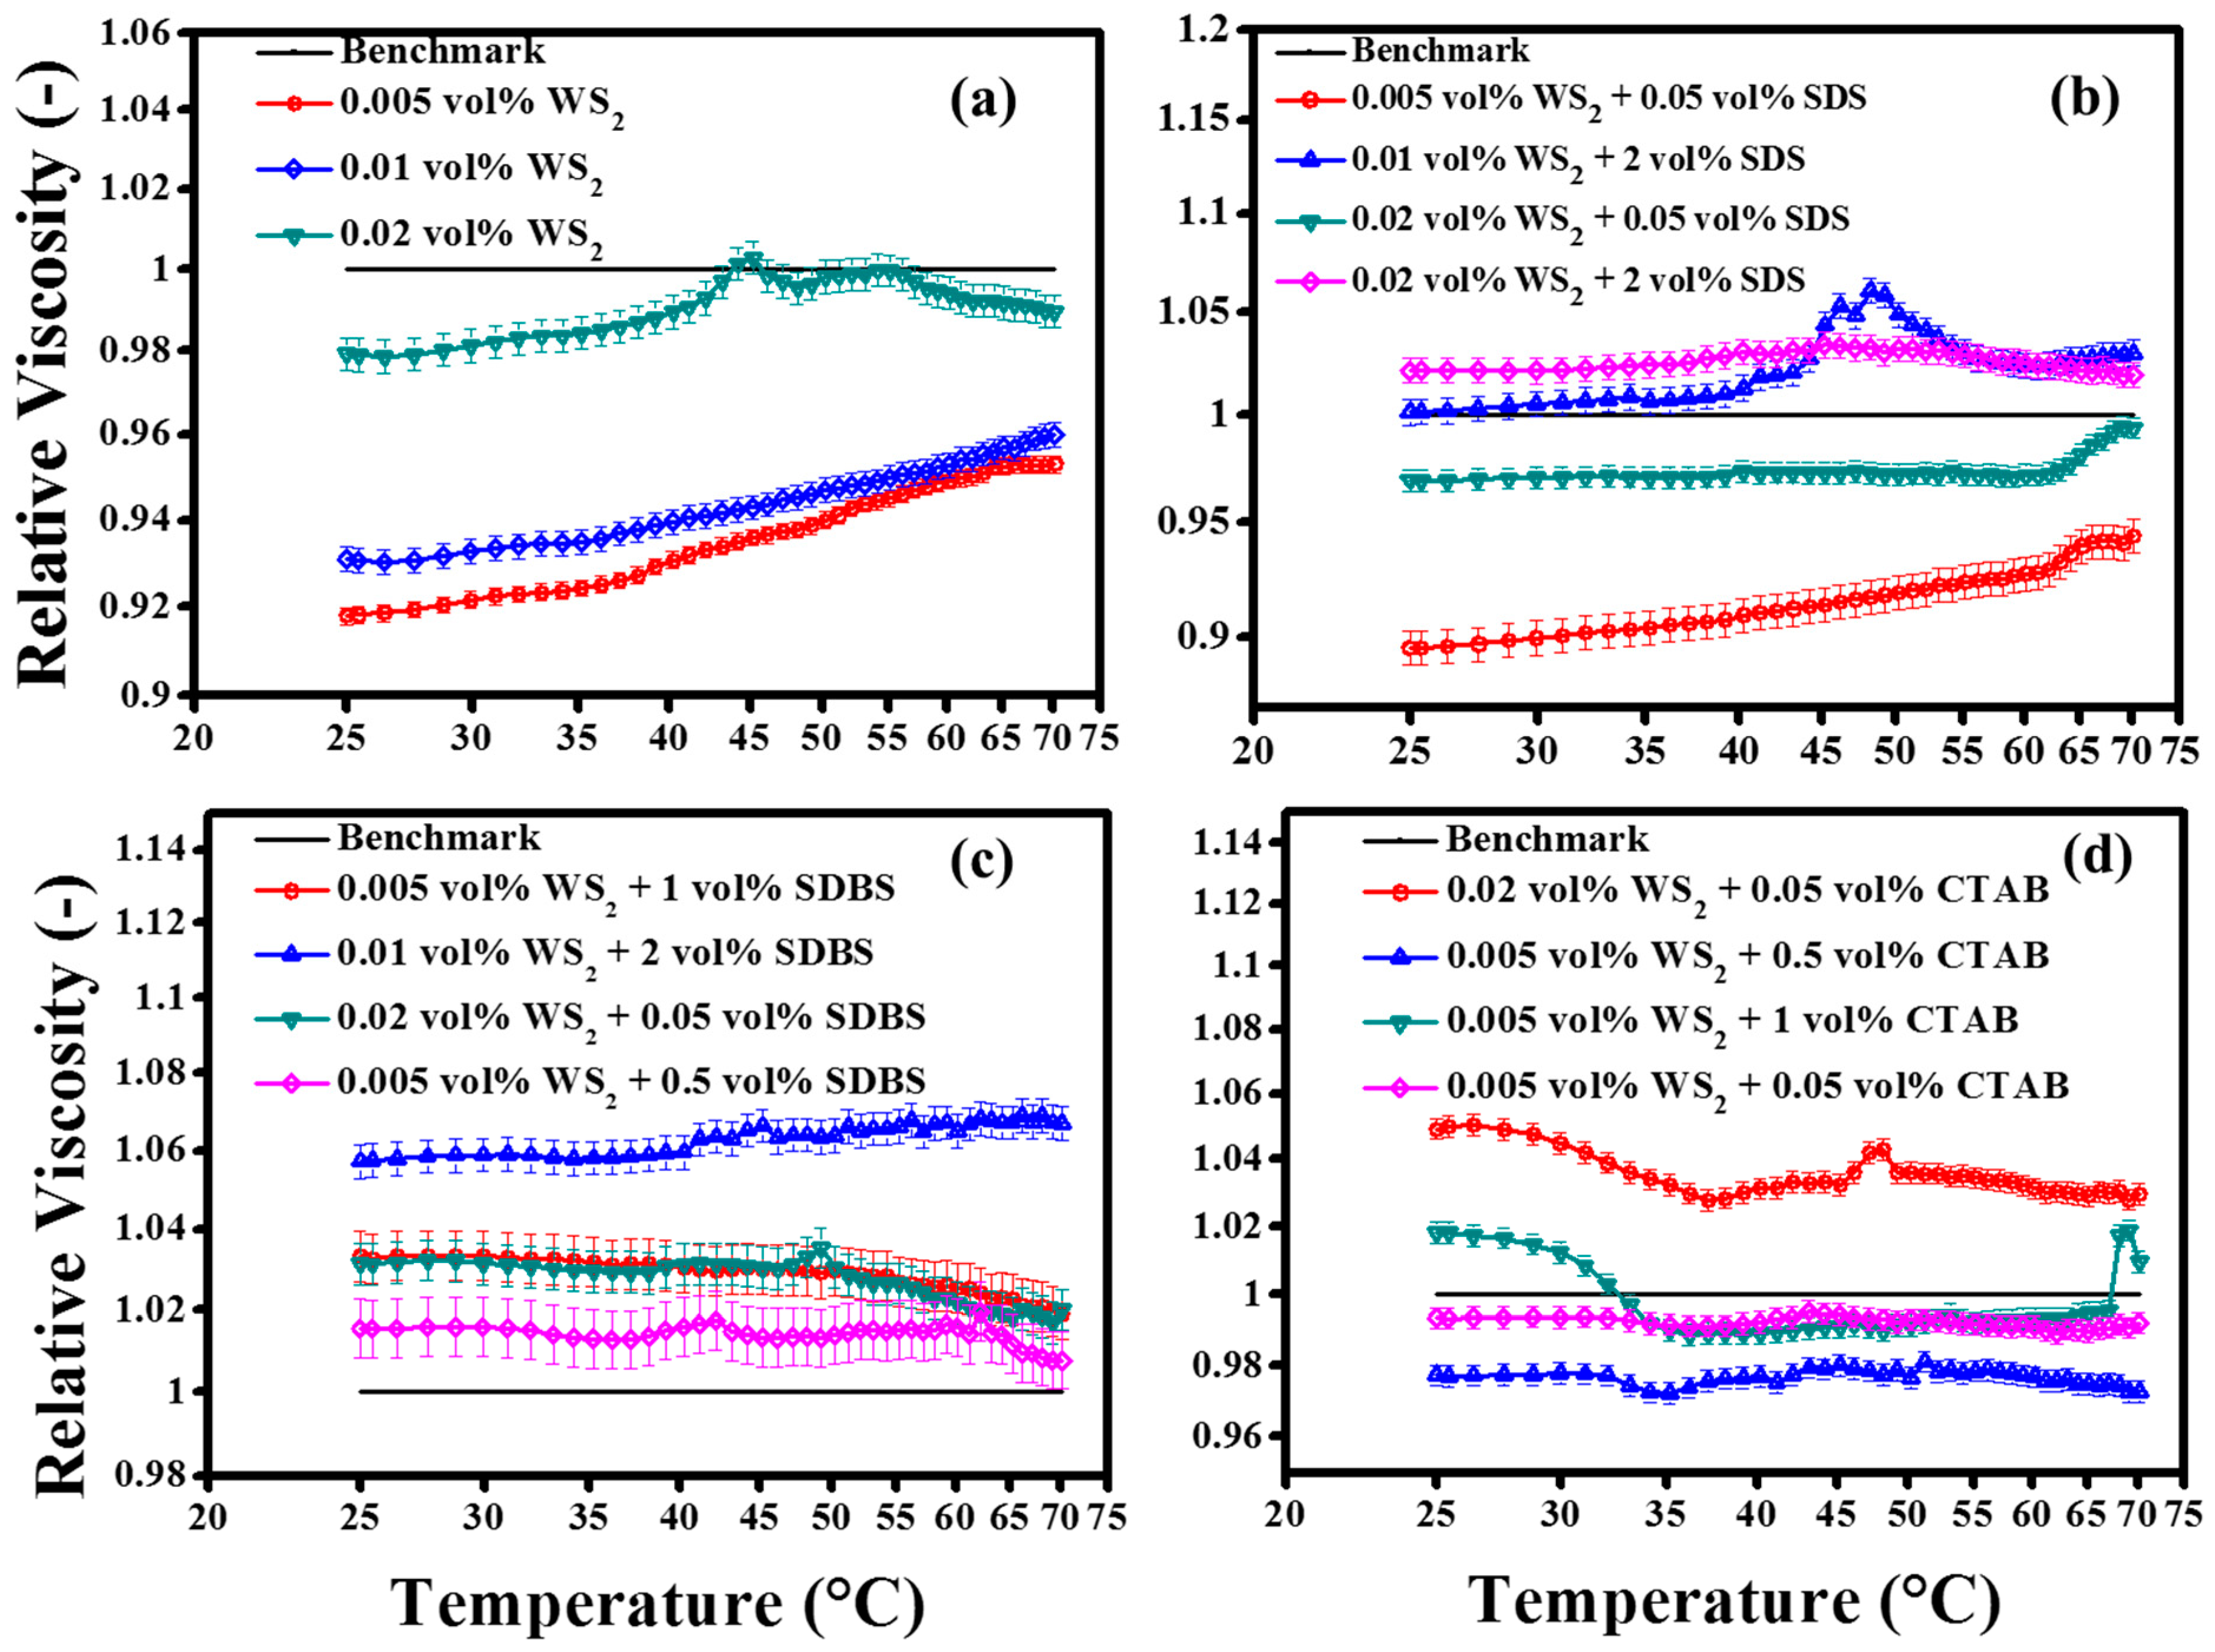
3.4.3. Temperature Sweep Study

Many flow thermal applications operated in a range of temperatures. Therefore, knowledge of the temperature dependent viscosity is important for the process design. The temperature dependent viscosity is presented in the form of relative viscosity from 25 °C to 70 °C, as shown in Figure 11. In the case of the pristine WS2/EG nanofluids (Figure 11a), the viscosity was sufficiently below the base fluid. However, an interesting behavior was observed over the entire temperature range. As the temperature increased, the relative viscosity progressively increased, but, overall, it was sufficiently below the base fluid for volume concentrations of up to 0.01%. The higher volume concentration (0.02%) showed the intersecting points close to the benchmark line. Such behavior of nanofluids provides evidence about the critical temperature limit, as shown in Figure 11a. The results revealed that, at a critical temperature, the viscosity inversion occurred, and again it starts increasing. However, in the present case, the higher concentration (0.02%) has shown a critical temperature transition range of between 40 °C and 45 °C. The possible mechanisms behind the existence of a critical temperature could be the fact that, at the same temperature, the base fluid’s viscosity was not reduced sufficiently, due to the viscous hindrance offered by nanoparticles. Thus, such critical temperature behavior could be avoided by using high shear rates at elevated temperatures [31]. Such behavior of nanofluids indicates that the in-depth understanding of temperature dependent viscosity is a vital parameter in deciding the process design parameters, such as the size of pump and the pressure requirements. In the current work, the base fluid viscosity was reduced to ~56.3% and ~74.5% at temperatures of 50 °C and 70 °C, respectively, when compared with the viscosity at 25 °C. Furthermore, the 0.005% WS2 NPs’ addition raised this reduction to 64.3% and 75.9%, corresponding to 50 °C and 70 °C, respectively, which can be attributed to the lubrication characteristics of NPs [12]. On the other hand, 0.01% WS2 nanofluids improved the viscosity reduction to 58.7% and 75.9%, while 0.02% WS2 showed an almost similar trend as the base fluid corresponding to the selected targeted temperatures, respectively. These results suggest the concentration and temperature dependency of dynamic viscosity. In view of the present results, it can be concluded that the lubricating effect of WS2 nanoparticles was significant at small concentrations, and it diminished as the concentration increased further from 0.01 vol% to 0.02 vol%. Besides this, the dynamic viscosity reduction potential of WS2 NPs was prominent at low temperatures, while along the higher side of the temperature range, the improvement became less prominent. Such behavior transformation of nanofluid viscosity with increasing temperature suggests that, at high temperatures, the base fluid part of the nanofluid governs the viscosity of colloidal systems. Probably, at elevated temperatures, it can also be linked with colloidal stability, as discussed earlier. The primary reason for the reduced viscosity was the breakdown of intermolecular forces among the fluid layers. Such breakdown is associated with the internal structure of nanofluids, which increases with temperature rises due to the enhanced Brownian motion [21].
Moreover, the surfactant-containing nanofluids also showed concentration dependent viscosity behavior, as shown in Figure 11b–d for SDS, SDBS, and CTAB, respectively. Like the oscillation and shear flow behavior, the temperature sweep results for surfactant-containing nanofluids were also similar. However, variation in the viscosity reduction over the temperature scale was flattened for some samples. For instance, as shown in Figure 11b, the SDS surfactant’s addition converted the pristine nanofluids’ behavior, with flat curve formations. This could be due to the colloidal stability of nanofluids which sustains the viscosity reduction due to surfactant micelles up to a certain temperature range. It was also witnessed that the small concentrations of SDS shifted the critical temperature to the higher temperature side for 0.02 vol% WS2, whereas the critical temperature range was eliminated at a higher SDS concentration. In addition, 0.01% WS2/EG nanofluids clearly revealed that the critical temperature transition was between 45 and 50 °C, while it was absent when no surfactant was used. Intriguingly, the 0.005% WS2/EG nanofluids illustrated a synergistic effect with small concentrations of SDS (0.05 vol%), with further improvements in viscous behavior.
The synergistic effect of SDBS and CTAB surfactants on temperature dependent viscosity is also noticeable, as shown in Figure 11c,d, respectively. The SDBS surfactant showed viscosity enhancement at all concentrations and over the entire temperature range, while the CTAB reflected a reduction at certain concentrations. In short, there exist optimum concentrations, which account for the improvements in the flow behavior of nanofluids. Like other studies related to nanofluids, in the present work, the absolute viscosity decreased exponentially with temperature [60]. Finally, a detailed summary of the dynamic viscosity reduction and enhancement at various temperatures is shown in Table 7.
Furthermore, to correlate the experimental temperature dependent viscosity data, an Arrhenius type equation was used [6], as shown in Equation (4).
η e f f = ( η , T ) × ( e E a R T )
where ηeff, η , T , Ea, and R are related to the experimental viscosity at certain given temperatures, viscosity at infinite temperature, activation energy, and the universal gas constant, respectively. Both the activation energy and infinite viscosity show the fluid flow behavior. The activation energy terminology was introduced by Savante Arrhenius [61]. Generally, it is the amount of energy needed to transform reactants into products in a chemical reaction. This might be in the form of the potential and kinetic energy of molecules, which could be used for chemical reactions to disentangle their bonds. The random movement of molecules does not initiate a reaction until their momentum is high enough when compared to the base energy barrier. Consequently, the bottom level of energy needed to initiate a chemical reaction is known as activation energy. Here, Ea corresponds to the inter-layer friction in nanofluids. The fitting parameters of the experimental data using Equation (4) are shown in Table 8.
It can be observed from the fitting parameters of the Arrhenius equation that the addition of nanoparticles into the base fluid have radically improved the viscous behavior. The infinite viscosity value decreased, along with a reduction in the activation energy for pristine nanofluids with the addition of NPs. Moreover, it is also notable that, as the concentration of WS2 increased, the infinite viscosity displayed significant changes (increased). In short, these findings were well in agreement with the detailed rheological analysis of WS2/EG nanofluids. A collective summary based on the stability, thermal conductivity, and rheological analysis, with the combinations of WS2/EG nanofluids (having reduced viscosity), is given in Table 9.

4. Conclusions

In the present study, a comprehensive experimental evaluation of stability, thermal conductivity, and rheological properties has been carried out. Nanofluids with a wide range of WS2 volume concentrations (0.005, 0.01, and 0.02%), along with SDS, SDBS, and CTAB surfactants (0.05, 0.5, 1, and 2%) were characterized for targeted properties in a range of temperatures (25–70 °C). The conclusive remarks as a result of the current experimental investigations are given below.
  • The size and morphology of WS2 NPs was confirmed and found to be well in agreement with the supplier data sheet.
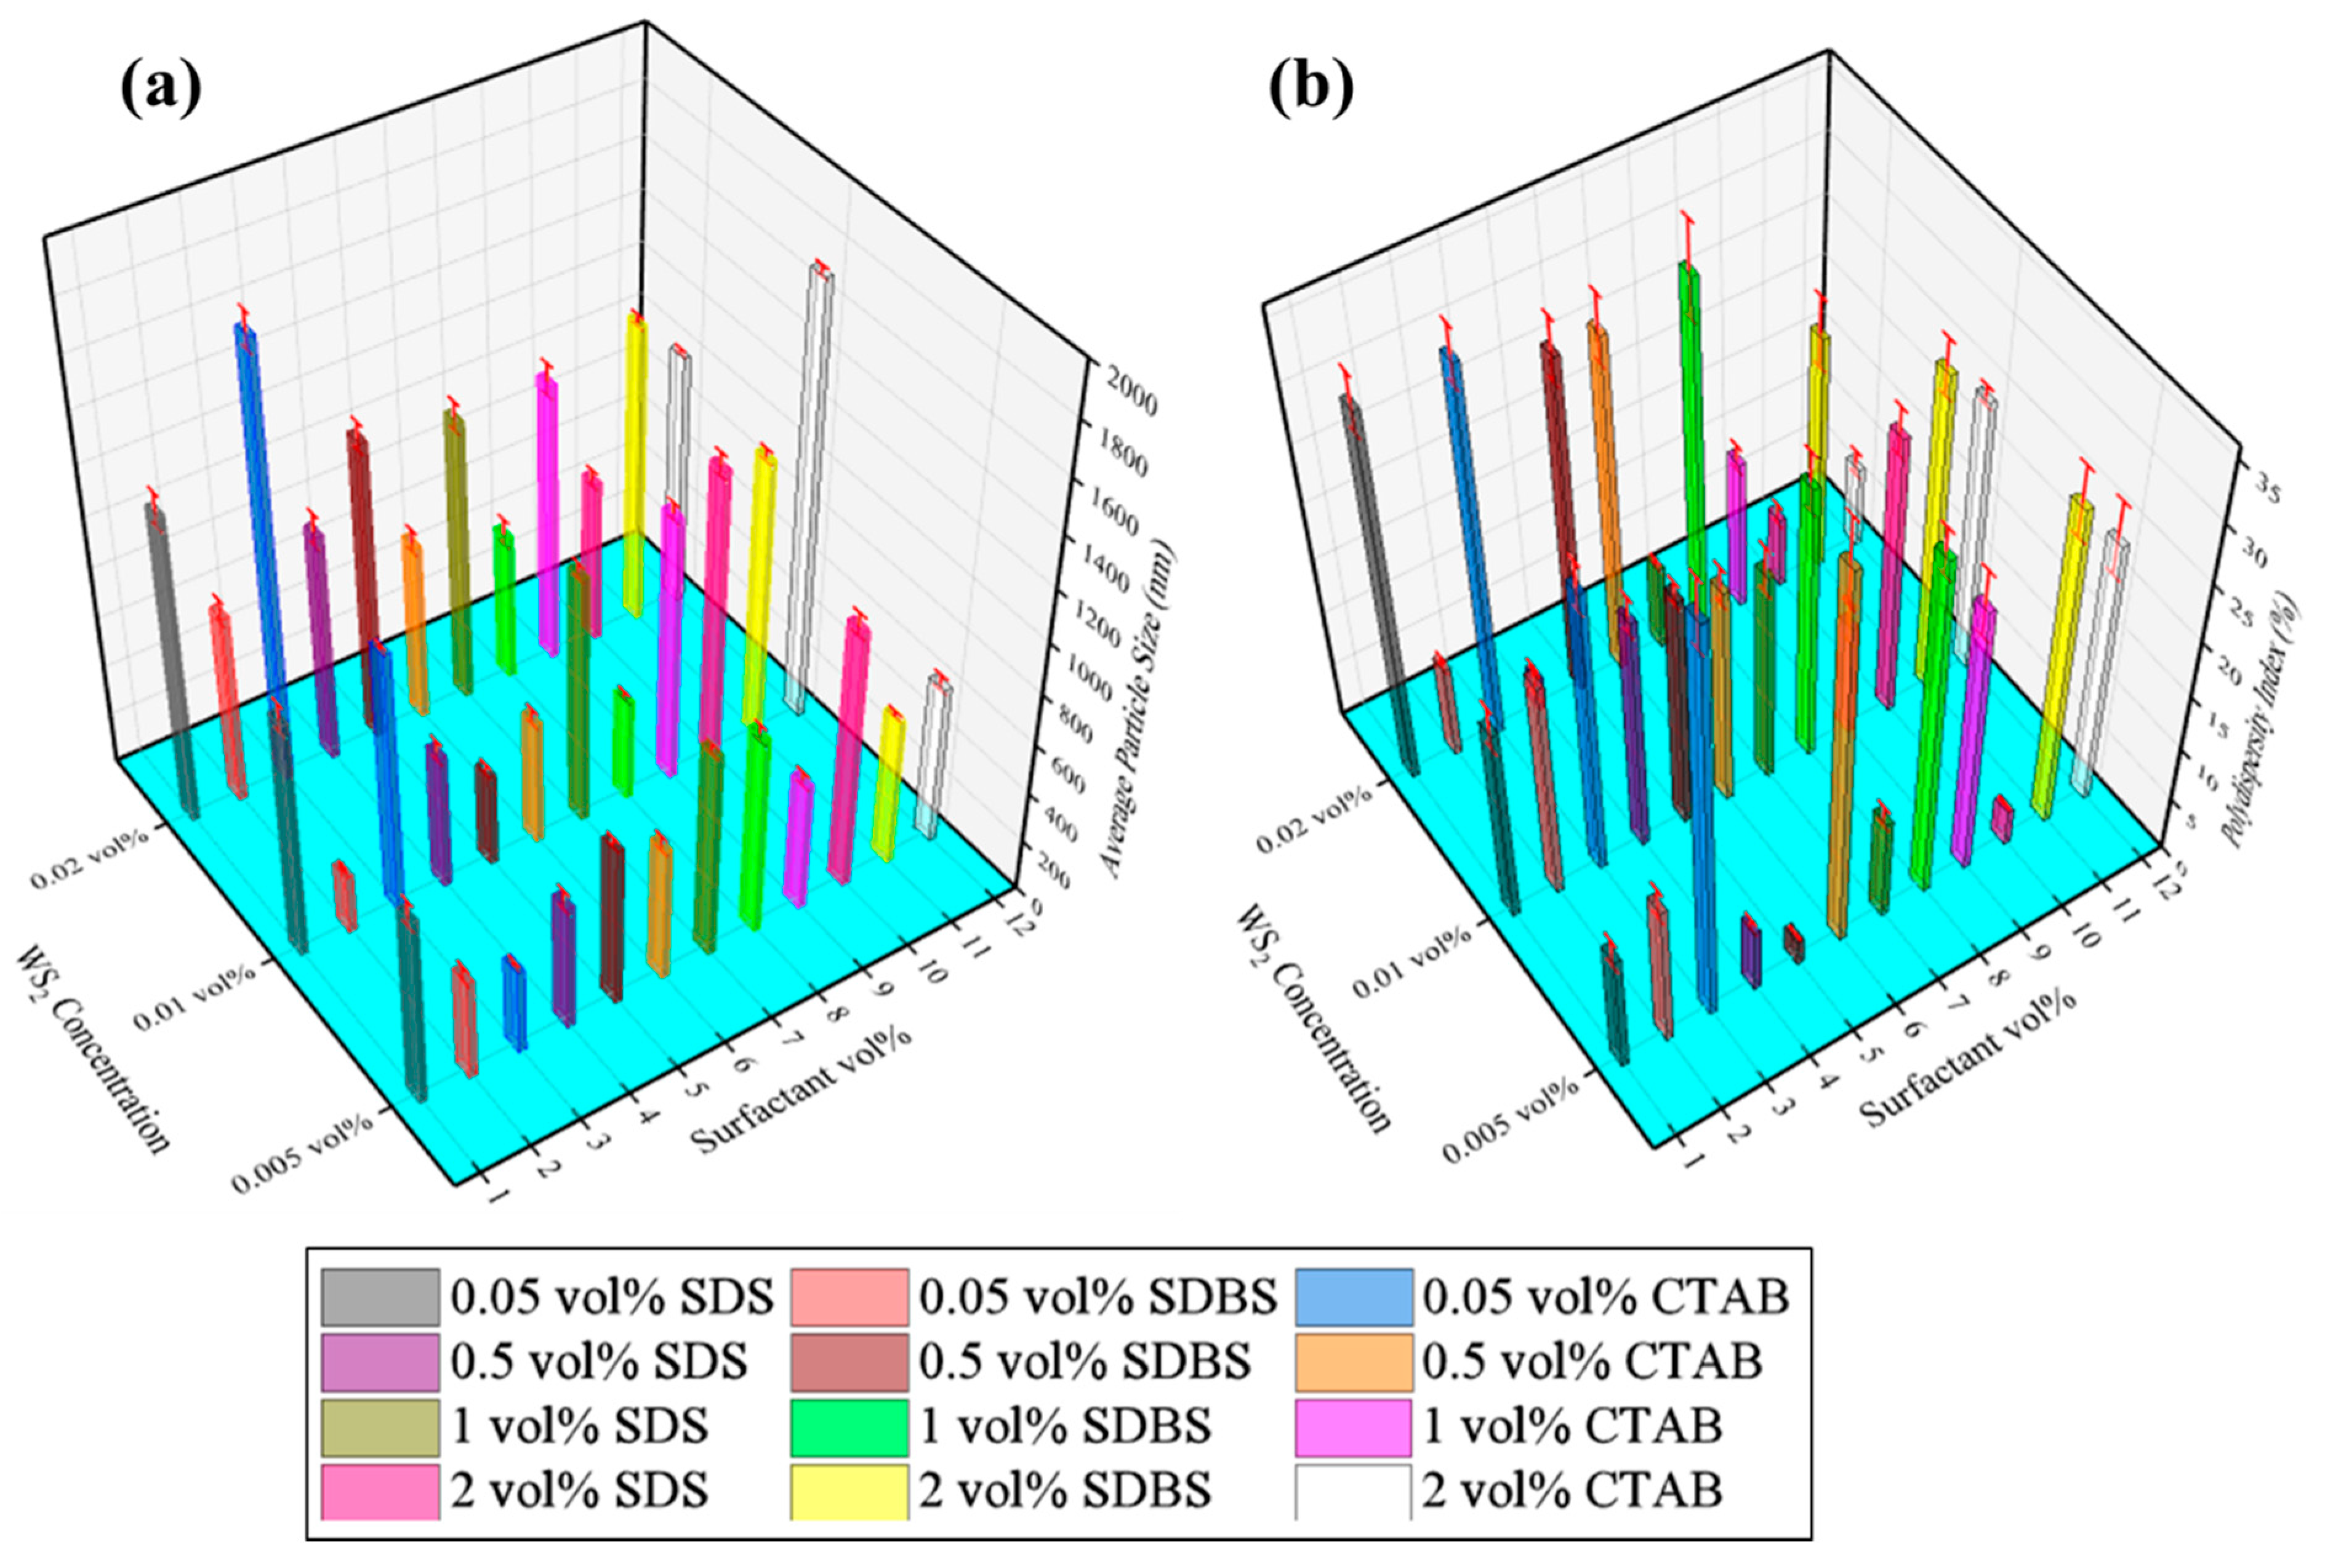
  • The addition of SDS (0.05%) increased the zeta potential by ~88% in comparison to 0.005% pristine nanofluid. This rate of improvement reduced to 37% per 0.05% SDS addition when 0.5% SDS was incorporated, but the absolute value of the zeta potential increased. Similarly, for other nanofluid combinations with SDS, the absolute zeta potential values improved, but the rate of improvement with regards to surfactant concentrations became slow as the amount of surfactant increased. In the case of SDS addition, the maximum increment in agglomerate size appeared at ~172%, ~245%, and 261%, corresponding to 0.005% WS2 + 2% SDS, 0.01% WS2 + 2% SDS, and 0.02% WS2 + 0.05% SDS, respectively. Collectively, the zeta potential improved to 554% while the mean particle size also showed an increase up to 411% due to the adsorption of surfactant molecules. This might cause agglomeration with aging, leading to flocculation and sedimentation.
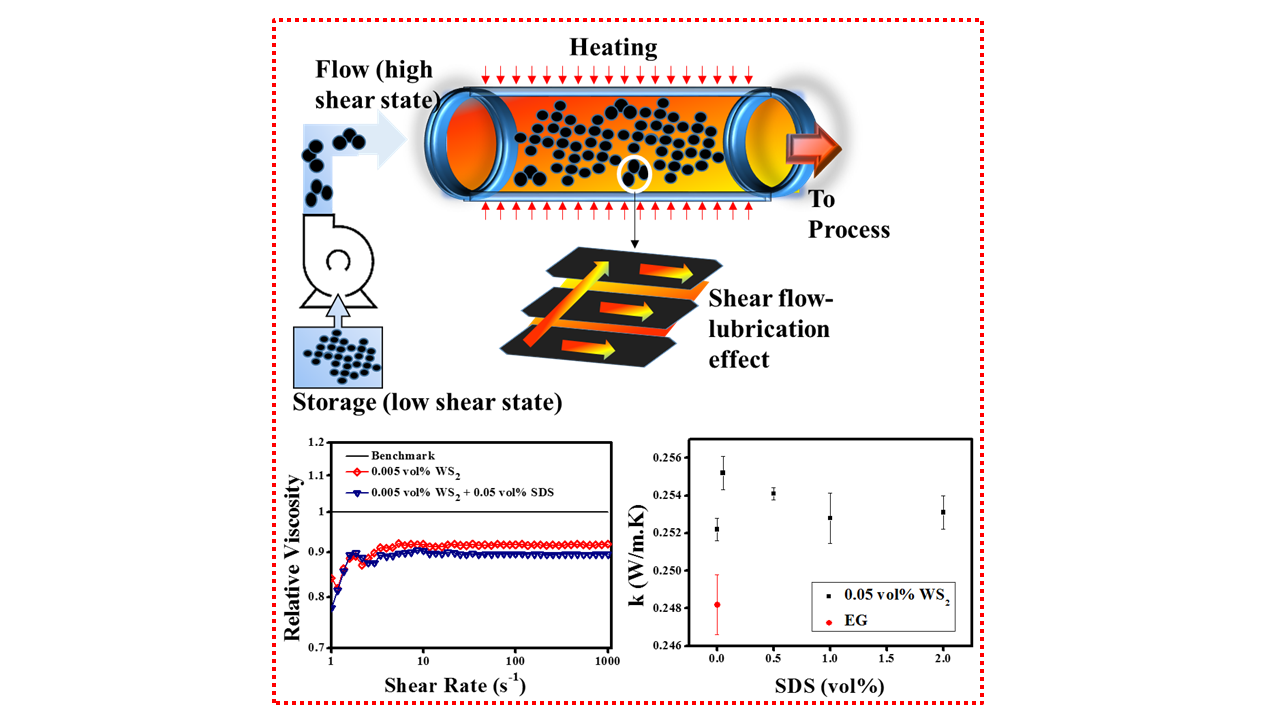
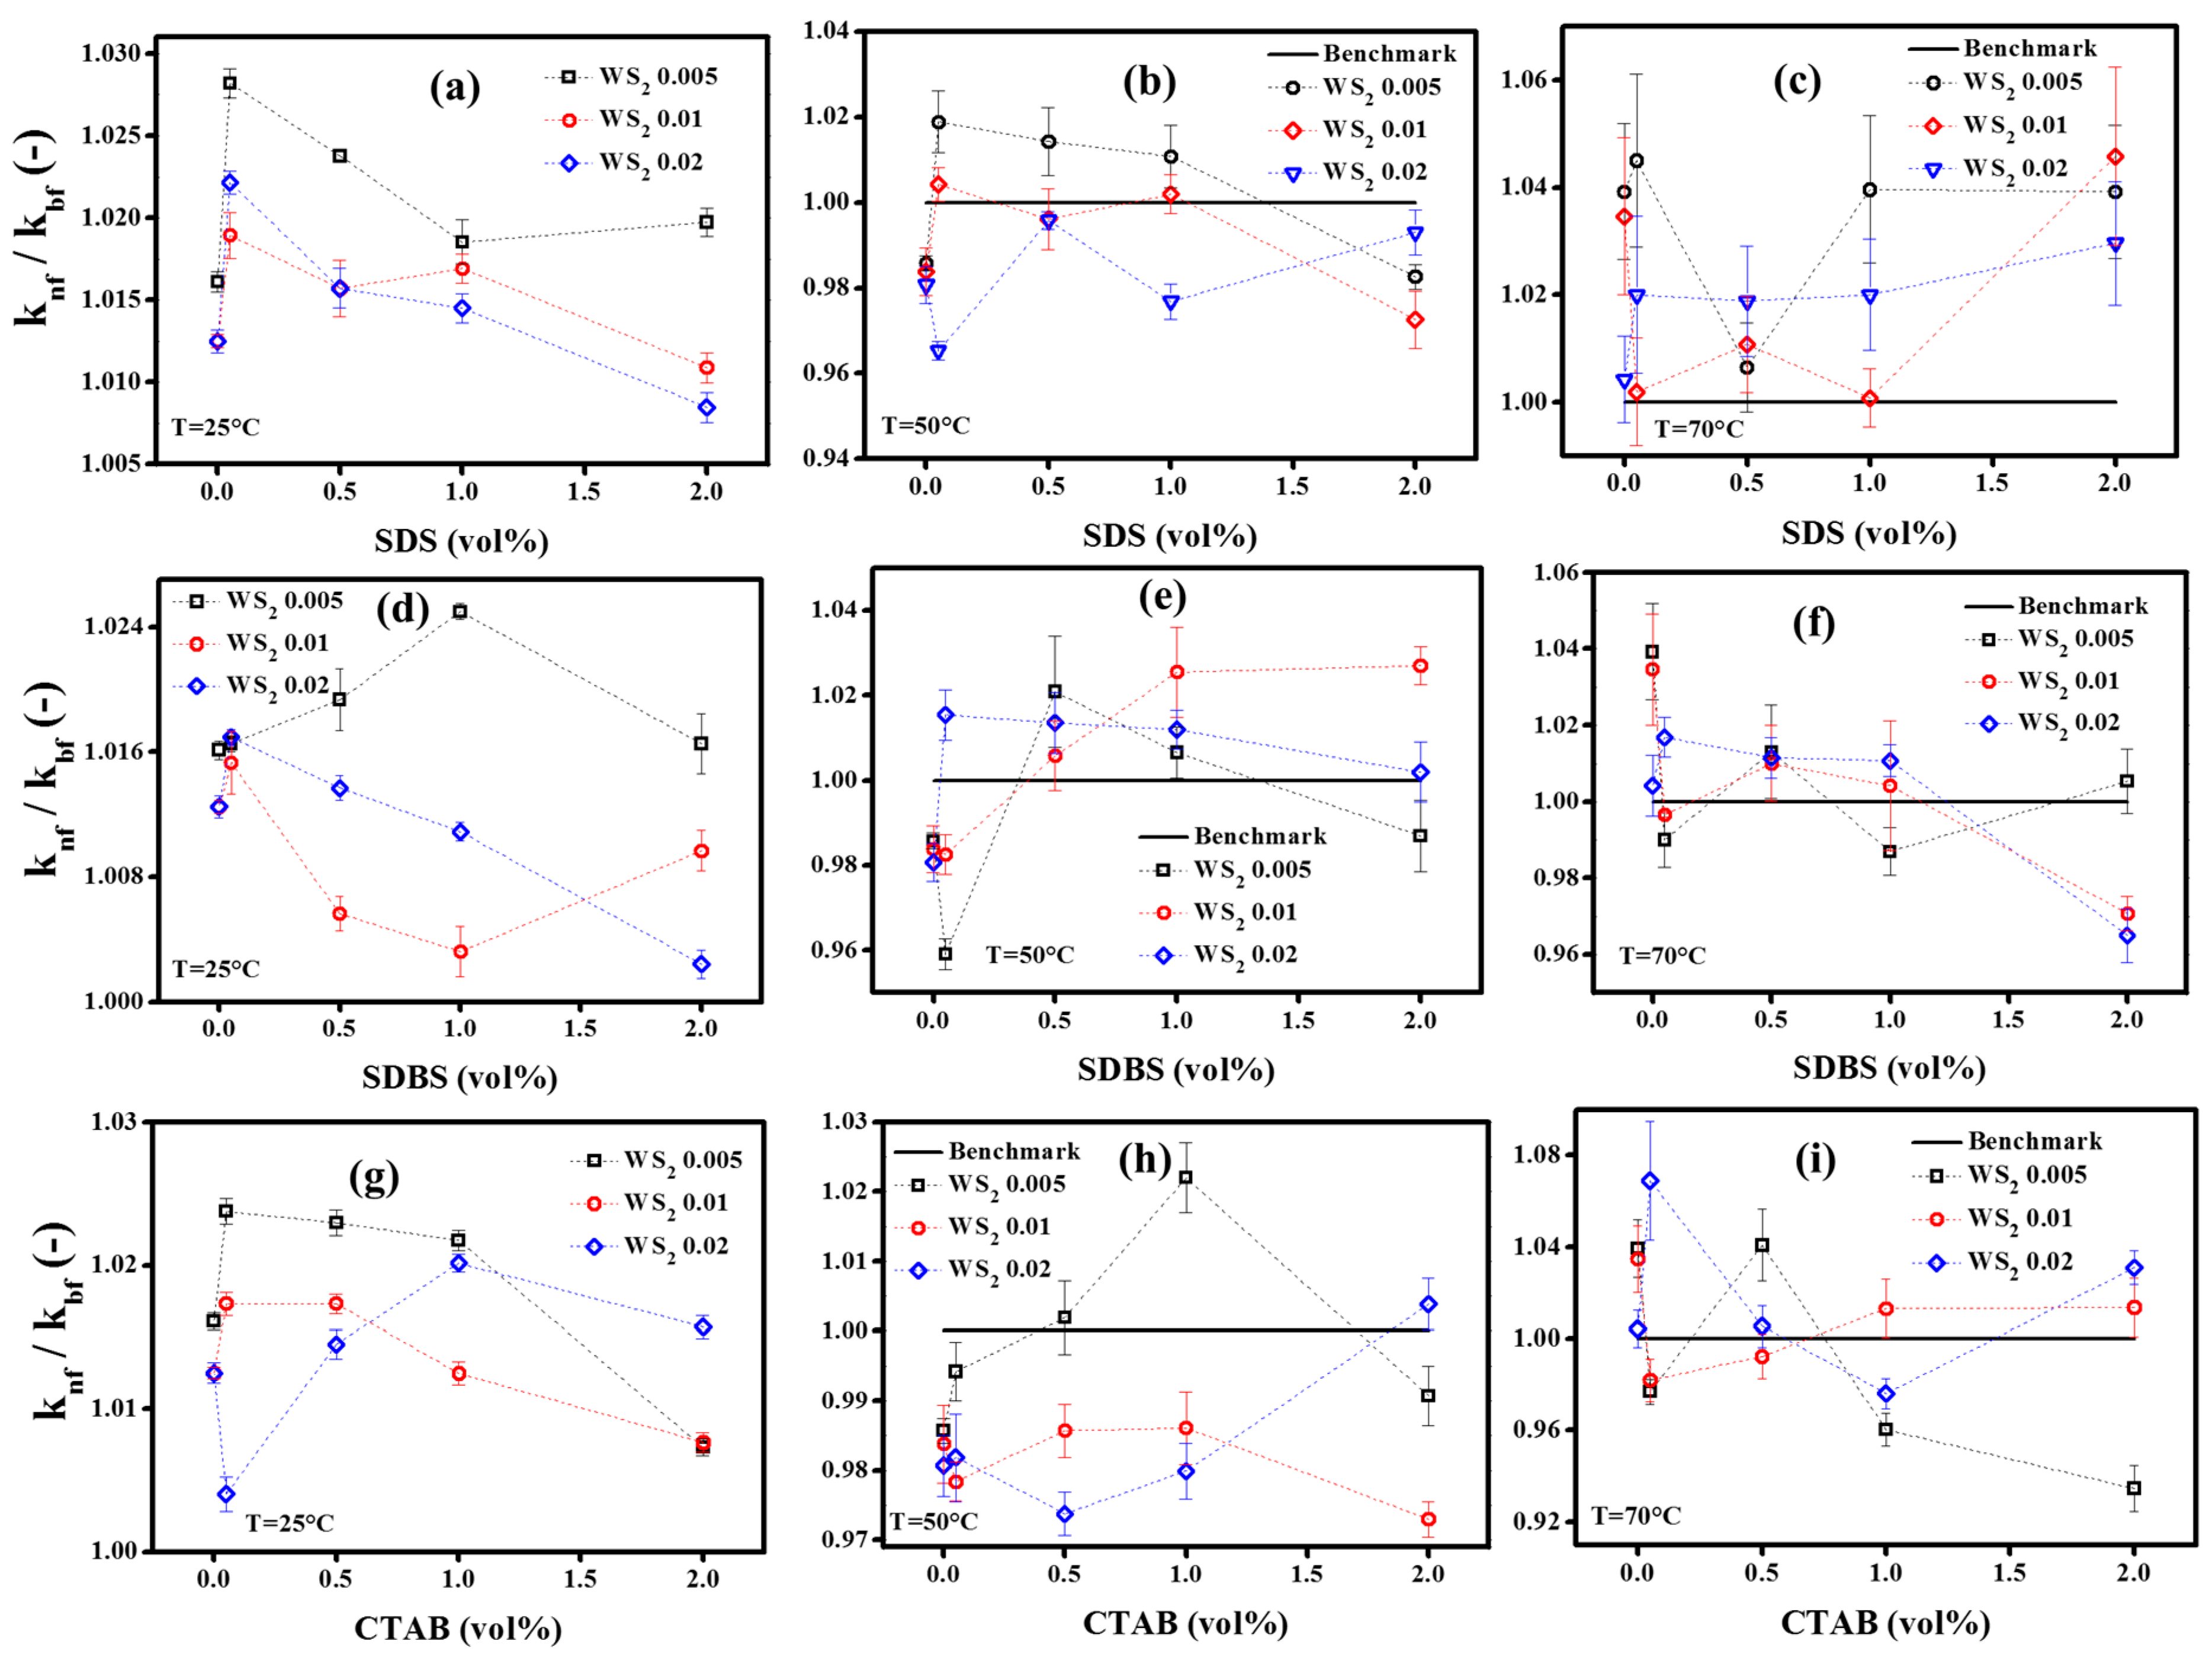
  • The maximum thermal conductivity enhancement was observed to be ~ 2.8%, 1.9%, and 4.5% for combinations of 0.05% SDS + 0.005% WS2, corresponding to operating temperatures of 25 °C, 50 °C, and 70 °C, respectively. Subsequently, the increased concentration of SDS decreased the thermal conductivity which is a common observation for higher concentration of surfactants. Like the 0.005% WS2, the higher concentrations such as 0.01% WS2 and 0.02% WS2 also show higher enhancement corresponding to lower surfactant concentrations. However, the elevated temperature behavior showed an oscillating response and the reason may lie within the detachment of surfactant molecules and the interaction with WS2 sheets. Therefore, it needs to be explored further. Collectively, the maximum thermal conductivity of pristine nanofluids increased from 3.5% to 6.9% with the addition of surfactants. However, the results also revealed that the maximum thermal conductivity improvement did not correspond to the high zeta potential. Thus, rigorous concentration optimization is always a decisive parameter for the optimum heat transfer fluid solution.
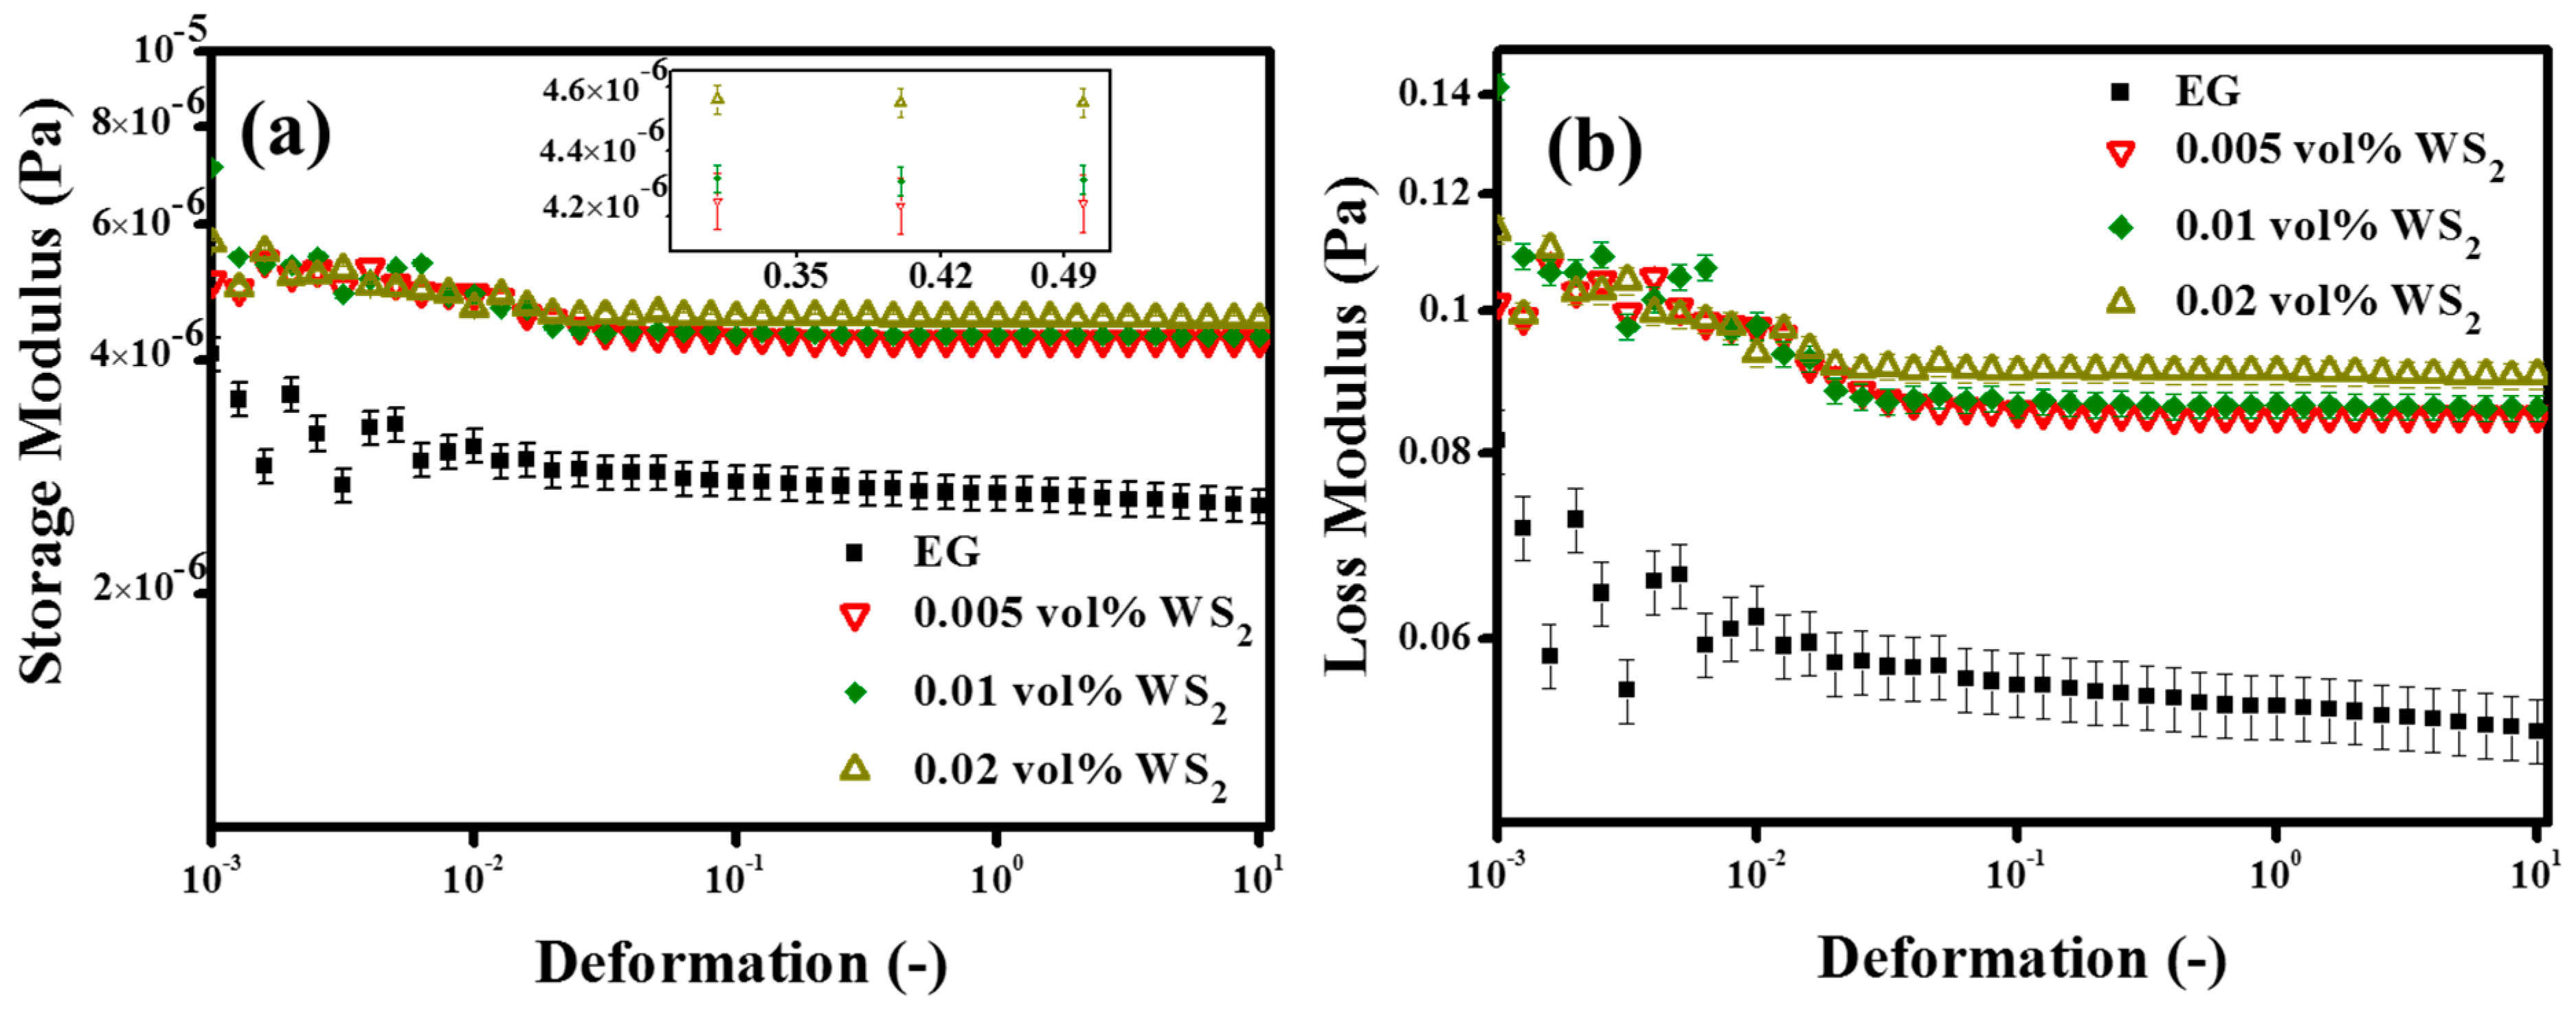
  • The oscillation rheology showed a rational verification of structured network formation inside nanofluids with WS2 NPs and also depicted the nanofluids’ behavior transition from viscous to elastic with surfactants. The viscous to elastic structural transition suggested that a higher initial pumping input was required to initiate the fluid flow.
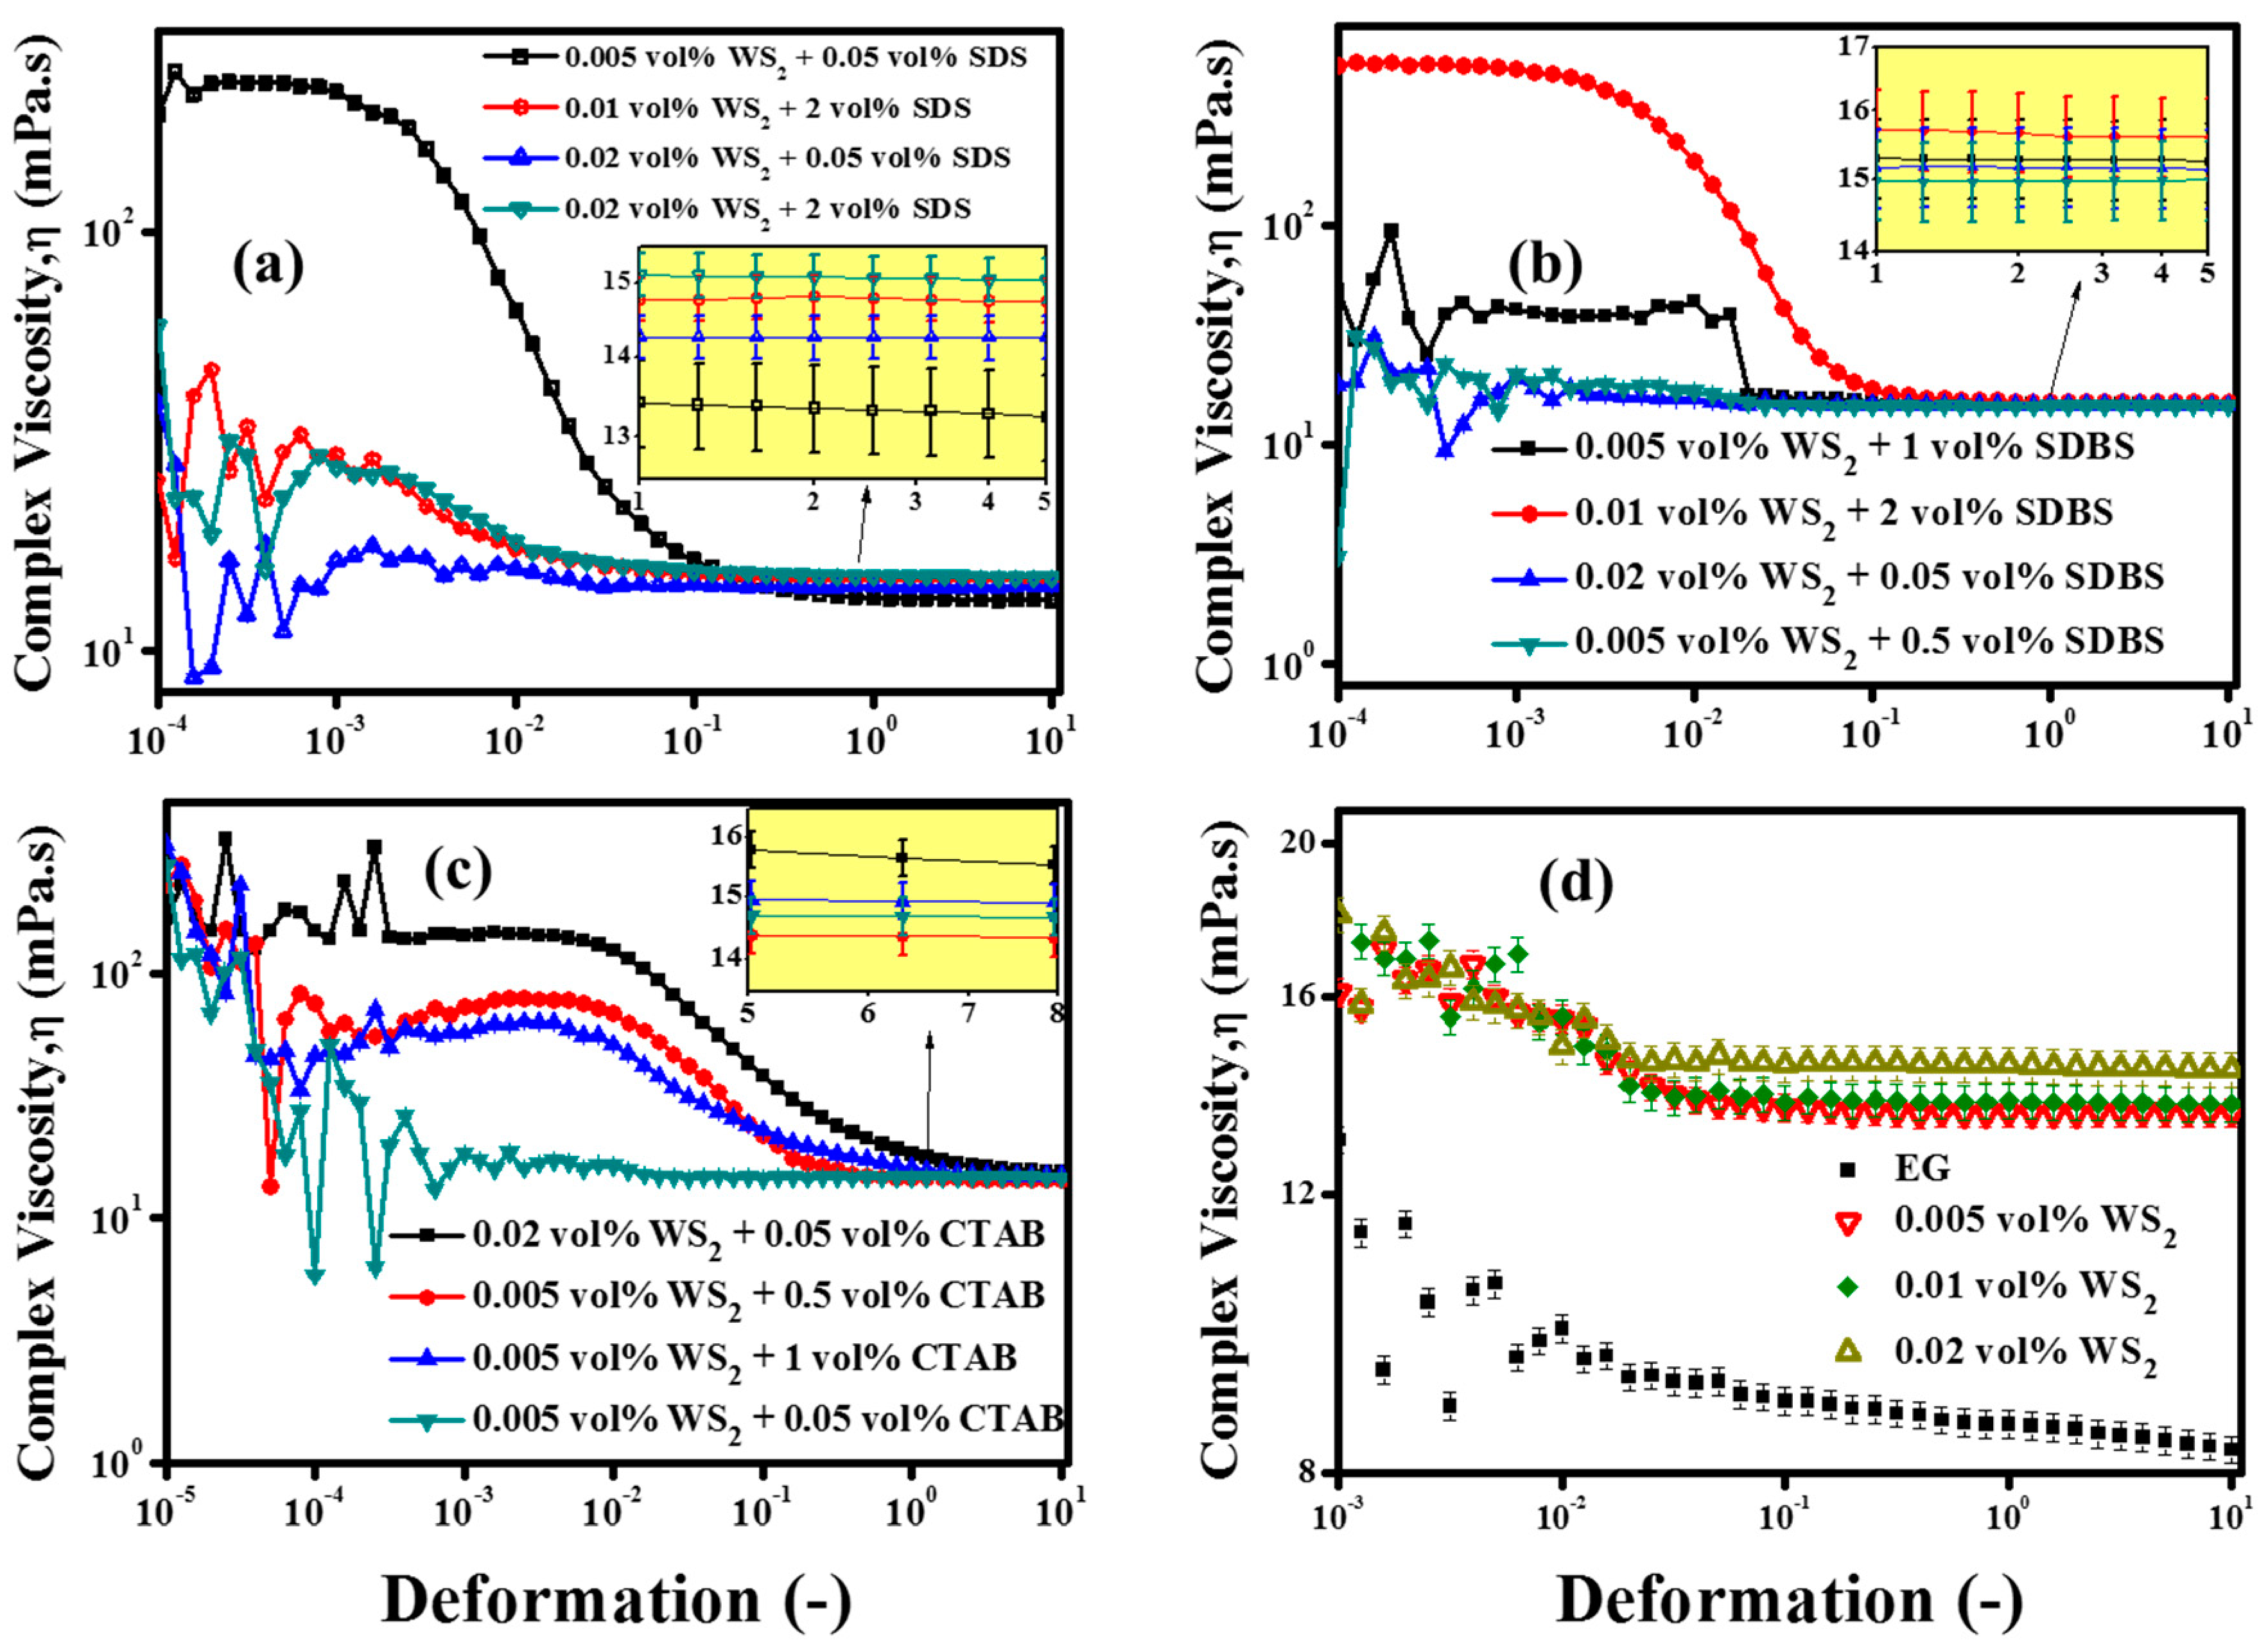
  • The anomalous viscosity reduction of ~8.2% corresponding to the minimum volume concentration (0.005%) of WS2 witnessed the super-fluidity of pristine WS2/EG nanofluids. In addition, the synergistic effect of small volume concentrations (0.05%) of SDS surfactant was also notable with 0.005% WS2, which further reduced the viscosity, and the final reduction became ~10.5%. However, higher concentrations of SDS, SDBS, and CTAB are not beneficial for synergistic effects with nanoparticles, as noted in the present work.
  • All the tested samples revealed a non-Newtonian to Newtonian behavior transition at a shear rate of 10 s−1.
  • Particularly for 0.05% SDS with 0.005% WS2, thermal conductivity was enhanced by up to 4.5%, with a corresponding decrease in viscosity of up to 10.5%, in a temperature range of 25–70 °C as compared to EG.
  • All in all, the thermal conductivity enhancement up to 6.9% and dynamic viscosity up to 10.5% proposed that the WS2/EG nanofluids can be considered as potential candidates for engineering applications. However, WS2 based nanofluids have been characterized here for the first time. Therefore, further experimental evaluation is proposed to develop a database of their stability, thermal conductivity, and rheology for comparison purposes.

Supplementary Materials

The following are available online at https://www.mdpi.com/2079-4991/10/7/1340/s1, Table S1: Mean thermal conductivity data with 95% confidence interval, Figure S1: Effect of surfactant on the thermal conductivity of base fluid, Figure S2: Amplitude sweep results of WS2/EG nanofluids containing SDS surfactant with less significant elastic domain, Figure S3: Amplitude sweep results of WS2/EG nanofluids containing SDBS surfactant with less significant elastic domain, Figure S4: Amplitude sweep results of WS2/EG nanofluids containing CTAB surfactant with less significant elastic domain.

Author Contributions

Conceptualization, S.S. and S.N.A.S.; methodology S.S. and S.N.A.S.; software, S.N.A.S.; validation, S.N.A.S., S.S. and M.F.M.S. (Mohd Faizul Mohd Sabri); formal analysis, S.N.A.S., S.S. and M.F.M.S. (Mohd Faizul Mohd Sabri); investigation, S.N.A.S.; resources, S.N.A.S., S.S., M.F.M.S. (Mohd Faizul Mohd Sabri), N.S. and K.M.K.; data curation, S.N.A.S., S.M.S., M.F.S., N.S. and K.M.K.; writing—original draft preparation, S.N.A.S.; writing—review and editing, S.S., M.F.M.S. (Mohd Faizul Mohd Sabri), S.M.S., M.F.M.S. (Mohd Faiz Mohd Salleh), N.S. and K.M.K.; visualization, S.N.A.S., S.S. and M.F.M.S. (Mohd Faizul Mohd Sabri); supervision, S.S., M.F.M.S. (Mohd Faizul Mohd Sabri) and M.F.M.S. (Mohd Faiz Mohd Salleh); project administration, S.S., M.F.M.S. (Mohd Faizul Mohd Sabri), N.S. and K.M.K.; funding acquisition, N.S. and K.M.K. All authors have read and agreed to the published version of the manuscript.

Funding

The authors acknowledge the financial support from University of Engineering and Technology Lahore, Pakistan under faculty development program and Deanship of Scientific Research at King Khalid University, Abha, Saudi Arabia (R. G. P.2/54/40). Moreover, authors also acknowledge the partial financial support from Universiti Pertahanan Nasional Malaysia through its Short Term Research Grant (UPNM/2019/GPJP/SG/2).

Acknowledgments

Nigel Foong (Application Specialist, Anton Paar Malaysia Sdn Bhd) is acknowledged for assistance in rheological measurements using MCR302 rheometer.

Conflicts of Interest

The authors declare no conflict of interest.

References

  1. Khullar, V.; Tyagi, H.; Hordy, N.; Otanicar, T.P.; Hewakuruppu, Y.; Modi, P.; Taylor, R.A. Harvesting solar thermal energy through nanofluid-based volumetric absorption systems. Int. J. Heat Mass Transf. 2014, 77, 377–384. [Google Scholar] [CrossRef]
  2. Chougule, S.S.; Sahu, S.K. Comparative Study of Cooling Performance of Automobile Radiator Using Al2O3-Water and Carbon Nanotube-Water Nanofluid. J. Nanotechnol. Eng. Med. 2014, 5, 010901. [Google Scholar] [CrossRef]
  3. Aberoumand, S.; Jafarimoghaddam, A. Tungsten (III) oxide (WO3)—Silver/transformer oil hybrid nanofluid: Preparation, stability, thermal conductivity and dielectric strength. Alex. Eng. J. 2018, 57, 169–174. [Google Scholar] [CrossRef]
  4. Pal, B.; Mallick, S.S.; Pal, B. Remarkably Improved Dispersion Stability and Thermal Conductivity of WO3–H2O Suspension by SiO2 Coating. J. Nanosci. Nanotechnol. 2018, 18, 3283–3290. [Google Scholar] [CrossRef] [PubMed]
  5. Nguyen, C.T.; Desgranges, F.; Roy, G.; Galanis, N.; Maré, T.; Boucher, S.; Mintsa, H.A. Temperature and particle-size dependent viscosity data for water-based nanofluids–hysteresis phenomenon. Int. J. Heat Fluid Flow 2007, 28, 1492–1506. [Google Scholar] [CrossRef]
  6. Karimi-Nazarabad, M.; Goharshadi, E.K.; Youssefi, A. Particle shape effects on some of the transport properties of tungsten oxide nanofluids. J. Mol. Liq. 2016, 223, 828–835. [Google Scholar] [CrossRef]
  7. Naik, M.T.; Janardhana, G.R.; Reddy, K.V.K.; Reddy, B.S. Experimental investigation into rheological property of copper oxide nanoparticles suspended in propylene glycol–water based fluids. ARPN J. Eng. Appl. Sci. 2010, 5, 29–34. [Google Scholar]
  8. Karimi-Nazarabad, M.; Goharshadi, E.K.; Entezari, M.H.; Nancarrow, P. Rheological properties of the nanofluids of tungsten oxide nanoparticles in ethylene glycol and glycerol. Microfluid. Nanofluidics 2015, 19, 1191–1202. [Google Scholar] [CrossRef]
  9. SU, S.C. Enhancing the rmal conductivity of fluids with nanoparticles, developments and applications of non-Newtonian flows. In Proceedings of the 1995 International mechanical engineering congress and exhibition, San Francisco, CA, USA, 12–17 November 1995. [Google Scholar]
  10. Namburu, P.K.; Kulkarni, D.P.; Misra, D.; Das, D.K. Viscosity of copper oxide nanoparticles dispersed in ethylene glycol and water mixture. Exp. Therm. Fluid Sci. 2007, 32, 397–402. [Google Scholar] [CrossRef]
  11. Pastoriza-Gallego, M.J.; Casanova, C.; Legido, J.L.; Piñeiro, M.M. CuO in water nanofluid: Influence of particle size and polydispersity on volumetric behaviour and viscosity. Fluid Phase Equilib. 2011, 300, 188–196. [Google Scholar] [CrossRef]
  12. Chen, L.; Xie, H.; Li, Y.; Yu, W. Nanofluids containing carbon nanotubes treated by mechanochemical reaction. Thermochim. Acta 2008, 477, 21–24. [Google Scholar] [CrossRef]
  13. Kedzierski, M.A. Viscosity and density of CuO nanolubricant. Int. J. Refrig. 2012, 35, 1997–2002. [Google Scholar] [CrossRef]
  14. Liu, Z.; Yang, J.; Grey, F.; Liu, J.Z.; Liu, Y.; Wang, Y.; Yang, Y.; Cheng, Y.; Zheng, Q. Observation of microscale superlubricity in graphite. Phys. Rev. Lett. 2012, 108, 205503. [Google Scholar] [CrossRef] [PubMed] [Green Version]
  15. Yeo, S.; Nandi, D.K.; Rahul, R.; Kim, T.H.; Shong, B.; Jang, Y.; Bae, J.-S.; Han, J.W.; Kim, S.-H.; Kim, H. Low-temperature direct synthesis of high quality WS2 thin films by plasma-enhanced atomic layer deposition for energy related applications. Appl. Surf. Sci. 2018, 459, 596–605. [Google Scholar] [CrossRef]
  16. Durairaj, A.; Jennifer, D.L.; Sakthivel, T.; Obadiah, A.; Vasanthkumar, S. Development of tungsten disulfide ZnO nanohybrid photocatalyst for organic pollutants removal. J. Mater. Sci. Mater. Electron. 2018, 29, 19413–19424. [Google Scholar] [CrossRef]
  17. Rapoport, L.; Bilik, Y.; Feldman, Y.; Homyonfer, M.; Cohen, S.R.; Tenne, R. Hollow nanoparticles of WS2 as potential solid-state lubricants. Nature 1997, 387, 791–793. [Google Scholar] [CrossRef]
  18. Lee, D.-W.; Tolochko, O.V.; Turaev, F.R.; Kim, D.; Kim, B.-K. Synthesis and characterization of WS2 nanoparticles by chemical vapor condensation. Nanosci. Nanotechnol. 2009, 9, 1–6. [Google Scholar]
  19. Kamel, M.S.; Lezsovits, F. Experimental Investigation on Pool Boiling Heat Transfer Performance Using Tungsten Oxide WO3 Nanomaterial-Based Water Nanofluid. Materials 2020, 13, 1922. [Google Scholar] [CrossRef]
  20. Martínez-Merino, P.; Alcántara, R.; Aguilar, T.; Gallardo, J.J.; Carrillo-Berdugo, I.; Gómez-Villarejo, R.; Rodríguez-Fernández, M.; Navas, J. Stability and Thermal Properties Study of Metal Chalcogenide-Based Nanofluids for Concentrating Solar Power. Energies 2019, 12, 4632. [Google Scholar] [CrossRef] [Green Version]
  21. Zhu, D.; Wang, L.; Yu, W.; Xie, H. Intriguingly high thermal conductivity increment for CuO nanowires contained nanofluids with low viscosity. Sci. Rep. 2018, 8, 1–2. [Google Scholar] [CrossRef] [Green Version]
  22. Martínez-Merino, P.; Midgley, S.D.; Martín, E.I.; Estellé, P.; Alcántara, R.; Sánchez-Coronilla, A.; Grau-Crespo, R.; Navas, J. Novel WS2-Based Nanofluids for Concentrating Solar Power: Performance Characterization and Molecular-Level Insights. ACS Appl. Mater. Interfaces 2020, 12, 5793–5804. [Google Scholar] [CrossRef] [PubMed]
  23. Saterlie, M.S.; Sahin, H.; Kavlicoglu, B.; Liu, Y.; Graeve, O.A. Surfactant effects on dispersion characteristics of copper-based nanofluids: A dynamic light scattering study. Chem. Mater. 2012, 24, 3299–3306. [Google Scholar] [CrossRef]
  24. Lee, D.; Kim, J.-W.; Kim, B.G. A new parameter to control heat transport in nanofluids: Surface charge state of the particle in suspension. J. Phys. Chem. B 2006, 110, 4323–4328. [Google Scholar] [CrossRef]
  25. Liu, Y.; Sun, D.; Askari, S.; Patel, J.; Macias-Montero, M.; Mitra, S.; Zhang, R.; Lin, W.F.; Mariotti, D.; Maguire, P. Enhanced Dispersion of TiO2 Nanoparticles in a TiO2/PEDOT:PSS hybrid Nanocomposite via Plasma-Liquid Interactions. Sci. Rep. 2015, 5, 1–11. [Google Scholar] [CrossRef] [Green Version]
  26. Zhou, J.; Hu, M.; Jing, D. The synergistic effect between surfactant and nanoparticle on the viscosity of water-based fluids. Chem. Phys. Lett. 2019, 727, 1–5. [Google Scholar] [CrossRef]
  27. Sharma, P.; Baek, I.; Cho, T.; Park, S.; Lee, K.B.; Bong, K. Enhancement of thermal conductivity of ethylene glycol based silver nano fl uids. Powder Technol. 2011, 208, 7–19. [Google Scholar] [CrossRef]
  28. Singh, M.; Kundan, L. Experimental Study on Thermal Conductivity and Viscosity of Al2O3-Nanotransformer Oil. Int. J. Theor. Appl. Res. Mech. Eng. 2013, 2, 125–130. [Google Scholar]
  29. Sani, E.; Vallejo, J.P.; Cabaleiro, D.; Lugo, L. Functionalized graphene nanoplatelet-nanofluids for solar thermal collectors. Sol. Energy Mater. Sol. Cells 2018, 185, 205–209. [Google Scholar] [CrossRef]
  30. Holman, J.P. Experimental Methods for Engineers, 8th ed.; McGraw-Hill: New York, NY, USA, 1966. [Google Scholar]
  31. Yu, L.; Bian, Y.; Liu, Y.; Xu, X. Experimental investigation on rheological properties of water based nanofluids with low MWCNT concentrations. Int. J. Heat Mass Transf. 2019, 135, 175–185. [Google Scholar] [CrossRef]
  32. Yarbrough, K.; Pradhan, S.K.; Kogo, G.; Roul, M.; Lin, P.; Zhang, K.; Baumgart, H.; Bahoura, M. Thickness Controlled Nanostructure Formation in RF Sputtered WS2 Thin Film. Mater. Res. Express 2018. [Google Scholar] [CrossRef]
  33. Mahler, B.; Hoepfner, V.; Liao, K.; Ozin, G.A. Colloidal synthesis of 1T-WS2 and 2H-WS2 nanosheets: Applications for photocatalytic hydrogen evolution. J. Am. Chem. Soc. 2014, 136, 14121–14127. [Google Scholar] [CrossRef] [PubMed]
  34. Scherrer, P. Zsigmondy’s Kolloidchemie; BoD–Books on Demand: Norderstedt, Germany, 2012. [Google Scholar]
  35. Vattikuti, S.V.; Byon, C. Effect of CTAB surfactant on textural, structural, and photocatalytic properties of mesoporous WS2. Sci. Adv. Mater. 2015, 7, 2639–2645. [Google Scholar] [CrossRef]
  36. Liu, L.; Stetsyuk, V.; Kubiak, K.J.; Yap, Y.F.; Chai, J.C. Nanoparticles for convective heat transfer enhancement: Heat transfer coefficient and the effects of particle size and zeta potential. Chem. Eng. Commun. 2018, 206, 761–771. [Google Scholar] [CrossRef] [Green Version]
  37. Graves, J.E.; Latvytė, E.; Greenwood, A.; Emekwuru, N.G. Ultrasonic preparation, stability and thermal conductivity of a capped copper-methanol nanofluid. Ultrason. Sonochem. 2019, 55, 25–31. [Google Scholar] [CrossRef]
  38. Seong, H.J.; Kim, G.N.; Jeon, J.H.; Jeong, H.M.; Noh, J.P.; Kim, Y.J.; Kim, H.J.; Huh, S.C. Experimental study on characteristics of grinded graphene nanofluids with surfactants. Materials 2018, 11, 950. [Google Scholar] [CrossRef] [Green Version]
  39. Umar, S.; Sulaiman, F.; Abdullah, N.; Mohamad, S.N. Investigation of the effect of pH adjustment on the stability of nanofluid. In AIP Conference Proceedings; AIP Publishing LLC: Melville, NY, USA, 2018; Volume 2031, p. 020031. [Google Scholar] [CrossRef]
  40. Carrillo-Berdugo, I.; Zorrilla, D.; Sánchez-Márquez, J.; Aguilar, T.; Gallardo, J.J.; Gómez-Villarejo, R.; Alcántara, R.; Fernández-Lorenzo, C.; Navas, J. Interface-inspired formulation and molecular-level perspectives on heat conduction and energy storage of nanofluids. Sci. Rep. 2019, 9, 1–13. [Google Scholar] [CrossRef] [Green Version]
  41. Li, D.; Fang, W.; Feng, Y.; Geng, Q.; Song, M. Stability properties of water-based gold and silver nanofluids stabilized by cationic gemini surfactants. J. Taiwan Inst. Chem. Eng. 2019, 458–465. [Google Scholar] [CrossRef]
  42. Che Sidik, N.A.; Mahmud Jamil, M.; Aziz Japar, W.M.A.; Muhammad Adamu, I. A review on preparation methods, stability and applications of hybrid nanofluids. Renew. Sustain. Energy Rev. 2017, 80, 1112–1122. [Google Scholar] [CrossRef]
  43. Korada, V.S.; Hamid, N.H.B. Engineering Applications of Nanotechnology: From Energy to Drug Delivery; Springer International Publishing: Cham, Switzerland, 2017. [Google Scholar]
  44. Ilyas, S.U.; Pendyala, R.; Marneni, N. Settling Characteristics of Alumina Nanoparticles in Ethanol-Water Mixtures. In Applied Mechanics and Materials; Trans Tech Publications Ltd.: Schwyz, Switzerland, 2013; Volume 372, pp. 143–148. [Google Scholar] [CrossRef]
  45. Michael, M.; Zagabathuni, A.; Ghosh, S.; Pabi, S.K. Thermo-physical properties of pure ethylene glycol and water–ethylene glycol mixture-based boron nitride nanofluids: An experimental investigation. J. Therm. Anal. Calorim. 2018, 5, 369–380. [Google Scholar] [CrossRef]
  46. Xia, G.; Jiang, H.; Liu, R.; Zhai, Y. Effects of surfactant on the stability and thermal conductivity of Al2O3/de-ionized water nanofluids. Int. J. Therm. Sci. 2014, 84, 118–124. [Google Scholar] [CrossRef]
  47. Ilhan, B.; Kurt, M.; Ertürk, H. Experimental investigation of heat transfer enhancement and viscosity change of hBN nanofluids. Exp. Therm. Fluid Sci. 2016, 77, 272–283. [Google Scholar] [CrossRef]
  48. Thomas, S.; Sobhan, C.B.; Taha-Tijerina, J.; Narayanan, T.N.; Ajayan, P.M. Investigations on Transient Natural Convection in Boron Nitride-Mineral Oil Nanofluid Systems. In ASME 2012 International Mechanical Engineering Congress and Exposition; American Society of Mechanical Engineers: New York, NY, USA, 2013; p. 671. [Google Scholar]
  49. Sarviya, R.M.; Fuskele, V. Review on Thermal Conductivity of Nanofluids. Mater. Today Proc. 2017, 4, 4022–4031. [Google Scholar] [CrossRef]
  50. Shah, J.; Ranjan, M.; Sooraj, K.P.; Sonvane, Y.; Gupta, S.K. Surfactant prevented growth and enhanced thermophysical properties of CuO nanofluid. J. Mol. Liq. 2019, 283, 550–557. [Google Scholar] [CrossRef]
  51. Ebrahimi, R.; de Faoite, D.; Finn, D.P.; Stanton, K.T. Accurate measurement of nanofluid thermal conductivity by use of a polysaccharide stabilising agent. Int. J. Heat Mass Transf. 2019, 136, 486–500. [Google Scholar] [CrossRef]
  52. Selvam, C.; Mohan Lal, D.; Harish, S. Thermal conductivity and specific heat capacity of water–ethylene glycol mixture-based nanofluids with graphene nanoplatelets. J. Therm. Anal. Calorim. 2017, 129, 947–955. [Google Scholar] [CrossRef]
  53. Leong, K.Y.; Mohd Hanafi, N.; Mohd Sohaimi, R.; Amer, N.H. The effect of surfactant on stability and thermal conductivity of carbon nanotube based nanofluids. Therm. Sci. 2016, 20, 429–436. [Google Scholar] [CrossRef]
  54. Żyła, G.; Fal, J.; Estellé, P. Thermophysical and dielectric profiles of ethylene glycol based titanium nitride (TiN–EG) nanofluids with various size of particles. Int. J. Heat Mass Transf. 2017, 113, 1189–1199. [Google Scholar] [CrossRef]
  55. Hermida-Merino, C.; Perez-Rodriguez, M.; Pineiro, M.M.; Pastoriza-Gallego, M.J. Evidence of viscoplastic behavior of exfoliated graphite nanofluid. Soft Matter 2010, 4, 2264–2275. [Google Scholar] [CrossRef]
  56. Franck, A. Understanding Rheology of Structured Fluids. Available online: http://www.tainstruments.com/pdf/literature/AAN016_V1_U_StructFluids.pdf (accessed on 7 July 2020).
  57. Beheshti, A.; Shanbedi, M.; Zeinali, S. Heat transfer and rheological properties of transformer oil-oxidized MWCNT nanofluid. J. Therm. Anal. Calorim. 2014, 118, 1451–1460. [Google Scholar] [CrossRef]
  58. Larson, R.G. The rheology of dilute solutions of flexible polymers: Progress and problems. J. Rheol. 2005, 49, 1–70. [Google Scholar] [CrossRef]
  59. Kamal, C.; Gravelle, S.; Botto, L. Hydrodynamic slip can align thin nanoplatelets in shear flow. Nat. Commun. 2020, 11, 1–10. [Google Scholar] [CrossRef] [PubMed]
  60. Vajjha, R.S.; Das, D.K.; Chukwu, G.A. An Experimental Determination of the Viscosity of Propylene Glycol/Water Based Nanofluids and Development of New Correlations. J. Fluids Eng. 2015, 137, 081201. [Google Scholar] [CrossRef]
  61. Arrhenius, S. Über die Dissociationswärme und den Einfluss der Temperatur auf den Dissociationsgrad. Z. Phys. Chem. 1889, 4, 96–116. [Google Scholar] [CrossRef] [Green Version]
Figure 1. (a) Powder XRD pattern of WS2 and (b) Universal Attenuated Total Reflectance (UATR)-FTIR spectra of WS2.
Nanomaterials 10 01340 g001
Figure 2. WS2 morphology using (a) FESEM and (b) HRTEM (high-resolution transmission electron microscopy).
Nanomaterials 10 01340 g002
Figure 3. (a) Zeta potential distribution without dispersant and (b) particle size distribution without dispersant.
Nanomaterials 10 01340 g003
Figure 4. Relationship between pH and zeta potential at different volumes% of WS2 and dispersants (a,b), with SDS, (c,d) with SDBS, and (e,f) with CTAB.
Nanomaterials 10 01340 g004
Figure 5. (a) Effect of surfactants on mean particle size and (b) polydispersity index (PDI) of WS2/EG nanofluids.
Nanomaterials 10 01340 g005
Figure 6. Relative thermal conductivity at different temperatures: (ac) with SDS, (df) with SDBS, and (gi) with CTAB.
Nanomaterials 10 01340 g006
Figure 7. (a,b) Storage (G’) and loss (G”) modulus variation in WS2/EG nanofluids without surfactants.
Nanomaterials 10 01340 g007
Figure 8. (ac) Complex viscosity (η) of WS2/EG nanofluids with surfactants and (d) without surfactants as an indication of structured network inclusion.
Nanomaterials 10 01340 g008
Figure 9. Effect of surfactants on the viscoelastic behavior of WS2/EG nanofluids: evidence of typical flow point. (a) WS2 combination with SDS, (b,c) WS2 combination with SDBS, and (df) WS2 combination with CTAB.
Nanomaterials 10 01340 g009
Figure 10. Relative viscosity of WS2/EG nanofluids (a) without surfactant and (bd) with surfactants over a range of shear rates at 25 °C.
Nanomaterials 10 01340 g010
Figure 11. Effect of temperature on relative viscosity of WS2/EG nanofluids at 50 s−1 constant pre-shear: (a) pristine WS2/EG nanofluids, (b) SDS contained WS2/EG nanofluids, (c) SDBS contained WS2/EG nanofluids and (d) CTAB contained WS2/EG nanofluids.
Nanomaterials 10 01340 g011
Table 1. Tungsten disulphide (WS2) specifications.
NanoparticlesPurity (%)Density (g/cm3)Molecular Weight (g/mol)Average Thickness (nm)Specific Surface Area (m2/g)Coefficient of FrictionSource
CAS-Reg. No.: 12138-09-9 WS2 Silver-Grey Crystalline Solid Powder997.524890300.03–0.07M K Impex Corp. Mississauga, ON, Canada
Table 2. Details of surfactants and base fluid.
MaterialNameChemical FormulaMolecular Weight (g/mol)Density (g/cm3)Type (-)Source
SurfactantsSDS *NaC12H25SO4288.381.01AnionicFisher Scientific, Loughborough, UK
SDBS *C18H29NaO3S348.481.06Anionic
CTAB *C19H42BrN364.450.5Cationic
Base fluidEG *(CH12OH)262.071.11OrganicSigma Aldrich, Subang Jaya, Malaysia
* SDS: Sodium dodecyl sulphate. SDBS: Sodium dodecylbenzenesulfonate. CTAB: Cetyltrimethylammonium bromide. EG: Ethylene glycol.
Table 3. Maximum value of zeta potential for WS2/EG nanofluids.
WS2 (Vol%)Surfactant Concentration (vol%)Maximum Mean Zeta Potential (mV)
SDSSDBSCTABSDSSDBSCTABNo Surfactant
0.00520.52−51.7 ± 4.9−45.2 ± 2.142.3 ± 4.5−7.9 ± 1.3
0.01212−35.6 ± 5.3−43.2 ± 2.340 ± 2.8−9.28 ± 1.8
0.02222−35.9 ± 6.8−42.7 ± 2.331.6 ± 3.9−5.06 ± 0.5
Table 4. Optimal surfactant concentrations corresponding to maximum thermal conductivity enhancement at different temperatures.
WS2 (Vol%)Optimal Surfactant Concentration (vol%)Maximum Thermal Conductivity Enhancement (%)
SDSSDBSCTABSDSSDBSCTABNo Surfactant
T = 25 °C
0.0050.0510.052.82.52.41.6
0.010.050.050.051.91.51.71.2
0.020.050.0512.21.721.2
T = 50 °C
0.0050.050.511.92.12.2−1.4
0.010.05220.42.7−2.7−1.6
0.020.050.052−3.51.50.4−1.9
T = 70 °C
0.0050.050.50.54.51.34.13.9
0.0120.514.611.33.5
0.0220.050.053.01.76.90.4
Table 5. Strain sweep results summary on WS2/EG nanofluids (continued).
Sample DescriptionFlow Point Stress (mPa) at G’ = G”Resulting Remarks
Base fluid (EG)No crossoverVery high loss factor with high fluidity over entire deformation range
0.005 vol% WS2No crossoverG’ increased as compared to EG but still high fluidity over entire deformation range
0.01 vol% WS2No crossover
0.02 vol% WS2No crossover
0.005 vol% Ws2 + 0.05 vol% SDS4.2Behaves strongly gel-like until 1.218% of deformation
0.01 vol% Ws2 + 2 vol% SDSNo significant crossoverOscillatory behavior followed by completely liquid-like over high deformation range
0.02 vol% WS2 + 0.05 vol% SDSNo significant crossoverOscillatory behavior followed by completely liquid-like over high deformation range
0.02 vol% WS2 + 2 vol% SDSNo significant crossoverWeak gel behavior at low deformation followed by liquid behavior over high deformation range
0.005 vol% Ws2 + 1 vol% SDBS3.548Behaves like weak gel until 1.646% of deformation
0.01 vol% Ws2 + 2 vol% SDBS9.05Strong gel until 2.779% of deformation
0.02 vol% Ws2 + 0.05 vol% SDBSNo significant crossoverWeak gel behavior at low deformation followed by liquid behavior over high deformation range
0.005 vol% Ws2 + 0.5 vol% SDBSNo crossoverVery high loss factor with high fluidity over entire deformation range
0.02 vol% Ws2 + 0.05 vol% CTAB8.289Weak gel until 1.095% of deformation
0.005 vol% Ws2 + 0.5 vol% CTAB2.597Weak gel until 0.5343% of deformation
0.005 vol% Ws2 + 1 vol% CTAB3.815Weak gel until 1.32% of deformation
0.005 vol% Ws2 + 0.05 vol% CTABNo crossoverVery high loss factor with high fluidity over entire deformation range
Table 6. Herschel–Bulkley and Bingham model fitting parameters.
Sample DescriptionH–B ModelBingham Model
τo (mPa)K (mPa.sn)n (-)R2τo (mPa)μ (mPa.s)R2
Base fluid (EG)1.542114.5751.00130.999991.086614.6580.99999
0.005 vol% WS21.603113.2581.00340.999990.5014813.460.99999
0.01 vol% WS2−0.77283 *13.7350.999370.99999−0.56718 *13.6970.99999
0.02 vol% WS21.484414.2471.00180.999990.8555114.3630.99999
0.005 vol% WS2 + 0.05 vol% SDS3.472412.8121.00520.999991.862113.1060.99999
0.01 vol% WS2 + 2 vol% SDS−0.49429 *14.8360.998170.999990.1473214.7180.99999
0.02 vol% WS2 + 0.05 vol% SDS−1.3374 *14.4870.996771−0.23628 *14.2841
0.02 vol% WS2 + 2 vol% SDS−2.0203 *15.3670.994830.99999−0.16437 *15.0231
0.005 vol% WS2 + 1 vol% SDBS−1.1213 *15.570.995240.99980.6146515.2490.99998
0.01 vol% WS2 + 2 vol% SDBS−2.2094 *16.010.993840.999990.09018815.5840.99999
0.02 vol% WS2 + 0.05 vol% SDBS3.912114.6591.00640.999981.636515.0740.99999
0.005 vol% WS2 + 0.5 vol% SDBS0.1840415.0140.9990410.5266414.9511
0.02 vol% WS2+ 0.05 vol% CTAB13.84415.6540.99310.9999616.39315.1860.99995
0.005 vol% WS2 + 0.5 vol% CTAB1.644614.4490.997510.999992.496514.2920.99998
0.005 vol% WS2 + 1 vol% CTAB15.34413.991.010.9999711.84614.620.99998
0.005 vol% WS2 + 0.05 vol% CTAB−3.02 *15.1460.992560.99998−0.41809 *14.660.99998
* Yield stress cannot be calculated.
Table 7. Comparison of viscosity data for enhancement and reduction (%) at targeted temperatures of 25 °C, 50 °C, and 70 °C, using a constant shear rate of 50 s−1. “+” sign indicates enhancement and “–” sign indicates reduction in viscosity as compared to the base fluid.
Sample DescriptionViscosity Enhancement/Reduction (%)
25 °C50 °C70 °C
0.005 vol% WS2−8.2−6−4.7
0.01 vol% WS2−6.9−5.3−4
0.02 vol% WS2−2.1−0.2−1
0.005 vol% WS2 + 0.05 vol% SDS−10.5−8.1−5.6
0.01 vol% WS2 + 2 vol% SDS0.114.93
0.02 vol% WS2 + 0.05 vol% SDS−3.1−2.8−0.6
0.02 vol% WS2 + 2 vol% SDS2.13.21.9
0.005 vol% WS2 + 1 vol% SDBS3.331.9
0.01 vol% WS2 + 2 vol% SDBS5.76.46.7
0.02 vol% WS2 + 0.05 vol% SDBS3.132
0.005 vol% WS2 + 0.5 vol% SDBS1.51.40.8
0.02 vol% WS2 + 0.05 vol% CTAB4.93.62.9
0.005 vol% WS2 + 0.5 vol% CTAB−2.3−2.3−2.7
0.005 vol% WS2 + 1 vol% CTAB1.8−0.91
0.005 vol% WS2 + 0.05 vol% CTAB−0.7−0.7−0.8
Table 8. Arrhenius equation fitting parameters for WS2/EG nanofluids.
Sample DescriptionArrhenius Equation Fitting Parameters
η , T   ( mPa . s ) Ea (Jmol−1)R2
Base fluid (EG)33.337620.270040.99723
0.005 vol% WS229.808260.26180.99712
0.01 vol% WS230.409850.263920.99712
0.02 vol% WS232.176060.265190.99796
0.005 vol% WS2 + 0.05 vol% SDS28.971510.260660.9968
0.01 vol% WS2 + 2 vol% SDS32.464860.261070.99781
0.02 vol% WS2 + 0.05 vol% SDS32.110540.268170.99685
0.02 vol% WS2 + 2 vol% SDS33.892050.268310.99794
0.005 vol% WS2 + 1 vol% SDBS34.69490.27210.99738
0.01 vol% WS2 + 2 vol% SDBS34.985070.267730.99721
0.02 vol% WS2 + 0.05 vol% SDBS34.608620.271820.9976
0.005 vol% WS2 + 0.5 vol% SDBS33.892320.270490.99729
0.02 vol% WS2 + 0.05 vol% CTAB35.273970.274090.99646
0.005 vol% WS2 + 0.5 vol% CTAB32.547590.269950.99732
0.005 vol% WS2 + 1 vol% CTAB34.310330.276080.99499
0.005 vol% WS2 + 0.05 vol% CTAB33.164640.270490.9973
Table 9. Parametric comparison of current findings.
Sample DescriptionThermal Conductivity Enhancement/ReductionViscosity ReductionParticle SizeZeta Potential
(%)(%)(nm)(−mV)
25 °C50 °C70 °C25 °C50 °C70 °C25 °C
0.005 vol% WS21.6−1.43.9−8.2−6−4.7378.28 ± 34.37.9 ± 1.3
0.01 vol% WS21.2−1.63.5−6.9−5.3−4335.81 ± 38.99.28 ± 1.8
0.02 vol% WS21.2−1.90.4−2.1−0.2−1388.8 ± 25.75.06 ± 0.5
0.005 vol% WS2 + 0.05 vol% SDS2.81.94.5−10.5−8.1−5.6749.2 ± 50.114.9 ± 1.5
0.02 vol% WS2 + 0.05 vol% SDS2.2−3.53−3.1−2.8−0.61224.6 ± 65.38.7 ± 1.1
0.005 vol% WS2 + 0.5 vol% CTAB2.30.24.1−2.3−2.3−2.7532.8 ± 28.4−22 ± 2.6
0.005 vol% WS2 + 0.05 vol% CTAB2.4−0.6−2.4−0.7−0.7−0.8338.4 ± 10.25.8 ± 0.5

