Article

Microstructure, Thermal Stability, and Catalytic Activity of Compounds Formed in CaO-SiO2-Cr(NO3)3-H2O System

by
Domante Niuniavaite
1,
Kestutis Baltakys
1,*,
Tadas Dambrauskas
1,
Anatolijus Eisinas
1,
Dovile Rubinaite
1 and
Andrius Jaskunas
2
1
Department of Silicate Technology, Kaunas University of Technology, Radvilenu 19, LT-50270 Kaunas, Lithuania
2
Department of Physical and Inorganic Chemistry, Kaunas University of Technology, Radvilenu 19, LT-50270 Kaunas, Lithuania
*
Author to whom correspondence should be addressed.
Nanomaterials 2020, 10(7), 1299; https://doi.org/10.3390/nano10071299
Submission received: 28 May 2020 / Revised: 19 June 2020 / Accepted: 29 June 2020 / Published: 2 July 2020

Abstract

:
In this work, the thermal stability, microstructure, and catalytic activity in oxidation reactions of calcium silicate hydrates formed in the CaO-SiO2-Cr(NO3)3-H2O system under hydrothermal conditions were examined in detail. Dry primary mixture with a molar ratio of CaO/SiO2 = 1.5 was mixed with Cr(NO3)3 solution (c = 10 g Cr3+/dm3) to reach a solution/solid ratio of the suspension of 10.0:1. Hydrothermal synthesis was carried out in unstirred suspensions at 175 °C for 16 h. It was determined that, after treatment, semicrystalline calcium silicate hydrates C-S-H(I) and/or C-S-H(II) with incorporated Cr3+ ions (100 mg/g) were formed. The results of in situ X-ray diffraction and simultaneous thermal analyses showed that the products were stable until 500 °C, while, at higher temperatures, they recrystallized to calcium chromate (CaCrO4, 550 °C) and wollastonite (800–850 °C). It was determined that both the surface area and the shape of the dominant pore changed during calcination. Propanol oxidation experiments showed that synthetic semicrystalline calcium silicate hydrates with intercalated chromium ions are able to exchange oxygen during the heterogeneous oxidation process. The obtained results were confirmed by XRD, STA, FT-IR, TEM, SEM, and BET methods, and by propanol oxidation experiments.

Graphical Abstract

1. Introduction

According to various sources, humanity is facing more than 15 environmental concerns, such as air, water, and soil pollution, global warming, health issues, and others. One of the major contributors to global air pollution (denoted by the contribution to ozone and chemical smog) and human health is volatile organic compounds (VOCs, alkenes, alkanes, esters, alcohols, etc.) [1,2,3]. The main sources of these compounds are the chemical and petroleum industry, pharmaceutical plants, etc. In addition, a large variety of VOCs are generated from household products [4,5]. There are many technologies for VOC neutralization: Biological degradation, adsorption, ozonation, thermal treatment, and oxidation. Catalytic oxidation is one of the most common attractive ways to eliminate these compounds by converting them to CO2 and H2O at a low temperature (200–500 °C). The conventional catalysts require precious metals (Pt, Pd, Au), which are expensive; therefore, scientists are looking for new catalysts based on transitional metals [6,7,8,9].
In order to create a cost-effective and efficient catalyst for VOC oxidation, scientists are investigating such metals as Cr [10,11], Zn [12], Fe, Co [13,14,15], Cu [16,17], Mn [18], and others. One of the widely studied metals is chromium, which not only possesses efficient redox properties but is also economically attractive due to the low cost [19,20,21]. The application of chromium compounds for environmentally friendly selective oxidation reactions in the liquid or gas phases depends on the adhesion to specific catalyst supports. In addition, the nature of the catalyst support affects the performance, application, and properties of catalysts [22,23]. There are a lot of requirements for catalyst supports, but the high surface area and thermal stability are some of the most important ones. For this reason, attention has been paid to mesoporous calcium silicates (xCaO·ySiO2) or calcium silicate hydrates (xCaO·ySiO2·zH2O), which are a promising catalyst support [10,24]. These compounds not only have the aforementioned properties but are also chemically stable and able to disperse metal particles on the surface. In addition, calcium silicates and calcium silicate hydrates allow the retaining of the unique properties of metal ions and promote catalytic activity [25,26].
Calcium silicate hydrates form in nature, by curing cement, and they can also be synthesized in CaO-SiO2-H2O mixtures under hydrothermal conditions within the 100–350 °C temperature range [27]. Meanwhile, calcium silicates can be synthesized by calcining calcium silicate hydrates, or by solid sintering of calcium- and silicon-containing materials [28,29]. Usually, the preparation of catalysts supported with calcium silicates or calcium silicate hydrates involves three steps [30,31]: (1) Synthesis of calcium silicates or calcium silicate hydrates; (2) adsorption of metal ions; (3) calcination at a selected temperature (in order to achieve active metal oxides). In addition, it is possible to incorporate metal ions into the structure of calcium silicates or calcium silicate hydrates during their synthesis. Such compounds with incorporated metal ions can be used as catalysts for ethanol conversion to butadiene, for the synthesis of bisphenol F, and for the oxidation of ketones and aldehydes [25,32,33]. Unfortunately, there is a lack of information about the influence of metals on the formation, thermal stability, microstructure, and other properties of such materials. According to the literature, some metal ions, such as sodium or potassium ions, have a positive effect on the reactivity of silicon-containing compounds and promote the formation of calcium silicate hydrates [34]. Meanwhile, aluminum ions affect the stability and morphology of tobermorite because, by increasing the aluminum content, the form of crystals changes from plate-like to lath-like and then to needle-like [35]. Different results were obtained by using aluminum oxide for the synthesis of dibasic calcium silicate hydrate α-C2SH at 200 °C because this additive retarded the formation of calcium silicate hydrates but stimulated the crystallization of calcium silicate [28]. According to the literature, some cations, such as Al3+, B3+, and Be2+, can change silicon in the silicon–oxygen tetrahedron, while others (Na+, K+, Fe2+, Mn2+, Ti2+, Zr2+, etc.) intercalate outside it. These cations connect silicon–oxygen tetrahedrons to each other. Thus, different cations change the composition, structure, and other properties of calcium silicate hydrates and calcium silicates [36].
For these reasons, in the first part of this work, the thermal stability of compounds formed in the CaO-SiO2-Cr(NO3)3-H2O system under hydrothermal conditions was examined in detail. Meanwhile, in the second part, the microstructure and catalytic activity of synthetic and calcined products were determined.

2. Materials and Methods

The synthesis of dibasic calcium silicate hydrate samples (C-S-H) with incorporated Cr3+ ions was based on the hydrothermal method. The dry primary mixture of fine-grained SiO2·nH2O (Reaktiv, Saint Petersburg, Russia, loss of ignition—16.9%) and calcium oxide (produced by burning Ca(OH)2 (Sigma Aldrich, Darmstadt, Germany) at 450 °C for 1 h; the quantity of free CaO was equal to 97.41%) was mixed with CrN3O9·9H2O solution (Eurochemicals, Vilnius, Lithuania, concentration of Cr3+ ions 10 g/dm3) to reach a water-to-solid ratio of 10:1, with the CaO/SiO2 molar ratio of 1.5:1. Due to the formation peculiarities of higher-basicity calcium silicates hydrates [27,28,30,37], hydrothermal synthesis was carried out in unstirred suspensions under saturated steam pressure at 175 °C for 16 h. After hydrothermal treatment, the obtained products were filtered off, rinsed with ethanol, dried at 50 °C ± 5 for 24 h, and sieved (<80 μm).
The obtained products were calcined in a high-temperature furnace Nabertherm LH 15/13 at 550 °C for 24 h. The calcination temperature was reached within 48 h.
The mineralogical composition of products was determined by powder X-ray diffraction (XRD, D8 Advance diffractometer, Bruker AXS, Karlsruhe, Germany). The operating conditions were as follows: 0.02 mm Ni filter, Cu Kα radiation, tube voltage 40 kV, tube current 40 mA, detector Bruker LynxEye. Diffraction patterns were recorded in a Bragg–Brentano geometry within the 2θ range of 3–70° at a scanning speed of 6°/min.
The measurements of the thermal stability and phase transformation were prepared with:
(1)
Linseis PT1000 instrument (Linseis, Selb, Germany). The operating conditions were: A heating rate of 15 °C/min, temperature range of 30–1000 °C, nitrogen atmosphere, ceramic sample handlers, and crucibles of Pt, and the sample mass was equal to ~13 mg.
(2)
In-situ XRD analysis was made with a high-temperature camera MTC-hightemp (Bruker AXS, Karlsruhe, Germany). The measurements were carried out with a step width of 0.02 2θ and 0.6 s/step at a heating rate of 50 °C/min after equilibration for 5 min at the desired temperature.
Fourier-transform infrared spectroscopy was carried out with the help of a Perkin Elmer FT–IR Spectrum X system (PerkinElmer, Waltham, MA, USA). Specimens were prepared by mixing 1 mg of the sample with 200 mg of KBr. Spectral analysis was performed in the range of 4000–400 cm−1 with a spectral resolution of 1 cm−1.
The microstructure of the products was determined by using:
(1)
Scanning electron microscopy was performed by using a JEOL JSM-7600F (JEOL, Tokyo, Japan) instrument at an accelerating voltage of 10 kV, and a working distance of 8.6 mm.
(2)
Transmission electron microscopy was performed by using a Tecnai G2 F20 X-TWIN instrument (FEI, Eindhoven, The Netherlands) with a Schottky-type field-emission electron source. The accelerating voltage was 200 kV.
The concentration of Cr3+ ions was determined by using a Perkin-Elmer Analyst 400 atomic absorption spectrometer (Perkin Elmer, Waltham, MA, USA) with the following parameters: Wavelength = 357.87 nm; hollow cathode lamp current (I) = 30 mA; the type of flame was C2H2–air; oxidant air = 10 L/min; acetylene = 2.5 L/min. All the tests were repeated three times. The concentration of nitrate anions was determined by using a Flow Injection Analyst FIAlyzer-100 (FIA; FIAlab Instruments, Seattle, WA, USA). FIAlyzer-100 system: FIAlyzer-100, integrated FIA LOB manifold, USB4000 UV/VIS spectrometer, HL2000-LL visible tungsten lamp.
The surface area of the samples was measured with a BET surface area analyzer (nitrogen adsorption porosimeter) Nova 2200 E-Series (Quantachrome Instruments, Boynton Beach, FL, USA). Prior to analysis, the samples were degassed under vacuum at 100 °C. The specific surface area of the samples was calculated with the BET equation by using the data of the lower part of the N2 adsorption isotherm (0.05 < P/P0 < 0.35). The total pore volume, the pore size distribution, and the shape of pores were calculated according to the corrected Kelvin equation and the scheme developed by Orr et al. by using the entire N2 desorption isotherm at 77 K [38,39].
The catalyst activity in oxidation reactions was determined as follows. Propanol was used as a volatile organic compound for catalytic oxidation experiments. In addition, 0.945–1.009 g of the analyzed sample was placed inside a fixed-bed quartz reactor equipped with a coil preheater. A quartz reactor was mounted inside a Nabertherm LH 15/13 furnace for maintaining the constant temperature, while a K-type thermocouple inside the reactor was used for accurate temperature monitoring. The inlet and the outlet of the reactor are equipped with special analysis points for the collection of gaseous flow samples, as well as CO and CO2 concentration measurement probes connected directly to a TESTO 445 unit. Catalytic oxidation was performed with a constant 370 mL/min flow of air, which was saturated with 475–640 ppm of VOC. The concentrations of propanol in the gas stream were determined with a Perkin Elmer Clarus 500 GC/MS system equipped with a COL-ELITE 5MS universal capillary column, which is 30 m long and has a 0.25 mm internal diameter.

3. Results and Discussions

3.1. Synthesis of Calcium Silicate Hydrates with Incorporated Cr3+ Ions

The data of X-ray diffraction analysis showed that, during the hydrothermal treatment in the CaO-SiO2-Cr(NO3)3-H2O mixture at 175 °C, semicrystalline calcium silicate hydrates C-S-H(I) and/or C-S-H(II) (d-spacing—0.303; 0.280; 0.184; 0.167 nm) were formed in the products (Figure 1a) [38,39]. In addition, due to the carbonization when the products were dried in the air-conditioned chamber, traces of calcite (PDF No. 04-012-0489) were detected in the XRD pattern [40]. It is worth mentioning that chromium ions do not affect the mineral composition of the synthesis products because, under the same conditions of synthesis in the pure system (CaO-SiO2-H2O), only C-S-H(I), C-S-H(II), and calcite were formed [30].
The results of atomic absorption spectroscopy showed that, after synthesis, the concentration of Cr3+ ions in the liquid medium decreased by more than 99.99%, i.e., from 10,000 mg/dm3 (before synthesis) to 0.041 mg/dm3 (after synthesis) (Supplementary Materials, Table S1). Meanwhile, the results of FIA analysis showed that more than 80% (from the primary amount of 17,308 mg/dm3) of the NO3 anions are present in the liquid medium (Supplementary Materials, Table S2). It should be noted that the XRD results did not show the formation of crystalline compounds containing Cr3+ or NO3 ions. Thus, it can be stated that all Cr3+ ions intercalated into the structure of calcium silicate hydrates or formed amorphous compounds, while NO3 anions only partially (−20%) participated in the process. These data are in good agreement with the results obtained in previous works [30,41], which determined that synthetic calcium silicate hydrates act as a chemo-sorbent, and their adsorption capacity is equal to 100 mg Cr3+/1 g CSH.
In the SEM micrograph of the synthesis products (Figure 1b), only thin close-packed particles (called foils or honeycomb) characteristic to C-S-H(I) and C-S-H(II) were observed [38,42]. In addition, the existence of the above-mentioned compounds was confirmed by DSC data: The endothermic effect at 116 °C can be assigned to the removal of adsorption/crystallization water in semicrystalline calcium silicate hydrates, while the exothermic effect at 836 °C and the shoulder at 866 °C are characteristic of the recrystallization process of C-S-H(I) and C-S-H(II), respectively (Figure 1c, curve 2). Furthermore, the endothermic effects at 288 °C and 595 °C can be assigned to the dehydration or decomposition of compounds containing Cr3+ and/or NO3 ions, as well as to the formation of double metal oxides (Figure 1c, curve 2) [43]. The small thermal effect at 675 °C corresponds to the decomposition of calcium carbonate. The data of TGA showed that less than 0.5% of the above-mentioned compound is present in the products (Figure 1c, curve 1).
The identification of the absorption bands in the FT-IR spectrum of the synthesis products is complicated (Figure 1d). The adsorption band, which is present within the 400–700 cm−1 frequency range, is typical to semicrystalline C-S-H (δ(Si–O–Si) and δ(O–Si–O)) [44] and/or to ν(Cr–O) vibrations [45]. In a higher frequency interval (800–1000 cm−1), the absorption bands can be assigned to symmetrical νs(O-SiO-) vibrations in the C-S-H structure [46]. Furthermore, the adsorption maximums at –1428 and –875 cm−1 correspond to ν(CO32−) and δ(C–O32−) or NO3 group vibrations, respectively [47]. Meanwhile, the adsorption band at 1644 cm−1 can be assigned to the vibration of the OH bonds in both C-S-H and compounds containing the Cr3+ ions structure. Finally, the broad band within the 2500–4000 cm−1 range reflected the H-O-H bending vibration of water. It is worth mentioning that the adsorption bands associated with the NO3 group occur in the same frequency interval as ν(CO32−) and OH vibrations.

3.2. Thermal Stability of Synthesis Products

In order to determine the formation of the potentially catalytic active compounds, the synthesis products were calcined in a high-temperature camera MTC-hightemp within the 25–1000 °C temperature range (Figure 2). Calcination was carried out at a heating rate of 50 °C/min after equilibration for 5 min at the desired temperature. The results of in-situ XRD patterns showed that the synthesis products are stable within the 25–550 °C temperature range (Figure 2). It should be noted that the DSC curve showed two endothermic effects at 115 °C and 288 °C temperatures (Figure 1c). The difference between the presently mentioned results may have been observed due to the dehydration and/or decomposition of the amorphous phase, which cannot be identified in XRD patterns. By increasing the calcination temperature (>550 °C), the formation of calcium chromate CaCrO4 (PDF 00-008-0458) proceeded (Figure 2). According to the literature, this compound can be used for scintillation, Raman scattering behavior, or as a catalyst, dielectric material, paint pigment, and lubricant, and for wastewater treatment [48,49,50,51]. It was determined that calcium chromate remained stable until 1000 °C (Figure 2). These data are in good agreement with DSC results (Figure 1c). In addition, when the calcination temperature was increased to 800–850 °C, the formation of calcium silicate—wollastonite (PDF 00-066-0271, Supplementary Materials, Figure S1)—was observed (Figure 2).
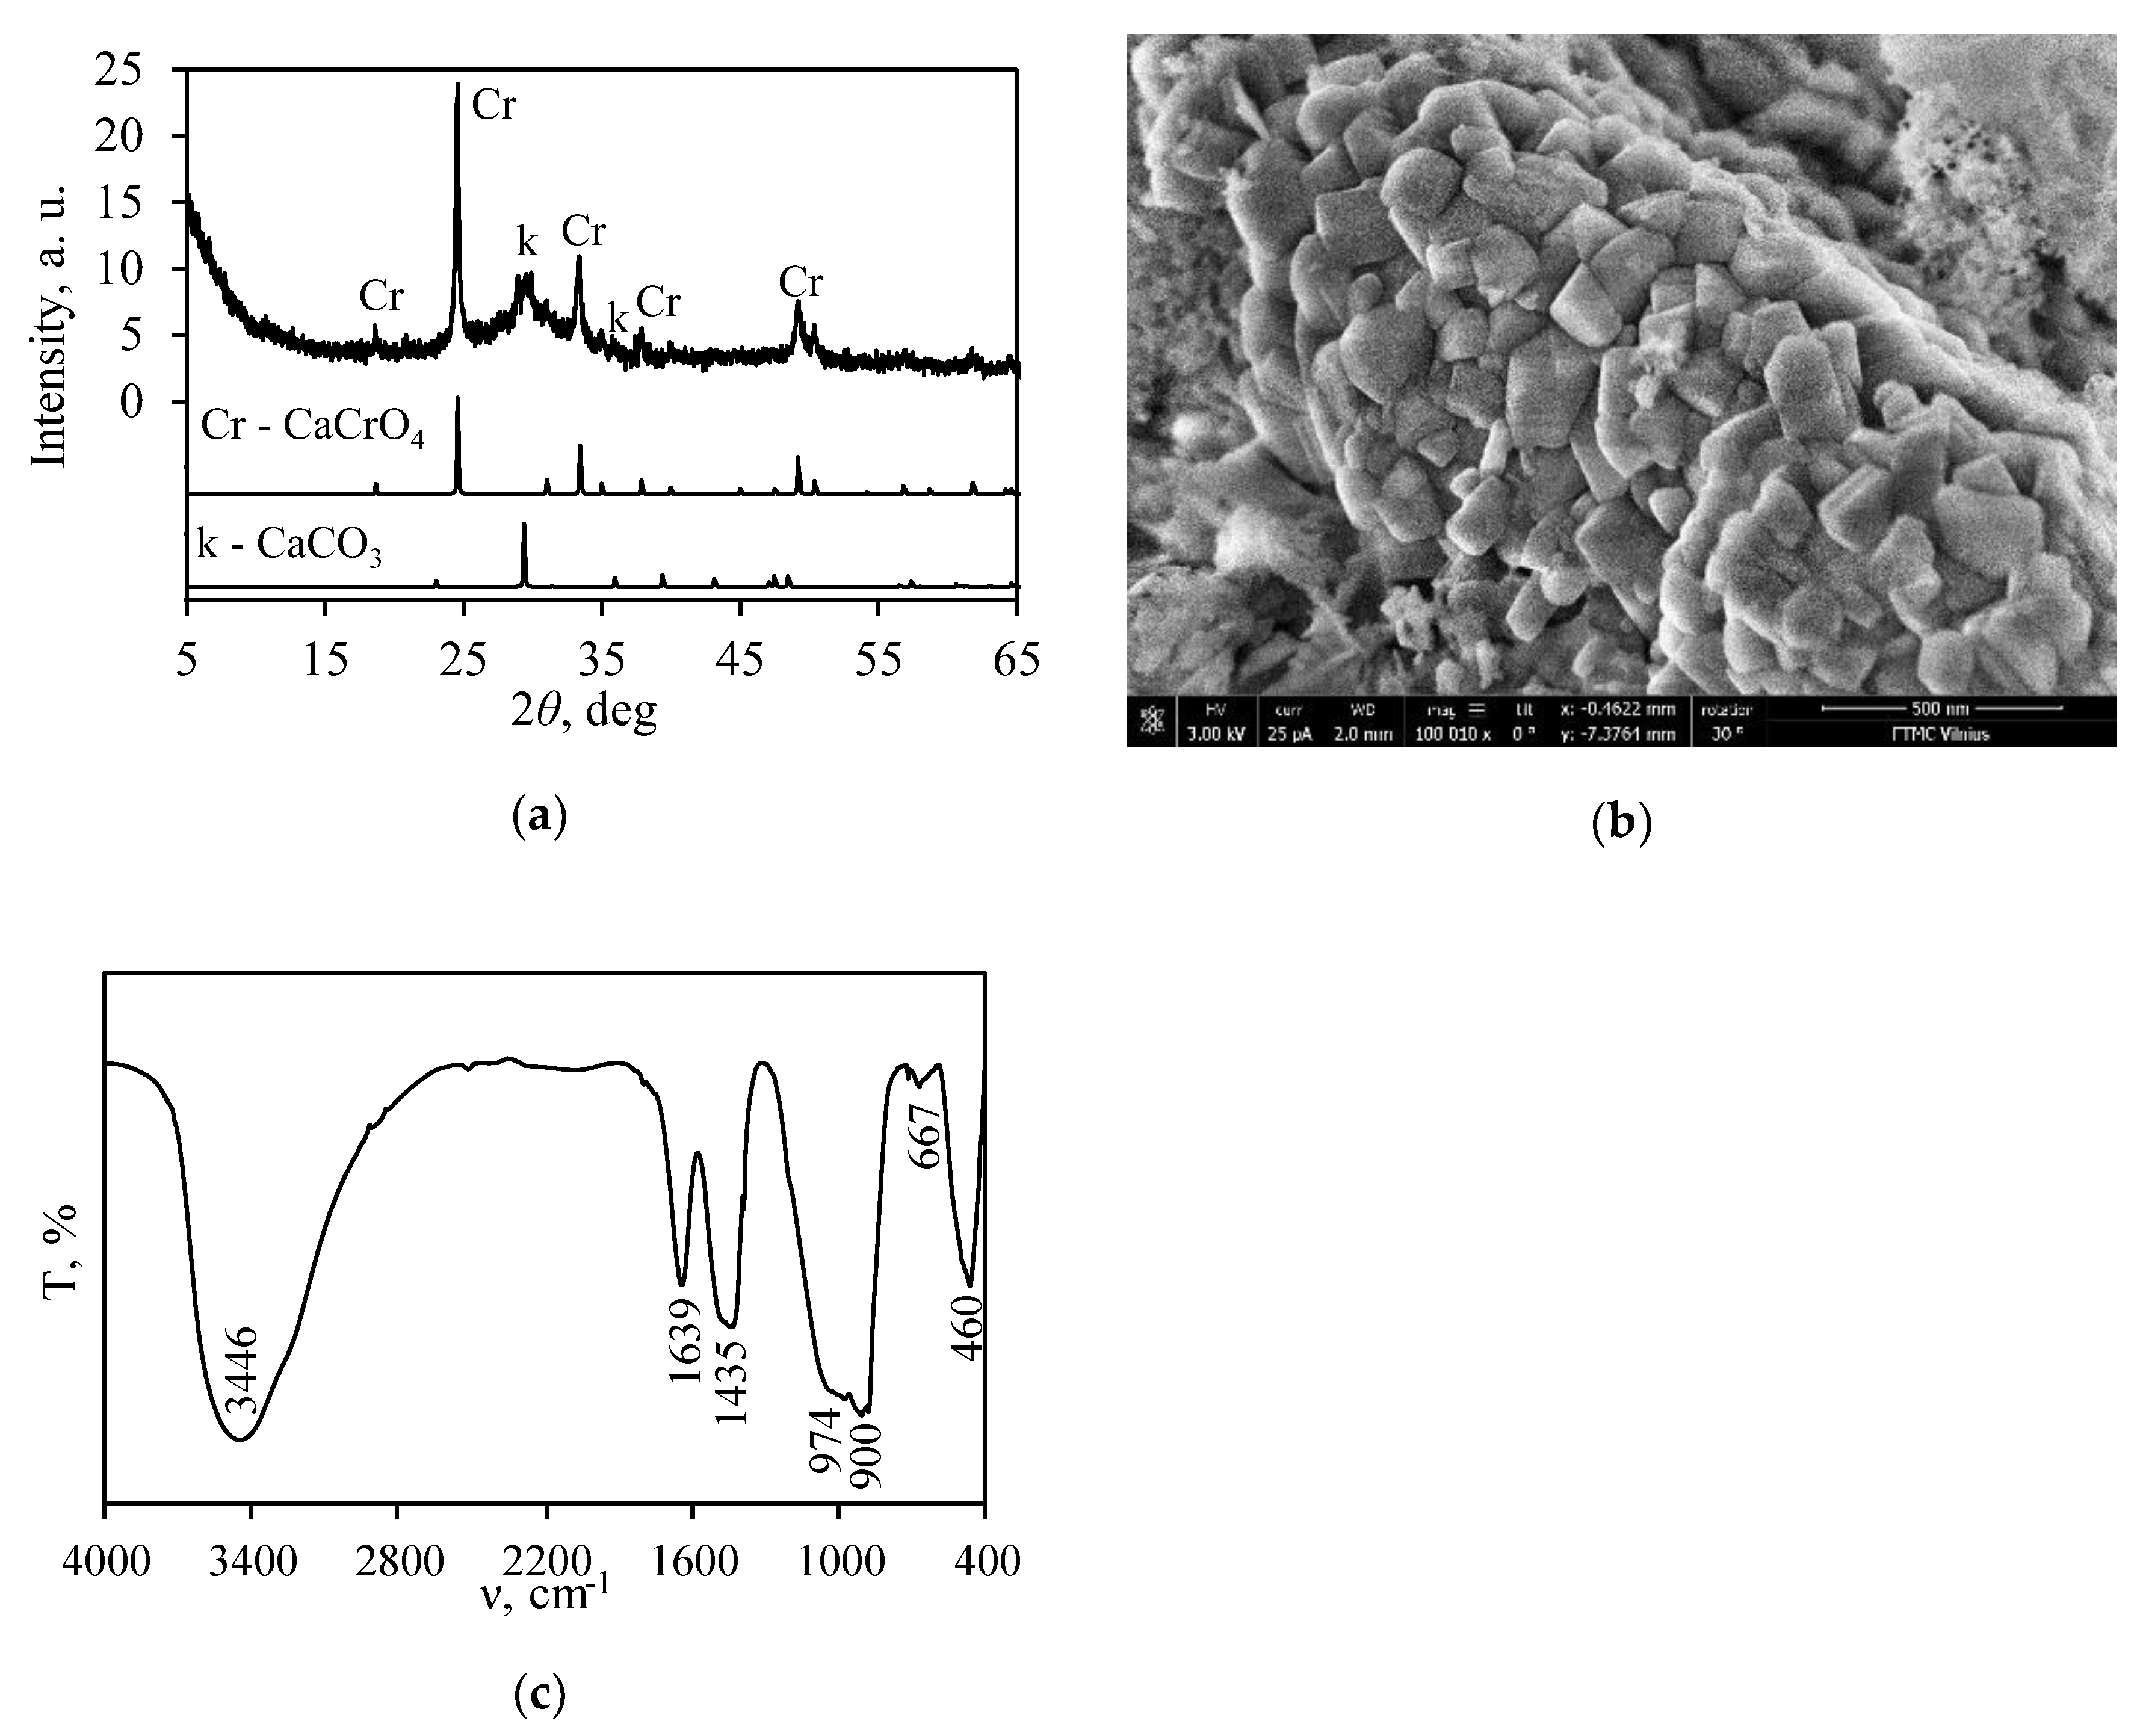
In order to obtain a calcined sample with calcium chromate and a high surface area, a synthetic sample was calcined in the furnace Nabertherm LH 15/13 at 550 °C for 24 h. The calcination temperature was reached within 48 h. It was determined that, after calcination, only one crystalline compound—calcium chromate—was formed (Figure 3a). In addition, a broad basal reflection within the 25–37° 2θ range can be assigned to partially dehydrated semicrystalline calcium silicate hydrates. It is worth mentioning that, under these conditions of calcination, the traces of calcite remained stable.
The results of SEM analysis are in good agreement with the data of XRD (Figure 3a) because small crystals typical of CaCrO4 were observed (Figure 3b). In addition, in the FT-IR spectrum, the intensive adsorption band at 900 cm–1 can be attributed to the vibrations of Cr+6–O bonds in CaCrO4 [45] (Figure 3c). It should also be observed that, under these conditions of calcination, the dehydration of the semicrystalline-type compounds proceeded partially because intensive bands characteristic of OH group vibrations in the FT-IR spectrum are visible (Figure 3c). These results are in good agreement with TGA results because the mass changes of the synthetic product in the 550–900 °C temperature range are equal to 4.14% (Figure 1c). In addition, similar results were presented in the literature [52].

3.3. Porosity of Synthetic and Calcined Products

It is known that one of the most important parameters of all catalysts and adsorbents is a high surface area, which leads to successful application [38,53,54]. Thus, in order to determine the specific surface area, nitrogen gas adsorption in combination with the Brunauer, Emmett, and Teller (BET) equation was performed. Meanwhile, the shape of meso- and macro-pores and their distribution were calculated by using the corrected Kelvin equation and the scheme as developed by Orr et al.
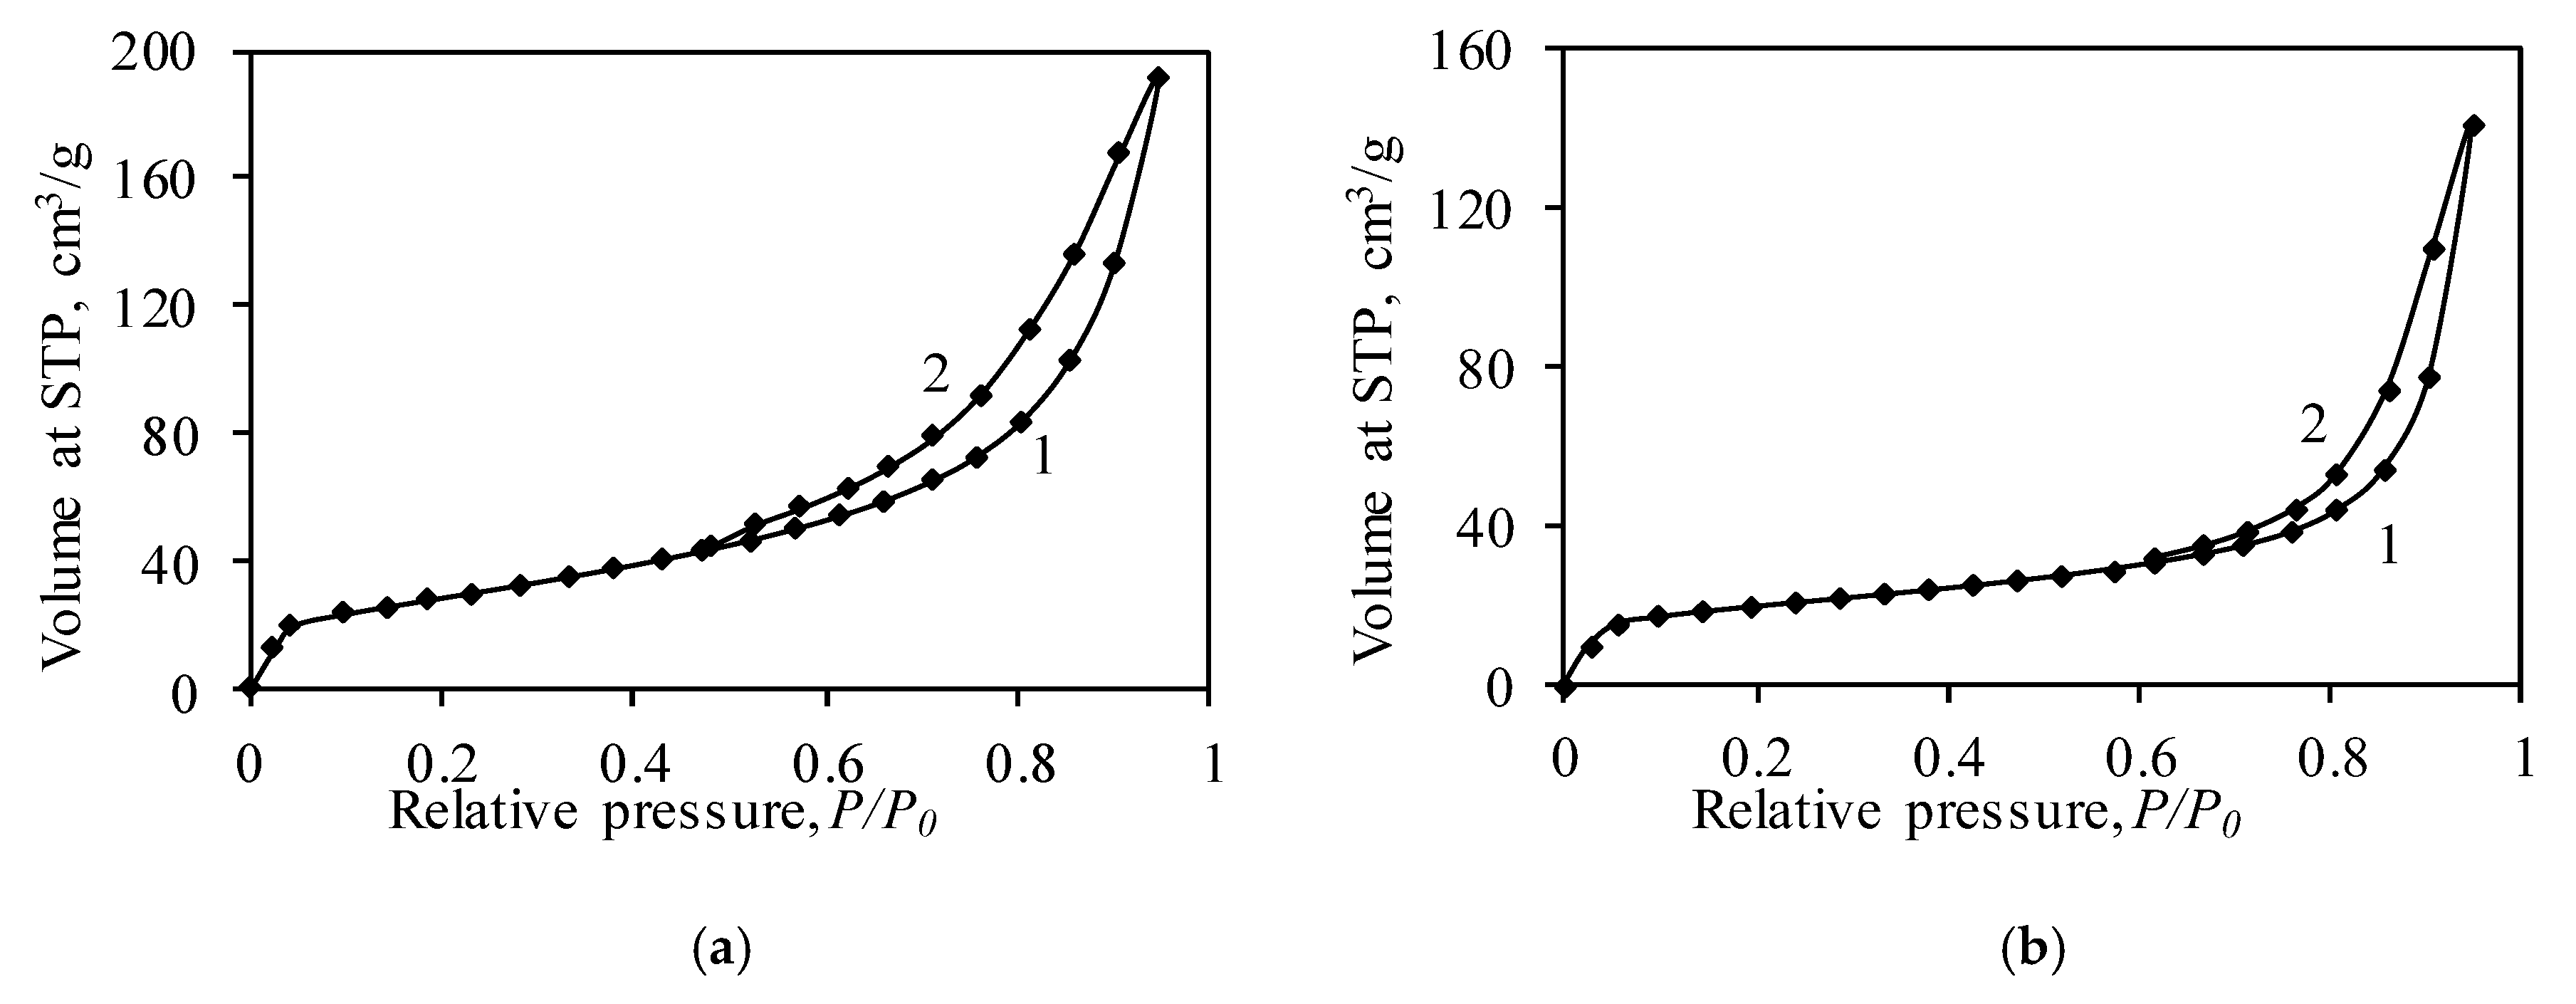
The nitrogen adsorption–desorption isotherms of the samples are presented in Figure 4. According to the IUPAC classification [55], the adsorption isotherms of both samples can be classified as Type IV whose characteristic feature is a hysteresis loop. According to the literature, this type of isotherm should feature a plateau at high P/P0 values (>0.7), which indicates complete pore filling. In the case of synthetic and calcined samples, the plateau was not present in the adsorption/desorption isotherms (Figure 4). This phenomenon can be explained by unrestricted multilayer adsorption on the surfaces of samples. Similar adsorption–desorption isotherms were obtained by Naderi [56], and Babaee and Castel [57]. According to Rouquerol [58] and Sun [59], the Type IV isotherm is characteristic of mesoporous materials (the pore diameter varies within the 2–50 nm range), where the formation of a monolayer and a multilayer does not overlap; thus, the BET equation can be used for the characterization of materials.
Further analysis of the isotherms showed that the hysteresis loop of the synthetic product corresponds to Type H1 and/or Type H3 (Figure 4a). The H1 hysteresis loop is characteristic of mesoporous materials consisting of spherical particles or possessing well-defined cylindrical-like pore channels [55,60]. Usually, materials with a H1 hysteresis loop have connected similarly sized pores. Meanwhile, the H3 hysteresis loop is detected in materials consisting of plate-like particles and slit-like pores. This type of hysteresis loop does not have limiting adsorption at high P/P0 and closes in the range of P/P0 0.4–0.45. Thus, it possible that, in the synthetic product, both cylindrical-like and slit-like pores were formed (Figure 4). These data are in good agreement with the SEM results (Figure 1b) and the literature data. According to Liu et al. [31] and Zhang [61], during the hydrothermal synthesis of calcium silicates hydrates, cylindrical-like, slit-like, or ink-bottle pores may be present in the products.
It was determined that, during calcination, the shape of the dominant pores changed from a mixture of cylindrical-like and slit-like pores to well-defined cylindrical-like pores (Figure 4). The changes may have occurred due to solid sintering reactions and the formation of new compounds (with a different crystal lattice) during calcination (Figure 2). According to the literature, the changes in the pore shape have an influence on the surface area, the pore size distribution, and the physical-chemical properties of the catalyst, adsorbents, and membranes. Feinberg et al. [60] determined that membranes with slit-like pores have a higher selectivity than membranes with cylindrical-like pores. In addition, the accessibility of the active sites of the catalyst, as well as the surfaces of adsorbents, depends on the structure of the pores, their diameter, and the pore network.
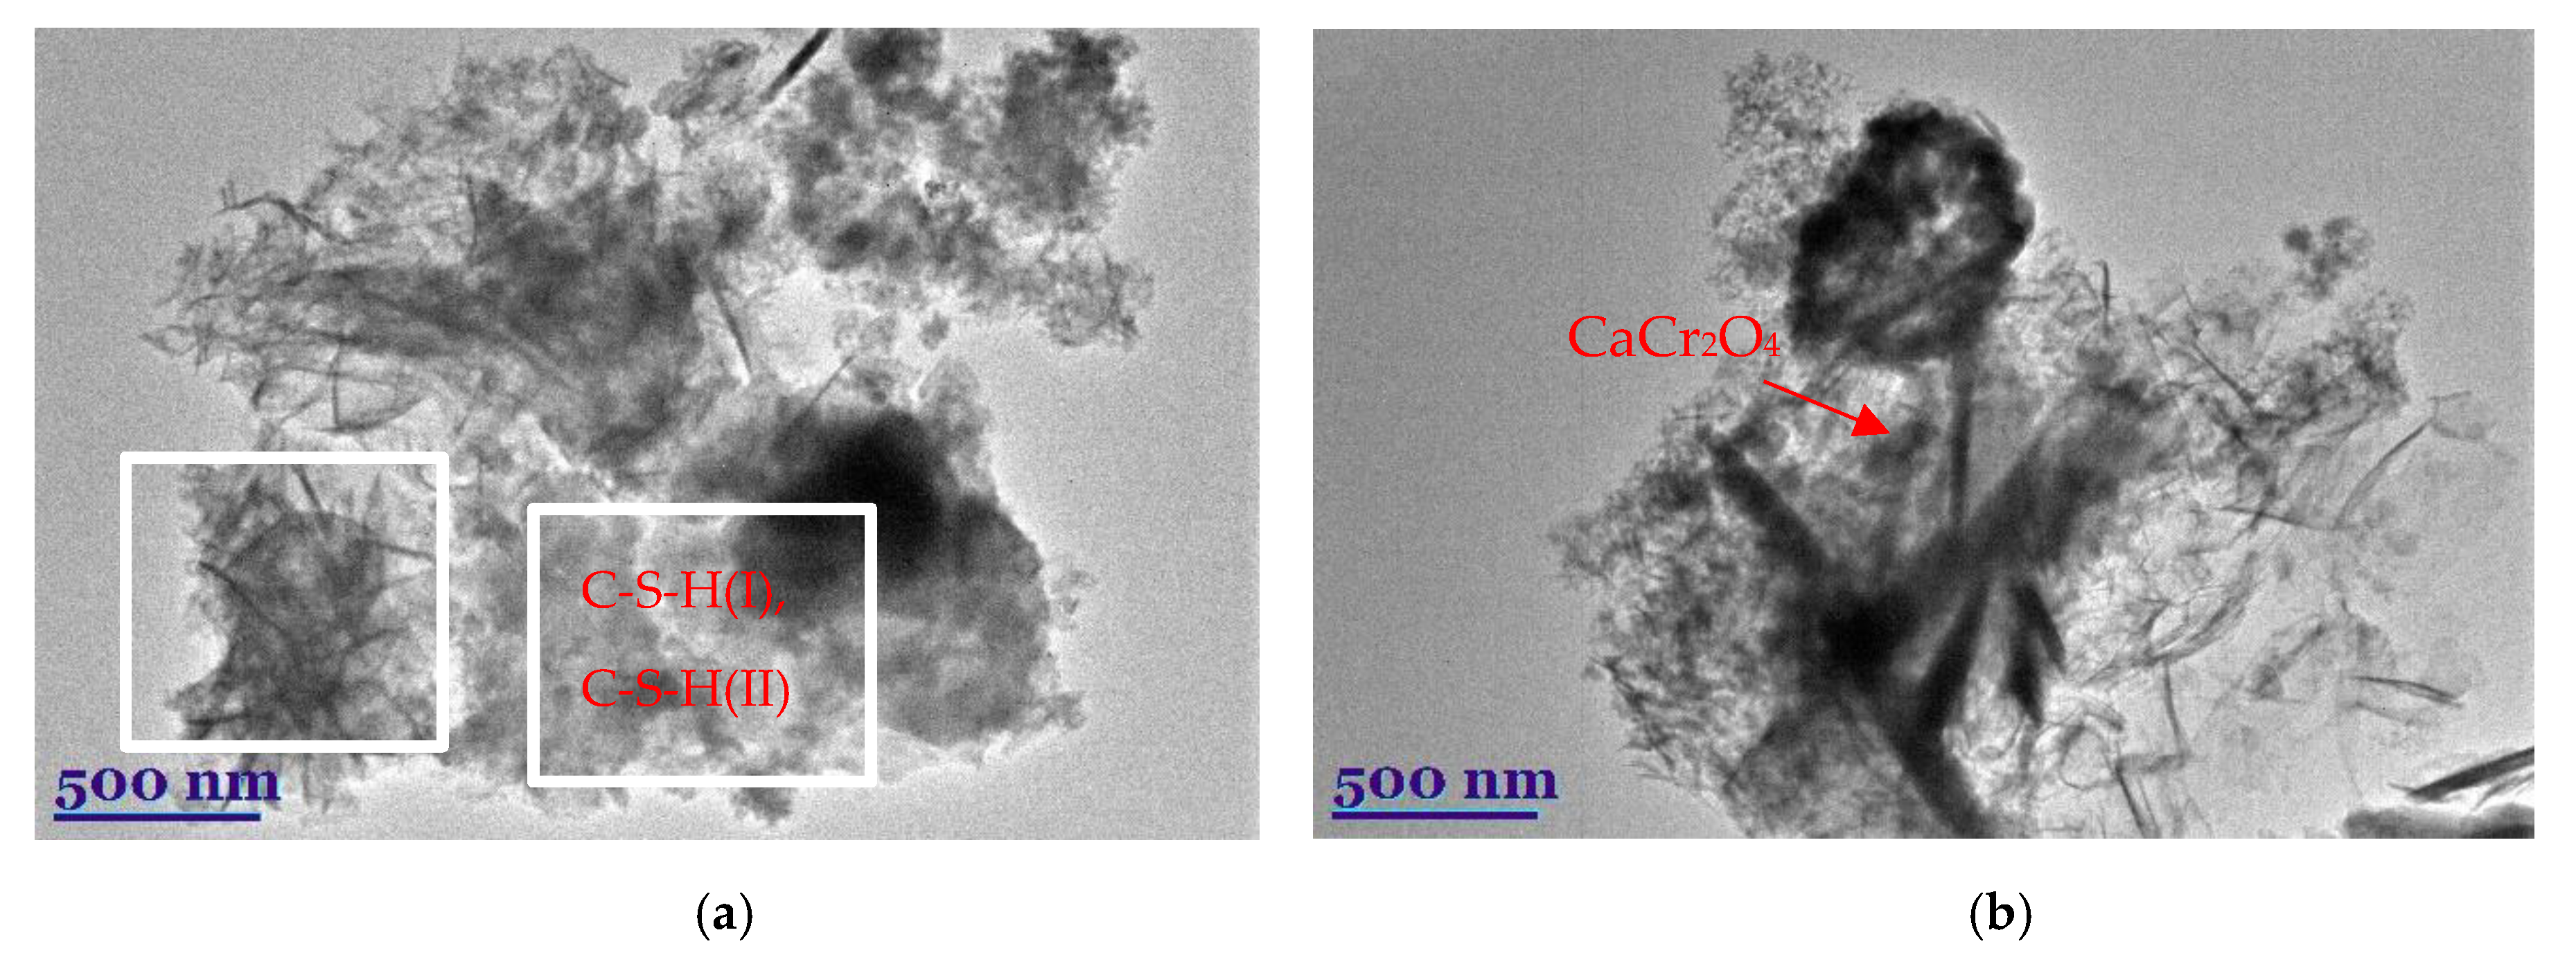
The presently discussed results were confirmed by TEM data (Figure 5). The TEM micrograph of the synthetic C-S-H sample with chrome ions showed an amorphous mass and needle-like crystallites (Figure 5a). Presumably, cylindrical-like pores form in amorphous mass, while slit-like pores form between needle-like crystallites. Meanwhile, in a calcined sample, compounds of the amorphous structure (partially dehydrated C-S-H(I) and C-S-H(II)) and plate-like crystallite of CaCr2O4 [62] were identified (Figure 5b).
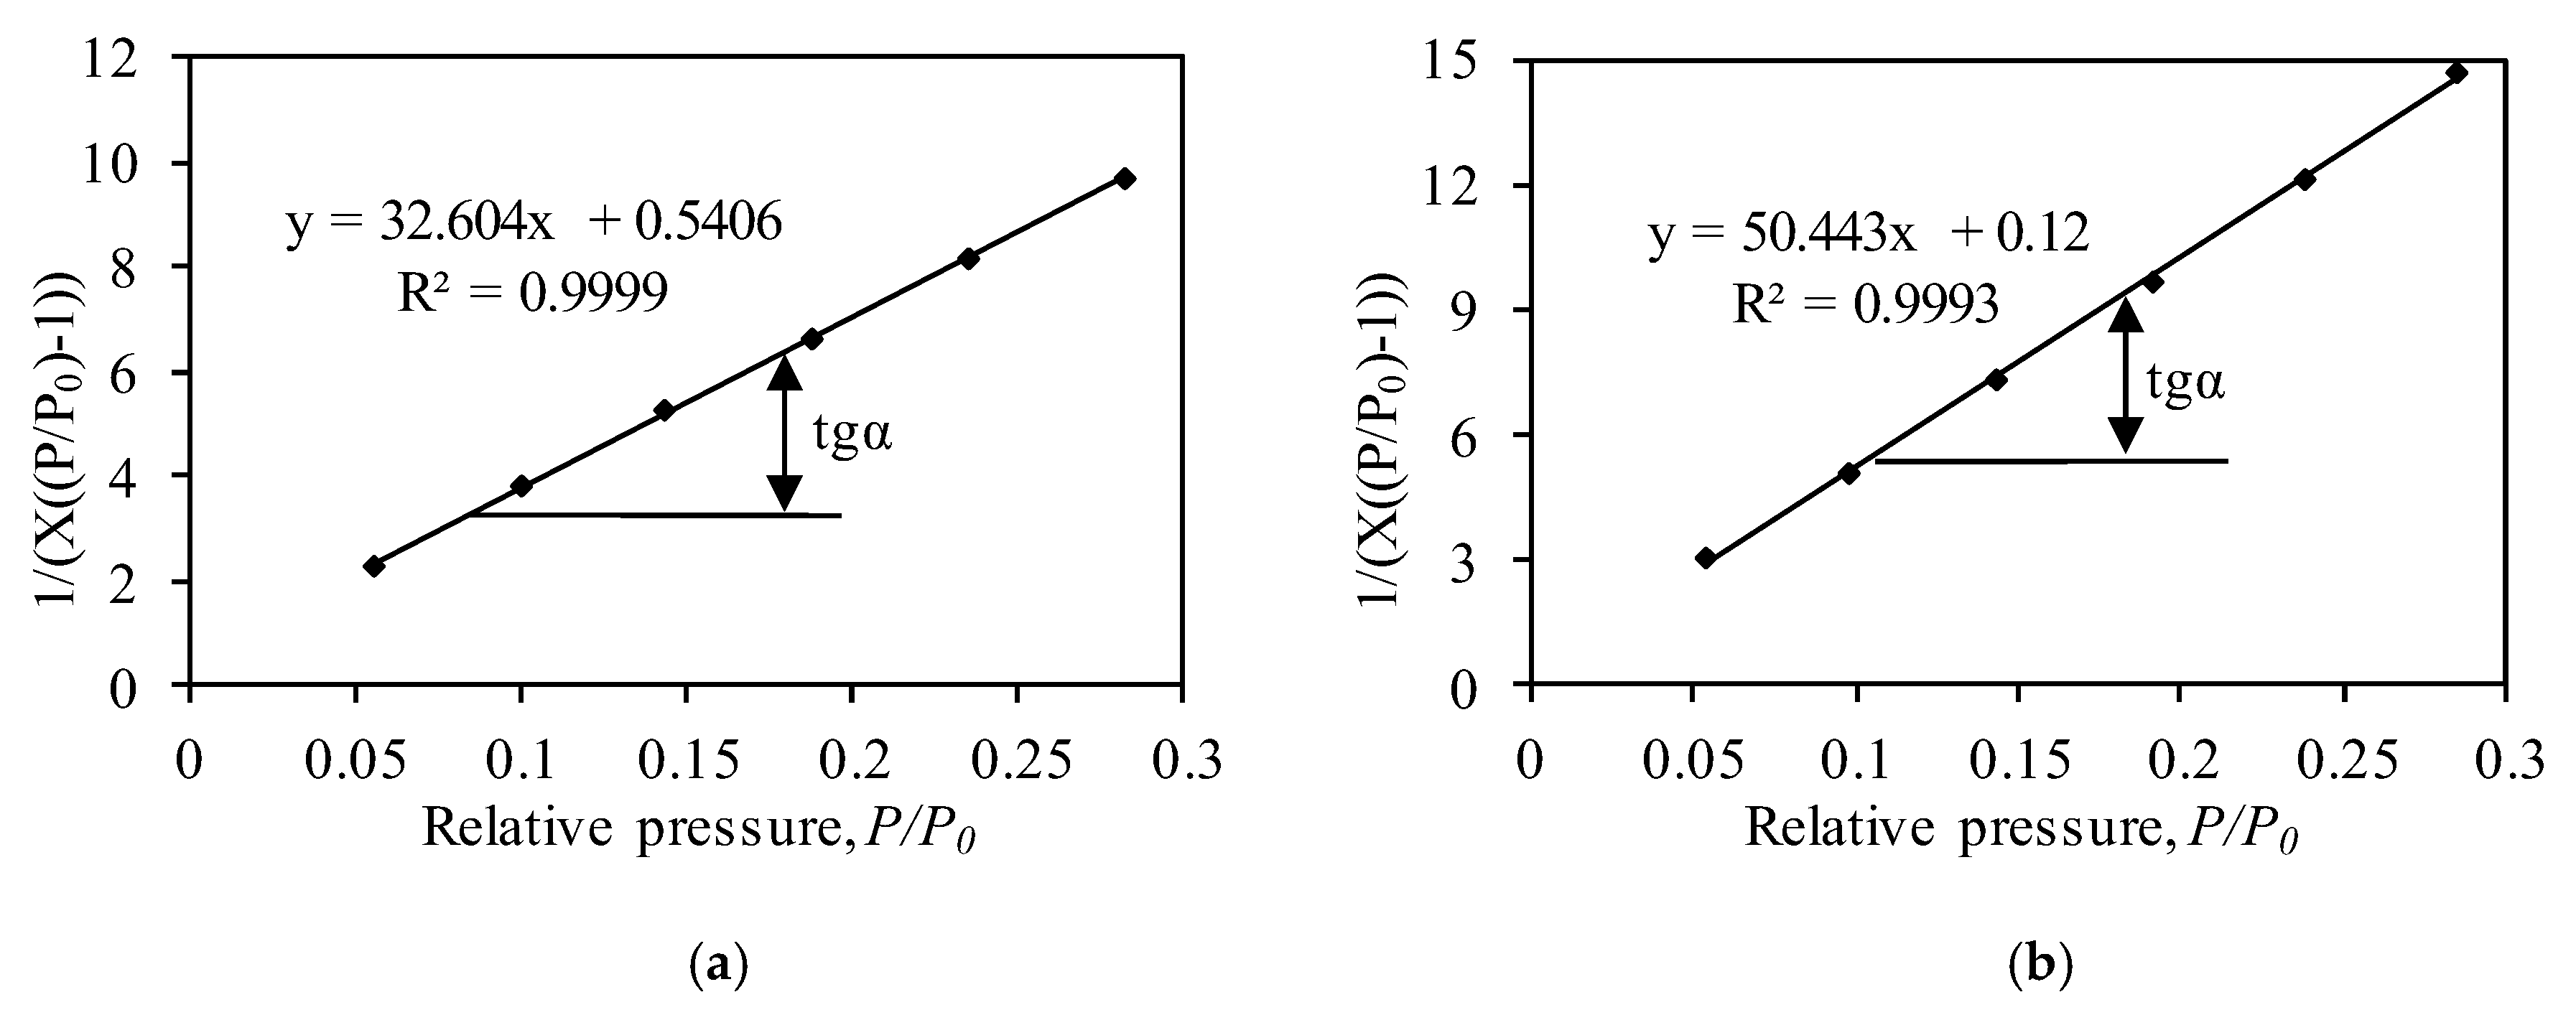
The BET method was used for the calculation of the surface area of the samples (Figure 6, Table 1), which affects such properties of materials as their dissolution rate, adsorption capacity, etc. [63,64]. According to the literature [56,58], the BET method is valid if a straight line in the BET coordination (1/[X((P0/P) − 1)]) − (P/P0) is obtained (Figure 6), and the value of the CBET constant is higher than 2 (in the ideal case, it is between 50 and 300). Calculations revealed that the values of the CBET constant of synthetic and calcined samples are equal to 61.31 and 421.30, respectively. The higher value of the CBET constant of the calcined sample can be explained by nitrogen adsorption on high-energy surface sites (probably CaCr2O4 crystals) or the filling of micropores [55,65]. It was calculated that the synthetic sample has a relatively large surface area of 105.14 m2/g (Table 1). It is worth noting that the SBET value of synthetic calcium silicates hydrates usually varies within the 30–500 m2/g range [66,67]. It was determined that, during calcination, at 550 °C, the value of the surface area decreased to 68.92 m2/g (Table 1). The decreases in the surface area can be related to the changes in the pore shape from cylindrical-like and slit-like pores (after synthesis) to well-defined cylindrical-like pores (after calcination) (Figure 4). Although the value of the surface area decreased, it is still 2–20 times higher compared to other calcium silicates: Wollastonite−2 m2/g, kilchoanite−6 m2/g, rankinite−11.7 m2/g, and others [38,68,69]. Meanwhile, the surface area of the catalyst depends on the starting raw materials, as well as on the synthesis conditions, and it can vary within the 13–1000 m2/g range [70].
The aforementioned analysis of adsorption isotherms and the visual inspection of the shape of the pores (TEM, SEM) are fairly complicated; thus, in order to confirm the obtained results and to calculate the dominating pore size, the cumulative pore volume, the corrected Kelvin equation, and the scheme developed by Orr et al. were applied. The calculations were done by using models of cylindrical-like and slit-like pores formed between parallel plates. The employed model is valid as long as the difference between SBET and ∑A is not significant, i.e., it does not exceed 10%. The calculations of the dominant pore shape in the structure of synthetic samples showed a fairly significant difference between the SBET and ∑A values (Table 2). These results confirm the hysteresis loop classification as an intermediate case between H1 and H3 (Figure 4a). In addition, it can be stated that both cylindrical-like and slit-like pores were formed in the structure of the synthetic sample. Further calculations showed that, during calcination, the shape of the pores changed to a well-defined cylindrical one because the difference between the SBET and ∑A values was equal to only 2.87% (Table 2).
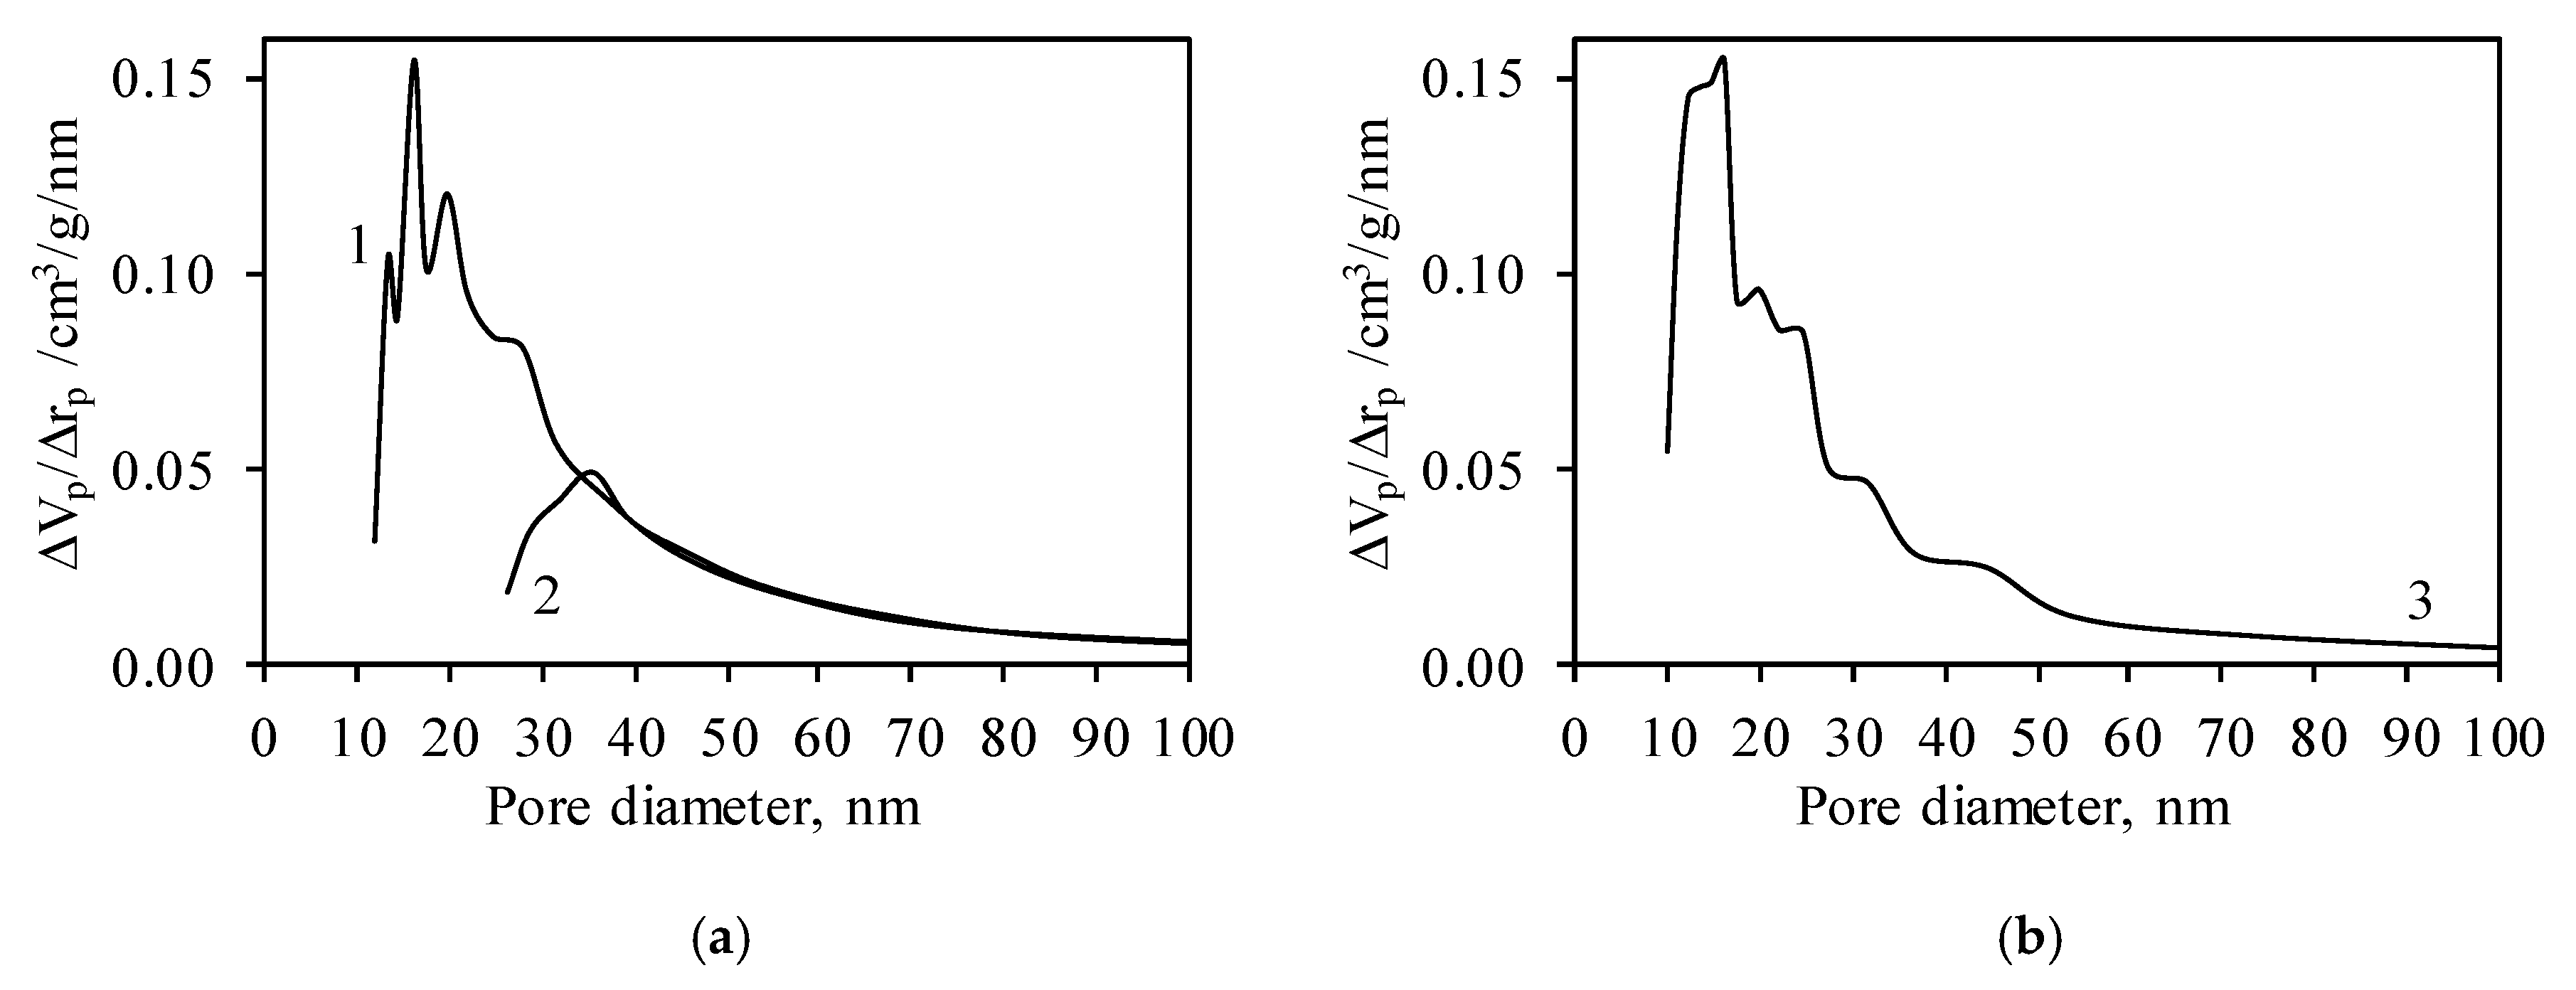
It was calculated that the value of the cumulative pore volume of the synthetic sample depends on the employed model and is equal to 0.278 and 0.320 cm3/g (Table 2). Differential distributions of the pore sizes showed that the synthetic sample is a mesoporous material because the pores with the 10–60 nm diameter are dominant (Figure 7a). It is worth mentioning that the employed model has a significant influence on the distributions of the pore sizes (Figure 7a). Unfortunately, both types of pores were present in the structure of the synthetic samples, and, as a result, the right distribution is arguable.
It was determined that, during calcination, the cumulative pore volume of the sample decreased to 0.230 cm3/g (Table 2). The obtained value is sufficient for the preparation of adsorbents or catalysts because the cumulative pore volume of zeolites and aluminum oxide varies within the 0.2–0.4 cm3/g range [70,71]. Meanwhile, the results of differential distributions of the pore sizes showed that the calcined sample is a mesoporous material with dominant 10–30 nm pores (Figure 7b). In addition, in the structure of the calcined sample, pores of a higher diameter (30–60 nm) are present.

3.4. Catalyst Activity in Oxidation Reactions

The catalytic activity of synthesized and calcined samples was measured during complete oxidation of propanol in an air stream. The main product of complete oxidation is carbon dioxide; thus, the main parameter for catalyst performance is the decrease in the concentration of the volatile organic compound in relation to CO2 accumulation. As the initial concentration of propanol slightly varied, all the measured concentration values were normalized and are presented as one gram of catalyst per one gram of propanol in the ingoing stream. The decrease in the propanol concentration is presented as conversion to percentage units, whereas the selectivity of the catalysts was evaluated by the amounts of intermediates found in the outgoing flow. Experiments were performed within the temperature range of 150–300 °C with the step of the temperature increasing by around 25 °C per hour.
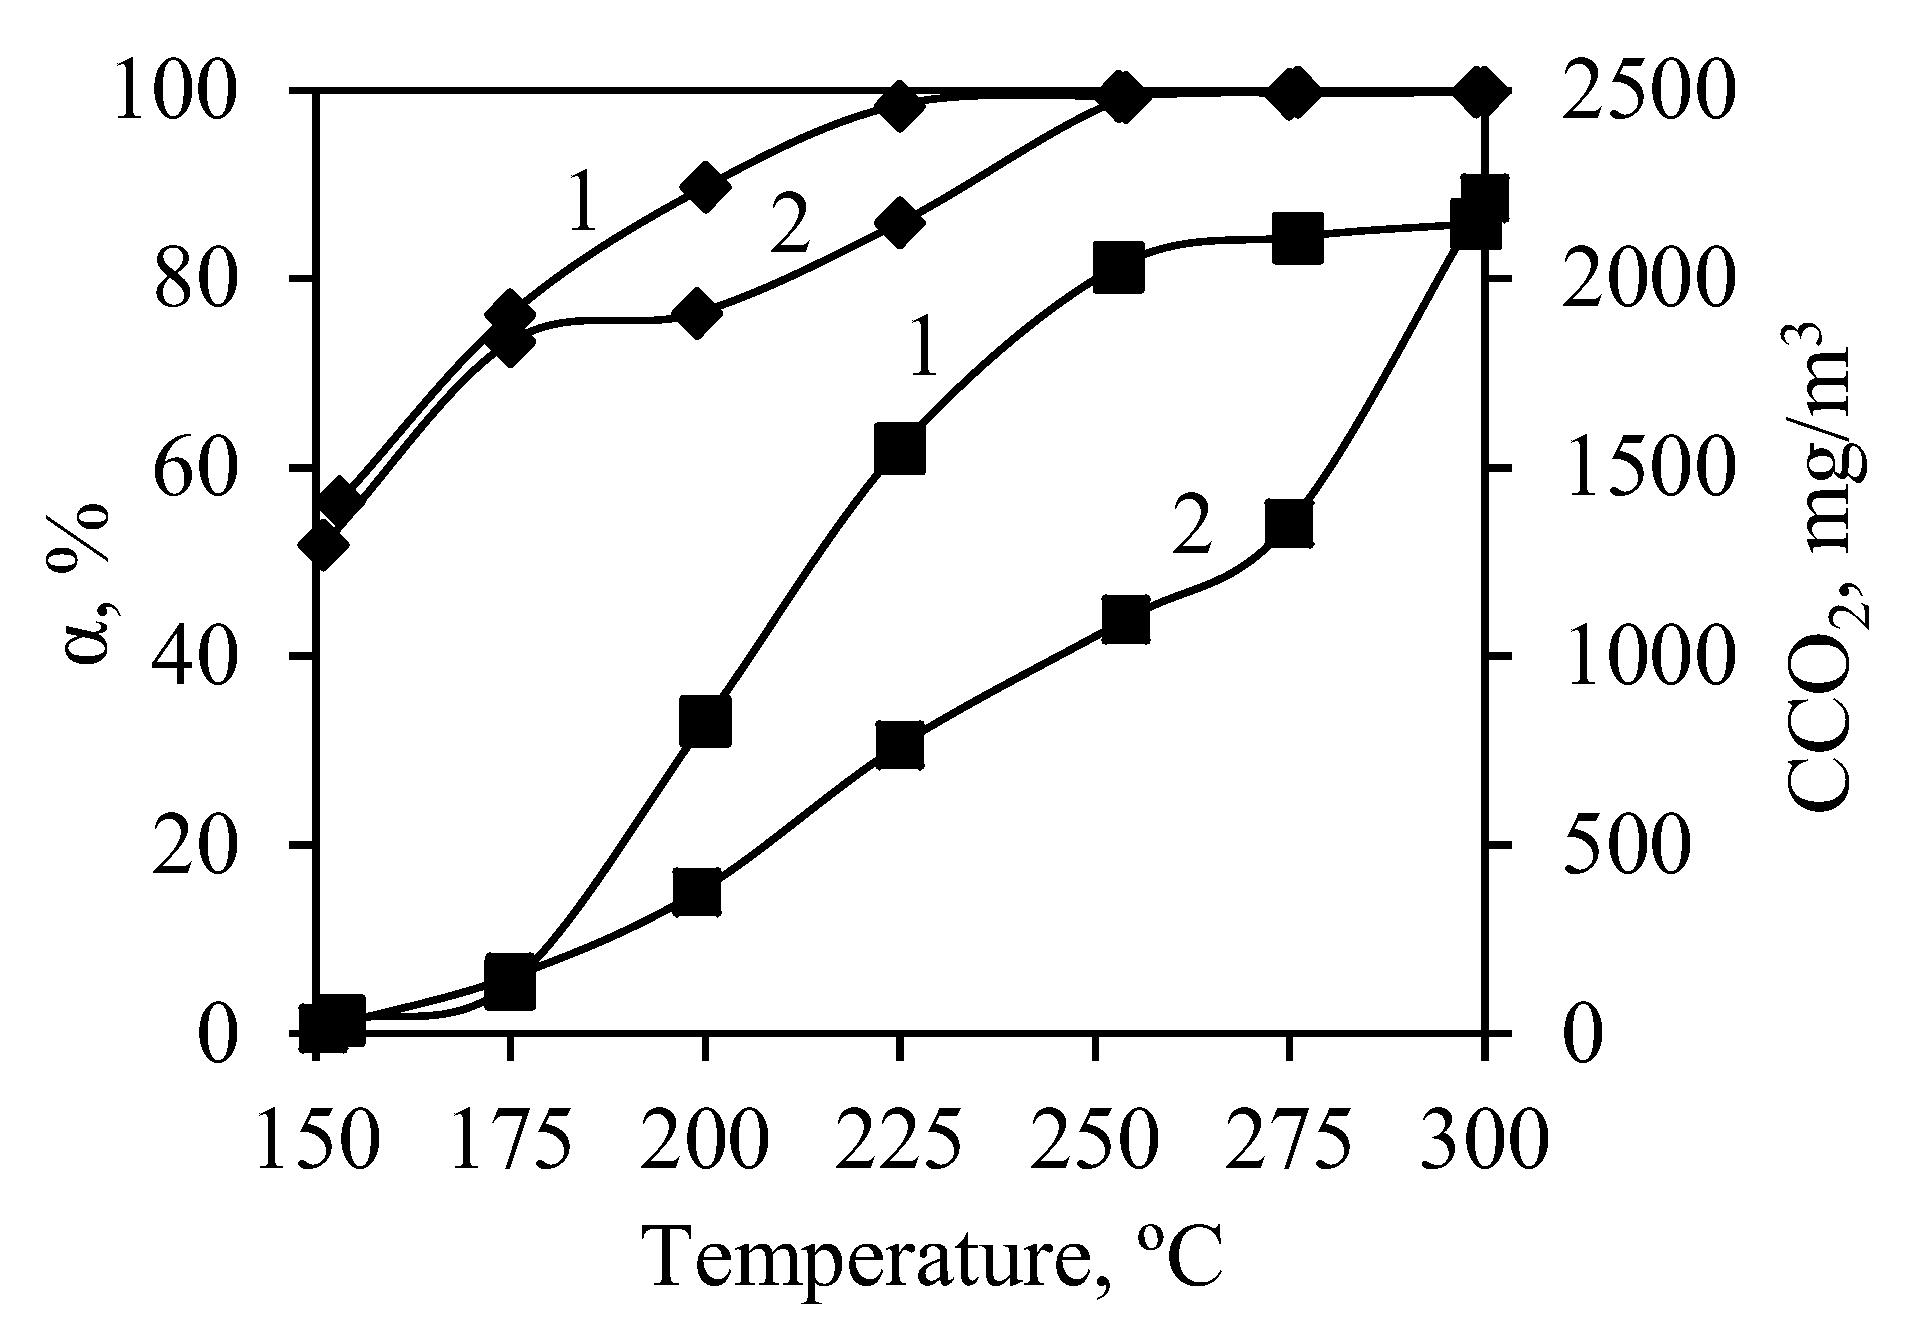
It was determined that, at the beginning of the experiments (150 °C), by using synthetic and calcined samples, the concentration of propanol in the outgoing stream decreased to 56.5% and to 51.8%, respectively (Figure 8). However, further analysis showed the absence of CO2 in the outgoing stream, which indicates that propanol was adsorbed by samples but was not oxidized. The higher adsorption of propanol by the synthetic sample can be explained by its higher surface area (105.14 m2/g) than that of the calcined sample (68.92 m2/g) (Table 1).
Propanol oxidation starts at a temperature of 175 °C because the CO2 concentration increases in the outgoing stream. At this temperature, the differences between synthetic and calcined samples appear. The synthetic sample showed a higher catalytic activity than the calcined one because a sharper increase in CO2 concentration was observed (Figure 8). Conversion and CO2 accumulation curves coincide well, which indicates that, with the increase in temperature, the process switches from adsorption toward catalytic oxidation.
By comparing the aforementioned curves, it can be stated that the synthetic sample reached 95% conversion at around 240 °C, which is a good result comparable to bulk, supported, and mixed catalysts [53,54,72]. This indicates that semicrystalline calcium silicate hydrates with intercalated chromium ions are able to exchange oxygen during the heterogeneous oxidation process. It should be noted that chlorinated organics, as well as esters, are less destructible than alcohols. It was determined that the calcined sample struggled with catalytic oxidation as the formation of carbon dioxide was much slower—conversion of 95% was reached only at temperatures higher than 290 °C (Figure 8). It can be concluded that the formation of calcium chromate has a negative effect on propanol oxidation reactions; thus, the synthetic sample should be used at lower temperatures than 500 °C (in order to avoid the formation of calcium chromate). Similar results are presented in the literature, specifically that copper dichromate did not show high catalytic activity [72]. Evidently, both samples had high adsorptive affinity for propanol, as the influence of adsorption on the overall process was observed at temperatures as high as 275 °C. As the temperature was increased in the catalyst bed, sharp increases in CO2 concentration, as well as sudden spikes in temperature due to the exothermal effect of the oxidation reaction, were observed.
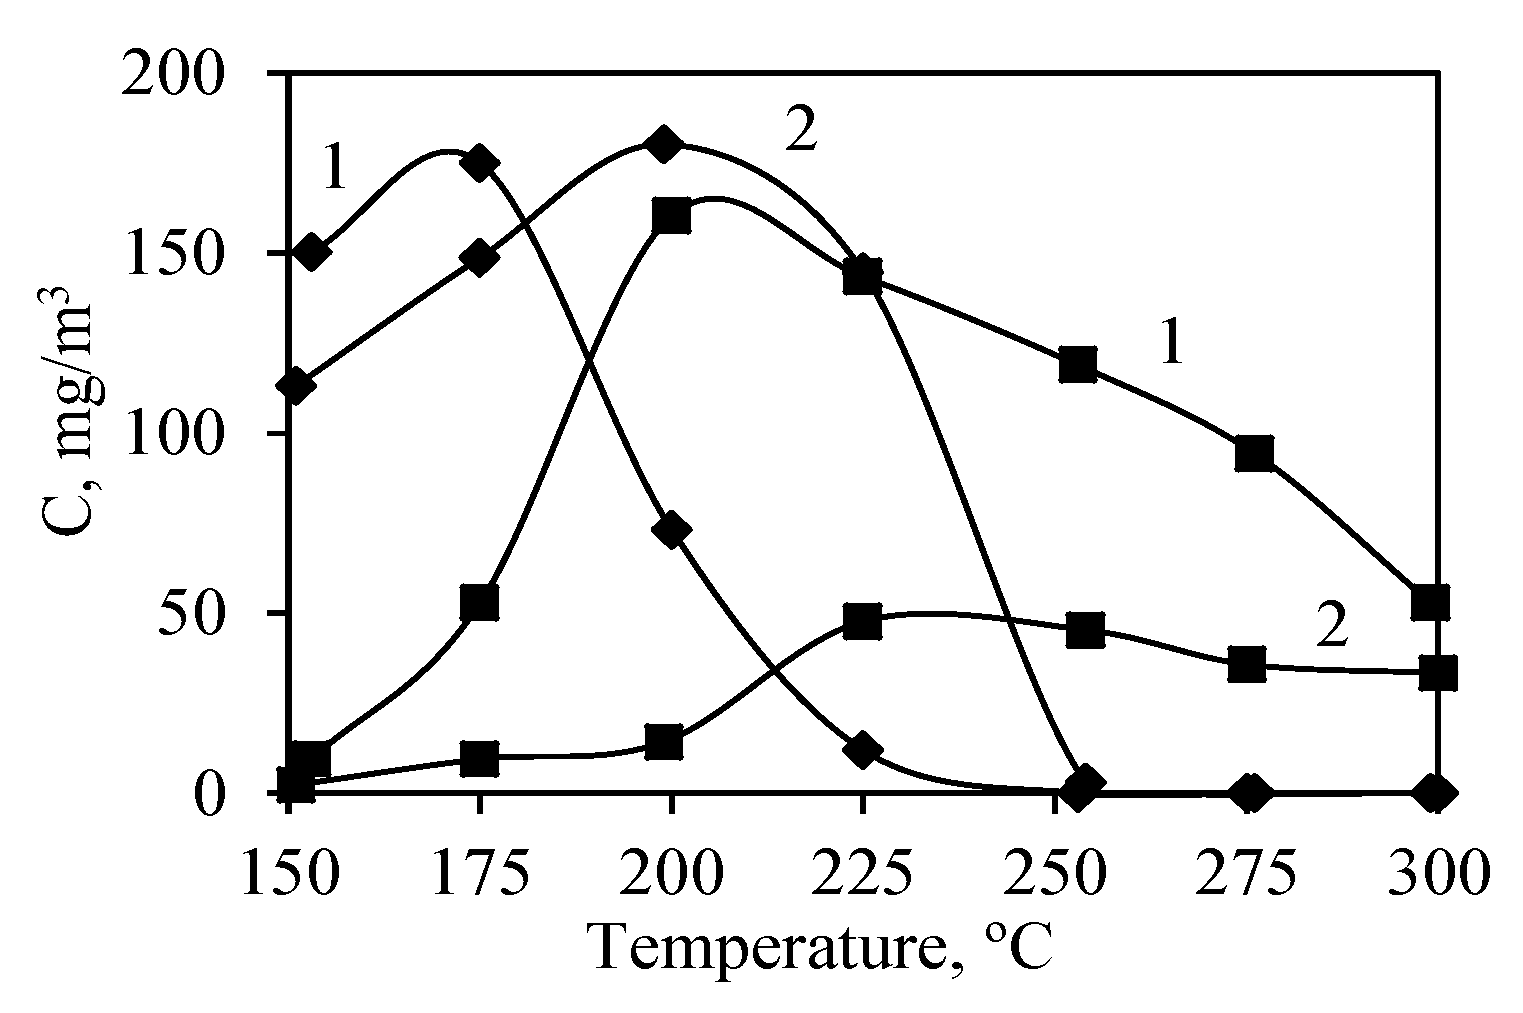
The CO probe and GC/MS monitoring of the outgoing gas stream showed the appearance of incomplete catalytic oxidation product intermediates. Usually, carbon monoxide forms at the beginning of catalytic oxidation reactions, and it is oxidized to CO2 faster by increasing the temperature. In this case, the formation of CO could also be used for the determination of catalytic activity. The initial formation of CO could be observed at lower temperatures only for the synthetic sample, where it reached the maximum value of 161 mg/m3 at 200 °C and started decreasing afterward (Figure 9). Meanwhile, the calcined sample reached the maximum concentration of CO (48 mg/m3) at a temperature higher by 25°, i.e., at 225 °C, and it was more than three times lower in comparison to the synthetic sample. CO formation curves (Figure 9) showed that the lower formation of carbon monoxide during oxidation on the calcined sample is caused by the lower overall activity, but not due to higher selectivity.
Both samples showed similar results for the formation of the second intermediate compound—propanal—where they yielded similar amounts of this aldehyde, –175 mg/m3 for the synthesized sample and 180 mg/m3 for the calcined sample (Figure 9). The formation of propanal takes place up until catalytic oxidation takes over adsorption, and the maximum values are reached at 175 °C for the synthesized sample and at 200 °C for the calcined sample. Although aldehydes are harder to oxidize than alcohols, because of the relatively smaller amount of propanal in the stream, its concentration still decreases fast as the temperature in the catalyst bed increases, and it can no longer be detected at 250 °C. Propanal forms as a result of the interaction between propanol and the surface of the catalyst, which means dehydrogenation of propanol takes place. Therefore, it is evident that the largest amount of propanal forms when the adsorption process is the strongest, and it is also attributed to the apparent decrease in the propanol concentration before the start of catalytic oxidation reactions.

4. Conclusions

It was determined that, after 16 h of hydrothermal treatment at 175 °C, semicrystalline calcium silicate hydrates C-S-H(I) and/or C-S-H(II) were formed in the products. The analysis of the liquid medium showed that all Cr3+ ions intercalated into the structure of the synthesis products or formed amorphous compounds, while NO3 anions only partially (~20%) participated in the process.
It was determined that, during calcination at 550 °C, the formation of calcium chromate (CaCrO4) proceeded, and it remained stable until 1000 °C. The formation of this compound was confirmed by SEM and FT-IR analysis: In SEM micrographs, crystals characteristic of CaCrO4 were observed, while, in the FT-IR spectrum, an intensive adsorption band at 900 cm–1 of Cr+6–O vibrations was identified.
It was determined that both synthetic and calcined (550 °C) samples are mesoporous materials whose specific surface area (SBET) is equal to 104.76 and 68.92 m2/g, respectively. It was determined that cylindrical-like and slit-like pores are present in the structure of the synthetic samples, while, during calcination at a temperature of 550 °C, the shape of the pores changed to well-defined cylindrical-like pores. These data were confirmed by SEM, as well as TEM results, and by calculations using the corrected Kelvin equation and the Orr et al.-developed scheme.
It was determined that at temperatures lower than 175 °C, synthetic and calcined samples act as adsorbents, while, at higher temperatures, catalytic oxidation proceeds. It was determined that the synthetic sample reached 95% conversion at around 240 °C, which is a good result, while the calcined sample reached this value only at temperatures higher than 290 °C. It can thus be concluded that the formation of calcium chromate has a negative effect on propanol oxidation reactions; therefore, the synthetic sample should be used at temperatures lower than 500 °C.

Supplementary Materials

The following are available online at https://www.mdpi.com/2079-4991/10/7/1299/s1, Figure S1: XRD pattern of wollastonite (PDF 00-066-0271), Table S1: Concentration of Cr3+ ions in the liquid medium, Table S2: Concentration of NO3 ions in the liquid medium.

Author Contributions

Investigation, D.N.; Methodology, D.N., A.E., and A.J.; Formal analysis, D.N., D.R., and A.J.; Validation, D.N. and T.D.; Visualization, D.N.; Software, A.E. and D.R.; Writing—original draft, D.N. and A.J.; Data curation, T.D.; Writing—review & editing, T.D. and K.B.; Conceptualization, K.B.; Supervision, K.B. All authors have read and agreed to the published version of the manuscript.

Funding

This research was funded by a grant (No. S-MIP–17–92) awarded by the Research Council of Lithuania.

Conflicts of Interest

The authors declare that there is no conflict of interest.

Data Availability

The data supporting the findings of this study are available by request from the corresponding author: Tadas Dambrauskas ([email protected]).

References

  1. Jacobson, M.Z.; Delucchi, M.A.; Bauer, Z.A.; Goodman, S.C.; Chapman, W.E.; Cameron, M.; Bozonnat, C.; Chobadi, L.; Clonts, H.A.; Enevoldsen, P.; et al. 100% Clean and Renewable Wind, Water, and Sunlight All-Sector Energy Roadmaps for 139 Countries of the World. Joule 2017, 1, 108–121. [Google Scholar] [CrossRef] [Green Version]
  2. Mellmann, D.; Sponholz, P.; Junge, H.; Beller, M. Formic acid as a hydrogen storage material—Development of homogeneous catalysts for selective hydrogen release. Chem. Soc. Rev. 2016, 45, 3954–3988. [Google Scholar] [CrossRef] [PubMed]
  3. Wang, H.; Nie, L.; Li, J.; Wang, Y.; Wang, G.; Wang, J.; Hao, Z. Characterization and assessment of volatile organic compounds (VOCs) emissions from typical industries. Chin. Sci. Bull. 2013, 58, 724–730. [Google Scholar] [CrossRef] [Green Version]
  4. Nematollahi, N.; Kolev, S.D.; Steinemann, A. Volatile chemical emissions from 134 common consumer products. Air Qual. Atmos. Health 2019, 12, 1259–1265. [Google Scholar] [CrossRef]
  5. Palmisani, J.; Nørgaard, A.W.; Kofoed-Sørensen, V.; Clausen, P.A.; De Gennaro, G.; Wolkoff, P. Formation of ozone-initiated VOCs and secondary organic aerosol following application of a carpet deodorizer. Atmos. Environ. 2020, 222. [Google Scholar] [CrossRef]
  6. Kamal, M.S.; Razzak, S.A.; Hossain, M.M. Catalytic oxidation of volatile organic compounds (VOCs). A review. Atmos. Environ. 2016, 140, 117–134. [Google Scholar] [CrossRef]
  7. Guiza, M.; Abdedayem, A.; Ghouma, I.; Ouederni, A. Effect of copper and nickel supported activated carbon catalysts on the simultaneous adsorption/ozonation process of nitrobenzene degradation. J. Chem. Technol. Metall. 2017, 52, 836–851. [Google Scholar]
  8. Stacy, J.; Regmi, Y.N.; Leonard, B.; Fan, M. The recent progress and future of oxygen reduction reaction catalysis: A review. Renew. Sustain. Energy Rev. 2017, 69, 401–414. [Google Scholar] [CrossRef] [Green Version]
  9. Lin, L.; Zhou, W.; Gao, R.; Yao, S.; Zhang, X.; Xu, W.; Zheng, S.; Jiang, Z.; Yu, Q.; Li, Y.-W.; et al. Low-temperature hydrogen production from water and methanol using Pt/α-MoC catalysts. Nature 2017, 544, 80–83. [Google Scholar] [CrossRef]
  10. Michorczyk, P.; Ogonowski, J.; Zeńczak, K. Activity of chromium oxide deposited on different silica supports in the dehydrogenation of propane with CO2—A comparative study. J. Mol. Catal. A: Chem. 2011, 349, 1–12. [Google Scholar] [CrossRef]
  11. Al-Awadi, A.S.; El-Toni, A.M.; Alhoshan, M.; Khan, A.; Labis, J.P.; Al-Fatesh, A.S.; Abasaeed, A.E.; Al-Zahrani, S.M. Impact of precursor sequence of addition for one-pot synthesis of Cr-MCM-41 catalyst nanoparticles to enhance ethane oxidative dehydrogenation with carbon dioxide. Ceram. Int. 2019, 45, 1125–1134. [Google Scholar] [CrossRef]
  12. Lan, J.; Qu, Y.; Zhang, X.; Ma, H.; Xu, P.; Sun, J. A novel water-stable MOF Zn(Py)(Atz) as heterogeneous catalyst for chemical conversion of CO2 with various epoxides under mild conditions. J. CO2 Utili. 2020, 35. [Google Scholar] [CrossRef]
  13. Ali, M.; Tit, N.; Yamani, Z.H.; Pi, X. First principles study on the functionalization of graphene with Fe catalyst for the detection of CO2: Effect of catalyst clustering. Appl. Surf. Sci. 2020, 502. [Google Scholar] [CrossRef]
  14. Cheng, G.; Zhao, Y.; Li, W.; Zhang, J.; Wang, X.; Dong, C. Performance enhancement of bipolar membranes modified by Fe complex catalyst. J. Membr. Sci. 2019, 589. [Google Scholar] [CrossRef]
  15. Ishihara, A.; Andou, A.; Hashimoto, T.; Nasu, H. Steam reforming of ethanol using novel carbon-oxide composite-supported Ni, Co and Fe catalysts. Fuel Process. Technol. 2020, 197. [Google Scholar] [CrossRef]
  16. Novikov, V.; Xanthopoulou, G.; Knysh, Y.; Amosov, A. Solution Combustion Synthesis of nanoscale Cu-Cr-O spinels: Mechanism, properties and catalytic activity in CO oxidation. Ceram. Int. 2017, 43, 11733–11742. [Google Scholar] [CrossRef]
  17. Lai, C.; He, T.; Li, X.; Chen, F.; Yue, L.; Hou, Z. Catalytic wet air oxidation of phenols over porous plate Cu-based catalysts. Appl. Clay Sci. 2019, 181. [Google Scholar] [CrossRef]
  18. Huang, J.; Zhang, H.J. Mn-based catalysts for sulfate radical-based advanced oxidation processes: A review. Environ. Int. 2019, 133. [Google Scholar] [CrossRef]
  19. Zapata, P.M.C.; Nazzarro, M.S.; Gonzo, E.E.; Parentis, M.L.; Bonini, N.A. Cr/SiO2 mesoporous catalysts: Effect of hydrothermal treatment and calcination temperature on the structure and catalytic activity in the gas phase dehydration and dehydrogenation of cyclohexanol. Catal. Today 2016, 259, 39–49. [Google Scholar] [CrossRef]
  20. Wang, Z.; Tan, K.; Cai, J.; Hou, S.; Wang, Y.; Jiang, P.; Liang, M. Silica oxide encapsulated natural zeolite for high efficiency removal of low concentration heavy metals in water. Coll. Surf. A: Physicochem. Eng. Asp. 2019, 561, 388–394. [Google Scholar] [CrossRef]
  21. Fridman, V.Z.; Xing, R.; Severance, M. Investigating the CrOx/Al2O3 dehydrogenation catalyst model: I. identification and stability evaluation of the Cr species on the fresh and equilibrated catalysts. Appl. Catal. A: Gen. 2016, 523, 39–53. [Google Scholar] [CrossRef]
  22. Guerrero-Pérez, M.O.; Romero, M.J.V.; Hernandez, S.; Nieto, J.M.L.; Rodríguez-Mirasol, J.; Cordero, T. Lignocellulosic-derived mesoporous materials: An answer to manufacturing non-expensive catalysts useful for the biorefinery processes. Catal. Today 2012, 195, 155–161. [Google Scholar] [CrossRef]
  23. Ghods, B.; Meshkani, F.; Rezaei, M. Effects of alkaline earth promoters on the catalytic performance of the nickel catalysts supported on high surface area mesoporous magnesium silicate in dry reforming reaction. Int. J. Hydrog. Energy 2016, 41, 22913–22921. [Google Scholar] [CrossRef] [Green Version]
  24. Nagaraju, N. Alumina and silica supported metal catalysts for the production of carbon nanotubes. J. Mol. Catal. A: Chem. 2002, 181, 57–62. [Google Scholar] [CrossRef]
  25. Shimizu, K.-I.; Kanno, S.; Kon, K.; Siddiki, S.H.; Tanaka, H.; Sakata, Y. N-alkylation of ammonia and amines with alcohols catalyzed by Ni-loaded CaSiO3. Catal. Today 2014, 232, 134–138. [Google Scholar] [CrossRef]
  26. Sakata, Y.; Tamaura, Y.; Imamura, H.; Watanabe, M. Preparation of a New Type of CaSiO3 with High Surface Area and Property as a Catalyst Support. Adv. Pharm. 2006, 162, 331–338. [Google Scholar]
  27. Richardson, I. The calcium silicate hydrates. Cem. Concr. Res. 2008, 38, 137–158. [Google Scholar] [CrossRef]
  28. Dambrauskas, T.; Baltakys, K.; Eisinas, A. Formation and thermal stability of calcium silicate hydrate substituted with Al3+ ions in the mixtures with CaO/SiO2 = 1.5. J. Therm. Anal. Calorim. 2017, 131, 501–512. [Google Scholar] [CrossRef]
  29. Novembre, D.; Pace, C.; Gimeno, D. Synthesis and characterization of wollastonite-2Mby using a diatomite precursor. Miner. Mag. 2018, 82, 95–110. [Google Scholar] [CrossRef]
  30. Niuniavaite, D.; Baltakys, K.; Dambrauskas, T.; Eisinas, A. Cu2+, Co2+ and Cr3+ adsorption by synthetic dibasic calcium silicate hydrates and their thermal stability in a 25–1000° C temperature range. J. Therm. Anal. Calorim. 2019, 138, 2241–2249. [Google Scholar] [CrossRef]
  31. Liu, L.; Liu, S.; Peng, H.; Yang, Z.; Zhao, L.; Tang, A. Surface charge of mesoporous calcium silicate and its adsorption characteristics for heavy metal ions. Solid State Sci. 2020, 99. [Google Scholar] [CrossRef]
  32. Xia, X.; Xu, Y.; Chen, Y.; Liu, Y.; Lu, Y. The distinct catalytic behaviours of calcium silicate hydrate for the high selectivity of 2, 2′-isomer in reaction of phenol with formaldehyde. Catal. Commun. 2019, 118, 15–18. [Google Scholar] [CrossRef]
  33. Segawa, A.; Nakashima, A.; Nojima, R.; Yoshida, N.; Okamoto, M. Acetaldehyde Production from Ethanol by Eco-Friendly Non-Chromium Catalysts Consisting of Copper and Calcium Silicate. Ind. Eng. Chem. Res. 2018, 57, 11852–11857. [Google Scholar] [CrossRef]
  34. Zhu, G.; Li, H.; Wang, X.; Hou, X.; Wu, W.; Tang, Q. Synthesis of Calcium Silicate Hydrate in Highly Alkaline System. J. Am. Ceram. Soc. 2016, 99, 2778–2785. [Google Scholar] [CrossRef]
  35. Qu, X.; Zhao, Z.; Zhao, X. Microstructure and characterization of aluminum-incorporated calcium silicate hydrates (C–S–H) under hydrothermal conditions. R. Soc. Chem. Adv. 2018, 8, 28198–28208. [Google Scholar] [CrossRef] [Green Version]
  36. El-Korashy, S. Characterization of Cation Exchange and Cesium Selectivity of Synthetic Beta-Dicalcium Silicate Hydrate. J. Korean Chem. Soc. 2002, 46, 515–522. [Google Scholar] [CrossRef] [Green Version]
  37. Liu, Y.; Jia, H.; Zhang, G.; Sun, Z.; Pan, Y.; Zheng, S. Synthesis and humidity control performances of natural opoka based porous calcium silicate hydrate. Adv. Powder Technol. 2019, 30, 2733–2741. [Google Scholar] [CrossRef]
  38. Dambrauskas, T.; Baltakys, K.; Eisinas, A.; Kitrys, S. The specific surface area and porosity of synthetic and calcined α-C2SH, kilchoanite and hydroxyledgrewite. Powder Technol. 2019, 355, 504–513. [Google Scholar] [CrossRef]
  39. You, Y.-Z.; Kalebaila, K.K.; Brock, S.L.; Oupicky, D. Temperature-Controlled Uptake and Release in PNIPAM-Modified Porous Silica Nanoparticles. Chem. Mater. 2008, 20, 3354–3359. [Google Scholar] [CrossRef]
  40. Meng, Y.; Ling, T.-C.; Mo, K.H.; Tian, W. Enhancement of high temperature performance of cement blocks via CO2 curing. Sci. Total Environ. 2019, 671, 827–837. [Google Scholar] [CrossRef]
  41. Chen, Q.; Hills, C.D.; Yuan, M.; Liu, H.; Tyrer, M. Characterization of carbonated tricalcium silicate and its sorption capacity for heavy metals: A micron-scale composite adsorbent of active silicate gel and calcite. J. Hazard. Mater. 2008, 153, 775–783. [Google Scholar] [CrossRef]
  42. Polychroniadis, E.K.; Oral, A.Y.; Ozer, M. Proceedings of 2nd International Multidisciplinary Microscopy and Microanalysis Congress; Springer: Cham, Switzerland, 2015. [Google Scholar]
  43. Berei, E.; Ştefănescu, O.; Muntean, C.; Ţăranu, B.; Ştefănescu, M. Study on the formation of CoCr2O4/SiO2 nanocomposite obtained from Co(II) carboxylate and ammonium dichromate. Therm. Anal. Calorim. 2019, 138, 1863–1870. [Google Scholar] [CrossRef]
  44. He, Y.; Zhao, X.; Lu, L.; Struble, L.J.; Hu, S. Effect of C/S ratio on morphology and structure of hydrothermally synthesized calcium silicate hydrate. J. Wuhan Univ. Technol. Sci. Ed. 2011, 26, 770–773. [Google Scholar] [CrossRef]
  45. El-Sheikh, S.; Rabah, M. Optical properties of calcium chromate 1D-nanorods synthesized at low temperature from secondary resources. Opt. Mater. 2014, 37, 235–240. [Google Scholar] [CrossRef]
  46. Chang, S.K.; Seong, I.W. Characterization of Cr/silica ethylene polymerization catalyst by TPO/TPR and FT—IR. J. Mol. Catal. 1992, 73, 249–263. [Google Scholar] [CrossRef]
  47. Shao, C.; Chen, M. In situ FT-IR studies on the CO2 hydrogenation over the SiO2-supported RhM (M=Cr, Mo, W) complex catalysts. J. Mol. Catal. A: Chem. 2001, 166, 331–335. [Google Scholar] [CrossRef]
  48. Liu, B.; Yu, S.; Li, L.; Zhang, Q.; Zhang, F.; Jiang, K. Morphology control of stolzite microcrystals with high hierarchy in solution. Angew. Chem. 2004, 43, 4745–4750. [Google Scholar] [CrossRef]
  49. Xiang, J.-H.; Yu, S.-H.; Xu, Z. Polymorph and Phase Discrimination of Lead Chromate Pigments by a Facile Room Temperature Precipitation Reaction. Cryst. Growth Des. 2004, 4, 1311–1315. [Google Scholar] [CrossRef]
  50. Kobayashi, M.; Miho, Y.; Shibasaki, N.; Ogura, K. Electrochemical Oxidative Decomposition of Aliphatic Amino Acids. Nippon KAGAKU KAISHI 1998, 1998, 442–446. [Google Scholar] [CrossRef]
  51. Driscoll, S.; Ozkan, U. Isotopic Labeling Studies on Oxidative Coupling of Methane over Alkali Promoted Molybdate Catalysts. Adv. Pharm. 1994, 82, 367–375. [Google Scholar]
  52. Yu, P.; Kirkpatrick, R.J.; Poe, B.; McMillan, P.F.; Cong, X. Structure of calcium silicate hydrate (C-S-H): Near-, mid-, and far-infrared spectroscopy. J. Am. Ceram. Soc. 1999, 82, 742–748. [Google Scholar] [CrossRef]
  53. Rotter, H.; Landau, M.V.; Carrera, M.; Goldfarb, D.; Herskowitz, M. High surface area chromia aerogel efficient catalyst and catalyst support for ethylacetate combustion. Appl. Catal. B: Environ. 2004, 47, 111–126. [Google Scholar] [CrossRef]
  54. Kang, M.; Chang-Ha, L. Methylene chloride oxidation on oxidative carbon-supported chromium oxide catalyst. Appl. Catal. A: Gen. 2004, 263, 163–172. [Google Scholar] [CrossRef]
  55. Thommes, M.; Kaneko, K.; Neimark, A.V.; Olivier, J.P.; Rodriguez-Reinoso, F.; Rouquerol, J.; Sing, K.S. Physisorption of gases, with special reference to the evaluation of surface area and pore size distribution (IUPAC Technical Report). Pure Appl. Chem. 2015, 87, 1051–1069. [Google Scholar] [CrossRef] [Green Version]
  56. Naderi, M. Chapter Fourteen—Surface Area: Brunauer–Emmett–Teller (BET). In Progress in Filtration and Saperation; Academic Press: Cambridge, MA, SUA, 2015; pp. 585–608. [Google Scholar]
  57. Babaee, M.; Castel, A. Water vapor sorption isotherms, pore structure, and moisture transport characteristics of alkali-activated and Portland cement-based binders. Cem. Concr. Res. 2018, 113, 99–120. [Google Scholar] [CrossRef]
  58. Rouquerol, J.; Rouquerol, F.; Llewellyn, P.; Maurin, G.; Sing, K.S. Adsorption by Powders and Porous Solids: Principles, Methodology and Applications; Academic Press: Cambridge, MA, SUA, 2013. [Google Scholar]
  59. Sun, Z.; Huang, D.; Duan, X.; Hong, W.; Liang, J. Functionalized nanoflower-like hydroxyl magnesium silicate for effective adsorption of aflatoxin B1. J. Hazard. Mater. 2020, 387. [Google Scholar] [CrossRef] [PubMed]
  60. Feinberg, B.J.; Hsiao, J.; Park, J.; Zydney, A.L.; Fissell, W.H.; Roy, S. Slit pores preferred over cylindrical pores for high selectivity in biomolecular filtration. J. Colloid Interface Sci. 2018, 517, 176–181. [Google Scholar] [CrossRef]
  61. Zhang, Y.; Liu, C.; Liu, Z.; Liu, G.; Yang, L. Modelling of diffusion behavior of ions in low-density and high-density calcium silicate hydrate. Constr. Build. Mater. 2017, 155, 965–980. [Google Scholar] [CrossRef]
  62. Veksha, A.; Moo, J.G.S.; Krikstolaityte, V.; Oh, W.; Udayanga, W.D.C.; Giannis, A.; Lisak, G. Synthesis of CaCr2O4/carbon nanoplatelets from non-condensable pyrolysis gas of plastics for oxygen reduction reaction and charge storage. J. Electroanal. Chem. 2019, 849. [Google Scholar] [CrossRef]
  63. Lapham, D.P.; Lapham, J.L. BET surface area measurement of commercial magnesium stearate by krypton adsorption in preference to nitrogen adsorption. Int. J. Pharm. 2019, 568. [Google Scholar] [CrossRef]
  64. Lapham, D.P.; Lapham, J.L. Gas adsorption on commercial magnesium stearate: Effects of degassing conditions on nitrogen BET surface area and isotherm characteristics. Int. J. Pharm. 2017, 530, 364–376. [Google Scholar] [CrossRef]
  65. Anokhin, A.; Chernova, E.S.; Strelnikova, S.S.; Andrianov, N.T.; Ashmarin, A.A.; Zheleznyi, M.V. Influence of additives of aluminum, magnesium and calcium on synthesis and sintering of lanthanum chromite. Inorg. Mater. Appl. Res. 2014, 5, 323–329. [Google Scholar] [CrossRef]
  66. Roosz, C.; Gaboreau, S.; Grangeon, S.; Prêt, D.; Montouillout, V.; Maubec, N.; Ory, S.; Blanc, P.; Vieillard, P.; Henocq, P. Distribution of Water in Synthetic Calcium Silicate Hydrates. Langmuir 2016, 32, 6794–6805. [Google Scholar] [CrossRef]
  67. Morales-Flórez, V.; Findling, N.; Brunet, F. Changes on the nanostructure of cementitius calcium silicate hydrates (C–S–H) induced by aqueous carbonation. J. Mater. Sci. 2011, 47, 764–771. [Google Scholar] [CrossRef]
  68. Zdujić, M.; Lukic, I.; Kesić, Ž.; Janković-Častvan, I.; Marković, S.; Jovalekić, Č.; Skala, D. Synthesis of CaO SiO2 compounds and their testing as heterogeneous catalysts for transesterification of sunflower oil. Adv. Powder Technol. 2019, 30, 1141–1150. [Google Scholar] [CrossRef]
  69. Yang, Y.; Liu, W.; Hu, Y.; Sun, J.; Tong, X.; Li, Q.; Zhou, Z. Novel low cost Li4SiO4-based sorbent with naturally occurring wollastonite as Si-source for cyclic CO2 capture. Chem. Eng. J. 2019, 374, 328–337. [Google Scholar] [CrossRef]
  70. Pal, N. Nanoporous metal oxide composite materials: A journey from the past, present to future. Adv. Colloid Interface Sci. 2020, 280. [Google Scholar] [CrossRef]
  71. Zukal, A.; Shamzhy, M.V.; Kubů, M.; Čejka, J. The effect of pore size dimensions in isoreticular zeolites on carbon dioxide adsorption heats. J. CO2 Utili. 2018, 24, 157–163. [Google Scholar] [CrossRef]
  72. Hosseini, S.; Niaei, A.; Salari, D.; Álvarez-Galván, C.; Fierro, J.L.G. Study of correlation between activity and structural properties of Cu-(Cr, Mn and Co)2 nano mixed oxides in VOC combustion. Ceram. Int. 2014, 40, 6157–6163. [Google Scholar] [CrossRef]
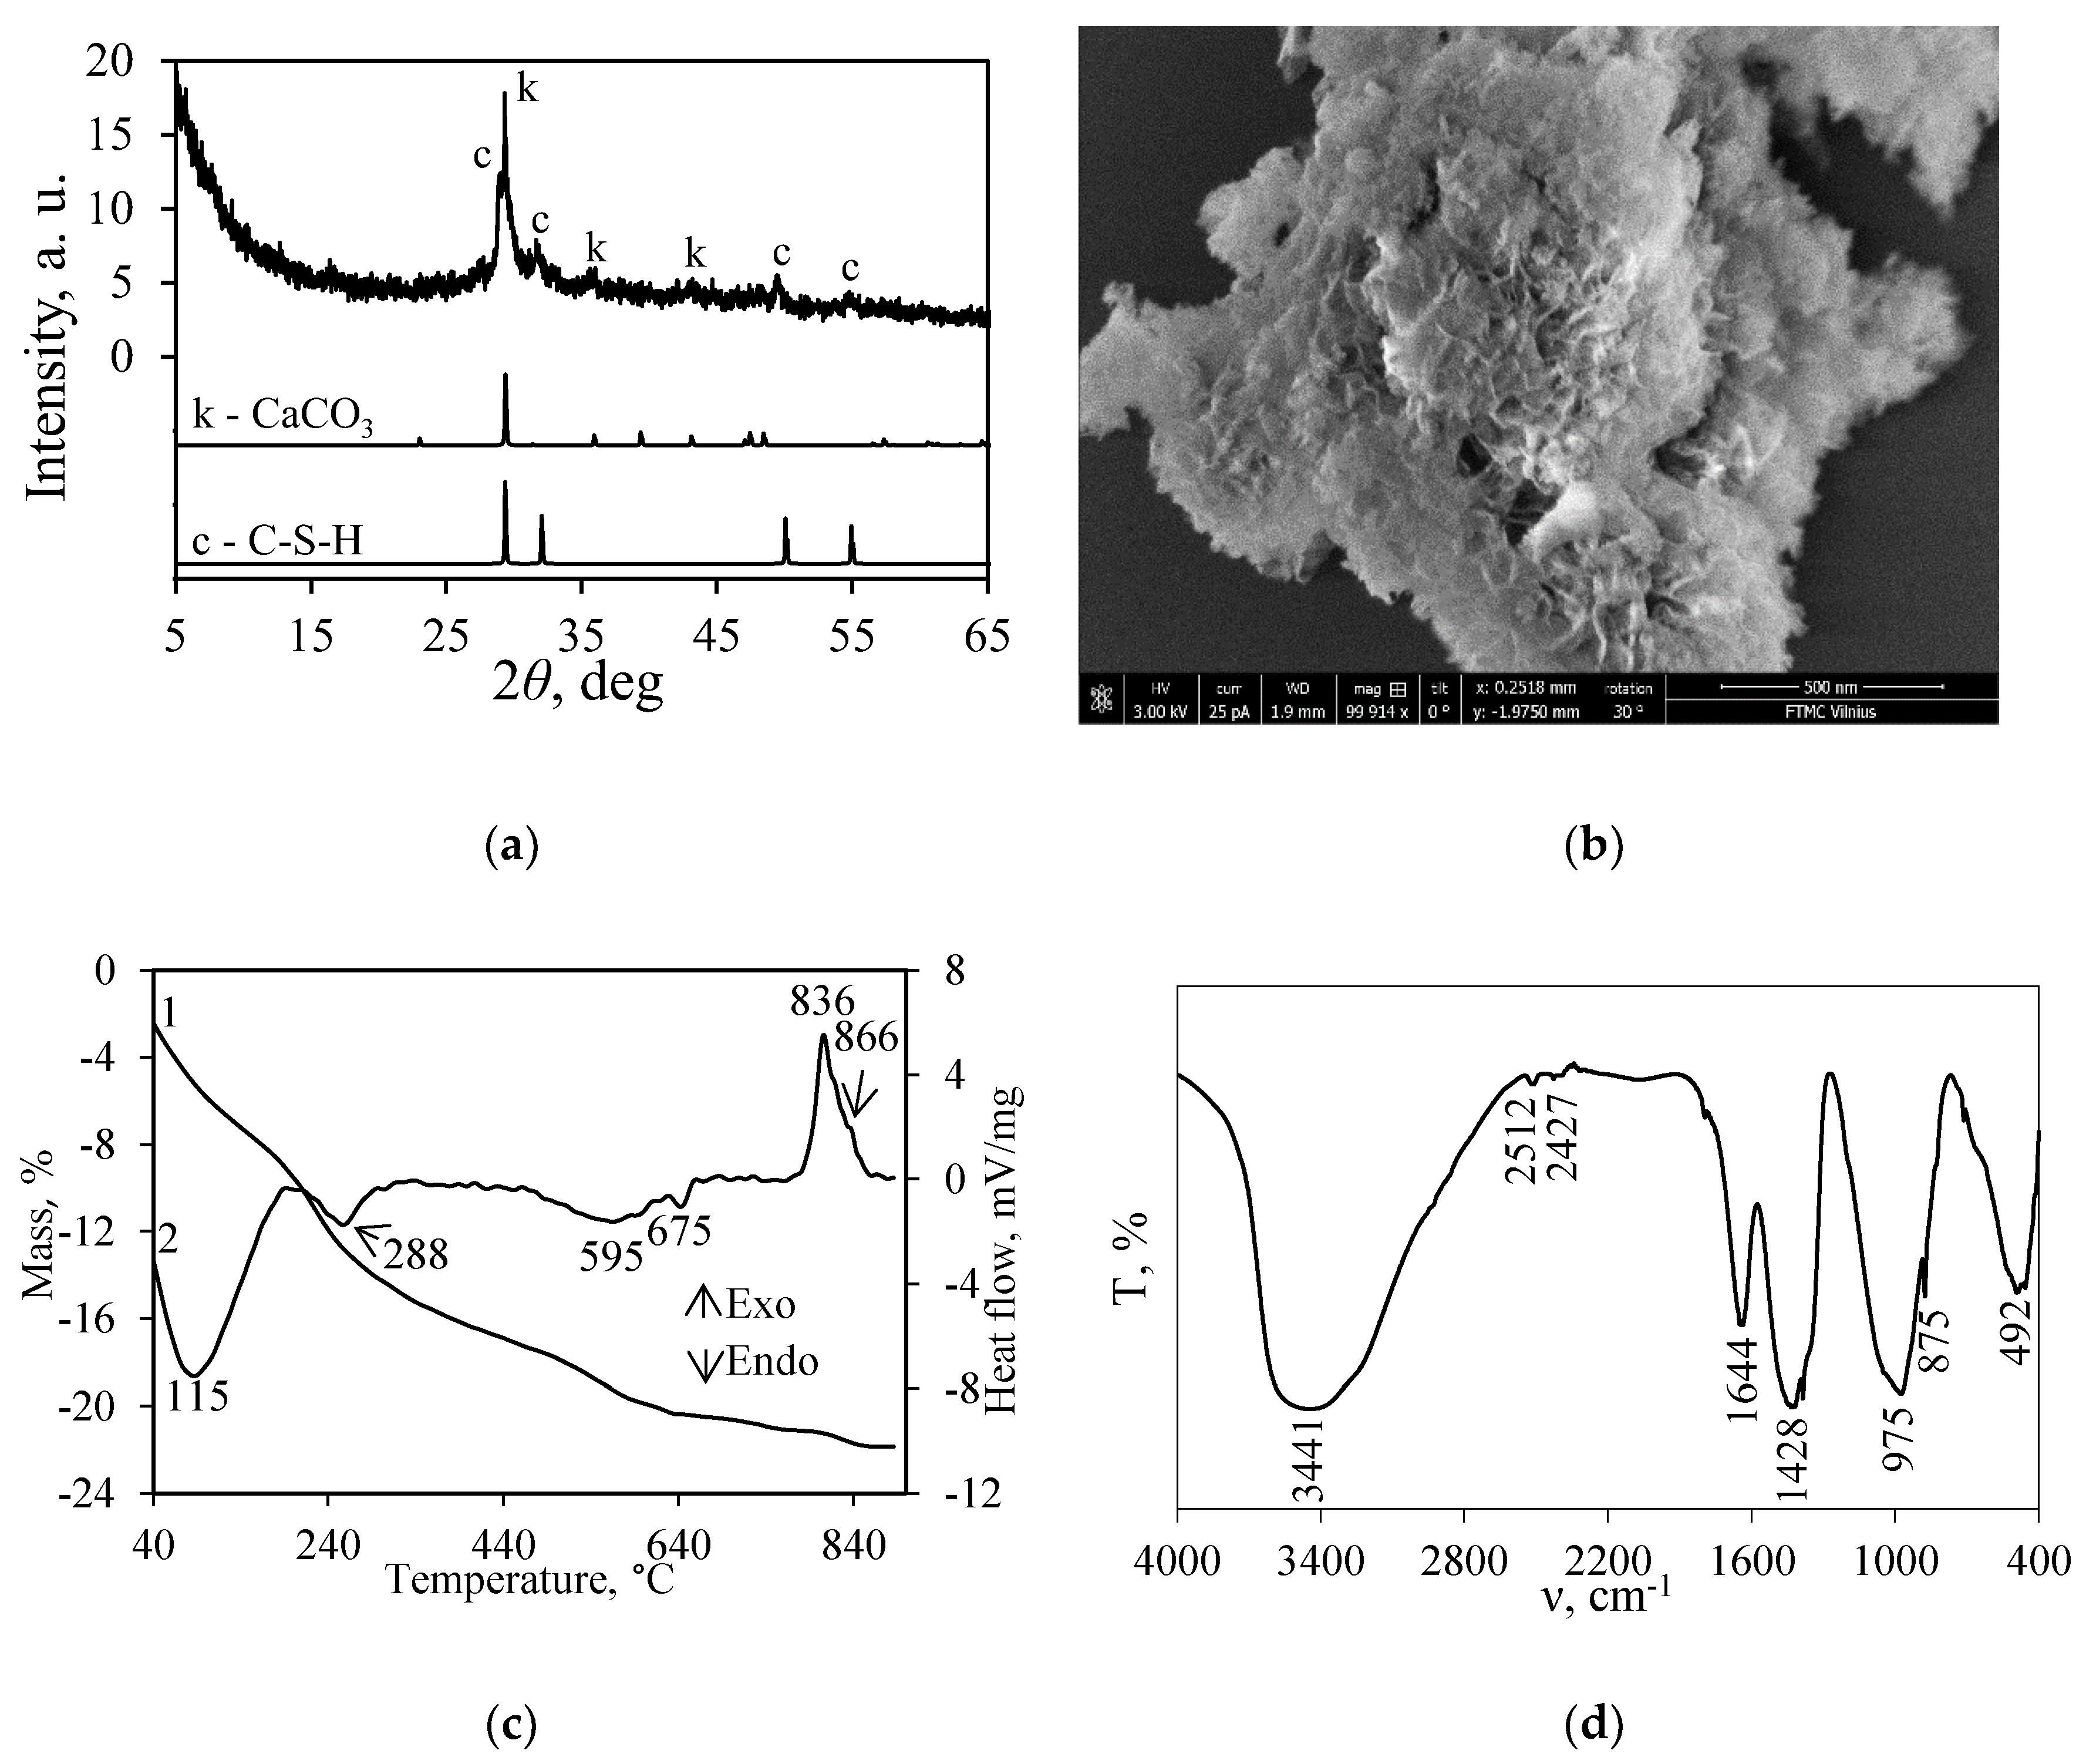
Figure 1. XRD pattern (a), SEM image (b), STA curves (curve 1—TG; curve 2—DSC) (c), and FT-IR spectrum (d) of the synthesis products. Indexes: k–calcite, c–C-S-H(I)/C-S-H(II).
Nanomaterials 10 01299 g001
Figure 2. In-situ XRD patterns of synthesis products when the temperature of calcination is 25–1000 °C. Indexes: c—C-S-H(I)/C-S-H(II); w—wollastonite; k—CaCO3; Cr—CaCrO4.
Nanomaterials 10 01299 g002
Figure 3. XRD pattern (a), SEM image (b), and FT-IR spectrum (c) of the calcined sample at 550 °C. Indexes: k—CaCO3; Cr—CaCrO4.
Nanomaterials 10 01299 g003
Figure 4. Adsorption (1)–desorption (2) isotherms of synthetic (a) and calcined (b) samples.
Nanomaterials 10 01299 g004
Figure 5. TEM micrographs of synthetic (a) and calcined (b) samples.
Nanomaterials 10 01299 g005
Figure 6. Isotherm of N2 adsorption at 77 K in BET plot of synthetic (a) and calcined (b) samples.
Nanomaterials 10 01299 g006
Figure 7. Differential distributions of pore sizes of synthetic (a) and calcined (b) samples. Here, curve 1 and curve 3 values were obtained by using the model of cylindrical-like pores, and curve 2 values were obtained by using the model of slit-like pores.
Nanomaterials 10 01299 g007
Figure 8. Degree of conversion (♦) and accumulated CO2 concentration (■) during catalytic oxidation of propanol in synthetic (1) and calcined (2) samples.
Nanomaterials 10 01299 g008
Figure 9. Changes in the concentrations of pentanal (♦) and CO (■) formed during propanol catalytic oxidation in synthetic (1) and calcined (2) samples.
Nanomaterials 10 01299 g009
Table 1. Calculated parameters of synthetic and calcined samples by BET method.
SampleBET Equation ConstantsCapacity of Mono Layer XmSBET, m2/gCBET ConstantReliability Coefficient, R2
Slope/S = tgαIntercept/I
Synthetic32.760.510.030104.7665.560.995
Calcined50.440.120.02068.92421.300.995
Table 2. Data of ΣA and ΣVP calculations of samples.
SampleSBET, m2/gResults Obtained by Using the Model of Cylindrical PoresResults Obtained by Using the Model of Slit-Like Pores
ΣA, m2/g|SBET − ΣA|, m2/g|SBET − ΣA|, %ΣVP, cm3/gΣA, m2/g|SBET − ΣA|, m2/g|SBET − ΣA|, %ΣVP, cm3/g
Synthetic105.14134.4629.3227.890.32084.4620.6819.670.278
Calcined68.9266.941.982.870.23037.2731.6545.92-