Surface Study of CuO Nanopetals by Advanced Nanocharacterization Techniques with Enhanced Optical and Catalytic Properties

 , ,
, ,
Abstract
1. Introduction
2. Materials and Methods
2.1. Materials
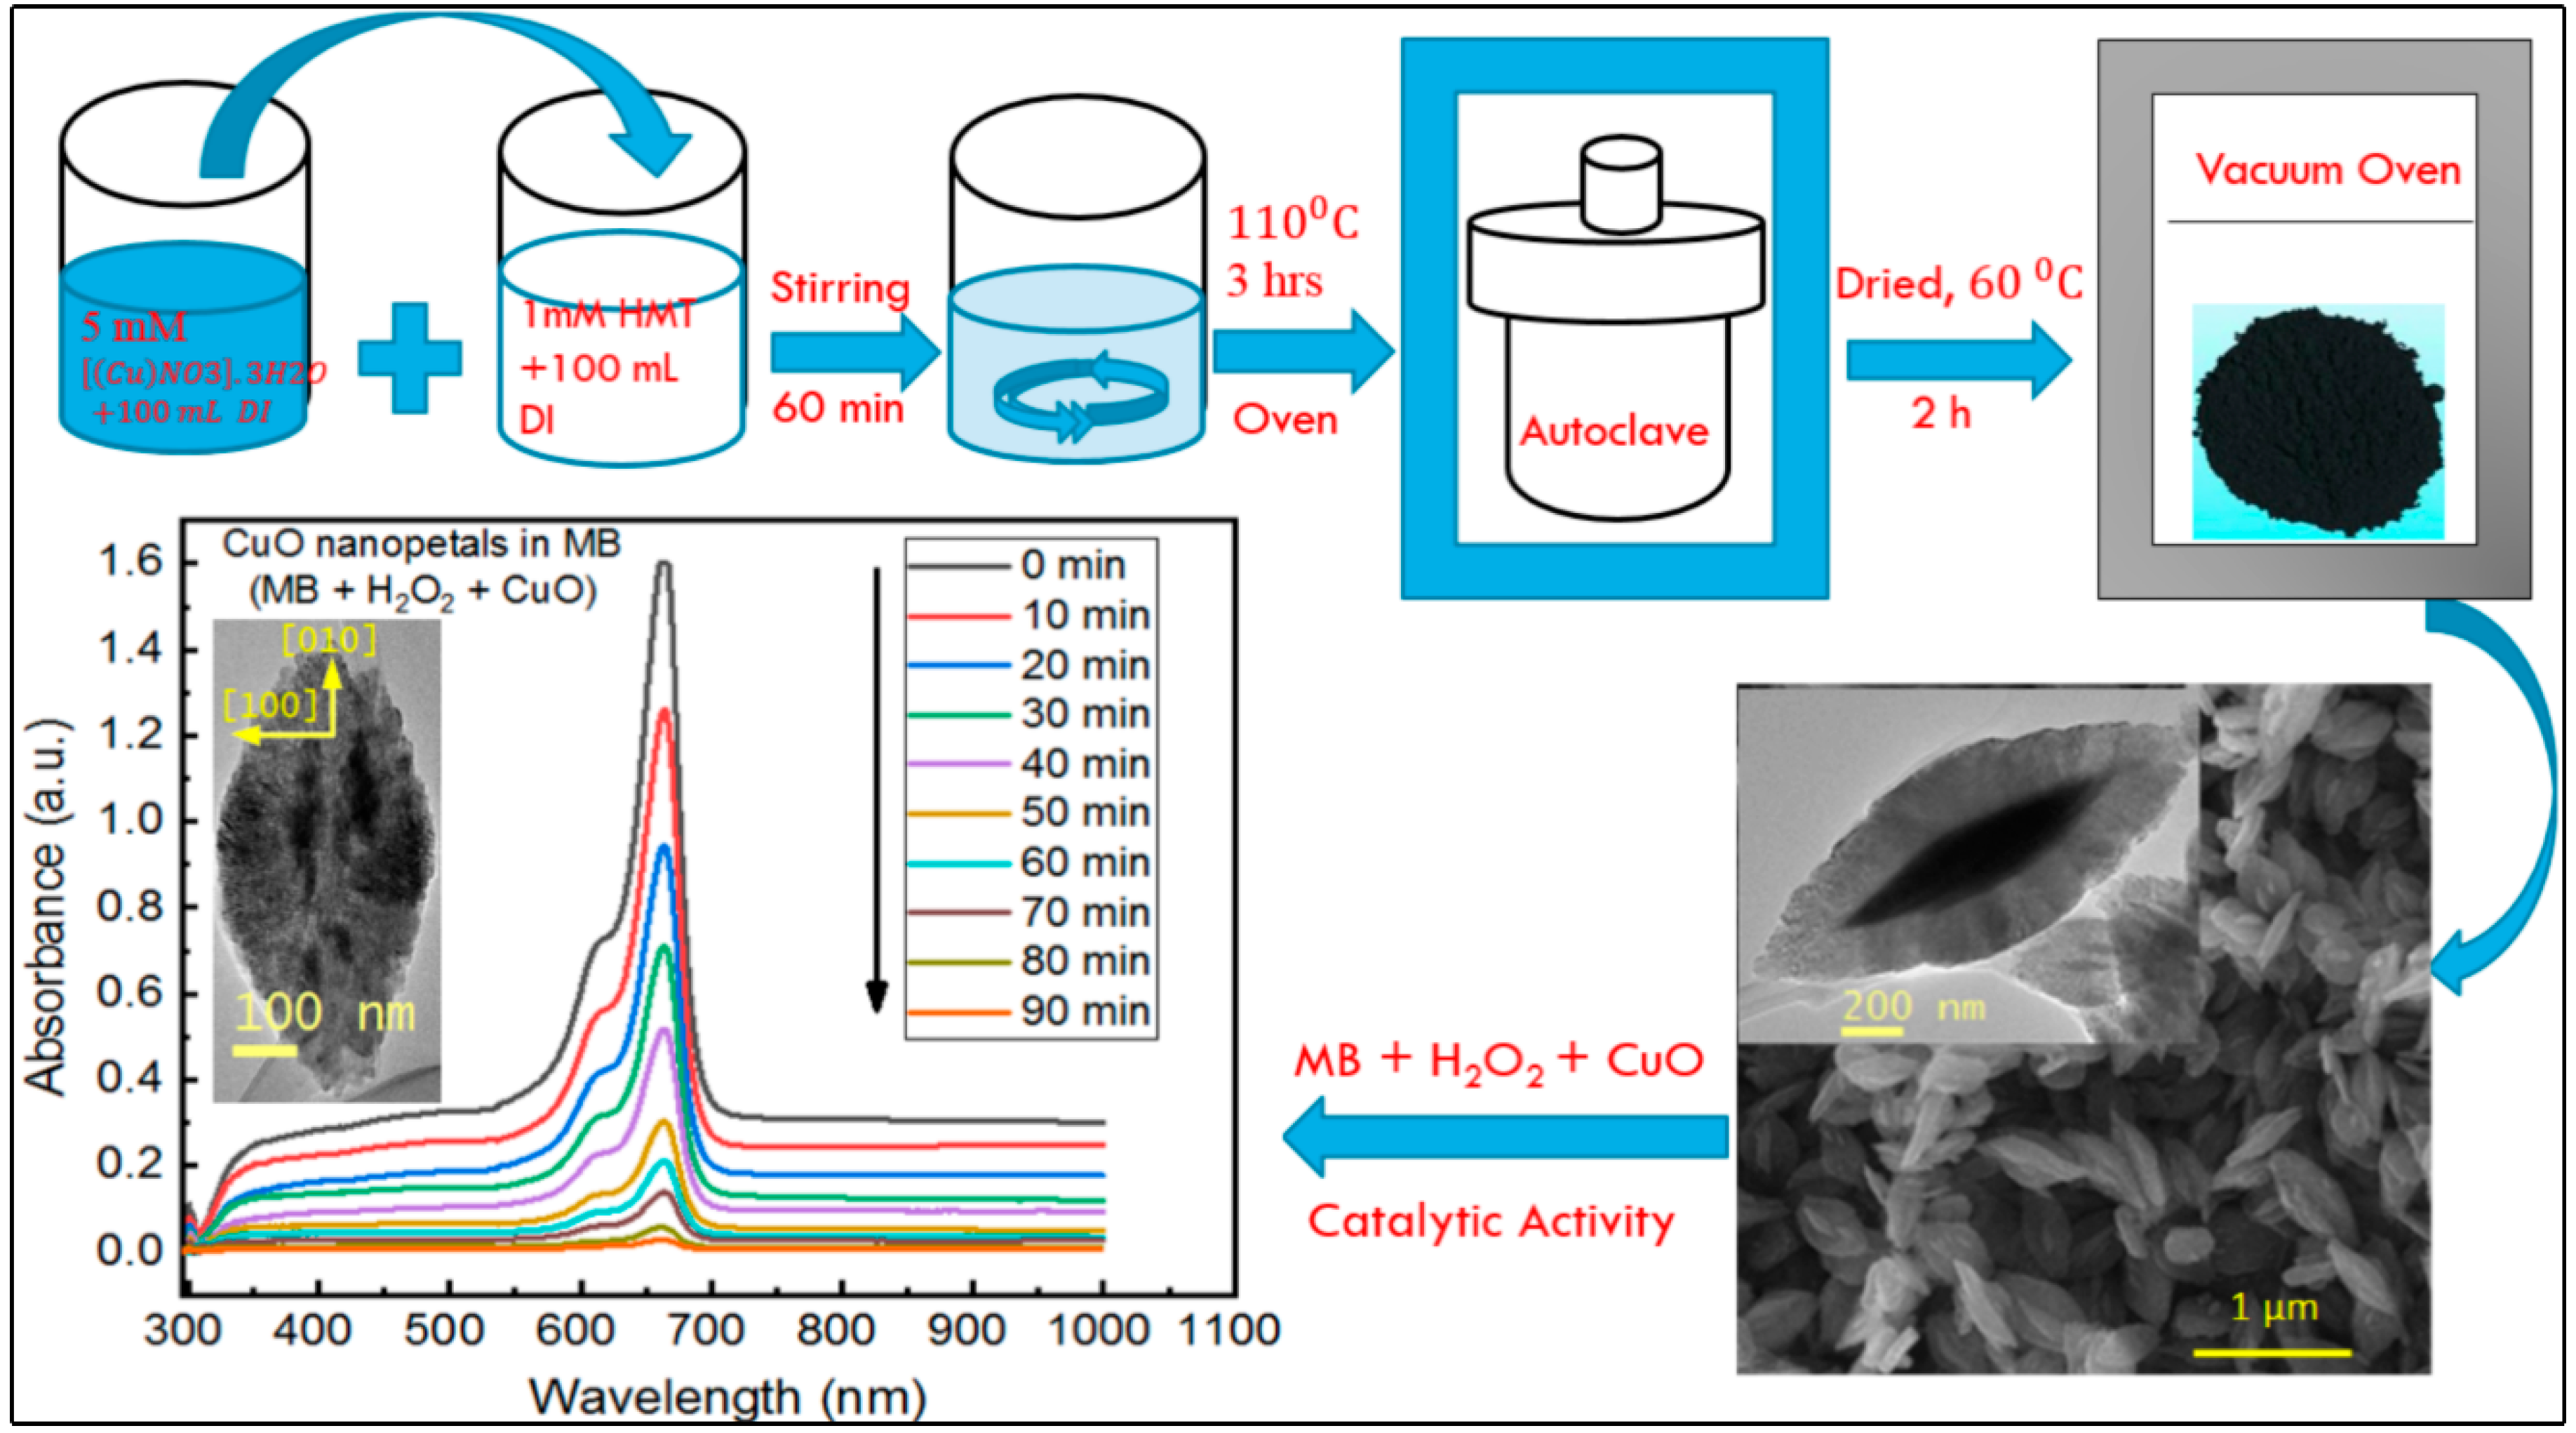
2.2. Synthesis of Copper Oxide Nanopetals
2.3. Characterization
2.4. Catalytic Testing
3. Results and Discussion
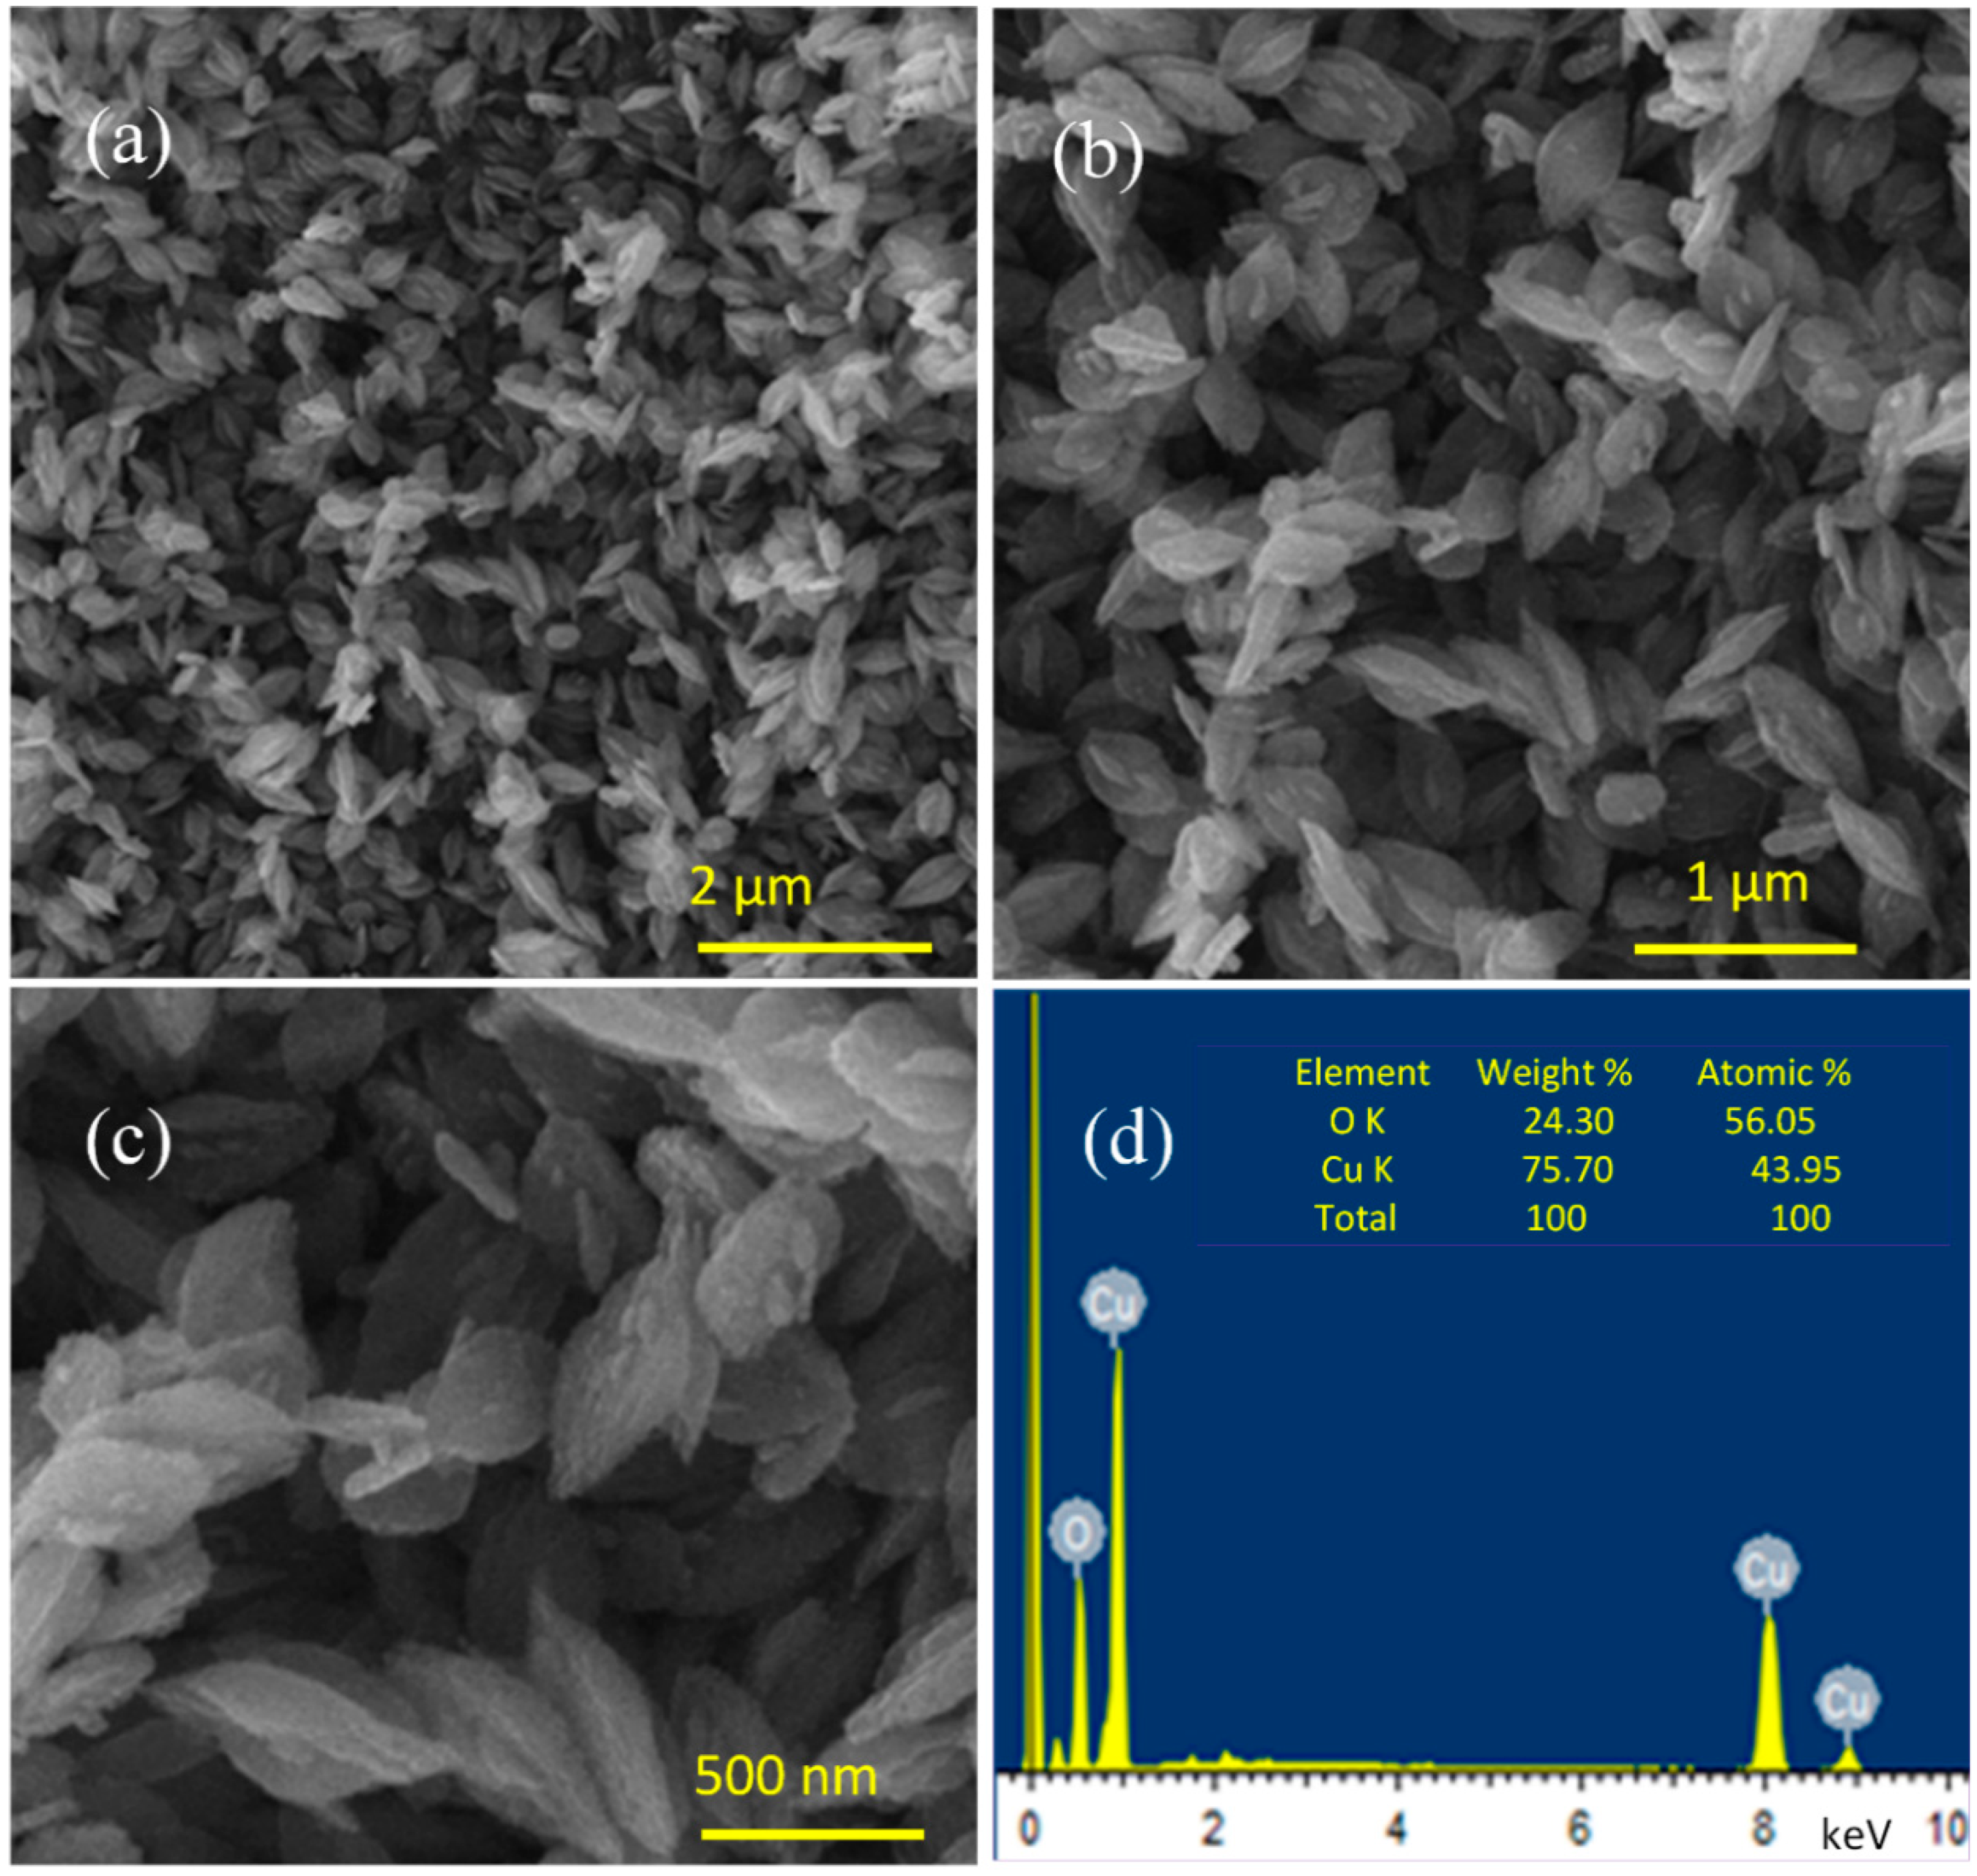
3.1. Surface Morphology
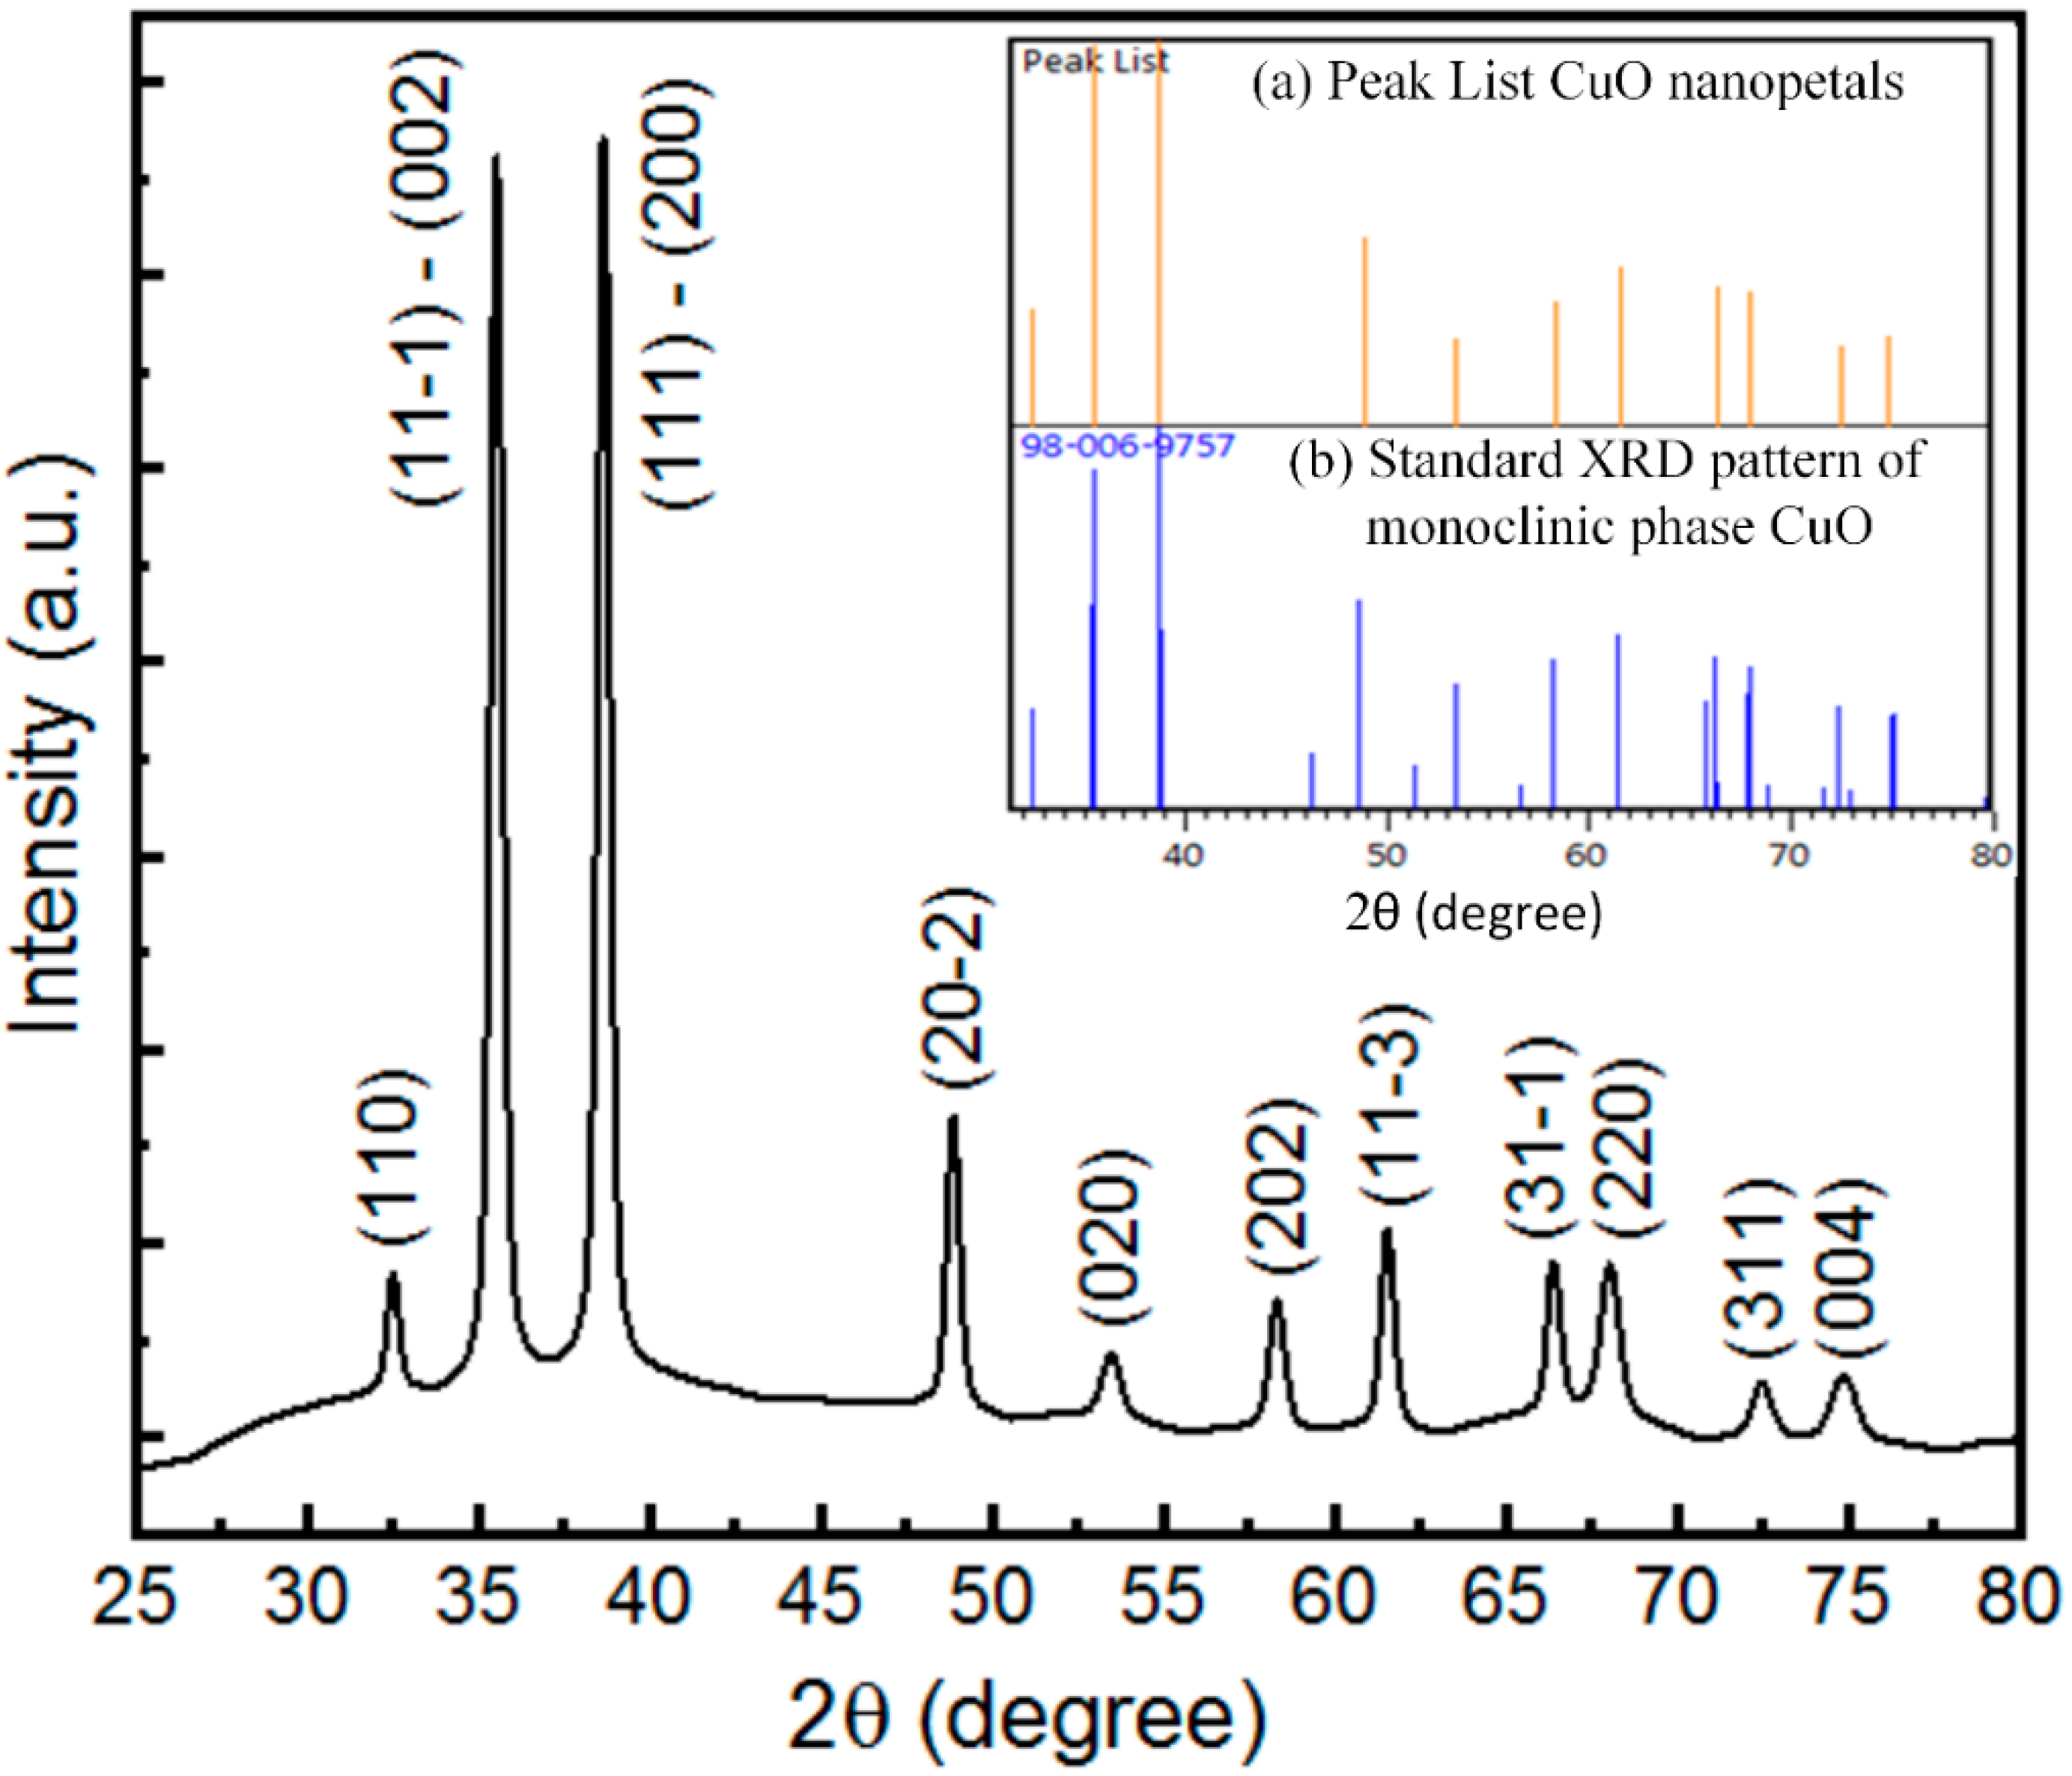
3.2. Crystallinity
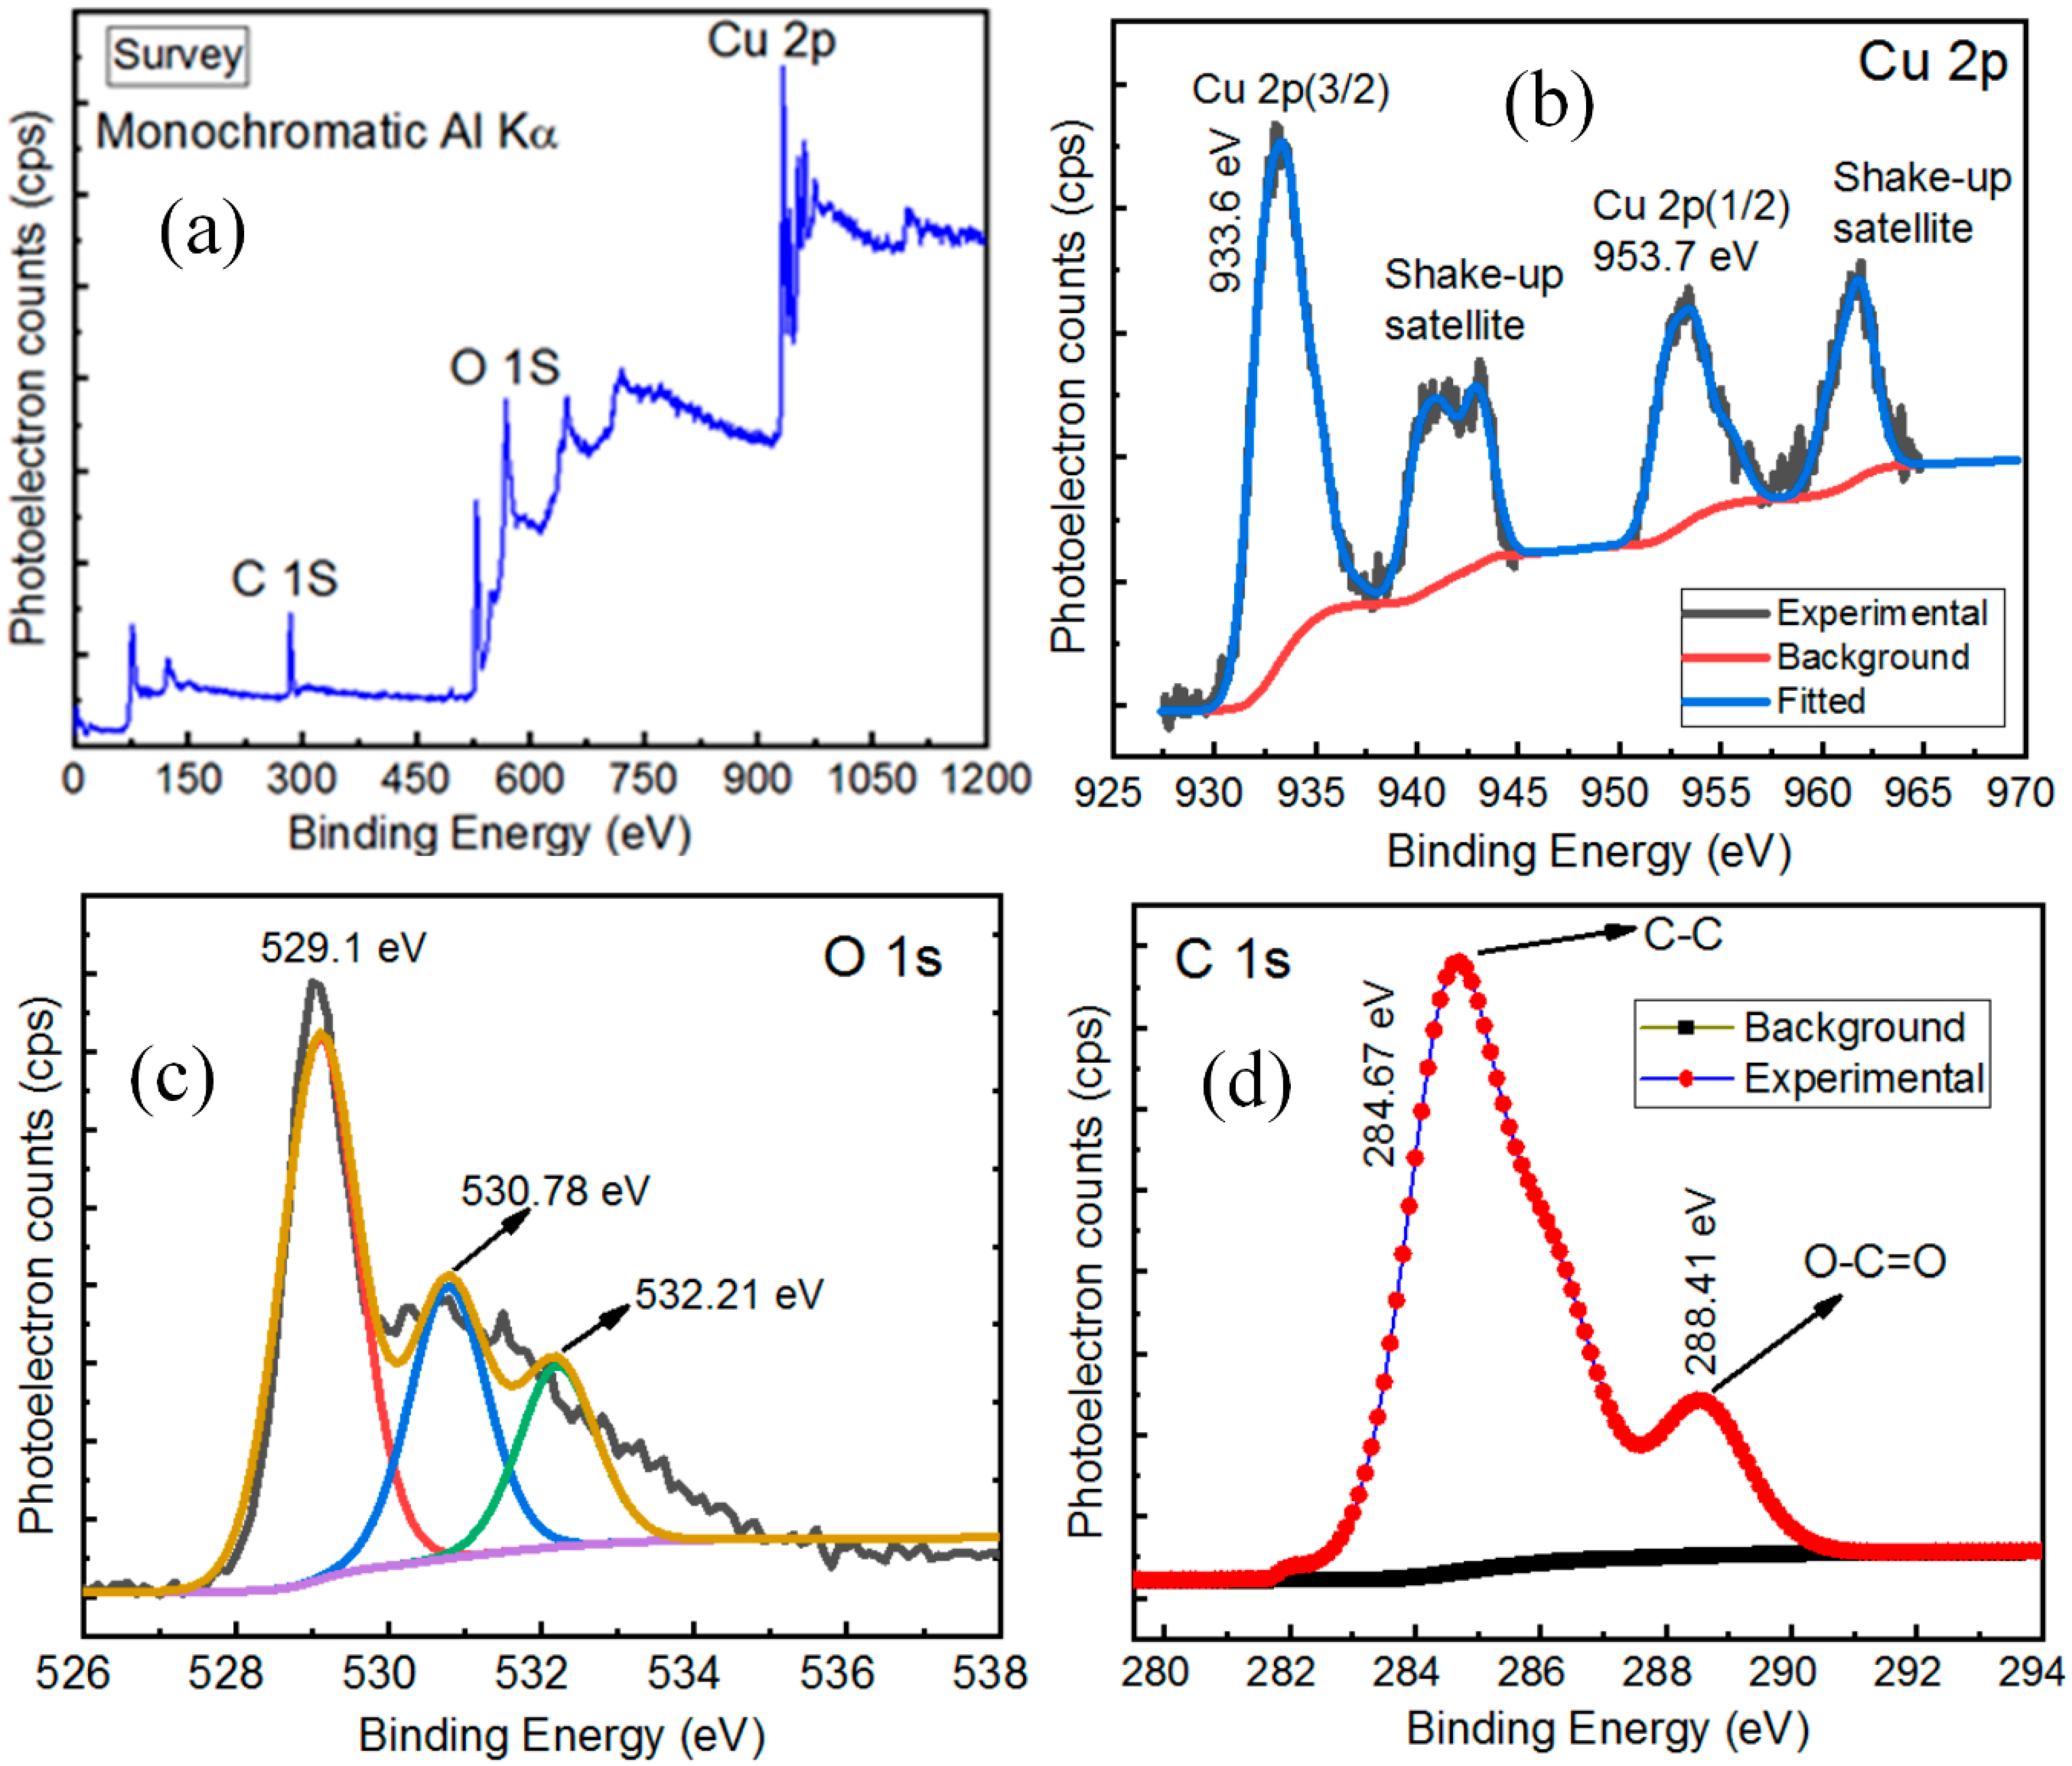
3.3. X-rays Photoelectron Spectroscopy Analysis
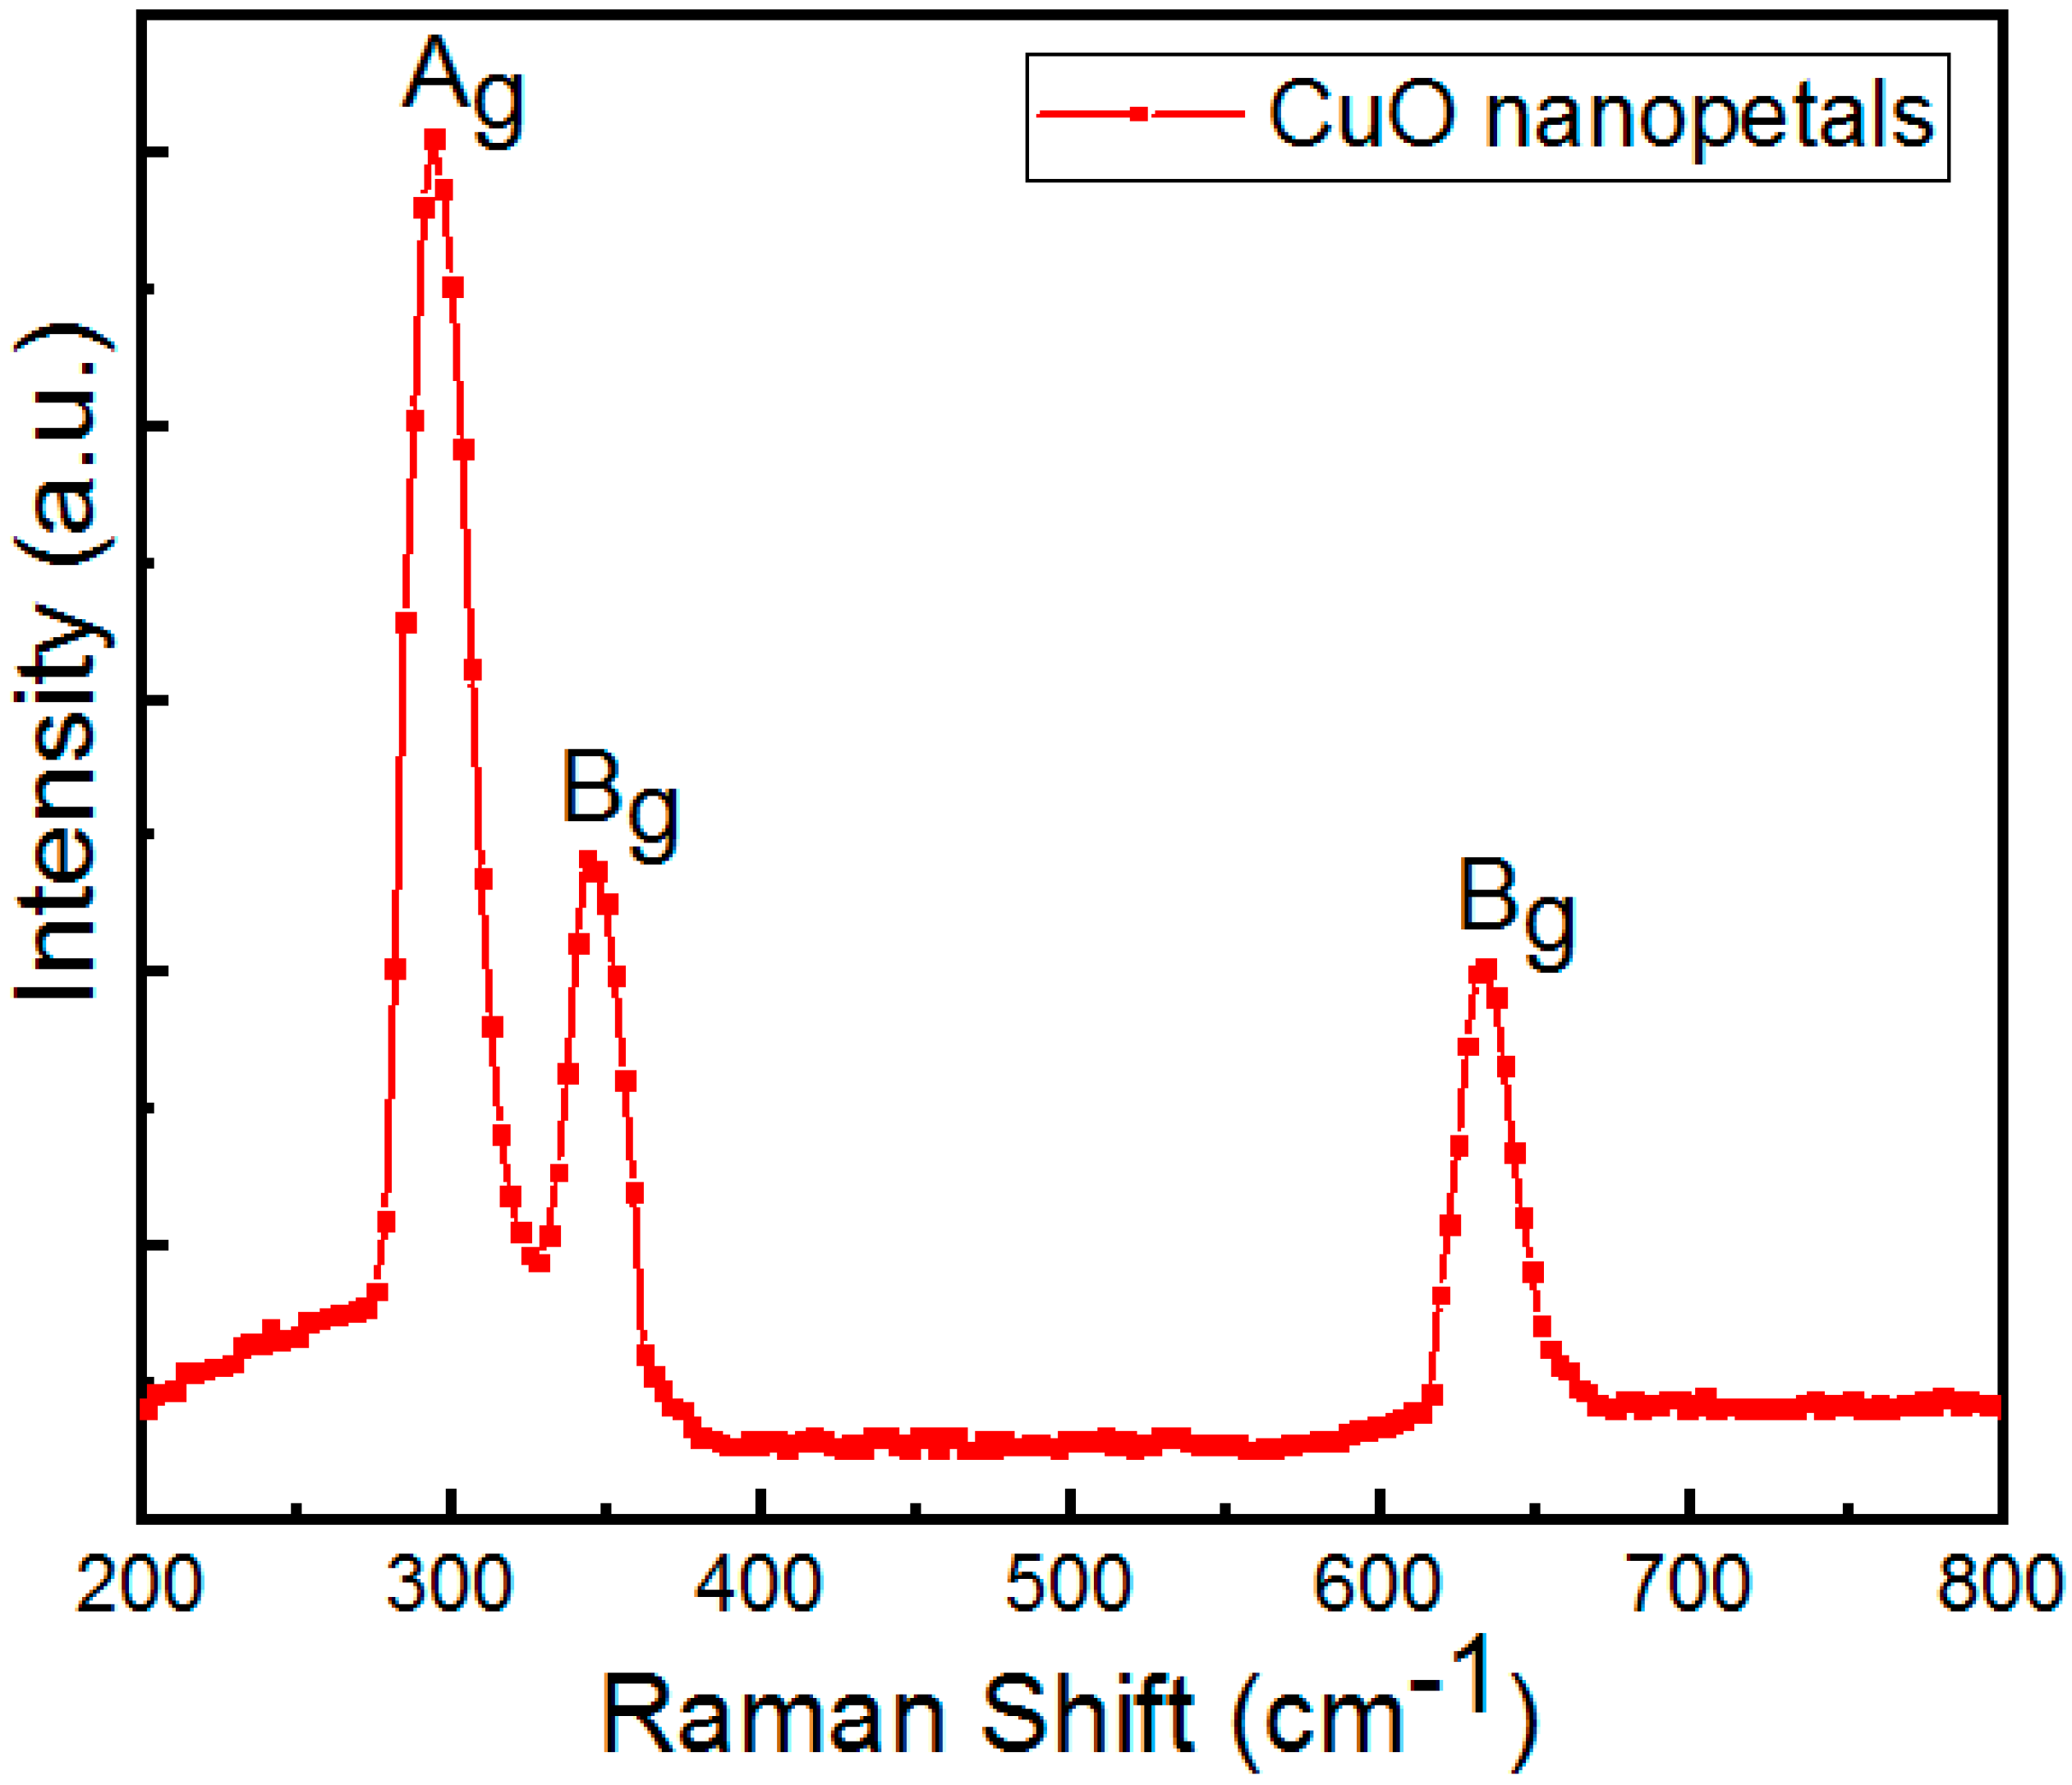
3.4. Raman Analysis
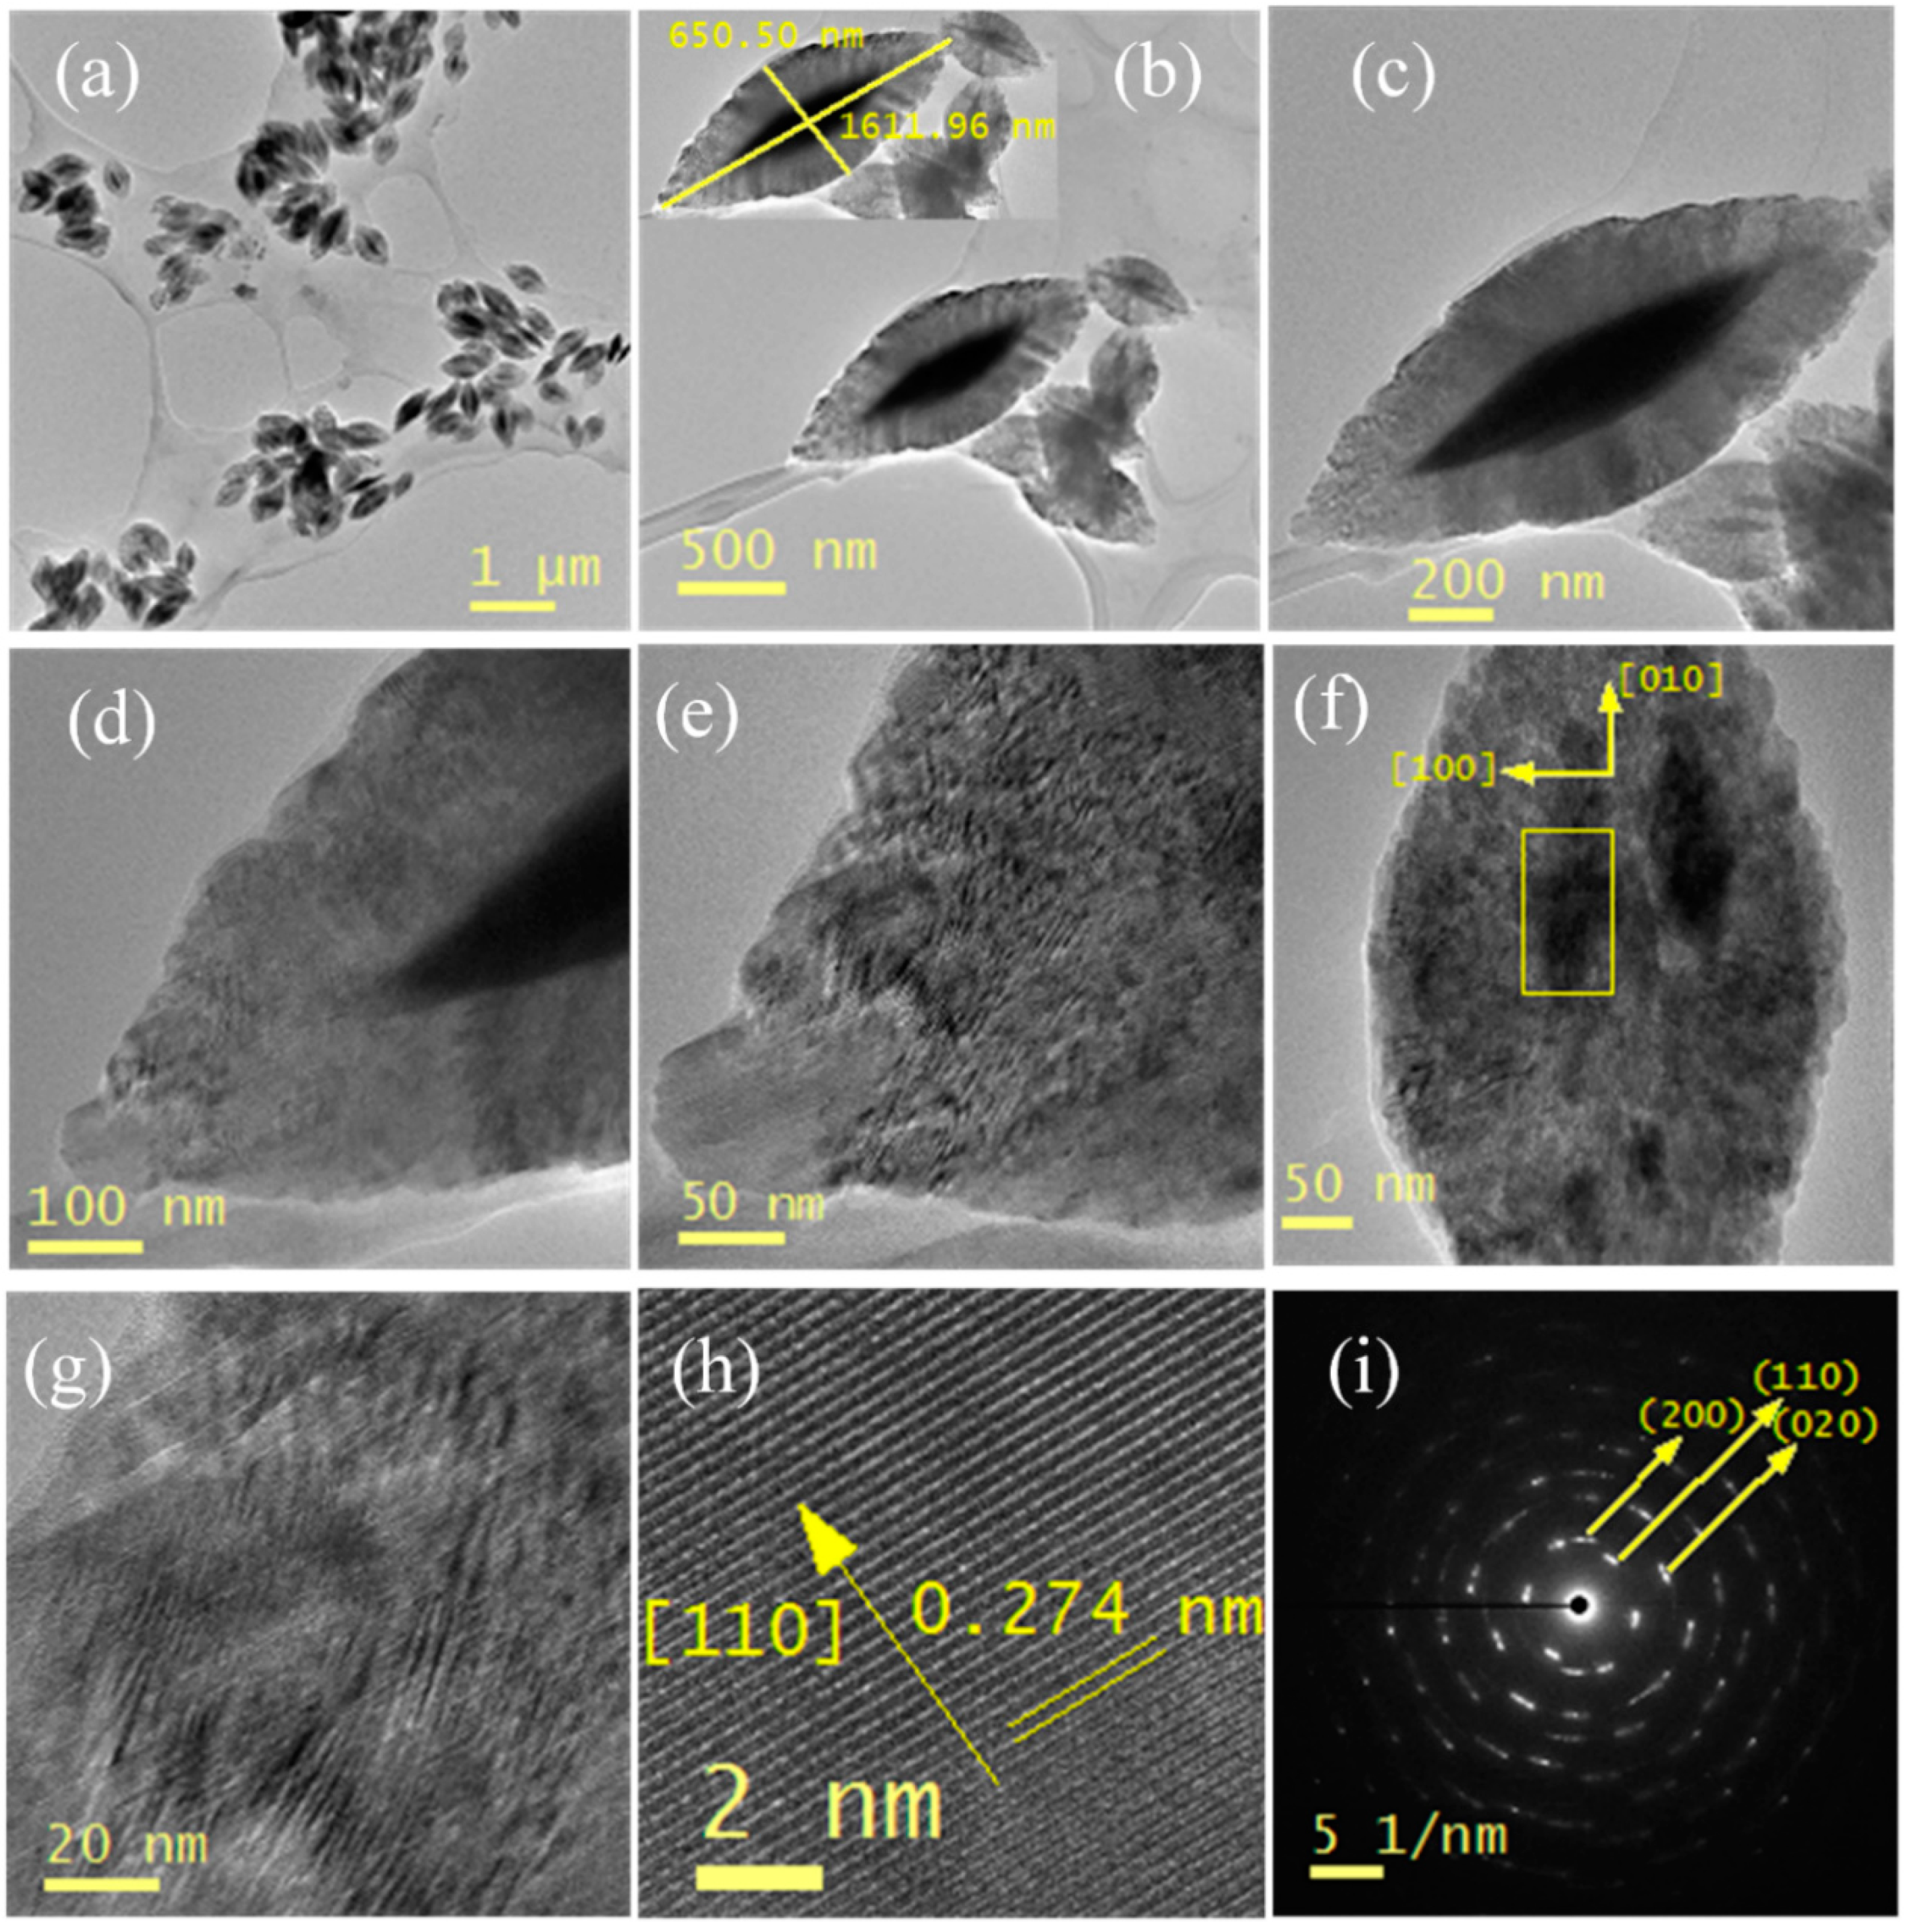
3.5. TEM Analysis
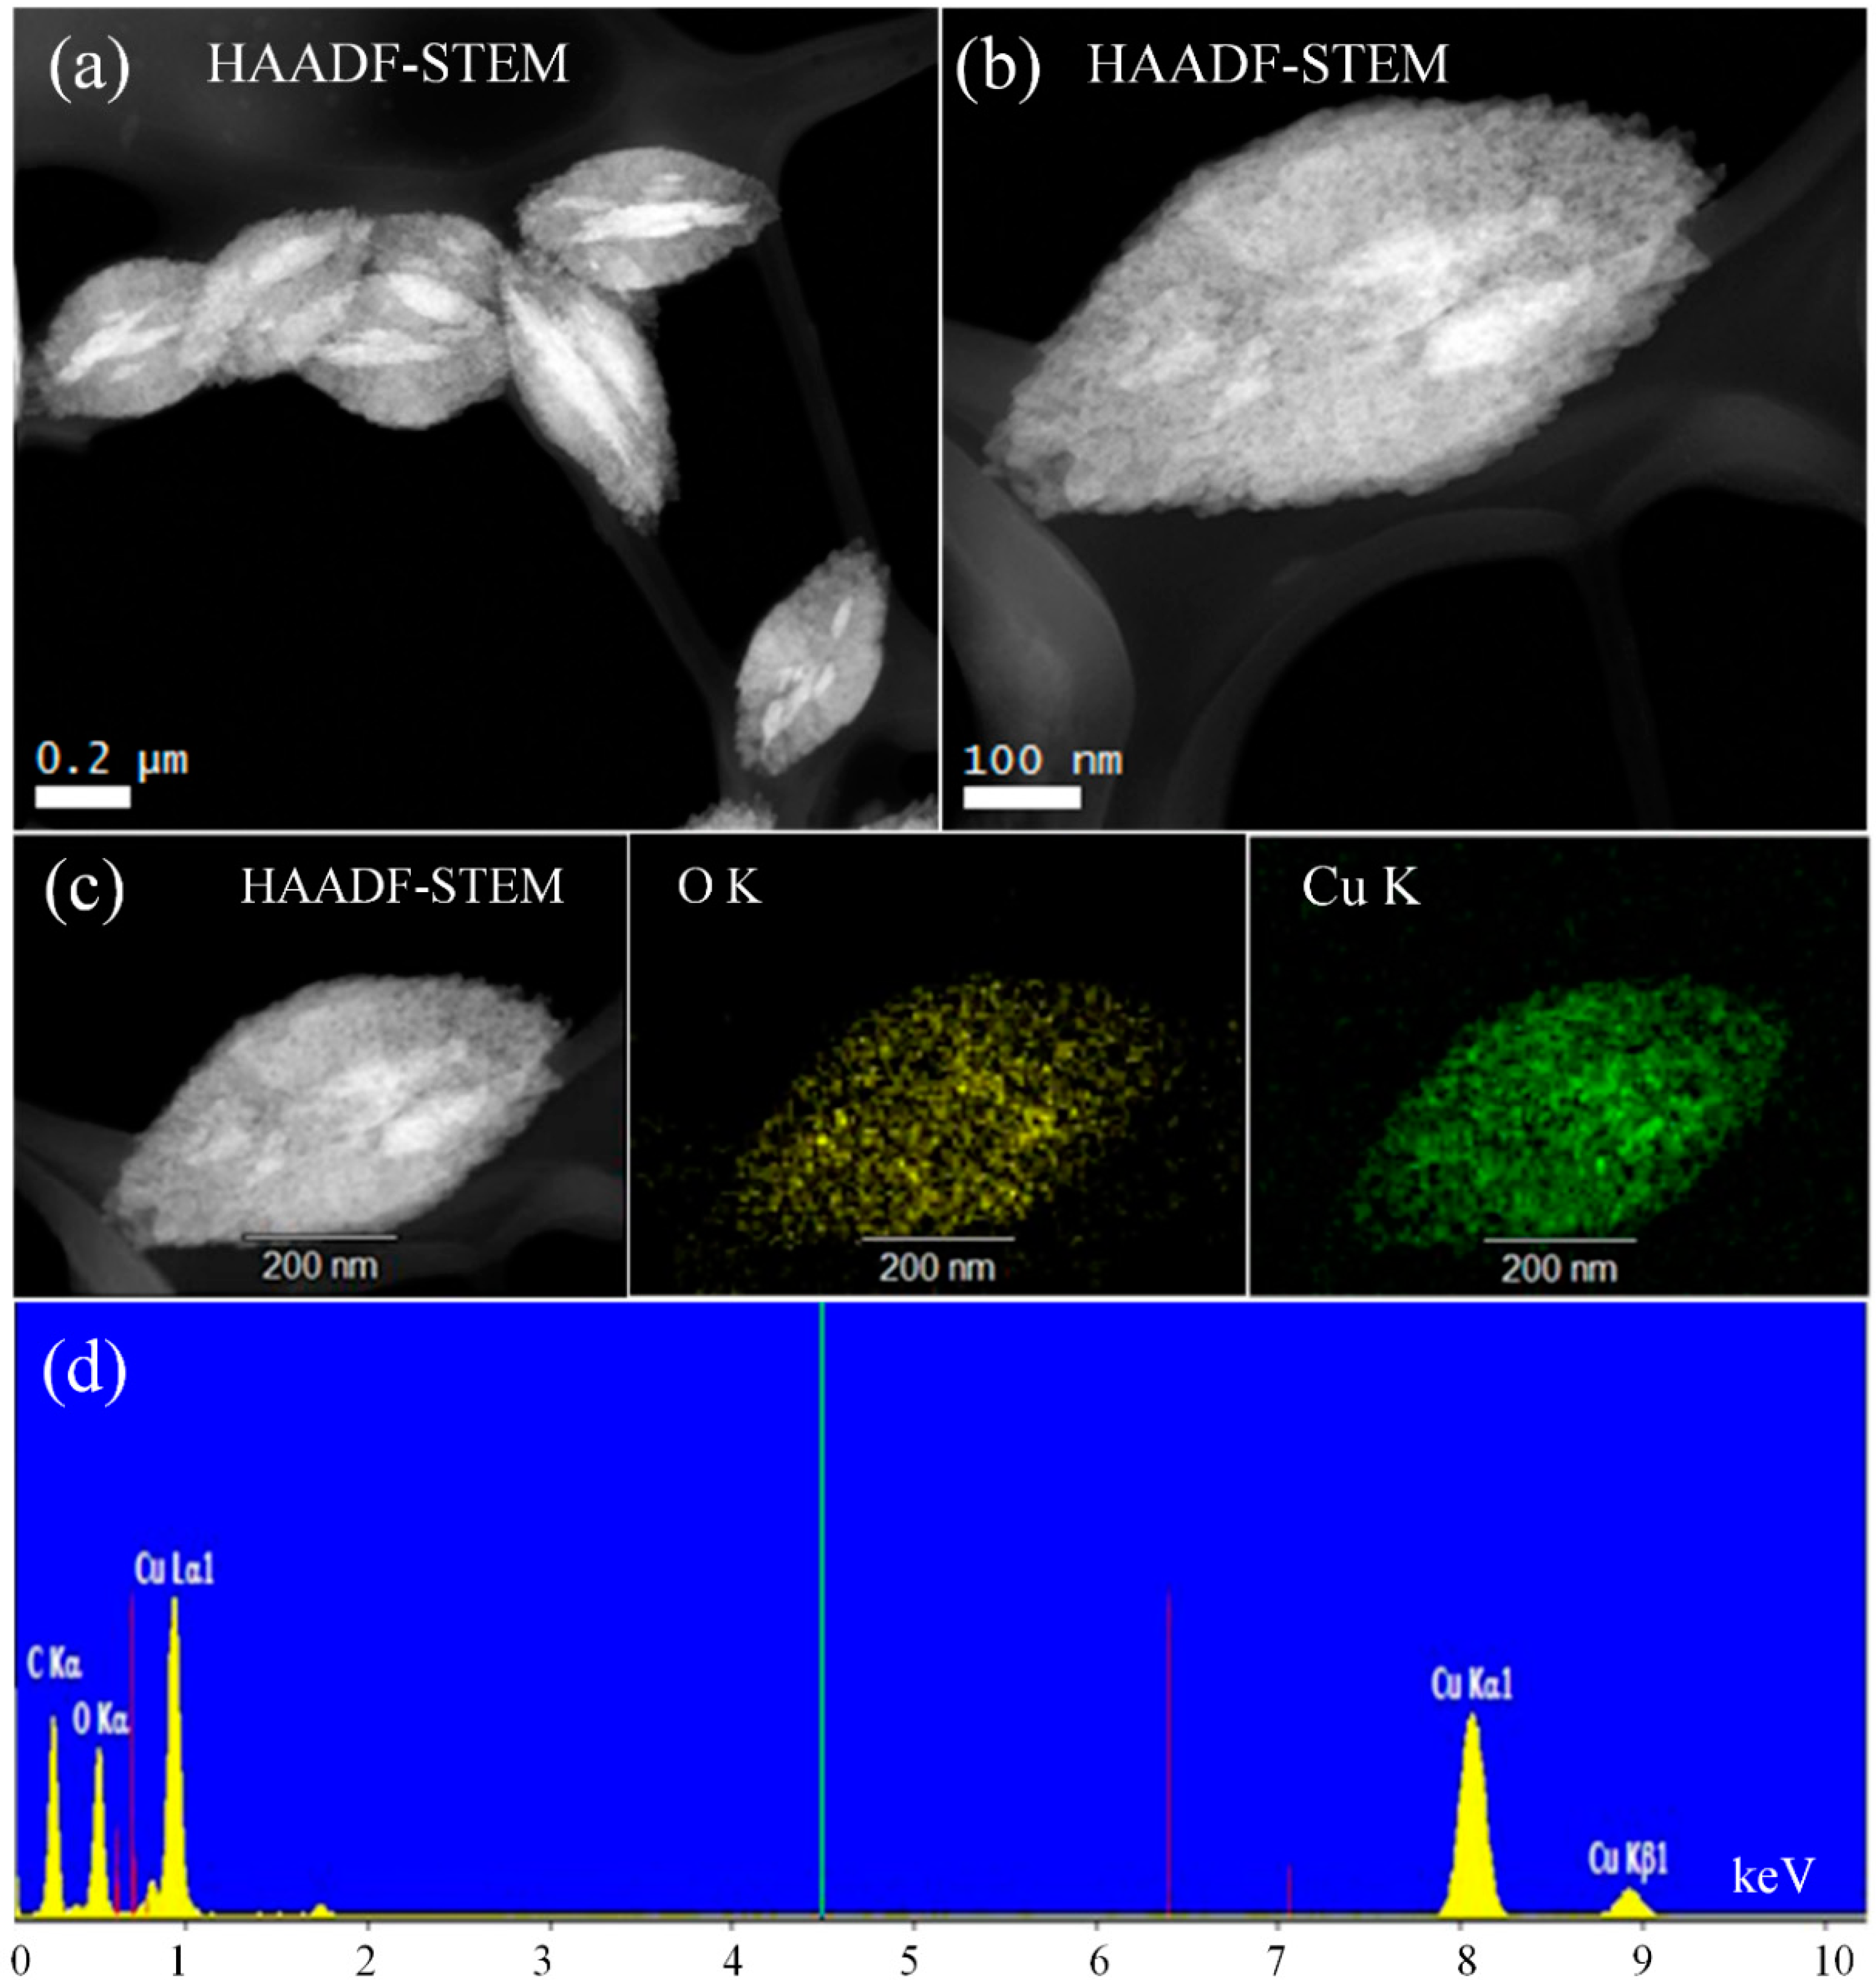
3.6. Advanced STEM Analysis (HAADF-STEM)
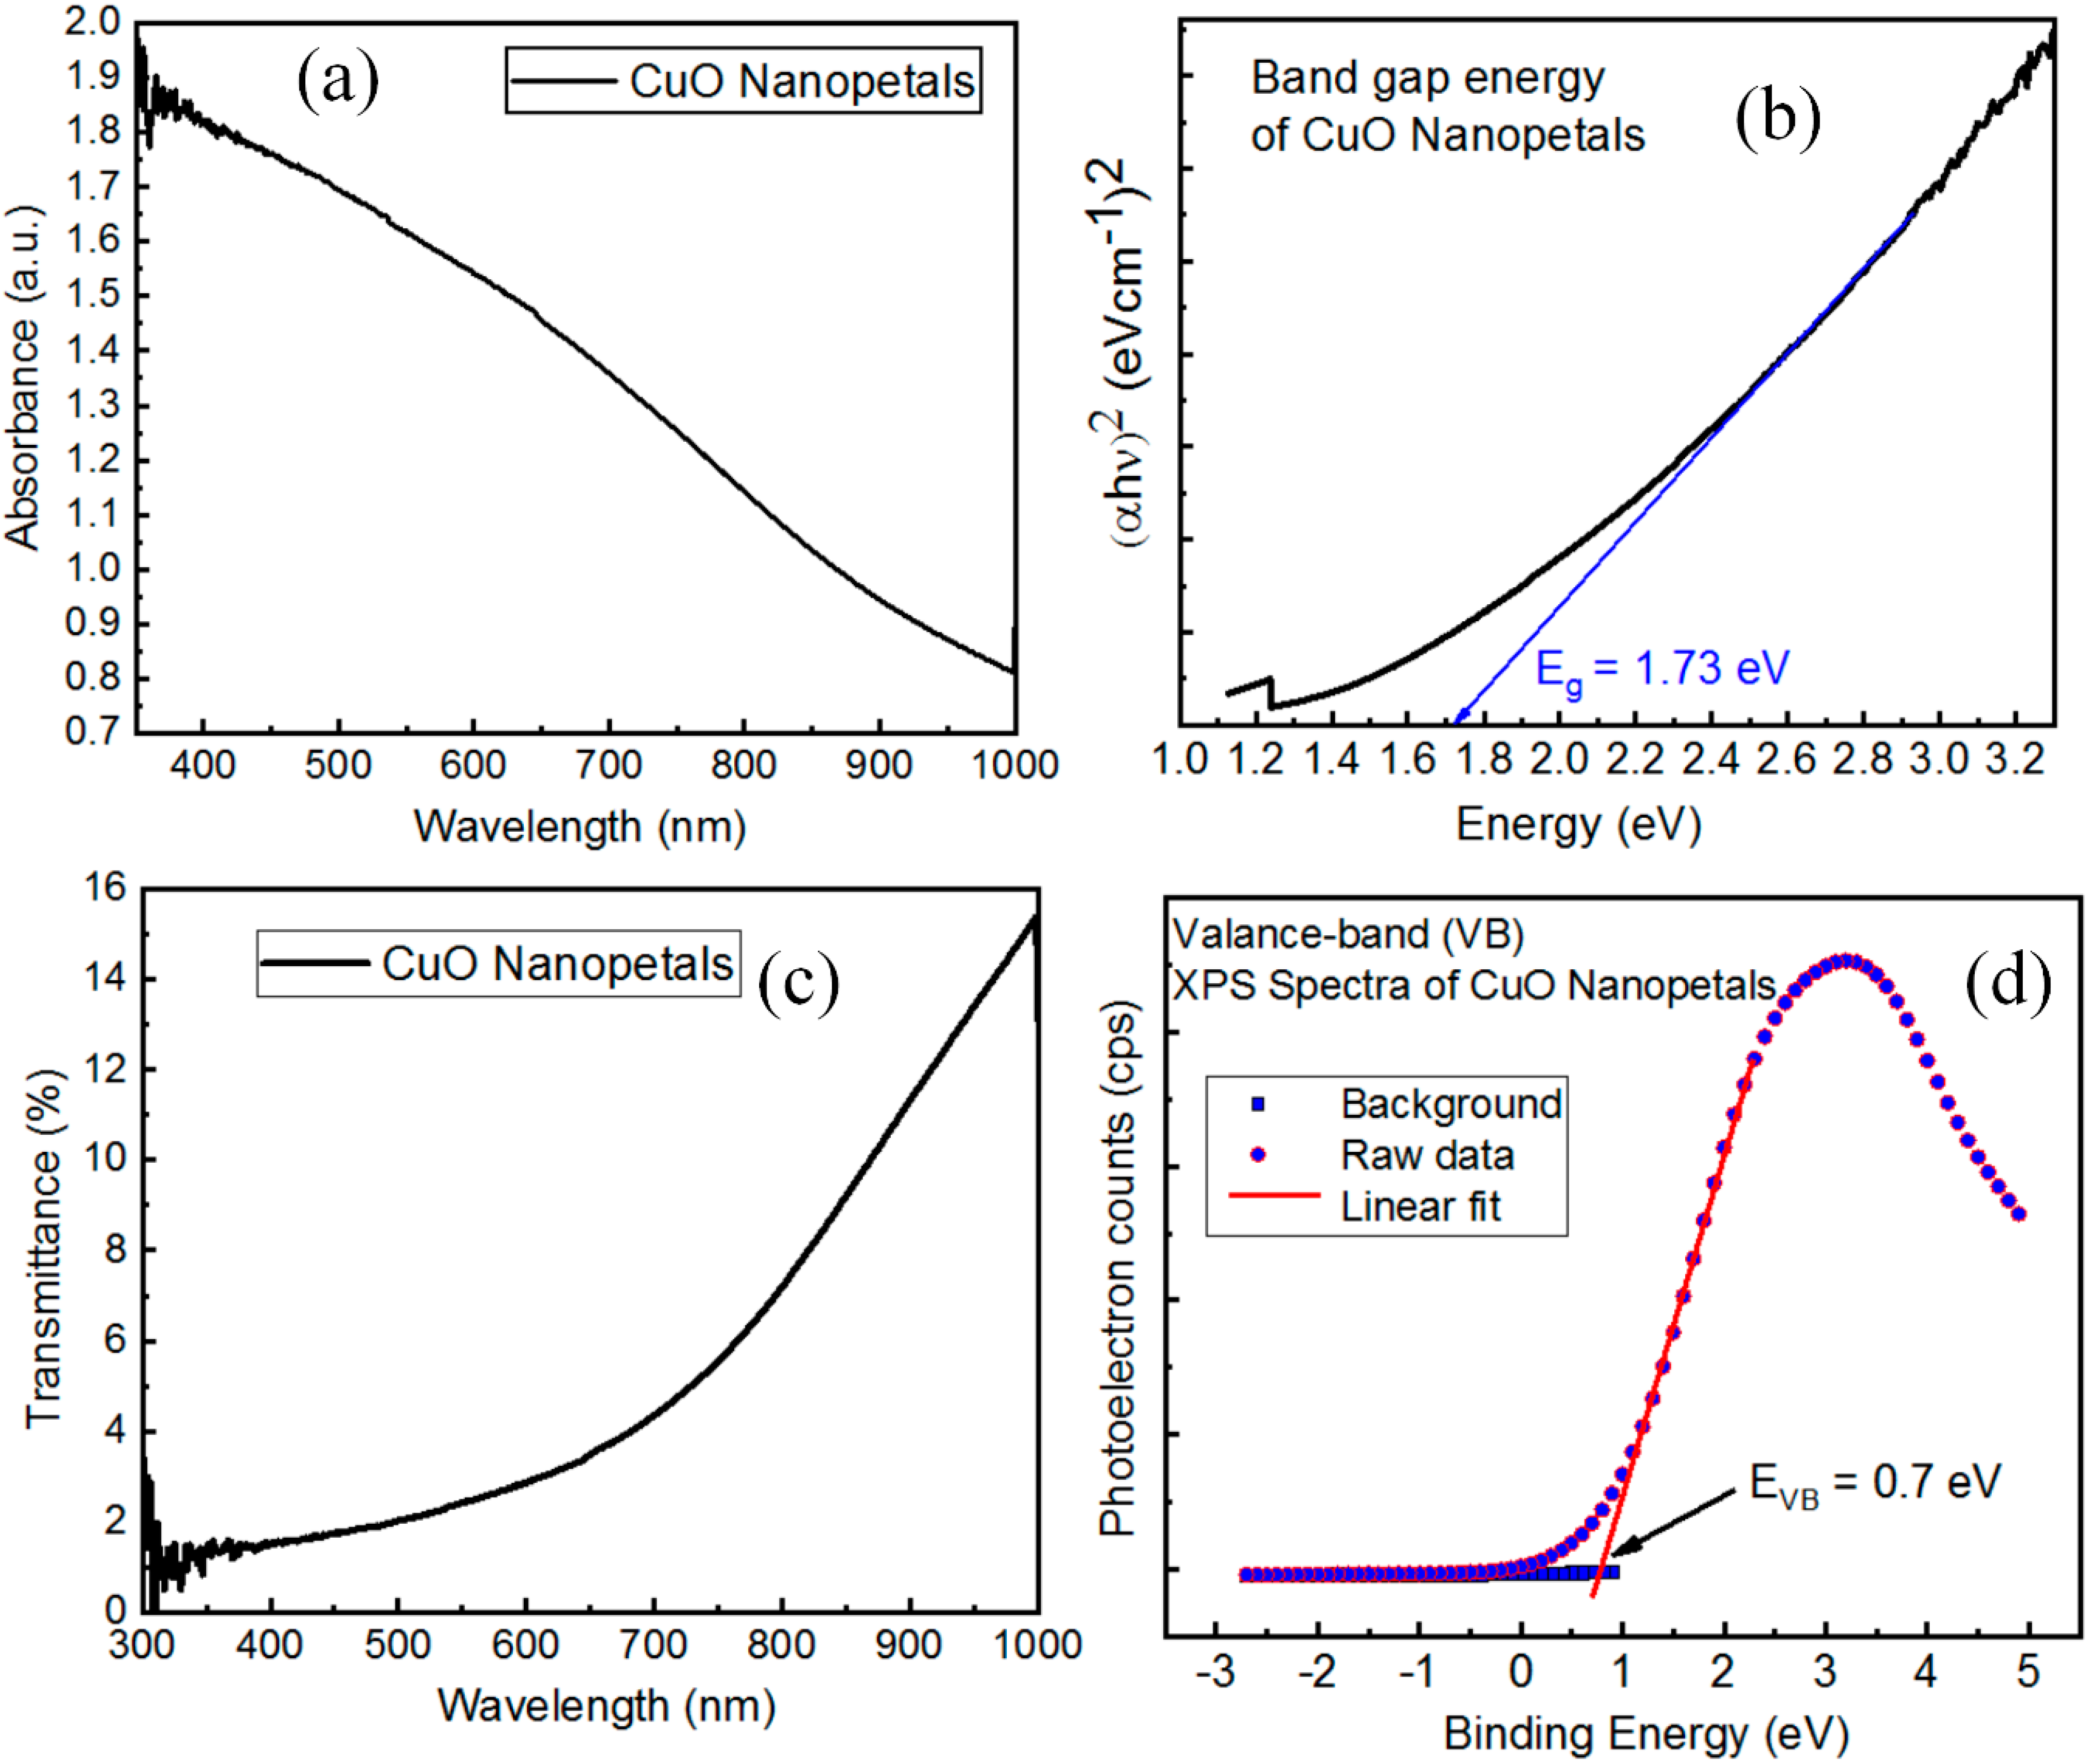
3.7. Optical Properties
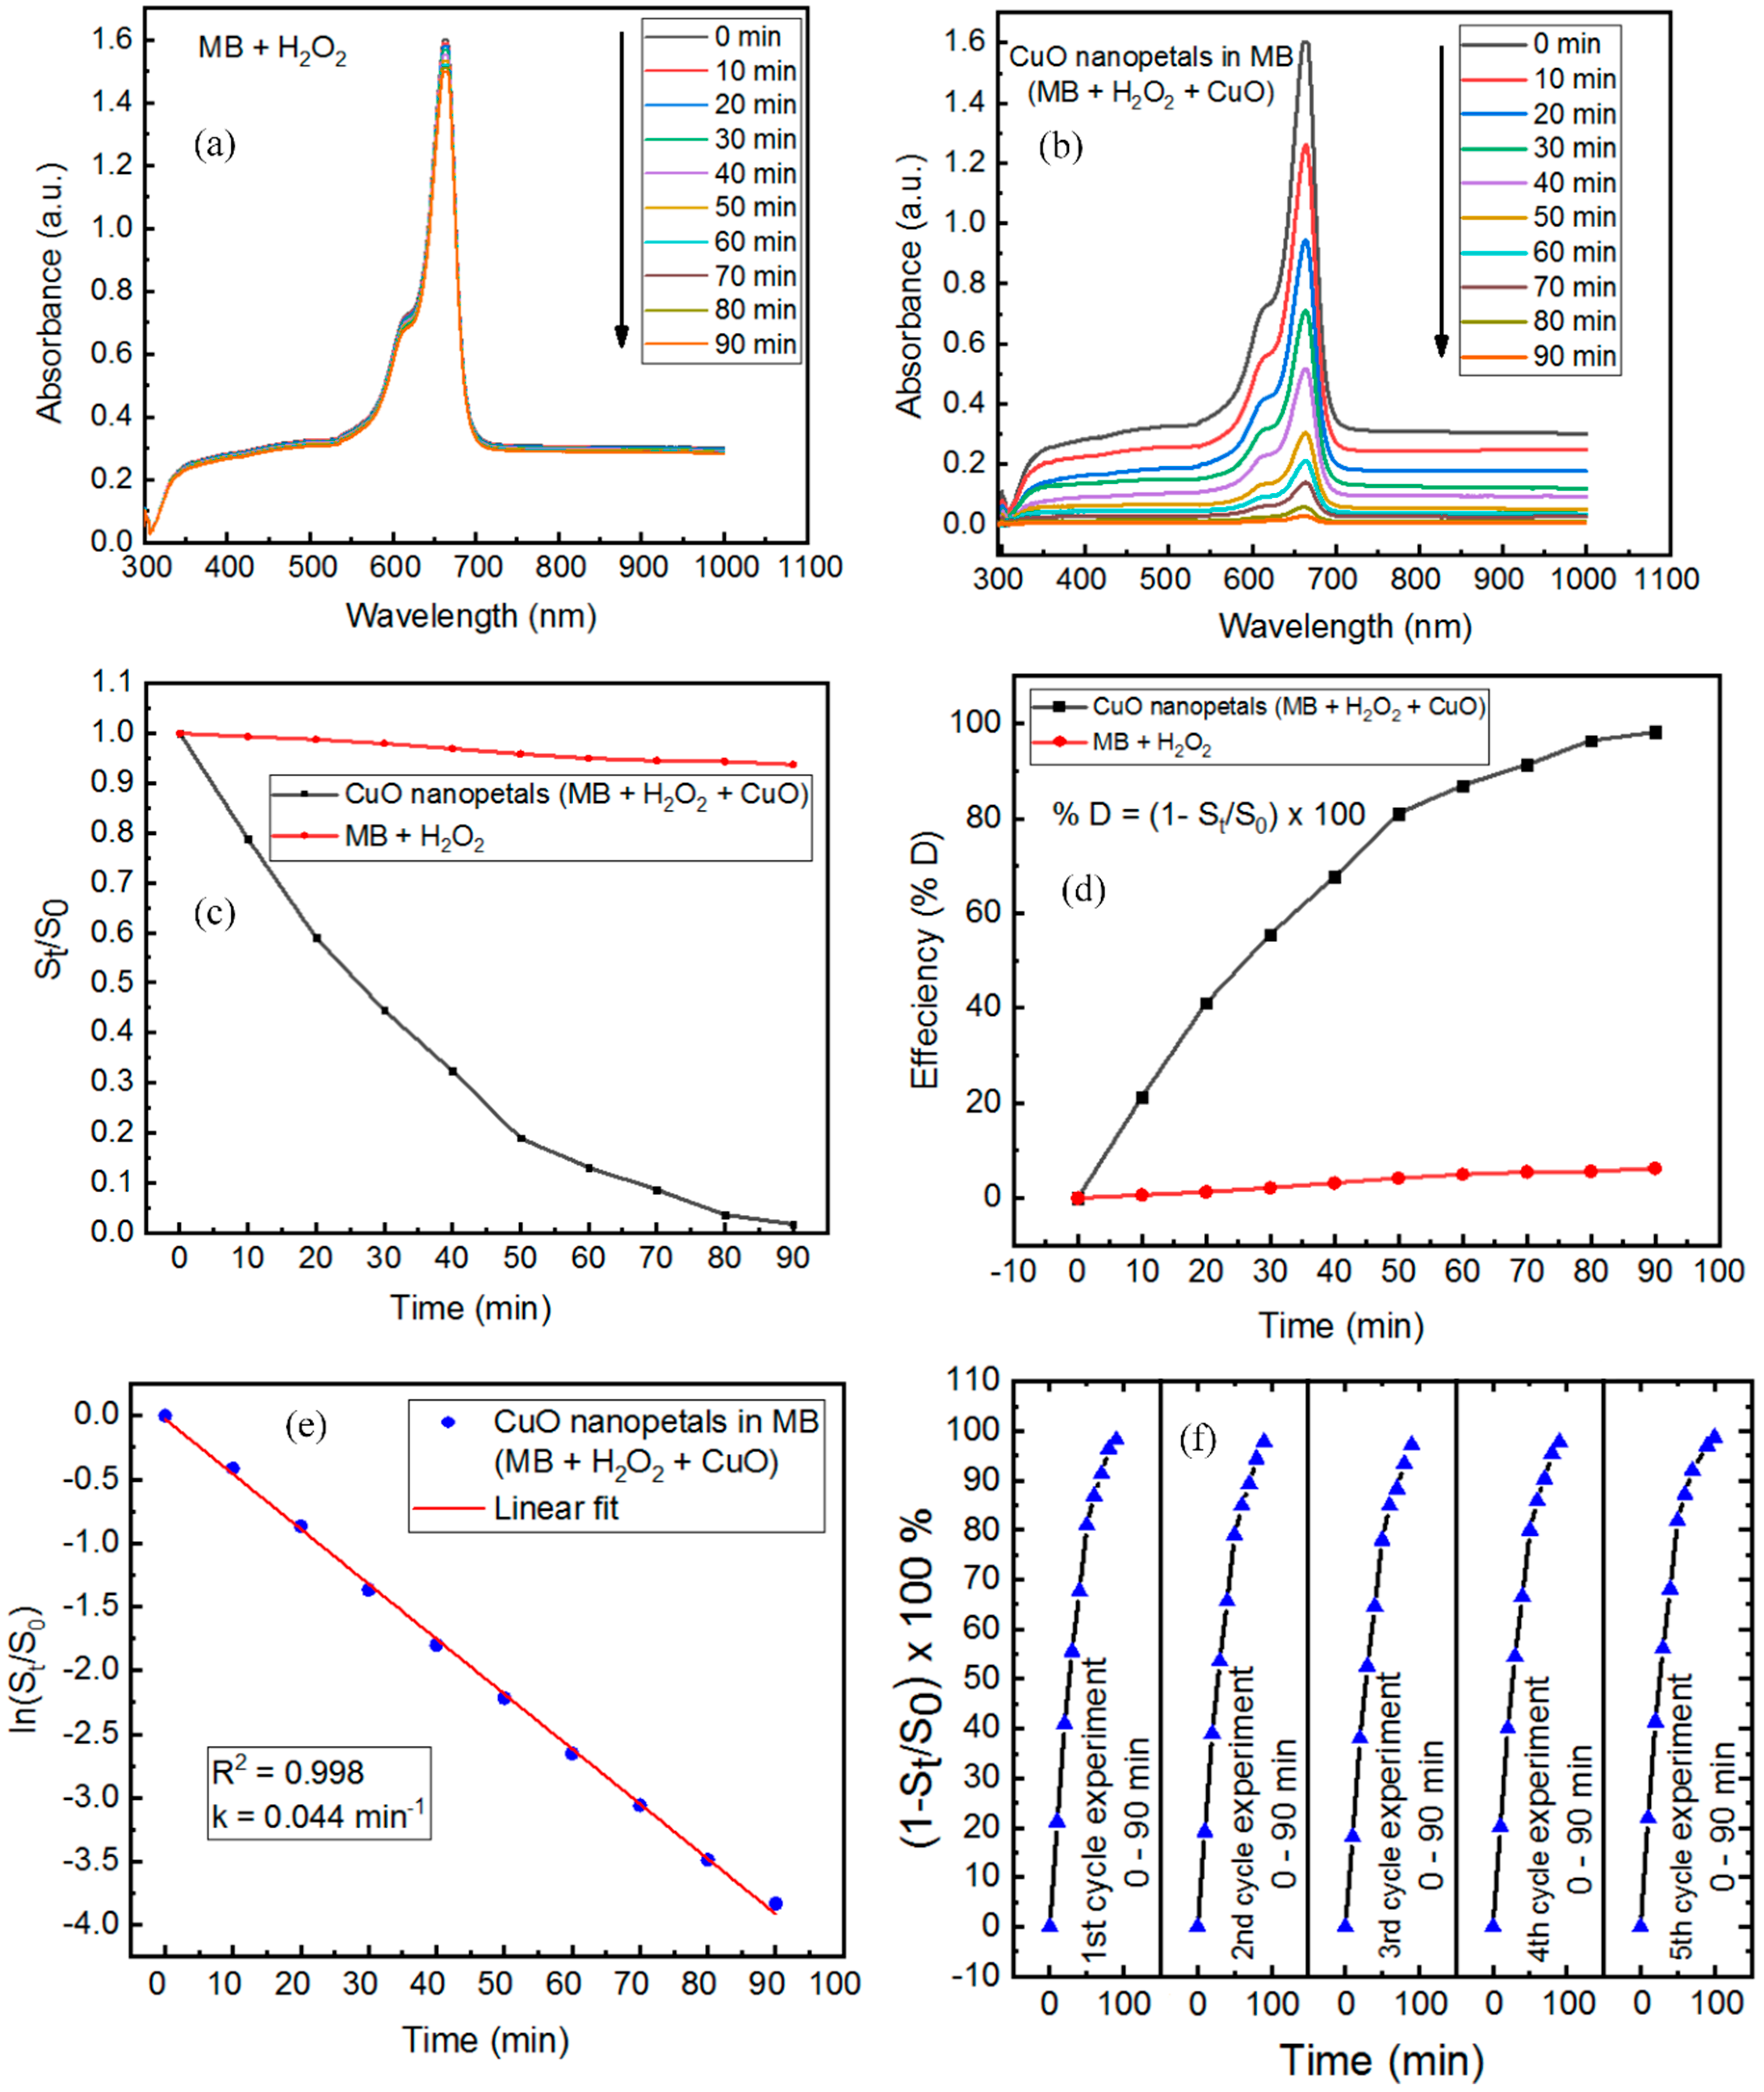
3.8. Catalytic Properties
4. Conclusions
Author Contributions
Funding
Acknowledgments
Conflicts of Interest
References
- Gnanasekaran, L.; Hemamalini, R.; Saravanan, R.; Ravichandran, K.; Gracia, F.; Agarwal, S.; Gupta, V.K. Synthesis and characterization of metal oxides (CeO2, CuO, NiO, Mn3O4, SnO2 and ZnO) nanoparticles as photo catalysts for degradation of textile dyes. J. Photochem. Photobiol. B Biol. 2017, 173, 43–49. [Google Scholar] [CrossRef] [PubMed]
- Kong, C.; Lv, J.; Hu, X.; Zhao, N.; Liu, K.; Zhang, X.; Meng, G.; Yang, Z.; Yang, S. Template-synthesis of hierarchical CuO nanoflowers constructed by ultrathin nanosheets and their application for non-enzymatic glucose detection. Mater. Lett. 2018, 219, 134–137. [Google Scholar] [CrossRef]
- Su, D.; Xie, X.; Dou, S.; Wang, G. CuO single crystal with exposed {001} facets-A highly efficient material for gas sensing and Li-ion battery applications. Sci. Rep. 2014, 4, 1–9. [Google Scholar] [CrossRef] [PubMed]
- Jie, J.; Zhang, W.; Bello, I.; Lee, C.S.; Lee, S.T. One-dimensional II-VI nanostructures: Synthesis, properties and optoelectronic applications. Nano Today 2010, 5, 313–336. [Google Scholar] [CrossRef]
- Chen, D.; Shen, G.; Tang, K.; Qian, Y. Large-scale synthesis of CuO shuttle-like crystals via a convenient hydrothermal decomposition route. J. Cryst. Growth 2003, 254, 225–228. [Google Scholar] [CrossRef]
- Gao, P.; Liu, D. Petal-like CuO nanostructures prepared by a simple wet chemical method, and their application to non-enzymatic amperometric determination of hydrogen peroxide. Microchim. Acta. 2015, 182, 1231–1239. [Google Scholar] [CrossRef]
- Shinde, S.K.; Dubal, D.P.; Ghodake, G.S.; Fulari, V.J. Hierarchical 3D-flower-like CuO nanostructure on copper foil for supercapacitors. RSC Adv. 2014, 5, 4443–4447. [Google Scholar] [CrossRef]
- Lu, Y.; Liu, X.; Qiu, K.; Cheng, J.; Wang, W.; Yan, H.; Tang, C.; Kim, J.K.; Luo, Y. Facile synthesis of graphene-like copper oxide nanofilms with enhanced electrochemical and photocatalytic properties in energy and environmental applications. ACS Appl. Mater. Interfaces 2015, 7, 9682–9690. [Google Scholar] [CrossRef]
- Zedan, A.F.; Mohamed, A.T.; El-Shall, M.S.; Alqaradawi, S.Y.; Aljaber, A.S. Tailoring the reducibility and catalytic activity of CuO nanoparticles for low temperature CO oxidation. RSC Adv. 2018, 8, 19499–19511. [Google Scholar] [CrossRef]
- Reddy, N.L.; Emin, S.; Kumari, V.D.; Muthukonda Venkatakrishnan, S. CuO Quantum Dots Decorated TiO2 Nanocomposite Photocatalyst for Stable Hydrogen Generation. Ind. Eng. Chem. Res. 2018, 57, 568–577. [Google Scholar] [CrossRef]
- Khan, M.A.; Wahab, Y.; Muhammad, R.; Tahir, M.; Sakrani, S. Catalyst-free fabrication of novel ZnO/CuO core-Shell nanowires heterojunction: Controlled growth, structural and optoelectronic properties. Appl. Surf. Sci. 2018, 435, 718–732. [Google Scholar] [CrossRef]
- Daneshvar, F.; Aziz, A.; Abdelkader, A.M.; Zhang, T.; Sue, H.J.; Welland, M.E. Porous SnO2-CuxO nanocomposite thin film on carbon nanotubes as electrodes for high performance supercapacitors. Nanotechnology 2018, 30, 1–22. [Google Scholar]
- Vaidehi, D.; Bhuvaneshwari, V.; Bharathi, D.; Sheetal, B.P. Antibacterial and photocatalytic activity of copper oxide nanoparticles synthesized using Solanum lycopersicum leaf extract. Mater. Res. Express 2018, 5, 1–27. [Google Scholar] [CrossRef]
- Hao, W.; Mi, Y. A Direct Carbon Fuel Cell with a CuO-ZnO-SDC Composite Anode. RSC Adv. 2016, 6, 50201–50208. [Google Scholar] [CrossRef]
- Filipič, G.; Cvelbar, U. Copper oxide nanowires: A review of growth. Nanotechnology 2012, 23, 194001. [Google Scholar] [CrossRef]
- Xu, X.; Yang, H.; Liu, Y. Self-assembled structures of CuO primary crystals synthesized from Cu(CH3COO)2-NaOH aqueous systems. CrystEngComm 2012, 14, 5289–5298. [Google Scholar] [CrossRef]
- Jung, S.; Jeon, S.; Yong, K. Fabrication and characterization of flower-like CuO-ZnO heterostructure nanowire arrays by photochemical deposition. Nanotechnology 2011, 22, 1–9. [Google Scholar] [CrossRef]
- Zhu, J.; Bi, H.; Wang, Y.; Wang, X.; Yang, X.; Lu, L. CuO nanocrystals with controllable shapes grown from solution without any surfactants. Mater. Chem. Phys. 2008, 109, 34–38. [Google Scholar] [CrossRef]
- Anandan, S.; Lee, G.J.; Wu, J.J. Sonochemical synthesis of CuO nanostructures with different morphology. Ultrason. Sonochem. 2012, 19, 682–686. [Google Scholar] [CrossRef]
- Tran, T.H.; Nguyen, V.T. Copper Oxide Nanomaterials Prepared by Solution Methods, Some Properties, and Potential Applications: A Brief Review. Int. Sch. Res. Not. 2014, 13, 1–14. [Google Scholar] [CrossRef]
- Wu, S.; Zhang, Z.; Lan, M.; Yang, S.; Cheng, J.; Cai, J.; Shen, J.; Zhu, Y.; Zhang, K.; Zhang, W. Lithiophilic Cu-CuO-Ni Hybrid Structure: Advanced Current Collectors toward Stable Lithium Metal Anodes. Adv. Mater. 2018, 30, 1–7. [Google Scholar] [CrossRef] [PubMed]
- Nishino, F.; Jeem, M.; Zhang, L.; Okamoto, K.; Okabe, S.; Watanabe, S. Formation of CuO nano-flowered surfaces via submerged photo-synthesis of crystallites and their antimicrobial activity. Sci. Rep. 2017, 7, 1–11. [Google Scholar] [CrossRef] [PubMed]
- Willander, M.; ul Hasan, K.; Nur, O.; Zainelabdin, A.; Zaman, S.; Amin, G. Recent progress on growth and device development of ZnO and CuO nanostructures and graphene nanosheets. J. Mater. Chem. 2012, 22, 2337. [Google Scholar] [CrossRef]
- Volanti, D.P.; Orlandi, M.O.; Andres, J.; Longo, E. Efficient microwave-assisted hydrothermal synthesis of CuO sea urchin-like architectures via a mesoscale self-assembly. CrystEngComm 2010, 12, 1696–1699. [Google Scholar] [CrossRef]
- Dar, M.A.; Ahsanulhaq, Q.; Kim, Y.S.; Sohn, J.M.; Kim, W.B.; Shin, H.S. Versatile synthesis of rectangular shaped nanobat-like CuO nanostructures by hydrothermal method; structural properties and growth mechanism. Appl. Surf. Sci. 2009, 255, 6279–6284. [Google Scholar] [CrossRef]
- Wang, X.; Xi, G.; Xiong, S.; Liu, Y.; Xi, B.; Yu, W.; Qian, Y. Solution-Phase Synthesis of Single-Crystal CuO Nanoribbons and Nanorings. Cryst. Growth Des. 2007, 7, 930–934. [Google Scholar] [CrossRef]
- Zhou, K.; Wang, R.; Xu, B.; Li, Y. Synthesis, characterization and catalytic properties of CuO nanocrystals with various shapes. Nanotechnology 2006, 17, 3939–3943. [Google Scholar] [CrossRef]
- Inchaurrondo, N.S.; Massa, P.; Fenoglio, R.; Font, J.; Haure, P. Efficient catalytic wet peroxide oxidation of phenol at moderate temperature using a high-load supported copper catalyst. Chem. Eng. J. 2012, 198–199, 426–434. [Google Scholar] [CrossRef]
- Bradu, C.; Frunza, L.; Mihalche, N.; Avramescu, S.M.; Neaţǎ, M.; Udrea, I. Removal of Reactive Black 5 azo dye from aqueous solutions by catalytic oxidation using CuO/Al2O3 and NiO/Al2O3. Appl. Catal. B Environ. 2010, 96, 548–556. [Google Scholar] [CrossRef]
- Yang, M.; He, J. Fine tuning of the morphology of copper oxide nanostructures and their application in ambient degradation of methylene blue. J. Colloid Interface Sci. 2011, 355, 15–22. [Google Scholar] [CrossRef]
- Srivastava, R.; Anu Prathap, M.U.; Kore, R. Morphologically controlled synthesis of copper oxides and their catalytic applications in the synthesis of propargylamine and oxidative degradation of methylene blue. Colloids Surf. A Physicochem. Eng. Asp. 2011, 392, 271–282. [Google Scholar] [CrossRef]
- Vaseem, M.; Umar, A.; Kim, S.H.; Hahn, Y.B. Low-Temperature Synthesis of Flower-Shaped CuO Nanostructures by Solution Process: Formation Mechanism and Structural Properties. J. Phys. Chem. C 2008, 112, 5729–5735. [Google Scholar] [CrossRef]
- Molazemhosseini, A.; Magagnin, L.; Vena, P.; Liu, C.C. Single-Use Nonenzymatic Glucose Biosensor Based on CuO Nanoparticles Ink Printed on Thin Film Gold Electrode by Micro-Plotter Technology. J. Electroanal. Chem. 2017, 789, 50–57. [Google Scholar] [CrossRef]
- Vaseem, M.; Hong, A.R.; Kim, R.T.; Hahn, Y.B. Copper Oxide Quantum Dot Ink for Inkjet-Driven Digitally Controlled High Mobility Field Effect Transistors. J. Mater. Chem. C 2013, 1, 2112–2120. [Google Scholar] [CrossRef]
- Yu, T.; Zhao, X.; Shen, Z.X.; Wu, Y.H.; Su, W.H. Investigation of individual CuO nanorods by polarized micro-Raman scattering. J. Cryst. Growth 2004, 268, 590–595. [Google Scholar] [CrossRef]
- Lu, Y.; Yan, H.; Qiu, K.; Cheng, J.; Wang, W.; Liu, X.; Tang, C.; Kim, J.K.; Luo, Y. Hierarchical porous CuO nanostructures with tunable properties for high performance supercapacitors. RSC Adv. 2015, 5, 10773–10781. [Google Scholar] [CrossRef]
- Zoolfakar, A.S.; Rani, R.A.; Morfa, A.J.; Mullane, A.P.O.; Kalantar-Zadeh, K. Nanostructured copper oxide semiconductors: A perspective on materials, synthesis methods and applications. J. Mater. Chem. C 2014, 2, 5247–5270. [Google Scholar] [CrossRef]
- Debbichi, L.; Marco De Lucas, M.C.; Pierson, J.F.; Krüger, P. Vibrational properties of CuO and Cu4O3 from first-principles calculations, and Raman and infrared spectroscopy. J. Phys. Chem. C 2012, 116, 10232–10237. [Google Scholar] [CrossRef]
- Nie, J.F. Applications of atomic-resolution HAADF-STEM and EDS-STEM characterization of light alloys. IOP Conf. Ser. Mater. Sci. Eng. 2017, 219, 012005. [Google Scholar] [CrossRef]
- Yamazaki, T.; Nakanishi, N.; Rečnik, A.; Kawasaki, M.; Watanabe, K.; Čeh, M.; Shiojiri, M. Quantitative high-resolution HAADF-STEM analysis of inversion boundaries in Sb2O3-doped zinc oxide. Ultramicroscopy 2004, 98, 305–316. [Google Scholar] [CrossRef]
- Wu, Y.; Wang, H.; Tu, W.; Wu, S.; Chew, J.W. Effects of composition faults in ternary metal chalcogenides (ZnxIn2S3+x, x = 1–5) layered crystals for visible-light-driven catalytic hydrogen generation and carbon dioxide reduction. Appl. Catal. B Environ. 2019, 256, 117810. [Google Scholar] [CrossRef]
- Tahir, M. Well-designed ZnFe2O4/Ag/TiO2 nanorods heterojunction with Ag as electron mediator for photocatalytic CO2 reduction to fuels under UV/visible light. J. CO2 Util. 2020, 37, 134–146. [Google Scholar] [CrossRef]
- Sreeju, N.; Rufus, A.; Philip, D. Studies on catalytic degradation of organic pollutants and anti-bacterial property using biosynthesized CuO nanostructures. J. Mol. Liq. 2017, 242, 690–700. [Google Scholar] [CrossRef]
- Fendi, W.J.; Naser, J.A. Adsorption Isotherms Study of Methylene Blue Dye on Membranes from Electrospun Nanofibers. Orient. J. Chem. 2018, 34, 2884–2894. [Google Scholar] [CrossRef]
- Lakhotiya, G.; Bajaj, S.; Nayak, A.K.; Pradhan, D.; Tekade, P.; Rana, A. Enhanced catalytic activity without the use of an external light source using microwave-synthesized CuO nanopetals. Beilstein J. Nanotechnol. 2017, 8, 1167–1173. [Google Scholar] [CrossRef] [PubMed]
- Zaman, S.; Zainelabdin, A.; Amin, G.; Nur, O.; Willander, M. Efficient catalytic effect of CuO nanostructures on the degradation of organic dyes. J. Phys. Chem. Solids 2012, 73, 1320–1325. [Google Scholar] [CrossRef]
- Liao, J.; Li, H.; Zhang, X.; Xiao, D. Copper oxide nanoplatelets and nanoflowers: Facile synthesis and catalytic activity in oxidative degradation of methylene blue. Micro Nano Lett. 2014, 9, 432–436. [Google Scholar] [CrossRef]


| S. No | Catalysts | Method | Band Gap (eV) | Degradation Efficiency | K (Rate Constant) | Ref. | |
|---|---|---|---|---|---|---|---|
| 1 | CuO (plate-like) | Hydrothermal | 1.45 | 97.2% | 0.998 | 0.00377 min−1 | [30] |
| 2 | CuO (flower) | Hydrothermal | 1.43 | 96.0% | ......... | 0.00320 min−1 | [30] |
| 3 | CuO (petal) | Hydrothermal | ......... | 95% | 0.993 | 0.00192 min−1 | [46] |
| 4 | CuO (flower) | Hydrothermal | ......... | 72% | .......... | 0.000867 min−1 | [46] |
| 5 | CuO (nanoplatelets) | Hydrothermal | ......... | .......... | .......... | 0.00471 min−1 | [47] |
| 6 | CuO (flower) | Hydrothermal | ......... | .......... | .......... | 0.00836 min−1 | [47] |
| 7 | CuO (petal) | Hydrothermal | 1.73 | 99.3% | 0.998 | 0.044 min−1 | Present |
© 2020 by the authors. Licensee MDPI, Basel, Switzerland. This article is an open access article distributed under the terms and conditions of the Creative Commons Attribution (CC BY) license (http://creativecommons.org/licenses/by/4.0/).
Share and Cite
Khan, M.A.; Nayan, N.; Shadiullah; Ahmad, M.K.; Soon, C.F. Surface Study of CuO Nanopetals by Advanced Nanocharacterization Techniques with Enhanced Optical and Catalytic Properties. Nanomaterials 2020, 10, 1298. https://doi.org/10.3390/nano10071298
Khan MA, Nayan N, Shadiullah, Ahmad MK, Soon CF. Surface Study of CuO Nanopetals by Advanced Nanocharacterization Techniques with Enhanced Optical and Catalytic Properties. Nanomaterials. 2020; 10(7):1298. https://doi.org/10.3390/nano10071298
Chicago/Turabian StyleKhan, Muhammad Arif, Nafarizal Nayan, Shadiullah, Mohd Khairul Ahmad, and Chin Fhong Soon. 2020. "Surface Study of CuO Nanopetals by Advanced Nanocharacterization Techniques with Enhanced Optical and Catalytic Properties" Nanomaterials 10, no. 7: 1298. https://doi.org/10.3390/nano10071298
APA StyleKhan, M. A., Nayan, N., Shadiullah, Ahmad, M. K., & Soon, C. F. (2020). Surface Study of CuO Nanopetals by Advanced Nanocharacterization Techniques with Enhanced Optical and Catalytic Properties. Nanomaterials, 10(7), 1298. https://doi.org/10.3390/nano10071298