Seed-Assisted Growth of TiO2 Nanowires by Thermal Oxidation for Chemical Gas Sensing


 ,
, 
Abstract
1. Introduction
2. Materials and Methods
3. Results
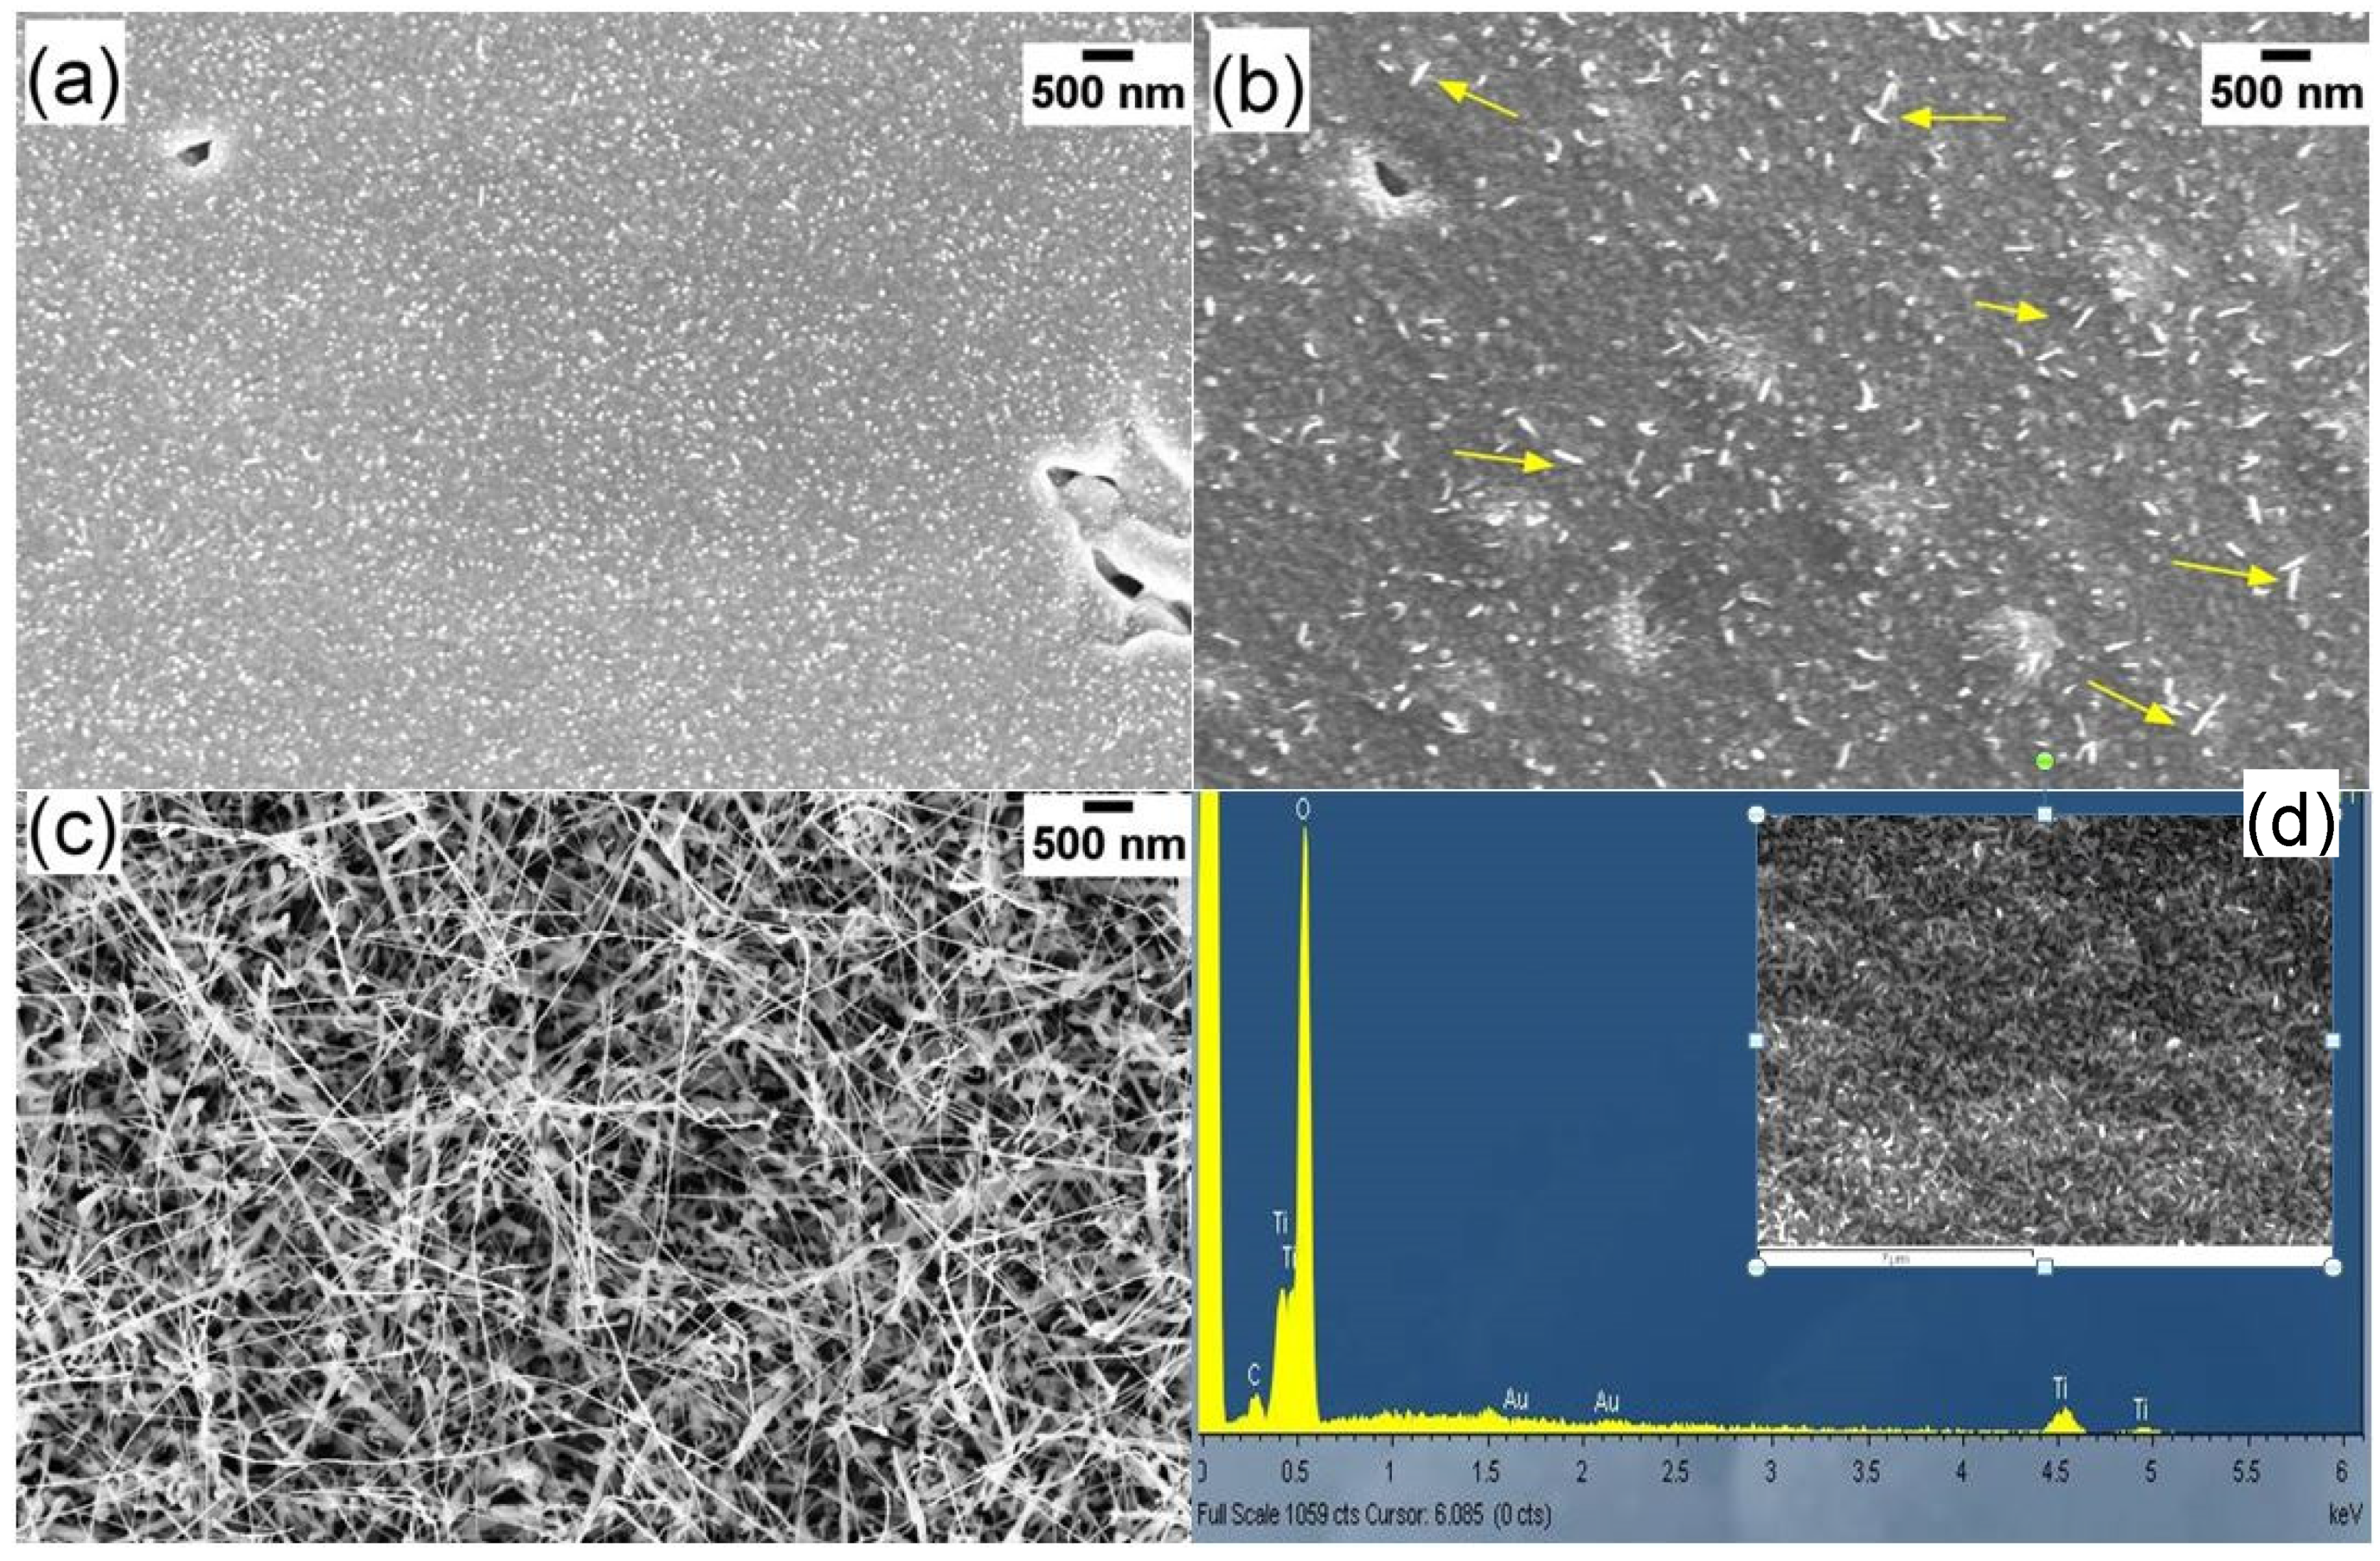
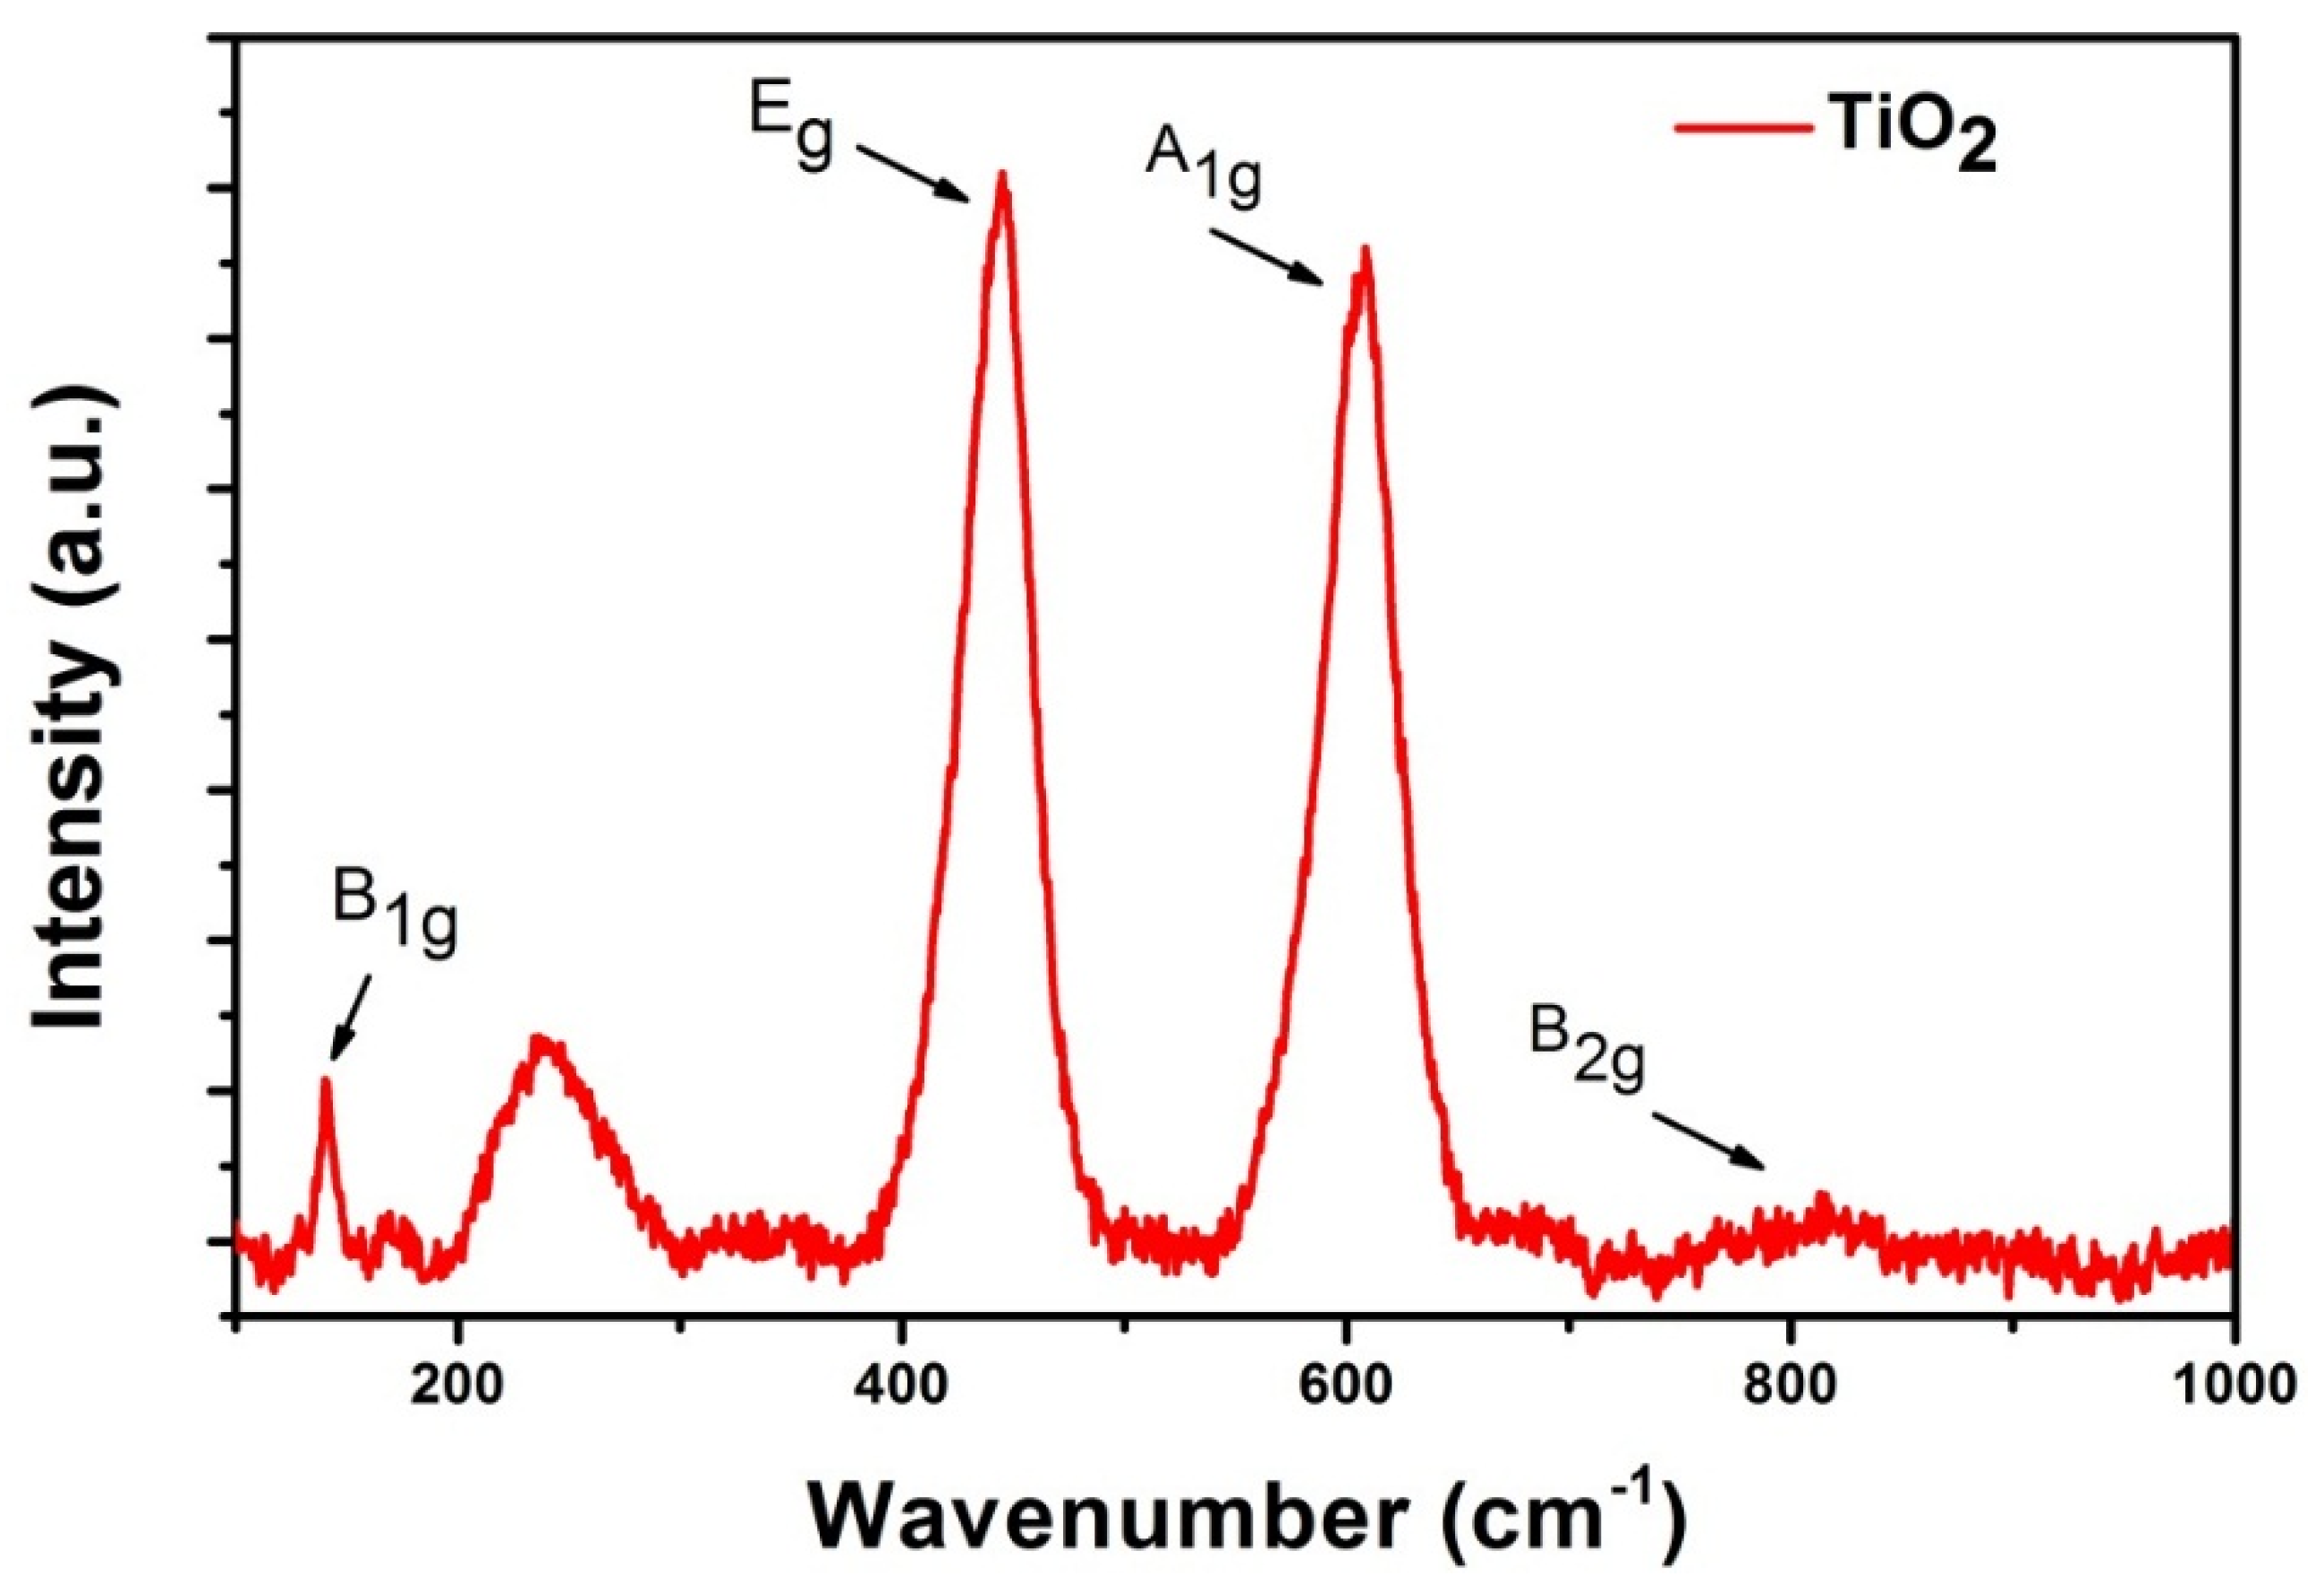
3.1. Morphological and Structural Characterization
3.2. Growth Mechanism
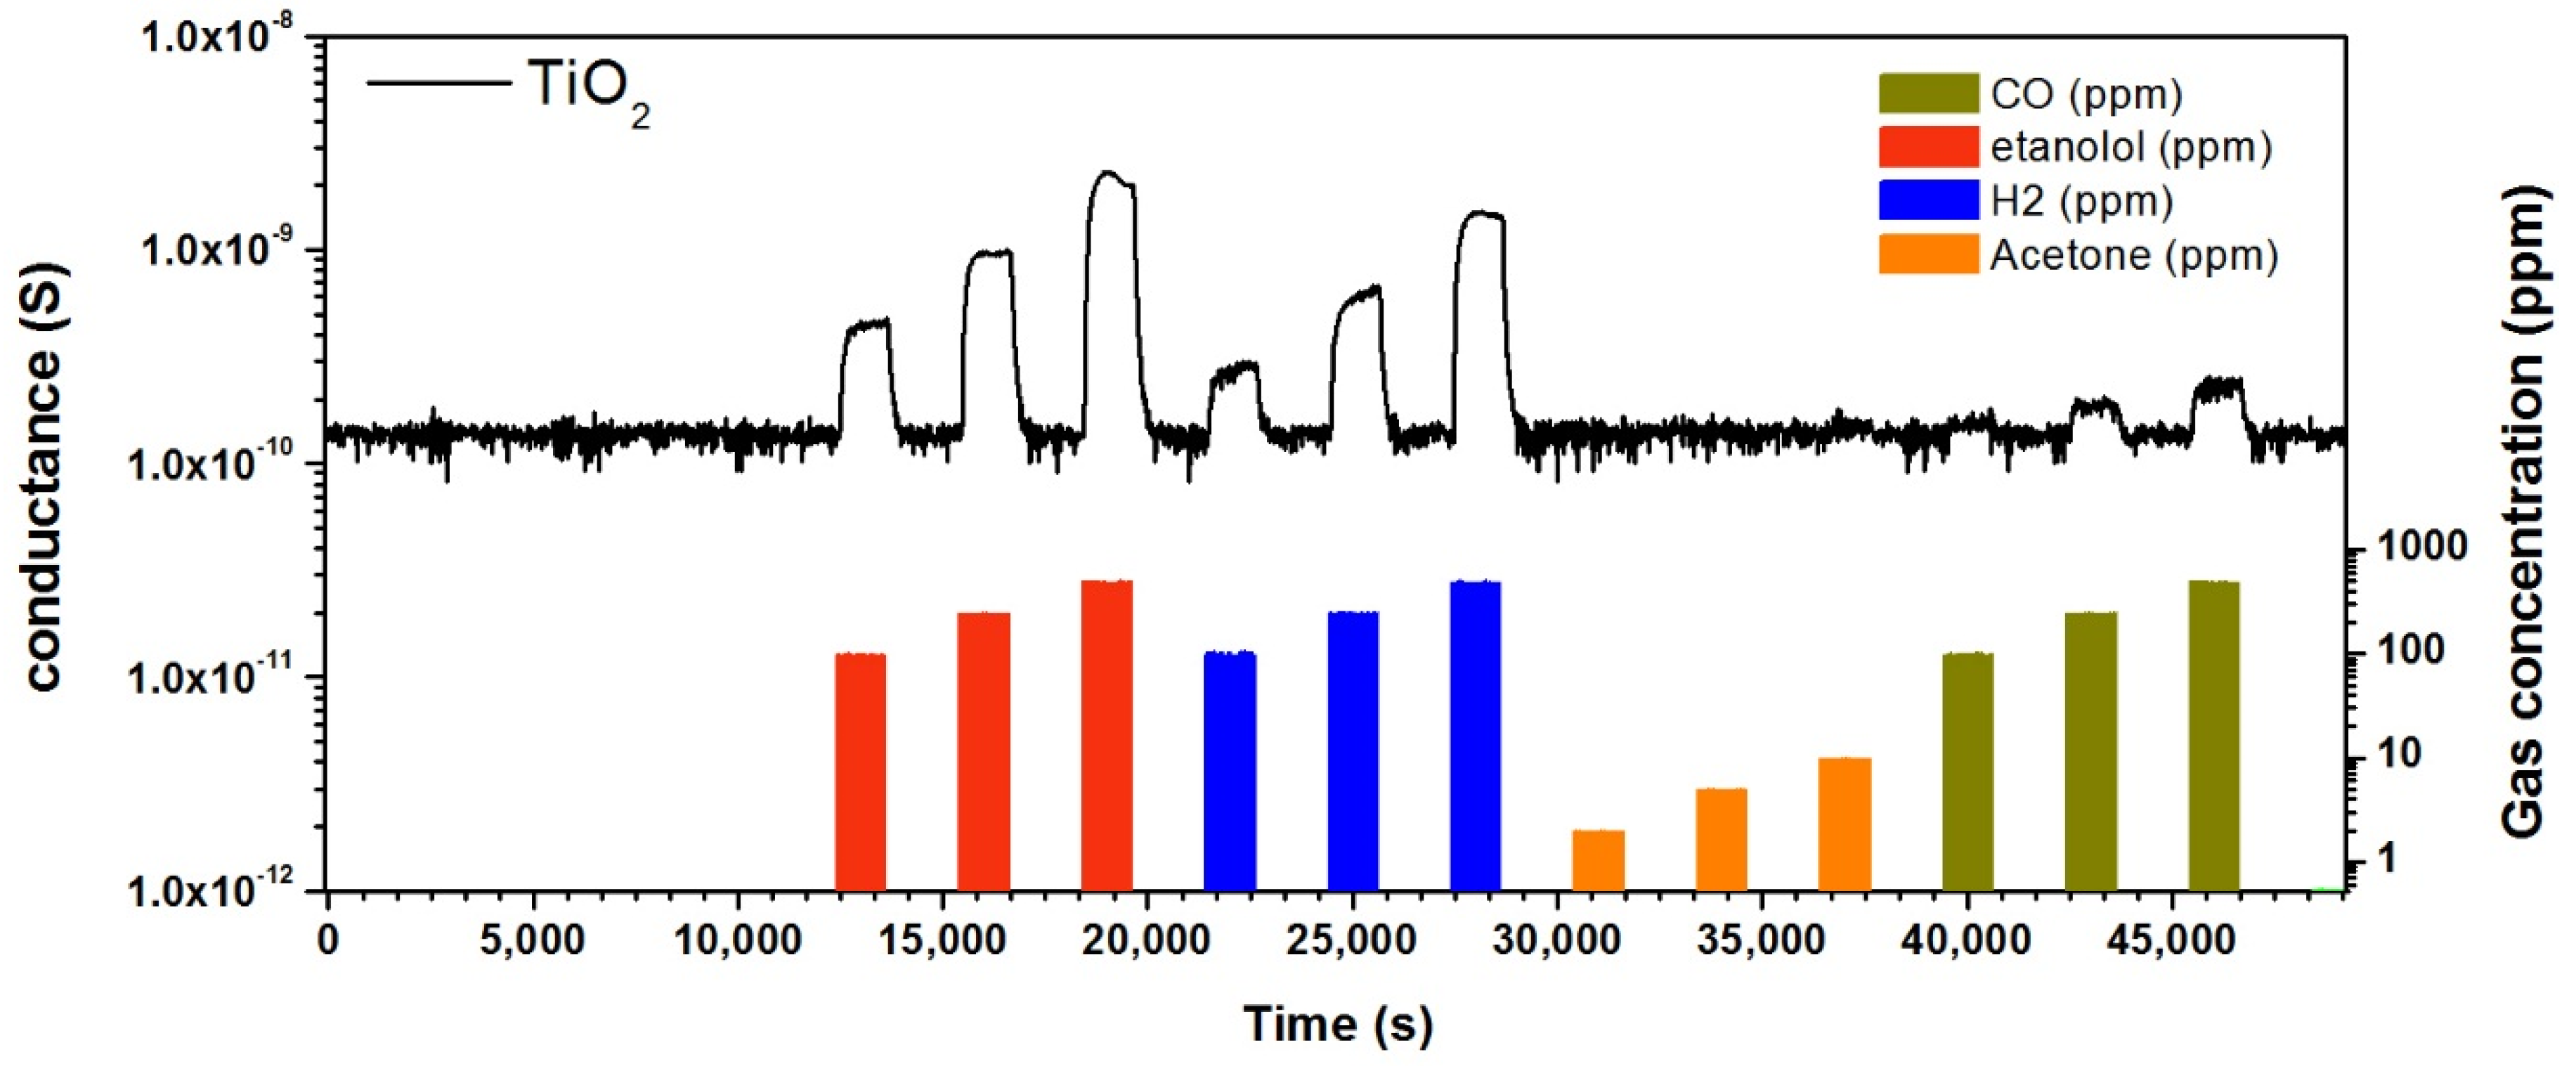
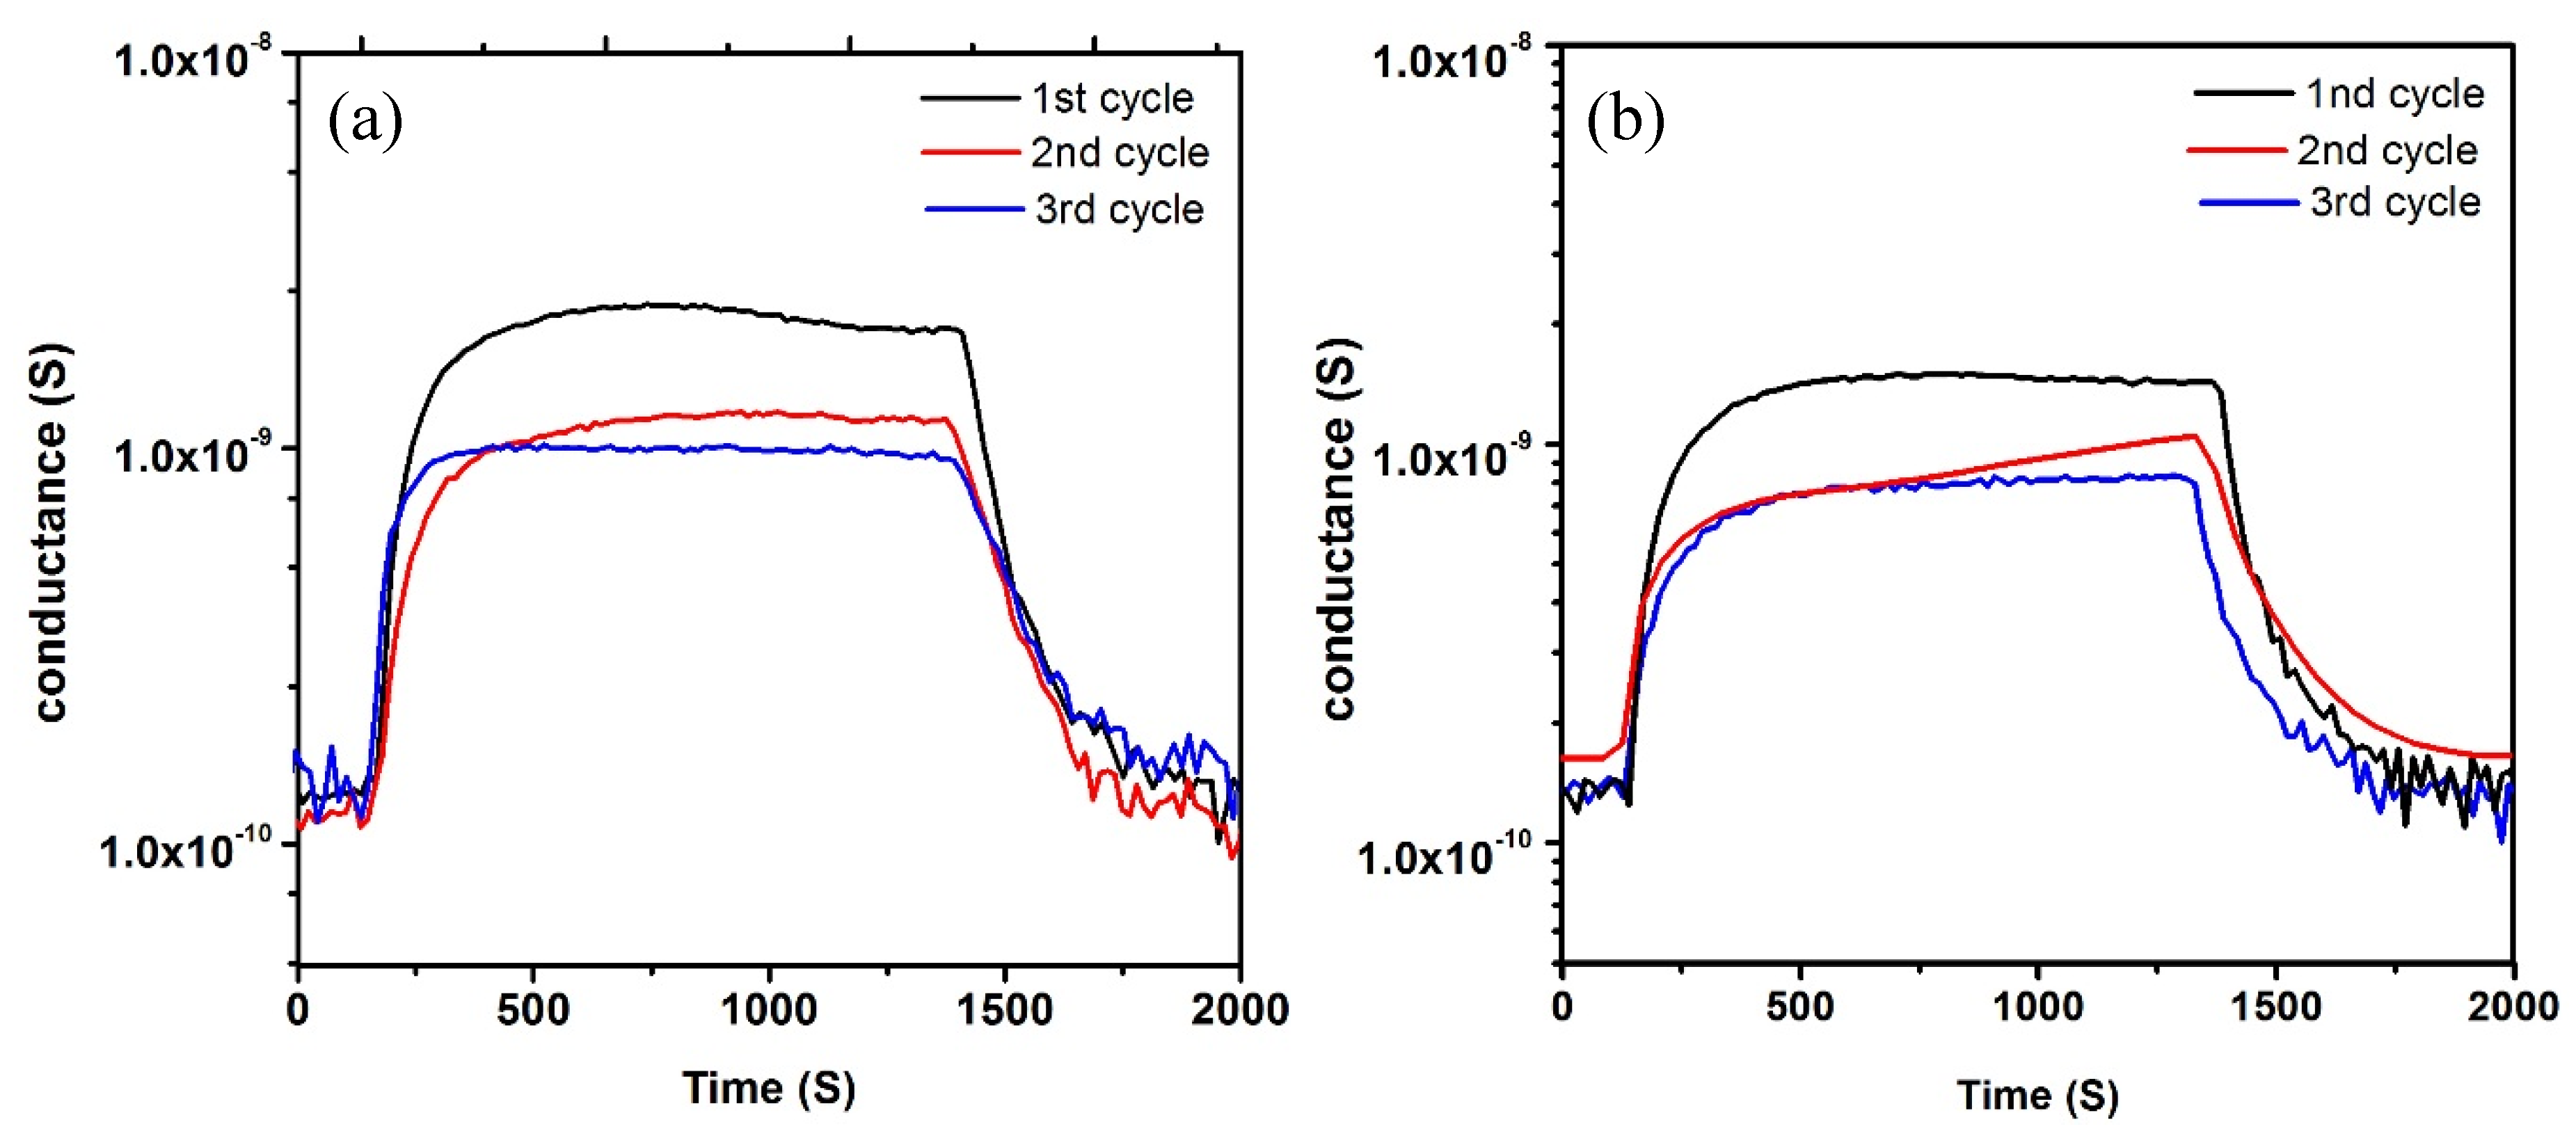
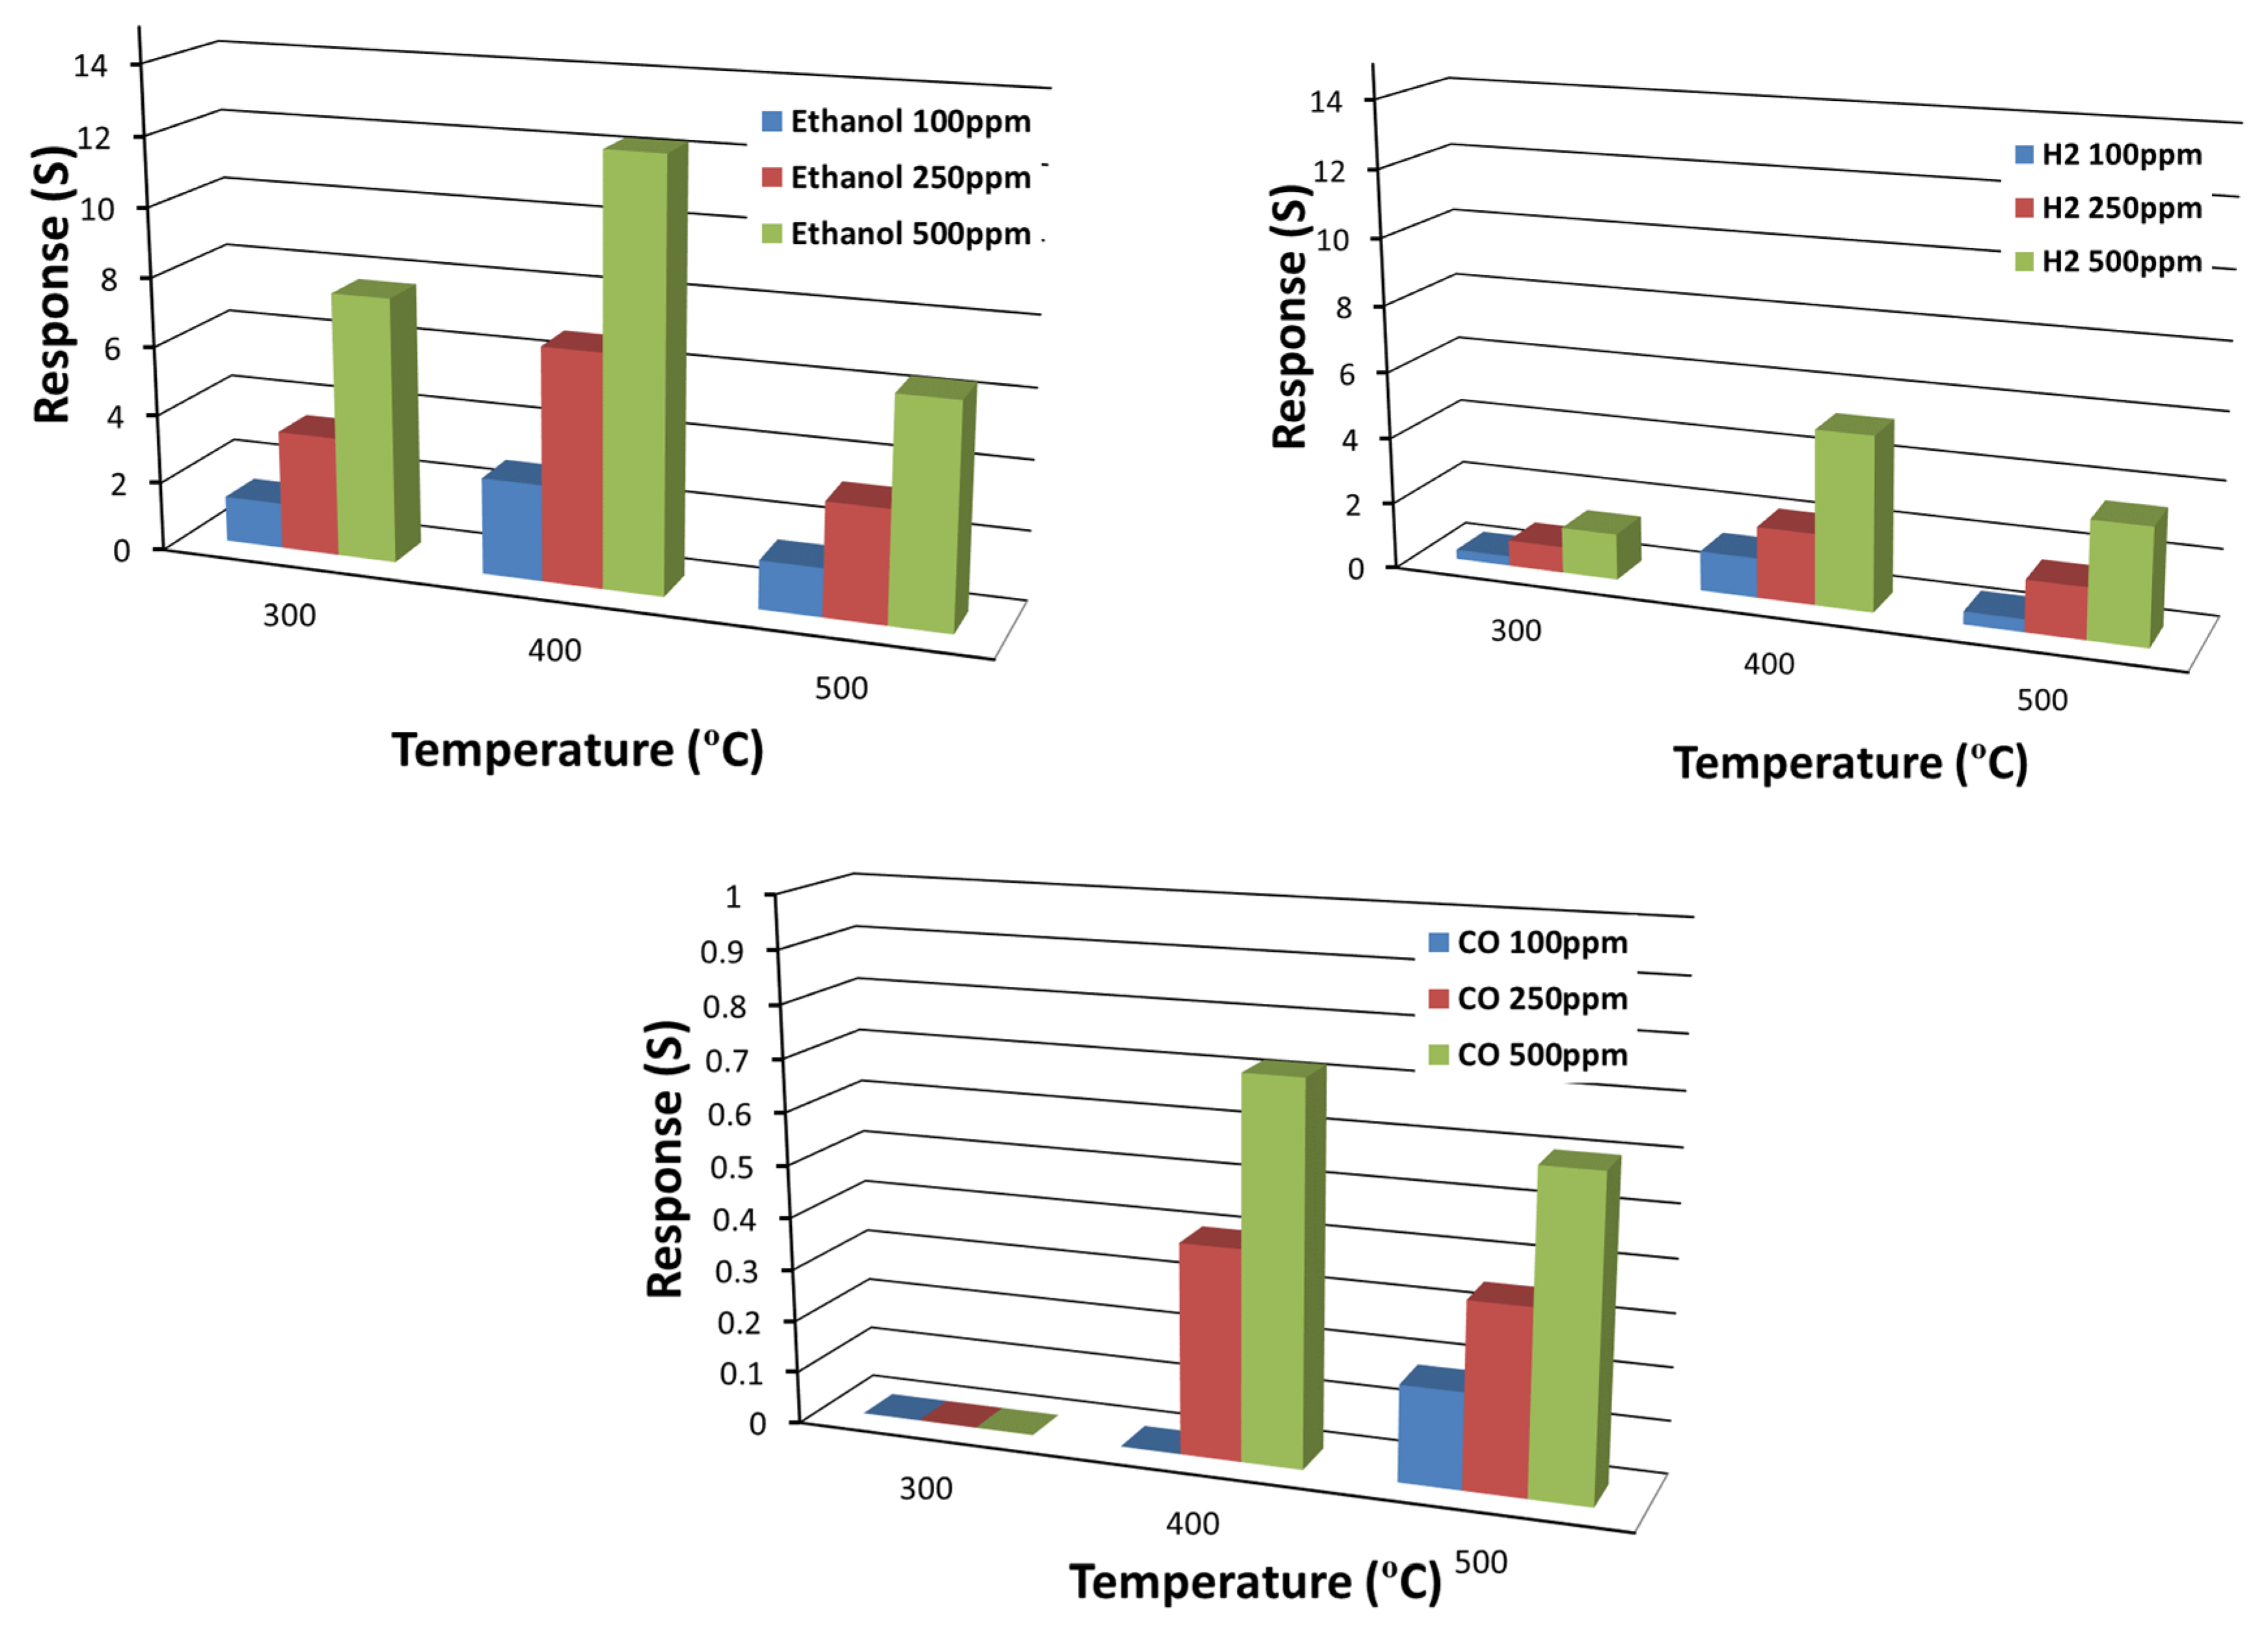
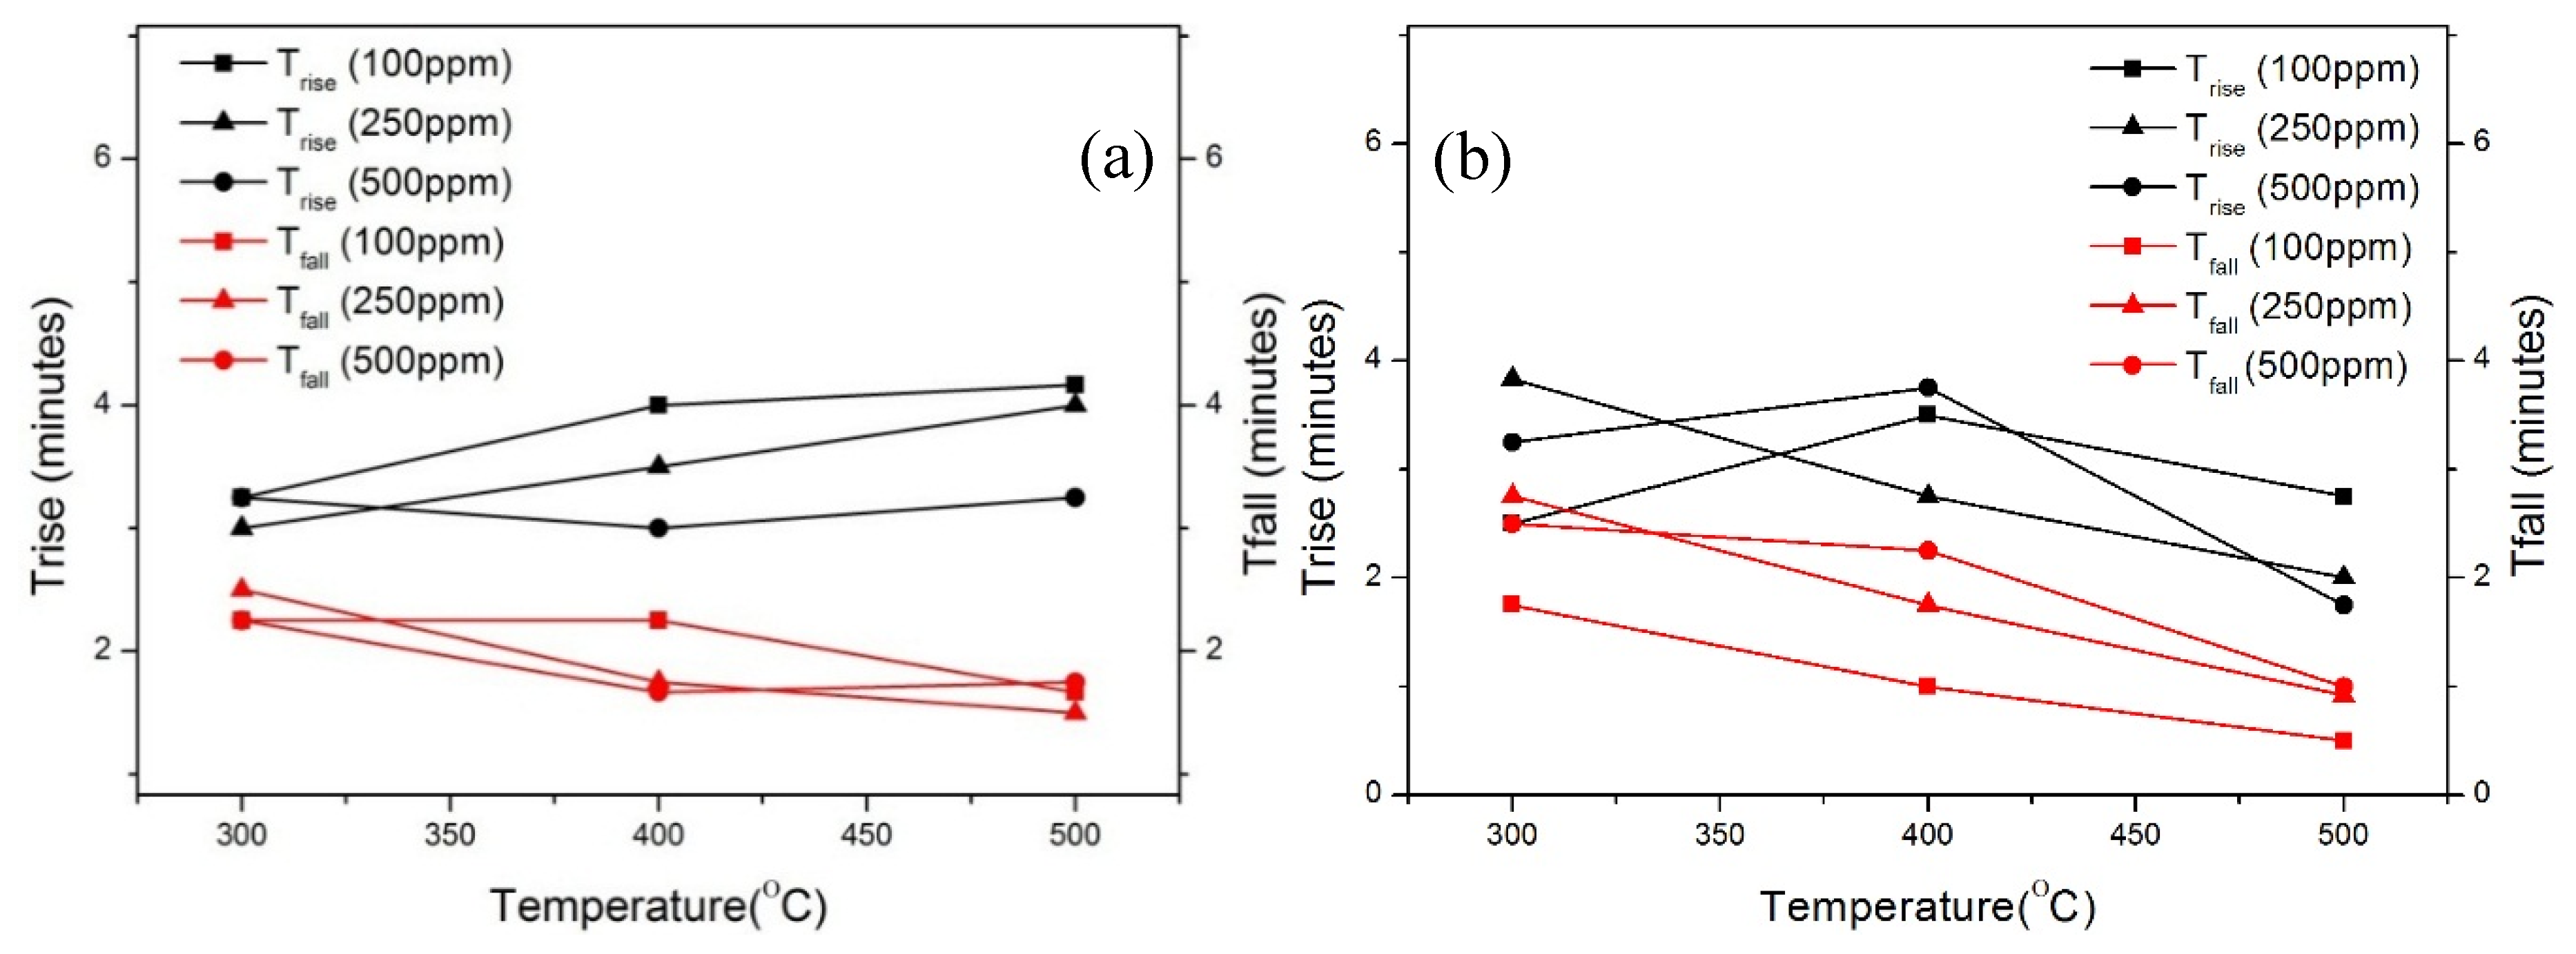
3.3. Gas Sensing
3.4. Gas Sensing Mechanism
4. Conclusions
Author Contributions
Funding
Acknowledgments
Conflicts of Interest
References
- Gerasimov, G.N.; Gromov, V.F.; Ilegbusi, V.F.; Trakhtenberg, L.I. The mechanisms of sensory phenomena in binary metal oxide nanocomposites. Sens. Actuators B Chem. 2017, 240, 613–624. [Google Scholar] [CrossRef]
- Wang, C.; Yin, L.; Zhang, L.; Xiang, D.; Gao, R. Metal Oxide Gas Sensors: Sensitivity and Influencing Factors. Sensors 2010, 10, 2088–2106. [Google Scholar] [CrossRef] [PubMed]
- Rahman, M.A.; Bazargan, S.; Srivastava, S.; Wang, X.; Ellah, M.A.; Thomas, J.P.; Heinig, N.F.; Pradhan, D.; Leung, K.T. Defect-rich decorated TiO2 nanowires for super-efficient photoelectrochemical water splitting driven by visible light. Energy Environ. Sci. 2015, 8, 3363–3373. [Google Scholar] [CrossRef]
- Park, N.G.; Lagemaat, J.V.D.; Frank, A.J. Comparison of Dye-Sensitized Rutile- and Anatase-Based TiO 2 Solar Cells. J. Phys. Chem. B 2000, 104, 8989–8994. [Google Scholar] [CrossRef]
- Appell, D. Wired for success. Nature 2002, 419, 553–555. [Google Scholar] [CrossRef]
- Ni, M.; Leung, M.K.; Leung, D.Y.; Sumathy, K. A review and recent developments in photocatalytic water-splitting using TiO2 for hydrogen production. Renew. Sustain. Energy Rev. 2007, 11, 401–425. [Google Scholar] [CrossRef]
- Galstyana, V.; Comini, E.; Baratto, C.; Mazhar, M.E.; Ponzoni, A.; Sberveglieri, V.; Poli, N.; Faglia, G.; Sberveglieri, G. Conductance and work function of TiO2 nanotubes based gas sensors. Procedia Eng. 2005, 120, 769–772. [Google Scholar] [CrossRef][Green Version]
- Galstyan, V. Porous TiO2-based gas sensors for cyber chemical systems to provide security and medical diagnosis. Sensors 2017, 17, 12. [Google Scholar] [CrossRef]
- Galstyan, V.; Ponzoni, A.; Kholmanov, I.; Comini, E.; Sberveglieri, V.; Poli, N.; Sberveglieri, G. Hierarchically Assembled Titania Based Nanostructures: Innovative and Efficient Strategies for the Synthesis and the Improvement of Sensing. MDPI Proc. 2017, 1, 293. [Google Scholar] [CrossRef]
- Kwoka, M.; Galstyan, V.; Comini, E.; Szuber, J. Pure and highly Nb-doped titanium dioxide nanotubular arrays: Characterization of local surface properties. Nanomaterials 2007, 7, 456. [Google Scholar] [CrossRef]
- Lee, S.H.; Galstyan, V.; Ponzoni, A.; Juan, I.G.; Riedel, R.; Dourges, M.A.; Nicolas, Y.; Toupance, T. Finely Tuned SnO2 Nanoparticles for Efficient Detection of Reducing and Oxidizing Gases: The Influence of Alkali Metal Cation on Gas-Sensing Properties. ACS Appl. Mater. Interfaces 2018, 10, 10173–10184. [Google Scholar] [CrossRef] [PubMed]
- Epifani, M.; Andreu, T.; Zamani, R.; Arbiol, J.; Comini, E.; Siciliano, P.; Fagli, G.; Morante, J.R. Pt doping triggers growth of TiO2 nanorods: Nanocomposite synthesis and gas-sensing properties. CrystEngComm 2012, 14, 3882–3887. [Google Scholar] [CrossRef]
- Lee, J.C.; Park, K.S.; Kim, T.G.; Choi, H.J.; Sung, Y.M. Controlled growth of high-quality TiO2 nanowires on sapphire and silica. Nanotechnology 2006, 17, 4317–4321. [Google Scholar] [CrossRef]
- Park, Y.S.; Lee, J.S. Morphology Control of Single Crystalline Rutile TiO2 Nanowires. Bull. Korean Chem. Soc. 2011, 32, 3571–3574. [Google Scholar] [CrossRef]
- DSani, S.R.; Ali, A.M.; Jafari, R. The effect of carrier gas flow on structural and optical properties of TiO2 nanowires. Phys. E Low-Dimens. Syst. Nanostruct. 2011, 43, 1809–1812. [Google Scholar] [CrossRef]
- Pishekloo1, S.P.; Dariani, R.S. Growing TiO2 nanowires by solid–liquid–solid mechanism including two factors (Ti and O). Appl. Phys. A 2016, 122, 1–10. [Google Scholar] [CrossRef]
- Peng, X.; Wang, J.; Thomas, D.F.; Chen, A. Tunable growth of TiO2 nanostructures on Ti substrates. Nanotechnology 2005, 16, 2389–2395. [Google Scholar] [CrossRef]
- Peng, X.; Chen, A. Dense high-hydrophobic rutile TiO2 nanorod arrays. Appl. Phys. A Mater. Sci. Process. 2005, 80, 473–476. [Google Scholar] [CrossRef]
- Huo, K.; Zhang, X.; Hu, L.; Sun, X.; Fu, J.; Chu, P.K. One-step growth and field emission properties of quasialigned TiO2 nanowire/carbon nanocone core-shell nanostructure arrays on Ti substrates. Appl. Phys. Lett. 2008, 93, 013105. [Google Scholar] [CrossRef]
- Lee, G.H. Synthesis of TiO2 nanowires via thermal oxidation process in air. Mater. Res. Innov. 2016, 20, 421–424. [Google Scholar] [CrossRef]
- Poudel, B.; Wang, W.Z.; Dames, C.; Huang, J.Y.; Kunwar, S.; Wang, D.Z.; Banerjee, D.; Chen, G.; Ren, Z.F. Formation of crystallized titania nanotubes and their transformation into nanowires. Nanotechnology 2005, 16, 1935–1940. [Google Scholar] [CrossRef]
- Bhowmik, B.; Dutta, K.; Banerjee, N.; Hazra, A.; Bhattacharyya, P. Low temperature acetone sensor based on Sol-gel grown nano TiO2 thin film. In Proceedings of the 2013 IEEE International Conference ON Emerging Trends in Computing, Communication and Nanotechnology (ICECCN), Tirunelveli, India, 25–26 March 2013; pp. 553–557. [Google Scholar] [CrossRef]
- Losilla, J.A.; Ratanatawanate, C.; Balkus, K.J., Jr. Synthesis of TiO2 nanotube films via pulsed laser deposition followed by a hydrothermal treatment. J. Exp. Nanosci. 2014, 9, 126–137. [Google Scholar] [CrossRef][Green Version]
- Nikfarjam, A.; Hosseini, S.; Salehifar, N. Fabrication of a Highly Sensitive Single Aligned TiO2 and Gold Nanoparticle Embedded TiO2 Nano-Fiber Gas Sensor. ACS Appl. Mater. Interfaces 2017, 9, 15662–15671. [Google Scholar] [CrossRef] [PubMed]
- Shen, J.; Vincent, P.; Blanchard, N.P.; Nicolle, J.; Chouei, M.; Purcell, S.T.; Poncharal, P.; Salles, V.; Brioude, A. Physical properties of individual anatase TiO2 nanowires investigated by field emission in a transmission electron microscope. J. Vac. Sci. Technol. 2014, 30, 11801. [Google Scholar] [CrossRef]
- Kim, I.D.; Rothschild, A.; Lee, B.H.; Kim, D.Y.; Jo, S.M.; Tuller, H.L. Ultrasensitive Chemiresistors Based on Electrospun TiO2 Nanofibers. Nano Lett. 2016, 6, 2006–2013. [Google Scholar] [CrossRef]
- Yang, B.Y.; Qu, L.; Dai, L.; Kang, T.; Durstock, M. Electrophoresis Coating of Titanium Dioxide on Aligned Carbon Nanotubes for Controlled Syntheses of Photoelectronic Nanomaterials. Adv. Mater. 2007, 19, 1239–1243. [Google Scholar] [CrossRef]
- Wang, J.; Lin, Z. Anodic formation of ordered TiO2 nanotube arrays: Effects of electrolyte temperature and anodization potential. J. Phys. Chem. C 2009, 113, 4026–4030. [Google Scholar] [CrossRef]
- Mortezaali, A.; Sani, S.R. Study of growth parameters on structural properties of TiO2 nanowires. J. Nanostruct. Chem. 2013, 3, 1–6. [Google Scholar] [CrossRef]
- Dariani, R.S.; Qaleh, Z.N. Microstructure characterization of TiO2 nanowires fabricated by thermal evaporation process. Thin Solid Film. 2013, 542, 192–198. [Google Scholar] [CrossRef]
- Shang, Z.G.; Liu, Z.Q.; Shan, P.J.; Shang, J.K. Synthesis of Single-Crystal TiO2 Nanowire Using Titanium Monoxide Powder by Thermal Evaporation. J. Mater. Sci. Technol. 2012, 28, 385–390. [Google Scholar] [CrossRef]
- Arcadipane, E.; Sanz, R.; Amiard, G.; Boninelli, S.; Impellizzeri, G.; Privitera, V.; Bonkerud, J.; Bhoodoo, C.; Vines, L.; Svenssonc, B.G.; et al. Single-crystal TiO2 nanowires by seed assisted thermal oxidation of Ti foil: Synthesis and photocatalytic properties. RSC Adv. 2017, 7, 11222. [Google Scholar] [CrossRef]
- Lee, H.; Dregia, S.; Akbar, S.; Alhoshan, M. Growth of 1-D TiO2 Nanowires on Ti and Ti Alloys by Oxidation. J. Nanomater. 2010, 2010, 503186. [Google Scholar] [CrossRef]
- Peng, X.; Chen, A. Aligned TiO2 nanorod arrays synthesized by oxidizing titanium with acetone. J. Mater. Chem. 2004, 14, 2542–2548. [Google Scholar] [CrossRef]
- Kolasinski, K.W. Catalytic growth of nanowires: Vapor–liquid–solid, vapor–solid–solid, solution–liquid–solid and solid–liquid–solid growth. Curr. Opin. Solid State Mater. Sci. 2007, 10, 182–191. [Google Scholar] [CrossRef]
- Galstyan, V.; Comini, E.; Baratto, C.; Ponzoni, A.; Ferroni, M.; Poli, N.; Bontempi, E.; Brisotto, M.; Faglia, G.; Sberveglieri, G. Large surface area biphase titania for chemical sensing. Sens. Actuators B Chem. 2015, 209, 1091–1096. [Google Scholar] [CrossRef]
- Gao, T.; Fjellvåg, H.; Norby, P. Crystal structures of titanate nanotubes: A Raman scattering study. Inorg. Chem. 2009, 48, 1423–1432. [Google Scholar] [CrossRef] [PubMed]
- Gao, T.; Fjellvåg, H.; Norby, P. Raman scattering properties of a protonic titanate HxTi2-x/4[]x/4O4.H2O ([], vacancy; x = 0.7) with lepidocrocite-type layered structure. J. Phys. Chem. B 2008, 112, 9400–9405. [Google Scholar] [CrossRef]
- Frank, O.; Zukalova, M.; Laskova, B.; Kürti, J.; Koltai, J.; Kavan, L. Raman spectra of titanium dioxide (anatase, rutile) with identified oxygen isotopes. Phys. Chem. Chem. Phys. 2012, 14, 14567–14572. [Google Scholar] [CrossRef]
- Lubas, M.; Jasinski, J.J.; Sitarz, M.; Kurpaska, L.; Podsiad, P.; Jasinski, J. Raman spectroscopy of TiO2 thin films formed by hybrid treatment for biomedical applications. Spectrochimica. Acta-Part A Mol. Biomol. Spectrosc. 2014, 133, 867–871. [Google Scholar] [CrossRef]
- Martinez, W.E.; Gregori, G.; Mates, T. Titanium diffusion in gold thin films. Thin Solid Film. 2010, 518, 2585–2591. [Google Scholar] [CrossRef]
- Sylwestrowicz, W.D.; Elkholy, H.A.; Kammlott, G.W. The effect of temperature and humidity on interdiffusion of gold and titanium in thin films. J. Mater. Sci. 1979, 14, 873–881. [Google Scholar] [CrossRef]
- Zeng, W.; Lui, T.; Wang, Z. Enhanced gas sensing properties by SnO2 nanosphere functionalized TiO2 nanobelts. J. Mater. Chem. 2012, 22, 3544–3548. [Google Scholar] [CrossRef]
- Zhou, Y.; Ding, Q.; Li, J.; Wang, Y.; Wang, B.; Zhu, W.; AoOuyang, X.; Liu, L.; Wang, Y. Enhanced sensing performance of TiO2/Ag2V4O11 nanoheterostructures to ethanol gas. J. Alloys Compd. 2019, 811, 151958. [Google Scholar] [CrossRef]
- Zhou, M.; Liu, Y.; Wu, Y.; Zhang, X. Different crystalline phases of aligned TiO2 nanowires and their ethanol gas sensing properties. Phys. E Low-Dimens. Syst. Nanostruct. 2019, 114, 113601. [Google Scholar] [CrossRef]
- Deng, J.; Yo, B.; Lou, Z.; Wang, L.; Wang, R.; Zhang, T. Facile synthesis and enhanced ethanol sensing properties of the brush-like ZnO–TiO2 heterojunctions nanofibers. Sens. Actuators B Chem. 2013, 184, 21–26. [Google Scholar] [CrossRef]
- Seo, M.H.; Yuasa, M.; Kida, T.; Huh, J.S.; Shimanoe, K.; Yamazoe, N. Gas sensing characteristics and porosity control of nanosturctured films composed of TiO2 nanotubles. Sens. Actuators B Chem. 2009, 137, 513–520. [Google Scholar] [CrossRef]
- Meng, D.; Yamazaki, T.; Kikuta, T. Preparation and gas sensing properties of undoped and Pd-doped TiO2 nanowires. Sens. Actuators B Chem. 2014, 190, 838–843. [Google Scholar] [CrossRef]
- Sennik, E.; Colak, Z.; Kilic, N.; Ozturk, Z.Z. Sytnhesis of hughly-orderd TiO2 nanotubes for a hydrigen sensor. Int. J. Hydrog. Energy 2010, 35, 4420–4427. [Google Scholar] [CrossRef]
- Sennik, E.; Alev, O.; Ozturk, Z.Z. The effect of Pd on the H2 and VOC sensing properties of TiO2 nanorods. Sens. Actuators B Chem. 2016, 229, 692–700. [Google Scholar] [CrossRef]
- Li, Z.; Ding, D.; Liu, Q.; Wang, Z. Ni-doped TiO2 nanotubes for wide-range hydrogen sensing. Nanoscale Res. Lett. 2014, 9, 118. [Google Scholar] [CrossRef]
- Ren, S.; Liu, W. One-step photochemical deposition of PdAu alloyed nanoparticles on TiO2 nanowires for ultra-sensitive H2 detection. J. Mater. Chem. A 2016, 4, 2236–2245. [Google Scholar] [CrossRef]
- Bertuna, A.; Faglia, G.; Ferroni, M.; Kaur, N.; Munasinghe, H.M.M.M.; Sberveglieri, G.; Comini, E. Metal oxide nanowire preparation and their integration into chemical sensing devices at the SENSOR lab in Brescia. Sensors 2017, 17, 1000. [Google Scholar] [CrossRef]
- Munasinghe, M.A.H.M.; Zappa, D.; Poli, N.; Gunawardhana, N.; Comini, E. Gold functionalized MoO3 nano flakes for gas sensing applications. Sens. Actuators B Chem. 2018, 269, 331–339. [Google Scholar] [CrossRef]


| Parameter | Condition |
|---|---|
| Ti layer thickness (nm) | 50, 100, 200 |
| Oxidation temperature (°C) | 600, 650, 700, 750 |
| Oxidation time (h) | 2, 3, 4 |
| Oxygen flow (SCCM) | 1, 5, 10, 20 |
| Argon flow (SCCM) | 100 |
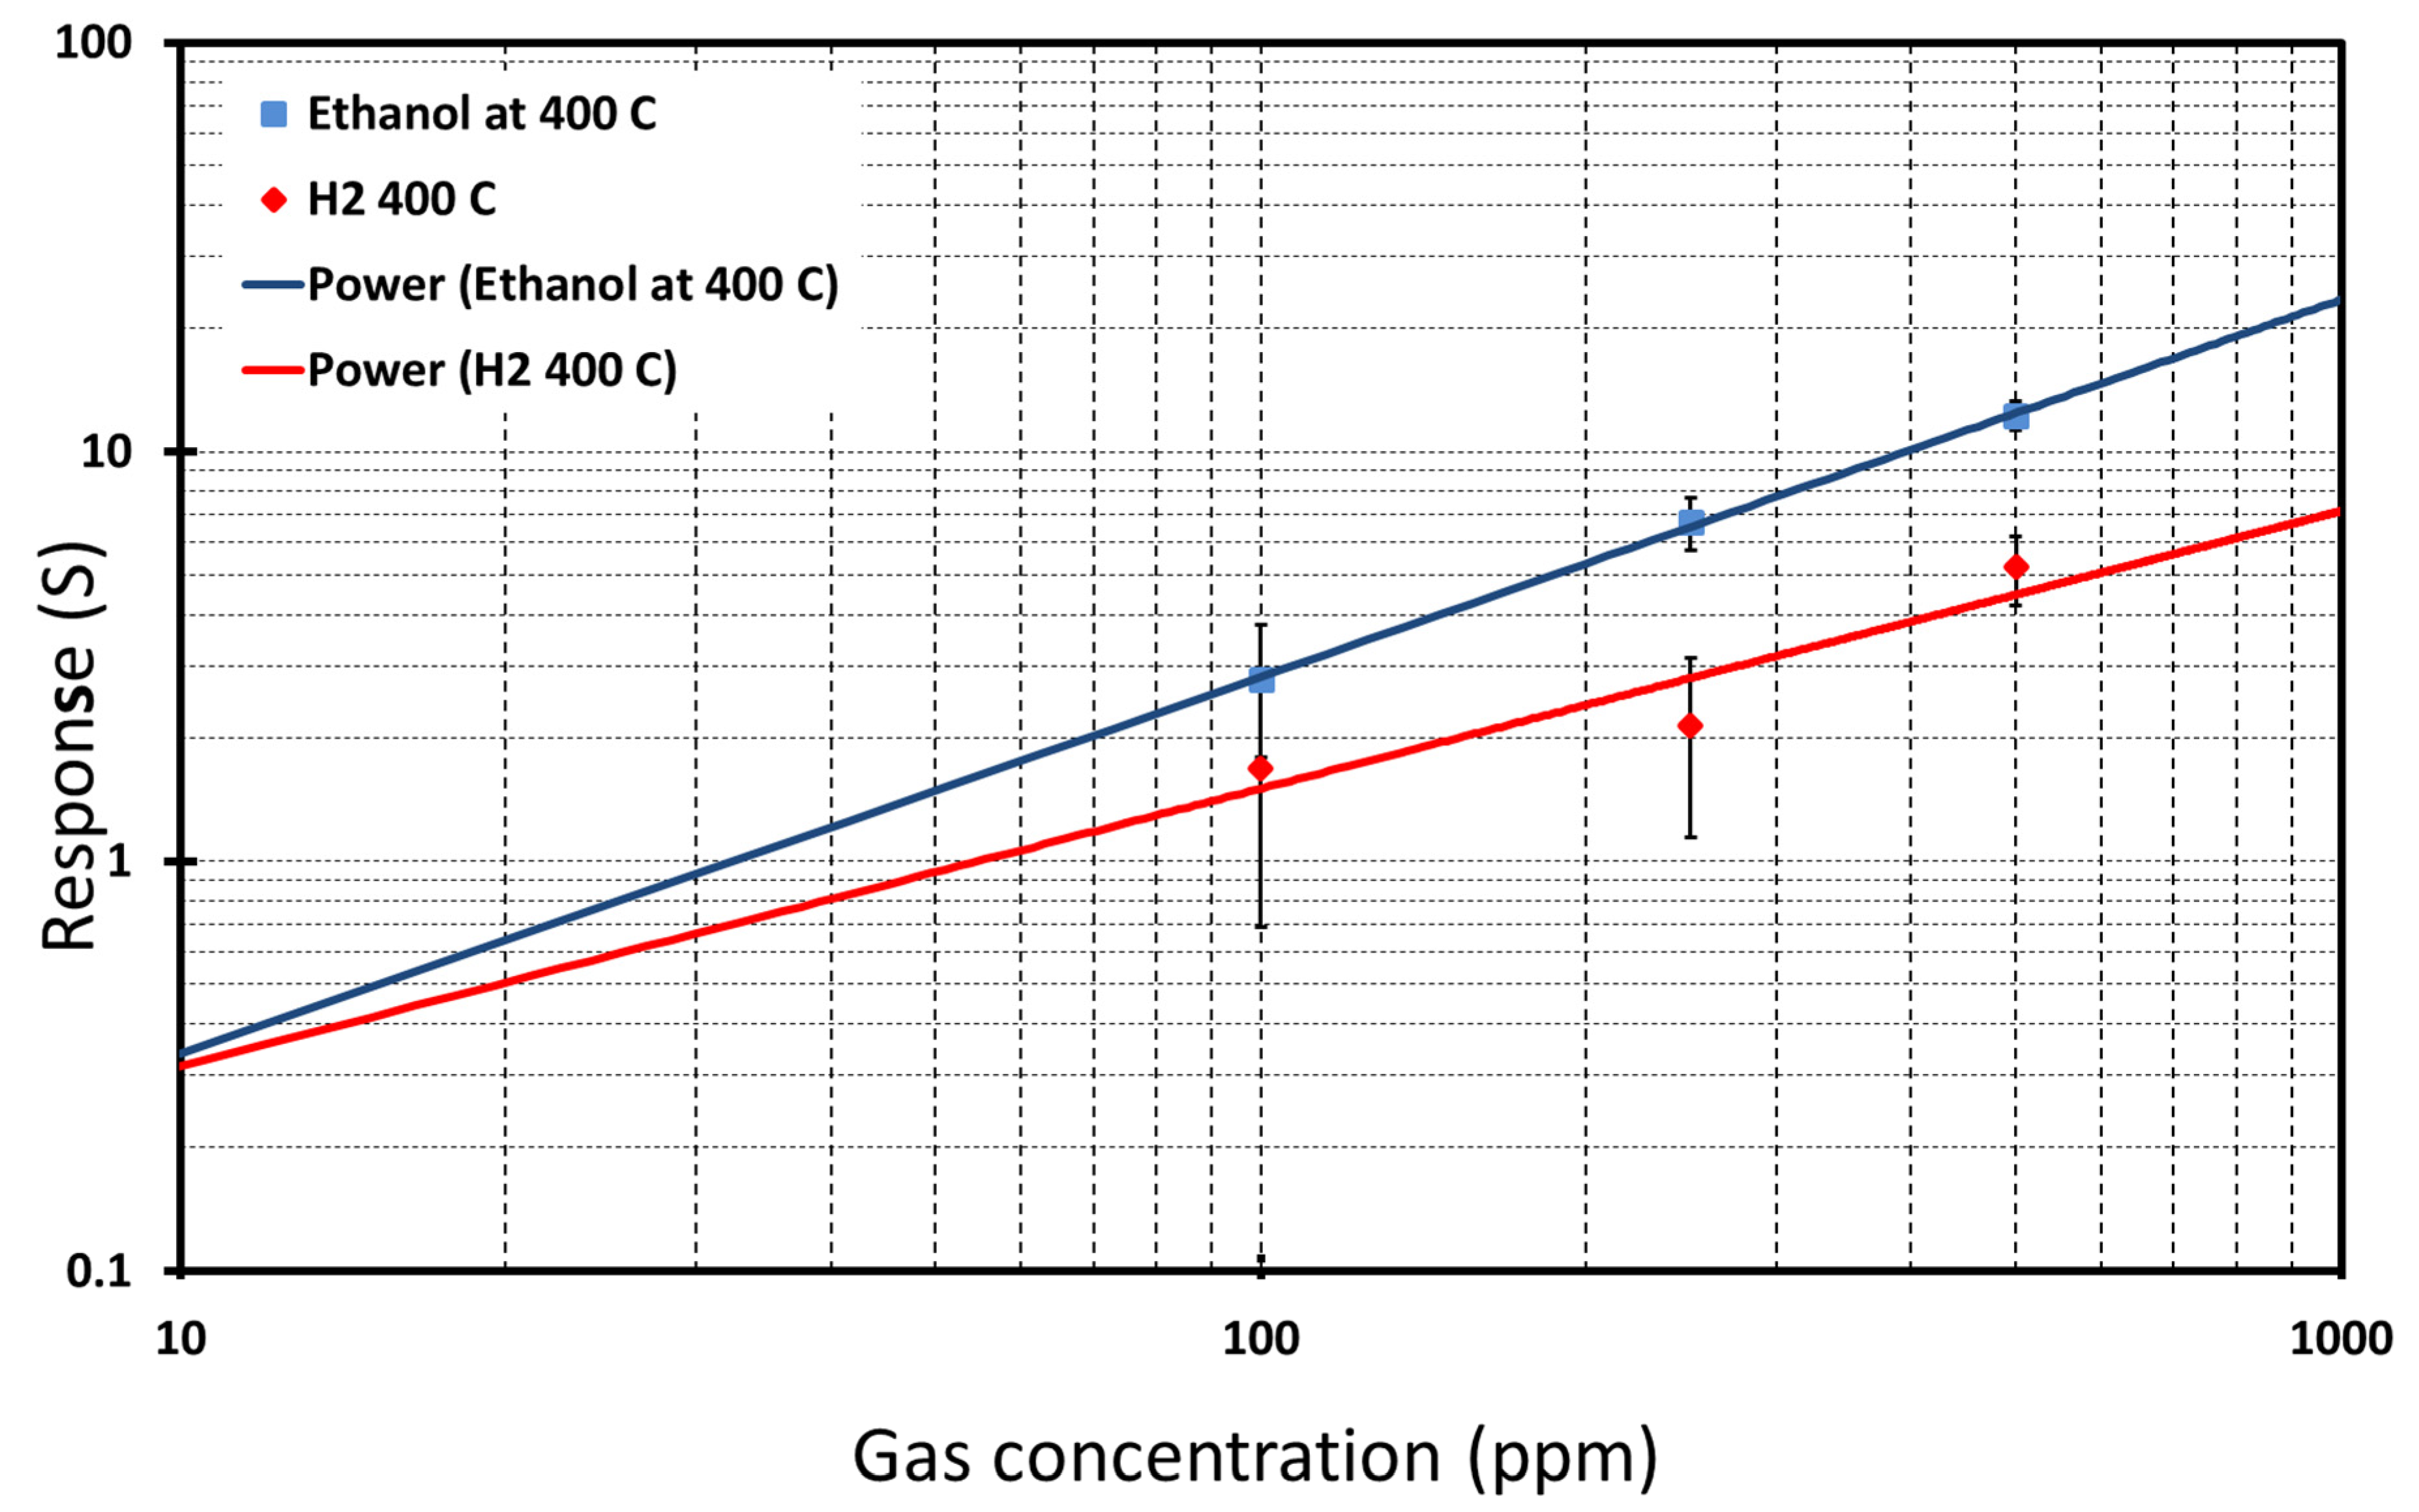
| Gas | Detection Limit (ppm) | A | B |
|---|---|---|---|
| Ethanol | 32 | 0.0405 | 0.9214 |
| H2 | 90 | 0.0173 | 0.9029 |
| Synthesis Method | Composition | Gas | Gas Con: (ppm) | Temp: (°C) | RH% | Res (S) | Ref |
|---|---|---|---|---|---|---|---|
| Hydrothermal | Nano belts | Ethanol | 400 | 350 | 40 | 13 | [43] |
| Hydrothermal | Nanowires | 1000 | 500 | 30 | 4.5 | [44] | |
| Electrospinning | Nanowires | 1000 | 400 | 0 | 15.8 | [45] | |
| Hydrothermal | Nanowires | 500 | 400 | 0 | 6 | [46] | |
| Hydrothermal | Nanotubes | 47 | 500 | 0 | 15 | [47] | |
| Thermal oxidation | Nanowires | 500 | 400 | 40 | 15 | This work | |
| VLS | Nanowires | Hydrogen | 1000 | 500 | 0 | 1 | [48] |
| Hydrothermal | Nanotubes | 500 | 500 | 0 | 9.6 | [47] | |
| Anodic oxidation | Nanotubes | 100 | 150 | 0 | 18 | [49] | |
| Hydrothermal | Nanorods | 1000 | 200 | 0 | 0.87 | [50] | |
| Electrochemical Anodization | Nanotubes | 20,000 | 25 | 0 | 0.25 | [51] | |
| Hydrothermal | Nanowires | 5 | RT | 0 | 3.5 | [52] | |
| Thermal oxidation | Nanowires | 500 | 400 | 40 | 5.2 | This work |
© 2020 by the authors. Licensee MDPI, Basel, Switzerland. This article is an open access article distributed under the terms and conditions of the Creative Commons Attribution (CC BY) license (http://creativecommons.org/licenses/by/4.0/).
Share and Cite
Munasinghe Arachchige, H.M.M.; Zappa, D.; Poli, N.; Gunawardhana, N.; Attanayake, N.H.; Comini, E. Seed-Assisted Growth of TiO2 Nanowires by Thermal Oxidation for Chemical Gas Sensing. Nanomaterials 2020, 10, 935. https://doi.org/10.3390/nano10050935
Munasinghe Arachchige HMM, Zappa D, Poli N, Gunawardhana N, Attanayake NH, Comini E. Seed-Assisted Growth of TiO2 Nanowires by Thermal Oxidation for Chemical Gas Sensing. Nanomaterials. 2020; 10(5):935. https://doi.org/10.3390/nano10050935
Chicago/Turabian StyleMunasinghe Arachchige, Hashitha M. M., Dario Zappa, Nicola Poli, Nanda Gunawardhana, Nuwan H. Attanayake, and Elisabetta Comini. 2020. "Seed-Assisted Growth of TiO2 Nanowires by Thermal Oxidation for Chemical Gas Sensing" Nanomaterials 10, no. 5: 935. https://doi.org/10.3390/nano10050935
APA StyleMunasinghe Arachchige, H. M. M., Zappa, D., Poli, N., Gunawardhana, N., Attanayake, N. H., & Comini, E. (2020). Seed-Assisted Growth of TiO2 Nanowires by Thermal Oxidation for Chemical Gas Sensing. Nanomaterials, 10(5), 935. https://doi.org/10.3390/nano10050935