Effect of Humidity on Light-Activated NO and NO2 Gas Sensing by Hybrid Materials

 ,
,  ,
,  , ,
, , 

Abstract
1. Introduction
2. Materials and Methods
3. Results and Discussion
4. Conclusions
Supplementary Materials
Author Contributions
Funding
Acknowledgments
Conflicts of Interest
References
- World Health Organization (WHO). WHO Guidelines for Indoor Air Quality: Selected Pollutants. Available online: www.euro.who.int_data/assets/pdf_file/0009/128169/e94535/pdf (accessed on 30 March 2020).
- Menil, F.; Coillard, V.; Lucat, C. Critical Review of Nitrogen Monoxide Sensors for Exhaust Gases of Lean Burn Engines. Sens. Actuators B 2000, 67, 1–23. [Google Scholar] [CrossRef]
- Witschi, H. Ozone, nitrogen dioxide and lung cancer: A review of some recent issues and problems. Toxicology 1988, 48, 1–20. [Google Scholar] [CrossRef]
- Seinfeld, J.H.; Pandis, S.N. Chapter 20. Wet Deposition. In Atmospheric Chemistry and Physics: From Air Pollution to Climate Change, 3rd ed.; John Wiley & Sons, Inc.: Hoboken, NJ, USA, 2006; pp. 856–888. [Google Scholar]
- Barnes, P.J. Nitric Oxide and Airway Disease. Ann. Med. 1995, 27, 389–393. [Google Scholar] [CrossRef] [PubMed]
- Lunt, A.; Ahmed, N.; Rafferty, G.F.; Dick, M.; Rees, D.; Height, S.; Thein, S.L.; Greenough, A. Airway and alveolar nitric oxide production, lung function, and pulmonary blood flow in sickle cell disease. Pediatri. Res. 2016, 79, 313–317. [Google Scholar] [CrossRef] [PubMed][Green Version]
- Pijnenburg, M.W.H.; De Jongste, J.C. Exhaled nitric oxide in childhood asthma: A review. Clin. Exp. Allergy 2008, 38, 246–259. [Google Scholar] [CrossRef]
- Righettoni, M.; Amann, A.; Pratsinis, S.E. Breath analysis by nanostructured metal oxides as chemoresistive gas sensors. Mater. Today 2015, 18, 163–171. [Google Scholar] [CrossRef]
- Hyodo, T.; Urata, K.; Kamada, K.; Ueda, T.; Shimizu, Y. Semiconductor-type SnO2-based NO2 sensors operated at room temperature under UV-light irradiation. Sens. Actuators B Chem. 2017, 253, 630–640. [Google Scholar] [CrossRef]
- Liu, B.; Luo, Y.; Li, K.; Wang, H.; Gao, L.; Duan, G. Room-Temperature NO2 Gas Sensing with Ultra-Sensitivity Activated by Ultraviolet Light Based on SnO2 Monolayer Array Film. Adv. Mater. Interfaces 2019, 1900376, 1–10. [Google Scholar]
- Fomekong, R.L.; Saruhan, B. Influence of Humidity on NO2-Sensing and Selectivity of Spray-CVD Grown ZnO Thin Film above 400 °C. Chemosensors 2019, 7, 42. [Google Scholar] [CrossRef]
- Belghachi, A.; Collins, R.A. The effects of humidity on phthalocyanine NO2 and NH3 sensors. J. Phys. D Appl. Phys 1990, 23, 223–227. [Google Scholar] [CrossRef]
- Ling, Z.; Leach, C. The effect of relative humidity on the NO2 sensitivity of a SnO2/WO3 heterojunction gas sensor. Sens. Actuators B 2004, 102, 102–106. [Google Scholar] [CrossRef]
- Nasriddinov, A.; Rumyantseva, M.; Shatalova, T.; Tokarev, S.; Yaltseva, P.; Fedorova, O.; Khmelevsky, N.; Gaskov, A. Organic-inorganic hybrid materials for room temperature light-activated sub-ppm NO detection. Nanomaterials 2020, 10, 70. [Google Scholar] [CrossRef]
- Rumyantseva, M.; Nasriddinov, A.; Vladimirova, S.; Fedorova, O.; Tokarev, S.; Krylov, I.; Drozdov, K.; Baranchikov, A.; Gaskov, A. Photosensitive organic-inorganic hybrid materials for room temperature gas sensor applications. Nanomaterials 2018, 8, 671. [Google Scholar] [CrossRef]
- Ruhland, B.; Becker, T.; Muller, G. Gas-kinetic interactions of nitrous oxides with SnO2 surfaces. Sens. Actuators B 1998, 50, 85–94. [Google Scholar] [CrossRef]
- Bârsan, N.; Weimar, U. Conduction model of metal oxide gas sensors. J. Electroceram. 2001, 7, 143–167. [Google Scholar] [CrossRef]
- Rumyantseva, M.N.; Makeeva, E.A.; Badalyan, S.M.; Zhukova, A.A.; Gaskov, A.M. Nanocrystalline SnO2 and In2O3 as materials for gas sensors: The relationship between microstructure and oxygen chemisorption. Thin Solid Film. 2009, 518, 1283–1288. [Google Scholar] [CrossRef]
- Korotcenkov, G.; Brinzari, V.; Golovanov, V.; Blinov, Y. Kinetics of gas response to reducing gases of SnO2 films, deposited by spray pyrolysis. Sens. Actuators B 2004, 98, 41–45. [Google Scholar] [CrossRef]
- Egashira, M.; Nakashima, M.; Kawasuma, S.; Selyama, T. Temperature programmed desorption study of water adsorbed on metal oxides. Part 2. Tin oxide surfaces. J. Phys. Chem. 1981, 85, 4125–4130. [Google Scholar] [CrossRef]
- Bârsan, N.; Schweizer-Berberich, M.; Gopel, W. Fundamental and practical aspects in the design of nanoscaled SnO2 gas sensors: A status report. Fresenius J. Anal. Chem. 1999, 365, 287–304. [Google Scholar] [CrossRef]
- Yamazoe, N.; Sakai, G.; Shimanoe, K. Oxide semiconductor gas sensors. Catal. Surv. Asia 2003, 7, 63–75. [Google Scholar] [CrossRef]
- Davydov, A.A. Chapter 2. The Nature of Oxide Surface Centers. In Molecular Spectroscopy of Oxide Catalyst Surfaces; Sheppard, N.T., Ed.; John Wiley & Sons Ltd.: Chichester, UK, 2003. [Google Scholar]
- Heiland, G.; Kohl, D. Chapter 2. Physical and Chemical Aspects of Oxidic Semiconductor Gas Sensors. In Chemical Sensor Technology; Seiyama, T., Ed.; Elsevier Science: Amsterdam, The Netherlands, 1988; Volume 1, pp. 15–38. [Google Scholar]
- Morrison, S.R. Chapter 5. Bonding of Foreign Species at the Solid Surface. In The Chemical Physics of Surfaces, 2nd ed.; Springer Science+ Business Media: New York, NY, USA, 1990; pp. 173–220. [Google Scholar]
- Henrich, V.A.; Cox, P.A. Chapter 6. Molecular Adsorption on Oxides. In The Surface Science of Metal Oxides; Cambridge University Press: Cambridge, UK, 1994; pp. 247–370. [Google Scholar]
- Gurlo, A. Interplay between O2 and SnO2: Oxygen ionosorption and spectroscopic evidence for adsorbed oxygen. Chem. Phys. Chem. 2006, 7, 2041–2052. [Google Scholar] [CrossRef]
- Konstantinova, E.A.; Pentegov, I.S.; Marikutsa, A.V.; Rumyantseva, M.N.; Gaskov, A.M.; Kashkarov, P.K. EPR study of nanocrystalline tin dioxide. Phys. Status Solidi C 2011, 8, 1957–1960. [Google Scholar] [CrossRef]
- Konstantinova, E.A.; Weidmann, J.; Dittrich, T. Influence of adsorbed water and oxygen on the photoluminescence and EPR of por-TiO2 (anatase). J. Porous Mater. 2000, 7, 389–392. [Google Scholar] [CrossRef]
- Weidmann, J.; Dittrich, T.; Konstantinova, E.A.; Lauermann, I.; Uhlendorf, I.; Koch, F. Influence of oxygen and water related surface defects on the sensitized TiO2 solar cell. Sol. Energy Mater. Sol. Cells 1999, 56, 153–165. [Google Scholar] [CrossRef]
- Yang, L.; Marikutsa, A.; Rumyantseva, M.; Konstantinova, E.; Khmelevsky, N.; Gaskov, A. Quasi similar routes of NO2 and NO sensing by nanocrystalline WO3: Evidence by in situ drift spectroscopy. Sensors 2019, 19, 3405. [Google Scholar] [CrossRef]
- Leblanc, E.; Perier-Camby, L.; Thomas, G.; Gibert, R.; Primet, M.; Gelin, P. NOx adsorption onto dehydroxylated or hydroxylated tin dioxide surface. Application to SnO2-based sensors. Sens. Actuators B 2000, 62, 67–72. [Google Scholar] [CrossRef]
- Hadjiivanov, K.I. Identification of neutral and charged NxOy surface species by IR spectroscopy. Catal. Rev. Sci. Eng. 2000, 42, 71–144. [Google Scholar] [CrossRef]
- Nakamoto, K. Infrared and Raman Spectra of Inorganic and Coordination Compounds. Part A: Theory and Applications in Inorganic Chemistry, 6th ed.; John Wiley & Sons, Inc.: New Jersey, NJ, USA, 2009. [Google Scholar]
- Socrates, G. Infrared and Raman Characteristic Group Frequencies: Tables and Charts, 3rd ed.; John Wiley & Sons Ltd.: Chichester, UK, 2001. [Google Scholar]
- Guglielminotti, E.; Boccuzzi, F. Nitric Oxide Adsorption and Nitric Oxide-Carbon Monoxide Interaction on Ru/ZnO Catalyst. J. Catal. 1993, 141, 486–493. [Google Scholar] [CrossRef]
- Valden, M.; Keiski, R.; Xiang, N.; Pere, J.; Aaltonen, J.; Pessa, M.; Maunula, T.; Savimaki, A.; Lahti, A.; Harkonen, M. Reactivity of Pd/Al2O3, Pd/La2O3–Al2O3 and Pd/LaAlO3 Catalysts for the Reduction of NO by CO: CO and NO Adsorption. J. Catal. 1996, 161, 614–625. [Google Scholar] [CrossRef]
- Chao, C.C.; Lunsford, J.H. Adsorption of nitric oxide on Y-type zeolites. Low-temperature infrared study. J. Am. Chem. Soc. 1971, 93, 6794–6800. [Google Scholar] [CrossRef]
- Kantcheva, M.; Bushev, V.; Hadjiivanov, K. Nitrogen dioxide adsorption on deuteroxylated titania (anatase). J. Chem. Soc. Faraday Trans. 1992, 88, 3087–3089. [Google Scholar] [CrossRef]
- Gil, B.; Datka, J.; Kubacka, A.; Janas, J.; Sulikowski, B. NO adsorption on the active sites of Co- and/or in-containing ferrierite catalysts for the CH4-SCR-NO process. Stud. Surf. Sci. Catal. 2005, 158, 1137–1144. [Google Scholar]
- Djonev, B.; Tsyntsarski, B.; Klissurski, D.; Hadjiivanov, K. IR spectroscopic study of NOx adsorption and NOx–O2 coadsorption on Co2+/SiO2 catalysts. J. Chem. Soc. Faraday Trans. 1997, 93, 4055–4063. [Google Scholar] [CrossRef]
- Chen, E.S.; Wentworth, W.E.; Chen, E.C.M. The electron affinities of NO and O2. J. Mol. Struct. 2002, 606, 1–7. [Google Scholar] [CrossRef]
- Xu, G.; Zhang, L.; He, C.; Ma, D.; Lu, Z. Adsorption and oxidation of NO on various SnO2(110) surfaces: A density functional theory study. Sens. Actuators B 2015, 221, 717–722. [Google Scholar] [CrossRef]
- Sergent, N.; Epifani, M.; Comini, E.; Faglia, G.; Pagnier, T. Interactions of nanocrystalline tin oxide powder with NO2: A Raman spectroscopic study. Sens. Actuators B 2007, 126, 1–5. [Google Scholar] [CrossRef]


| Sample | Phase Composition | dXRD1, nm | dTEM2, nm | Ssurf3, m2/g | Average Pore Diameter, nm | , at. % | Rav5, Ohm Pure Air | SPh6, in Pure Air (λ = 470 nm) |
|---|---|---|---|---|---|---|---|---|
| SnO2 | SnO2, cassiterite In2O3, bixbyite | 4 ± 1 | 4 ± 1 | 115 ± 5 | 3–5; 70–80 | - | 7.8·104 | 1.00 |
| SnO2+RuITP | 7 ± 1 | 7 ± 2 | 90 ± 5 | 3–4 | 1.2 ± 0.1 | 6.9·105 | 1.22 | |
| In2O3 | - | 1.7·104 | 1.25 | |||||
| In2O3+RuITP | 2.1 ± 0.2 | 5.8·105 | 1.95 |
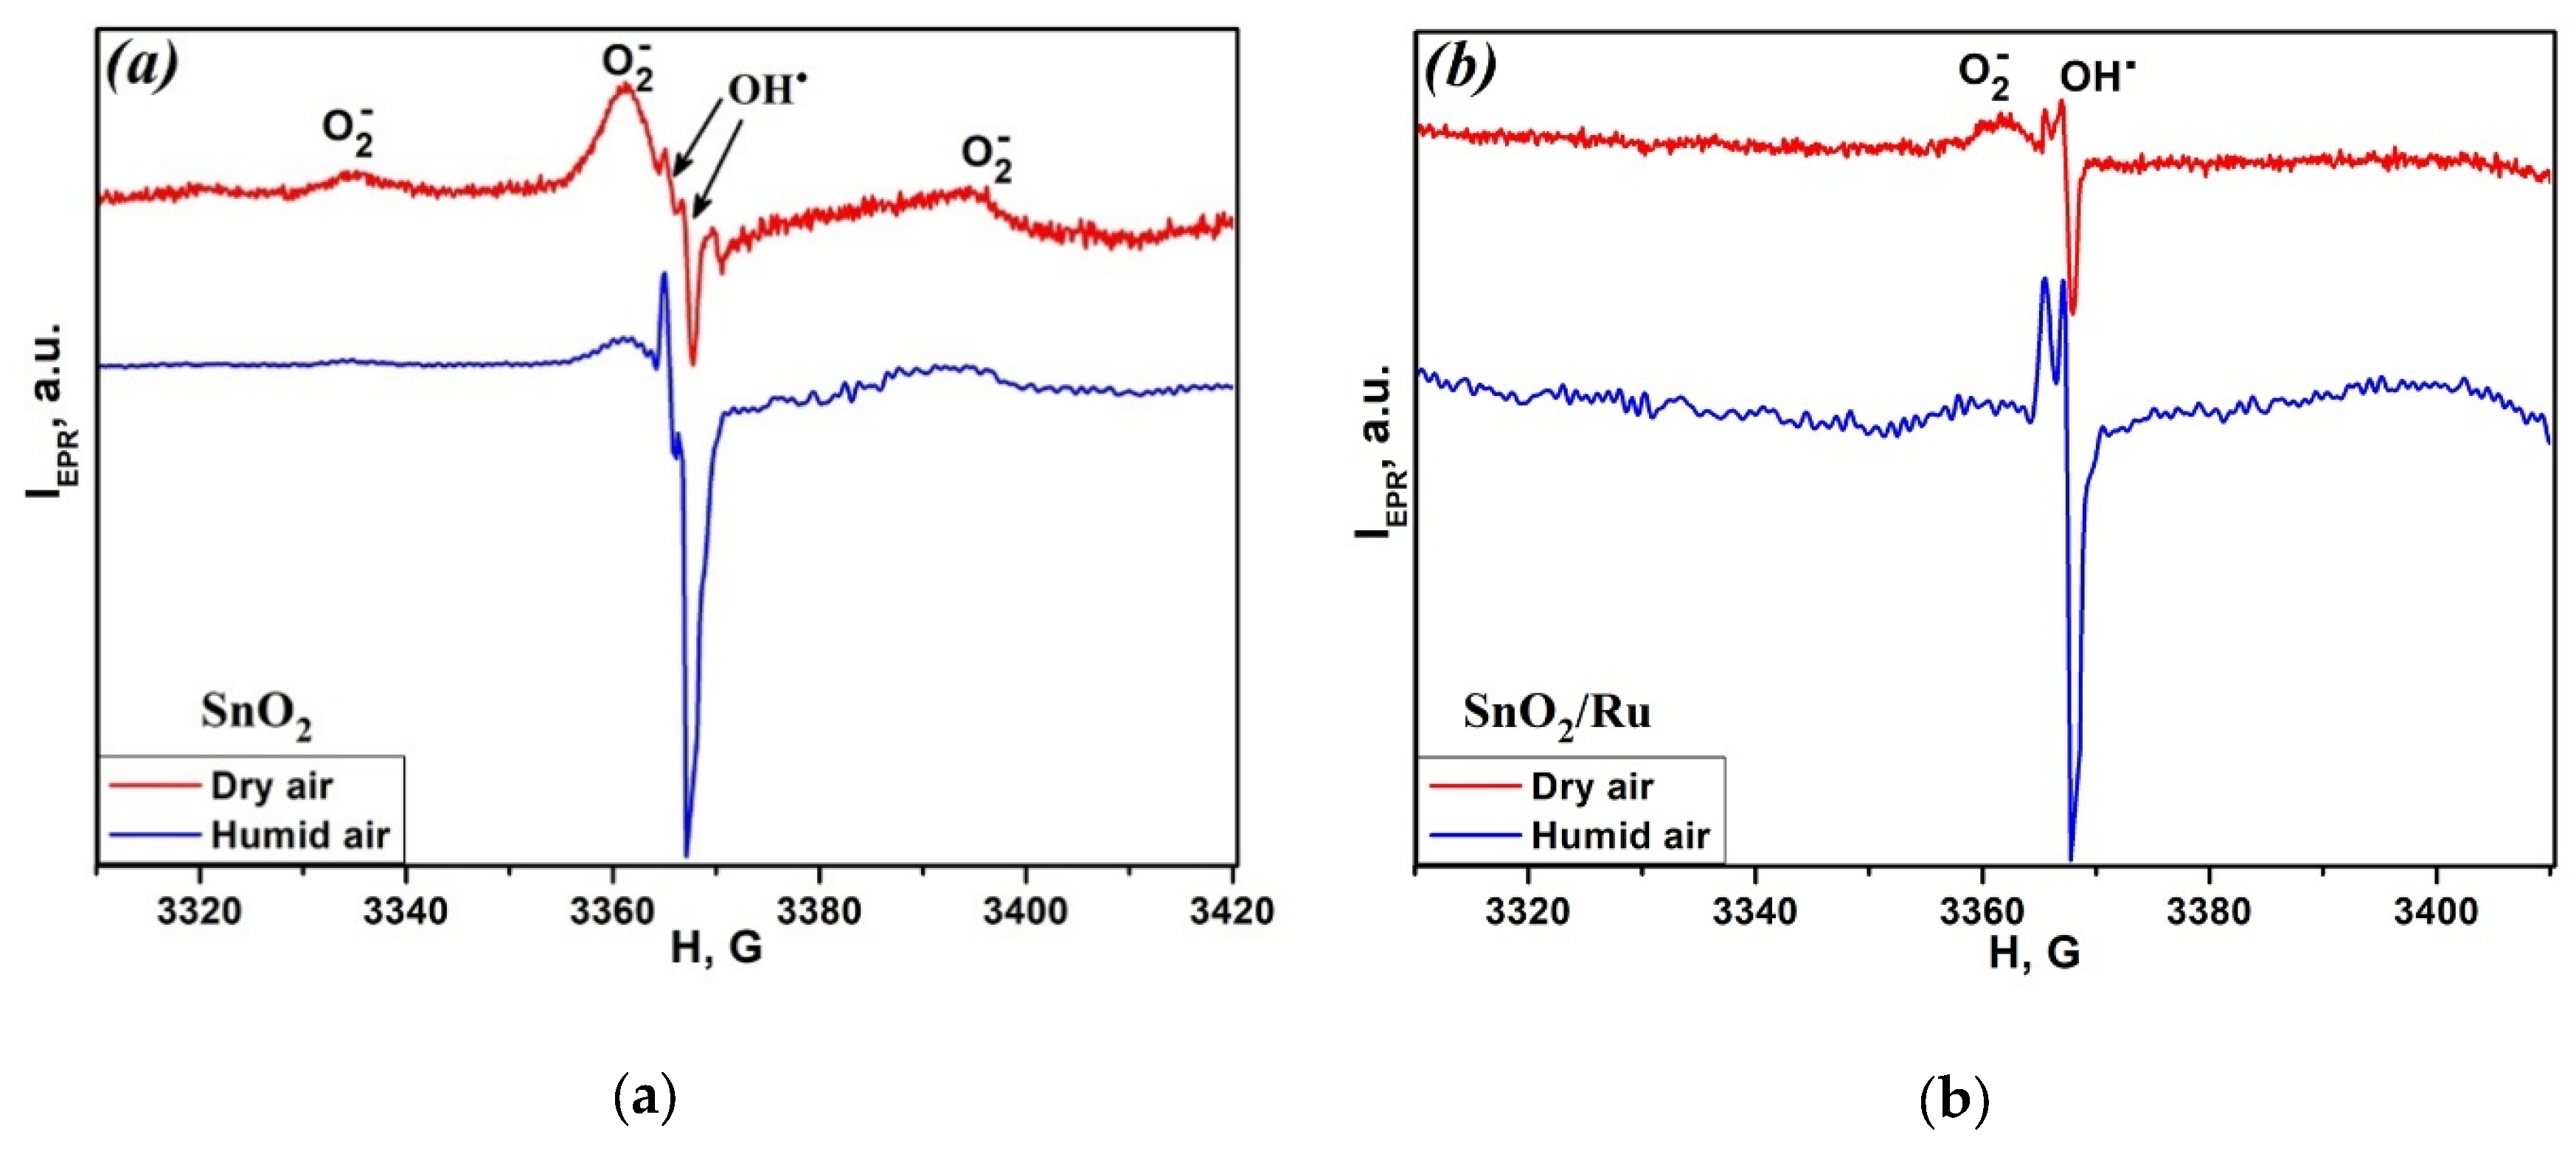
| Conditions | SnO2 | SnO2/Ru | ||||
|---|---|---|---|---|---|---|
| O2− | OH∙ | OH∙/O2− | O2− | OH∙ | OH∙/O2− | |
| Dry air | 8 × 10¹⁴ | 1.9 × 10¹⁴ | 0.24 | 2.5 × 10¹⁴ | 4.4 × 10¹⁴ | 1.2 |
| Humid air | 2.8 × 10¹⁴ | 4.3 × 10¹⁴ | 1.54 | 1014 | 1.1 × 10¹⁵ | 11 |
© 2020 by the authors. Licensee MDPI, Basel, Switzerland. This article is an open access article distributed under the terms and conditions of the Creative Commons Attribution (CC BY) license (http://creativecommons.org/licenses/by/4.0/).
Share and Cite
Nasriddinov, A.; Rumyantseva, M.; Konstantinova, E.; Marikutsa, A.; Tokarev, S.; Yaltseva, P.; Fedorova, O.; Gaskov, A. Effect of Humidity on Light-Activated NO and NO2 Gas Sensing by Hybrid Materials. Nanomaterials 2020, 10, 915. https://doi.org/10.3390/nano10050915
Nasriddinov A, Rumyantseva M, Konstantinova E, Marikutsa A, Tokarev S, Yaltseva P, Fedorova O, Gaskov A. Effect of Humidity on Light-Activated NO and NO2 Gas Sensing by Hybrid Materials. Nanomaterials. 2020; 10(5):915. https://doi.org/10.3390/nano10050915
Chicago/Turabian StyleNasriddinov, Abulkosim, Marina Rumyantseva, Elizaveta Konstantinova, Artem Marikutsa, Sergey Tokarev, Polina Yaltseva, Olga Fedorova, and Alexander Gaskov. 2020. "Effect of Humidity on Light-Activated NO and NO2 Gas Sensing by Hybrid Materials" Nanomaterials 10, no. 5: 915. https://doi.org/10.3390/nano10050915
APA StyleNasriddinov, A., Rumyantseva, M., Konstantinova, E., Marikutsa, A., Tokarev, S., Yaltseva, P., Fedorova, O., & Gaskov, A. (2020). Effect of Humidity on Light-Activated NO and NO2 Gas Sensing by Hybrid Materials. Nanomaterials, 10(5), 915. https://doi.org/10.3390/nano10050915