1. Introduction
Today, luminescence thermometry is considered to be a mature technology with many applications in diverse areas and environments, such as electrical and mechanical engineering, biomedicine, nanotechnology, and microfluidics (some of the application examples can be found in Reference [
1] and references therein). Still, breakthrough advances related to it can be expected in the future, particularly in developments of novel luminescence thermometry probes and improvements of temperature readout schemes. Temperature readout methods from luminescence can be primarily classified according to the temporal nature of the measurement, as time-integrated (steady-state) or time-resolved (concerned with the emission decay and rise times). In the former type, the ratio of intensities of emissions, the so-called luminescence intensity ratio (LIR), is the most utilized method as it is simple, self-referencing, and ratiometric, and thus unaffected by fluctuations in excitation and detection systems. It can be used with many different types of luminescence probes and does not require expensive equipment with benefits such as fast response time and good temperature resolutions. The most commonly researched LIR with trivalent lanthanide ion (Ln
3+) activated luminescence thermometry probes is one which utilizes the ratio of two emissions originating from the two thermalized excited levels whose magnitude can be formulated by the Boltzmann-type equation [
2]:
where
k = 0.695 cm
−1 K
−1 is the Boltzmann constant,
is an energy difference between excited levels, and H and L abbreviate energetically higher and lower excited levels of Ln
3+ (thermalized levels), respectively. The pre-exponential factor
B is usually considered as a constant to be determined from the fit of experimental data to Equation (1) or estimated from the Judd–Ofelt parameters, if available [
3]. It depends on the degeneracy of the excited levels
g, the spontaneous emission rates
A, and emission energy of the transition
hν:
The thermalization of levels occurs when the energy gap permits the population of a higher-energy level solely by the thermal energy and when the nonradiative transition rates between the two levels surpass the radiative transition rates. Traditionally, emissions from the adjacent Ln
3+ excited levels have been considered for the Boltzmann-type LIR temperature readings. However, this approach suffers from the limitation of its relative sensitivity:
since it depends solely on the
value which is, for the Ln
3+ adjacent excited energy levels, largest in the case of Eu
3+ 5D
1 and
5D
0 levels (ca. 1750 cm
−1). Thus, the research has come to a conundrum: the lower the Δ
E the better the thermalization, but at the cost of the loss of sensitivity [
4]. Additionally, when choosing LIRs of the higher Δ
E to achieve the higher S
R, the population of the H level is low at low temperatures, with the consequence of low measurement resolution due to the high values of uncertainty in the measurements. One of the solutions to the above problem is an inclusion of the third, higher energy level, not too much separated from the traditionally used H level, to allow for thermalization (from now on the traditionally used H level is reabbreviated as M–mid), with the following logic; if L and M are thermalized, and M and H are thermalized, then the L and H fractional population will also follow the Boltzmann distribution and Equation (1) will remain valid. In other words, after the first thermalization from L to M, the electron at the M level can undergo the following three paths: radiative or nonradiative deactivation, or further thermalization to the H level. As the Δ
EH-L = Δ
EH-M + Δ
EM-L, the result will be increased relative sensitivity for the given ion, and in some cases, thermalization with ≥1750 cm
−1 can be achieved. However, caution is needed because H levels tend to have very low intensities, especially at lower temperatures, shifting the usable temperature range and reducing the overall temperature resolution, Δ
T, a fact that has often been neglected in thermometric research of this type. Thus, both the relative sensitivity and the relative uncertainties of LIR should be simultaneously considered. So far, we have only been aware of few investigations of the kind: on Dy
3+ ion (Δ
T = 6.8 K) [
3], Nd
3+ (Δ
T not reported) [
5], and Er
3+ (Δ
T = 1 K) [
6].
The first LIR study of Er
3+ goes back a few decades to Berthou and Jorgensen [
7], and since then Er
3+ has become the most used lanthanide ion luminescence thermometry [
1]. By using the
2H
11/2 and
4S
3/2 levels, separated by ca. 750 cm
−1 [
8], the maximum achievable relative sensitivity is 1080/
T2. It was only until recently that this three-level strategy for increasing the sensitivity was investigated for Er
3+ ion, by including the next higher level,
4F
7/2.
4 Numerous Er
3+ doped materials, codoped with Yb
3+, were investigated for luminescent thermometry [
9,
10,
11] by the upconversion pumping mechanism. These upconverting materials have drawn significant attention due to the excitation in the NIR region of a biologically transparent window [
12], allowing for numerous biological and medical applications (for example, in photothermal therapies of tumors) [
13]. Ideally, the separation of energy levels would be low enough to provide for sufficient thermalization at biologically important temperatures, but high enough for the clear separation of levels in the spectrum. Ideally, this would be achievable by Δ
E = 700 cm
−1. Another advantage for in vivo temperature sensing would be if emissions of LIR levels are within the biologically transparent window as well, such as reported for Nd
3+ [
14]. To our knowledge, the same NIR-NIR readouts have not yet been reported for Er
3+.
Upconverting Yb
3+/Er
3+ codoped materials do possess all the desired properties: (1) a trio of thermally coupled emissive levels (
4S
3/2,
2H
11/2 and
4F
7/2), (2) NIR excitation by widely available, cheap and powerful 980 nm laser, (3) emissions in the first biologically transparent window from thermally coupled levels
4S
3/2 and
2H
11/2 to the first excited level
4I
13/2, and (4) energy gap between
4S
3/2 and
2H
11/2 close to the ideal 700 cm
−1 for biologically relevant measurements. This paper presents a comparative analysis of performances of 3 LIR readouts by upconversion with 980 nm excitation: (1) from traditionally employed
4S
3/2→
4I
15/2 and
2H
11/2→
4I
15/2 emissions, (2)
4S
3/2→
4I
15/2 and
4F
7/2→
4I
15/2, and (3) with NIR emissions
4S
3/2→
4I
13/2 and
2H
11/2→
4I
13/2, with the goal of obtaining temperature readout sensitivities and resolutions, and investigating measurement repeatability. The choice of YF
3 as the host matrix was due to its low phonon energy of ~500 cm
−1 [
15], high chemical stability [
16], and high iconicity [
17], providing an excellent ground for highly efficient luminescence.
2. Materials and Methods
For the preparation of Y
0.78Yb
0.2Er
0.02F
3, the following chemicals were used: yttrium oxide (Y
2O
3, 99.99%), ytterbium oxide (Yb
2O
3, 99.99%), erbium oxide (Er
2O
3, 99.99%), and ammonium hydrogen difluoride (NH
4HF
2, 98.5%). All chemicals were purchased from Sigma−Aldrich. To synthesize Y
0.78Yb
0.2Er
0.02F
3, the appropriate amounts of commercial Y
2O
3, Yb
2O
3, and Er
2O
3 were mixed with NH
4HF
2 according to the overall reaction:
The obtained mixture was first thoroughly ground in an agate mortar to ensure the best homogeneity and then heated, first in the air at 170 °C for 20 h and then at 500 °C for 3 h in a slightly reducing atmosphere (Ar-10% H2).
Phase identification of the synthesized powder sample was done through X-ray diffraction (XRD) measurements on a Philips PW 1050 diffractometer that uses CuK
α radiation (
λ = 1.54178 Å). XRD measurement conditions were: 2
θ range 20−70° with a step of 0.05° and a counting time of 3 s. Mean crystallite size and microstrain were calculated by the XFIT program based on the fundamental parameters approach to X-ray diffraction line-profile fitting [
18]. SEM measurements were done on a JEOL JSM-7600F scanning electron microscope. The powder was deposited on a graphite sample holder and coated with a Pt layer of 5 nm thickness using PECS Gatan 682. Photoluminescence measurements were carried out on pellets prepared by pressing the Y
0.78Yb
0.2Er
0.02F
3 powder under the load of 2000 kg/cm
2. Photoluminescence upconversion emission spectra were measured using a Fluorolog-3 spectrofluorometer (model FL3-221, Horiba JobinYvon, emission slit set to 1 nm) over the 293–473 K temperature range in 20 K steps. Samples were excited by a 980 nm solid-state laser radiation (model MDLH 980 3W, the excitation power set to 150 mW) and emission was detected over the 450–870 nm spectral range by using a fiber-optic bundle.
3. Results and Discussion
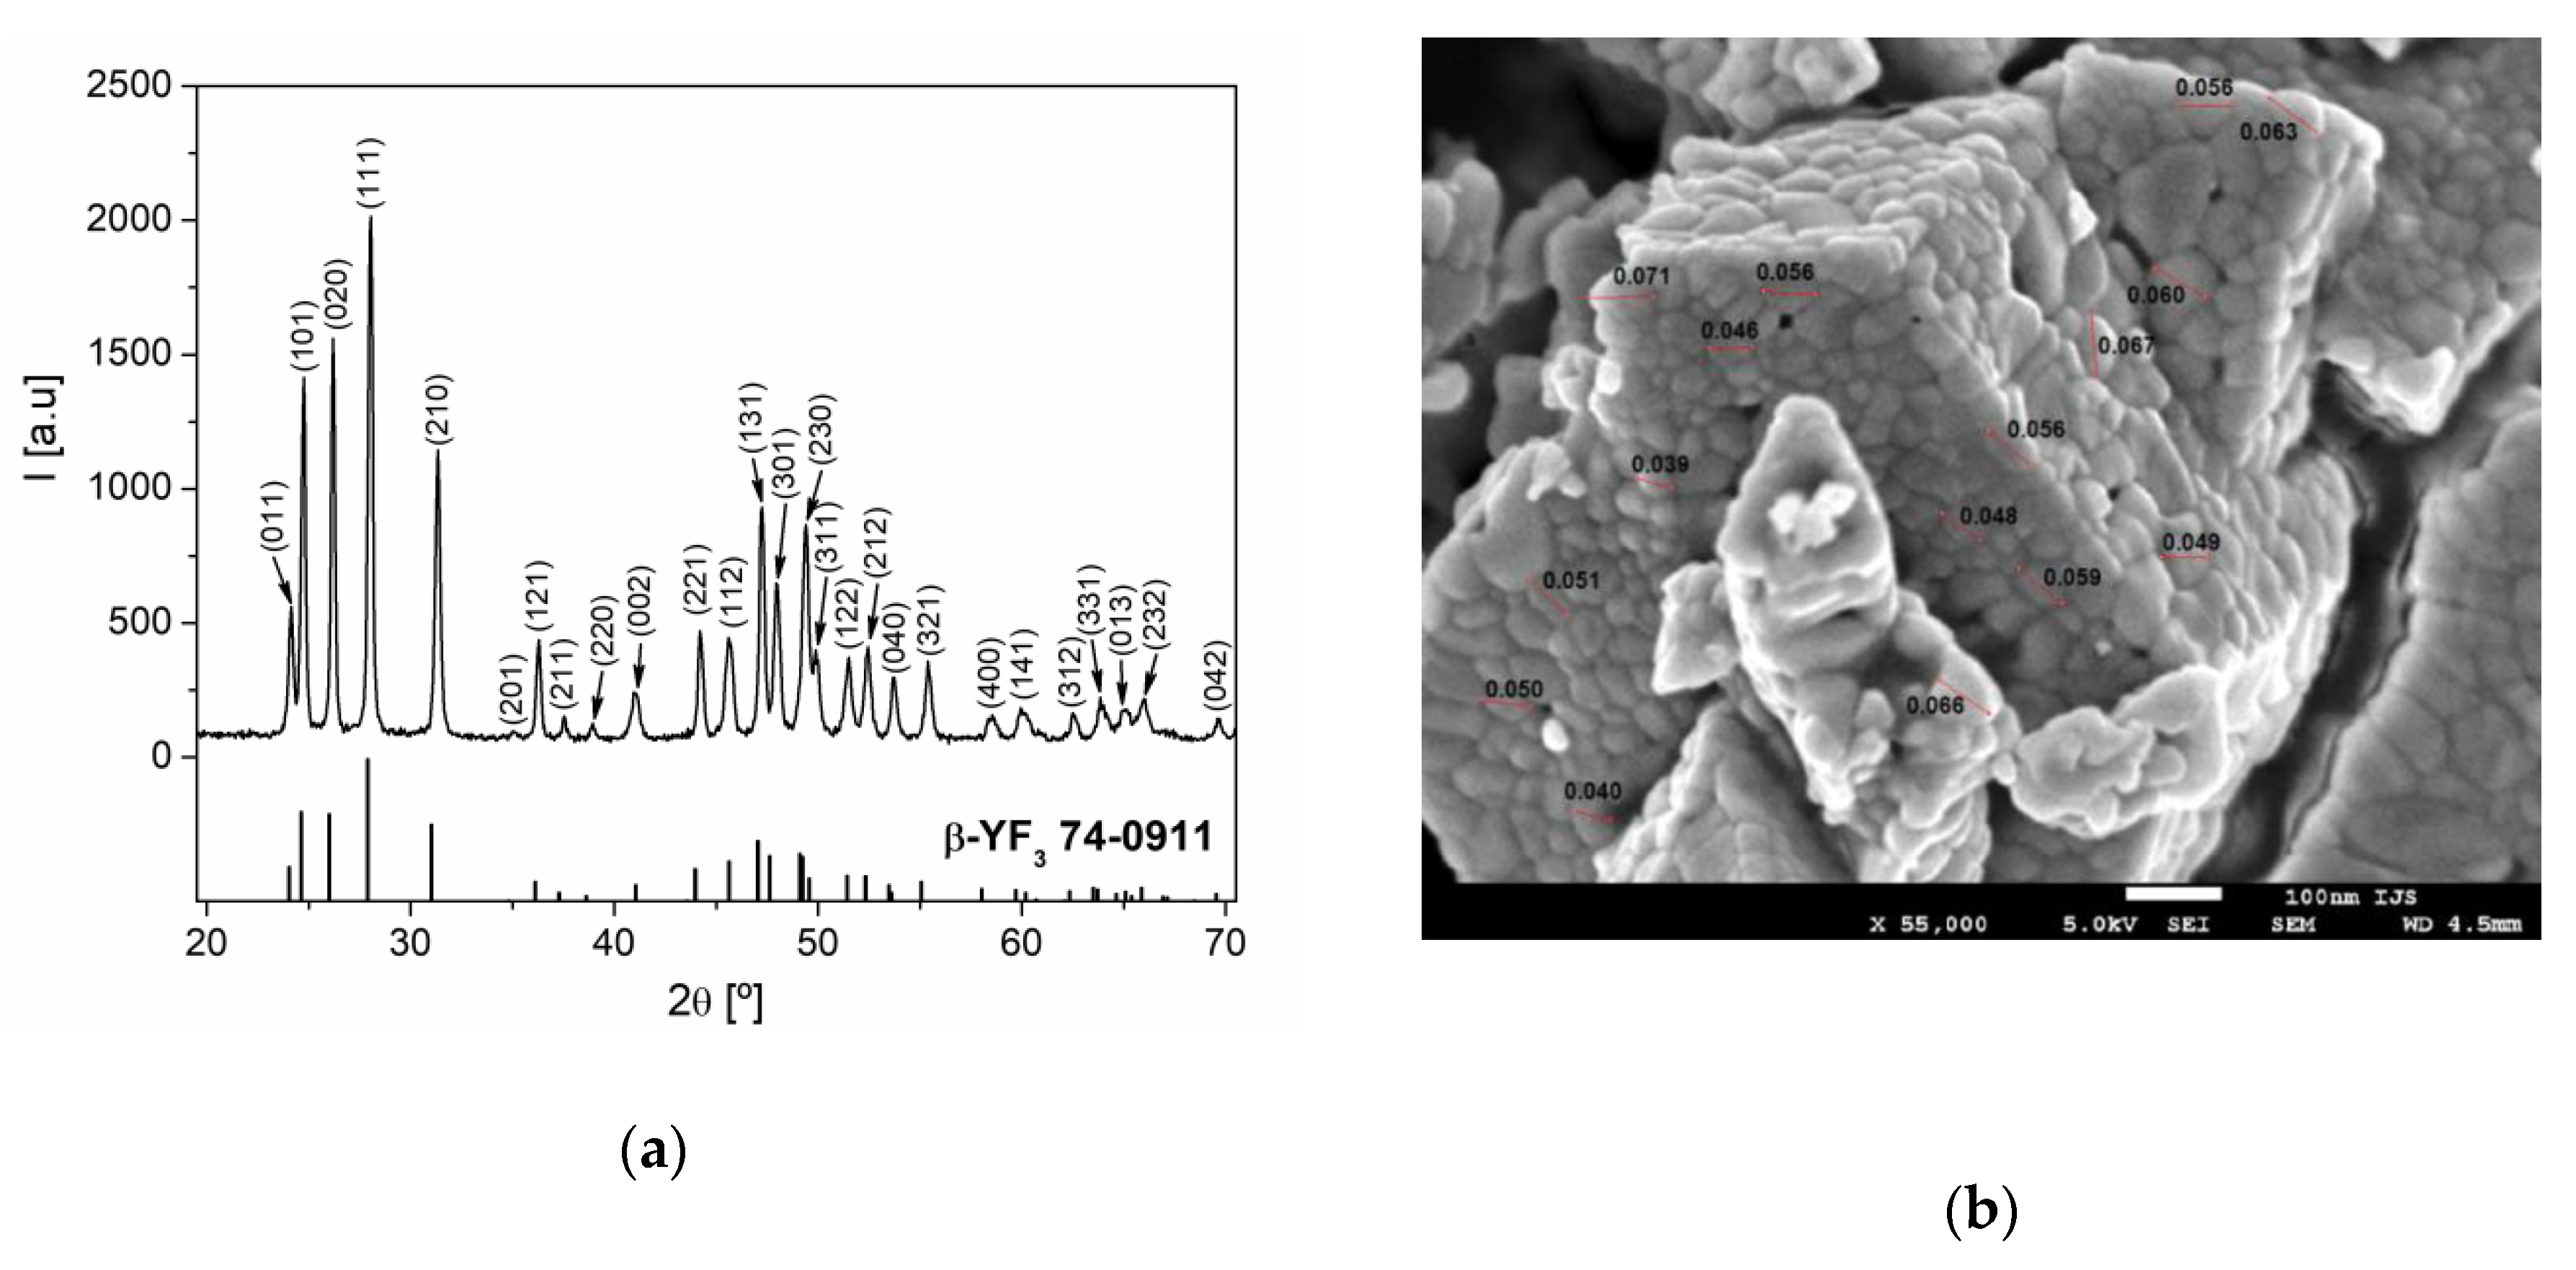
The phase composition of the synthesized sample was examined by XRD analysis. As can be seen from
Figure 1a, all the diffraction reflections can be indexed in a pure orthorhombic
β-YF
3 structure type, within the space group
Pnma (62) [
19]. From the XRD pattern, the calculated cell parameters were
a = 6.3211 (4) Å,
b = 6.8429 (4) Å, and
c = 4.4162 (3) Å, and these values are in a good agreement with the values of cell parameters for YF
3 from the work [
19]. According to the analysis by the XFIT program, the mean crystallite size and microstrain of Y
0.78Yb
0.2Er
0.02F
3 sample were 51 nm and 0.2%, respectively.
The SEM image of the Y
0.78Yb
0.2Er
0.02F
3 sample is presented in
Figure 1b. The examined sample consisted of strongly aggregated, irregularly shaped particles of approximately 20–100 nm in size.
Under the 980 nm excitation, YF
3:Yb
3+/Er
3+ emissions were identified as those originating from Er
3+ 4F
7/2→
4I
15/2,
2H
11/2→
4I
15/2,
4S
3/2→
4I
15/2,
2H
11/2→
4I
15/2, and
4S
3/2→
4I
15/2 electronic transitions, centered at 485 nm, 523 nm, 542 nm, 793 nm, and 840 nm, respectively. The population of the high-energy levels of Er
3+ is realized via well-known mechanisms: the absorption of 980 nm excitation by Yb
3+ with a subsequent energy transfer to the Er
3+, the ground state absorption of Er
3+ (to a much less extent), and the excited state absorption of Er
3+. The first energy transfer to the Er
3+ ion is responsible for the population of the
4I
11/2, while the second pumps from the
4I
11/2 to the
4F
7/2 (see
Figure 2a). The population of the lower-lying
2H
11/2 and
4S
3/2 energy levels occurs via fast multiphonon de-excitations which compete with thermalization processes. These mechanisms allow for the efficient population of all three thermally coupled levels,
4F
7/2,
2H
11/2, and
4S
3/2, with relative populations depending on the temperature in accordance to the Boltzmann distribution.
With the temperature increase, upconversion emissions from the
4S
3/2 level (at 542 and 840 nm) rapidly decreased in intensity, while emissions from the
2H
11/2 level (523 and 793 nm) showed almost constant intensities,
Figure 2b. The intensity of emission from
4F
7/2 showed a slight monotonic increase with temperature,
Figure 2b, exactly like in the CaWO
4:Yb
3+/Er
3+, as previously described by Li et al. [
6]. The same phenomenon of the increase in the intensity of downshifting emission from the higher excited state has been described for Dy
3+ activated CaWO4, where populations in Dy
3+ 4G
11/2 and
4I
15/2 states enlarge with the temperature at the expense of the depopulation of the
4F
9/2 state [
4]. The enlarged population of
4F
7/2 state occurs via thermalization from
4S
3/2 level via
2H
11/2 level, as described by Li et al. [
6] showing that the
4F
7/2 and
4S
3/2 states are thermally linked with each other and that their populations follow Boltzmann’s law, Equation (1). This trend of changes in emission intensities with temperature provides an excellent ground for the study of performance of three different Boltzmann-type luminescence intensity ratio (LIR) based temperature readings available with Er
3+. These are: LIR1—the conventional LIR which utilizes the ratio of two green (523 and 542 nm) upconversion emission intensities from
2H
11/2 and
4S
3/2 →
4I
15/2 transitions; LIR2—which utilizes the ratio of blue and green (485 and 542 nm) upconversion emission intensities from
4F
7/2 and
4S
3/2→
4I
15/2, and where there is a larger energy difference between thermally coupled excited energy levels than in the conventional LIR1 (the energy of
4F
7/2 level is higher than the energy of
2H
11/2); and LIR3—which utilizes the ratio of two NIR upconversion emission intensities (793 and 840 nm) from
2H
11/2 and
4S
3/2→
4I
13/2 transitions and which utilizes the same pair of excited levels as conventional LIR1, see
Figure 2a. The experimental values of these three LIRs are shown in
Figure 3a (LIR1—black square symbols, LIR2—red circle symbols, and LIR3—blue triangle symbols) in the
format that is obtained by taking the natural logarithm of Equation. (1). The
vs
is a linear function with a slope of
which is the energy difference between thermalized excited levels, which is obtained by fitting of experimental data represented as full lines in
Figure 3a (the 95% confidence intervals are given by dashed lines; the fitting parameters are given in
Table 1).
LIR1 and LIR3 showed identical sensitivity to temperature (the difference being within the experimental error), see
Table 1, which is expected since both LIRs are based on the same couple of thermalized energy levels (
2H
11/2 and
4S
3/2). The energy difference between these levels of about 600 cm
−1 obtained from the LIRs’ temperature dependence (
) was slightly lower than one obtained from the spectral measurements, which is a common case in luminescence thermometry [
20].
However, NIR upconversion emissions used for LIR3 were of much smaller intensities than green emissions used for LIR1, so that the uncertainty in the measurements of LIR3 was much larger than for that of LIR1, see
Table 2.
For this reason, the temperature resolution of LIR3 of
(at 313 K) was much worse than that of LIR1
(
;
– the relative standard deviation of measurement). LIR2 has two times larger sensitivity (2.03%K
−1 at 293 K) than LIR1 and LIR3, which is due to the two times larger energy difference between thermalized excited energy levels. This result confirms the assumption that relative sensitivities beyond the currently accepted limit for thermometry with Ln
3+ ions may be achieved if LIR utilizes the emission from the excited level of higher energy than one used in the traditional practice of Boltzmann-type LIR. Nevertheless, as in the case of LIR3, the emission from the high energy excited levels usually has a weak intensity, so the uncertainty in measurement may be large. Here, the temperature resolution obtained with LIR2 was
, two and a half times worse than with LIR1, meaning that the larger relative sensitivity of the LIR does not necessarily lead to a more precise measurement. On the other hand, from the trend in emission intensity changes with temperature shown in
Figure 2b, one may conclude that the use of emission from
4F
7/2 transition (LIR2) may increase in importance at higher temperatures than measured in this research, where its intensity may be comparable with the emission intensity of
2H
11/2. For such measurements, the luminescence probe ought to be temperature stable above 480 K.
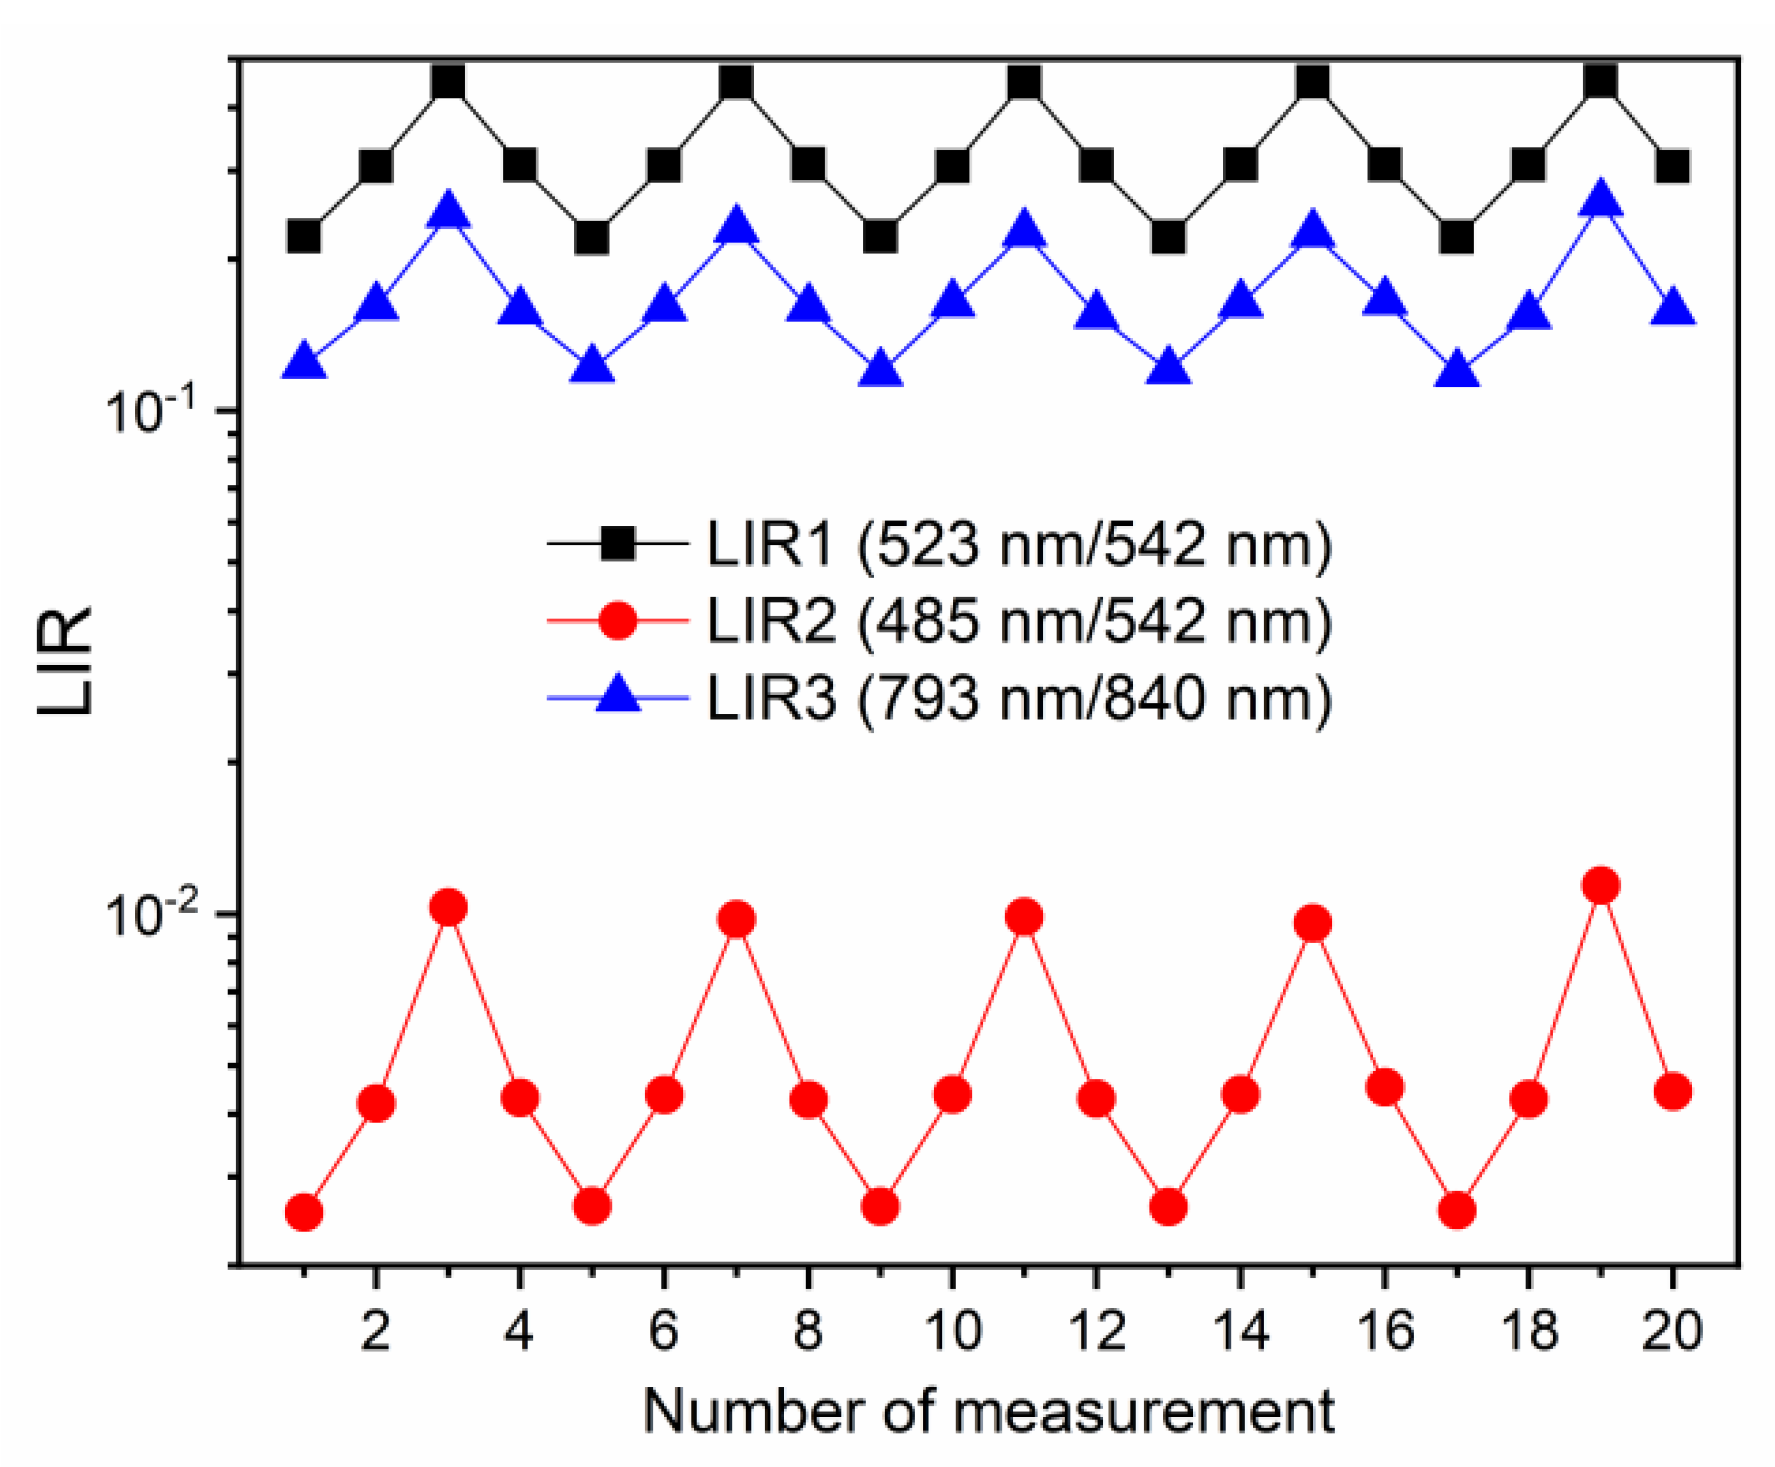
For the investigation of repeatability of measurements, LIR values were evaluated for 20 measurements, at 313 K, 353 K, and 413 K, in the heating and cooling sequences, and the results are depicted in
Figure 4 (LIR1—black square symbols; LIR2—red circle symbols, LIR3—blue triangle symbols). The repeatability of measurements was excellent with all three LIRs; the observed small variations in LIR values were on the level of uncertainty in measurements. Additionally, LIRs were unaffected by the heating/cooling, proving the temperature stability of the probe material in the used temperature measurement range. Such excellent results of repeatability testing are common in luminescence thermometry with Ln
3+ probes [
1].
It is important to note that this study has two limitations. Firstly, the power dependences of upconversion emission intensities on LIRs were not studied in detail (note that similar dependences on excitation power were found for all emission bands). Secondly, the conditions for obtaining the Boltzmann-based equilibrium between two excited levels were not checked (the nonradiative transition rates between the two levels should surpass the radiative transition rates within the considered temperature range) [
21]. These analyses, although important, were beyond the main aim of the study which was to show three different types of LIRs available with Er
3+ activated luminescence thermometry probes, and to compare their performance. Finally, one should be aware that continued exposure to excitation at 980 nm causes overheating in biological tissues due to a strong optical absorption of water and biological specimens [
22]. The problem may be overcome by using the 915 nm excitation as shown in Reference [
22] or by using Nd
3+ as a codopant which renders the system excitable at 800 nm [
23,
24]. However, in the latter case, the Er
3+ NIR LIR would be very difficult to measure.

 ,
, 


