Article

Quantitative and Selective Surface Plasmon Resonance Response Based on a Reduced Graphene Oxide–Polyamidoamine Nanocomposite for Detection of Dengue Virus E-Proteins

by
Nur Alia Sheh Omar
1,
Yap Wing Fen
1,2,*,
Jaafar Abdullah
2,
Amir Reza Sadrolhosseini
1,
Yasmin Mustapha Kamil
3,
Nurul ‘Illya Muhamad Fauzi
2,
Hazwani Suhaila Hashim
2 and
Mohd Adzir Mahdi
4
1
Institute of Advanced Technology, Universiti Putra Malaysia, Serdang 43400 UPM, Malaysia
2
Faculty of Science, Universiti Putra Malaysia, Serdang 43400 UPM, Malaysia
3
inLAZER Dynamics Sdn Bhd, InnoHub Unit, Putra Science Park, Universiti Putra Malaysia, Serdang 43400, Malaysia
4
Wireless and Photonics Network Research Centre, Faculty of Engineering, Universiti Putra Malaysia, Serdang 43400 UPM, Malaysia
*
Author to whom correspondence should be addressed.
Nanomaterials 2020, 10(3), 569; https://doi.org/10.3390/nano10030569
Submission received: 31 December 2019 / Revised: 31 January 2020 / Accepted: 11 February 2020 / Published: 21 March 2020
(This article belongs to the Special Issue Biosensors Based on Nanostructure Materials)

Abstract

:
Dengue viral infection is one of the most common deadliest diseases and has become a recurrent issue for public health in tropical countries. Although the spectrum of clinical diagnosis and treatment have recently been established, the efficient and rapid detection of dengue virus (DENV) during viremia and the early febrile phase is still a great challenge. In this study, a dithiobis (succinimidyl undecanoate, DSU)/amine-functionalized reduced graphene oxide-–polyamidoamine dendrimer (DSU/amine-functionalized rGO–PAMAM) thin film-based surface plasmon resonance (SPR) sensor was developed for the detection of DENV 2 E-proteins. Different concentrations of DENV 2 E-proteins were successfully tested by the developed SPR sensor-based system. The performance of the developed sensor showed increased shift in the SPR angle, narrow full-width–half-maximum of the SPR curve, high detection accuracy, excellent figure of merit and signal-to-noise ratio, good sensitivity values in the range of 0.08–0.5 pM (S = 0.2576°/pM, R2 = 0.92), and a high equilibrium association constant (KA) of 7.6452 TM−1. The developed sensor also showed a sensitive and selective response towards DENV 2 E-proteins compared to DENV 1 E-proteins and ZIKV (Zika virus) E-proteins. Overall, it was concluded that the Au/DSU/amine-functionalized rGO–PAMAM thin film-based SPR sensor has potential to serve as a rapid clinical diagnostic tool for DENV infection.

1. Introduction

The demand for rapid, sensitive, and quantifiable methods for the detection of dengue virus is significant. Optical sensors have emerged as a promising technology to potentially identify biological phenomena. They have the advantages of being highly sensitivity, allowing fast detection and real-time measurements, and having a simple configuration [1,2,3,4,5,6,7]. The main advantage of optical sensors is the possibility of performing label-free quantitative detection, which allows direct binding without fluorescent labels or isotope labelling [8,9,10,11,12,13,14]. Recently, two well-known optical sensors have been used to identify and quantify the dengue virus, i.e., the tapered optical fiber (TOF) and the surface plasmon resonance (SPR) sensors. A study using TOF revealed the successful detection of dengue virus (DENV) at 1 pM within 15 min [15]. However, this sensor requires precise alignment, high cleanliness and maintenance, and very careful handling, since the fibers can break easily [16,17]. To address these downsides, researchers are exploring the SPR sensor which has a low cost, is simple to use and environment-friendly, and provides high accuracy and fast measurements [18,19,20,21,22]. However, efficient and highly sensitive SPR sensors are still lacking. Therefore, in this work, we developed a quantitative SPR sensor with a novel biomolecular recognition function and improved sensitivity. Anchoring a stable biorecognition element on the gold surface of the sensor is important to support its antigen binding activity, because it allows a significant change in the angle of the reflectivity minimum and is thus well suited for dengue virus detection.
Graphene oxide (GO)-based sensors have received great attention due to their exciting properties including abundant functional groups, low thickness, very low mass, large specific area, high π-conjugation structure, and high mechanical strength [23,24,25,26,27,28]. Rich functional groups on GO could disturb conductive regions for resistance transduction, and heavily oxidized GO is not electrically conductive [29,30]. By chemical reduction of GO, the oxidized functional groups are removed resulting in reduce graphene oxide (rGO), which is a conductive material. The advantages of rGO with respect to GO are that it can be stored longer without agglomeration, is more stable in organic solvents, and has inferior electrical properties [31,32,33]. Interestingly, some oxygen groups on the rGO surface may be chemically functionalized for the preparation of composite materials. For instance, the functionalization of rGO with primary amines (-NH2) renders it hydrophilic and increases its interfacial binding to materials of interest, thus making it more adaptable as a sensing platform for the detection of dengue virus [34,35,36]. Likewise, combining globular-shaped dendrimer of polyamidoamine (PAMAM) with rGO provides great opportunities to enhance the sensitivity of detection. PAMAM dendrimers are believed to provide advantages in sensing applications as they are highly efficient in transporting bioactive agents and are not toxic at the dosages used [37,38,39,40].
With no effective and licensed vaccines, early detection of DENV is crucial to prevent severe clinical complications, which can cause failure of the circulatory system and the liver and death if not adequately managed. There are four distinct serotypes of dengue viruses, i.e., DENV 1 to DENV 4, and each serotype consists 3 structural proteins (capsid, membrane, envelope (E) protein) and 7 non-structural proteins [41,42,43,44,45,46,47]. Currently, the detection of the NS1 antigen from the dengue virus is the basis for early diagnosis and an ideal diagnostic marker of disease progression when antibody levels are not detectable [48,49]. The setback of NS1 detection, however, is its low sensitivity in the diagnosis of secondary dengue infection (DENV 2) compared to primary dengue infection (DENV 1) [50,51,52]; therefore, we did not focus on DENV 2 detection. Additionally, NS1 is a metabolic product that is induced by the virus infection after the viremia phase and therefore allows early detection of DENV, at the onset of infection. With the proposed sensor, our aim was to detect the virus itself through the E-proteins of DENV 2, which was our determinant. The E-proteins are the major virion surface proteins and seem to be a promising target since they contribute to the formation of the coat of the virus itself and therefore it are sufficient to mount an early immune response (in the viremia phase) [53].
Herein, we developed an SPR sensor based on an amine-functionalized rGO–PAMAM composite, with monoclonal antibodies immobilized on self-assembled dithiobis (succinimidyl undecanoate, DSU) to detect and quantify the dengue virus. The sensing performances of the proposed sensor, i.e., linear sensitivity, detection accuracy, full-width half maximum, signal-to-noise ratio, figure of merit, selectivity, and matrix effect are discussed in detail. To the best of our knowledge, this is the first report of the detection of DENV at the low concentration of 0.08 pM in 8 min using an Au/DSU/amine-functionalized rGO–PAMAM/IgM thin film-based SPR optical sensor.

2. Materials and Methods

2.1. Reagents

DSU (MW = 628.84 g/mol) was purchased from Dojindo Japan. Graphene oxide was purchased from Graphanea, Spain. PAMAM dendrimer (ethylenediamine core, generation 4.0 solution in methanol), ethylenediamine (EDA), N-hydroxysuccinimide (NHS), bovine serum albumin (BSA) were purchased from Sigma Aldrich, Germany. N-Ethyl-N-(3-(dimethylaminopropyl) carbodiimide (EDC) was bought from Fluka, Switzerland. The standard powder of recombinant DENV 2 E-proteins and antibodies (IgM) against dengue type 2 envelope proteins were purchased from Meridian Life Science. The preparation of amine-functionalized rGO was begun by amalgamating the graphene oxide with EDC for 5 min, followed by the addition of EDA. After the solution was vigorously stirred, the suspension was slowly dissolved and started to change its color from brown to dark black. Then, the suspension was washed for 5 times with ethanol and centrifuged to remove excessive EDA and EDC and then was allowed to dry in an oven at 60 °C for at least 1 h. Afterward, the PAMAM solution with the desired concentration was mixed to the amine-functionalized rGO to obtain a composite. Unless otherwise indicated, all antibodies and antigen solutions were diluted in 10 mM phosphate-buffered saline (PBS) at pH 7.4. All chemicals were of reagent or higher grade, and deionized water was used throughout the experiments.

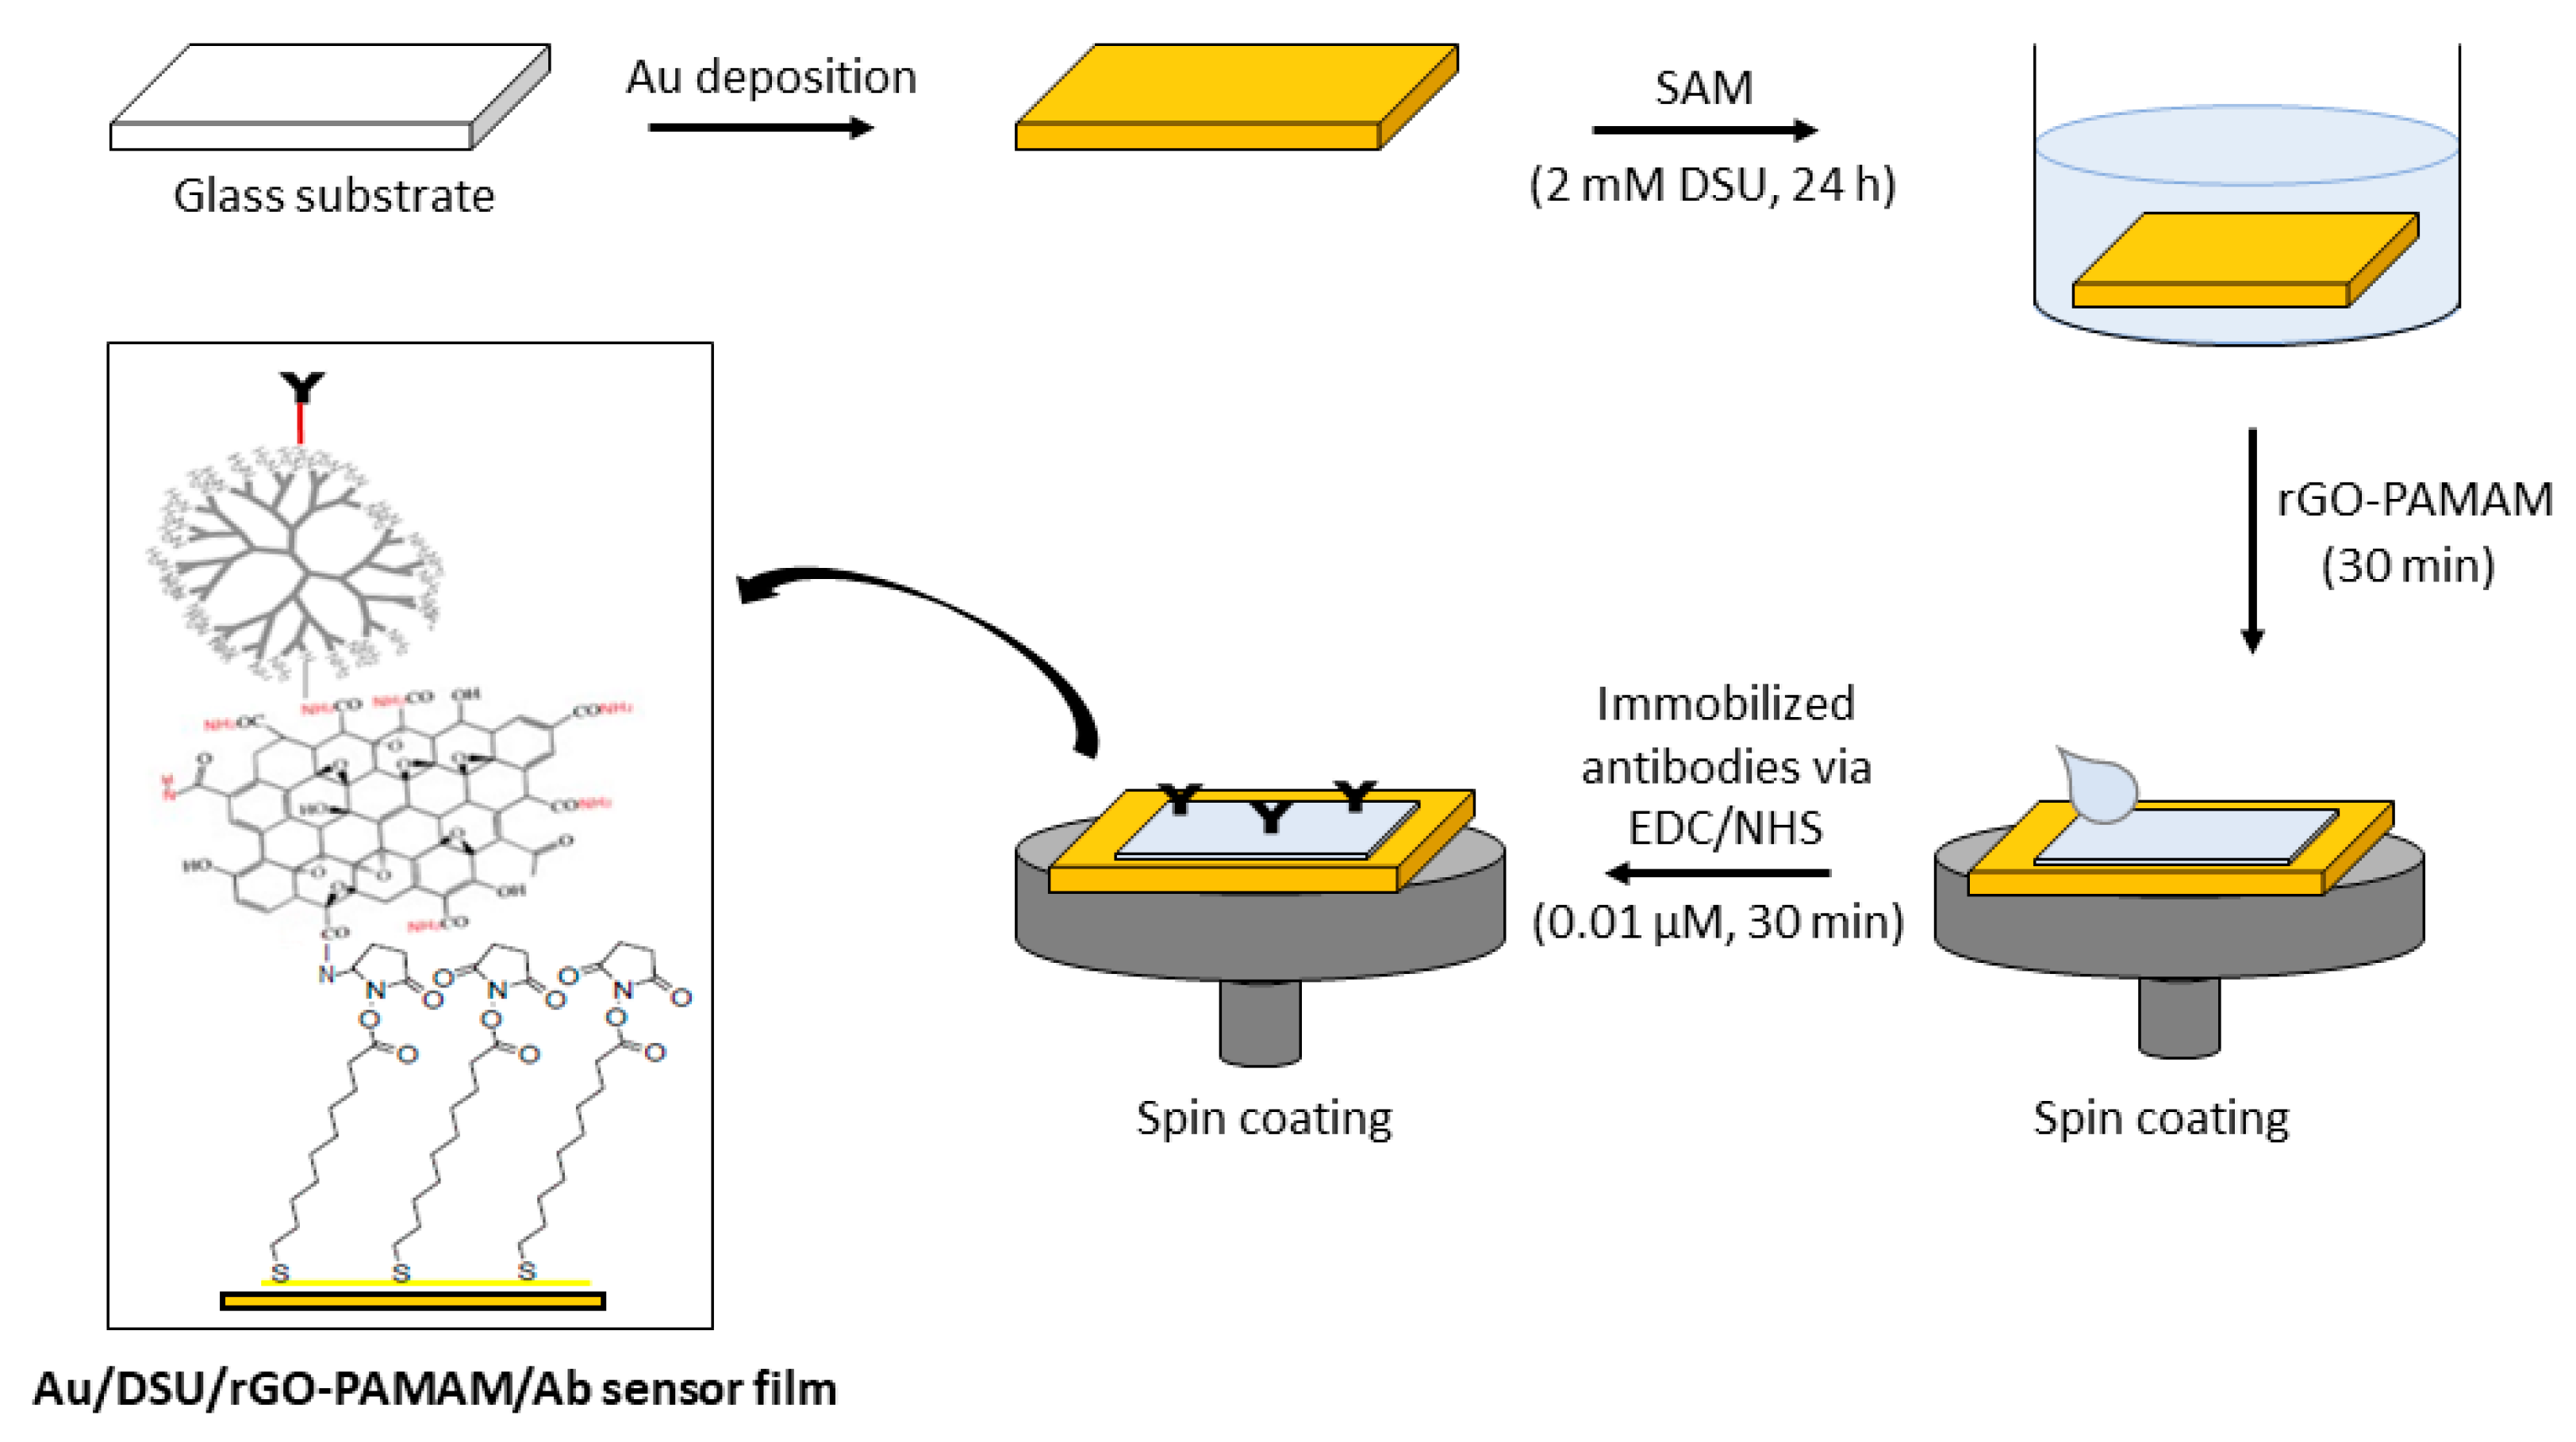
2.2. Sensor Surface Fabrication

To produce the best SPR peak for sensor application, a metal deposition technique to obtain a thin Au film (~50 nm) with high thickness tolerance is required. The generally used methods for metal thin-film deposition are electroplating, sputtering, and evaporation (such as vacuum thermal, electron beam, laser beam, and ion-plating evaporation) [54,55,56]. Sputter coating was chosen in this study because it achieves uniform thickness and high film quality, meeting the thickness tolerance requirement for the SPR experiment. It is also an easy-to-use, environment-friendly, and relatively low-cost technique.
Figure 1 shows the preparation procedure of the proposed sensor film. To begin, a glass substrate (Menzel glass, 24 mm × 24 mm) was coated with an Au film (~50 nm) using a sputter coater, with a deposition time of 67 s and a current of 20 mA. The prepared Au film was then rinsed thoroughly using deionized water and then ethanol and dried in a nitrogen flow. Afterward, the Au film was self-assembled in 2 mM DSU solution for 24 h to allow chemisorption of biomolecules through amide linkages. After rinsing with acetone and PBS, the gold substrate was incubated with amine-functionalized rGO–PAMAM for 30 min, followed by spinning. The amine-functionalized rGO–PAMAM-modified film was cross-linked with EDC/NHS for 30 min and spun at 6000 rpm for 30 s. After cross-linking, 0.01 µM antibodies specific to DENV 2 E-proteins was incubated over the surface for 30 min. This sensor film will be referred to as DSU/amine-functionalized rGO–PAMAM/IgM in the following discussion.

2.3. DENV E-Proteins Detection

For the detection of DENV 2 E-proteins, the sensor film was mounted on a prism with a refractive-index-matching liquid and loaded onto the SPR rotating stage for SPR measurements. Figure 2 shows the schematic diagram of our custom-made SPR experimental set up. In the beginning, 1 mL of PBS solution was injected into the measuring cell to obtain the baseline signal. Afterward, 1 mL of 0.08 pM DENV 2 E-proteins solution was injected into the measuring cell while monitoring the SPR response for 30 min. A triplicate SPR response was recorded for each concentration of DENV 2 E-proteins solution (0.08–1 pM) by using new sensor films. The changes of the SPR shift for each concentration of DENV 2 E-proteins were calculated by measuring the difference between the resonance angle of the sample and the PBS solution (as shown in Figure 2). The selectivity of the proposed sensor was also evaluated by comparing its SPR response to different concentrations of DENV 2 E-proteins with that to other proteins.

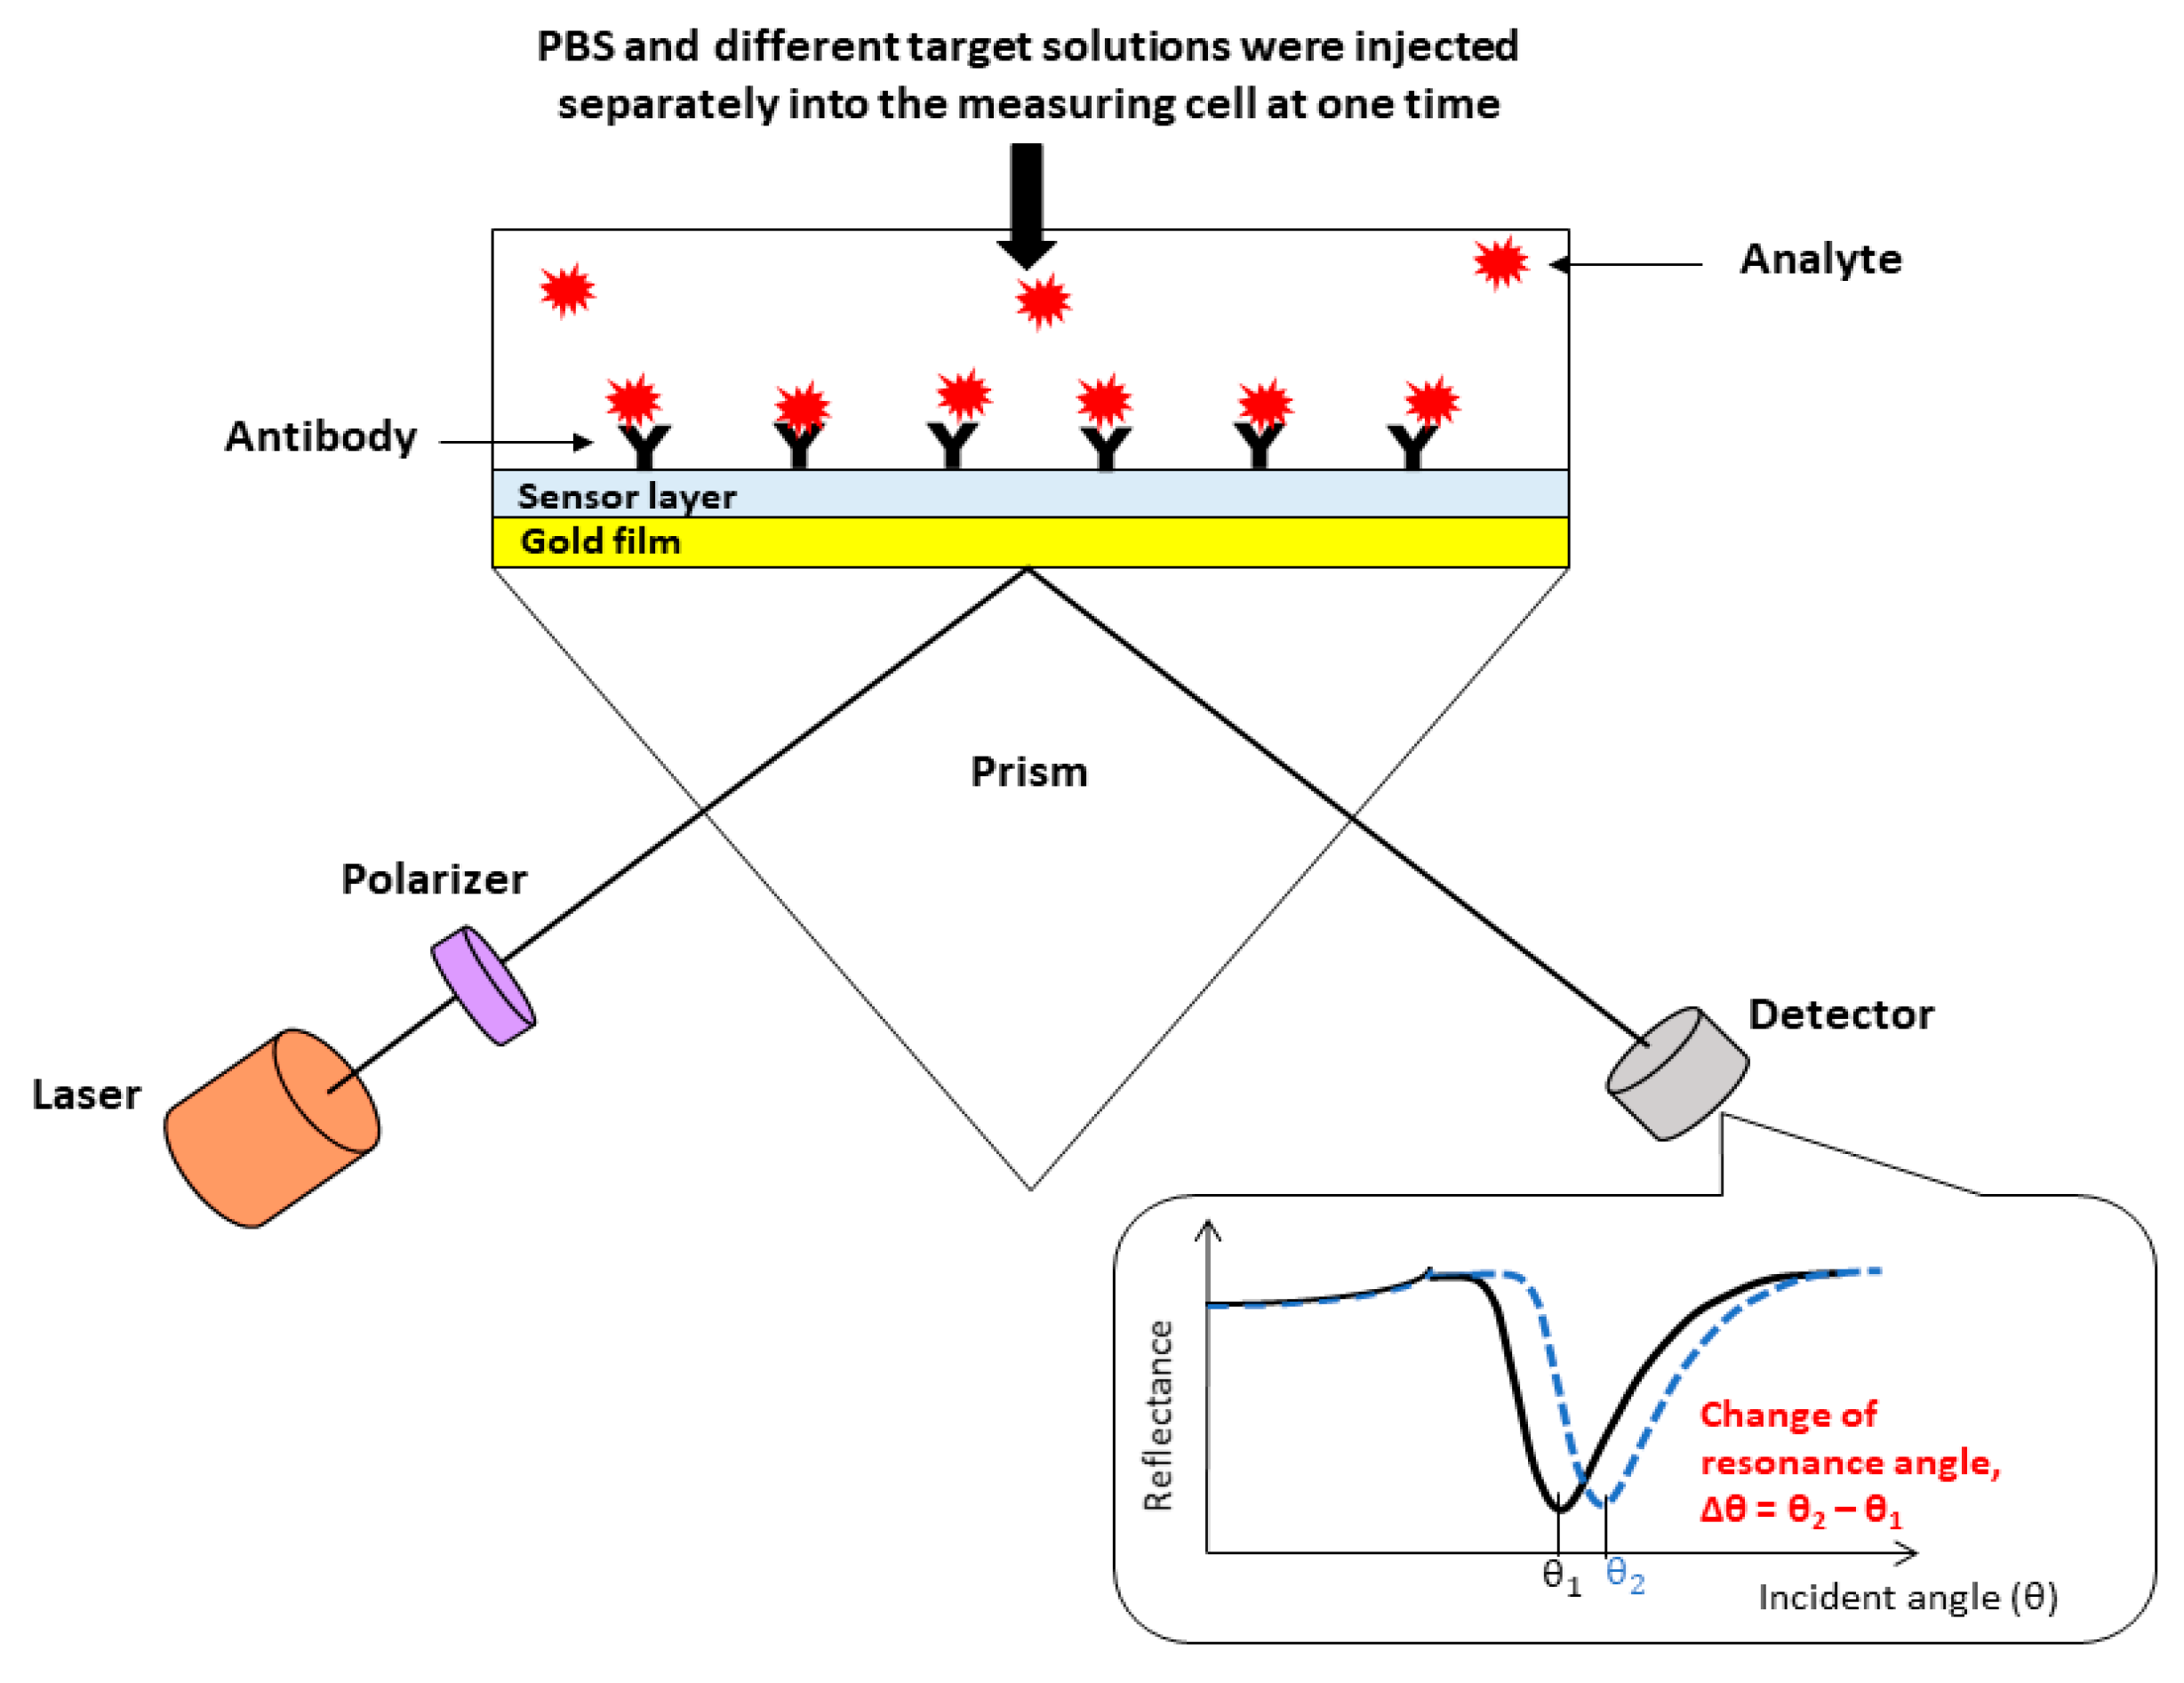
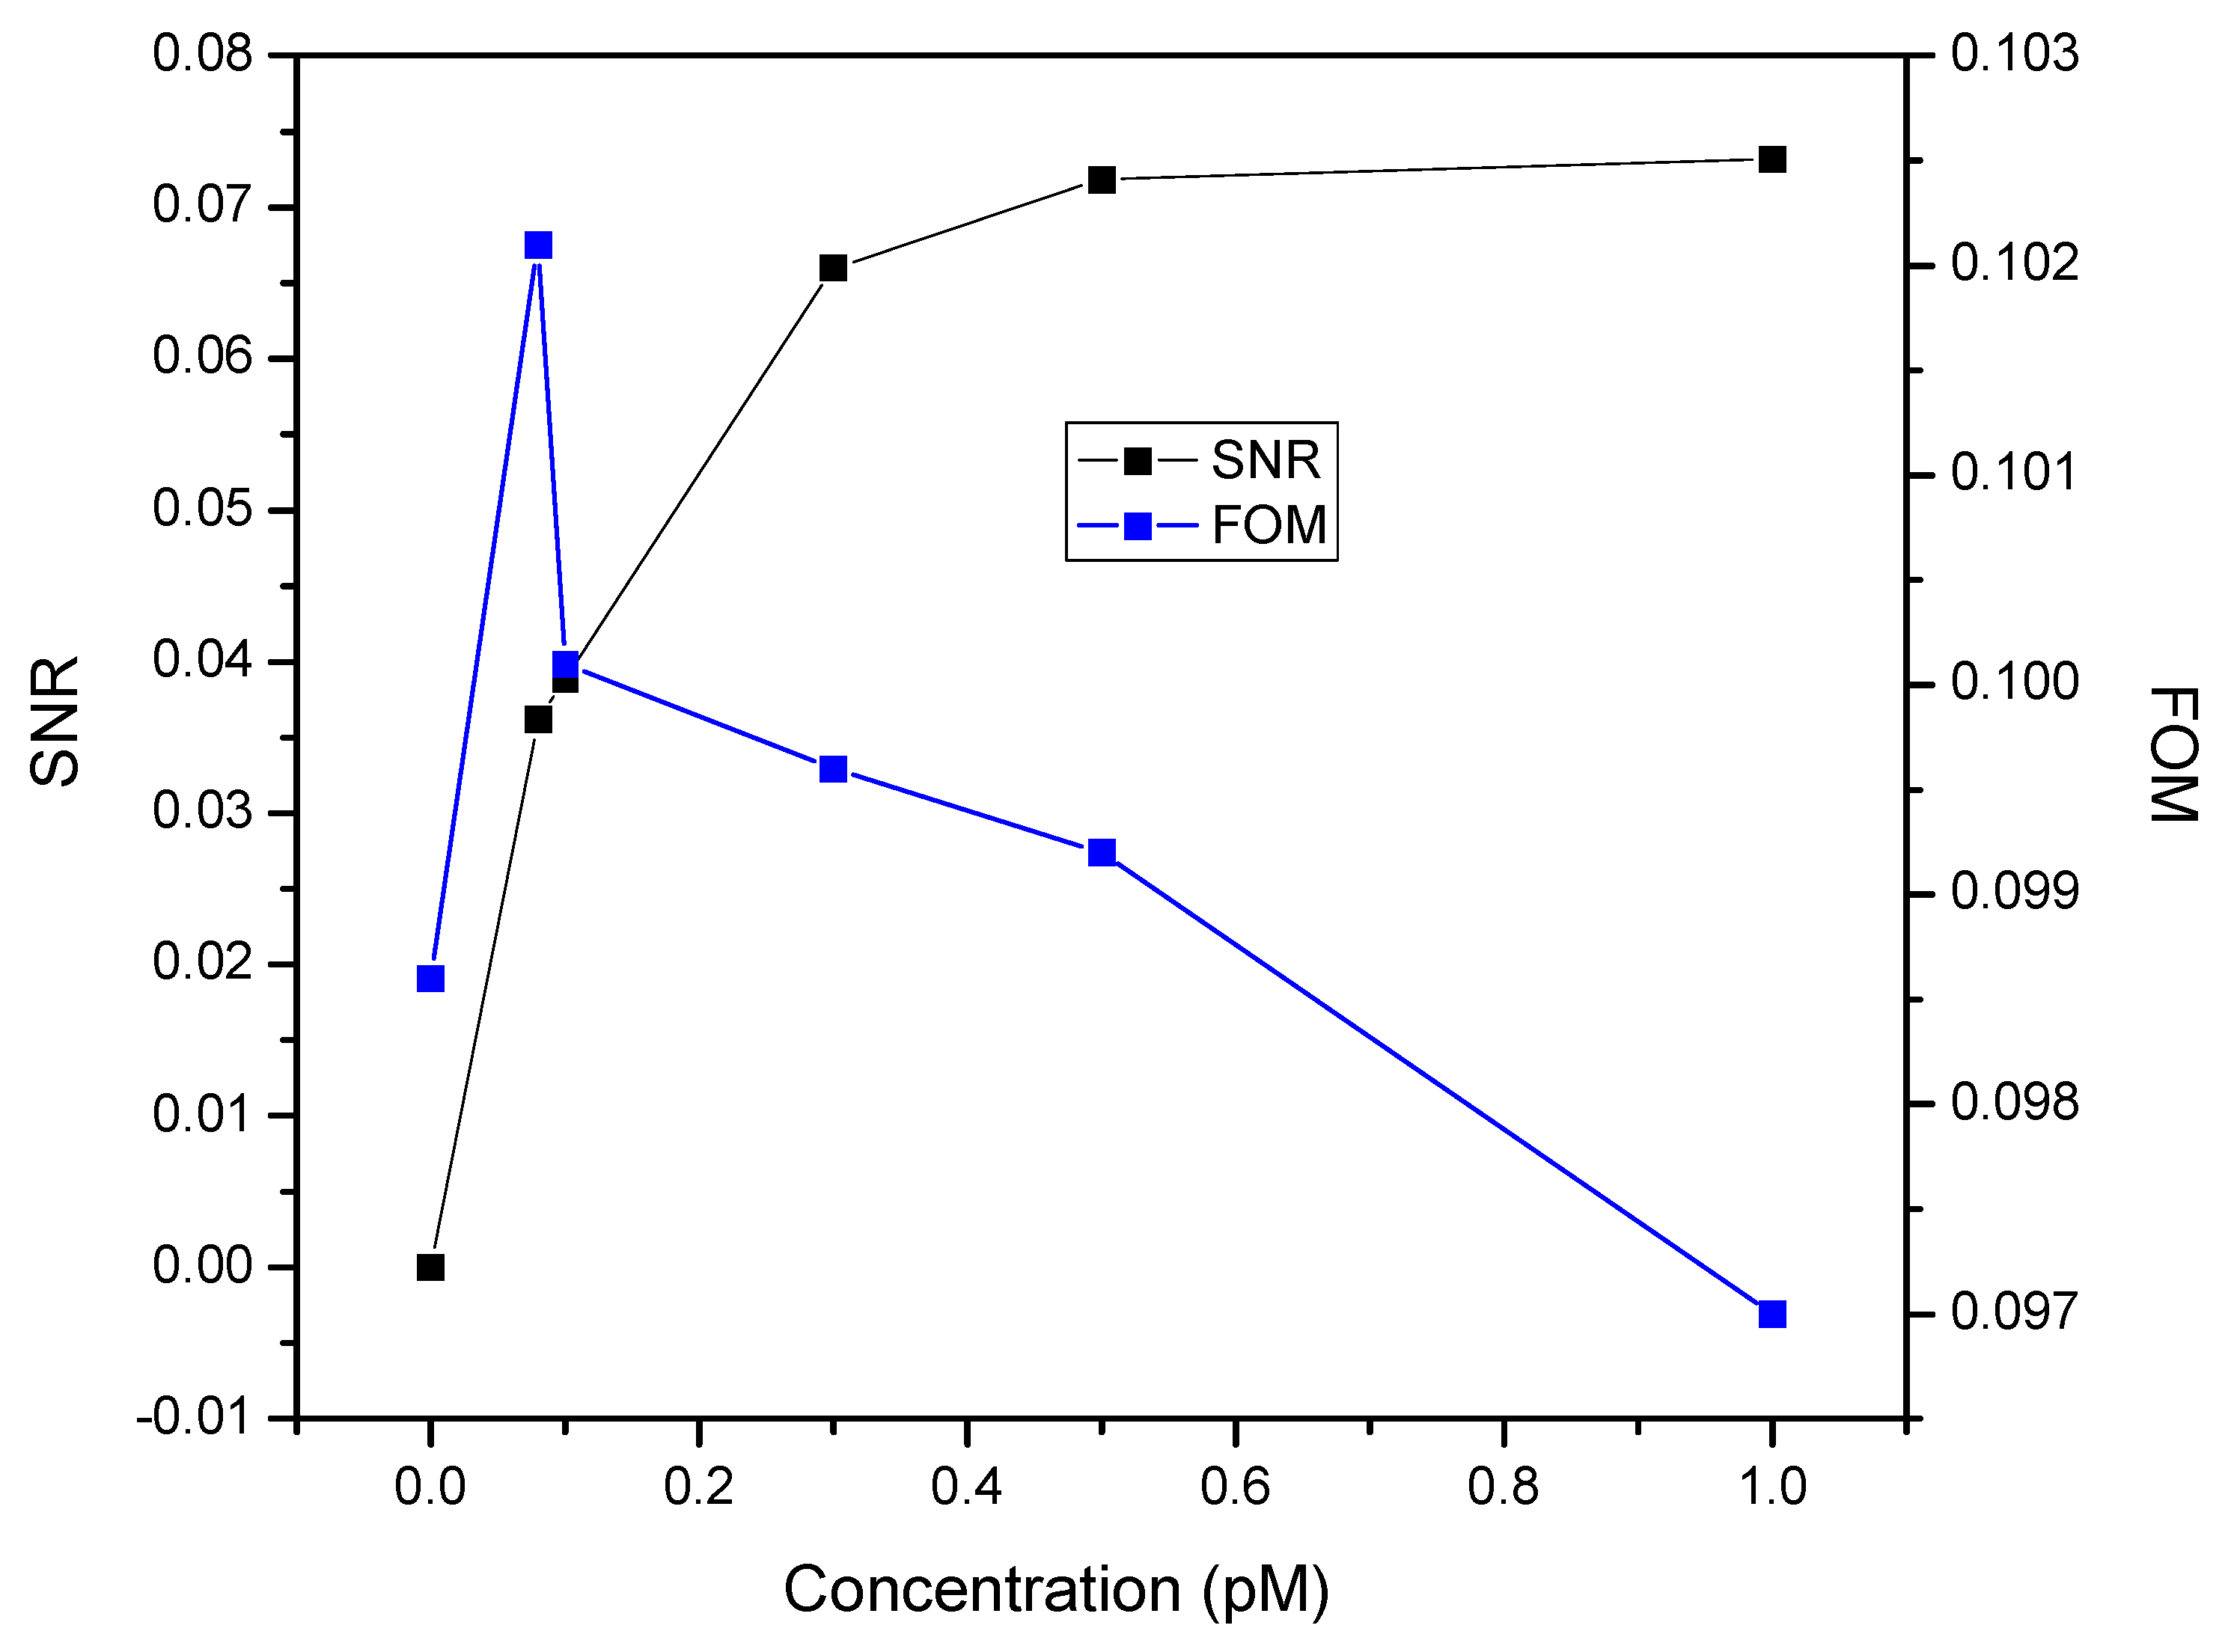
2.4. SPR Performances

There are several parameters, i.e., sensitivity, full width at half minimum (FWHM), detection accuracy (DA), signal-to-noise ratio (SNR), figure of merit (FOM), selectivity, and spike recovery that are used to analyze the performance of SPR sensors. The sensitivity of an SPR sensor can be defined by calculating the slope in the graph of the resonance angle shift, Δθ, versus DENV 2 E-protein concentrations, as follows:
S = Δ θ [ D E N V ]
A second parameter is the angular width of the SPR curve for the half value of the maximum reflectance, which is known as the FWH). The value of FWHM should be as small as possible in order to get an accurate reading on the dip of the SPR curve [57]. Therefore, the DA of the SPR sensor is y inversely proportional to the value of FWHM.
To comprehensively evaluate the performance of the SPR signal, the SNR can be determined according to
S N R = Δ θ F W H M
Finally, the FOM can be defined as the ratio between the spectral sensitivity and the width of the SPR curve and can be written as
F O M = S F W H M

2.5. Sensor Surface Characterization
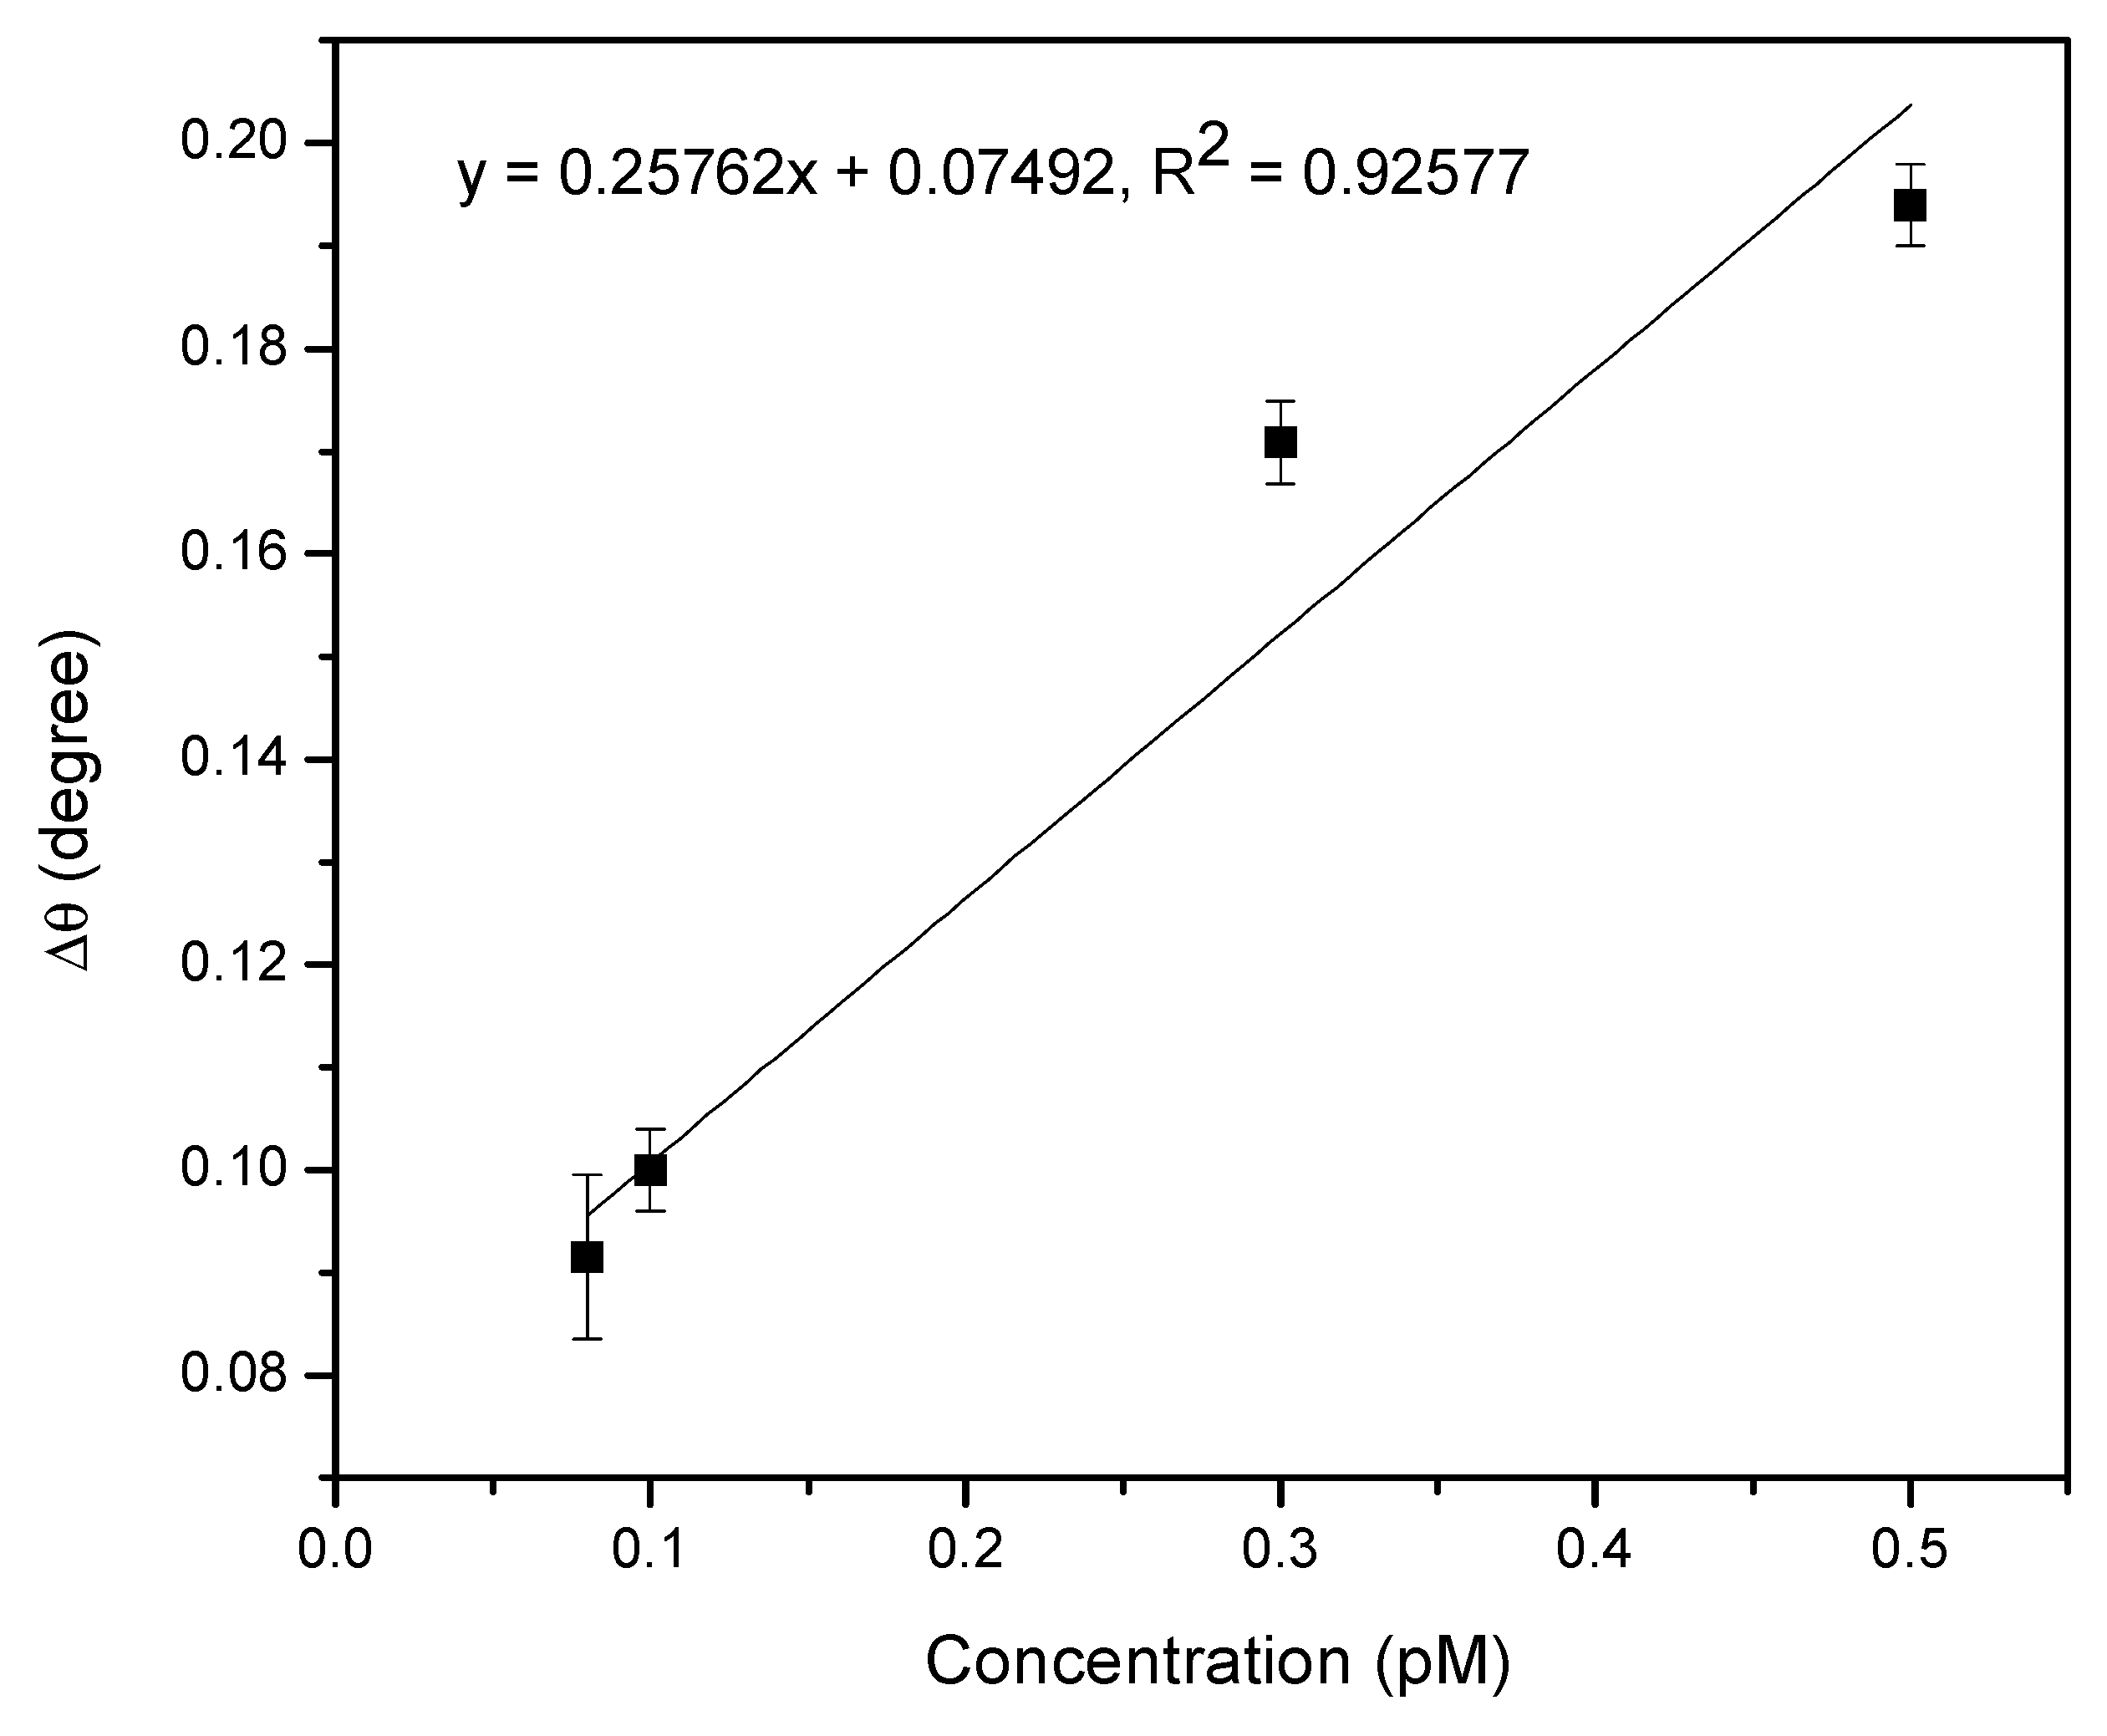
The surface morphology and roughness of the sensor films were imaged using an atomic force microscope (AFM, Bruker AFM multimode 8, Santa Barbara, CA, USA) in Scan Asyst mode. This measurement was performed in ambient atmosphere at room temperature.

3. Results

Figure 3 shows the SPR responses of the proposed sensor film for the detection of DENV 2 E-proteins. To verify the viability of the sensor film, various concentrations of DENV 2 E-proteins in the range of 0.08-1 pM were injected into the cell. The results showed that the resonance angle for the reference solution (0 pM), i.e., the PBS solution, was 54.2138°. When the proposed sensor was exposed to 0.08 pM DENV 2 E-proteins, the resonance angle of the reflected light increased to 54.3052°. Subsequently, for DENV 2 E-proteins concentrations of 0.1 pM, 0.3 pM, 0.5 pM, and 1 pM, the resonance angles from the SPR curves were found to be 54.3137°, 54.3925°, 54.4004°, and 54.4083°, respectively. To measure the amount of antigen bound to the sensor surface, the resonance angle shift (Δθ) was determined from the difference between the resonance angle of the antigen and the resonance angle of the reference solution. It was found that increases of Δθ of 0.0914°, 0.0999°, 0.1708°, 0.1866°, and 0.1945° were obtained when detecting 0.08 pM, 0.1 pM, 0.3 pM, 0.5 pM, and 1 pM DENV 2 E-proteins, respectively. These Δθ can be attributed to the changes in the refractive index of the sensor surface which in turn changed the real part of the dielectric constant of the gold film caused by the binding of DENV 2 E-proteins. It was inferred that a change of the thickness of the sensing layer would also result in a slight angle shift of SPR, as the evanescent wave possesses longer penetration depths [58,59]. The inset of Figure 3 shows how Δθ varied with time when detecting different concentrations of DENV 2 E-proteins. It can be seen that the proposed sensor achieved a stable detection time of 8 min for the lowest concentration of DENV 2 E-proteins. Therefore, all DENV E-proteins concentrations were left for 8 min before the SPR curve was recorded.
Figure 4 reports the evolution of FWHM and DA as a function of the concentration of DENV 2 E-proteins. As expected, the most extensive broadening of the SPR curves was observed when the proposed sensor surface was exposed to the highest concentration of DENV 2 E-proteins. This phenomenon was due to the increasing refractive index on the sensor surface caused by the kinetics of the binding between ligand and analyte [60]. The increase in surface roughness also led to broadening of the SPR curves as the coupling rate of SPR became poor. On the other hand, the resolution of the SPR signal decreased due to the increase in electron energy loss in the dense sensing layer. The minimum value of FWHM was achieved with the first introduction of DENV 2 E-proteins at the concentration of 0.08 pM. A more distinct and narrower SPR curve allows for higher accuracy of SPR sensors throughout measurements. Thus, the highest DA of 0.3964 degree1 was achieved in the detection of 0.00008 nM DENV E-proteins.
Figure 5 depicts the variation of SNR and FOM with the concentration of DENV 2 E-proteins. Expectedly, the SNR increased with the increase of the concentration of DENV 2 E-proteins. This indicated that a high concentration of DENV 2 E-proteins led to a lower noise of the signal, thus providing the maximum values of SNR. This effect was due to the stronger coupling of surface plasmon, which led to a stronger radiation damping of the surface [61,62]. In addition, the variation in SNR was almost similar to the binding kinetic analysis, as it is dependent on the resonance angle shift. Beyond that, a high FOM is required for a better quality of the SPR sensor. Apparently, a higher FOM was observed when a 0.08 pM DENV 2 E-proteins solution was introduced. The reason for the higher value of FOM at this concentration could be the smaller dissipation in metal upon the excitation of surface plasmon at a shorter wavelength, resulting in a narrow full width at half maximum of the SPR curve. Consequently, the FOM decreased with a further increase of the concentration of DENV 2 E-proteins . The decreasing of the FOM could be due to a faster decrease in the sensitivity compared to FWHM, which resulted in a notable uncertainty in determining the position of the resonance angle.
To investigate the binding between Au/DSU/amine-functionalized rGO–PAMAM/IgM-based SPR sensor and target, the changes in the resonance angle as a function of the concentration of DENV 2 E-proteins from 0.08 to 1 pM were plotted and fitted according to the Langmuir adsorption model (Figure 6), represented by the following equation [63,64]:
Δ θ = Δ θ max C K D + C
where Δθmax is the maximum SPR shift at saturation, C is the concentration of DENV, and KD is the equilibrium dissociation constant. Typically, the strength of biomolecular interactions is quantified through KD (reciprocal of KA). The fitted graph gave a KD of 0.1308 pM with R2 of 0.97, which was found to be consistent with the standard KD value for protein interactions (KD < 10 nM) [65,66]. A smaller KD value led to higher binding affinity of the ligand for its target. The apparent KA values for the binding of DENV 2 E-proteins to the sensor surface was 7.6452 TM−1, indicating the high potential for the use of the proposed SPR sensor in detecting DENV 2 E-proteins.
In order to determine the sensitivity of the proposed sensor film for DENV 2 E-proteins, a linear correlation curve was plotted and is presented in Figure 7. The results were fitted linearly with a correlation coefficient, R2, of 0.92. The slope of the linear fit was considered to be the sensitivity value of the proposed SPR sensor, thus yielding a sensitivity of 0.2576°/pM. It appears that DENV 2 E-proteins can be sensitively detected at the lowest concentration of 0.08 pM. This is possible thanks to the great penetration depth of the SPR evanescent field along the DSU/amine-functionalized rGO–PAMAM/IgM sensor layer.
Table 1 presents the performance of other techniques developed for DENV detection, in terms of sensitivity and detection limit [67,68,69,70,71]. From the table, it can be seen that the sensitivity of these techniques has not been extensively evaluated compared to their detection limit. Therefore, with respect to the detection limit, the lowest DENV concentration measured by our SPR sensor was 0.08 pM. The performance of our SPR sensor is highly dependent on its surface modification, which can cause significant changes in surface mass due to binding events, thus improving its sensing performance.
To determine the selectivity of the Au/DSU/amine-functionalized rGO–PAMAM/IgM sensor film towards DENV 2 E-proteins, other envelope proteins, such as DENV 1 E-proteins and ZIKV E-proteins, at the concentration of 10 pM were tested. An excellent sensor should be highly selective in the detection of DENV 2 E-proteins. The results are shown in Figure 8. Clearly, the highest SPR signal was obtained for the detection of DENV 2 E-proteins, even of their concentration was much lower than those of DENV 1 E-proteins and ZIKV E-proteins. This demonstrated that the proposed sensor is highly selective for the detection of DENV 2 E-proteins.
AFM images were taken before (Figure 9a) and after the introduction of DENV 2 E-proteins (Figure 9b) onto the surface of the Au/DSU/amine-functionalized rGO–PAMAM/IgM sensor. A crumpled and wrinkled morphology of the rGO–PAMAM structure is observed in both images. It can be observed that when DENV 2 E-proteins were present onto the sensor surface, the surface structure became less crumpled and wrinkled. The surface roughness of the sensor films increased from 1.56 to 3.19 nm upon the introduction of DENV 2 E-proteins. The change in surface roughness proves that the attachment of DENV 2 E-proteins changed the surface morphology of the sensing layer.

4. Conclusions

In this study, a DSU/amine-functionalized rGO–PAMAM thin film-based SPR sensor was developed for the detection and quantification of DENV 2 E-proteins. The results demonstrate that the developed sensor could successfully monitor the changes in the SPR angle when detecting the lowest concentration of DENV 2 E-proteins, i.e., 0.08 pM, within 8 min. The sensitivity and binding affinity constant of the developed sensor were 0.2576°/pM and 7.6452 TM−1. The highest FOM and DA values were obtained when detecting 0.08 pM of DENV 2 E-proteins and corresponded to the minimum values of SNR. The selectivity of the proposed sensor was demonstrated, since the SPR response to other proteins was reduced compared to that to DENV 2 E-proteins. It can be concluded that the developed SPR sensor has a great potentiality for rapid DENV diagnostic analyses or point-of-care tests.

Author Contributions

Conceptualization, Methodology, Writing-Original Draft Preparation, N.A.S.O.; Validation, Supervision, Writing—Review and Editing, Y.W.F.; Supervision, Writing-Review and Editing, and Resources, J.A.; Software and Conceptualization, A.R.S. and Y.M.K.; Visualization, N.I.M.F. and H.S.H.; Supervision, Writing—Review and Editing, and Resources, M.A.M. All authors have read and agreed to the published version of the manuscript.

Funding

The Exploratory Research Grant Scheme (ERGS/1/2012/STG08/UPM/01/29) and Fundamental Research Grant Scheme (FRGS/1/2019/STG02/UPM/02/1) supported this research.

Conflicts of Interest

The authors declare no conflict of interest.

References

  1. Shankaran, D.R.; Gobi, K.V.; Miura, N. Recent advancements in surface plasmon resonance immunosensors for detection of small molecules of biomedical, food, and environmental interest. Sens. Actuators B Chem. 2007, 121, 158–177. [Google Scholar] [CrossRef]
  2. Zainudin, A.A.; Fen, Y.W.; Yusof, N.A.; Al-Rekabi, S.H.; Mahdi, M.A.; Omar, N.A.S. Incorporation of surface plasmon resonance with novel valinomycin doped chitosan-graphene oxide thin film for sensing potassium ion. Spectrochim. Acta A Mol. Biomol. Spectrosc. 2018, 191, 111–115. [Google Scholar] [CrossRef] [PubMed]
  3. Rich, R.L.; Myszka, D.G. Survey of the year commercial optical biosensor literature. J. Mol. Recognit. 2008, 21, 355–400. [Google Scholar] [CrossRef]
  4. Omar, N.A.S.; Fen, Y.W. Recent development of SPR spectroscopy as potential method for diagnosis of dengue virus E-protein. Sens. Rev. 2017, 38, 106–116. [Google Scholar] [CrossRef]
  5. Daniyal, W.M.E.M.M.; Fen, Y.W.; Abdullah, J.; Sadrolhosseini, A.R.; Saleviter, S.; Omar, N.A.S. Label-free optical spectroscopy for characterizing binding properties of highly sensitive nanocrystalline cellulose-graphene oxide-based nanocomposite towards nickel ion. Spectrochim. Acta A Mol. Biomol. Spectrosc. 2019, 212, 25–31. [Google Scholar] [CrossRef] [PubMed]
  6. Saleviter, S.; Fen, Y.W.; Omar, N.A.S.; Daniyal, W.M.E.M.M.; Abdullah, J.; Zaid, M.H.M. Structural and optical studies of cadmium sulfide quantum dot-graphene oxide-chitosan nanocomposite thin film as a novel SPR spectroscopy active layer. J. Nanomater. 2018, 2018, 1–8. [Google Scholar] [CrossRef]
  7. Ahuja, D.; Parande, D. Optical sensors and their applications. J. Sci. Res. Rev. 2012, 1, 60–68. [Google Scholar]
  8. Homola, J.; Piliarik, M. Surface plasmon resonance (SPR) sensors. In Surface Plasmon Resonance-Based Sensors; Springer: Berlin/Heidelberg, Germany, 2006; pp. 45–67. [Google Scholar]
  9. Nguyen, H.; Park, J.; Kang, S.; Kim, M. Surface plasmon resonance: A versatile technique for biosensor applications. Sensors 2015, 15, 10481–10510. [Google Scholar] [CrossRef] [Green Version]
  10. Syahir, A.; Usui, K.; Tomizaki, K.Y.; Kajikawa, K.; Mihara, H. Label and label-free detection techniques for protein microarrays. Microarrays 2015, 4, 228–244. [Google Scholar] [CrossRef] [Green Version]
  11. Martins, T.D.; Ribeiro, A.C.C.; de Camargo, H.S.; da Costa Filho, P.A.; Cavalcante, H.P.M.; Dias, D.L. New insights on optical biosensors: Techniques, construction and application. In State of the Art in Biosensors—General Aspects; InTech Open: London, UK, 2013; pp. 112–139. [Google Scholar]
  12. Daaboul, G.G.; Lopez, C.A.; Yurt, A.; Goldberg, B.B.; Connor, J.H.; Ünlü, M.S. Label-free optical biosensors for virus detection and characterization. IEEE J. Sel. Top. Quantum Electron. 2011, 18, 1422–1433. [Google Scholar] [CrossRef]
  13. Peltomaa, R.; Glahn-Martínez, B.; Benito-Peña, E.; Moreno-Bondi, M. Optical biosensors for label-free detection of small molecules. Sensors 2018, 18, 1–46. [Google Scholar] [CrossRef] [PubMed] [Green Version]
  14. Wilson, R.H.; Vishwanath, K.; Mycek, M.A. Optical methods for quantitative and label-free sensing in living human tissues: Principles, techniques, and applications. Adv. Phys. X 2016, 1, 523–543. [Google Scholar] [CrossRef] [PubMed]
  15. Kamil, Y.M.; Bakar, M.H.A.; Yaacob, M.H.; Syahir, A.; Lim, H.N.; Mahdi, M.A. Dengue E protein detection using a graphene oxide integrated tapered optical fiber sensor. IEEE J. Sel. Top. Quantum Electron. 2018, 25, 1–8. [Google Scholar] [CrossRef]
  16. Sabri, N.; Aljunid, S.A.; Salim, M.S.; Fouad, S. Fiber optic sensors: Short review and applications. In Recent Trends in Physics of Material Science and Technology; Springer: Singapore, 2015; pp. 299–311. [Google Scholar]
  17. Perrotton, C.; Westerwaal, R.J.; Javahiraly, N.; Slaman, M.; Schreuders, H.; Dam, B.; Meyrueis, P. A reliable, sensitive and fast optical fiber hydrogen sensor based on surface plasmon resonance. Opt. Express 2013, 21, 382–390. [Google Scholar] [CrossRef] [PubMed] [Green Version]
  18. Prabowo, B.; Purwidyantri, A.; Liu, K.C. Surface plasmon resonance optical sensor: A review on light source technology. Biosensors 2018, 8, 1–27. [Google Scholar] [CrossRef] [Green Version]
  19. Zhang, H.; Chen, Y.; Wang, H.; Hu, S.; Xia, K.; Xiong, X.; Huang, W.; Lu, H.; Yu, J.; Guan, H.; et al. Titanium dioxide nanoparticle modified plasmonic interface for enhanced refractometric and biomolecular sensing. Opt. Express 2018, 26, 33226–33237. [Google Scholar] [CrossRef]
  20. Omar, N.A.S.; Fen, Y.W.; Abdullah, J.; Chik, C.E.N.C.E.; Mahdi, M.A. Development of an optical sensor based on surface plasmon resonance phenomenon for diagnosis of dengue virus E-protein. Sens. Biosens. Res. 2018, 20, 16–21. [Google Scholar] [CrossRef]
  21. Fen, Y.W.; Yunus, W.M.M. Surface plasmon resonance spectroscopy as an alternative for sensing heavy metal ions: A review. Sens. Rev. 2013, 33, 304–314. [Google Scholar]
  22. Homola, J. Surface plasmon resonance sensors for detection of chemical and biological species. Chem. Rev. 2008, 108, 462–493. [Google Scholar] [CrossRef]
  23. Kuilla, T.; Bhadra, S.; Yao, D.; Kim, N.H.; Bose, S.; Lee, J.H. Recent advances in graphene-based polymer composites. Prog. Polym. Sci. 2010, 35, 1350–1375. [Google Scholar] [CrossRef]
  24. Zainudin, A.A.; Fen, Y.W.; Yusof, N.A.; Omar, N.A.S. Structural, optical and sensing properties of ionophore doped graphene based bionanocomposite thin film. Optik 2017, 144, 308–315. [Google Scholar] [CrossRef]
  25. Suvarnaphaet, P.; Pechprasarn, S. Graphene-based materials for biosensors: A review. Sensors 2017, 17, 1–24. [Google Scholar] [CrossRef] [Green Version]
  26. Priyadarsini, S.; Mohanty, S.; Mukherjee, S.; Basu, S.; Mishra, M. Graphene and graphene oxide as nanomaterials for medicine and biology application. J. Nanostruct. Chem. 2018, 8, 123–137. [Google Scholar] [CrossRef] [Green Version]
  27. Ramdzan, N.S.M.; Fen, Y.W.; Omar, N.A.S.; Anas, N.A.A.; Daniyal, W.M.E.M.M.; Saleviter, S.; Zainudin, A.A. Optical and surface plasmon resonance sensing properties for chitosan/carboxyl-functionalized graphene quantum dots thin film. Optik 2019, 178, 802–812. [Google Scholar] [CrossRef]
  28. Sun, H.; Wu, L.; Wei, W.; Qu, X. Recent advances in graphene quantum dots for sensing. Mater. Today 2013, 16, 433–442. [Google Scholar] [CrossRef]
  29. Balandin, A.A. Thermal properties of graphene and nanostructured carbon materials. Nat. Mater. 2011, 10, 569–581. [Google Scholar] [CrossRef] [Green Version]
  30. Gómez-Navarro, C.; Weitz, R.T.; Bittner, A.M.; Scolari, M.; Mews, A.; Burghard, M.; Kern, K. Electronic transport properties of individual chemically reduced graphene oxide sheets. Nano Lett. 2007, 7, 3499–3503. [Google Scholar] [CrossRef]
  31. Gilje, S.; Han, S.; Wang, M.; Wang, K.L.; Kaner, R.B. A chemical route to graphene for device applications. Nano Lett. 2007, 7, 3394–3398. [Google Scholar] [CrossRef]
  32. Sinitskii, A.; Fursina, A.A.; Kosynkin, D.V.; Higginbotham, A.L.; Natelson, D.; Tour, J.M. Electronic transport in monolayer graphene nanoribbons produced by chemical unzipping of carbon nanotubes. Appl. Phys. Lett. 2009, 95, 253108. [Google Scholar] [CrossRef]
  33. Lu, C.; Huang, P.J.J.; Liu, B.; Ying, Y.; Liu, J. Comparison of graphene oxide and reduced graphene oxide for DNA adsorption and sensing. Langmuir 2016, 32, 10776–10783. [Google Scholar] [CrossRef]
  34. Xing, F.; Liu, Z.B.; Deng, Z.C.; Kong, X.T.; Yan, X.Q.; Chen, X.D.; Ye, Q.; Zhang, C.P.; Chen, Y.S.; Tian, J.G. Sensitive real-time monitoring of refractive indexes using a novel graphene-based optical sensor. Sci. Rep. 2012, 2, 1–7. [Google Scholar] [CrossRef] [Green Version]
  35. Navaee, A.; Salimi, A. Efficient amine functionalization of graphene oxide through the Bucherer reaction: An extraordinary metal-free electrocatalyst for the oxygen reduction reaction. RSC Adv. 2015, 5, 59874–59880. [Google Scholar] [CrossRef]
  36. Guo, L.; Yan, H.; Chen, Z.; Liu, Q.; Feng, Y.; Ding, F.; Nie, Y. Amino functionalization of reduced graphene oxide/tungsten disulfide hybrids and their bismaleimide composites with enhanced mechanical properties. Polymers 2018, 10, 1–13. [Google Scholar] [CrossRef] [Green Version]
  37. Hidayah, N.M.S.; Liu, W.W.; Lai, C.W.; Noriman, N.Z.; Khe, C.S.; Hashim, U.; Lee, H.C. Comparison on graphite, graphene oxide and reduced graphene oxide: Synthesis and characterization. In Proceedings of the AIP Conference Proceedings, Penang, Malaysia, 8–9 August 2017; AIP Publishing: Melville, NY, USA, 2017; Volume 1892, p. 150002. [Google Scholar]
  38. Zhu, J.; Ye, Z.; Fan, X.; Wang, H.; Wang, Z.; Chen, B. A highly sensitive biosensor based on au NPs/rGo-PaMaM-Fc nanomaterials for detection of cholesterol. Int. J. Nanomed. 2019, 14, 835–849. [Google Scholar] [CrossRef] [Green Version]
  39. Bharti, J.P.; Prajapati, S.K.; Jaiswal, M.K.; Yadav, R.D. Dendrimer multifunctional nano-device: A review. Int. J. Pharm. Sci. Res. 2011, 2, 1947–1960. [Google Scholar]
  40. Calabretta, M.K.; Kumar, A.; McDermott, A.M.; Cai, C. Antibacterial activities of poly (amidoamine) dendrimers terminated with amino and poly (ethylene glycol) groups. Biomacromolecules 2007, 8, 1807–1811. [Google Scholar] [CrossRef] [Green Version]
  41. Tripathy, S.; Das, M.K. Dendrimers and their applications as novel drug delivery carriers. J. Appl. Pharm. Sci. 2013, 3, 142–149. [Google Scholar]
  42. Navakul, K.; Warakulwit, C.; Yenchitsomanus, P.; Panya, A.; Lieberzeit, P.; Sangma, C. A novel method for dengue virus detection and antibody screening using a graphene-polymer based electrochemical biosensor. Nanomedicine 2017, 13, 549–557. [Google Scholar] [CrossRef]
  43. Rice, C.M.; Lenches, E.M.; Eddy, S.R.; Shin, S.J.; Sheets, R.L.; Strauss, J.H. Nucleotide sequence of yellow fever virus: Implications for flavivirus gene expression and evolution. Science 1985, 229, 726–733. [Google Scholar] [CrossRef] [Green Version]
  44. Barrero, P.R.; Mistchenko, A.S. Complete genome sequencing of dengue virus type 1 isolated in Buenos Aires, Argentina. Virus Res. 2004, 101, 135–145. [Google Scholar] [CrossRef]
  45. Guzmán, M.G.; Kouri, G. Dengue diagnosis, advances and challenges. Int. J. Infect. Dis. 2004, 8, 69–80. [Google Scholar] [CrossRef] [Green Version]
  46. Chawla, P.; Yadav, A.; Chawla, V. Clinical implications and treatment of dengue. Asian Pac. J. Trop. Med. 2014, 7, 169–178. [Google Scholar] [CrossRef] [Green Version]
  47. Dhanoa, A.; Hassan, S.S.; Ngim, C.F.; Lau, C.F.; Chan, T.S.; Adnan, N.A.A.; Eng, W.W.H.; Gan, H.M.; Rajasekram, G. Impact of dengue virus (DENV) co-infection on clinical manifestations, disease severity and laboratory parameters. BMC Infect. Dis. 2016, 16, 1–14. [Google Scholar] [CrossRef] [Green Version]
  48. Gelanew, T.; Hunsperger, E. Development and characterization of serotype-specific monoclonal antibodies against the dengue virus-4 (DENV-4) non-structural protein (NS1). Virol. J. 2018, 15, 1–12. [Google Scholar] [CrossRef] [Green Version]
  49. Fry, S.R.; Meyer, M.; Semple, M.G.; Simmons, C.P.; Sekaran, S.D.; Huang, J.X.; McElnea, C.; Huang, C.; Valks, A.; Young, P.R.; et al. The diagnostic sensitivity of dengue rapid test assays is significantly enhanced by using a combined antigen and antibody testing approach. PLoS Negl. Trop. Dis. 2011, 5, 1–8. [Google Scholar] [CrossRef] [Green Version]
  50. Wong, W.R.; Sekaran, S.D.; Adikan, F.R.M.; Berini, P. Detection of dengue NS1 antigen using long-range surface plasmon waveguides. Biosens. Bioelectron. 2016, 78, 132–139. [Google Scholar] [CrossRef]
  51. Kumarasamy, V.; Chua, S.K.; Hassan, Z.; Wahab, A.H.A.; Chem, Y.K.; Mohamad, M.; Chua, K.B. Evaluating the sensitivity of a commercial dengue NSI antigen—Capture ELISA for early diagnosis of acute dengue virus infection. Singap. Med. J. 2007, 48, 669–673. [Google Scholar]
  52. Bessoff, K.; Delorey, M.; Sun, W.; Hunsperger, E. Comparison of two commercially available dengue virus (DENV) NS1 capture enzyme-linked immunosorbent assays using a single clinical sample for diagnosis of acute DENV infection. Clin. Vaccine Immunol. 2008, 15, 1513–1518. [Google Scholar] [CrossRef] [Green Version]
  53. Chávez, J.H.; Silva, J.R.; Amarilla, A.A.; Figueiredo, L.T.M. Domain III peptides from flavivirus envelope protein are useful antigens for serologic diagnosis and targets for immunization. Biologicals 2010, 38, 613–618. [Google Scholar] [CrossRef]
  54. Sarma, S.; Lee, J.H. Developing efficient thin film temperature sensors utilizing layered carbon nanotube films. Sensors 2018, 18, 1–10. [Google Scholar] [CrossRef] [Green Version]
  55. Green, T.A. Gold electrodeposition for microelectronic, optoelectronic and microsystem applications. Gold Bull. 2007, 40, 105–114. [Google Scholar] [CrossRef] [Green Version]
  56. Jilani, A.; Abdel-Wahab, M.S.; Hammad, A.H. Advance deposition techniques for thin film and coating. In Modern Technologies for Creating the Thin-Film Systems and Coatings; IntechOpen: London, UK, 2017; Volume 2, pp. 137–149. [Google Scholar]
  57. Jha, R.; Sharma, A.K. High-performance sensor based on surface plasmon resonance with chalcogenide prism and aluminum for detection in infrared. Opt. Lett. 2009, 34, 749–751. [Google Scholar] [CrossRef] [PubMed]
  58. Maharana, P.K.; Jha, R. Chalcogenide prism and graphene multilayer based surface plasmon resonance affinity biosensor for high performance. Sens Actuators B Chem. 2012, 169, 161–166. [Google Scholar] [CrossRef]
  59. Yoon, S.J.; Kim, D. Thin-film-based field penetration engineering for surface plasmon resonance biosensing. JOSA A 2007, 24, 2543–2549. [Google Scholar] [CrossRef] [PubMed]
  60. Kushwaha, A.S.; Kumar, A.; Kumar, R.; Srivastava, M.; Srivastava, S.K. Zinc oxide, gold and graphene-based surface plasmon resonance (SPR) biosensor for detection of pseudomonas like bacteria: A comparative study. Optik 2018, 172, 697–707. [Google Scholar] [CrossRef]
  61. Han, X.; Liu, K.; Sun, C. Plasmonics for biosensing. Materials 2019, 12, 1–24. [Google Scholar] [CrossRef] [Green Version]
  62. Yin, L.Y.; Huang, Y.H.; Wang, X.; Ning, S.T.; Liu, S.D. Double Fano resonances in nanoring cavity dimers: The effect of plasmon hybridization between dark subradiant modes. Aip Adv. 2014, 4, 1–12. [Google Scholar] [CrossRef] [Green Version]
  63. Omar, N.A.S.; Fen, Y.W.; Abdullah, J.; Zaid, M.H.M.; Daniyal, W.M.E.M.M.; Mahdi, M.A. Sensitive surface plasmon resonance performance of cadmium sulphide quantum dots-amine functionalized graphene oxide based thin film towards dengue virus E-proteins. Opt. Laser Technol. 2019, 114, 204–208. [Google Scholar] [CrossRef]
  64. Omar, N.A.S.; Fen, Y.W.; Abdullah, J.; Zaid, M.H.M.; Mahdi, M.A. Structural, optical and sensing properties of CdS-NH2GO thin film as a dengue virus E-protein sensing material. Optik 2018, 171, 934–940. [Google Scholar] [CrossRef]
  65. Hoet, M.; Cohen, E.H.; Kent, R.B.; Rookey, K.; Schoonbroodt, S.; Hogan, S.; Rem, L.; Frans, N.; Daukandt, M.; Pieters, H.; et al. Generation of high-affinity human antibodies by combining donor-derived and synthetic complementarity-determining-region diversity. Nat. Biotechnol. 2005, 23, 344–348. [Google Scholar] [CrossRef]
  66. Salahudeen, M.S.; Nishtala, P.S. An overview of pharmacodynamic modelling, ligand-binding approach and its application in clinical practice. Saudi Pharm. J. 2017, 25, 165–175. [Google Scholar] [CrossRef] [Green Version]
  67. Alcon, S.; Talarmin, A.; Debruyne, M.; Falconar, A.; Deubel, V.; Flamand, M. Enzyme-linked immunosorbent assay specific to Dengue virus type 1 nonstructural protein NS1 reveals circulation of the antigen in the blood during the acute phase of disease in patients experiencing primary or secondary infections. J. Clin. Microbiol. 2002, 40, 376–381. [Google Scholar] [CrossRef] [Green Version]
  68. Camara, A.R.; Gouvêa, P.M.; Dias, A.C.M.; Braga, A.M.; Dutra, R.F.; de Araujo, R.E.; Carvalho, I.C. Dengue immunoassay with an LSPR fiber optic sensor. Opt. Express 2013, 21, 27023–27031. [Google Scholar] [CrossRef] [PubMed]
  69. Cavalcanti, I.T.; Silva, B.V.M.; Peres, N.G.; Moura, P.; Sotomayor, M.D.P.T.; Guedes, M.I.F.; Dutra, R.F. A disposable chitosan-modified carbon fiber electrode for dengue virus envelope protein detection. Talanta 2012, 91, 41–46. [Google Scholar] [CrossRef] [PubMed]
  70. Kamil, Y.M.; Bakar, M.A.; Mustapa, M.A.; Yaacob, M.H.; Abidin, N.H.Z.; Syahir, A.; Lee, H.J.; Mahdi, M.A. Label-free Dengue E protein detection using a functionalized tapered optical fiber sensor. Sens. Actuators B Chem. 2018, 257, 820–828. [Google Scholar] [CrossRef]
  71. Jahanshahi, P.; Wei, Q.; Jie, Z.; Ghomeishi, M.; Sekaran, S.D.; Mahamd Adikan, F.R. Kinetic analysis of IgM monoclonal antibodies for determination of dengue sample concentration using SPR technique. Bioengineered 2017, 8, 239–247. [Google Scholar] [CrossRef] [Green Version]
Figure 1. Preparation procedure of the proposed sensor film. SAM: self-assembled monolayer, EDC: N-ethyl-N-(3-(dimethylaminopropyl) carbodiimide, NHS: N-hydroxysuccinimide, DSU/rGO–PAMAM: dithiobis (succinimidyl undecanoate)/ reduce graphene oxide–polyamidoamine.
Nanomaterials 10 00569 g001
Figure 2. Schematic of the custom-made surface plasmon resonance (SPR) set up (with the illustration of the SPR curve and the change of the resonance angle).
Nanomaterials 10 00569 g002
Figure 3. SPR reflectance of the SPR sensor based on a DSU/amine-functionalized rGO–PAMAM/IgM sensor film. Inset: SPR time response upon introduction of 0.08 to 1 pM of DENV 2 E-proteins.
Nanomaterials 10 00569 g003
Figure 4. Full width at half minimum (FWHM) and detection accuracy (DA) of the SPR sensor based on a DSU/amine-functionalized rGO–PAMAM/IgM sensor film.
Nanomaterials 10 00569 g004
Figure 5. Signal-to-noise ratio (SNR) and figure of merit (FOM) of the SPR sensor based on a DSU/amine-functionalized rGO–PAMAM/IgM sensor film.
Nanomaterials 10 00569 g005
Figure 6. Binding affinity between the Au/DSU/amine-functionalized rGO–PAMAM/IgM sensor film and secondary dengue virus infection (DENV 2) envelope (E)-proteins depending on the concentration of the latter.
Nanomaterials 10 00569 g006
Figure 7. Relationship between Δθ and different concentrations of DENV 2 E-proteins.
Nanomaterials 10 00569 g007
Figure 8. Shift of the resonance angle measured with different antigens.
Nanomaterials 10 00569 g008
Figure 9. AFM images of the Au/DSU/amine-functionalized rGO–PAMAM/IgM sensor film (a) before and (b) after the introduction of DENV 2 E-proteins.
Nanomaterials 10 00569 g009
Table 1. Performance of techniques developed for DENV (dengue virus) detection.
TechniqueTargetSensitivityLimit of DetectionReference
ELISANS1-0.02 nM67
LSPRNS143 nm/(ng/mm2)1.54 nM68
Rapid kitsNS1-0.1 nM49
Electronic biosensorE-proteins-2.11 pM69
Tapered fiber sensorE-proteins5.02 nm/nM1 pM70
SPR Biacore 3000 (automated)IgM antibodies0.0132 pM/sec.−12.125 pM71
Modified SPR sensor (custom-made)E-proteins0.2576°/pM0.08 pMThis work

