Article

Acid Dye Removal from Aqueous Solution by Using Neodymium(III) Oxide Nanoadsorbents

1
Department of Environmental Health, Zabol University of Medical Sciences, Zabol 986161588, Iran
2
PhD of Environmental Health, Infectious Diseases and Tropical Medicine Research Center, Resistant Tuberculosis Institute, Zahedan University of Medical Sciences, Zahedan 9816743463, Iran
3
Department of Physics, Faculty of science, University of Zabol, Zabol 538-98615, Iran
4
Department of Environmental Health, Kerman University of Medical Sciences, Kerman 7616913555, Iran
5
Department of Chemical Engineering, Nnamdi Azikiwe University, Awka 420218, Nigeria
6
Department of Chemistry, International Hellenic University, 654040 Kavala, Greece
*
Authors to whom correspondence should be addressed.
Nanomaterials 2020, 10(3), 556; https://doi.org/10.3390/nano10030556
Submission received: 10 February 2020 / Revised: 11 March 2020 / Accepted: 18 March 2020 / Published: 19 March 2020
(This article belongs to the Special Issue Nanomaterials and Nanotechnology in Wastewater Treatment)

Abstract

:
In the current work, neodymium oxide (Nd2O3) nanoparticles were synthesized and characterized by means of X-ray diffraction (XRD), Fourier-transform infrared spectroscopy (FTIR), and scanning electron microscopy (SEM). The major aim/investigation of this research was to fit/model and optimize the removal of Acid Blue 92 (AB92) dye from synthetic effluents (aqueous solutions) using the adsorption process based on neodymium oxide (Nd2O3) nanoparticles. To optimize the adsorption conditions, central composite design (CCD) based on response surface methodology (RSM) was applied. The effects of pH (3–9), adsorbent dosage (0.1–1 g/L), initial concentration of AB92 (100–300 mg/L), and contact time (10–100 min) on the adsorption process were investigated. Apart from equilibrium and kinetic experiments, thermodynamic evaluation of the adsorption process was also undertaken. The adsorption process was found to have the best fitting to Langmuir isotherm model and pseudo-second-order kinetic equation. Also, the process was found to be spontaneous and favorable with increased temperature. The optimal conditions found were: pH = 3.15, AB92 concentration equal to 138.5 mg/L, dosage of nanoadsorbent equal to 0.83 g/L, and 50 min as contact time, which resulted in 90.70% AB92 removal. High values for the coefficient of determination, R2 (0.9596) and adjusted R2 (0.9220) indicated that the removal of AB92 dye using adsorption can be explained and modeled by RSM. The Fisher’s F-value (25.4683) denotes that the developed model was significant for AB92 adsorption at a 95% confidence level.

1. Introduction

It is generally accepted that dyestuffs are very hazardous species of industrial effluents and need to be treated [1,2,3]. Azo dyes possess 70% of the total dyes in the world. Due to the presence of azo bonds (–N=N–), sulfonic groups and aromatic rings in dye compounds, azo dyes are hardly decomposed in the natural environment and have toxic, mutagenic, and carcinogenic effects [4]. They are also unwanted compounds in the environment because they reduce the penetration of light and impair the process of photosynthesis [5,6]. In addition, these compounds can cause negative effects on the appearance and quality of water [6]. Therefore, wastewaters containing this type of dyes were highlighted as one of the most important threatening factors in environmental and public health [2,5]. Different studies have reported that there are several methods for removing dyes from textile wastewaters, including the application of photodecomposition [6], electrolysis [7,8], adsorption [9,10,11,12,13,14,15,16,17,18], oxidation [19], biodegradation [20], combined sonochemical and adsorption [21], coagulation-flocculation [22,23], etc.
Adsorption is widely used because of its relatively simple design, low cost, and removal of color and other pollutants with great efficiency [19,24,25,26,27]. Adsorption can be either physisorption (which involves fairly weak (not strong enough) intermolecular forces), or chemical sorption (namely chemisorption), which involves the creation of chemical bonds among the funtioanl groups of pollutants and the surface of the adsorbent materials [20]. Activated carbons have been used successfully to remove organic and mineral pollutants [28]. Recently, nanotechnology has become known as a key and effective technology in science, technology, and industry [29]. Nanoparticles have been found to have high potential in adsorption of organic compounds. Last years, it is great of interest the removal of colors/dyes from wastewaters or/and sewage tanks by adsorption onto nanoparticles because they have a higher surface/volume ratio than other adsorbents [30,31,32].
Recently, more attention has been given to the applications of the adsorbents prepared by several rare-earth metals (REMs) for water treatment due to their favorable chemical properties. Compared to typically used metals (e.g., iron, aluminum, and manganese), the adsorbents prepared by the REMs have more functional groups on their surfaces [33], and better catalysis reaction performance [34], which are favorable for arsenic uptake. In addition, they have no or lower toxicity for humans. A series of REM-based adsorptive materials in the form of metal oxides/hydroxides, metal oxide/hydroxide modified adsorbents and metal ion impregnated adsorbents have been recently reported for the effective decontamination of arsenic. One of these rare earth elements is neodymium (Nd), with atomic number 60, atomic radius 1.821 A, valence state +3 and electronic configuration 4f46s2. Also, it has a noteworthy abundance in the upper Earth’s crust (26 ppm), which is 3rd in order after Ce (64 ppm) and La (30 ppm) [35].
Neodymium(III) oxide (Nd2O3) nanoparticles are widely used as coloring agents for ceramics and glasses, catalysts, raw materials of the neodymium alloy and neodymium metal, and also as dopants for high-efficiency solid-state lasers due to their unique thermal and physicochemical properties [36,37]. However, there is no special mention of the possible use of Nd2O3 nanoparticles as materials for dye adsorption. There is only mention of the adsorption of salicyl hydroxamic acid on Nd2O3 surfaces [38], as well as in another study NdCl3 was incorporated into order mesoporous carbon (OMC) through an incipient wetness technique to enhance sunset yellow removal [39]; however the latter is a modification of OMC and not a “clear” use of Nd2O3 as adsorbent.
The major target of the present study is to model the reduction of AB92 dye from aqueous solutions by adsorption onto Nd2O3 nanoparticles synthesized and also optimized in experimental conditions. The central composite design (CCD) via the response surface method (RSM) was employed to design the experimental runs for AB92 adsorption. It is an important tool applied for the development and optimization of novel processes, and improvement of existing processes [40,41,42]. The RSM was used to study the influence of the operating parameters (solution pH, Nd2O3 nanoparticles dosage, AB92 concentration, and time of reaction) and their relationships or interactions in order to maximize the efficiencies of adsorption and to determine the optimal conditions. The isotherm, kinetics, and thermodynamics of the process were also explored.

2. Materials and Methods
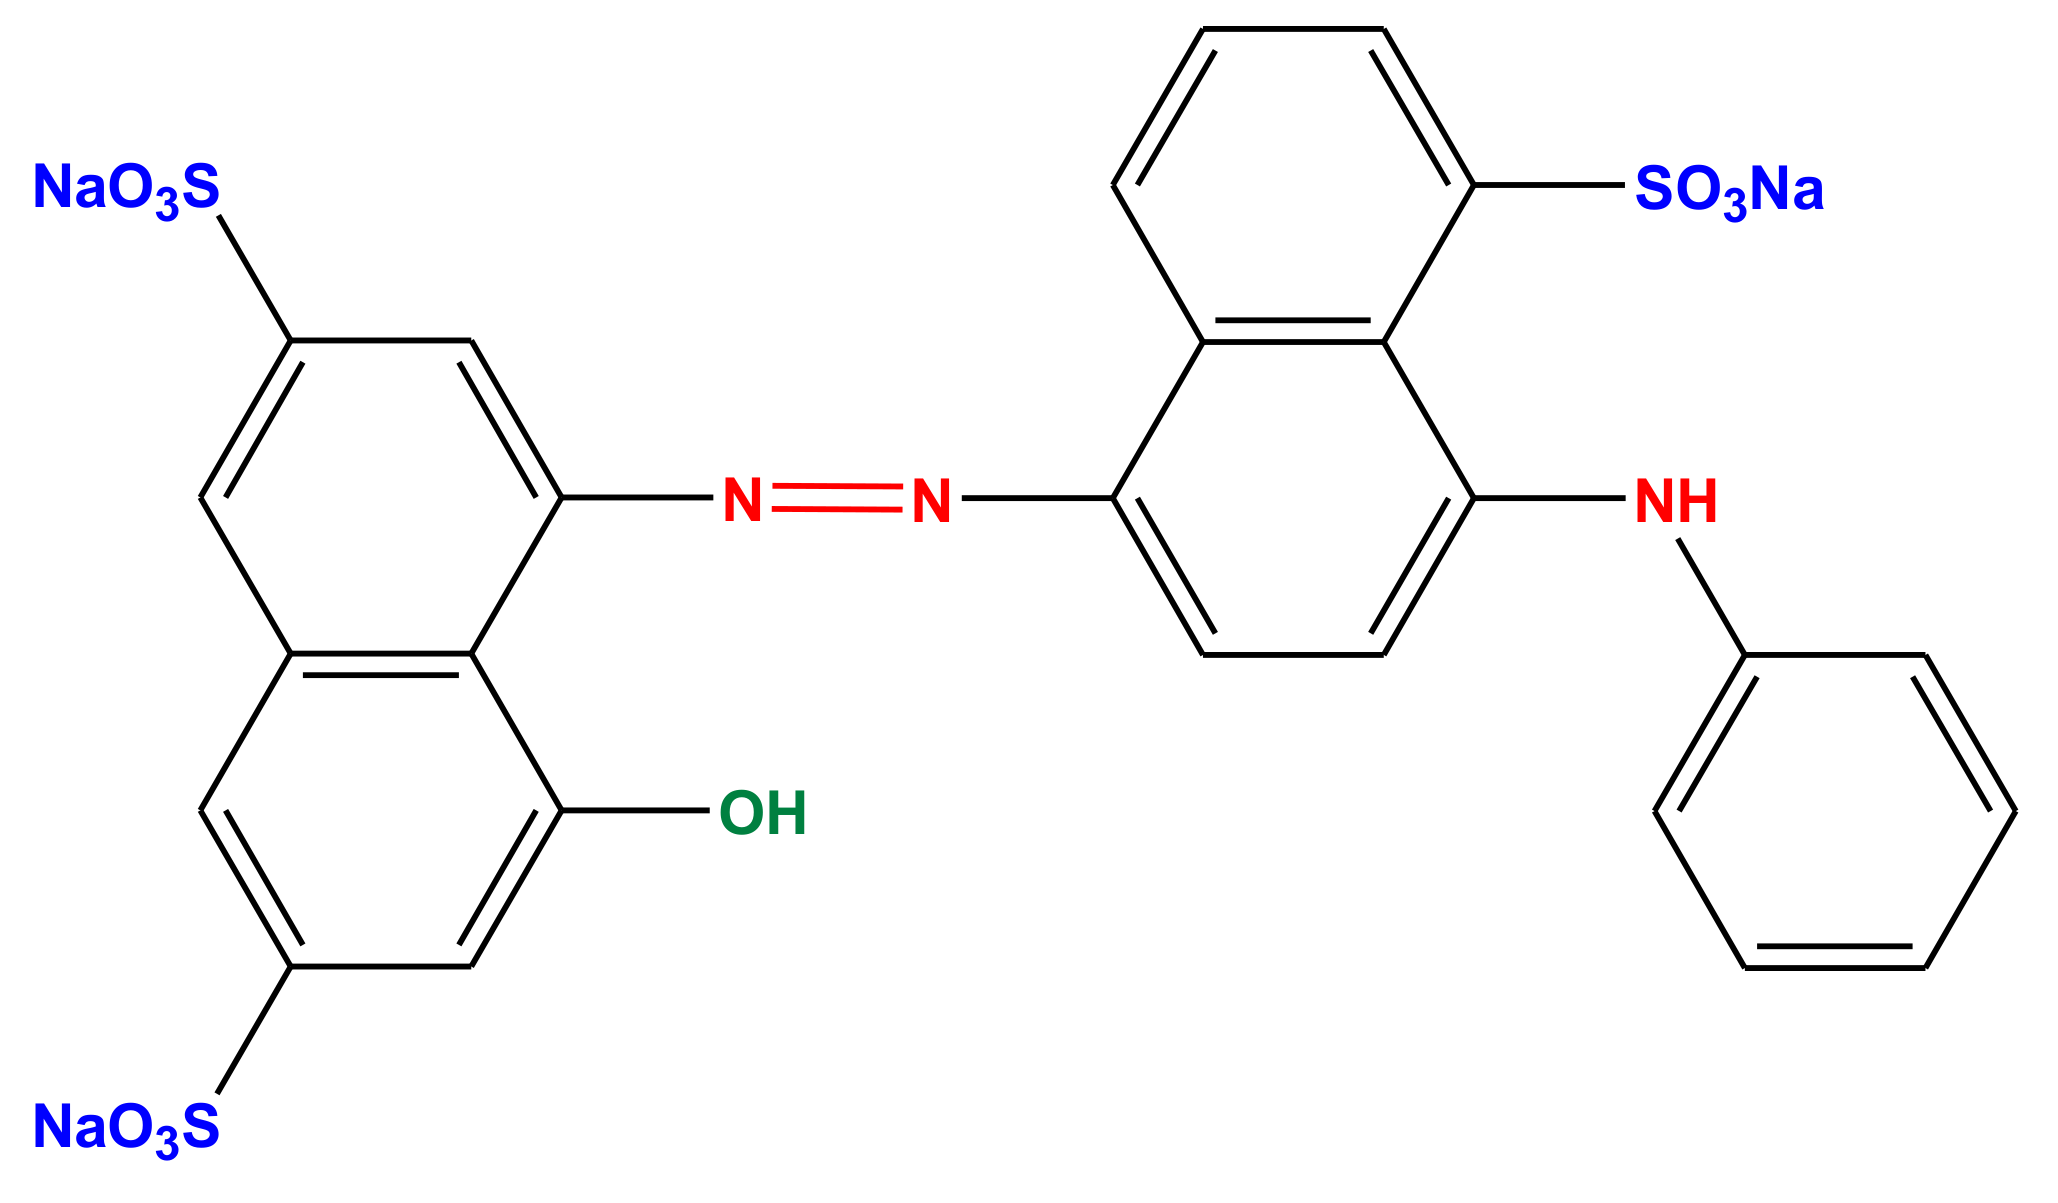
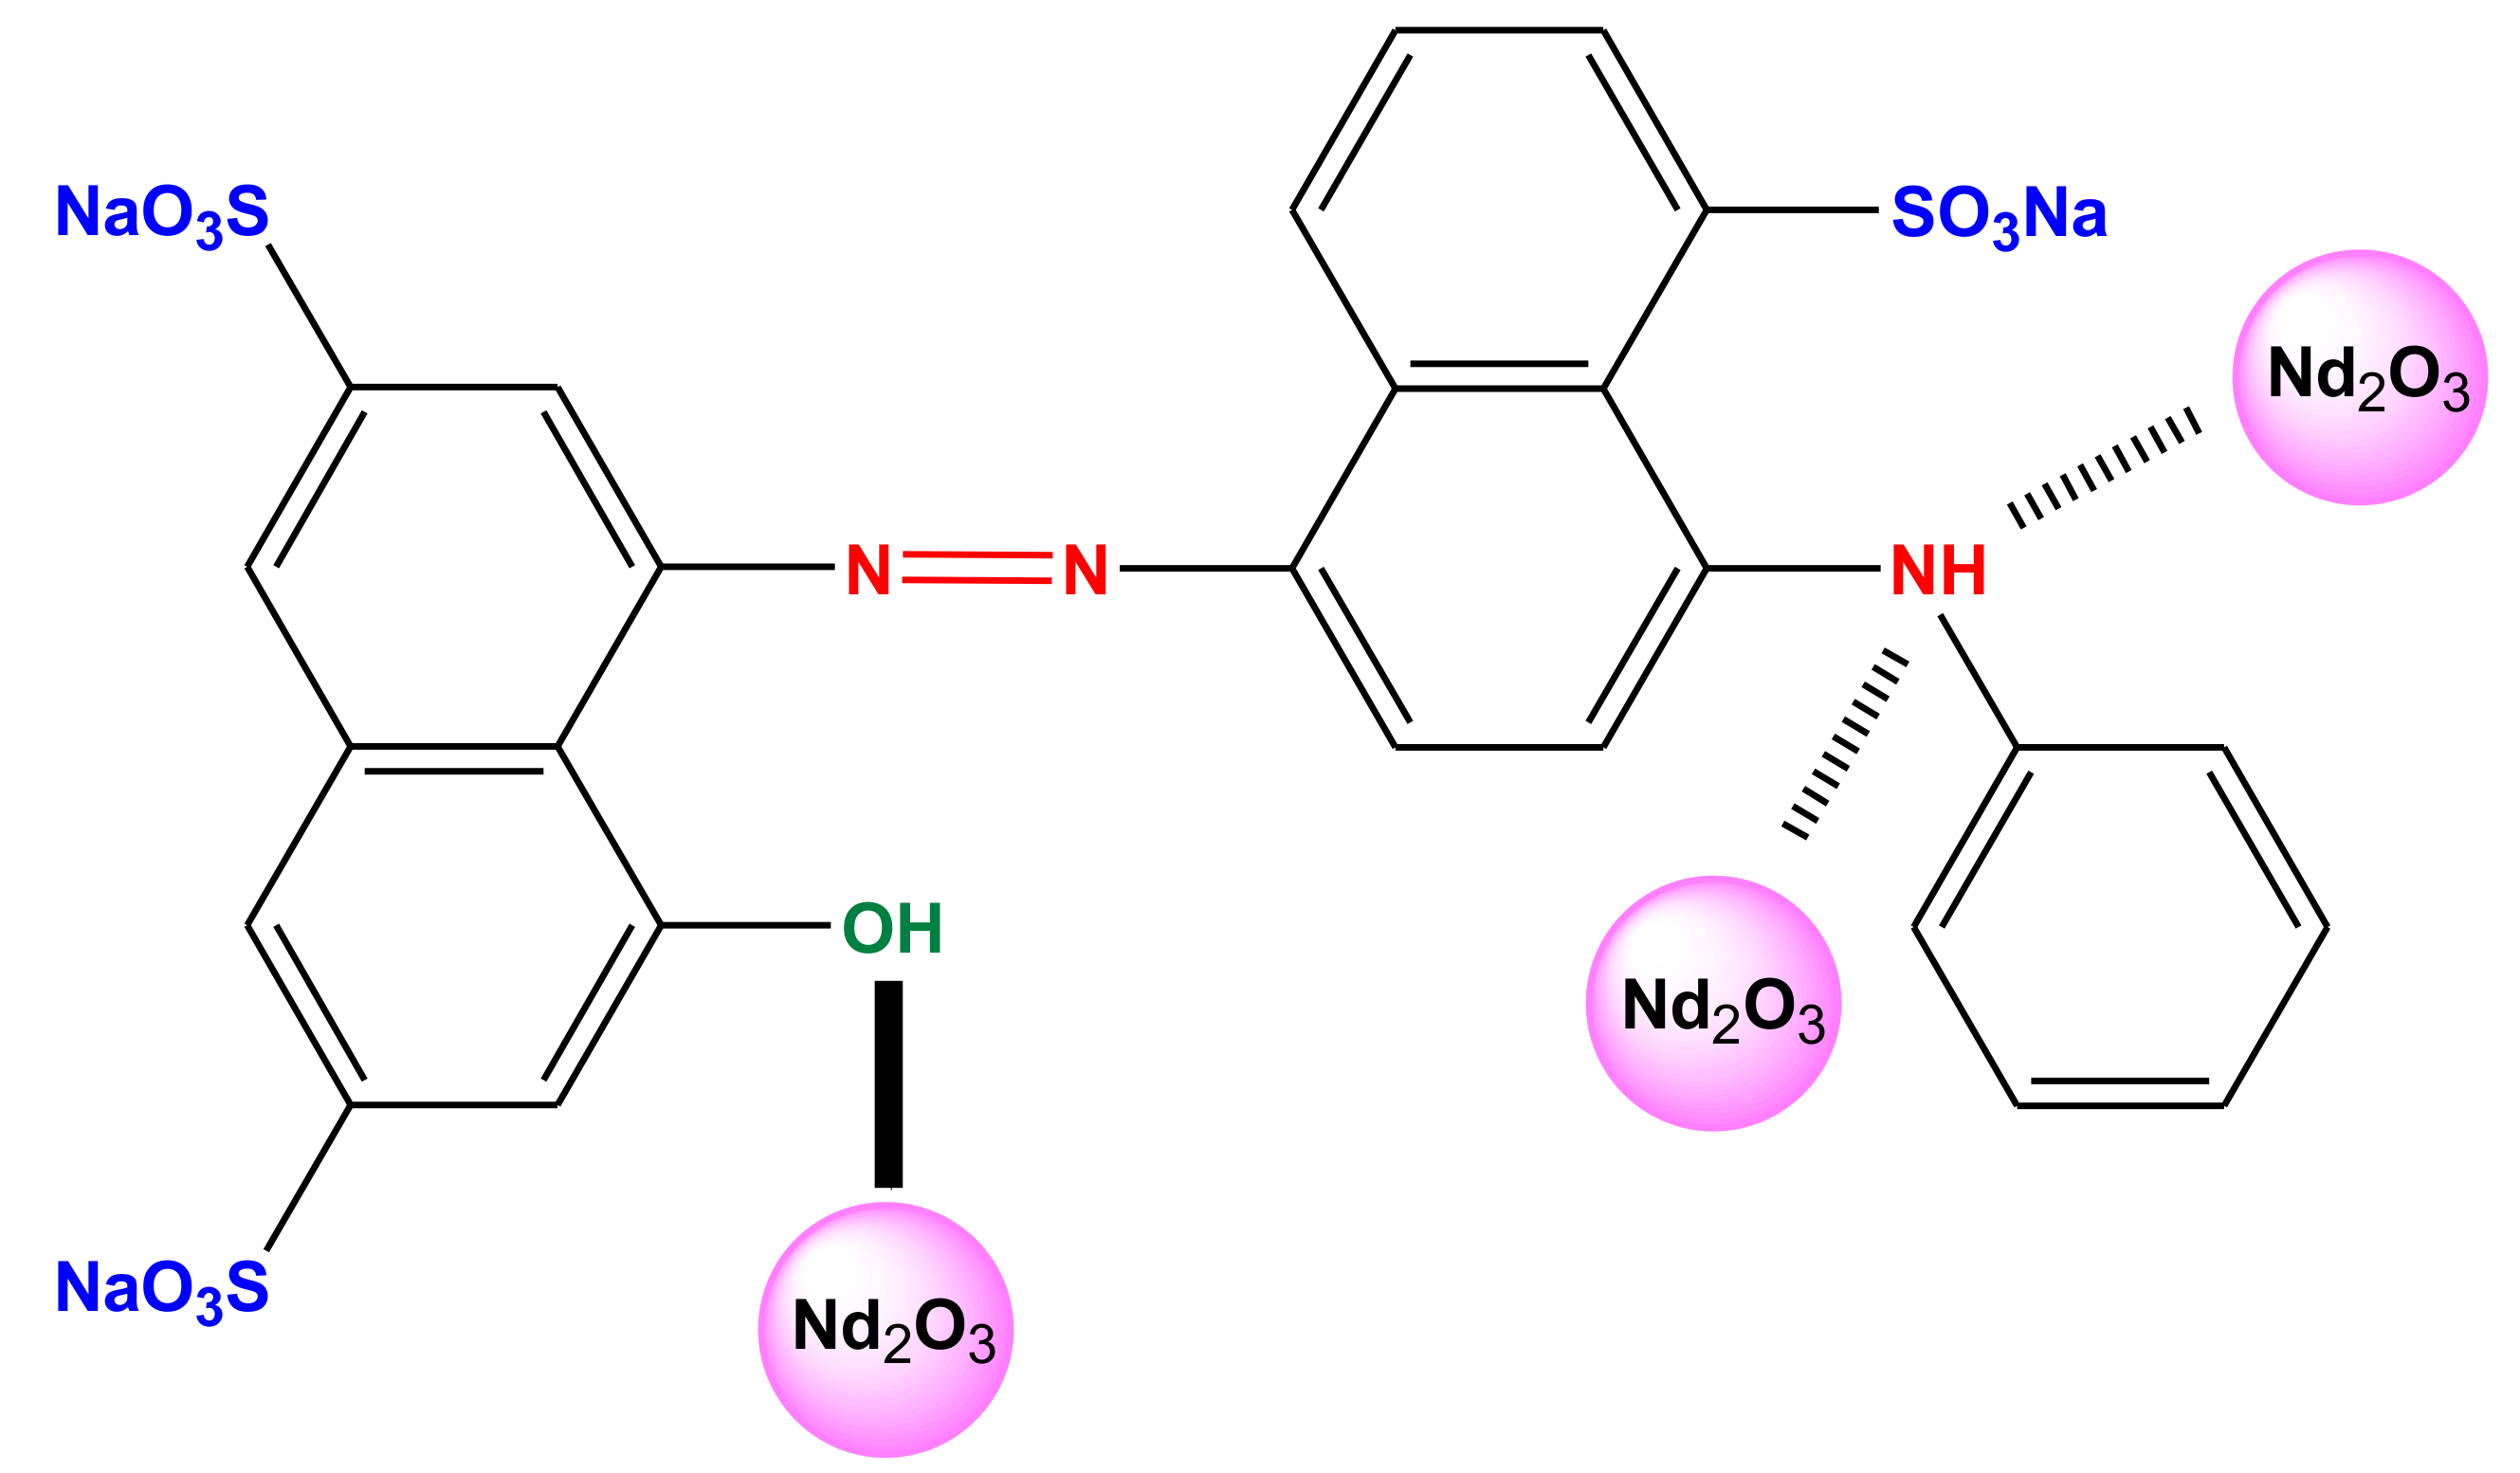
2.1. Materials

AB92 (Acid Blue 92) dye was purchased from AlvanSabet Corporation (Hamadan, Iran) and used as model pollutant. AB92 (anazolene sodium, C26H16N3Na3O10S3) is a commercial salt consisting of a mixture of dye and an inert product; the true dye content was 40%. This dye purity was taken into account in calculating the concentrations. Figure 1 shows the chemical structure of AB92. The molecular weight of the dye was 695.58 g/mol. AB92 is a monoazo compound bearing three sulfonic groups; it holds negative charges in aqueous solutions. Dye solutions were prepared by means of direct dilution in water (at the appropriate concentration) and the pH was controlled with hydrochloric acid and sodium hydroxide solutions.
All other reagents (sodium hydroxide (NaOH, 98%), and sulfuric acid (H2SO4, 99.99%)) were of analytical grade and purchased from Merck (Berlin, Germany). All solutions were prepared using deionized water. The pH of the solution was adjusted by micro-additions of HCl (0.1 N) or NaOH (0.1 N) solutions.

2.2. Synthesis of Nd2O3 Nanoadsorbent

The synthesis of Nd2O3 nanoparticles were carried out based on a published study [43]. The ligand Schiff base was used to synthesize the nanoparticles of neodymium. At first, 0.06 mol of 2-hydroxy-1-netaldehyde were dissolved in 30 mL of methanol using magnetic stirrer (0.5 h), next 0.03 mol of 1,4-diaminobutane were diluted in 30 mL of methanol in another container similarly by using magnetic stirrer (0.5 h) MSL 50 Digital (VELP Scientifica Srl, Usmate, Italy) and then added to the previous solution drop-by-drop. Subsequently, an appropriate amount of Nd(NO3)3∙6H2O (with a molar ratio of 1:4) was dissolved in the above solution (magnetic stirring 2 h). The solution was then stored at a reflux condition for 3 h. The compound formed was washed with distilled water and methanol (Soxhlet apparatus, 12 h) and dried at 60 ℃ for 3 h (oven). The ligand Schiff base was used as the making base. It was combined with salt with a different molar ratio (in a mortar). Then, it was calcified for 5 h in a furnace at 900 ℃.

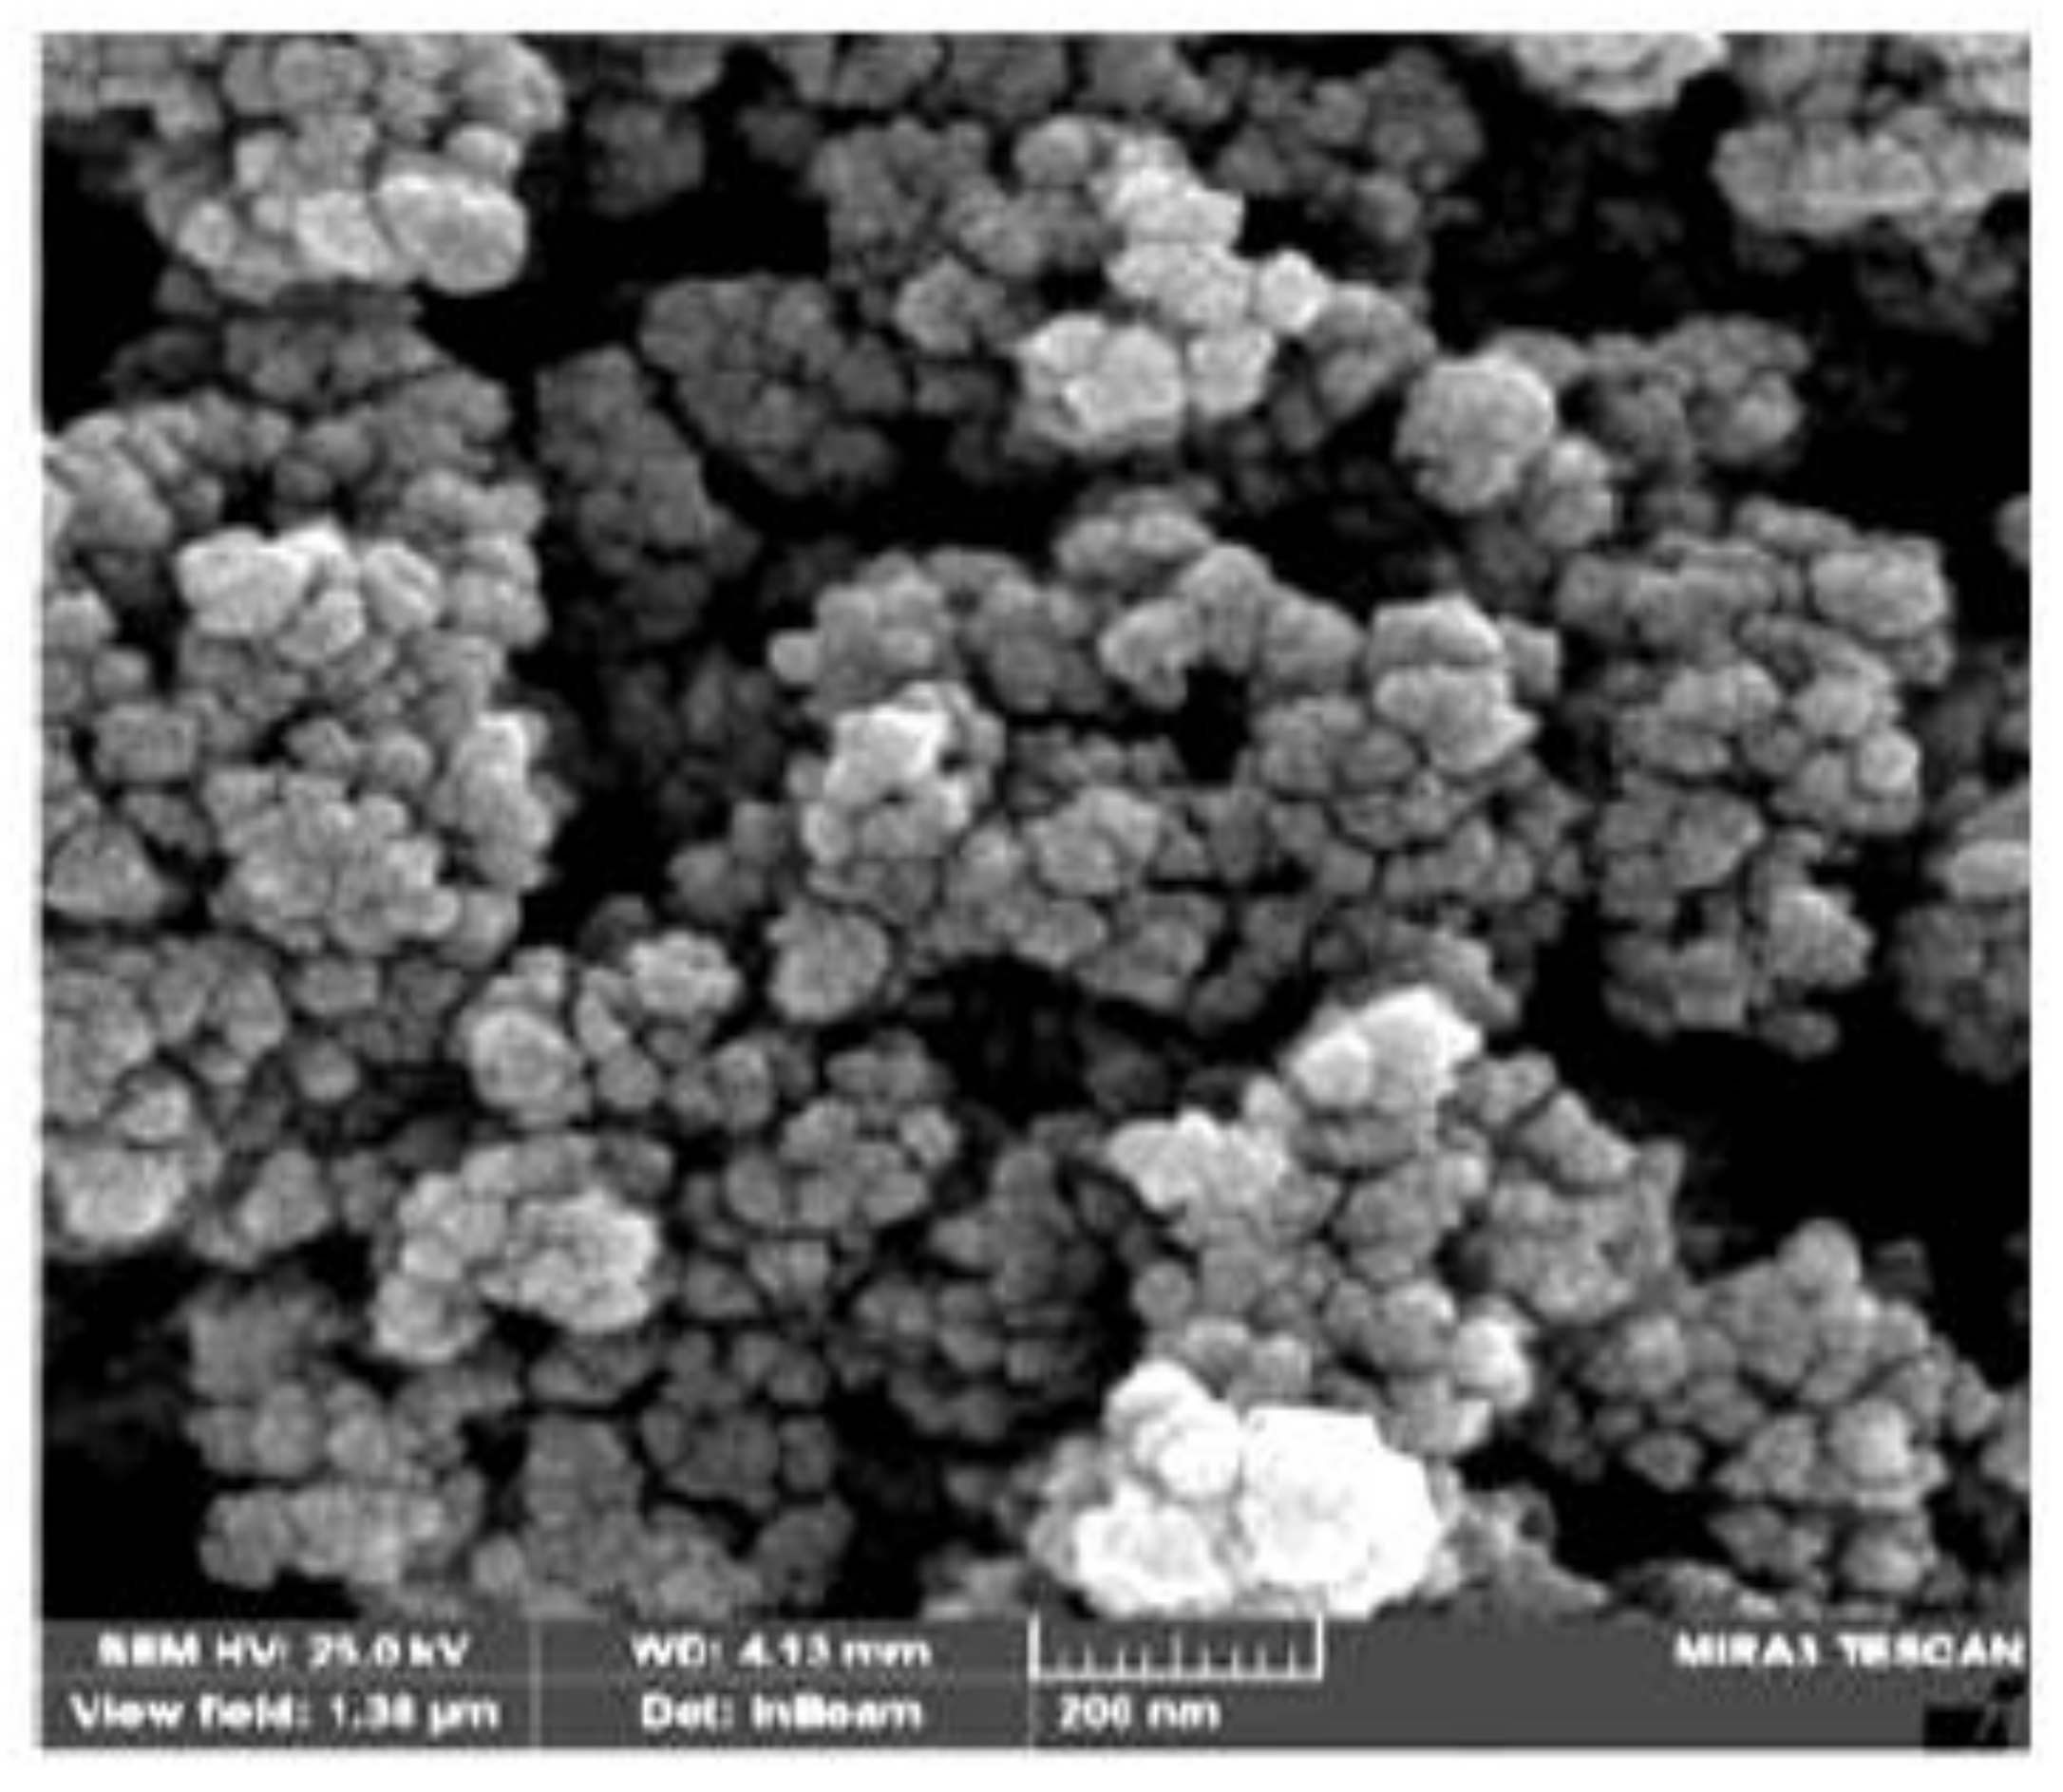
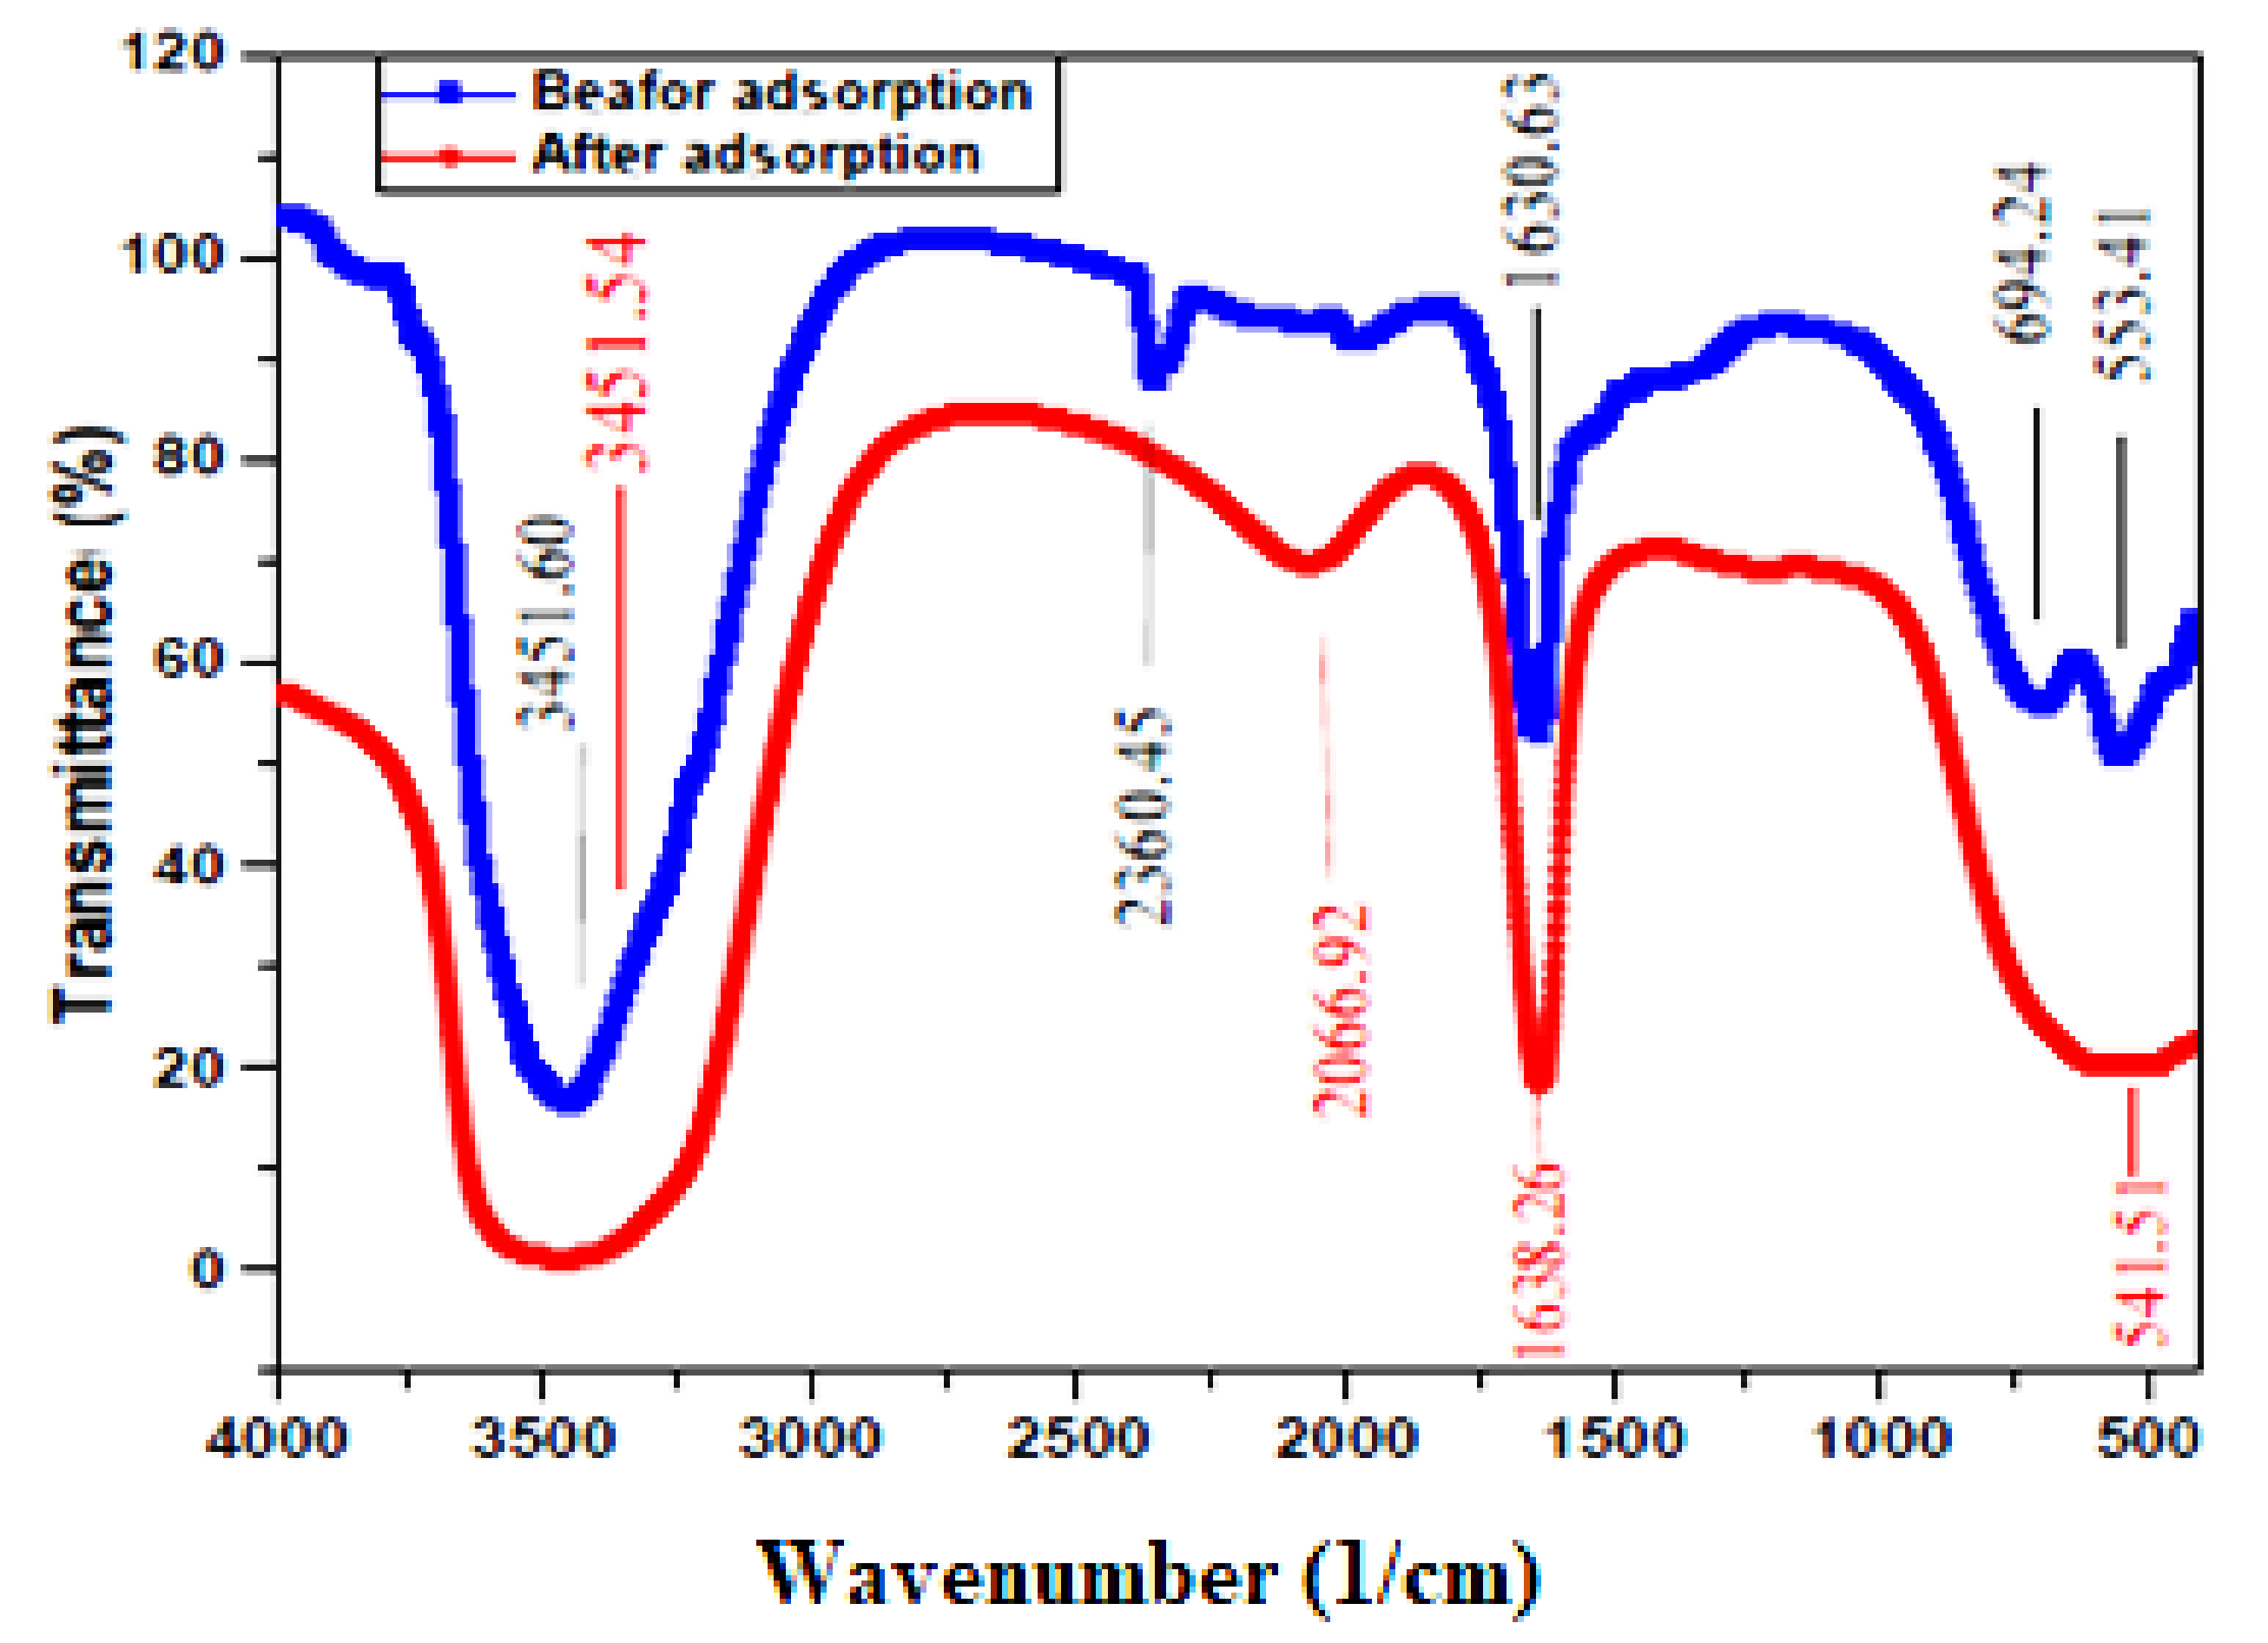
2.3. Characterizations

Fourier-transform infrared spectroscopy (FTIR) spectra were taken on a JASCO 640 plus machine (4000–400 cm−1) (Zeiss, Berlin, Germany) at room temperature so as to reveal the functional groups of Nd2O3 nanoadsorbents, which contributed to the removal of AB92. The morphology of nanoparticles was evaluated by taking scanning electron microscope (SEM) images using the LEO instrument model 1455VP (Zeis, Jena, Germany). XRD patterns were obtained with a diffractometer of Philips Company (PANalytical B.V., Almero, The Netherlands) with X’Pert Pro monochromatized CuKα radiation.

2.4. Adsorption/Desorption Experiments

The adsorption experiments were based on multi-parametric study. The effect of pH was studied in the range of 3–9, as well the influence that has the increase of nanoadsorbent’s dosage from 0.1 to 1 g per 1 L of effluents. Also, the kinetic behavior of the process was examined running experiments varying the contact time between sorbent and sorbate from 10 to 100 min, and the same was done for the determination of initial concentration of AB92 (100–300 mg/L). The preparation of AB92 stock solution was carried out by using double-distilled water. Batch experiments were performed in 250-mL Erlenmeyer flasks. The desired initial concentrations of dye were added to the flasks with pipettes, while the pH of the solution was adjusted by micro-additions of 0.1 N HCl or 0.1 N NaOH. The initial solution pH was analyzed with a MT65 pH-meter (Mettler-Toledo GmbH, Giessen, Germany). Then, a fixed nanoadsorbent’s mass (Nd2O3) was added to the flask (already containing the respective dye solution of final volume of 100 mL). The flasks were placed to the thermostatted bath and agitated (N = 180 rpm) for 2 h.
The initial and residual (final) dye concentrations in solutions were measured by using an ultraviolet (UV)-visible spectrophotometer (Shimadzu, Model CE-1021, Columbia, MD, USA) at λmax = 620 nm (wavelength of maximum absorbance). The percentage of adsorption was calculated as follows (Equation (1)):
R e m o v a l ( % ) = C 0 C f C 0 · 100 %
where C0 (mg/L) is the initial AB92 dye concentration and Cf (mg/L) is the final concentration.
Desorption experiments were performed in batch mode using constant (optimal) adsorption conditions found from experimental design (pH = 3.15, AB92 concentration equal to 138.5 mg/L, dosage 0.83 g/L, 50 min as contact time, 25 °C, N = 180 rpm) and divided into two main categories: (i) desorption experiments for finding the optimal eluent, and (ii) reuse cycles with continuous adsorption-desorption experiments. At first, after the end of adsorption stage, the adsorbent materials were separated from supernatant using filtration membranes. Then, the adsorbent particles separated were placed in flasks using deionized water as eluent with pH-adjusted values (10, which is the reverse pH conditions as those of adsorption to break the adsorption forces and then desorb). The desorption step (as in adsorption step) lasted 24 h. The quantitative evaluation of desorption was done using desorption percentages, calculated from the difference between the loaded amount of drugs on adsorbent after adsorption and the amount of drugs in solution after desorption. To investigate the reuse ability of adsorbents, the above procedure with the same conditions (firstly adsorption and then desorption) was repeated 5 times.

2.5. Experimental Design and Statistical Analysis

Central composite design (CCD) was done using Design Expert software 7.1 (Stat-Ease, Minneapolis, MN, USA). 4-factors at 3-levels (34) of full factorial were selected for this study. The CCD in RSM was used to generate the experiments with 30 experimental runs which comprise of 8 axial points, 16 factorial points, and 6 replicates at the center points. The optimization studies were carried out by studying the effects of pH, initial AB92 concentration, Nd2O3 dosage and time (independent variables). The chosen independent variables for this study were coded according to Equation (2) [44]:
x i = x i x 0 Δ x · 100 %
where xi is the dimensionless coded value of the independent variable, x0 is the value of xi at the center point and Δx is the step change value. The behavior of the system is explained by the following empirical second-order polynomial model (Equation (3)):
Y = β 0 + i = 1 k β i x i + i = 1 k β i i x i 2 + i = j k 1 i = j + 1 k β i j x i x j
where Y is the predicted response, xi, xj, …, xk are the input variables, which affect the response Y, x2i, x2j,…, x2k are the square effects, β0 is the intercept term, xixj, xjxk and xixk are the interaction effects, βi (i = 1, 2, …, k) is the linear effect, βii (i = 1, 2, …, k) is the squared effect, βij (j = 1, 2, …, k) is the interaction effect and Σ is the random error [45].
The experimental range and levels of the independent variables used in the present study are stated in Table 1. The experimental data obtained were fitted to the empirical second-order polynomial regression model (Equation (3)). Also, the coefficient of determination (R2) value was compared to the adjusted R2 and predicted R2 values to check the adequacy of the model. The analysis of variance (ANOVA) was used to examine the interactive effects of the process variables on the AB92 adsorption efficiency. The R2 is used to determine the potential of a regression model to predict a process. The adjusted R2 is applied to assess the goodness-of-fit of the model while the predicted R2 is used to define how good a model predicts a process.

3. Results and Discussion

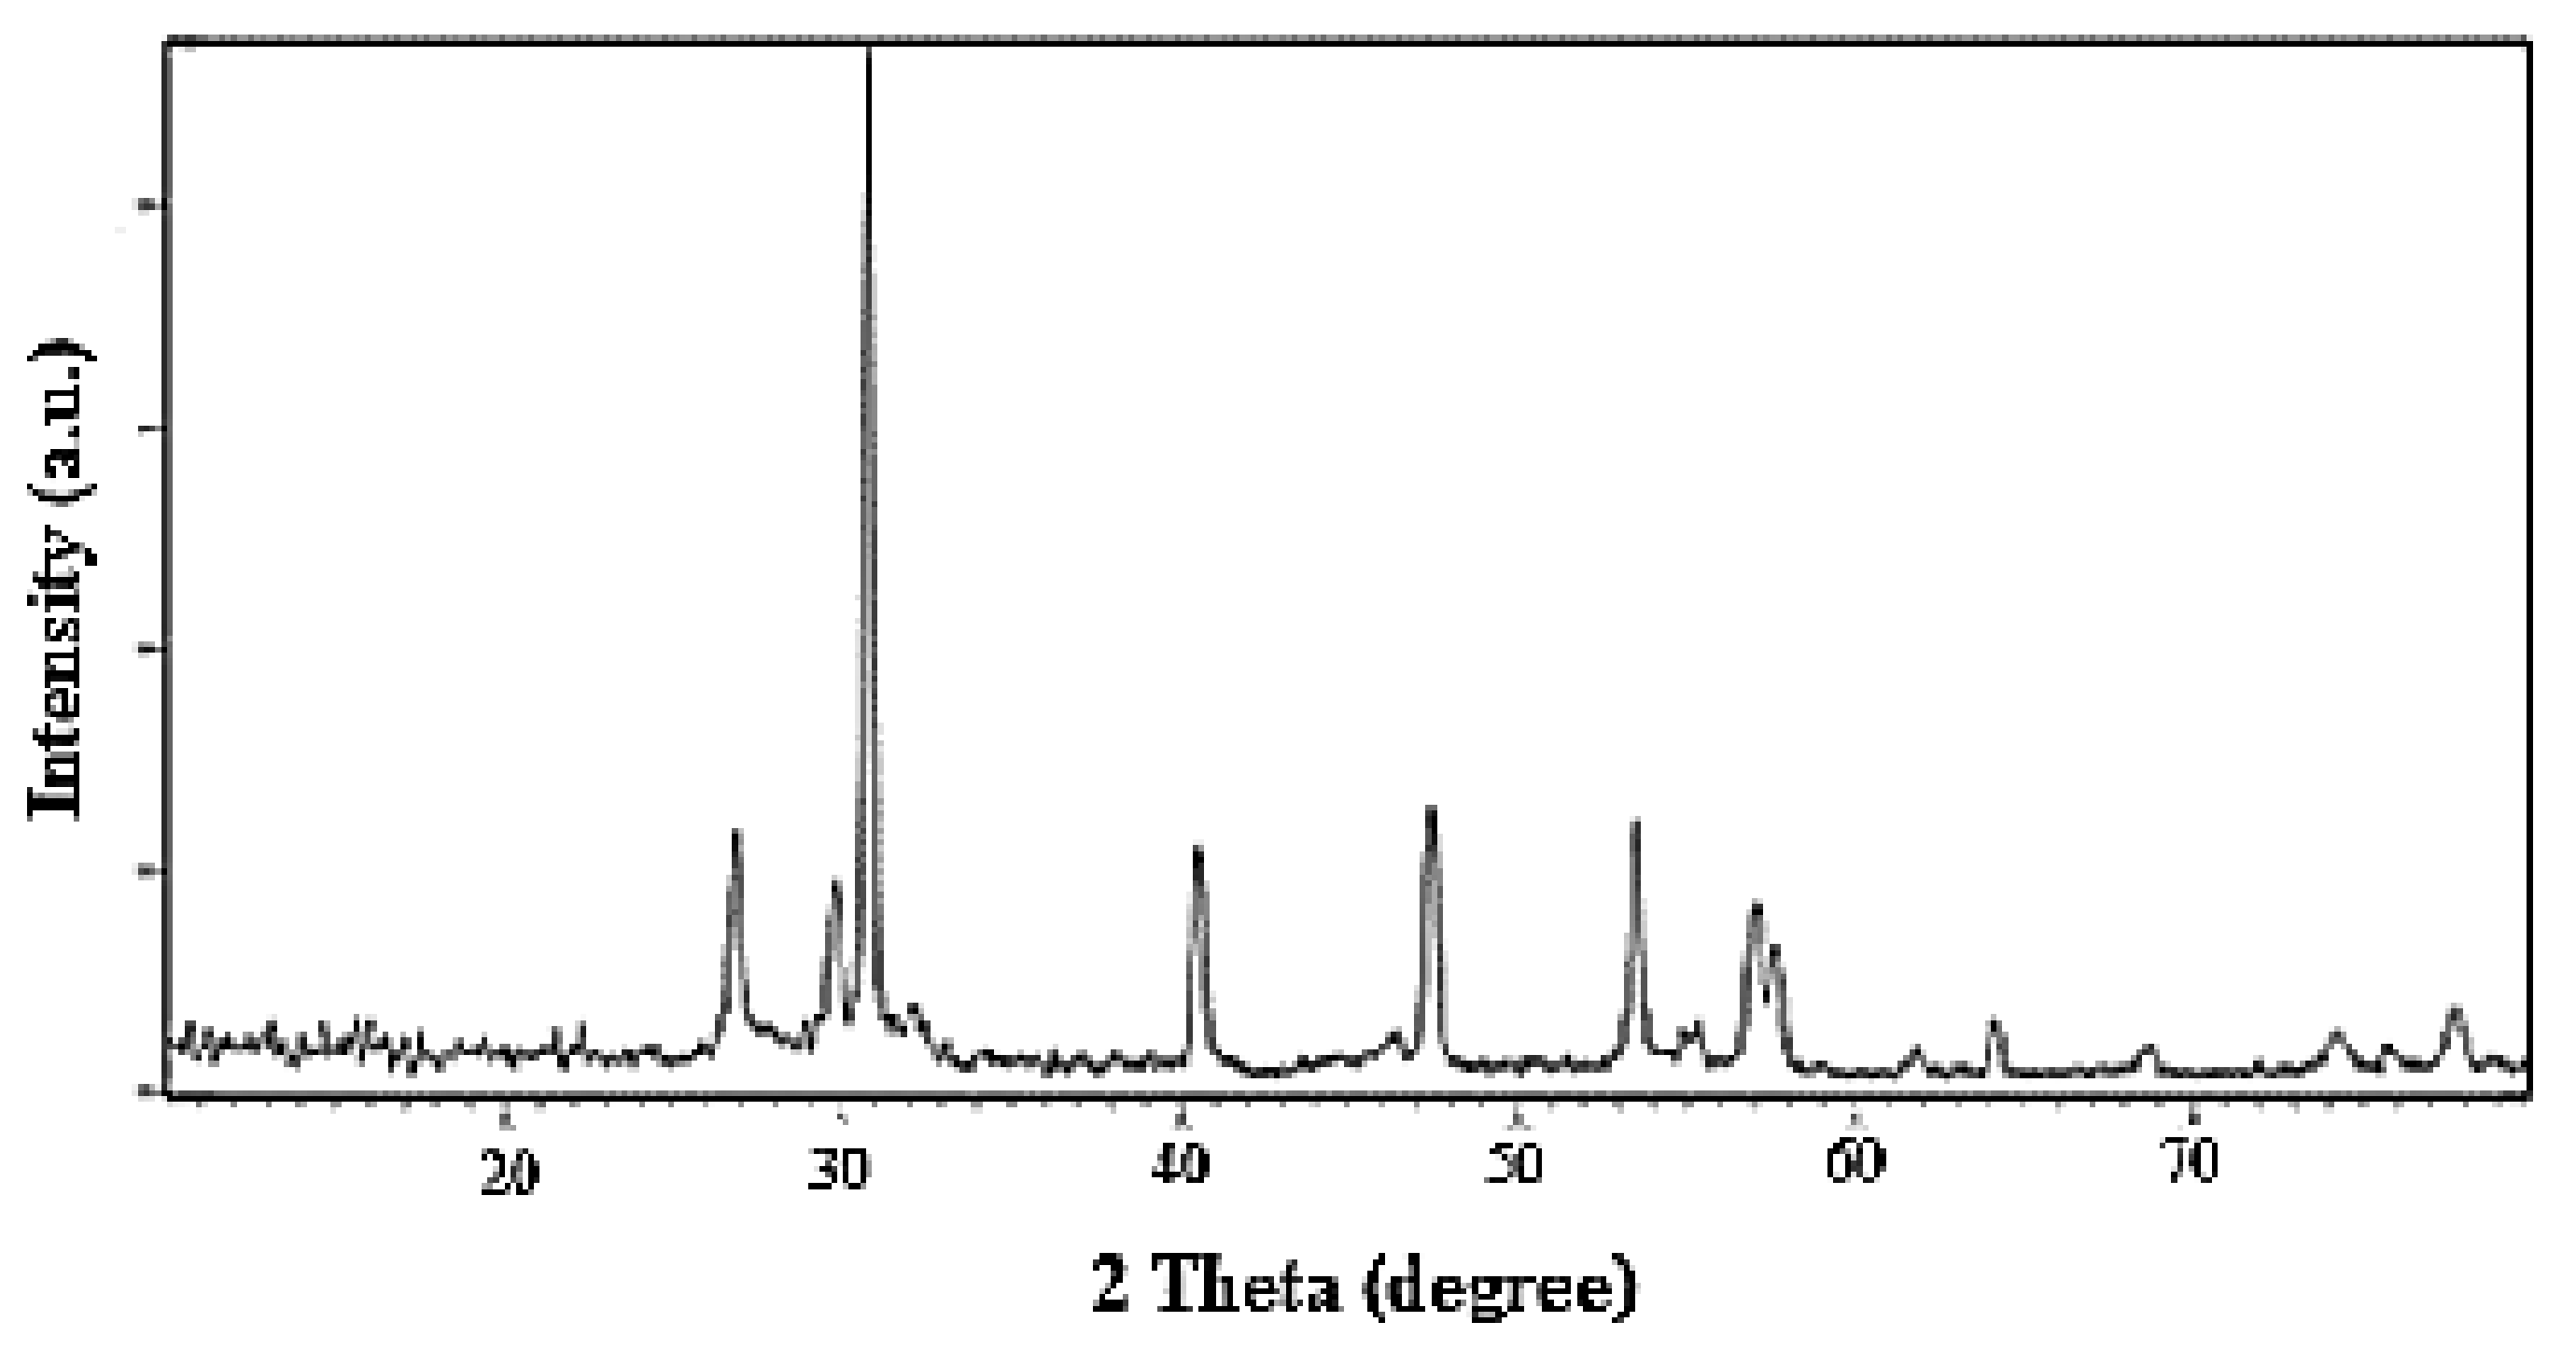
3.1. Techniques of Characterization

The structural surface of the Nd2O3 nanoparticles was visualized using the SEM technique. Figure 2 shows the SEM image (150 kx) of the adsorbent which seems to be approximately spherical-like in structure forming nanoclusters. The Nd2O3 sample consists of irregular shapes with pores of varying sizes, which will make available the active sites for the adsorption process and the take in of the AB92 dye particles. Moreover, it is fact that SEM images shows some percentage of agglomeration, but this does not imply that there is any porosity. Due to agglomeration, some surface area will be reduced so the adsorption capability will probably be affected. However, adsorption is a combined and in the case of oxides is majorly explained with attractive bonding (forces) and not so much with simple deposition on the surface area.
FTIR spectroscopy showed the functional groups present in the nanoadsorbent (Nd2O3 nanoparticles). The FTIR spectra of the nanoparticles (before and after dye adsorption) were recorded in the range of 400–4000 cm−1 (Figure 3).
In the case of Nd2O3 nanoparticles before dye adsorption, the presence of alkyl halides (C–Br stretching) was confirmed, as well as that of alkynes (–C≡C–H with C–H bend) and primary amines (N–H) (originating from the dye molecule—Figure 1) bending which were revealed at the band regions of 553.41, 694.24 and 1630.63 cm−1, respectively. An absorption peak at 2360.45 cm−1 was also observed which corresponds to –C=C– stretching of alkynes (a very weak band). The peak of 3451.54 cm−1 (very broad and strong band) is credited to O–H stretch, H–bonded (alcohols, phenols). This strong band (O–H stretch) participated actively in the adsorptive removal of AB92. After AB92 adsorption, the intensities of the bands were reduced from 553.41 and 1630.63 cm−1 to 541.51 and 1638.26 cm−1, respectively. The band intensity of 2360.45 was decreased to 2066.92 cm−1. Also, the intensity of the O–H band was increased from 3451.54 to 3451.60 cm−1. This peak shift implied the interaction of the adsorbate with the functional groups of the adsorbent [46]. Based on the above FTIR spectrum a proposed adsorption mechanism can be illiustrated in Figure 4.
The X-ray diffraction (XRD) pattern of Nd2O3 nanoparticles is depicted in Figure 5.
The XRD pattern indicates that the maximum peak is around 2θ = 31° with high intensity. This XRD pattern indicates that a crystalline nanoparticle has been prepared and no remarkable impurities were seen in the material, implying high purity of the nanoparticle. From the XRD data, the average crystallite size (Dc) of the nanocomposite was calculated using the Scherer equation:
D c = K · λ β · cos θ
where λ (nm) is the wavelength; K (usually 0.9) is the so-called shape factor and β is the breadth of the observed diffraction line at its half maximum intensity. The average size, Dc of the Nd2O3 nanoparticles was evaluated to be 83 nm.

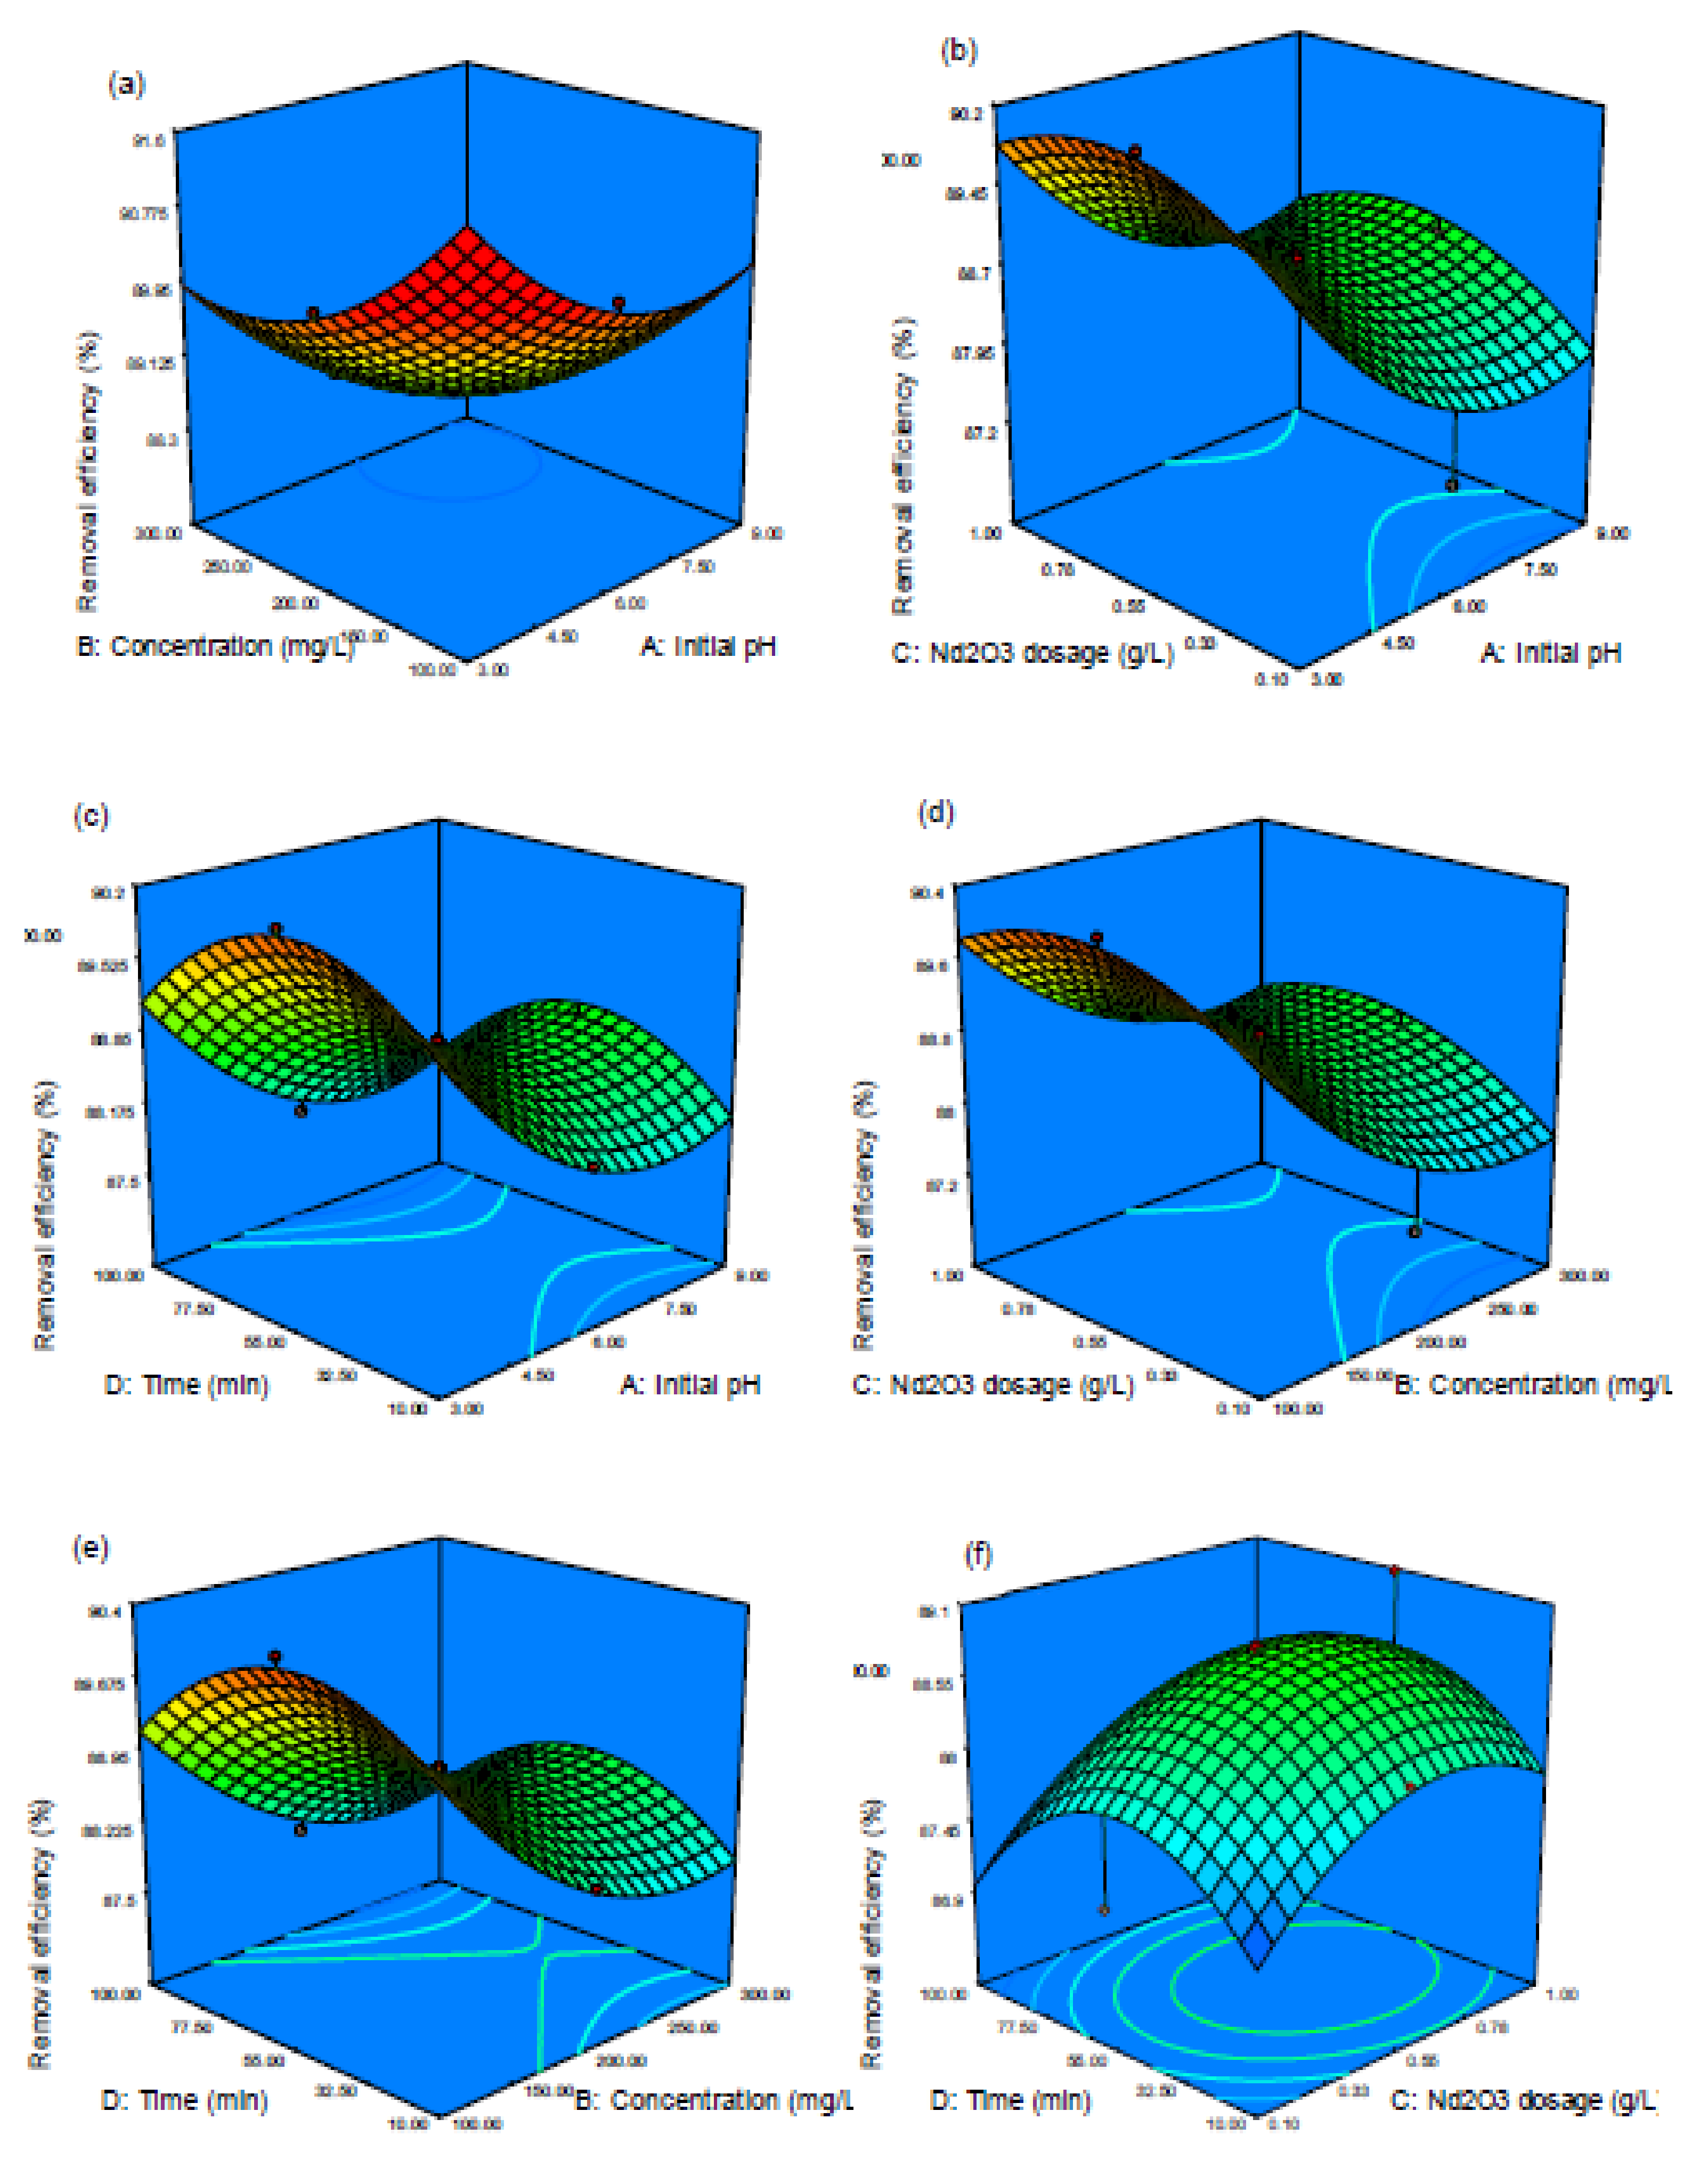
3.2. Model Fitting—Statistical Analysis—Adsorption Optimization

The experiments were carried out using the experimental conditionn described in Table 2. The experimental data generated were analyzed by using special software (Design expert software, Stat-Ease 7.1 trial version, Minneapolis, MN, USA). The results were analyzed via the RSM to acquire the empirical model. The actual and predicted adsorption percentages are shown in Table 2. The experimental values were established to be close to the predicted responses obtained for a particular run (Figure 6 and Table 2). The experimental data were examined via the sequential model sum of squares and model summary statistics to find the most appropriate models. Table 3 shows that the quadratic model gives the highest R2, adjusted R2 and predicted R2 values compared to other models (linear, interactive, and cubic) apart from the cubic model. The latter happens because a cubic model cannot be applied to fit/model the data since it is aliased. An aliased model means that it is a result of insufficient experimental runs to independently appraise all the models [47].
Table 4 shows the ANOVA results. ANOVA is a statistical method that divides the total variation in a set of data into component parts linked with particular sources of variation for the intention of testing the hypothesis on the parameters of the model [48]. The ANOVA shows that the second-order polynomial model (quadratic model) developed was statistically suitable for the analysis, representation, and explanation of the AB92 adsorption process at the variables’ studied range. The F-value was used to check the significance of the regression coefficients. The p-values were used to check the significance of each of the interactions among the variables, which may indicate the patterns of the interactions among the variables. A p-value less than 0.05 shows the influence and significance of a term [49].
After analysis, the Fisher’s F-value was found to be 25.4683, suggesting that the model is significant for dye adsorption, presenting a 95% confidence level. Also, the the values of "Prob > F" that were found to be less than 0.05 show that the model terms have a strong/significant impact on the output response (Table 3). In this case, A, B, C, D, A2, B2, C2, and D2 are the significant model terms. Then, the high p-values found (0.9835, 0.8362, 0.9176, 0.2060, 0.5241, and 0.7410) for AB, AC, AD, BC, BD, and CD, respectively imply that the interaction terms are not such significant. On the other hand, the values found that were higher than 0.1000 indicate that the model terms are not significant. The factor coefficient confirms the influence of a fixed factor, while the two combined factors coefficients can reveal the interaction between them [49]. Table 3 indicates that independent variable, initial AB92 concentration (F-value: 161.7921) has the highest effect on the AB19 adsorption followed by initial pH (F-value: 116.8807), nanoadsorbent’s dosage (F-value: 19.2103) and contact time (F-value: 6.0019). The interaction between concentration and dosage gave a high F value (1.7476), which was higher than the other interactions. Also, it is found that the high value of the determination coefficient (R2 = 0.9597), which can reveal the fitness degree to the model, presented a high correlation degree between the predicted and actual/real output response. It is worth noting that when determination coefficient (R2) is close to 1, the model can be considered as significant presenting and satisfying all the terms of ANOVA [50]. The predicted R2 of 0.8277 is in reasonable accordance with the adjusted R2 of 0.9220. The signal to noise ratio is measured by the adequate precision and a ratio of 20.2425 indicates an adequate signal, because a ratio higher than 4 can be considered as appropriate. So, this model can be used to pilot the design space. The lack of fit (LOF) value was found to be 1.1039, which is significant.
The quadratic model was applied to elucidate the mathematical correlation between the independent and dependent variables. The mathematical model equation with the independent process parameters (pH, time, initial AB19 concentration, and Nd2O3 nanoparticles dosage) is presented in terms of the coded factors in relation to the AB92 percentage removal (response) and is given as Equation (5):
Y = 88.7312 0.6913 A 0.8133 B + 0.2803 C 0.1566 D + 0.0014 A B + 0.0143 A C + 0.0071 A D + 0.0897 B C + 0.0442 B D 0.0228 C D + 0.6961 A 2 + 0.6373 B 2 0.5413 C 2 0.8165 D 2
where A = pH, B = concentration, C = Nd2O3 nanoparticles dosage and D = time.
The interactive effects of the operating parameters (independent variables) on the AB92 adsorption using Nd2O3 nanoparticles were studied by making three-dimensional (3D) response surface plots against any two independent variables while keeping the other parameters constant. The 3D surface plots of the output response (AB92 adsorption) from the interactions between the parameters are illustrated in Figure 7, Figure 8, Figure 9, Figure 10, Figure 11 and Figure 12. The pH, Nd2O3 nanoparticles dosage, AB92 concentration and time were studied in the range of 3–9, 100–300 mg/L, 0.1–1 g/L, and 10–100 min, respectively. It can be seen in Figure 7 that the other interactions apart from the interaction between time and dosage are not significant towards the removal of AB92. The pH is a very significant factor that affects an adsorption process [51,52,53]. The effect of pH on AB92 adsorption is linked to the solution pH and the functional groups exhibited by the Nd2O3 nanoparticles which will consecutively influence its surface charge [49]. The adsorption percentage was increased by decreasing the pH of the solution. However, it was observed that at higher pH (pH = 9), AB92 adsorption was reduced rapidly (Figure 7a–c). At pH higher than these value, the Nd2O3 nanoparticles had a negative charge (Figure 7). The adsorption of AB92 was more favorable in the acidic environment due to the presence of H+ on the adsorbent [54] and the electrostatic attractions between the negatively charged functional groups present on the anionic dye and the positively charged adsorbent (Nd2O3 nanoparticles) surface [55]. Figure 7a shows that optimal removal of 91.03% was achieved at a pH of 3.6 and concentration of 120 mg/L, 89.70% at pH 3.63 and time of 50.5 min (Figure 7c). Also, 89.75% optimal removal was reached at pH 3.6 and dosage of 0.69 g/L (Figure 7b). The reaction time is also vital in all research methods. Figure 7f shows the adsorption efficiency was increased by increasing the contact time and dosage of Nd2O3 nanoparticles. The efficiency was increased with increasing Nd2O3 nanoparticles dosage due to the availability of more active sites to trap the adsorbate (AB92); but beyond the optimal dosage and time, the adsorption efficiency was decreased. The removal of AB92 was improved rapidly with increasing contact time. The latter can be explained by the fact that high number of dye molecules does not have time to come in contact with nanoparticles to adsorb if the contact time is short [56]. The interaction between the initial AB92 concentration and pH has a negative effect on the adsorption process (Figure 7a). The adsorption efficiency declined with increasing initial concentration. Researchers have proved that at high concentrations, the removal efficiency is likely to decrease owing to the saturation of the adsorbent surface with the adsorbate contaminant [57]. The effect and significance of the interaction effects between the independent/process variables would have been lost if the experiments were done by using only the conventional means.

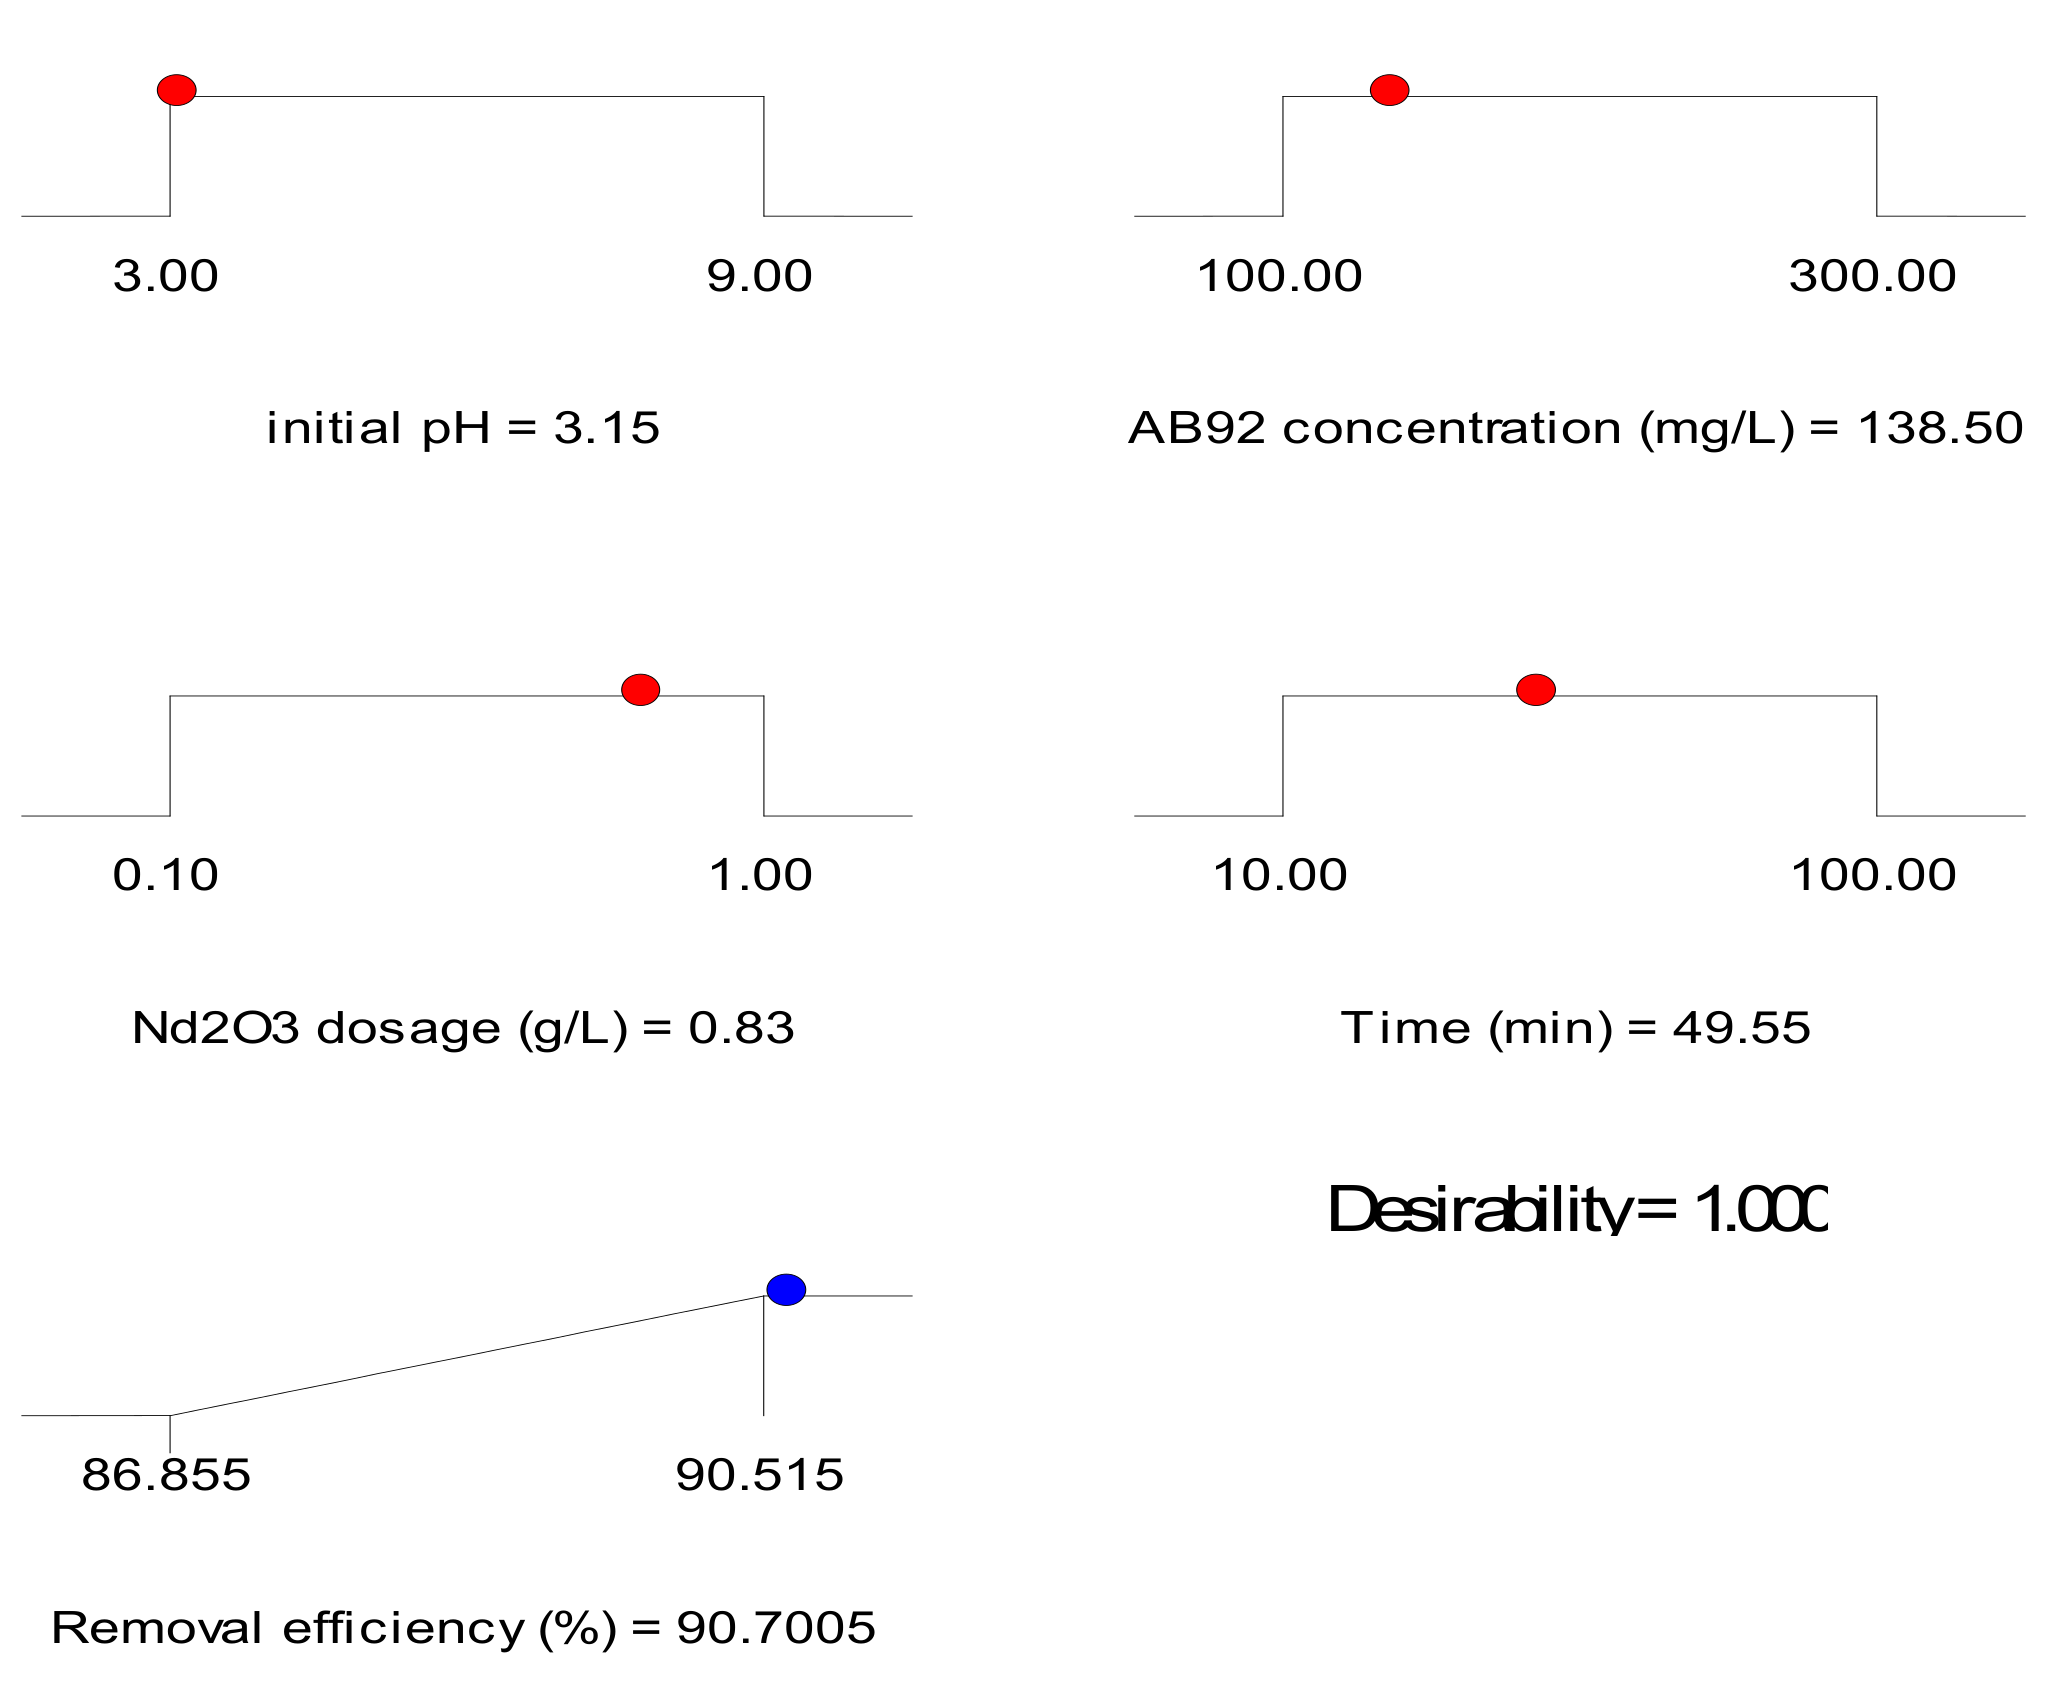
3.3. Optimization of Acid Blue 92 (AB92) Decolorization

Numerical optimization was executed through the Design expert software (Stat-Ease, 7.1 trial version) to define the optimal conditions for adsorption of AB92 on Nd2O3 nanoparticles. Adsorption efficiency of 90.70% was predicted at the optimal conditions of pH: 3.15, AB92 concentration: 138.5 mg/L, Nd2O3 nanoparticles dosage: 0.83 g/L and time: 49.55 min obtained. The validity of the predicted optimal values was proved by carrying out an experiment at these optimal conditions. Adsorption efficiency of 90.77% was obtained which is in agreement with the predicted adsorption percentage. Desirability value close to 1 shows the significance and acceptability of a model [58]. Figure 8 shows the desirability effect of the AB92 adsorption on Nd2O3 nanoparticles; the desirability of 1.000 confirms the applicability of the model and acceptability of the predicted output responses.

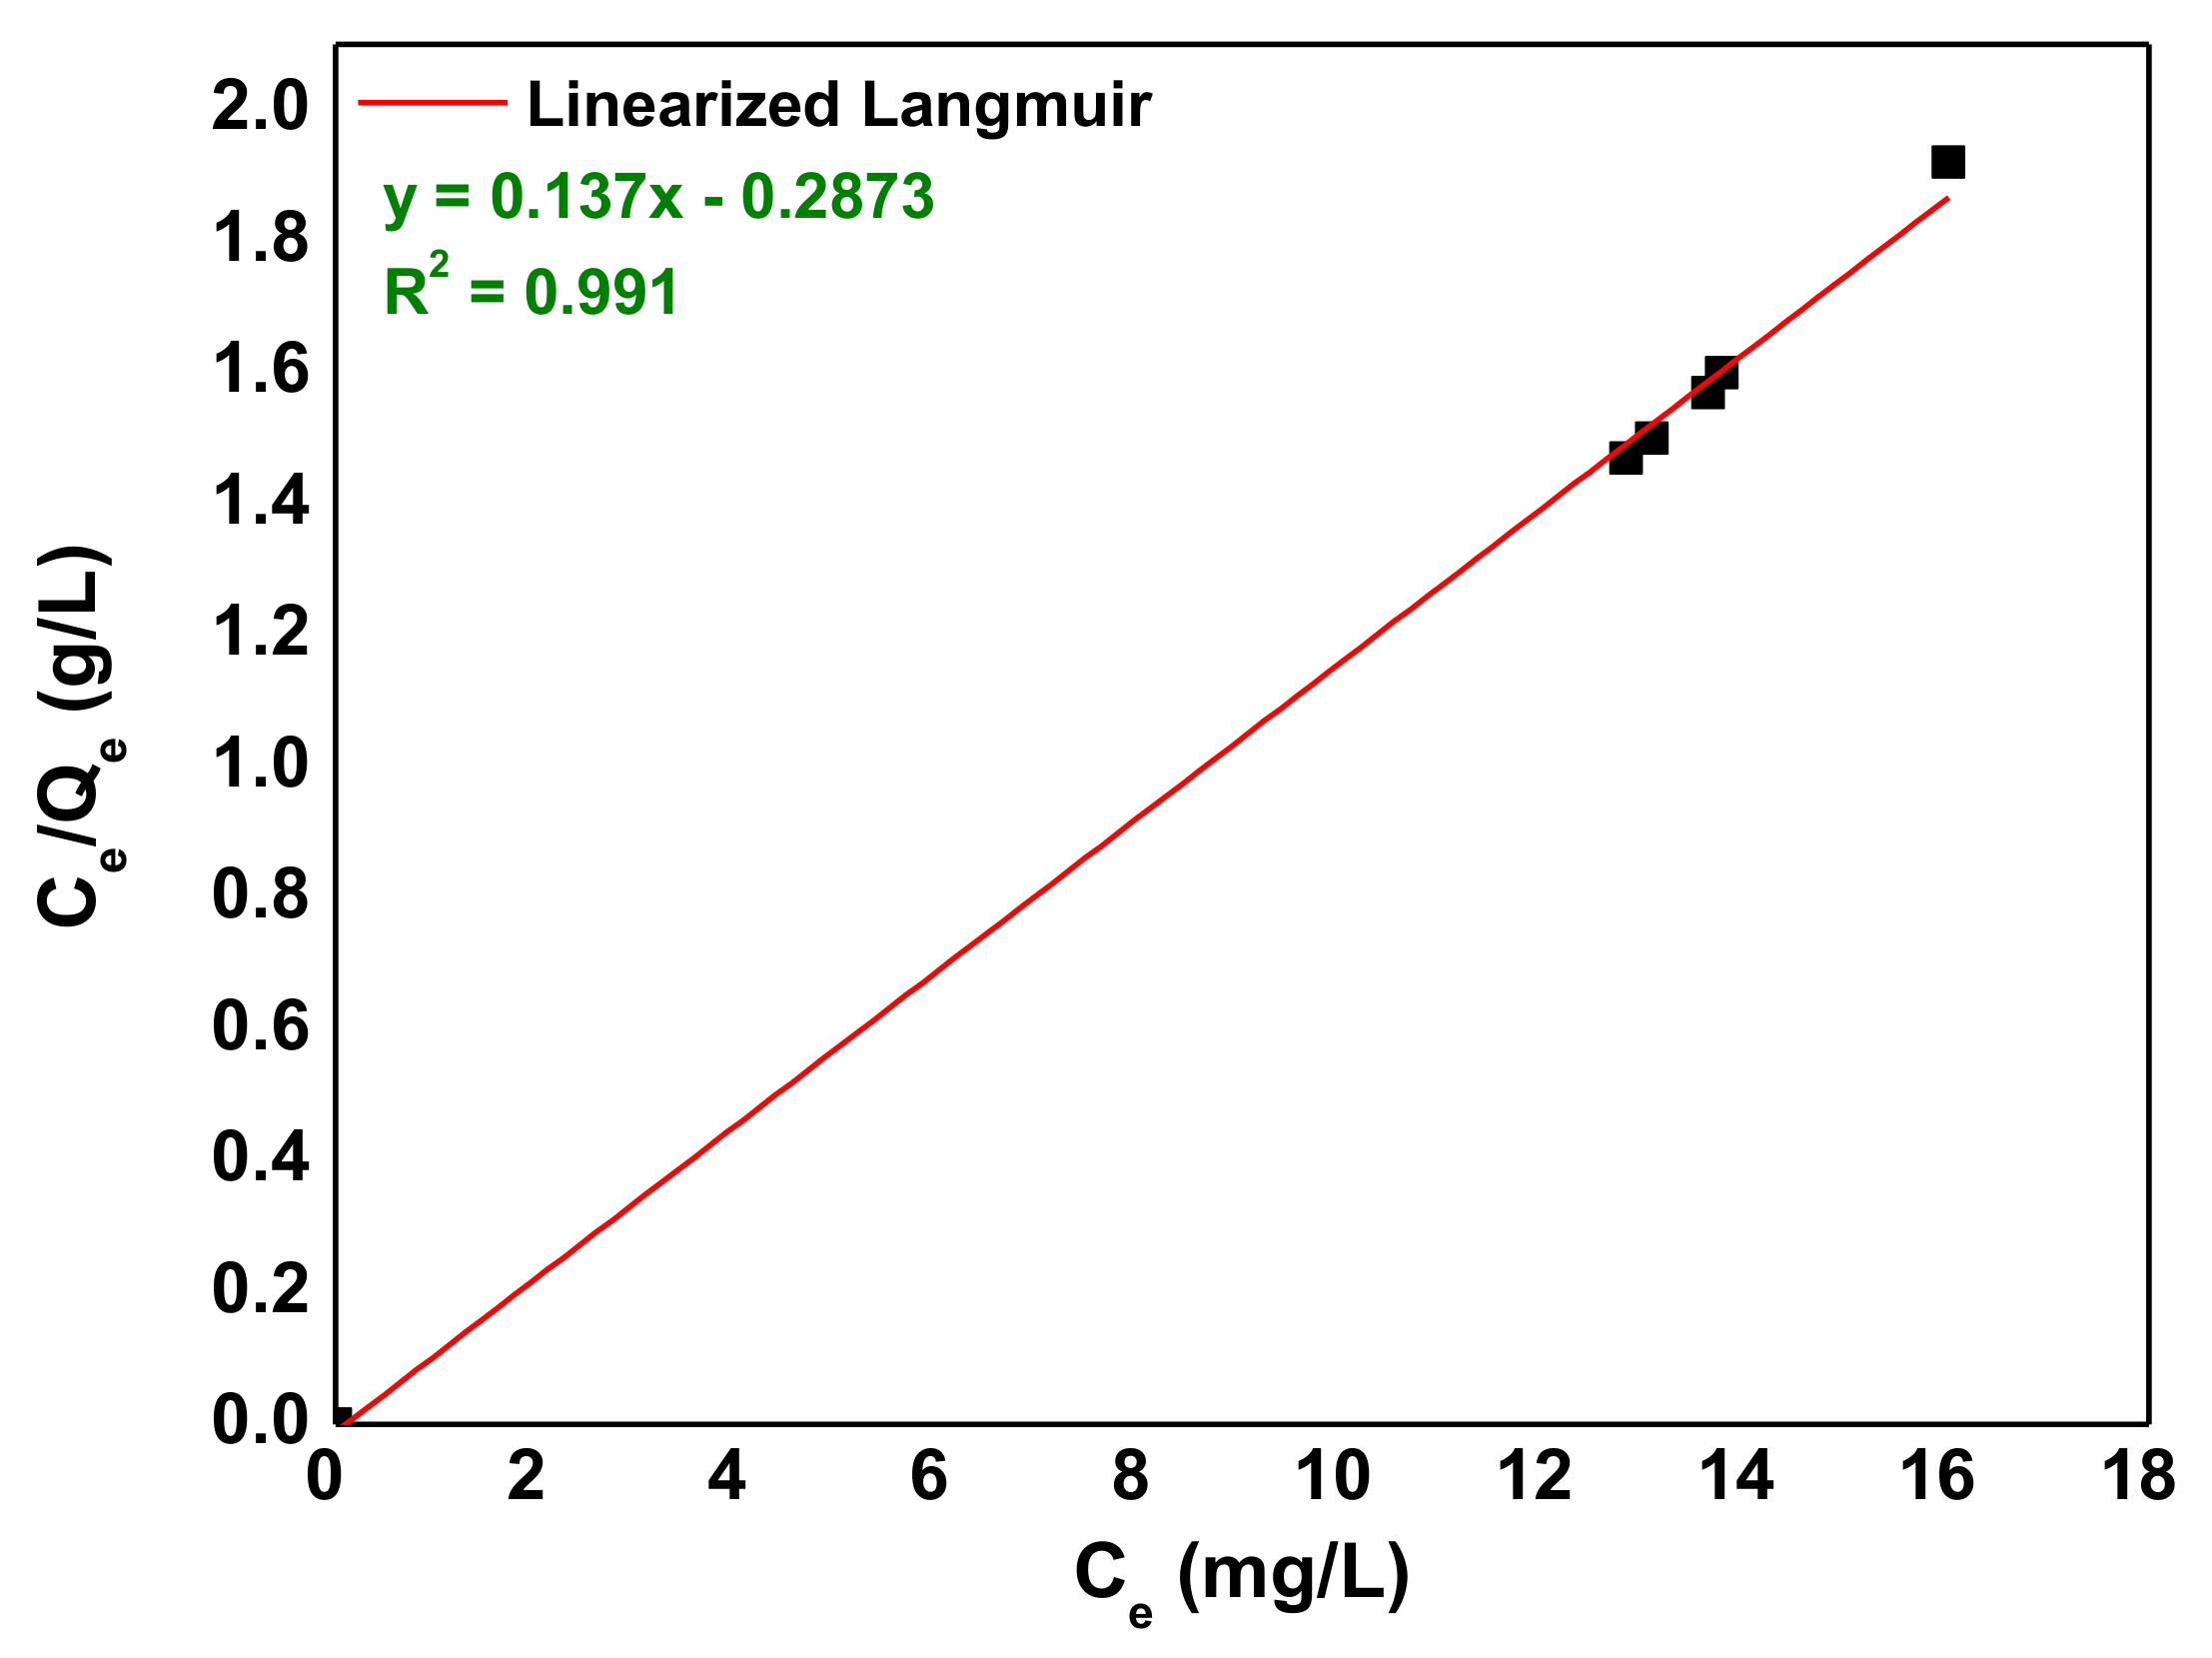
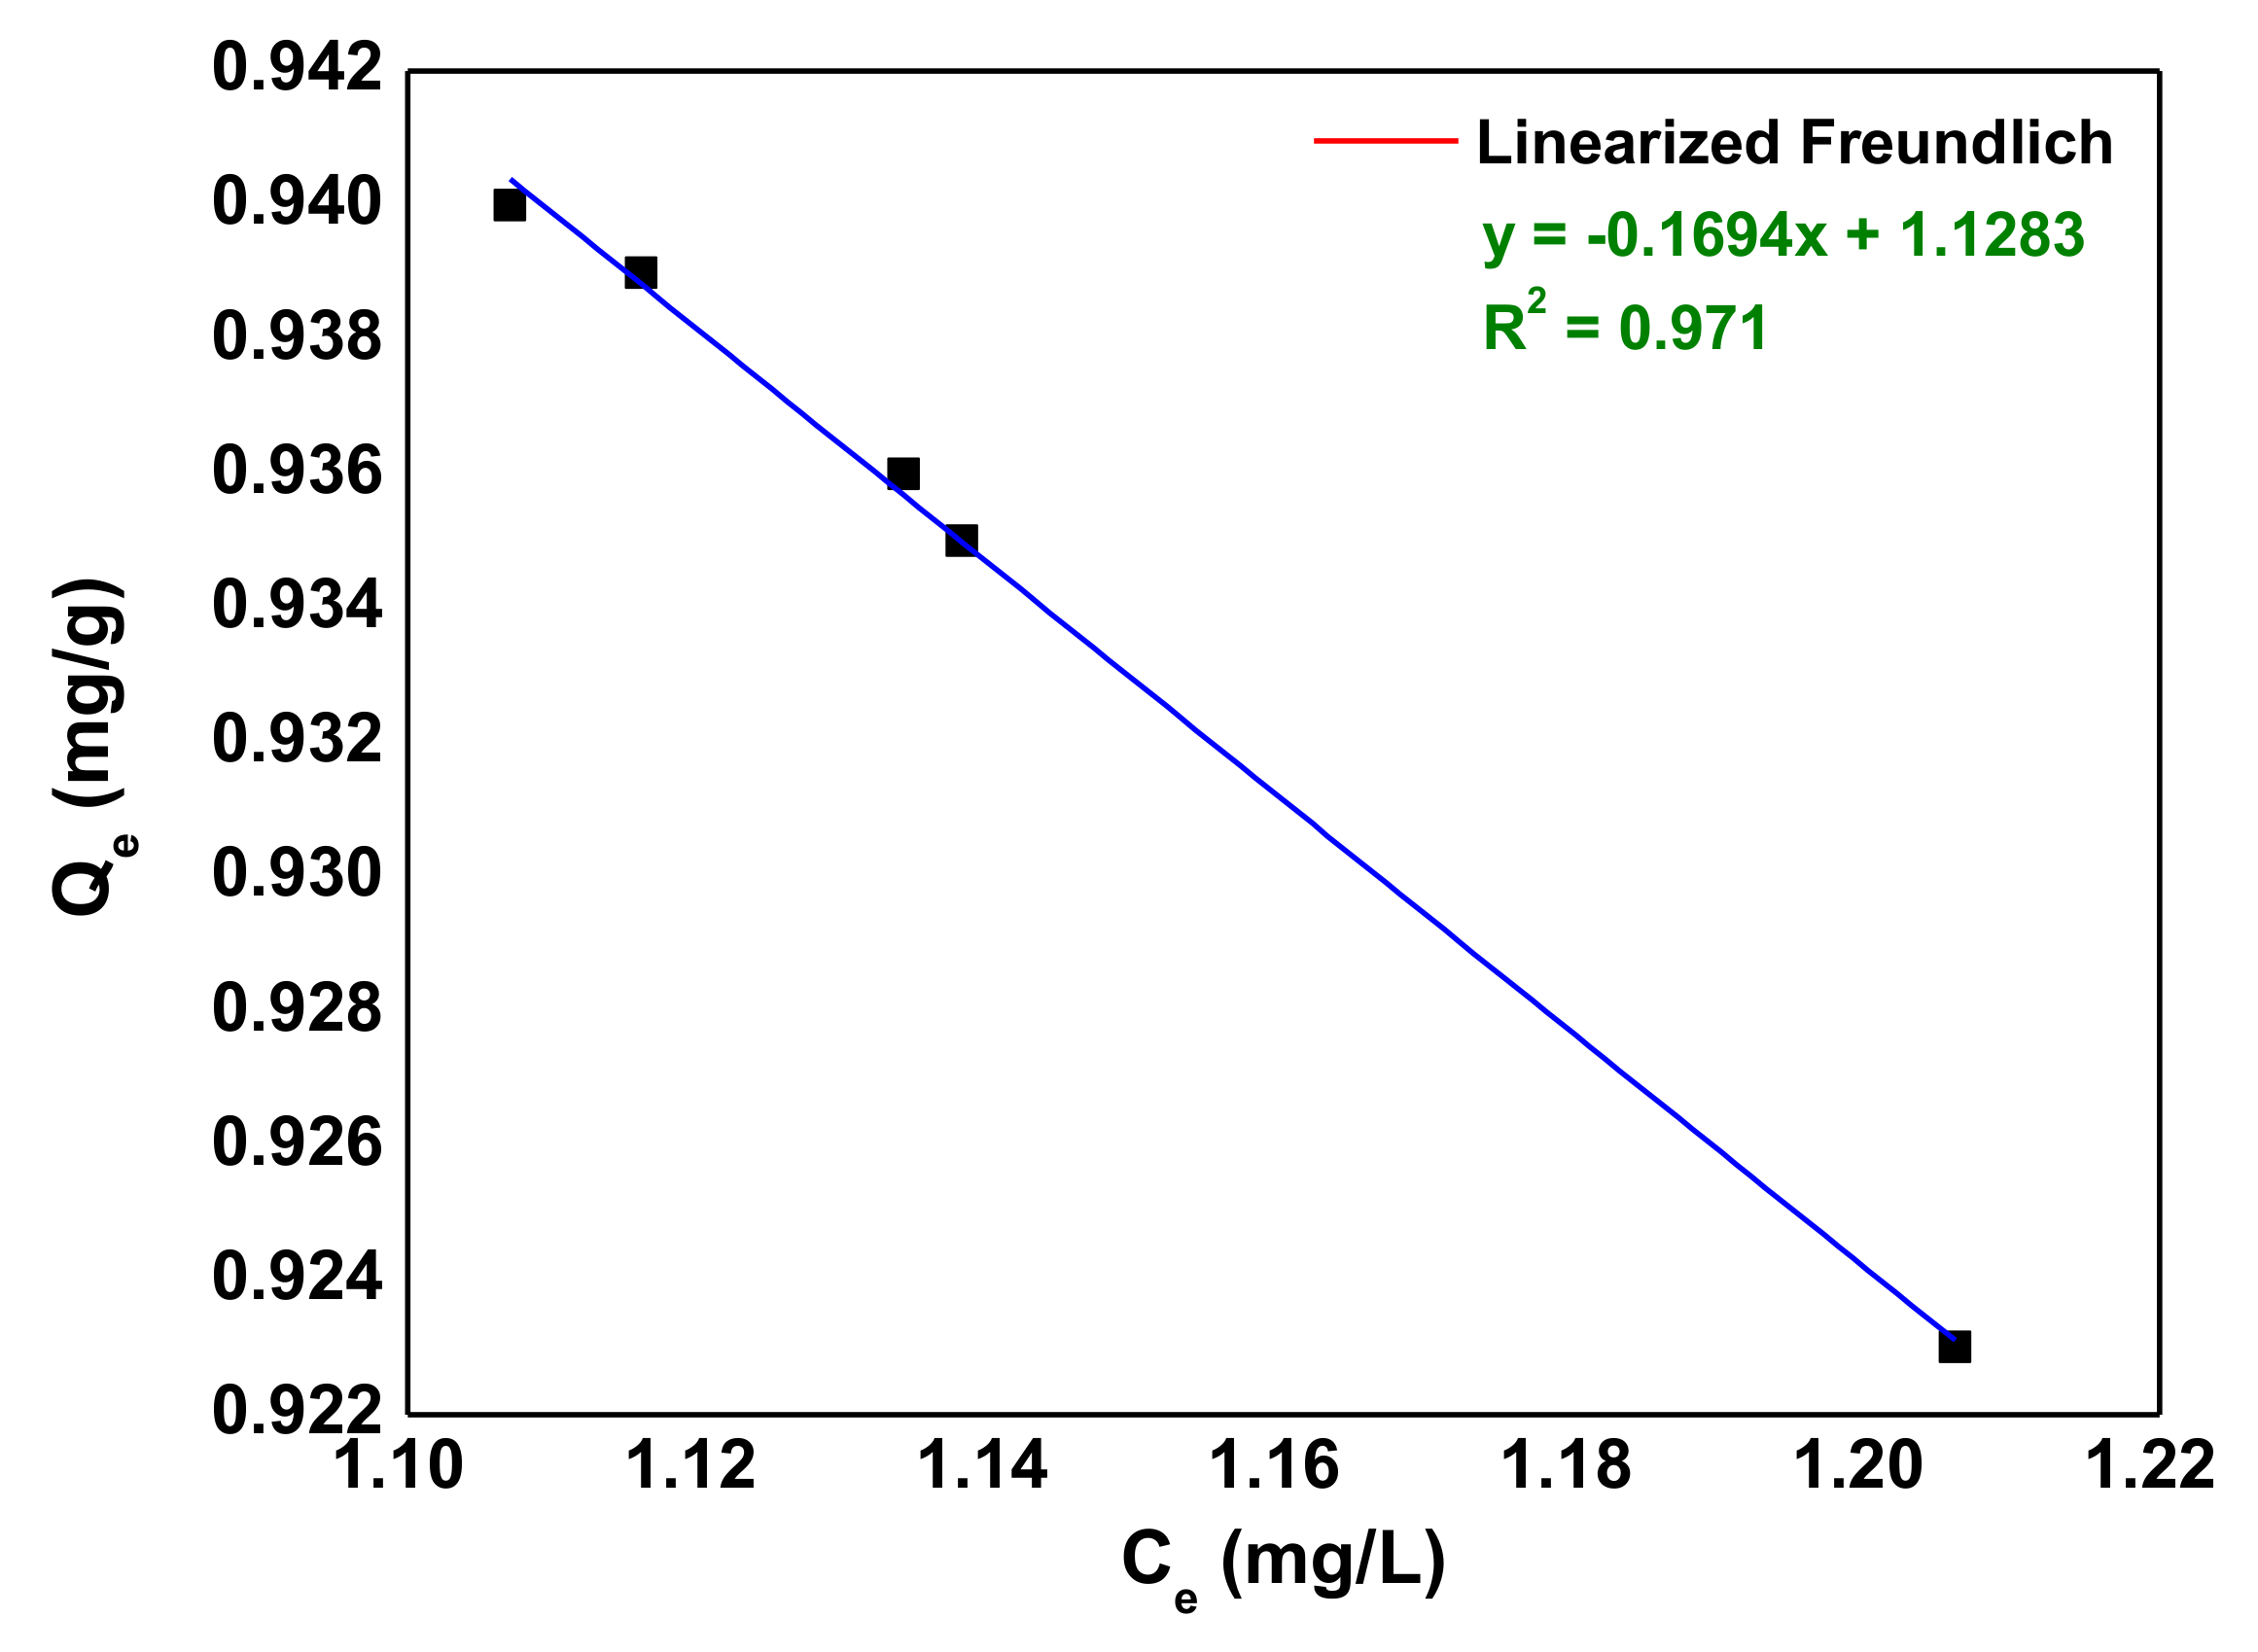
3.4. Adsorption Isotherms

In this research, the equilibrium data of AB92 adsorption on neodymium oxide nanoparticles were analyzed using the two most common isotherm models (Langmuir and Freundlich models). Figure 9 shows the typical equilibrium adsorption of AB92 onto prepared Nd2O3 nanoparticles at pH of 3, Nd2O3 nanoparticles dosage of 1 g/L, AB92 concentration of 100 mg/L and temperature of 289 K). The adsorption isotherm curve rises steeply at lower concentrations of AB92 and approaches to a plateau at higher concentrations.
The equilibrium data resulted were fitted to the non-linear Langmuir (Equation (6)) [59] and Freundlich (Equation (7)) [60] expressed by the following respective equations:
Q e = Q m a x K L C e 1 + K L C e
Q e = K F C e 1 / n
where Qe (mg/g) is the equilibrium dye concentration in the solid phase; Qmax (mg/g) is the maximum amount of adsorption; KL (L/mg) is the Langmuir adsorption equilibrium constant; KF (mg1−1/n L1/n/g) is the Freundlich constant representing the adsorption capacity, n (-) is the constant depicting the adsorption intensity.
The parameters found after fitting were Qmax = 20 mg/g, KL = 0.04118 L/mg (R2 = 0.991) for Langmuir equation, while KF = 0.94095 mg1−1/n L1/n/g, n = 0.08265 (R2 = 0.973) for the Freundlich equation.
However, many scientists also present isotherm models in linear expression. So, based on the ideal assumption of monolayer adsorption of adsorbate on the adsorbent surface, the Langmuir isotherm model is expressed in the linear form as follows [61]:
C e q e = 1 Q max · 1 K L + C e Q max
where the constants, qm, and KL were determined by plotting (Ce/qe) versus the equilibrium sorption, Ce (Figure 10) and the calculated Langmuir parameters are recorded in Table 5.
The Freundlich adsorption isotherm model is expressed as [62]:
log q e = 1 n log C e + log K F
where KF and 1/n are the Freundlich constants. The plot of log(qe) versus log(Ce) (Figure 11) enables the determination of the isotherm, constants KF and 1/n (Table 5). The isotherm parameters along with the regression coefficient, R2 are listed in Table 5.
The AB92 adsorption equilibrium data fitted into the studied isotherm models but the Langmuir was slightly better compared to the Freundlich isotherm with regards to its correlation coefficient, R2 (Table 5) with maximum adsorption capacity, qm of 7.299 mg/g under the experimental conditions. The favorability of an adsorption process is indicated by the magnitude of n [63]. The n-value of 5.903 determined for the Freundlich model lies within 1–10 (Freundlich threshold range) which suggests that the sorption process is favorable [63].

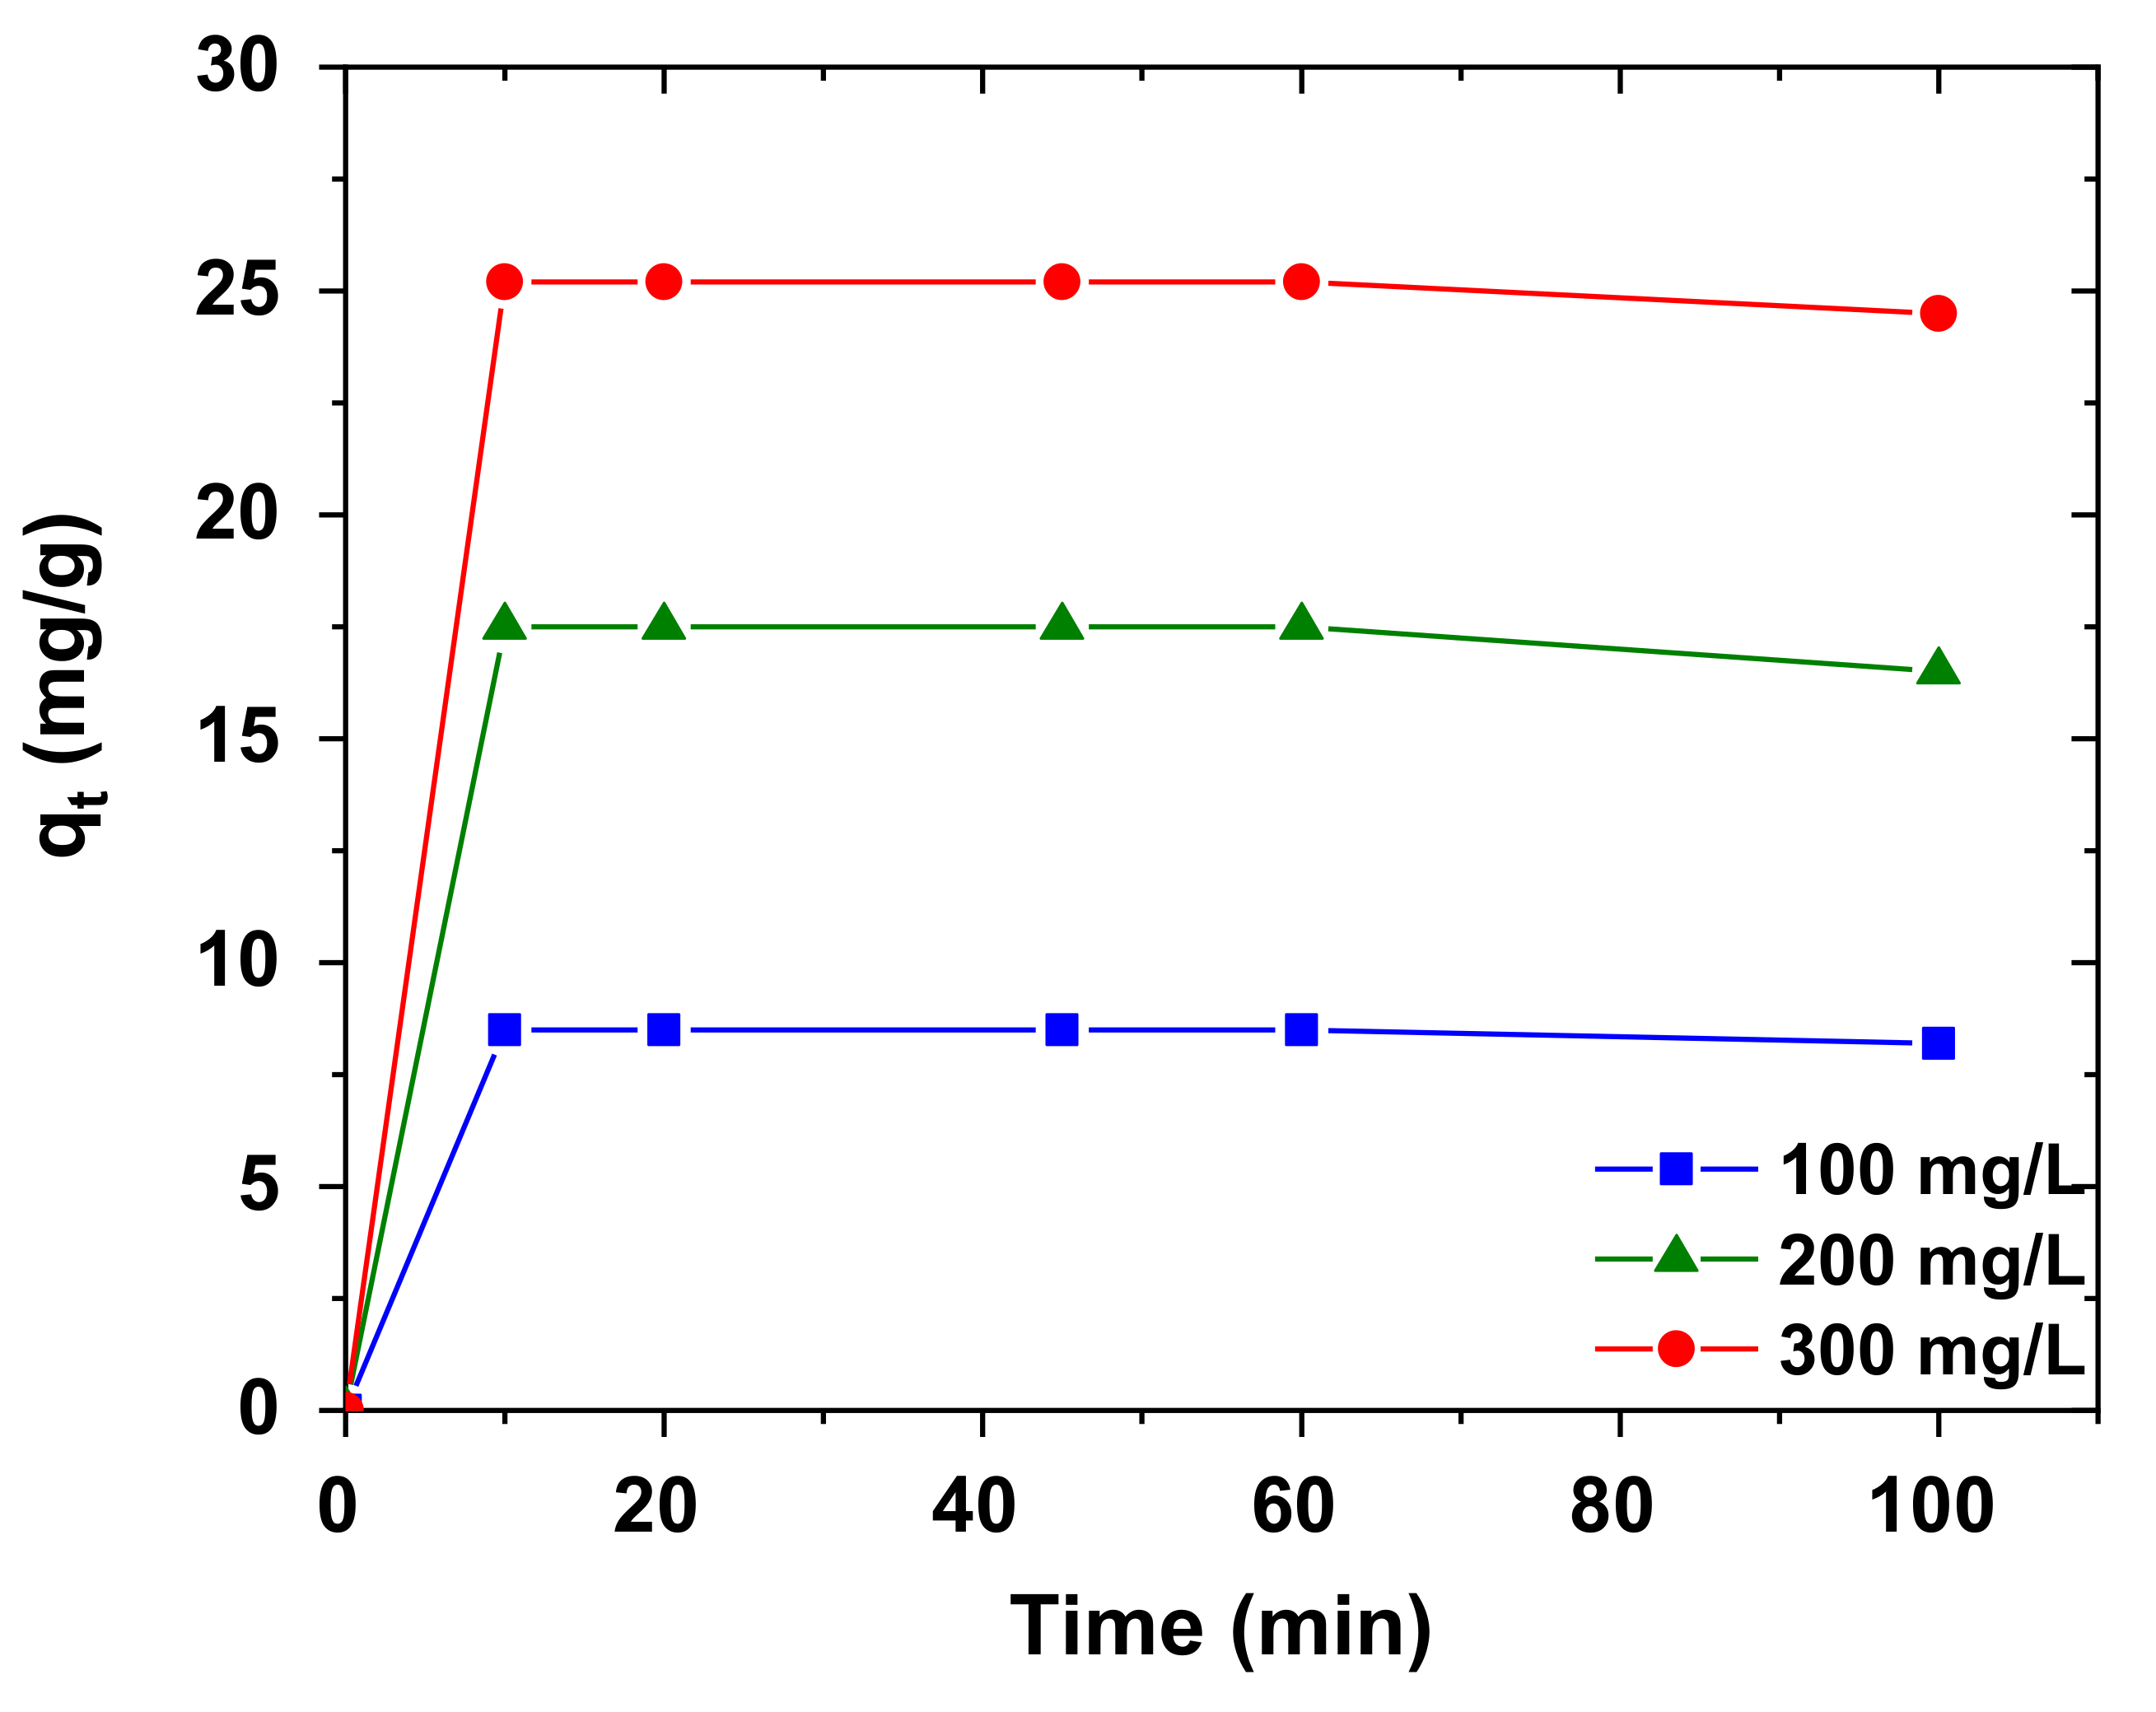
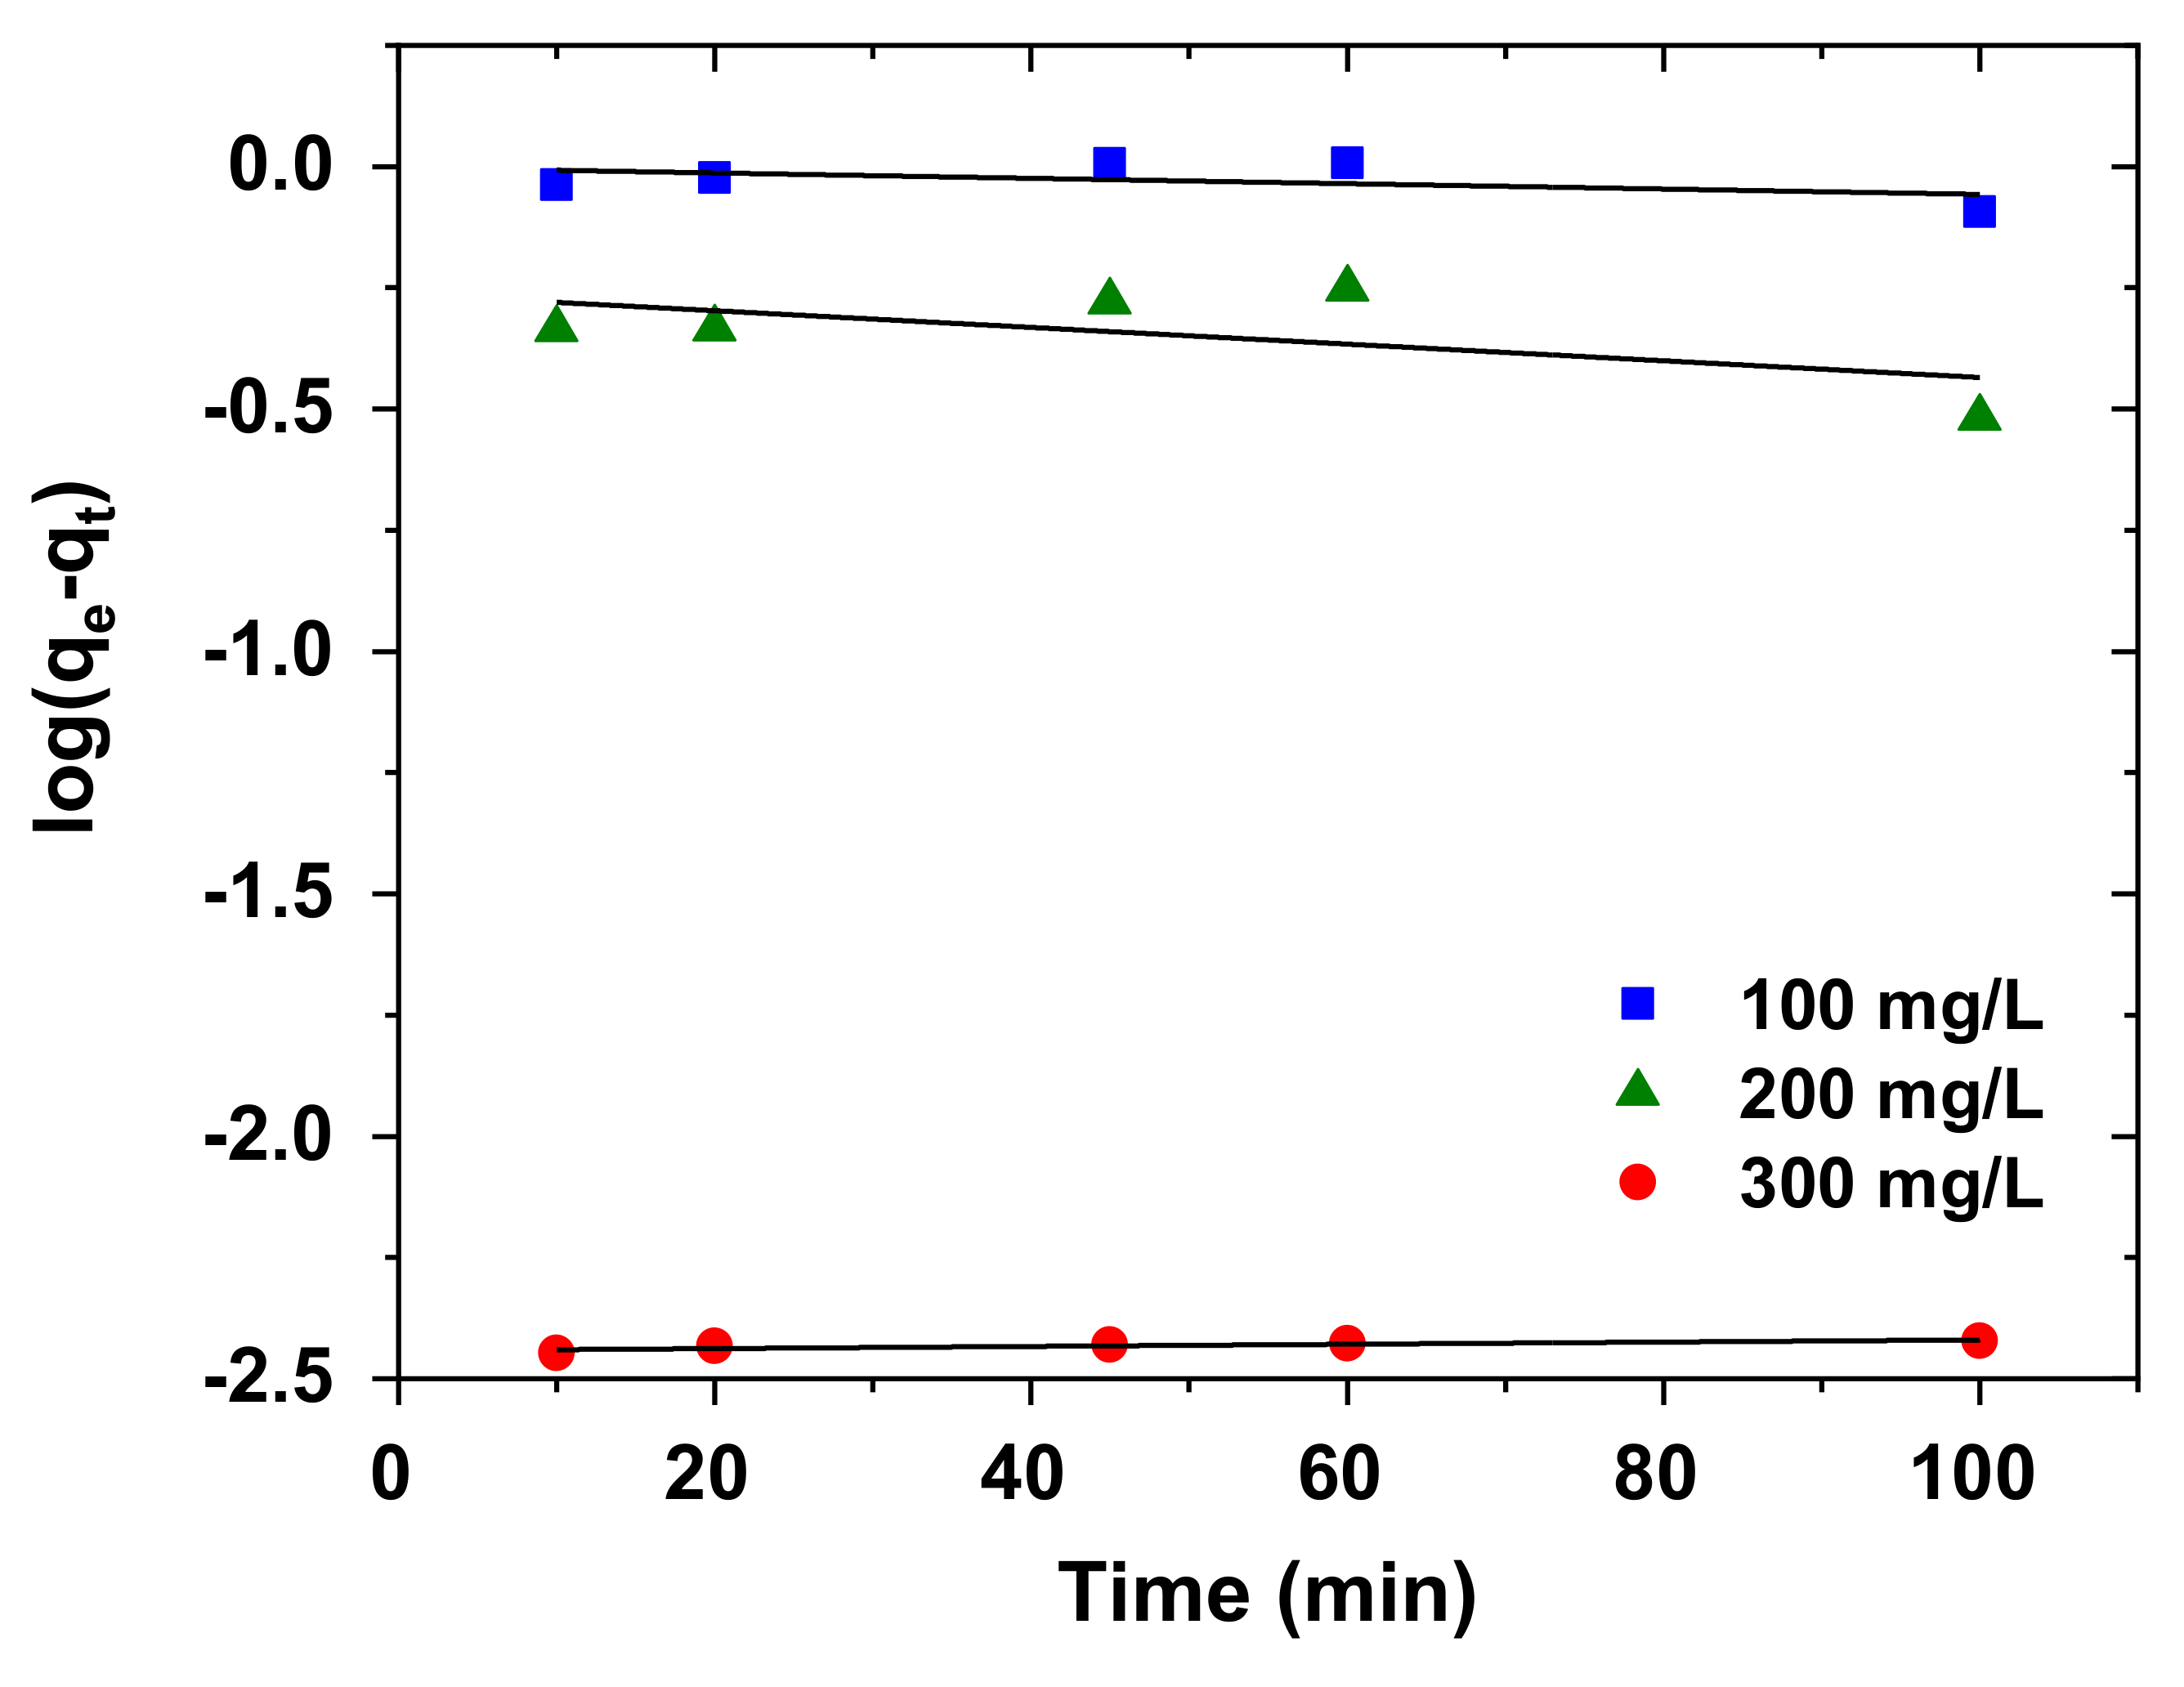
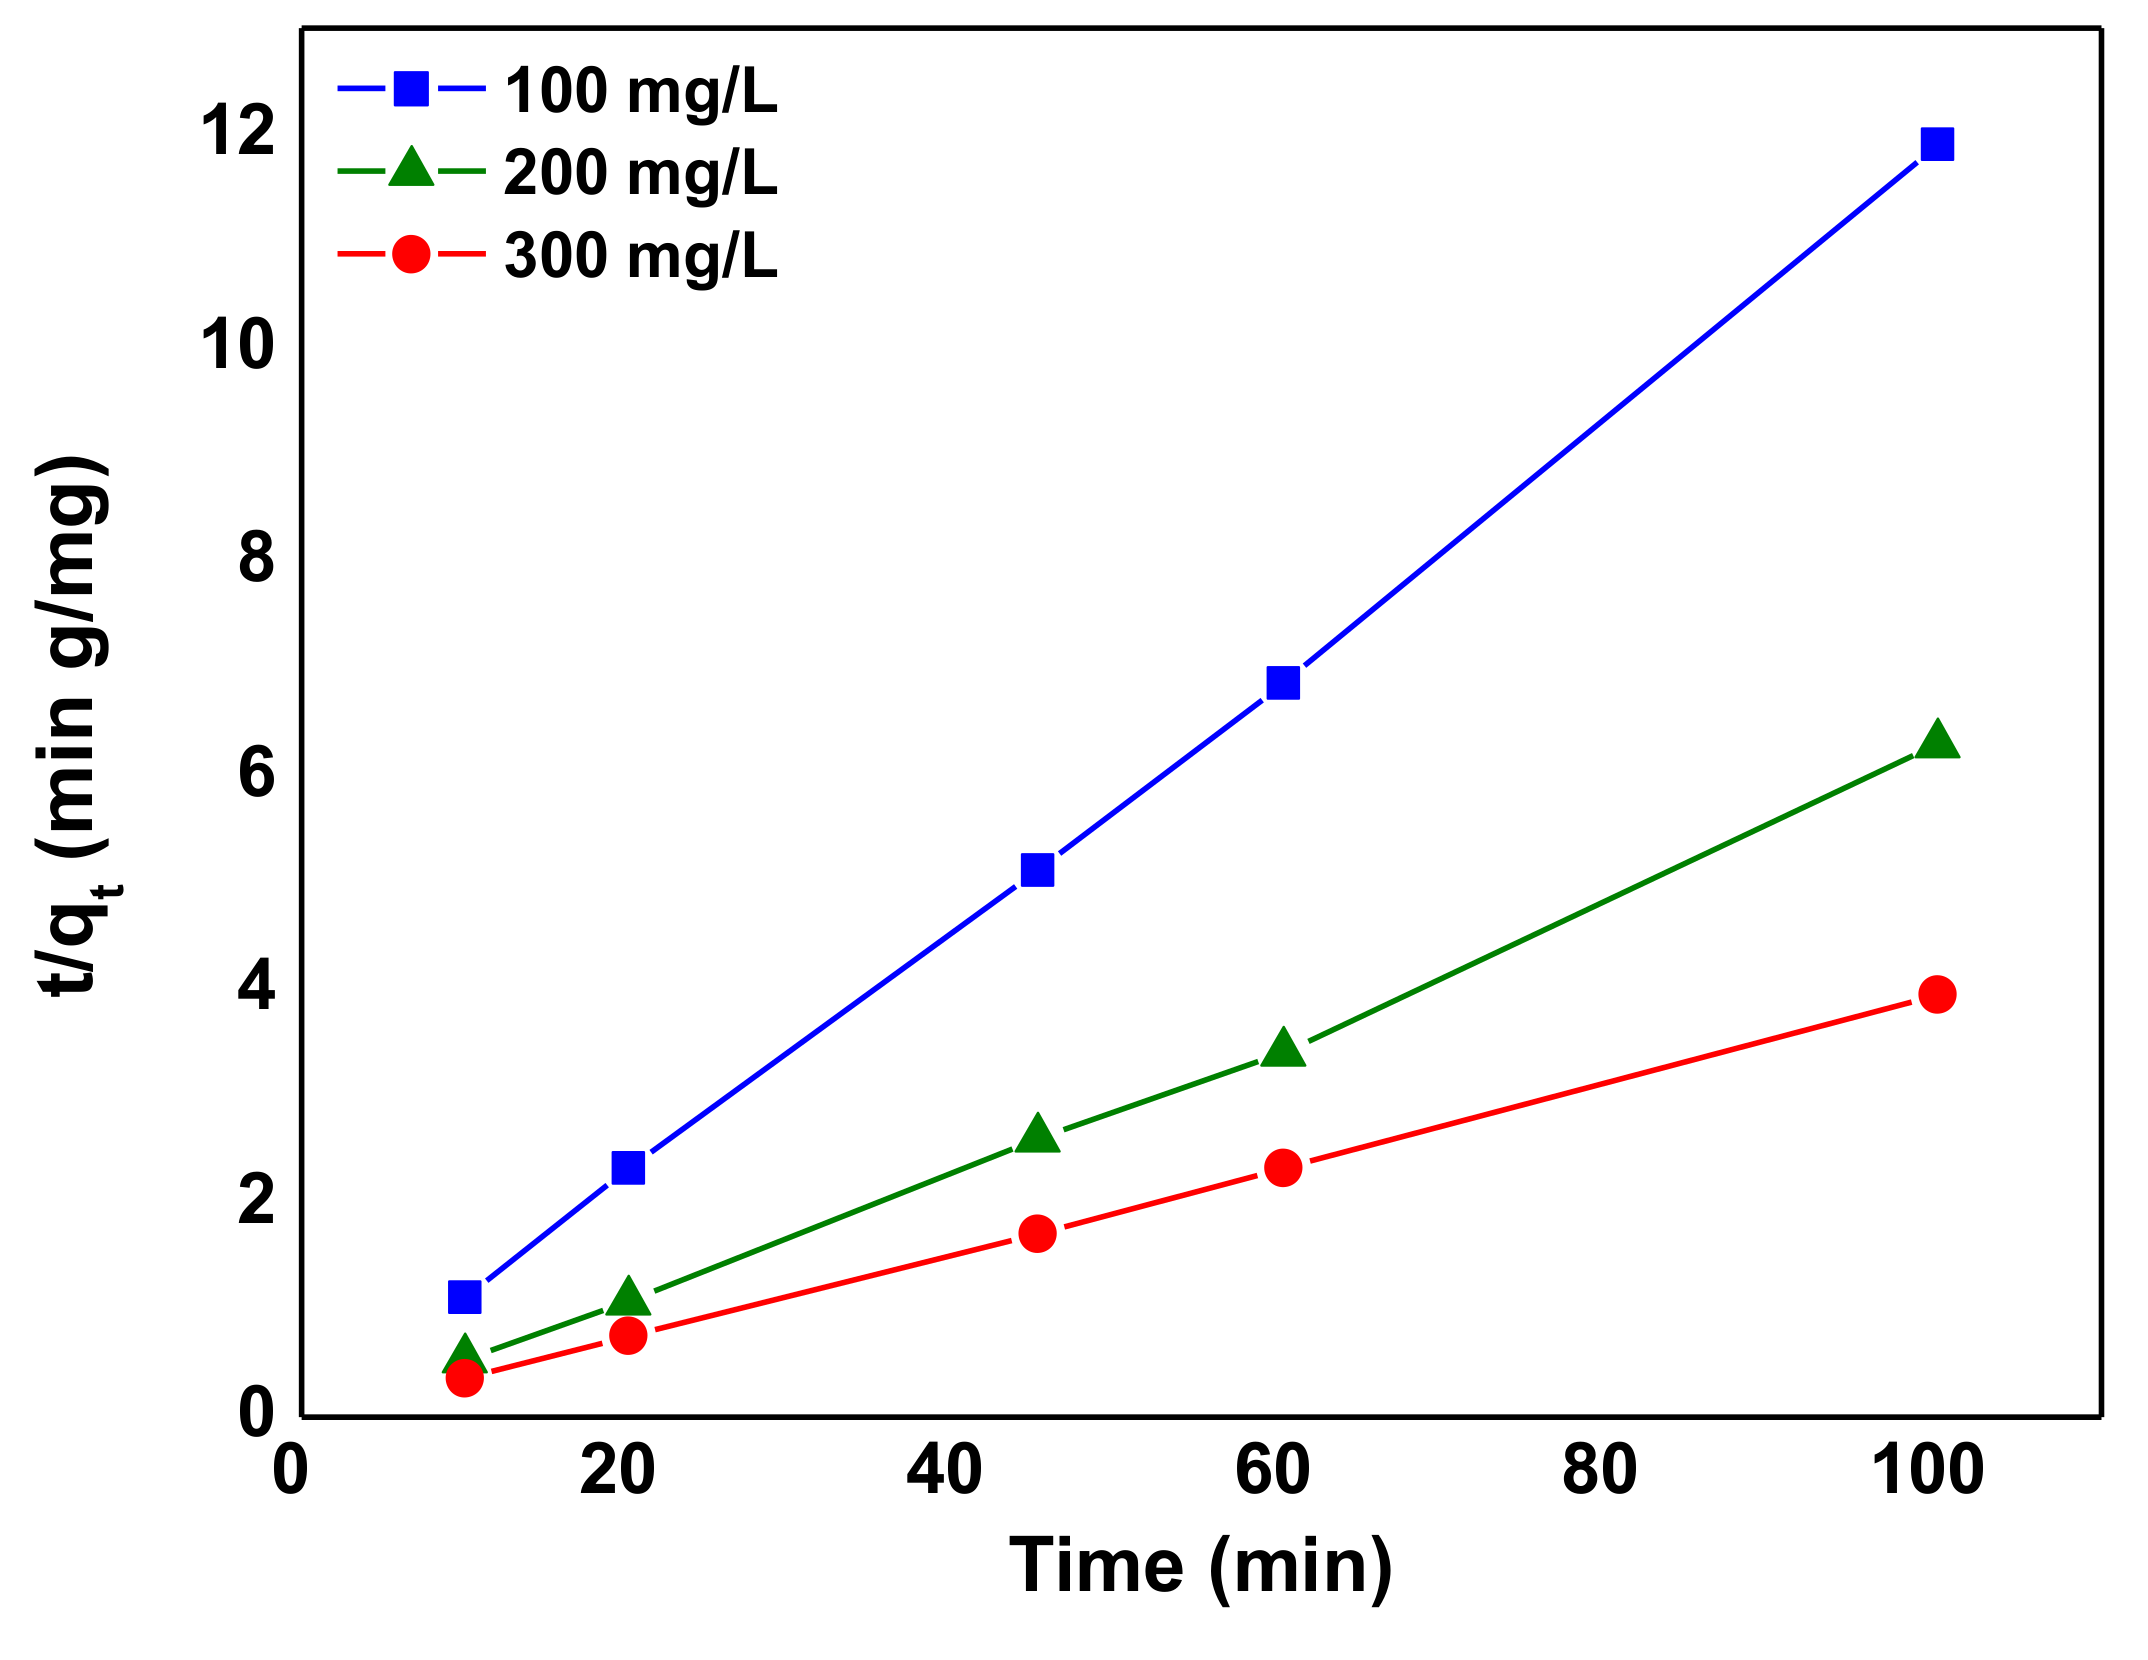
3.5. Kinetics of Adsorption

In order to further understand the adsorption process of AB92 onto Nd2O3 nanoparticles, the kinetics of the process was investigated. The experimental kinetic data were fitted into the Lagergren pseudo-first-order and Ho/Mckay pseudo-second-order kinetic models. The kinetics study was performed at pH of 3, Nd2O3 nanoparticles dosage of 1 g/L, and temperature of 298 K at different AB92 concentrations (100, 200 and 300 mg/L). The plot of qt versus t gives an excellent straight line relation for adsorption of AB92 on Nd2O3 nanoparticles (Figure 12).
The pseudo-first-order model is widely applied for the adsorption of liquid adsorbate on solid adsorbent on the basis of adsorption capacity at different time intervals (Figure 13). The pseudo-first-order rate equation is defined as Equation (10) [64]:
log q e q t = log q e k 1 2.303 t
This equation is known as the integrated rate law for pseudo-second-order chemisorption reaction.
The pseudo-second-order equation is given as Equation (11) [65,66]:
t q t = 1 k 2 q e 2 + t q e
where qe and qt denote the amount of AB92 adsorbed per unit mass of the adsorbent at equilibrium and at time, t (mg/g). k1and k2 are the pseudo-first-order and pseudo-second-order rate constants (min−1), respectively. By plotting (t/qt) versus t (Figure 14), the constants qe and k2 were evaluated (Table 6). The R2 was used as the basis for choosing the appropriate kinetic model. The adsorption kinetic data was found to agree with the Ho kinetic model than the Lagergren (pseudo-first-order) model at all concentrations (Table 6) which suggests that the rate-limiting step is the chemisorption process [67]; this entails the sharing or exchange of electrons [68].

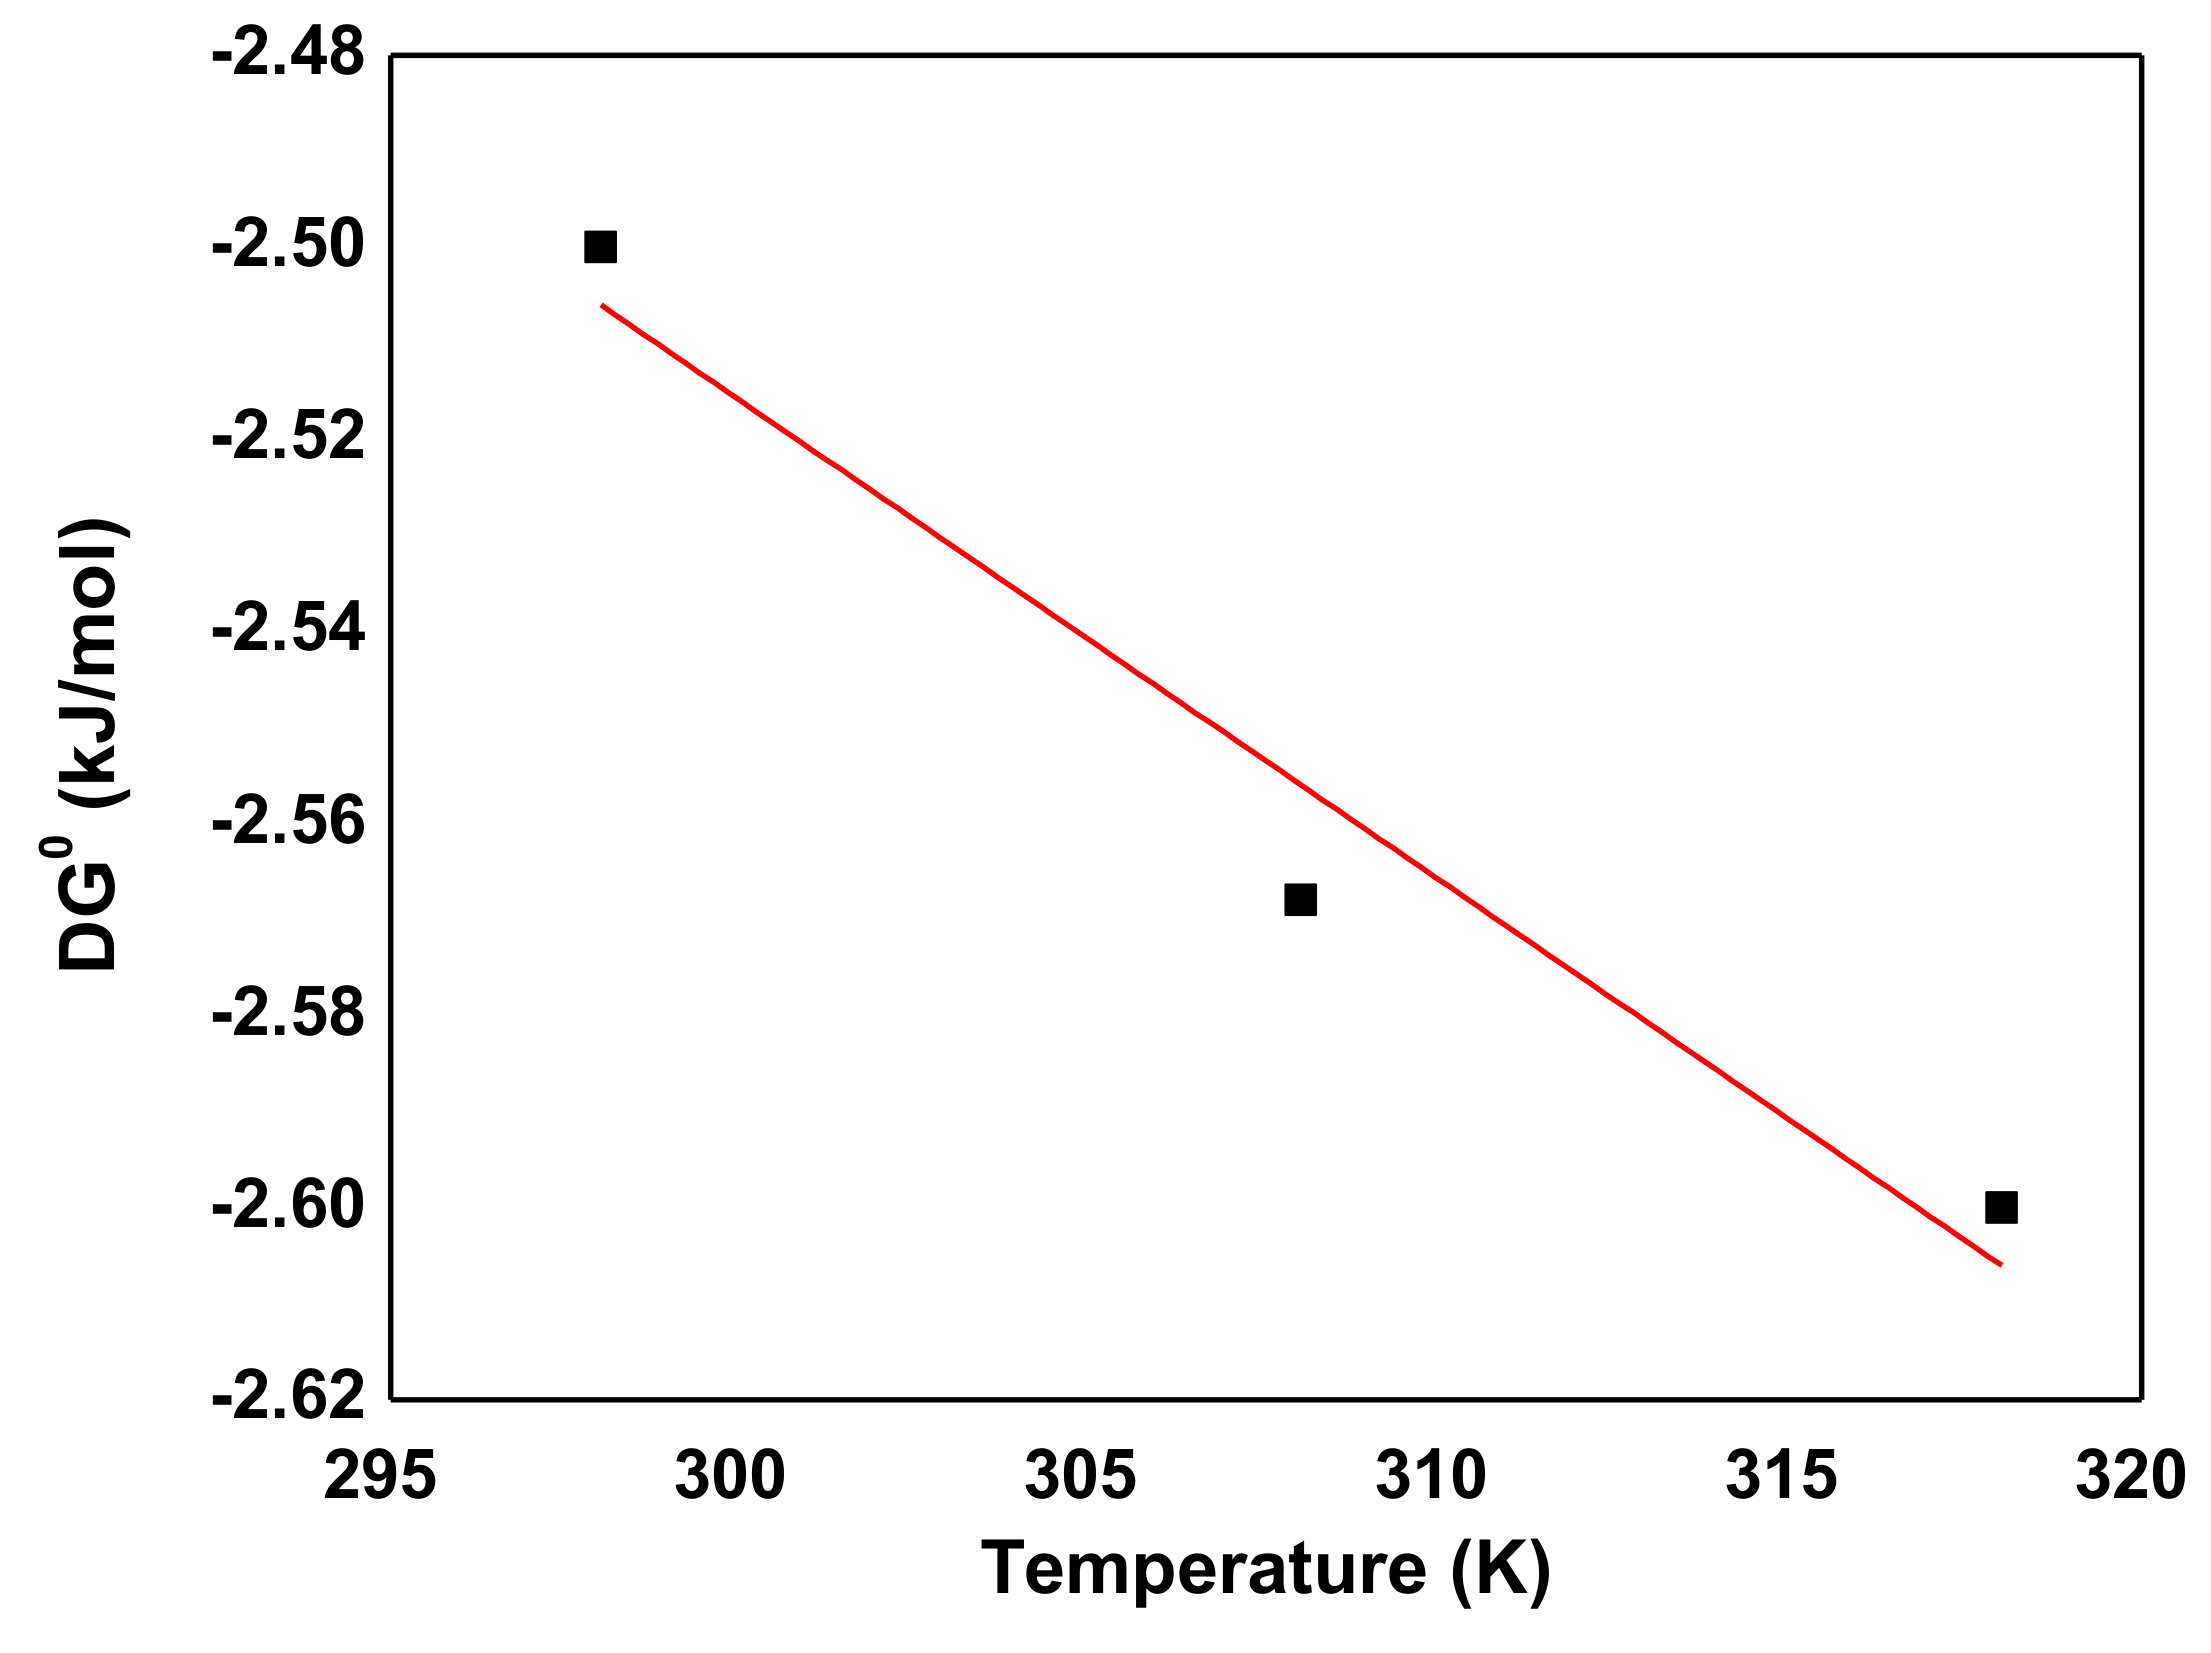
3.6. Thermodynamic Studies
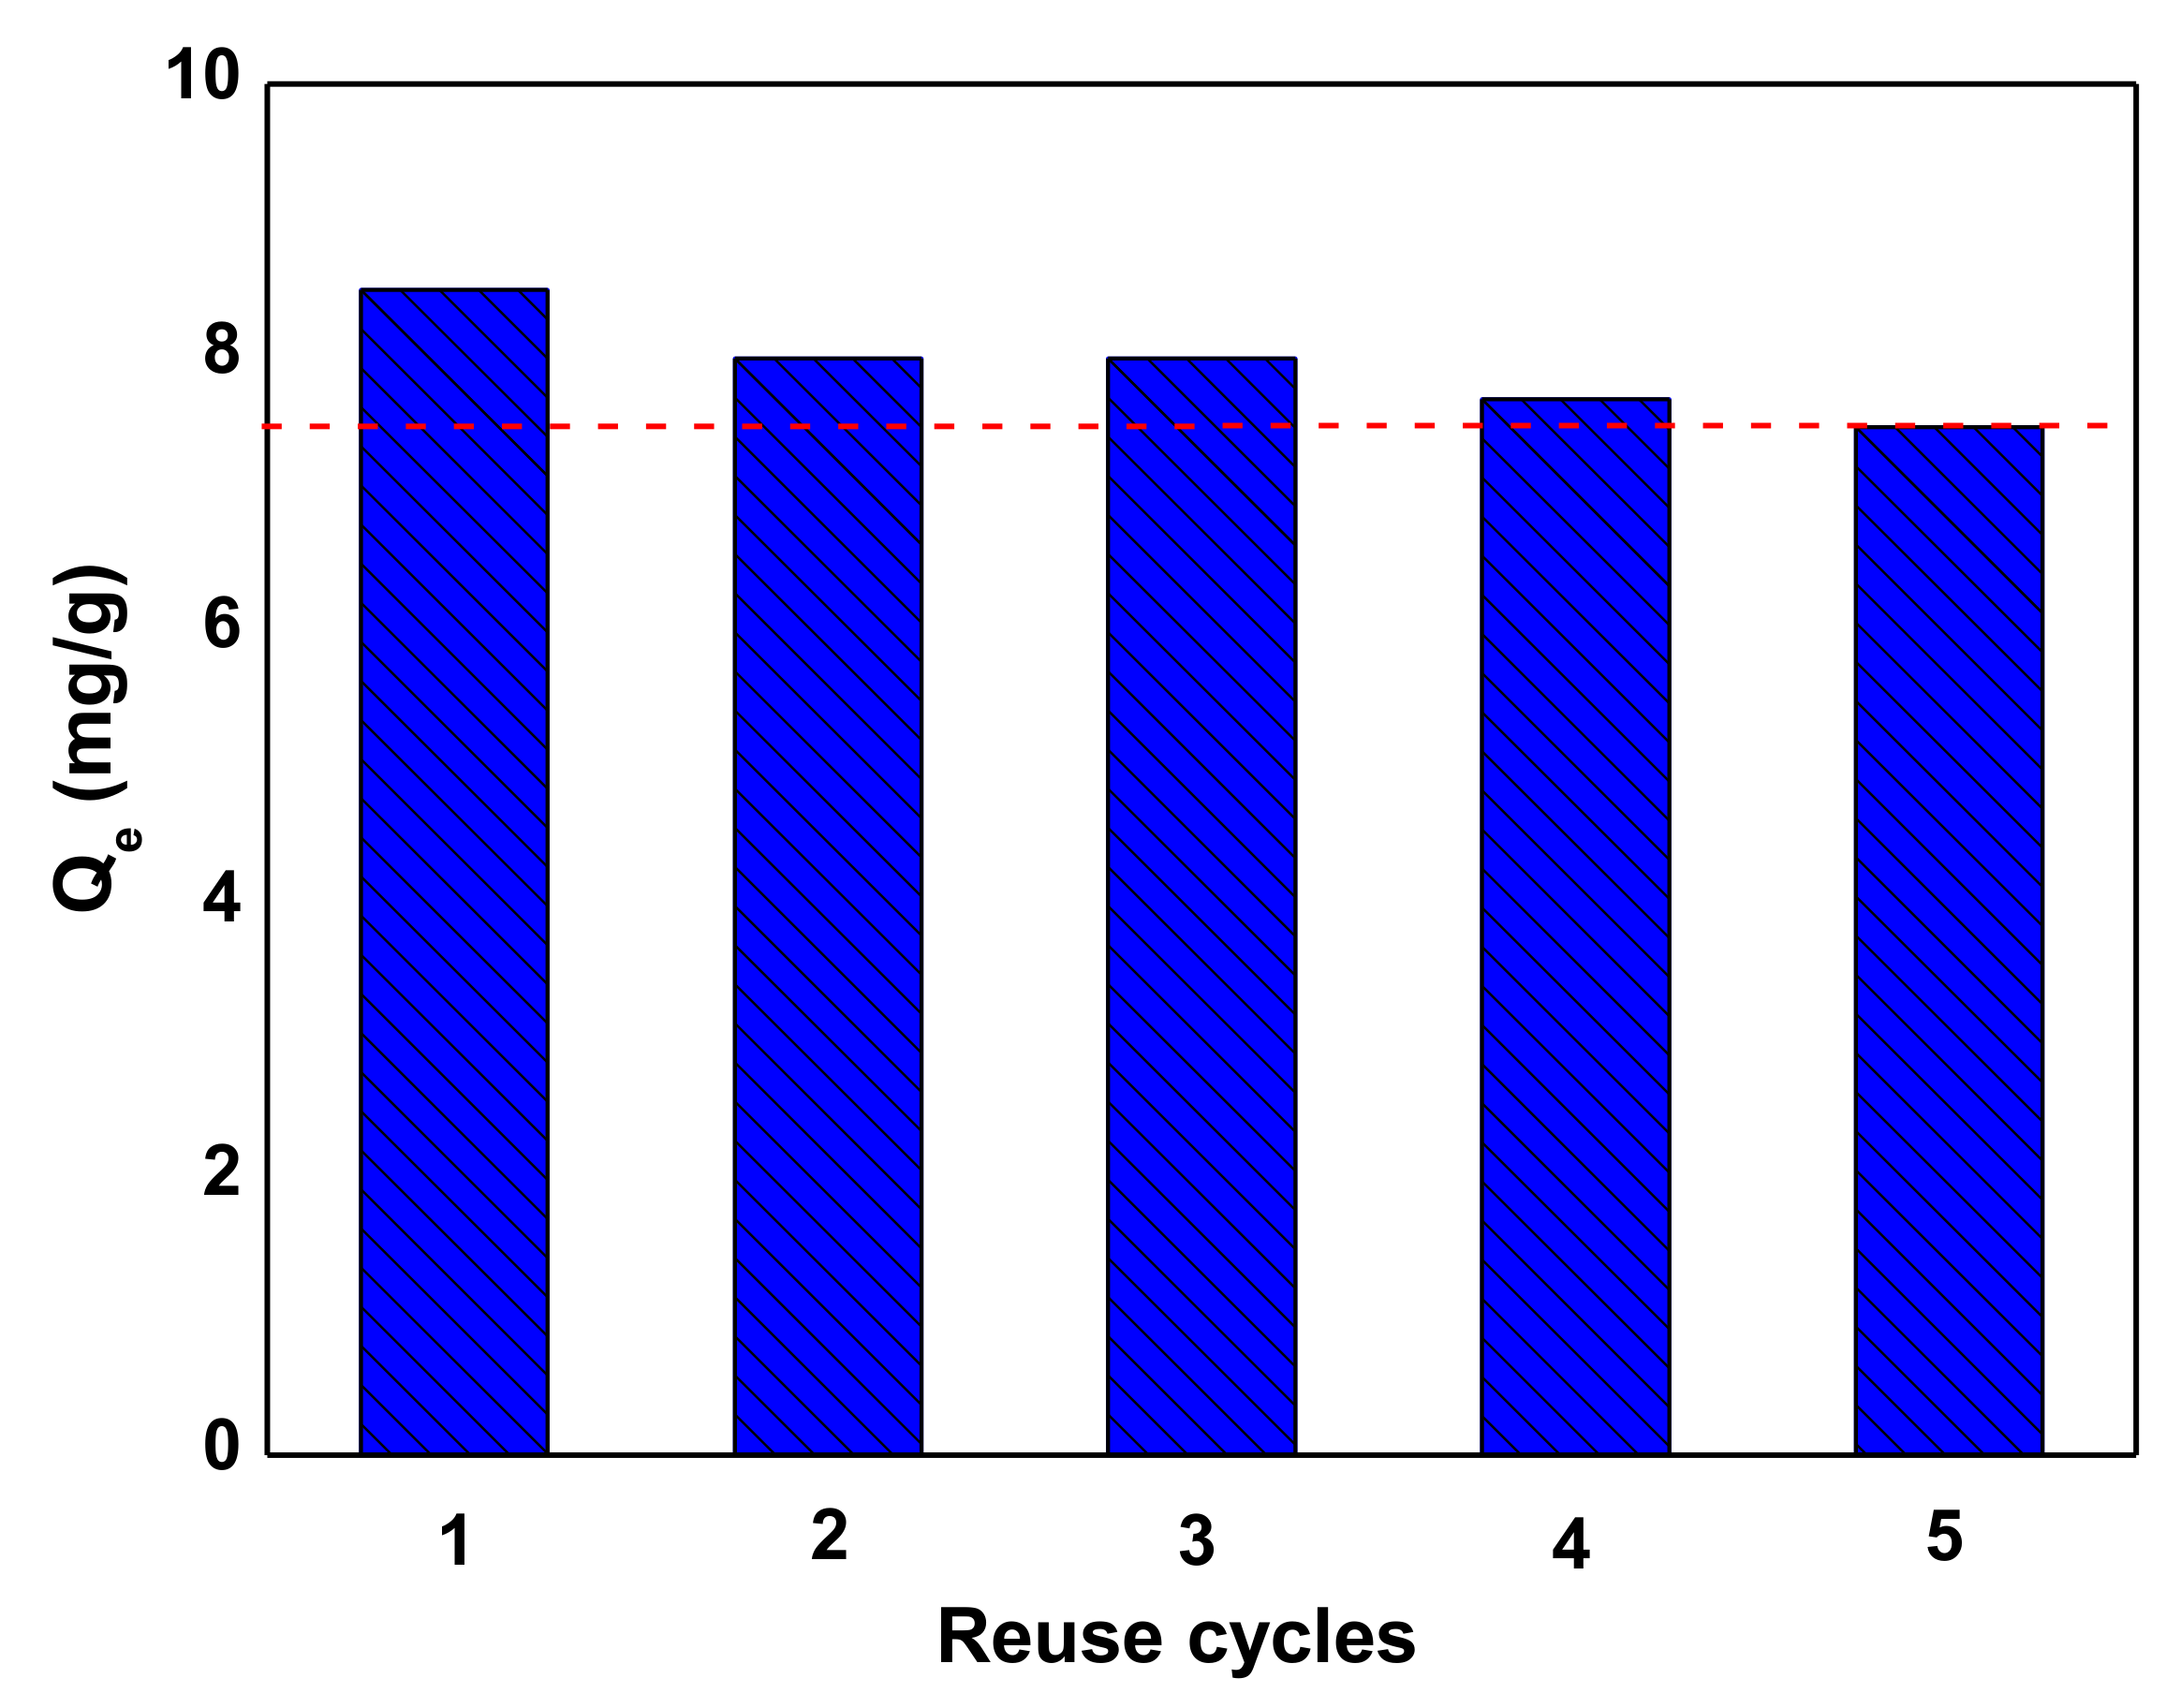
The thermodynamic parameters including the standard Gibbs free energy (ΔG0), enthalpy change (ΔH0), and entropy change (ΔS0) for adsorption of AB92 onto Nd2O3 were calculated (Table 7) using the following equations [69]:
Δ G 0 = R T ln K a
Δ G 0 = Δ H 0 T Δ S 0
where R is the universal gas constant (8.314 J/mol/K) and T is the absolute temperature in K. The thermodynamic parameter, Gibb’s free energy change (ΔG0), is calculated using Ka obtained from the Langmuir isotherm.
The negative ΔG0 values indicate that the adsorption of AB92 on Nd2O3 nanoparticle was spontaneous and favorable. The values of ΔG0 were found to decrease with increasing temperature (Table 7). For the calculation of ΔH0 and ΔS0 the plot of Figure 15 was used based on Equation (13). The positive value of ΔH0 indicates that the process is endothermic. According to Le Chatelier’s principle, increasing the temperature reduced the reaction rate and is followed by the reduction in the maximum adsorption capacity (qm). According to the results presented in Table 7, the Gibbs free energy values over –20 kJ/mol represent physical adsorption [58]. ΔS0 for the adsorption of AB92 by Nd2O3 nanoparticles is negative, suggesting that the degree of freedom at solid-solution level declines during the process of adsorption [70].

3.7. Reuse

Figure 16 illustrates the reuse potential of Nd2O3 after running the experiments in the same phase (aqueous) as that of adsorption experiments. The nanoparticles showed higher reusability, because it lost only 12% in adsorption capacity 5 cycles (8.5, 8.0, 8.0, 7.7, and 7.5 mg/g in the 1st, 2nd, 3rd, 4th and 5th cycle, respectively).

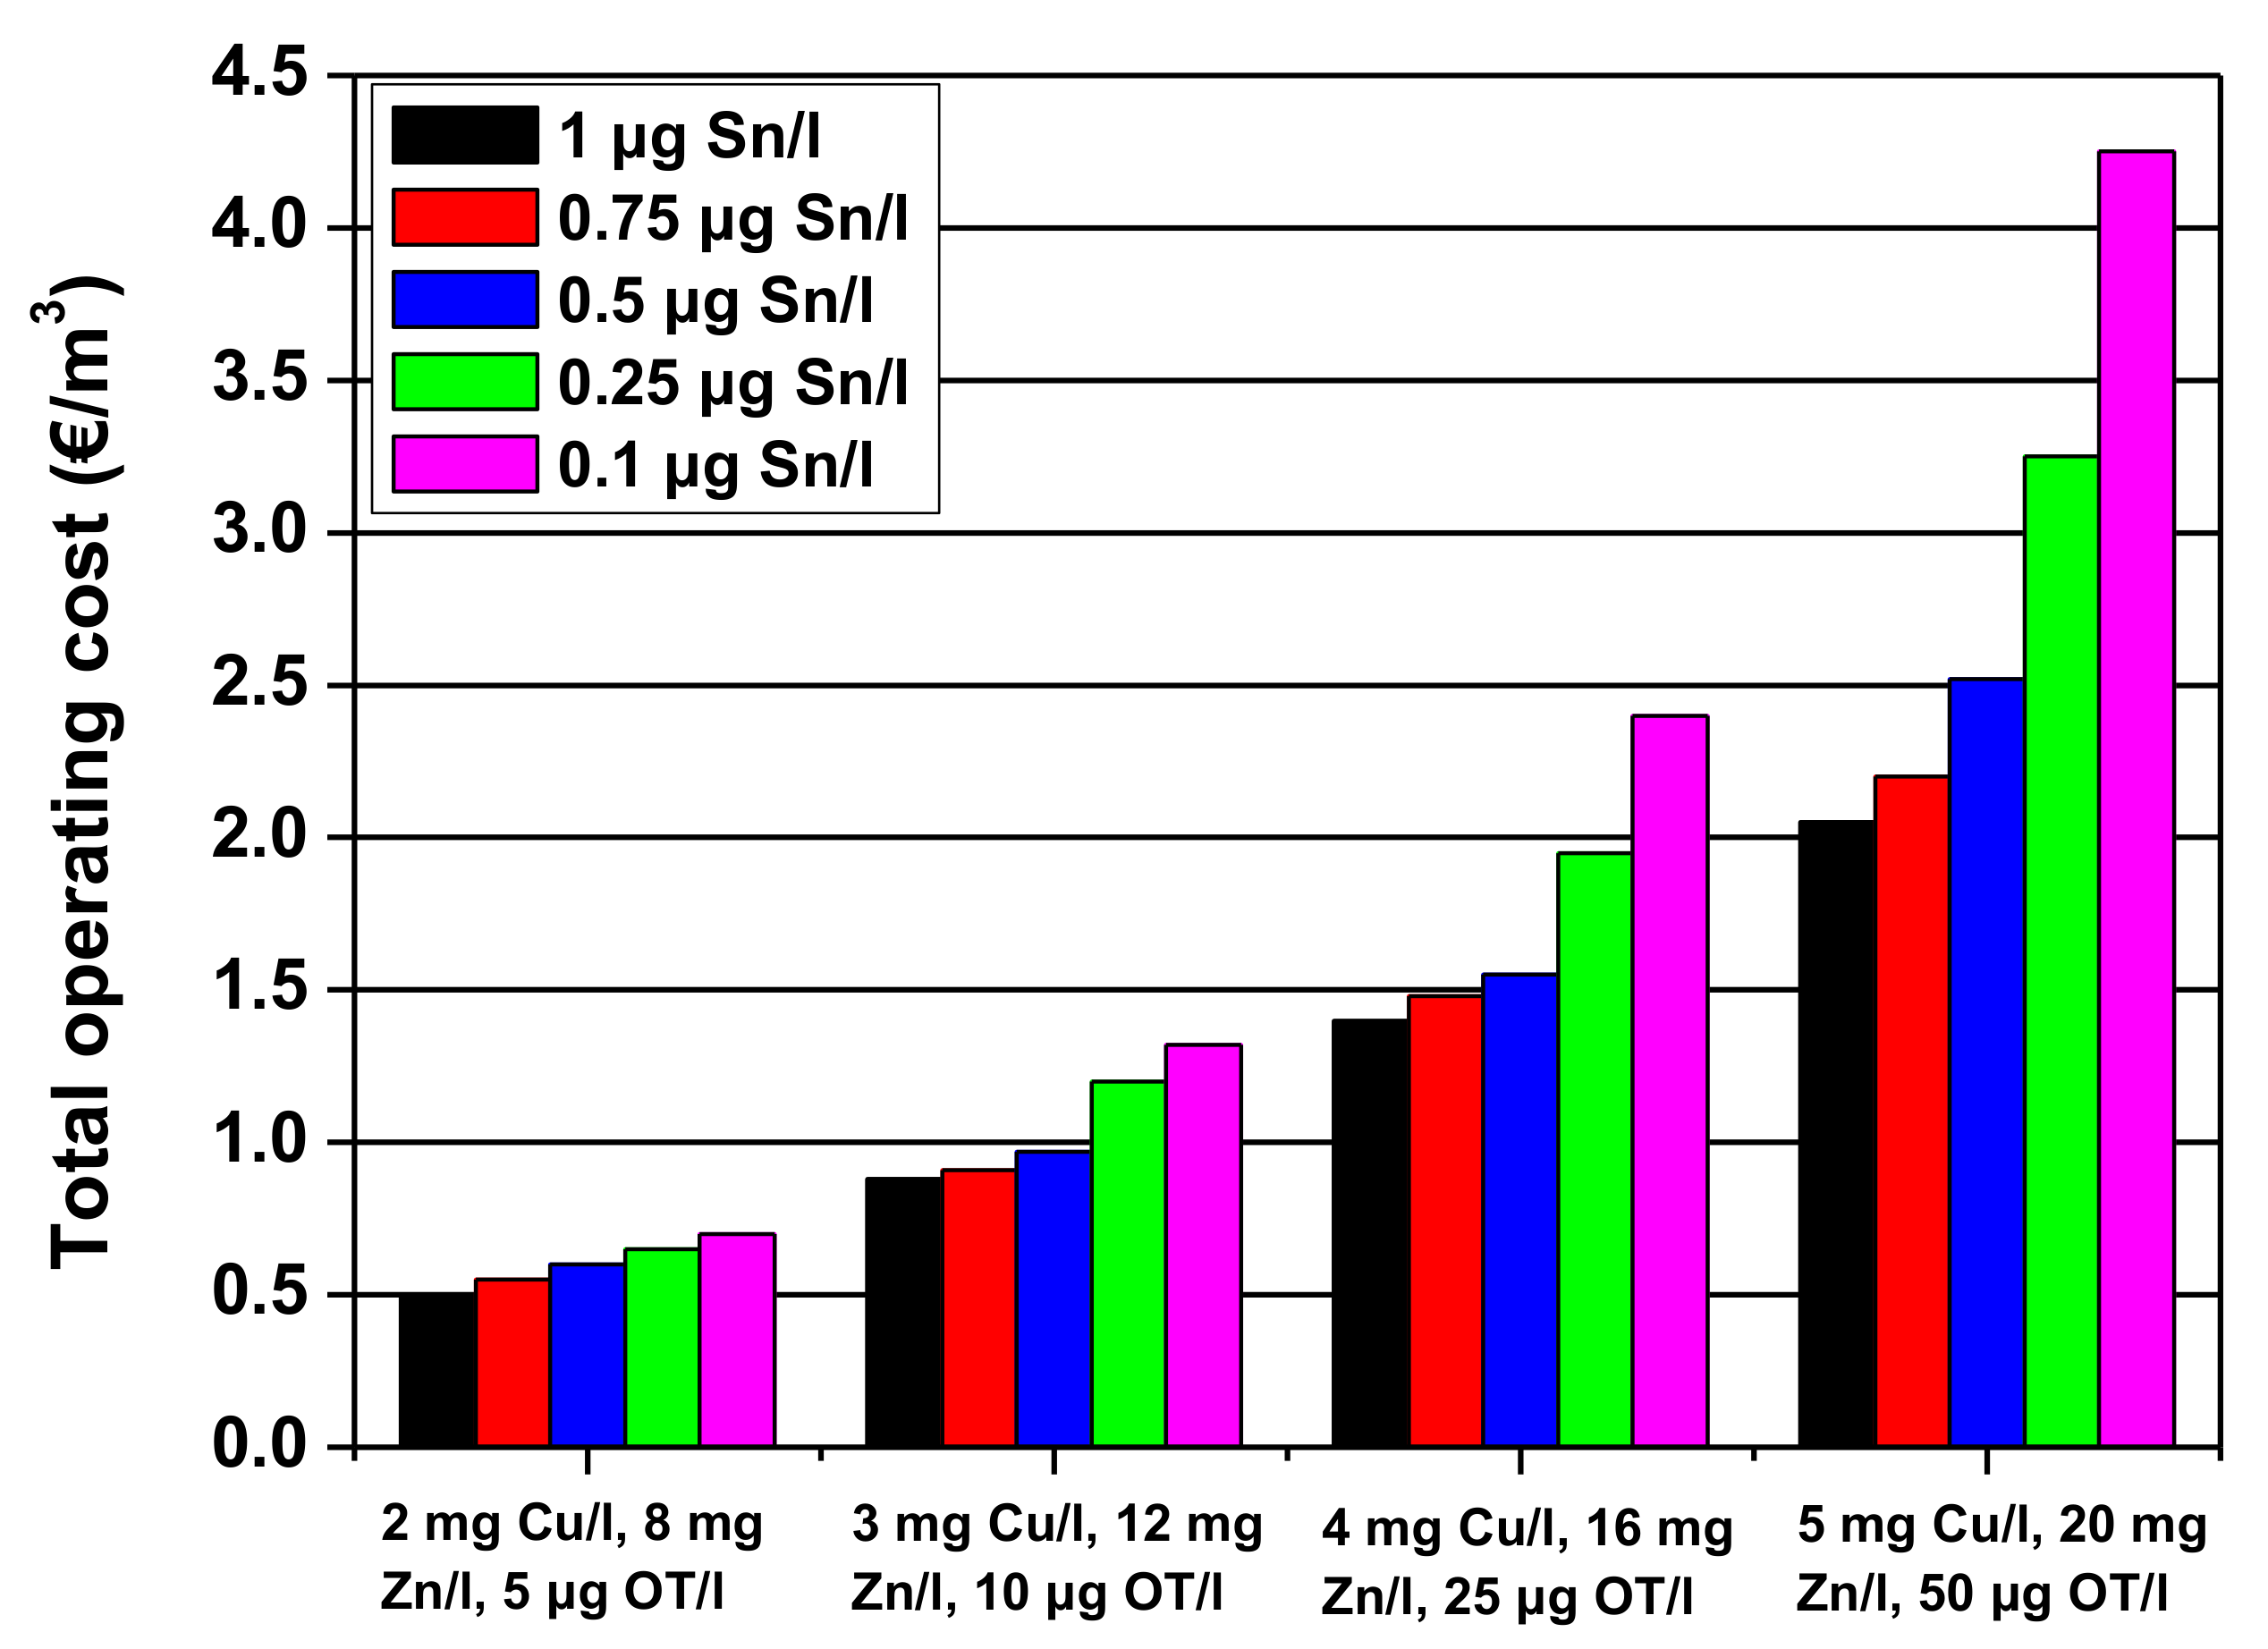
4. Brief Cost Analysis

4.1. Theoretical Approach

The most used adsorbent material is activated carbon; but as it will be discussed in the following it has drawbacks in reuse potential. The world demand for neat activated carbon is forecast to expand 5.2% per year through 2012 to 1.15 million metric tons. The consumption of activated carbons for industrial use has now become an indicator of development and environmental management efficiency. The per capita consumption of activated carbons per year is 0.5 kg in Japan, 0.4 kg in the U.S., 0.2 kg in Europe, and 0.03 kg in the rest of the world [71]. After the adsorbents are exhausted, they are either to be disposed off or regenerated for use. This depends upon the demand, the economics involved, and the kind of pollutant that was adsorbed. In many cases, spent adsorbents are to be treated as hazardous waste and need to be incinerated (which in many countries causes a set of environmental and societal problems) [72]. Exposure of spent adsorbents to ambient air may result in accumulation of heat due to adsorption of moisture and desorption of toxic adsorbates, creating hazardous conditions. Dumping spent adsorbents may also cause odour resulting in nuisance. The other option that industry can use is regeneration. Regeneration costs may equal to stabilization costs or just more than that, but if consumption of virgin adsorbent is reduced then multiple economic, industrial and environmental benefits can be gained. Extensive research has already been conducted regarding adsorption of pollutants onto various activated carbons, but investigations on regeneration remain scarce [73]. In many cases, the adsorbates may be a resource and need to be recovered or concentrated to earn recovery credits. Considering all the above arguments it is evident that spent adsorbent needs to be stabilized after being discarded. Because of high costs of production, stabilizing or proper disposal seem unlikely operations. Regeneration of adsorbents could prove double rewarding by stabilizing adsorbents and recovering valuable adsorbates, thereby minimizing demand for virgin adsorbents.
The main drawback of the already published adsorption studies is that their use is still in the laboratory stage mostly without pilot studies or commercialization. Limited attempts for detailed economic and market analyses are available [74]. Some attempts have been realized in the past at commercializing immobilized biomass dye biosorbents such as alga_SORB, AMT-bioclaim, B.V. Sorbex’s biosorbents and Bio-fix, but none have made a successful commercial entry in the market [75,76,77]. The main concept is not to extensively study the various fixed-bed adsorption papers in literature (and many of the parameters such as flow rate, bed volume, cross-sectional area, length, void fractions, adsorbent’s density, approach velocity, effective contact time, empty bed contact time, operation time, throughput volume, specific throughput, bed volumes), but to analyze and evaluate the first and fundamental principles of the use of green adsorbents.
In the case of the use of some green materials (mainly wastes) as a source for production of activated carbon, there is one serious problem: the regeneration cost. The costs of activated carbon adsorption are relatively high and the high costs limit its use in large-scale applications. The investment costs consist of the costs of equipment (instrumentation), pumps, pipes and monitoring systems). The operational costs depend mainly on the price of the adsorbent. The costs reduce when the adsorbent consumption per unit volume of treated wastewater reduces. In the adsorption process, electricity is mainly used for pumping the water and mixing the adsorbent suspension and for regeneration. In addition, the costs of regeneration and reactivation and the disposal costs of spent adsorbent must be taken into account when the total costs of adsorption are estimated. Spent adsorbent can include toxic substances and has to be treated as hazardous waste. The main conclusion of all above is that if an adsorbent is low cost but difficult to regenerate, it could not be economical and attractive for use [78,79].
As discussed above, the most important parameter determining the cost of the adsorption process to scale it up is the adsorbent and the regeneration cost. Furthermore, in a hypothetical scenario of using a green adsorbent produced from wastes, some other costs need to be taken into consideration. The cost of the adsorbent waste treatment consists of the cost of dewatering, transport and treatment by incineration or landfill and is estimated at 100 €/ton [79]. The adsorbent concentration needed to comply with the imposed discharge limits is influenced by the initial concentration of the pollutants in the water and the pollutant removal ability of the adsorbent. In systems containing only one pollutant and one adsorbent, an adsorption isotherm relates the adsorbents’ capacity to the pollutant concentration in the water at equilibrium conditions. Therefore, the appropriate adsorbent’s dosage has to be determined. For this reason, Kyzas et al. studied the use of spent coffee waste for dyes and heavy metal removal [80,81,82]. It was shown that 5 g/L was the best adsorbent dosage for the full decolorization of dyeing effluents. However, in each case, it is necessary to determine the environmental limits/regulations (discharge to aquatic systems) for each pollutant.
Another crucial factor regarding the operating cost of simulating adsorption procedure is the electricity, which is mainly used for pumping the water and mixing the adsorbent suspension. Vreysen and co-workers made a very useful cost estimation of the electricity required for an adsorption-flocculation system. The main equations used are the following: The suspension is mixed for 15 min at G = 821 s−1. The energy dissipation can be calculated from the formula:
G = P V μ 1 / 2
where G is the average velocity coefficient, V is the water volume, μ is the dynamic viscosity of water (8.9 × 10⁻⁴ Pa s) and P is the power required (Watt).
For the flow rate:
V = Q T
where Q is the flow rate (m3/h) and T is the time (h). Combining Equations (16) and (17) results in:
P = G 2 Q T μ [ W ]
or
P Q = G 2 T μ 1000 [ k W h / m 3 ]
The total operating cost consists of the sum of the adsorbent cost (including sludge treatment) and the electricity cost. Figure 17 shows a total operating cost estimation for 4 polluted wastewaters and 5 different organotin discharge limits as undertaken by Vreysen et al. [79]. The applied discharge limits for Cu and Zn were taken as 0.5 mg/L Cu and 2 mg/L. Zn in all cases.
From all above, it is clear that the most profitable use of green adsorbents is not those derived from activated carbon, but from agricultural waste. The use of those wastes untreated (just washed) seems to be even better. A possible scenario described below in order to compare is the following Table 8:
The parameters hypothetically are the same apart from the maximum theoretical adsorption capacity (Qm) and the estimated cost for the adsorbent production. In that case, 10, 5, and 3.3 kg of agricultural waste (AW), activated carbon (AC), and ACM are required for decontamination. However, in the case of AW the production cost is estimated to be zero. Instead, a factor of 0.5 is added. The production of AC is expected to be at least 4 times larger (electricity for pyrolysis etc.), while the respective for ACM is 6 times larger (pyrolysis, chemical modification etc.). It is clear that the order of profitability using the above adsorbents will be AW > AC > ACM. In another scenario, in which both other parameters vary, the superiority of green adsorbents will be even clearer.
In order to provide a more realistic scenario, for an average industry which treats and discharges 1 MGD (megagallons per day) as effluents (containing either dyes or metals), the approximate quantity of adsorbents can be calculated. In the case of textile industries, dye concentrations of 0.01–0.25 g/dm3 (= 10–250 g of dye per m3 of effluent) have been cited as being present in dye house effluents, depending on the dyes and processes used [83]. Therefore, 37.85–946.25 kg of dye (containing into the dyeing effluent) per day must be removed/adsorbed. Having as its basis the example of Table 9, 378.5–9462.5 kg of AW, 189–4731 kg of AC and 126–3154 kg of ACM are needed for the efficient treatment of effluent. However, as explained in the previous paragraph, the cost for the synthesis of AW in nearly zero. So, in any case this process can be characterized as sufficient. The same example for an average metal plating (chromium) with 2 MGD as effluent rate can be calculated mentioning that chromium concentrations of 0.5–270,000 g per m3 of effluent have been cited [84].

4.2. Application to the Present Nanomaterial

As was mentioned in the previous section, the wastewater treatment and the respective cost requirements are more or less similar for any textile wastewater treatment plants (WWTPs). However, there is big difference for the production of adsorbent material. To make a first attempt at the calculation of cost of the nanomaterial, it is mandatory to divide the cost in 3 major classes: (i) raw material cost (reagent, solvents, etc); (ii) energy cost for the synthesis; (iii) labor cost (personnel) [85]. Raw material cost prices for the study were obtained from publicly released catalogues. It should be noted that chitin and chitosan products can have very wide price ranges, depending on the quality of the final product. For example, chitosan prices might range between USD 10 to USD 1000 per kilogram. The costs calculated in this work are all translated to euros (€). The analysis took into account multiple market prices as provided by vendors all over the world. The raw material cost for each case included the adsorbent cost as well as the metal recovery cost.
The energy cost corresponds to the energy spent for the various stages of the adsorption process. Electricity costs per KWh used are based on the average energy price in Greece for 2019 (0.194 €/KWh). This price was retrieved by the Hellenic Public Power Corporation S.A. [86]. Therefore, the energy cost in Euros has been estimated as the product of the amount of KWh spent and the price of 1 KWh in Greece.
Labor cost consists of the compensation of researchers participating in the project, with the addition of taxes and benefits. For the purposes of this study, the personnel required for the synthesis process comprises 1 researcher working for 1 work-day (i.e., 3 h). The average wages of the personnel were assessed based on information from Glassdoor [86], which maintains a rich database with employee wages per company and country depending on the position.
To calculate the recipe cost, Table 9 was drawn gathering all appropriate information. In this table, the method and duration used during synthesis is presented along with the relative instrumentation (reported energy consumption).
The equation used for calculations of energy cost is:
E c = P D · a · t · C c
where Ec is the energy cost (€), PD is the power consumed by device (kW), a is a load factor (if we use the device in full mode then a = 1, while for half mode a = 0.5, t is the usage of the device (h), Cc is the energy cost (€/KWh).
After the appropriate calculations, the total energy cost for the procedure is 2.53 €. The raw materials cost was estimated form the catalogues of the suppliers. In particular, the cost was (i) 12.93 € for 0.06 mol of 2-hydroxy-1-netaldehyde; (ii) 1.56 € for methanol (60 mL); (iii) 2.19 € for Nd(NO3)3∙6H2O (with a molar ratio of 1:4); and 2.96 € for 1,4-diaminobutane (0.03 mol). So, in total for the raw costs was 19.64 €. But the latter cost was for 7.5 g of the prepared material. Therefore, the cost for the raw materials was 2.62 €/g. Similarly, the energy cost calculated in Equation (18) was 2.53 € for 7.5 g. But it is doubtful if it is correct to split this value for 7.5 g. So, it is decided to keep the whole energy cost as 2.53 €. Therefore, the total cost of production was 5.15 €/g.

5. Conclusions

The adsorptive removal of AB92 on neodymium oxide (Nd2O3) nanoparticles have been studied. The adsorption process was enhanced, modeled and optimized using CCD based on RSM. The influence of varying the pH (3–9), dosage (0.1–1 g/L), initial concentration of AB92 (100–300 mg/L) and contact time (10–100 min) on the adsorption process was examined. The adsorption process was found to fit best into the Langmuir isotherm and pseudo-second-order kinetic models. Also, the process was found to be spontaneous and favorable with increased temperature. Optimal conditions of pH 3.15, AB92 concentration of 138.5 mg/L, Nd2O3 nanoparticles dosage of 0.83 g/L, and contact time of 49.55 min were obtained which gave 90.70% AB92 removal. The values of the coefficient of determination, R2 (0.9596) and the adjusted R2 (0.9220) indicated that the process can be described by the RSM. The generated model was also found to be significant for AB92 adsorption at 95% confidence level. The prepared Nd2O3 nanoparticles have been applied successfully for the adsorptive removal of AB92 from its aqueous solution, modeled and optimized.

Author Contributions

Data curation, S.A., L.M., S.R., R.D., C.A.I., A.R. and G.Z.K.; Methodology, S.A., L.M., S.R., R.D., C.A.I., A.R. and G.Z.K; Supervision, A.R. and G.Z.K.; Writing – original draft, S.A., L.M., S.R., R.D., C.A.I., A.R. and G.Z.K.; Writing – review & editing, S.A., L.M., S.R., R.D., C.A.I., A.R. and G.Z.K. All authors have read and agreed to the published version of the manuscript.

Funding

This work was supported by the Zabol University of Medical Sciences, Iran (Grant No. IR.ZBMU REC-1397-027). A. Rahdar would like to thank the University of Zabol for financial support (UOZ-GR-9618-40) for this work.

Acknowledgments

The authors thank the Research Assistance of Zabol University of Medical Sciences.

Conflicts of Interest

The authors declare no conflict of interest.

References

  1. Hu, T.L. Decolourization of reactive azo dyes by transformation with Pseudomonas luteola. Bioresour. Technol. 1994, 49, 47–51. [Google Scholar] [CrossRef]
  2. Rahman, F. The treatment of industrial effluents for the discharge of textile dyes using by techniques and adsorbents. J. Text. Sci. Eng. 2016, 6, 1000242. [Google Scholar]
  3. Igwegbe, C.A.; Banach, A.M.; Ahmadi, S. Adsorption of Reactive Blue 19 from aqueous environment on magnesium oxide nanoparticles: Kinetic, isotherm and thermodynamic studies. Pharm. Chem. J. 2018, 5, 111–121. [Google Scholar]
  4. Jung, K.-W.; Choi, B.H.; Ahn, K.-H.; Lee, S.-H. Synthesis of a novel magnetic Fe3O4/γ-Al2O3 hybrid composite using electrode-alternation technique for the removal of an azo dye. Appl. Surf. Sci. 2017, 423, 383–393. [Google Scholar] [CrossRef]
  5. Ertugay, N.; Acar, F.N. Removal of COD and color from Direct Blue 71 azo dye wastewater by Fenton’s oxidation: Kinetic study. Arab. J. Chem. 2017, 10, S1158–S1163. [Google Scholar] [CrossRef] [Green Version]
  6. Sohrabi, M.R.; Khavaran, A.; Shariati, S.; Shariati, S. Removal of Carmoisine edible dye by Fenton and photo Fenton processes using Taguchi orthogonal array design. Arab. J. Chem. 2017, 10, S3523–S3531. [Google Scholar] [CrossRef] [Green Version]
  7. Cui, D.; Guo, Y.-Q.; Cheng, H.-Y.; Liang, B.; Kong, F.-Y.; Lee, H.-S.; Wang, A.-J. Azo dye removal in a membrane-free up-flow biocatalyzed electrolysis reactor coupled with an aerobic bio-contact oxidation reactor. J. Hazard. Mater. 2012, 239–240, 257–264. [Google Scholar] [CrossRef]
  8. Uzoh, C.F.; Onukwuli, O.D.; Nwabanne, J.T. Characterization, kinetics and statistical screening analysis of gmelina seed oil extraction process. Mater. Renew. Sustain. Energy 2014, 3, 38. [Google Scholar] [CrossRef] [Green Version]
  9. Hassan, S.S.M.; Kamel, A.H.; Hassan, A.A.; Amr, A.E.G.E.; El-Naby, H.A.; Elsayed, E.A. A sno2/ceo2 nano-composite catalyst for alizarin dye removal from aqueous solutions. Nanomaterials 2020, 10, 254. [Google Scholar] [CrossRef] [Green Version]
  10. Qin, Q.; Sun, T.; Wang, H.; Brault, P.; An, H.; Xie, L.; Peng, Q. Adsorption and diffusion of hydrogen in carbon honeycomb. Nanomaterials 2020, 10, 344. [Google Scholar] [CrossRef] [Green Version]
  11. Li, G.; Wang, Y.; Bi, J.; Huang, X.; Mao, Y.; Luo, L.; Hao, H. Partial oxidation strategy to synthesize WS2/WO3 heterostructure with enhanced adsorption performance for organic dyes: Synthesis, modelling, and mechanism. Nanomaterials 2020, 10, 278. [Google Scholar] [CrossRef] [PubMed] [Green Version]
  12. Li, J.; Zhao, H.; Ma, C.; Han, Q.; Li, M.; Liu, H. Preparation of Fe3O4@polyoxometalates nanocomposites and their efficient adsorption of cationic dyes from aqueous solution. Nanomaterials 2019, 9, 649. [Google Scholar] [CrossRef] [PubMed] [Green Version]
  13. Li, S.; Zhang, H.; Hu, S.; Liu, J.; Zhu, Q.; Zhang, S. Synthesis of hierarchical porous carbon in molten salt and its application for dye adsorption. Nanomaterials 2019, 9, 1098. [Google Scholar] [CrossRef] [PubMed] [Green Version]
  14. Parisi, F.; Lazzara, G.; Merli, M.; Milioto, S.; Princivalle, F.; Sciascia, L. Simultaneous removal and recovery of metal ions and dyes from wastewater through montmorillonite clay mineral. Nanomaterials 2019, 9, 1699. [Google Scholar] [CrossRef] [Green Version]
  15. Rupa, E.J.; Kaliraj, L.; Abid, S.; Yang, D.C.; Jung, S.K. Synthesis of a zinc oxide nanoflower photocatalyst from sea buckthorn fruit for degradation of industrial dyes in wastewater treatment. Nanomaterials 2019, 9, 1692. [Google Scholar] [CrossRef] [Green Version]
  16. Sabeela, N.I.; Almutairi, T.M.; Al-Lohedan, H.A.; Ezzat, A.O.; Atta, A.M. Reactive mesoporous ph-sensitive amino-functionalized silica nanoparticles for efficient removal of coomassie blue dye. Nanomaterials 2019, 9, 1721. [Google Scholar] [CrossRef] [Green Version]
  17. Wang, C.; Yin, J.; Wang, R.; Jiao, T.; Huang, H.; Zhou, J.; Zhang, L.; Peng, Q. Facile preparation of self-assembled polydopamine-modified electrospun fibers for highly effective removal of organic dyes. Nanomaterials 2019, 9, 116. [Google Scholar] [CrossRef] [Green Version]
  18. Zhan, S.; Li, C.; Tian, H.; Ma, C.; Liu, H.; Luo, J.; Li, M. Synthesis, characterization and dye removal behavior of core–shell–shell Fe3O4/Ag/polyoxometalates ternary nanocomposites. Nanomaterials 2019, 9, 1255. [Google Scholar] [CrossRef] [Green Version]
  19. Shu, H.-Y.; Huang, C.-R.; Chang, M.-C. Decolorization of mono-azo dyes in wastewater by advanced oxidation process: A case study of acid red 1 and acid yellow 23. Chemosphere 1994, 29, 2597–2607. [Google Scholar] [CrossRef]
  20. Elisangela, F.; Andrea, Z.; Fabio, D.G.; de Menezes Cristiano, R.; Regina, D.L.; Artur, C.-P. Biodegradation of textile azo dyes by a facultative Staphylococcus arlettae strain VN-11 using a sequential microaerophilic/aerobic process. Int. Biodeterior. Biodegrad. 2009, 63, 280–288. [Google Scholar] [CrossRef] [Green Version]
  21. Rahdar, S.; Shikh, L.; Ahmadi, S. Removal of Reactive Blue 19 Dye Using a Combined Sonochemical and Modified Pistachio Shell Adsorption Processes from Aqueous Solutions. Iran. J. Health Sci. 2018, 6, 8–20. [Google Scholar] [CrossRef]
  22. Obiora-Okafo, I.A.; Onukwuli, O.D. Characterization and optimization of spectrophotometric colour removal from dye containing wastewater by Coagulation-Flocculation. Pol. J. Chem. Technol. 2018, 20, 49–59. [Google Scholar] [CrossRef] [Green Version]
  23. Obiora-Okafo, I.A.; Onukwuli, O.D. Optimization of coagulation-flocculation process for colour removal from azo dye using natural polymers: Response surface methodological approach. Niger. J. Technol. 2017, 36, 482–495. [Google Scholar] [CrossRef] [Green Version]
  24. Homaeigohar, S. The Nanosized Dye Adsorbents for Water Treatment. Nanomaterials 2020, 10, 295. [Google Scholar] [CrossRef] [Green Version]
  25. Homaeigohar, S.; Botcha, N.K.; Zarie, E.S.; Elbahri, M. Ups and Downs of Water Photodecolorization by Nanocomposite Polymer Nanofibers. Nanomaterials 2019, 9, 250. [Google Scholar] [CrossRef] [Green Version]
  26. Homaeigohar, S.; Elbahri, M. An Amphiphilic, Graphitic Buckypaper Capturing Enzyme Biomolecules from Water. Water 2018, 11, 2. [Google Scholar] [CrossRef] [Green Version]
  27. Homaeigohar, S.; Strunskus, T.; Strobel, J.; Kienle, L.; Elbahri, M. A Flexible Oxygenated Carbographite Nanofilamentous Buckypaper as an Amphiphilic Membrane. Adv. Mater. Interfaces 2018, 5, 1800001. [Google Scholar] [CrossRef]
  28. Ahmadi, S.; Igwegbe, C.A. Adsorptive removal of phenol and aniline by modified bentonite: Adsorption isotherm and kinetics study. Appl. Water Sci. 2018, 8, 170. [Google Scholar] [CrossRef] [Green Version]
  29. Zafar, M.N.; Dar, Q.; Nawaz, F.; Zafar, M.N.; Iqbal, M.; Nazar, M.F. Effective adsorptive removal of azo dyes over spherical ZnO nanoparticles. J. Mater. Res. Technol. 2019, 8, 713–725. [Google Scholar] [CrossRef]
  30. Guo, R.; Wang, R.; Yin, J.; Jiao, T.; Huang, H.; Zhao, X.; Zhang, L.; Li, Q.; Zhou, J.; Peng, Q. Fabrication and highly efficient dye removal characterization of beta-cyclodextrin-based composite polymer fibers by electrospinning. Nanomaterials 2019, 9, 127. [Google Scholar] [CrossRef] [Green Version]
  31. Liu, Y.; Huang, Y.; Xiao, A.; Qiu, H.; Liu, L. Preparation of magnetic Fe3O4/MIL-88A nanocomposite and its adsorption properties for bromophenol blue dye in aqueous solution. Nanomaterials 2019, 9, 51. [Google Scholar] [CrossRef] [PubMed] [Green Version]
  32. Shi, X.; Zhang, S.; Chen, X.; Mijowska, E. Evaluation of nanoporous carbon synthesized from direct carbonization of a metal-organic complex as a highly effective dye adsorbent and supercapacitor. Nanomaterials 2019, 9, 601. [Google Scholar] [CrossRef] [PubMed] [Green Version]
  33. Yu, Y.; Yu, L.; Sun, M.; Paul Chen, J. Facile synthesis of highly active hydrated yttrium oxide towards arsenate adsorption. J. Colloid Interface Sci. 2016, 474, 216–222. [Google Scholar] [CrossRef] [PubMed]
  34. Miao, Q.; Xiong, G.; Sheng, S.; Cui, W.; Xu, L.; Guo, X. Partial oxidation of methane to syngas over nickel-based catalysts modified by alkali metal oxide and rare earth metal oxide. Appl. Catal. A Gen. 1997, 154, 17–27. [Google Scholar] [CrossRef]
  35. Zhang, J.; Zhao, B.; Schreiner, B. Separation Hydrometallurgy of Rare Earth Elements; Springer: Cham, Switzerland, 2016. [Google Scholar]
  36. Zinatloo-Ajabshir, S.; Mortazavi-Derazkola, S.; Salavati-Niasari, M. Schiff-base hydrothermal synthesis and characterization of Nd2O3 nanostructures for effective photocatalytic degradation of eriochrome black T dye as water contaminant. J. Mater. Sci. Mater. Electron. 2017, 28, 17849–17859. [Google Scholar] [CrossRef]
  37. Sime, M.; Das, A.; Galt, G.; Hope, G.; Young, C. Studies on the nature of salicyl hydroxamate adsorption at the surface of neodymium oxide. J. Dispers. Sci. Technol. 2019, 40, 1488–1498. [Google Scholar] [CrossRef]
  38. Ahmad, Z.U.; Yao, L.; Wang, J.; Gang, D.D.; Islam, F.; Lian, Q.; Zappi, M.E. Neodymium embedded ordered mesoporous carbon (OMC) for enhanced adsorption of sunset yellow: Characterizations, adsorption study and adsorption mechanism. Chem. Eng. J. 2019, 359, 814–826. [Google Scholar] [CrossRef]
  39. Hafshejani, M.K.; Ogugbue, C.J.; Morad, N. Application of response surface methodology for optimization of decolorization and mineralization of triazo dye Direct Blue 71 by Pseudomonas aeruginosa. 3 Biotech 2014, 4, 605–619. [Google Scholar] [CrossRef] [Green Version]
  40. Beyki, M.H.; Alijani, H.; Fazli, Y. Optimization using response surface methodology for fast removal of hazardous azo dye by γ-Fe2O3@ CuO nanohybrid synthesized by sol-gel combustion. Res. Chem. Intermed. 2017, 43, 6245–6257. [Google Scholar] [CrossRef]
  41. Goodman, S.M.; Bura, R.; Dichiara, A.B. Facile Impregnation of Graphene into Porous Wood Filters for the Dynamic Removal and Recovery of Dyes from Aqueous Solutions. ACS Appl. Nano Mater. 2018, 1, 5682–5690. [Google Scholar] [CrossRef]
  42. Mortazavi-Derazkola, S.; Zinatloo-Ajabshir, S.; Salavati-Niasari, M. Preparation and characterization of Nd2O3 nanostructures via a new facile solvent-less route. J. Mater. Sci. Mater. Electron. 2015, 26, 5658–5667. [Google Scholar] [CrossRef]
  43. Azami, M.; Bahram, M.; Nouri, S. Central composite design for the optimization of removal of the azo dye, Methyl red, from waste water using Fenton reaction. Curr. Chem. Lett. 2013, 2, 57–68. [Google Scholar] [CrossRef]
  44. Vaez, M.; Zarringhalam Moghaddam, A.; Alijani, S. Optimization and Modeling of Photocatalytic Degradation of Azo Dye Using a Response Surface Methodology (RSM) Based on the Central Composite Design with Immobilized Titania Nanoparticles. Ind. Eng. Chem. Res. 2012, 51, 4199–4207. [Google Scholar] [CrossRef]
  45. Liang, S.; Guo, X.; Feng, N.; Tian, Q. Isotherms, kinetics and thermodynamic studies of adsorption of Cu2+ from aqueous solutions by Mg2+/K+ type orange peel adsorbents. J. Hazard. Mater. 2010, 174, 756–762. [Google Scholar] [CrossRef]
  46. Asaithambi, P.; Beyene, D.; Aziz, A.R.A.; Alemayehu, E. Removal of pollutants with determination of power consumption from landfill leachate wastewater using an electrocoagulation process: Optimization using response surface methodology (RSM). Appl. Water Sci. 2018, 8, 69. [Google Scholar] [CrossRef] [Green Version]
  47. Ponnusamy, S.K.; Subramaniam, R. Process optimization studies of Congo red dye adsorption onto cashew nut shell using response surface methodology. Int. J. Ind. Chem. 2013, 4, 17. [Google Scholar] [CrossRef] [Green Version]
  48. Ahmadi, S.; Mohammadi, L.; Igwegbe, C.A.; Rahdar, S.; Banach, A.M. Application of response surface methodology in the degradation of Reactive Blue 19 using H2O2/MgO nanoparticles advanced oxidation process. Int. J. Ind. Chem. 2018, 9, 241–253. [Google Scholar] [CrossRef] [Green Version]
  49. Tetteh, E.; Rathilal, S.; Chollom, M. Treatment of industrial mineral oil wastewater-optimisation of coagulation flotation process using response surface methodology (RSM). Int. J. Appl. Eng. Res. 2017, 12, 13084–13091. [Google Scholar]
  50. Kyzas, G.Z.; Deliyanni, E.A.; Bikiaris, D.N.; Mitropoulos, A.C. Graphene composites as dye adsorbents: Review. Chem. Eng. Res. Des. 2018, 129, 75–88. [Google Scholar] [CrossRef]
  51. Anastopoulos, I.; Karamesouti, M.; Mitropoulos, A.C.; Kyzas, G.Z. A review for coffee adsorbents. J. Mol. Liq. 2017, 229, 555–565. [Google Scholar] [CrossRef]
  52. Deliyanni, E.A.; Kyzas, G.Z.; Triantafyllidis, K.S.; Matis, K.A. Activated carbons for the removal of heavy metal ions: A systematic review of recent literature focused on lead and arsenic ions. Open Chem. 2015, 13, 699–708. [Google Scholar] [CrossRef]
  53. Ahmadi, S.; Mostafapour, F.K. Adsorptive removal of aniline from aqueous solutions by Pistacia atlantica (Baneh) shells: Isotherm and kinetic studies. J. Sci. Technol. Environ. Inform. 2017, 5, 327–335. [Google Scholar] [CrossRef] [Green Version]
  54. Rahdar, S. Removal of phenol and aniline from aqueous solutions by using adsorption on to pistacia terebinthus: Study of adsorption isotherm and kinetics. J. Health Res. Community Winter 2017, 2, 35–45. [Google Scholar]
  55. Anastopoulos, I.; Kyzas, G.Z. Composts as biosorbents for decontamination of various pollutants: A review. Water Air Soil Pollut. 2015, 226, 61. [Google Scholar] [CrossRef]
  56. Godini, H.; Dargahi, A.; Mohammadi, M.; Hosseini Ahagh, M.; Mohammadi, S.; Jalilian, Z. Application of Response Surface Methodology for Optimization of Ammonia Nitrogen Removal from Aqueous Solutions Using Powdered Activated Carbon. Res. J. Environ. Sci. 2017, 11, 36–47. [Google Scholar]
  57. Roy, A.; Chakraborty, S.; Kundu, S.P.; Adhikari, B.; Majumder, S.B. Adsorption of Anionic-Azo Dye from Aqueous Solution by Lignocellulose-Biomass Jute Fiber: Equilibrium, Kinetics, and Thermodynamics Study. Ind. Eng. Chem. Res. 2012, 51, 12095–12106. [Google Scholar] [CrossRef]
  58. Langmuir, I. The adsorption of gases on plane surface of glass, mica and platinum. J. Am. Chem. Soc. 1916, 40, 1361–1368. [Google Scholar] [CrossRef] [Green Version]
  59. Freundlich, H. Over the adsorption in solution. Z. Phys. Chem. 1906, 57, 385–470. [Google Scholar]
  60. LeVan, M.D.; Vermeulen, T. Binary Langmuir and Freundlich isotherms for ideal adsorbed solutions. J. Phys. Chem. 1981, 85, 3247–3250. [Google Scholar] [CrossRef]
  61. Sheindorf, C.; Rebhun, M.; Sheintuch, M. A Freundlich-type multicomponent isotherm. J. Colloid Interface Sci. 1981, 79, 136–142. [Google Scholar] [CrossRef]
  62. Malik, P.K. Use of activated carbons prepared from sawdust and rice-husk for adsorption of acid dyes: A case study of Acid Yellow 36. Dye. Pigm. 2003, 56, 239–249. [Google Scholar] [CrossRef]
  63. Lagergren, S. About the theory of so-called adsorption of soluble substances. Handlingar 1898, 24, 1–39. [Google Scholar]
  64. Ho, Y.-S. Second-order kinetic model for the sorption of cadmium onto tree fern: A comparison of linear and non-linear methods. Water Res. 2006, 40, 119–125. [Google Scholar] [CrossRef] [PubMed]
  65. Ho, Y.S.; Wang, C.C. Pseudo-isotherms for the sorption of cadmium ion onto tree fern. Process Biochem. 2004, 39, 761–765. [Google Scholar] [CrossRef]
  66. Igwegbe, C.; Onukwuli, O.; Nwabanne, J. Adsorptive Removal of Vat Yellow 4 on Activated Mucuna pruriens (Velvet Bean) Seed Shells Carbon. Asian J. Chem. Sci. 2017, 1, 1–16. [Google Scholar] [CrossRef]
  67. Bhattacharyya, K.G.; Sharma, A. Kinetics and thermodynamics of Methylene Blue adsorption on Neem (Azadirachta indica) leaf powder. Dye. Pigm. 2005, 65, 51–59. [Google Scholar] [CrossRef]
  68. Giles, C.H.; McIver, N. Adsorption of dyes and the gibbs equation. An investigation by the monolayer technique. J. Colloid Interface Sci. 1977, 62, 329–335. [Google Scholar] [CrossRef]
  69. Ooi, J.; Lee, L.Y.; Hiew, B.Y.Z.; Thangalazhy-Gopakumar, S.; Lim, S.S.; Gan, S. Assessment of fish scales waste as a low cost and eco-friendly adsorbent for removal of an azo dye: Equilibrium, kinetic and thermodynamic studies. Bioresour. Technol. 2017, 245, 656–664. [Google Scholar] [CrossRef]
  70. Bansal, R.C.; Goyal, M. Activated Carbon Adsorption; CRC Press, Taylor & Francis: Boca Raton, FL, USA, 2005. [Google Scholar]
  71. Miyake, Y. Adsorption of PCE from soil vapors extraction on activated carbon fiber. J. Resour. Envrion. 1997, 33, 395–401. [Google Scholar]
  72. Mohan, D.; Pittman, C.U., Jr. Arsenic removal from water/wastewater using adsorbents—A critical review. J. Hazard. Mater. 2007, 142, 1–53. [Google Scholar] [CrossRef]
  73. Srinivasan, A.; Viraraghavan, T. Decolorization of dye wastewaters by biosorbents: A review. J. Environ. Manag. 2010, 91, 1915–1929. [Google Scholar] [CrossRef] [PubMed]
  74. Tsezos, M. Biosorption of metals. The experience accumulated and the outlook for technology development. Hydrometallurgy 2001, 59, 241–243. [Google Scholar] [CrossRef]
  75. Garnham, G.W. The Use of Algae as Metal Biosorbents. In Biosorbents for metal ions; Wase, J., Forster, C., Eds.; CRC Press: London, UK, 1997; pp. 11–37. [Google Scholar]
  76. Wang, J.; Chen, C. Biosorbents for heavy metals removal and their future. Biotechnol. Adv. 2009, 27, 195–226. [Google Scholar] [CrossRef] [PubMed]
  77. Di Natale, F.; Erto, A.; Lancia, A.; Musmarra, D. Mercury adsorption on granular activated carbon in aqueous solutions containing nitrates and chlorides. J. Hazard. Mater. 2011, 192, 1842–1850. [Google Scholar] [CrossRef]
  78. Vreysen, S.; Maes, A.; Wullaert, H. Removal of organotin compounds, Cu and Zn from shipyard wastewaters by adsorption–flocculation: A technical and economical analysis. Mar. Pollut. Bull. 2008, 56, 106–115. [Google Scholar] [CrossRef]
  79. Kyzas, G.Z. A decolorization technique with spent "Greek coffee" grounds as zero-cost adsorbents for industrial textile wastewaters. Materials 2012, 5, 2069–2087. [Google Scholar] [CrossRef]
  80. Kyzas, G.Z. Commercial coffee wastes as materials for adsorption of heavy metals from aqueous solutions. Materials 2012, 5, 1826–1840. [Google Scholar] [CrossRef]
  81. Kyzas, G.Z.; Lazaridis, N.K.; Mitropoulos, A.C. Removal of dyes from aqueous solutions with untreated coffee residues as potential low-cost adsorbents: Equilibrium, reuse and thermodynamic approach. Chem. Eng. J. 2012, 189–190, 148–159. [Google Scholar] [CrossRef]
  82. O’Neill, C.; Hawkes, F.R.; Hawkes, D.L.; Lourenco, N.D.; Pinheiro, H.M.; Delee, W. Colour in textile effluents—Sources, measurement, discharge consents and simulation: A review. J. Chem. Technol. Biotechnol. 1999, 74, 1009–1018. [Google Scholar] [CrossRef]
  83. Patterson, J.W. Industrial Wastewater Treatment Technology, 2nd ed.; Butterworth-Heinemann: London, UK, 1985. [Google Scholar]
  84. Gkika, A.D.; Liakos, V.E.; Vordos, N.; Kontogoulidou, C.; Magafas, L.; Bikiaris, N.D.; Bandekas, V.D.; Mitropoulos, C.A.; Kyzas, Z.G. Cost Estimation of Polymeric Adsorbents. Polymers 2019, 11, 925. [Google Scholar] [CrossRef] [PubMed] [Green Version]
  85. Public Power Corporation S.A.-Hellas. Available online: https://www.dei.gr/en (accessed on 1 January 2020).
  86. Glassdoor S.A. Available online: https://www.glassdoor.co.uk/ (accessed on 1 January 2020).
Figure 1. Structure of Acid Blue 92 (AB92).
Nanomaterials 10 00556 g001
Figure 2. Field-emission scanning electron microscope (FE-SEM) image of the Nd2O3 nanoparticles.
Nanomaterials 10 00556 g002
Figure 3. Fourier-transform infrared spectroscopy (FTIR) spectra of the Nd2O3 nanoparticles before adsorption (up) and after adsorption (down).
Nanomaterials 10 00556 g003
Figure 4. Proposed adsorption mechanism of AB92 and Nd2O3 nanoparticles.
Nanomaterials 10 00556 g004
Figure 5. X-ray diffraction (XRD) pattern of the Nd2O3 nanoparticles.
Nanomaterials 10 00556 g005
Figure 6. Predicted values versus experimental (actual) values of AB92 adsorption.
Nanomaterials 10 00556 g006
Figure 7. 3D surface plot of the interactive effect of (a) AB92 concentration initial and pH, (b) Nd2O3 dosage and pH, (c) time and pH, (d) Nd2O3 nanoparticles dosage and concentration, (e) time and concentration, and (f) time and Nd2O3 dosage on AB92 adsorption percentage.
Nanomaterials 10 00556 g007
Figure 8. The desirability effect for AB92 adsorption on Nd2O3 nanoparticles.
Nanomaterials 10 00556 g008
Figure 9. Adsorption capacity at various initial AB92 concentrations.
Nanomaterials 10 00556 g009
Figure 10. Linear Langmuir isotherm of AB92 adsorption onto Nd2O3 nanoparticles.
Nanomaterials 10 00556 g010
Figure 11. Linear Freundlich isotherm of AB92 adsorption onto Nd2O3 nanoparticles.
Nanomaterials 10 00556 g011
Figure 12. Adsorption kinetics of AB92 onto Nd2O3 nanoparticles.
Nanomaterials 10 00556 g012
Figure 13. Pseudo-first order kinetic (Lagergren) model for AB92 adsorption onto Nd2O3 nanoparticles at 298 K.
Nanomaterials 10 00556 g013
Figure 14. Pseudo-second order kinetic (Ho) model for AB92 adsorption onto Nd2O3 nanoparticles at 298 K.
Nanomaterials 10 00556 g014
Figure 15. Free energy change versus temperature.
Nanomaterials 10 00556 g015
Figure 16. Cycles of reuse (adsorption-desorption) for the system Nd2O3/AB92.
Nanomaterials 10 00556 g016
Figure 17. Total operating costs for 4 different wastewaters for 5 different organotin discharge limits. Reprinted with permission; Copyright Elsevier, 2008 [79].
Nanomaterials 10 00556 g017
Table 1. Experimental range and levels of the independent process parameters tested.
FactorIndependent VariablesUnitRange and Level of Actual and Coded Values
−10+1
A (x1)Initial pH 369
B (x2)Initial concentrationmg/L100200300
C (x3)Nd2O3 dosageg/L0.10.551
D (x4)Timemin1055100
Table 2. Experimental design matrix for AB92 adsorption on Nd2O3 nanoparticles.
RunInitial pH
(-)
C0
(mg/L)
Nd2O3 Dosage
(g/L)
Time (min)Experimental
Adsorption (%)
Predicted Adsorption (%)
(A)(B)(C)(D)
162000.555588.7888.73
293000.110086.8586.74
362000.555588.7888.73
4930011087.6887.72
532000.555590.1888.73
631000.110089.9089.85
79100110088.7688.82
891000.110088.5688.45
933000.11088.4088.32
1033000.110088.2588.13
1193000.11087.0386.90
1262000.555588.7888.73
13620015589.0888.47
1462000.5510087.6387.76
15310011090.5190.62
1692000.555588.5888.74
1762000.555588.7888.73
189300110087.4187.46
19910011089.1589.25
2062000.555588.7888.73
2191000.11088.8588.79
223100110090.0590.16
2362000.551088.1088.07
2431000.11090.2890.18
2561000.555590.2890.22
2662000.15587.2087.91
27330011088.9989.08
2862000.555588.7888.73
2963000.555588.3588.56
303300110088.7588.80
Table 3. Statistical models for AB92 adsorption.
Sequential Model Sum of Squares
SourceSum of SquaresdfMean SquareF ValueP ValueProb > F
Mean vs. Total236,1191236119
Linear vs. Mean22.363445.590928.0665< 0.0001
2FI vs. Linear0.172460.02870.11350.9937
Quadratic vs. 2FI3.703840.925912.58220.0001Suggested
Cubic vs. Quadratic1.066580.133324.94160.0002Aliased
Residual0.037470.0053
Total236,146.4307871.546
Model Summary Statistics
SourceStd. Dev.R2Adjusted R2Predicted R2PRESS
Linear0.44630.81790.78870.77436.1716
2FI0.50300.82420.73160.76126.5289
Quadratic0.27130.95960.92200.82774.7118Suggested
Cubic0.07310.99860.99430.83744.4467Aliased
Table 4. Analysis of variance (ANOVA), lack of fit (LOF) test, regression coefficients and the significance of the response surface quadratic model of adsorption of the dye solution.
SourceSum of SquaresdfMean SquareF Valuep-value
Prob > F
Model26.2396141.874325.4683<0.0001significant
A-initial pH8.601518.6015116.8807<0.0001
B-AB92 concentration11.9066111.9066161.7921<0.0001
C-Nd2O3 dosage1.413711.413719.21030.0005
D-Time0.441710.44176.00180.0270
AB3.26E-0513.26E-050.00040.9835
AC0.003310.00330.04430.8362
AD0.000810.00080.01110.9176
BC0.128610.12861.74760.2060
BD0.031310.03130.42540.5241
CD0.008310.00830.11330.7410
A21.255411.255417.05880.0009
B21.052411.052414.30020.0018
C20.759210.759210.31570.0058
D21.727211.727223.46950.0002
Residual1.1039150.0736
Lack of Fit1.1039100.1104
Pure Error050
Cor. Total27.343529
R2: 0.9597, Adj. R2: 0.9220, Pred. R2: 0.8277, Adeq. Precision: 20.2425, C.V. %: 0.3058, PRESS: 4.7118, Std. Dev.: 0.2713, Mean: 88.7166.
Table 5. Isotherms parameters for the adsorption of AB92 onto Nd2O3 nanoparticles.
LangmuirFreundlich
QmaxKLKF1/nR2
7.30.49713.4360.16940.9989
Table 6. Kinetics parameters for adsorption of AB92 onto Nd2O3 nanoparticles.
Lagergren IsothermHo Isotherm
C0qek1R2qek2R2
1000.950.00200.354715.8470.0270.9962
2001.770.00480.507025.250.1351.0000
300262.301.10000.78628.390.1290.9993
Table 7. Thermodynamic parameters for the adsorption system AB92-Nd2O3.
Temperature
(K)
C0
(mg/L)
ΔS0
(J/mol K)
ΔH0
(J/mol)
lnKaΔG0
(kJ/mol)
298 −1.01119−2.500
308100 mg/L−1.238.073−1.00307−2.568
318 −1.00307−2.596
Table 8. Techno-economical comparison for green and non- green adsorbents.
ParameterGreen AdsorbentsNon Green Adsorbent
AdsorbentAgricultural wastes (AW)Activated carbon (AC)Activated carbon (ACM)
Pollutants usedDyes, Metals, OthersDyes, Metals, OthersDyes, Metals, Others
ModificationNoNoYes
Adsorption capacity100 mg/g200 mg/g300 mg/g
Mass of pollutant for removal1 kg1 kg1 kg
Adsorption-desorption cycles202020
Loss of capacity after cycles20%20%20%
Estimated cost for the adsorbent production*0.523
Mass of adsorbent required10 kg5 kg3.3 kg
Order of profitability123
* This factor is used instead of using exact/unknown prices.
Table 9. Instrumentation and methods for nanomaterials synthesis.
MethodDuration (h)Instrumentation
Soxhlet12Soxhlet Electrothermal (580 W)
Oven Drying3Oven Thermofisher (1450 W)
Stirring3 (total)Stirrer CAT M 6,1 (580 W)

