Article

Manganese and Graphene Included Titanium Dioxide Composite Nanowires: Fabrication, Characterization and Enhanced Photocatalytic Activities

1
Daegyeong Regional Infrastructure Technology Development Center, Kyungpook National University, Daegu 41566, Korea
2
Faculty of Science, The University of Newcastle, Callaghan, NSW 2308, Australia
*
Author to whom correspondence should be addressed.
These authors contributed equally to this work.
Nanomaterials 2020, 10(3), 456; https://doi.org/10.3390/nano10030456
Submission received: 30 January 2020 / Revised: 28 February 2020 / Accepted: 29 February 2020 / Published: 4 March 2020
(This article belongs to the Special Issue Nanomaterials for Green Energy Applications)

Abstract

:
We report the detailed microstructural, morphological, optical and photocatalytic studies of graphene (G) and manganese (Mn) co-doped titanium dioxide nanowires (TiO2(G–Mn) NWs) prepared through facile combined electrospinning–hydrothermal processes. The as-prepared samples were thoroughly characterized using X-ray diffraction (XRD), transmission electron microscopy, X-ray photoelectron spectroscopy (XPS), Raman spectroscopy, and diffuse reflectance spectroscopy (DRS). XRD studies reveal the formation of mixed anatase-rutile phases or rutile phase depending on the dopant (Mn) precursor concentrations in the electrospinning dope and calcination temperature. The evaluation of lattice parameters revealed that the incorporation of Mn species and carbon atoms in to the lattice of anatase or rutile TiO2 could occur through substituting the sites of oxygen atoms. XPS results confirm the existence of Mn2+/Mn3+ within the TiO2 NW. Raman spectroscopy provides the evidence for structural modification because of the graphene inclusion in TiO2 NW. The optical band gap of G–Mn including TiO2 is much lower than pristine TiO2 as confirmed through UV-vis DRS. The photocatalytic activities were evaluated by nitric oxide (NOx) degradation tests under visible light irradiation. Superior catalytic activity was witnessed for rutile G–Mn-co-doped TiO2 NW over their anatase counterparts. The enhanced photocatalytic property was discussed based on the synergistic effects of doped G and Mn atoms and explained by plausible mechanisms.

1. Introduction

The breakthrough research report published by Fujishima and Honda on photocatalytic splitting of water on a titanium dioxide (TiO2) electrode under ultraviolet (UV) light irradiation forms the basis for extensive research inventions based on the photocatalysis phenomenon of TiO2. One of the limitations of TiO2 in photocatalytic applications is its large band gap (3.0–3.2 eV) because of the fact that TiO2 is photoactive only under UV irradiation [1]. The primary technical issues in terms of photocatalytic efficiency are the limited surface area of TiO2 and photoreaction [2]. Most of the electron–hole pairs undergo recombination within a few nanoseconds, and hence only a fraction of the charge carriers are involved in the photocatalytic reactions (∼10%) [3]. Considering these issues and the demands for future advanced applications of TiO2, there exists a need for the development of newly modified materials based on TiO2 having enhanced performances with respect to the photocatalytic properties. Strategies are being continuously evolved to modulate the properties of TiO2 and other metal oxides [4,5,6,7,8,9,10,11] towards achieving improved performances that include nanostructuring, generation of oxygen defects, chemical (metal or non-metal) doping, surface sensitization/modification, interface modification [12,13,14,15,16] and combining other semiconductors or other components to form nanocomposites/nanohybrids toward myriad of applications (energy, environment and health) [17,18,19,20].
The fabrication of TiO2 nanostructures with interesting morphologies and properties has attracted considerable attention in order to exploit their inherent physicochemical properties of TiO2 [21]. Many TiO2 nanostructured materials such as nanoparticles, exfoliated nanosheets, nanofibers, and nanowires (NW) have been developed through various synthesis methods [22]. Moreover, one dimensional (1D) semiconductor nanostructures can facilitate the light absorption and scattering, which is beneficial for photocatalytic reactions. Typically, 1D nanostructures of TiO2 (like NW) have been extensively studied because of their distinctive advantages such as high aspect ratio along with the typical features of TiO2 nanoparticles. In TiO2 NWs, the photogenerated carriers are expected to transfer along the axial direction effectively. In addition, the large specific surface area and chemical stability of 1D TiO2 allow them to be used as an ideal building block for assembling various surface heterostructures [23]. The prominent synthetic methods of TiO2 NW include sol–gel, hydrothermal and electrospinning. Among the various methods for the preparation of TiO2 NW, electrospinning is versatile and an up-scalable technique [24,25,26,27,28].
Researchers have been exploring methodologies to modify TiO2 for extending their optical response into the visible range [29]. Band engineering by incorporating impurities (either cations or anions) into TiO2 crystal structure, deposition of metal nanoparticles over the surface TiO2 particles, doping with anions/transition metals, sensitization by quantum dots, and formation of hybrids/ composites, etc., have been effectively utilized to extend the absorption of TiO2 from UV to the visible region. The impurity elements substitute the oxygen atoms from the lattice of TiO2 and decrease its band gap by generating sub energy levels between conduction and valence bands [30,31]. Doping TiO2 also changes their optoelectronic properties, facilitates separation of photogenerated charge carriers and leads to enhanced reaction rates for photocatalytic processes [32,33]. Non-metal (carbon, nitrogen, sulphur) doping has been extensively studied, especially after the work by Asahi et al. [34] on nitrogen-doped TiO2 [34,35]. The composites or hybrids of TiO2 with either graphene oxide [36], reduced graphene oxide, exfoliated graphene (G) sheets or G sheets having oxygenous functional groups (such as carboxylic (–COOH), hydroxyl (–OH) and carbonyl (C=O) groups) on the surface were effectively used to enhance the photocatalytic ability of TiO2 [24,37,38,39,40,41]. Through various studies, its understood that G inclusion into TiO2 improves the photocatalytic efficiency of TiO2 owing to its large specific surface area that can facilitate the distribution of TiO2 and enable narrowing of the band gaps of TiO2 [24,25,26,27,28,41,42]. Besides, the enhancement of photoactivity of TiO2 is ascribed to the synergistic effects between graphene oxide and/or G nanosheets and TiO2 [43,44].
Several reports revealed that doping of TiO2 with metals and/or non-metals minimizes the electron–hole recombination and increases its visible-light harvesting potential and these aspects have proved to be effective for accentuating the photocatalytic efficiency of TiO2 [45,46]. Among the metal doping for TiO2, manganese (Mn) doping for the modification of TiO2 attracts paramount interest because of the abundant nature of Mn, the possibility to extend the optical absorption in the visible or even the infrared solar light via the combined effects of narrowing the band gap, and the generation of internal band levels within the forbidden gap [47]. Oxygen vacancy and associated substitutional Mn in TiO2 crystal structure generate localized defect levels in the forbidden band, induce significant spin polarization and effectively reduce the energy [48]. To the best of our knowledge, reports on Mn doping into graphene including titanate composite NWs have not been attempted.
Extensive researches on single element doping of TiO2 in the past decades revealed that doping could improve the photoactivity of the catalysts only to some extent and has problems such as thermal stability and charge carrier trapping. In the process of further improving the photocatalytic activity more than single element doping, co-doped TiO2 were prepared through a judicial metal combination [49,50], metal non-metal elements [51,52] and double metal ions [53,54]. Kudo et al. reported that rutile TiO2 co-doped with chromium and antimony (TiO2:Cr/Sb), rhodium and antimony (TiO2:Rh/Sb), and nickel and tantalum or niobium (TiO2:Ni/(Ta, Nb)) showed visible light response to photocatalytic oxygen evolution [55,56]. La–Na co-doped TiO2 nanoparticles have been synthesized by a solvent-controlled, sol-gel route [57]. Several composite catalysts based on C, N and P co-doped TiO2 were prepared by sol-gel method [58]. Simultaneous doping of TiO2 using anions (C, N, etc.) and transition metals (Cr, V, Mo, etc.) results in significant narrowing of the bandgap. In such a situation, improvements in solubility limit of the dopant pair result from the charge states of p and n-type sites in non-compensated dopants (for example: Cr/N) [59]. Adopting this strategy, Cr–N co-doped TiO2 (TiO2:Cr, N) nanoparticles and single-crystal anatase [60] or rutile [61] thin films have been fabricated, having a diminished bandgap. It is understood that the interfacial charge-transfer processes are influenced by the presence of a metal co-catalyst or surface-bound molecular relays. Literature reveals that there are no reports on the preparation of Mn and graphene co-doped TiO2 NW.
In this work, we demonstrate a facile electrospinning and hydrothermal two-step methodology for the synthesis of graphene (G) and Mn species co-included with TiO2 nanowires (T(G–Mn) NW) as a potential photocatalytic material for NOx removal. These aspects have not been covered till date. It is worth noting that the hydrothermal stage guarantees the simultaneous inclusion of G and Mn species into the TiO2 NWs. Though the preparation of vertically aligned rutile TiO2 NW arrays has been reported [62], the reports on the preparation of rutile TiO2 NW co-doped with carbon and metal are scarce. Herein, we report a convenient method to prepare both anatase-rutile mixed phase T(G–Mn) NW and the pure rutile T(G–Mn) NW by controlling the annealing temperature. The morphology, structure and optical properties of T(G–Mn) NW prepared under different conditions were thoroughly characterized by various advanced techniques. The photocatalytic activities in NOx oxidation under visible light irradiation were comparatively investigated between the G and Mn including anatase and rutile NW. In addition, the photocatalysis mechanisms were explored.

2. Materials and Methods

2.1. Materials

Acetone (94.0%) and ethanol (99.5%) were obtained from OCI, Korea. Titanium isopropoxide (TIIP) (97%), manganese acetate tetrahydrate (99%), polyvinylpyrrolidone (molecular weight: 40,000 and 1.30 × 10⁶), and graphene oxide (15–20 sheets, 40–10% edge oxidized) were obtained from Sigma Aldrich, Seoul, Korea.

2.2. Preparation of G Included TiO2 Composite NWs

The two major steps involved in the synthesis include (i) preparation of G included TiO2 composites (titanate NWs) and (ii) calcination. The detailed preparation procedures of G-incorporated composite titanate nanofibers can be referred from our earlier reports published elsewhere [24,25,26,27]. A similar route has been adopted for the synthesis of Mn-embedded composite titanate NWs.

2.3. Preparation of Mn Included TiO2 Composite NWs

A typical experimental procedure is outlined here. Graphene (80 mg) and manganese acetate (40 mg) were dispersed in a 20 mL solution comprised of acetic acid and ethanol in the ratio of 3:7. The mixture was stirred well for 20 min. About 1.5 g of TIP was added slowly and stirred further for 30 min. Then, PVP with 40,000 and 1.30 × 10⁶ molecular weights were individually added in the ratio of 6:1 and stirred for 1 h. The entire mixture was allowed to stand for 6 h and left undisturbed. The prepared electrospinning dope solution was loaded into plastic syringes (10 mL) and electrospinning was performed with a high-voltage power of 25 kV. The electrospun G–Mn included titanate (TP(G–Mn) composite nanofiber mats were collected. The fiber mats were suspended in 20 mL of ethanol/water solution (50/50), and the hydrothermal reaction was carried out at 180 C for 2 h prior to calcination. The TP(G–Mn) composite nanofiber mats were thus prepared with different Mn loaded and designated (Table 1).
TP(G–Mn) composite nanofiber mats were calcined at 550 °C for 2 h in order to decompose PVP to obtain G–Mn including TiO2 NWs. Similarly, TP(G–Mn) composite nanofiber mats were calcined at 800 °C for 2 h to obtain G–Mn rutile TiO2 NWs. The calcinations were primarily performed to tune phase compositions of TiO2. The samples are designated based on the Mn precursor used in the electrospinning dope and the calcination temperature (Table 1).

2.4. Characterization

The morphology of the samples was examined by field-emission scanning electron microscopy (FE-SEM, SNE-3200M, SEC, Suwon, Korea) and field-emission transmission electron microscopy (FE-TEM, Titan G2 ChemiSTEM Cs Probe, FEI Company, Hillsboro, OR, USA). The crystal phases of the samples were examined by X-ray diffraction analyzer (D/Max-2500, Tokyo, Rigaku, Japan). The scanning angle 2θ was varied from 5° to 70° with a step size of 0.02 and a dwell time of 1.5 sec. The working voltage applied electric current and Cu Kα radiation were 40 kV, 200 mA and 1.5406 Å, respectively. The band gaps of the samples were determined by UV-Vis diffuse reflectance spectroscopy (S-3100, Seoul, Scinco, Korea) in the wavelength region 200 to 700 nm. X-ray photoelectron spectrum (XPS) of samples were recoded with an X-ray Photoelectron Spectroscopy (NEXSA, ThermoFisher, Waltham, MA, USA) using a Al-Kα monochromator source (1486.6 eV). Raman spectra of samples were obtained in the range 100 to 2,700 cm-1 using a Raman spectrometer (inVia reflex, Reinshaw, Wotton-under-Edge, UK), equipped with a 536 nm laser.

2.5. Photocatalytic Experiments

The photodegradation of NOx experiments was carried out under visible light irradiation by the gas-bag A method standardized by the Korea Photocatalyst Association. About 0.5 g of the photocatalyst was dispersed in distilled water to obtain a slurry. The photocatalyst slurry was applied on a 10 cm × 10 cm glass plate and dried for 1 h at 100 °C. Then, the photocatalyst-coated glass plate was then placed in a Tedlar bag (3 L volume) and filled with diluted nitrogen oxide gas using air. The nitrogen oxide concentration was kept as 1 vol. The Tedlar bag loaded with the sample and the gas was placed in a stainless-steel box. The sample was irradiated with the fluorescent lamp (Kumho Electric INC, three wavelength day light color, 17 W) fixed within the Tedlar box. The sample surface was irradiated with an illuminance of 3450 Lumen/m2. The concentration of NOx was measured with a NOx analyzer (GV-100s, Gastec) every hour for 6 h.

3. Results and Discussion

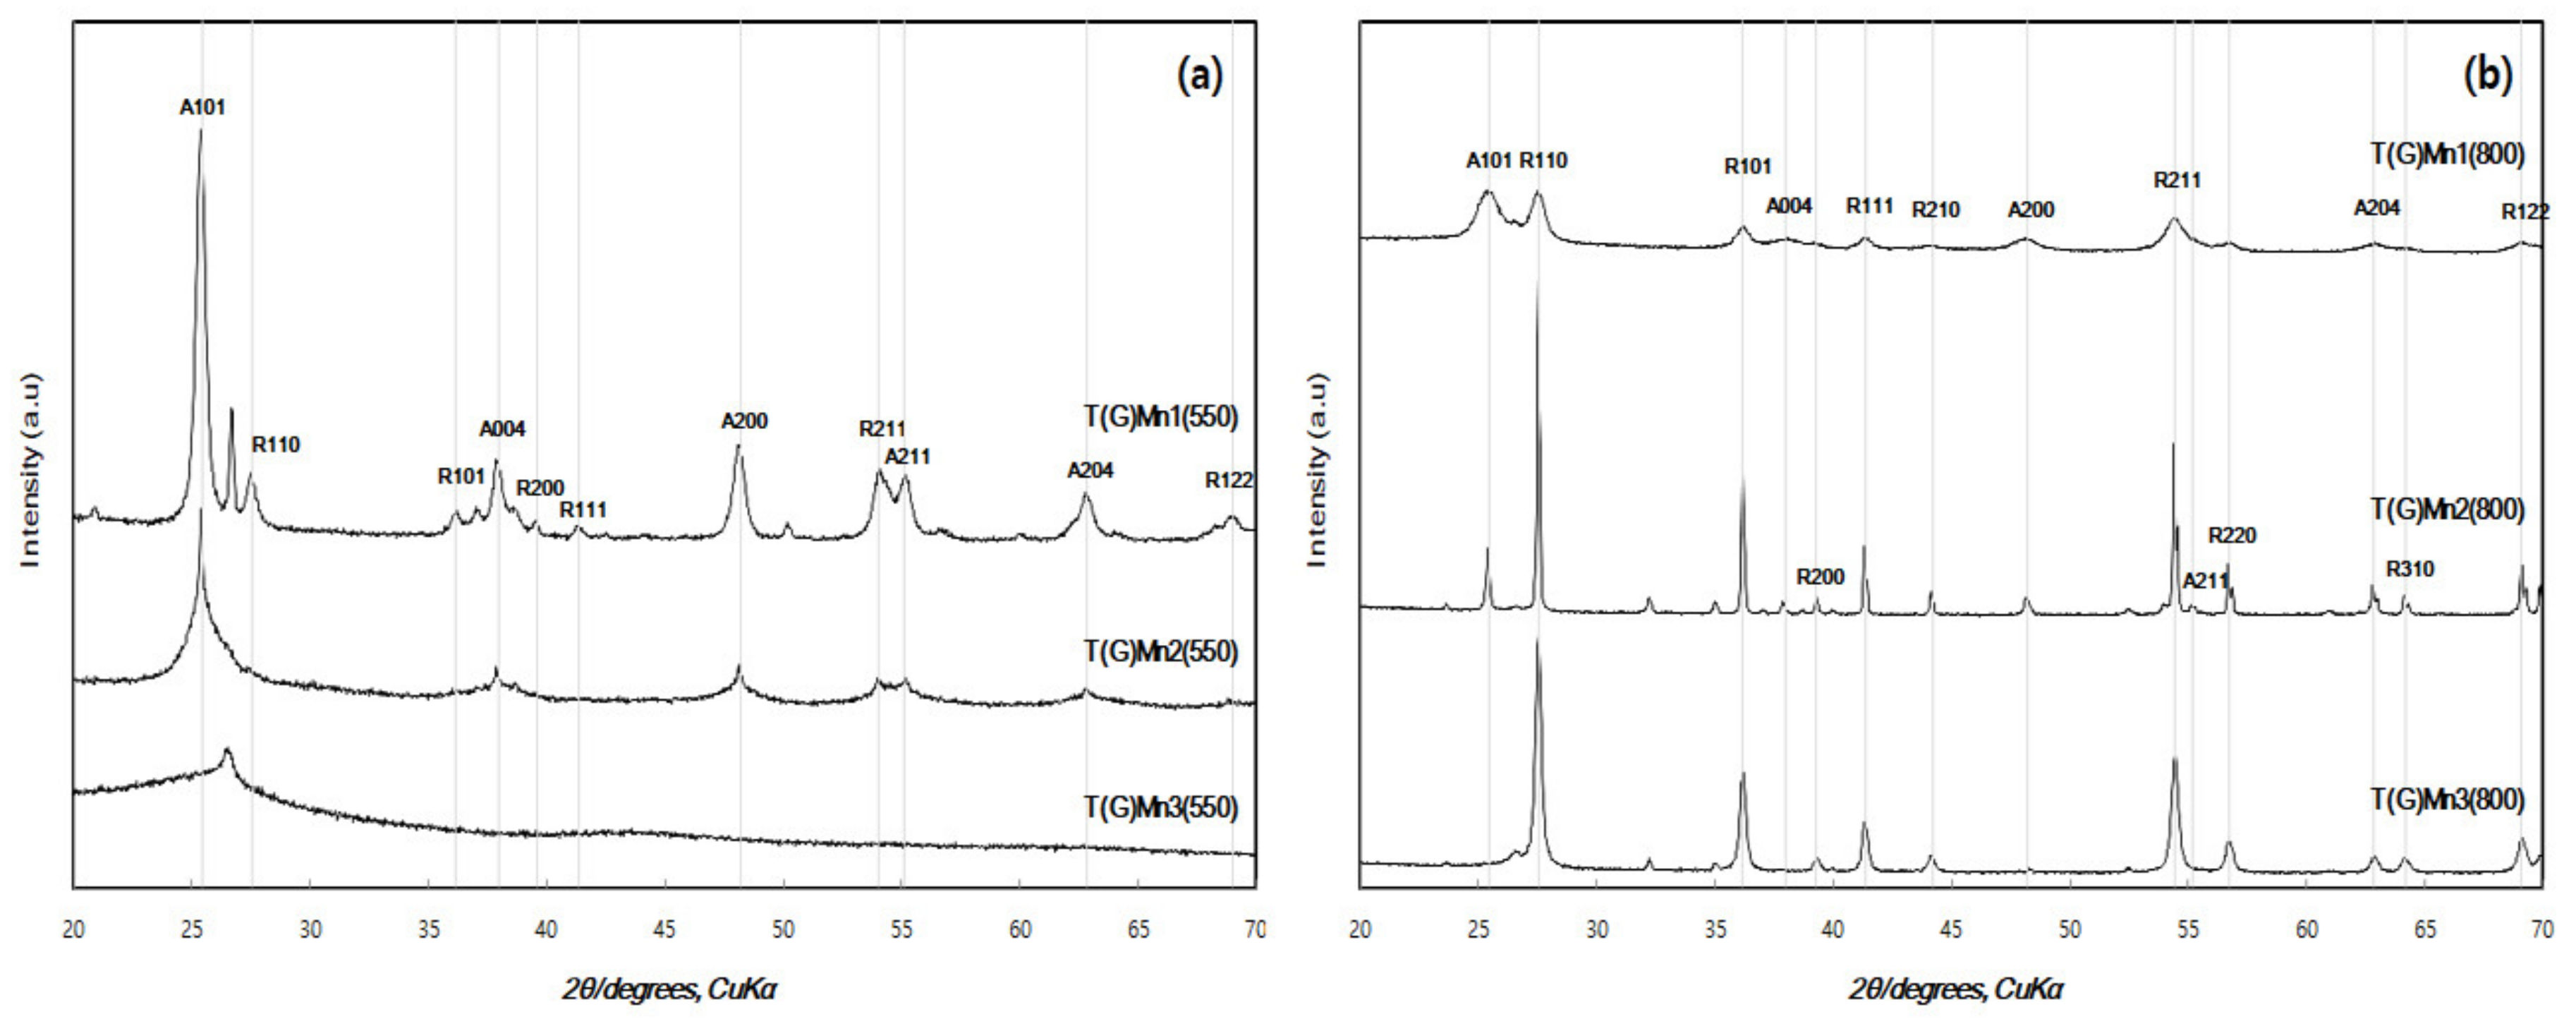
3.1. Phase Composition and Crystal Structure

Figure 1 presents the XRD results of various TiO2(G–Mn) samples after annealing at different temperatures (550 °C and 800 °C) (Table 1). The TiO2(G–Mn) samples annealed at 550 °C exhibit the formation of the mixed anatase and rutile phases. The XRD patterns for the T(G–Mn1) and T(G–Mn2) samples sintered at 550 °C show anatase crystalline diffraction peaks located at 2θ = 25.3, 37.8, 48.1, 55.1, and 62.7 that correspond to the polycrystalline tetragonal (101), (004), (200), (211), and (204), reflections, respectively. In addition, the rutile phase reflections were identified by the diffraction peaks located at 2θ = 27.5, 36.1, 39.2, 41.4, 54.1, and 68.9 and indexed as (110), (101), (200), (111), (211), and (122), respectively. On the other hand, the XRD pattern of T(G–Mn3) sample sintered at 550 °C did not show any crystalline pattern but rather presents an amorphous pattern with a broad peak around 2θ = 26.4. The formation of amorphous phase anatase is a rather interesting feature to note. The amorphous TiO2 is expected to be electronically defective in nature and can be attributed to the reduction of Ti4+ cations to the Ti3+ state, through the probable n-type doping, where tetravalent Ti may be substituted by polyvalent M cation [63]. When Mn concentrations are higher (120 mg in the electrospinning dope, Table 1), this possibility of amorphous anatase formation arises. Alternatively, the modification of the bond structure by creating O vacancies or Ti3+ interstitials is expected [63]. Hence, we believe that the reduction of the Ti coordination number and the shortening of the Ti–O bond could be the reason for amorphous TiO2 transformation in the case of the T(G–Mn3) (550) sample. The XRD pattern of 800 °C annealed samples predominately exhibit the existence of tetragonal rutile phase reflections. The sample T(G–MN1)(800) contains a very weak (101) anatase reflection peak. The position of the diffraction peaks is in good agreement with those given in ASTM data card (#21-1272) for anatase and ASTM data card (#21-1276) for rutile. It is interesting to inform that there are no reflection peaks that correspond to manganese phases in the XRD patterns, even with the highest doping concentration (Table 1). It must be noted that characterization results of the following samples prepared under similar experimental conditions were already reported in our earlier work [24] and hence are not presented here.
The percentage (%) of anatase and rutile phases in the samples was calculated and presented in Table 1. For the sake of comparison, the percentage anatase and rutile phases in the TiO2 samples without G and Mn (T(550) and T(800)) and samples prepared without including Mn precursor in the electrospinning stage (T(G)(550) and T(G)(800) are also presented in Table 2. The T(550) and T(G)(550) comprise mixtures of anatase and rutile phases, with rich anatase phase predominance (~90%). The T(G) (550) sample contains slightly higher anatase (93.76%) as compared to T(550) (90.14%). However, the 800 °C annealed samples (T(800)) and T(G) (800) correspond to nearly pure rutile phases (Table 1). Scherrer’s formula (see experimental part) was used to calculate the average crystalline size (D) by using the diffraction peak (101) for anatase phase and the peak (110) for rutile phase with λ = 1.54056 × 10⁻¹⁰ m. These D values are shown in Table 2. The D spacings were found to have variations based on the annealing temperature and amount of Mn dopant (Table 2). No correlations could be deduced between the Mn dopant concentration and D values. The amorphous–anatase–rutile phase transition of TiO2 nanoparticles was found to depend on their sizes [64]. As a common guideline, the anatase-rutile phase transition temperature is substantially lower for smaller TiO2 particles, and crystalline rutile phase formation is dominant at temperatures exceeding 550 °C [65]. In our experiments, the calcination of the samples at 800 °C resulted in nearly complete rutile phase formation. (Table 2)
Table 2 presents the comparison of lattice parameters (d-spacing, unit cell values and unit cell volume) for G–Mn co-doped, G-doped and undoped TiO2 samples. The (101) and (200) diffraction peaks, respectively at 25.3° and 48.1°, were used to calculate the a and c lattice parameters of tetragonal anatase, as well as the unit-cell volumes. Similarly, the diffraction peaks that correspond to (101) and (200) reflection planes at 36.1° and 39.2° were used to calculate the lattice parameters of tetragonal rutile and unit-cell volumes. The full width half maximum values of the (101) lattice reflections of the anatase and rutile phases are presented in Table 2. For the 550 °C calcined samples (T(G–Mn1(550)), T(G–Mn2(550)), T(G)(550), and T(550), the lattice parameters correspond to tetragonal crystal lattice with a = b ≠ c (Table 1), respectively. The sample T(G–Mn3(550) is amorphous. The 800 °C annealed samples (T(G–Mn1(800)), T(G–Mn2(800)), T(G–Mn3(800), T(G)(800), and T(800))) retain the tetragonal structure with a = b ≠ c, however, they have distinctly different a= b and c values (Table 1). As compared to T(550) and T(G)(550), the c values of the T(G–Mn1)(550) and T(G–Mn2)(550) increased from 9.499 A to 9.867 A. The ionic radii of the Mn species are 0.079 nm (Mn3+, high spin), 0.072 nm (Mn3+, low spin), and 0.067 nm (Mn4+) [66]. The ionic radius of Ti4+ in anatase structure was found to be 0.075 nm. The Mn ionic radii are within the threshold for possible extensive solid solution formation and TiO2 structure disruption [67]. The inclusion of Mn species can be the reason for the elongation of the c-axis of the tetragonal TiO2 anatase structure. Similarly, the c values of T(G–Mn1)(800) and T(G–Mn2)(800) are larger (4.564 A) as compared to the c values of T(800) and T(G)(800)(2.959 A). Hence, a distortion of rutile tetragonal structure is evident through the elongation of the c-axis. On comparing the ionic radii of Mn3+ and Mn4+, the substitution of Ti4+ by Mn4+ is easier while substitution by Mn3+ requires the formation of oxygen vacancies for charge balance, and in turn is advantageous for the photocatalytic activity [68]. We believe that increased oxygen vacancies could be brought about by the substitution of Ti by lower valence Mn ions [69]. The generation of oxygen vacancies lattice can reduce the constraint and facilitate the reconstructive phase transformation. When the annealing temperature was increased from 550 °C to 800 °C, the reconstruction of anatase to rutile transformation happened through the rearrangement of the TiO2 lattice. We compared the unit cell volume between the 500 °C and 800 °C annealed samples. Nearly 54% decrease in unit cell volume was witnessed between 550 °C and 800 °C annealed pure TiO2 samples (Table 1). The decrease in unit cell volume upon anatase to rutile transformation is in accordance with the literature [35,70]. There is not much difference in unit cell volume between T(800) and T(G)(800) samples, signifying that the inclusion of G did not alter much the TiO2 crystal structure. On the other hand, the inclusion of Mn along with G was accompanied with an increase of ~35% unit cell volume. The atomic status of Mn in the TiO2 structure is further explored through XPS analysis (latter part of discussion).

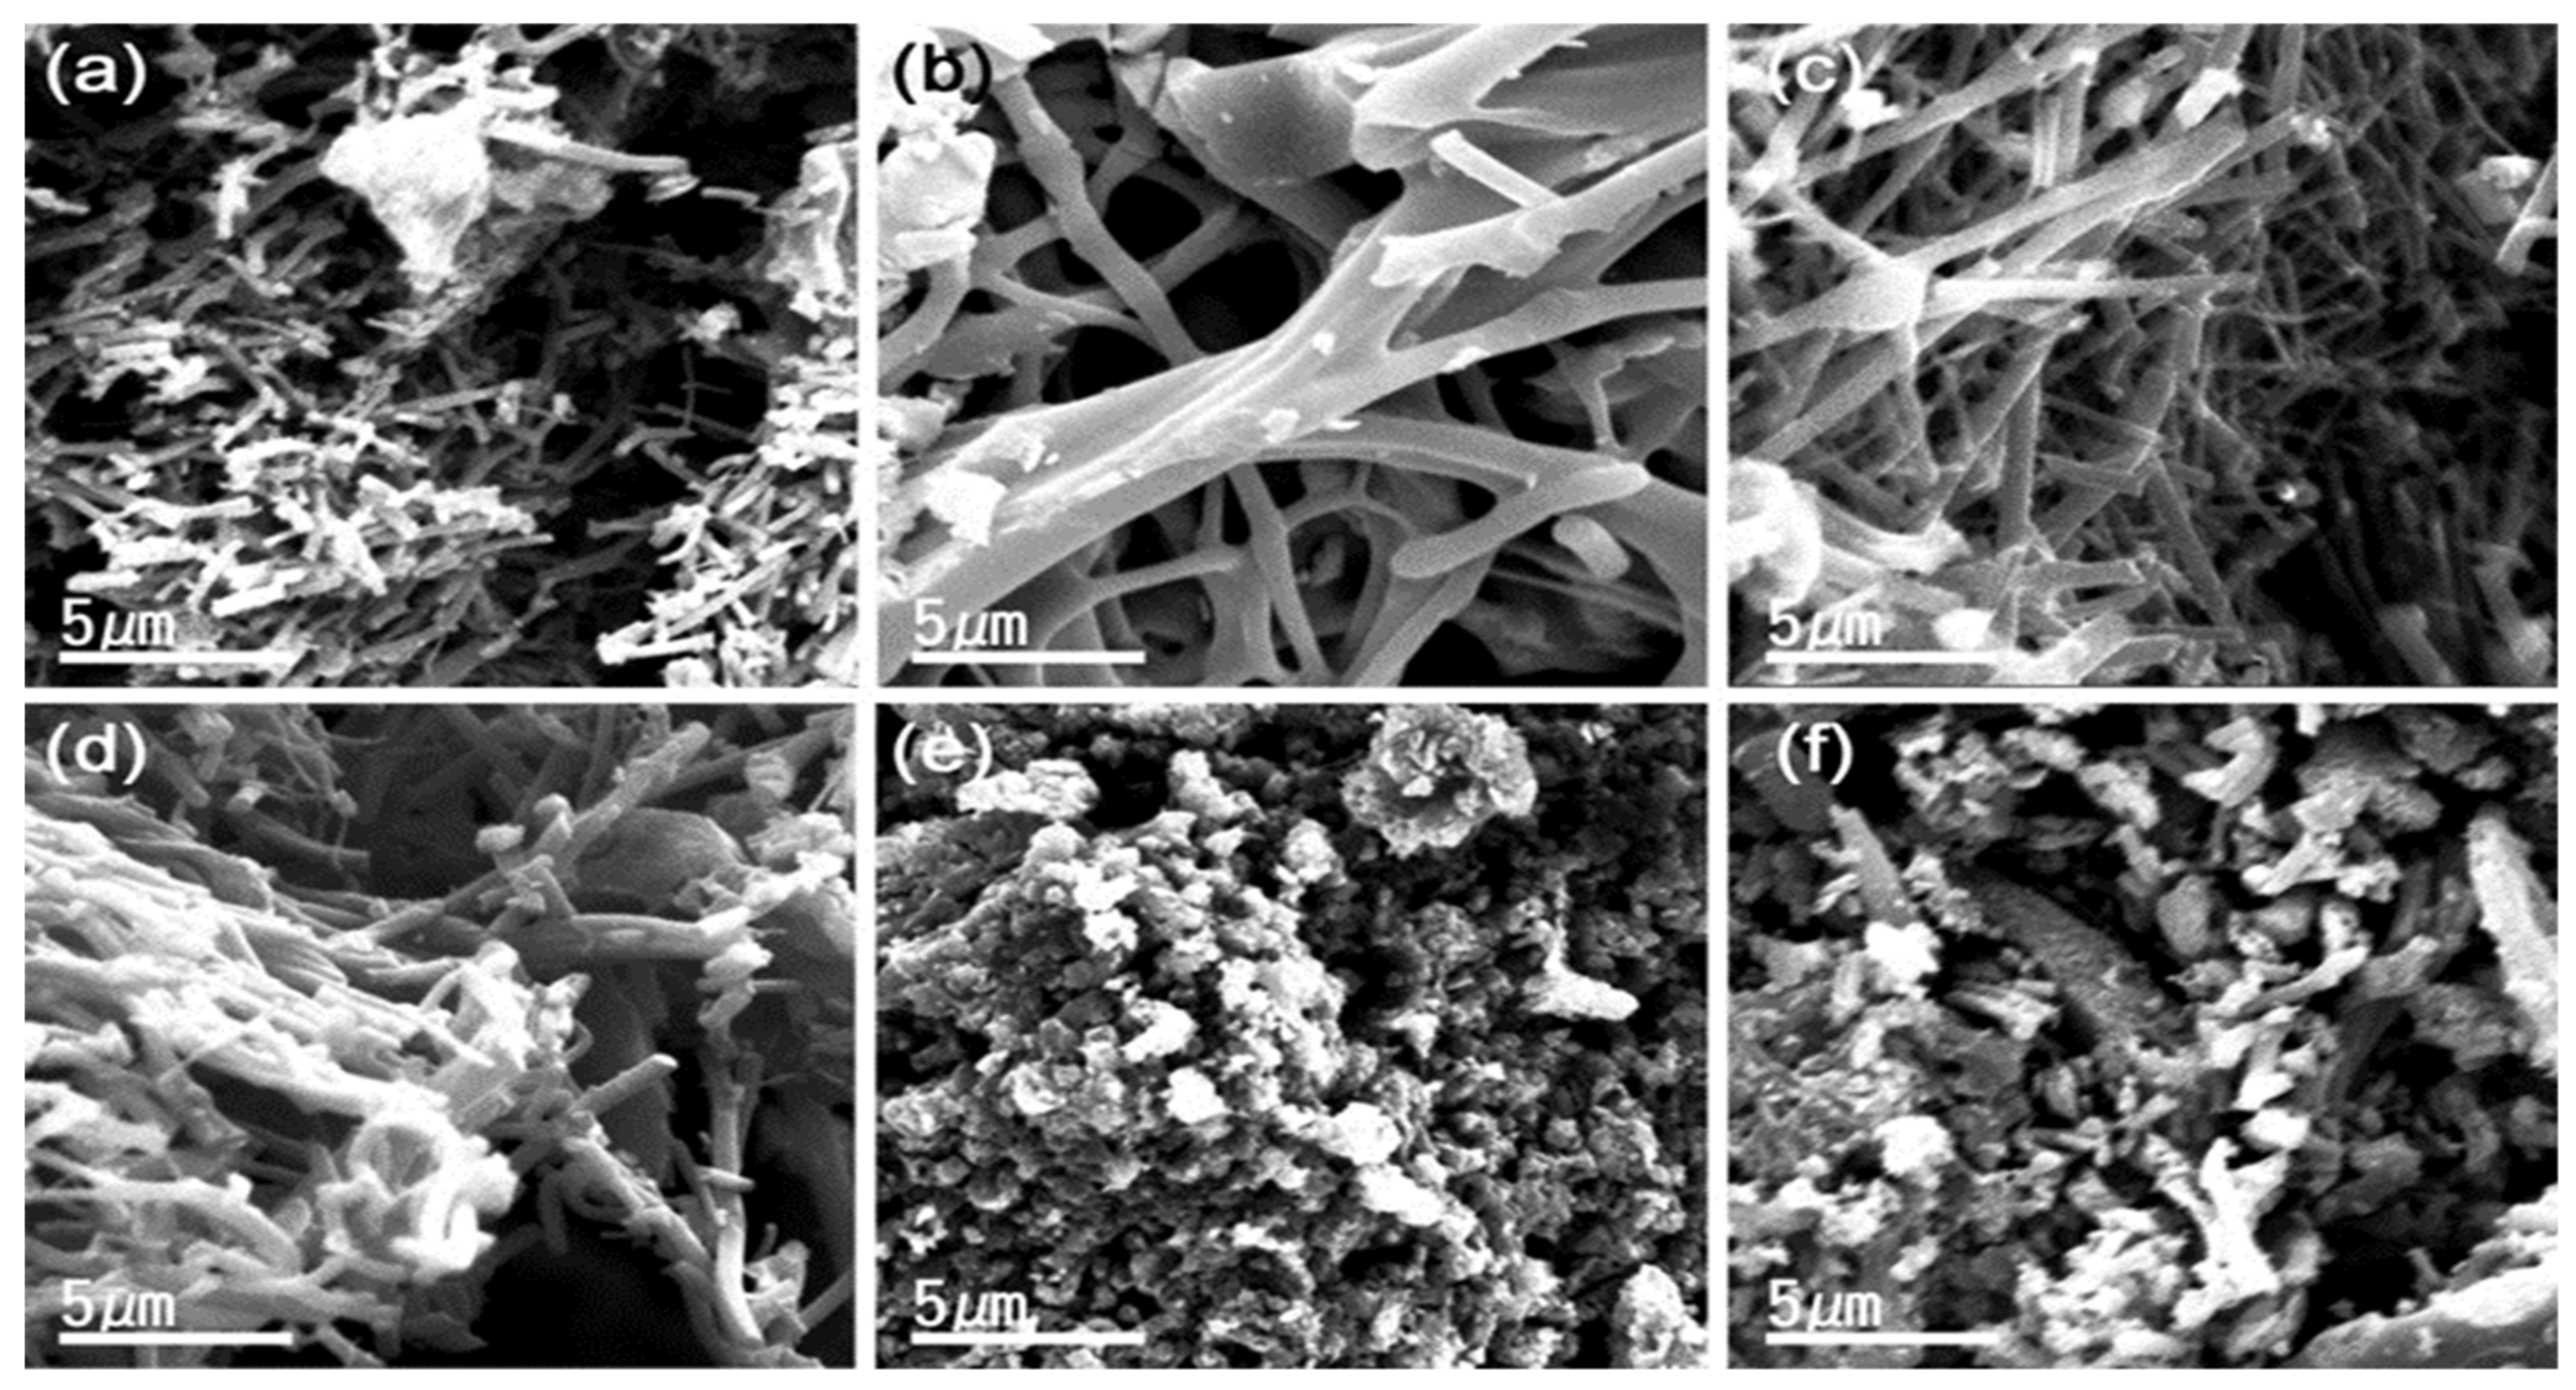
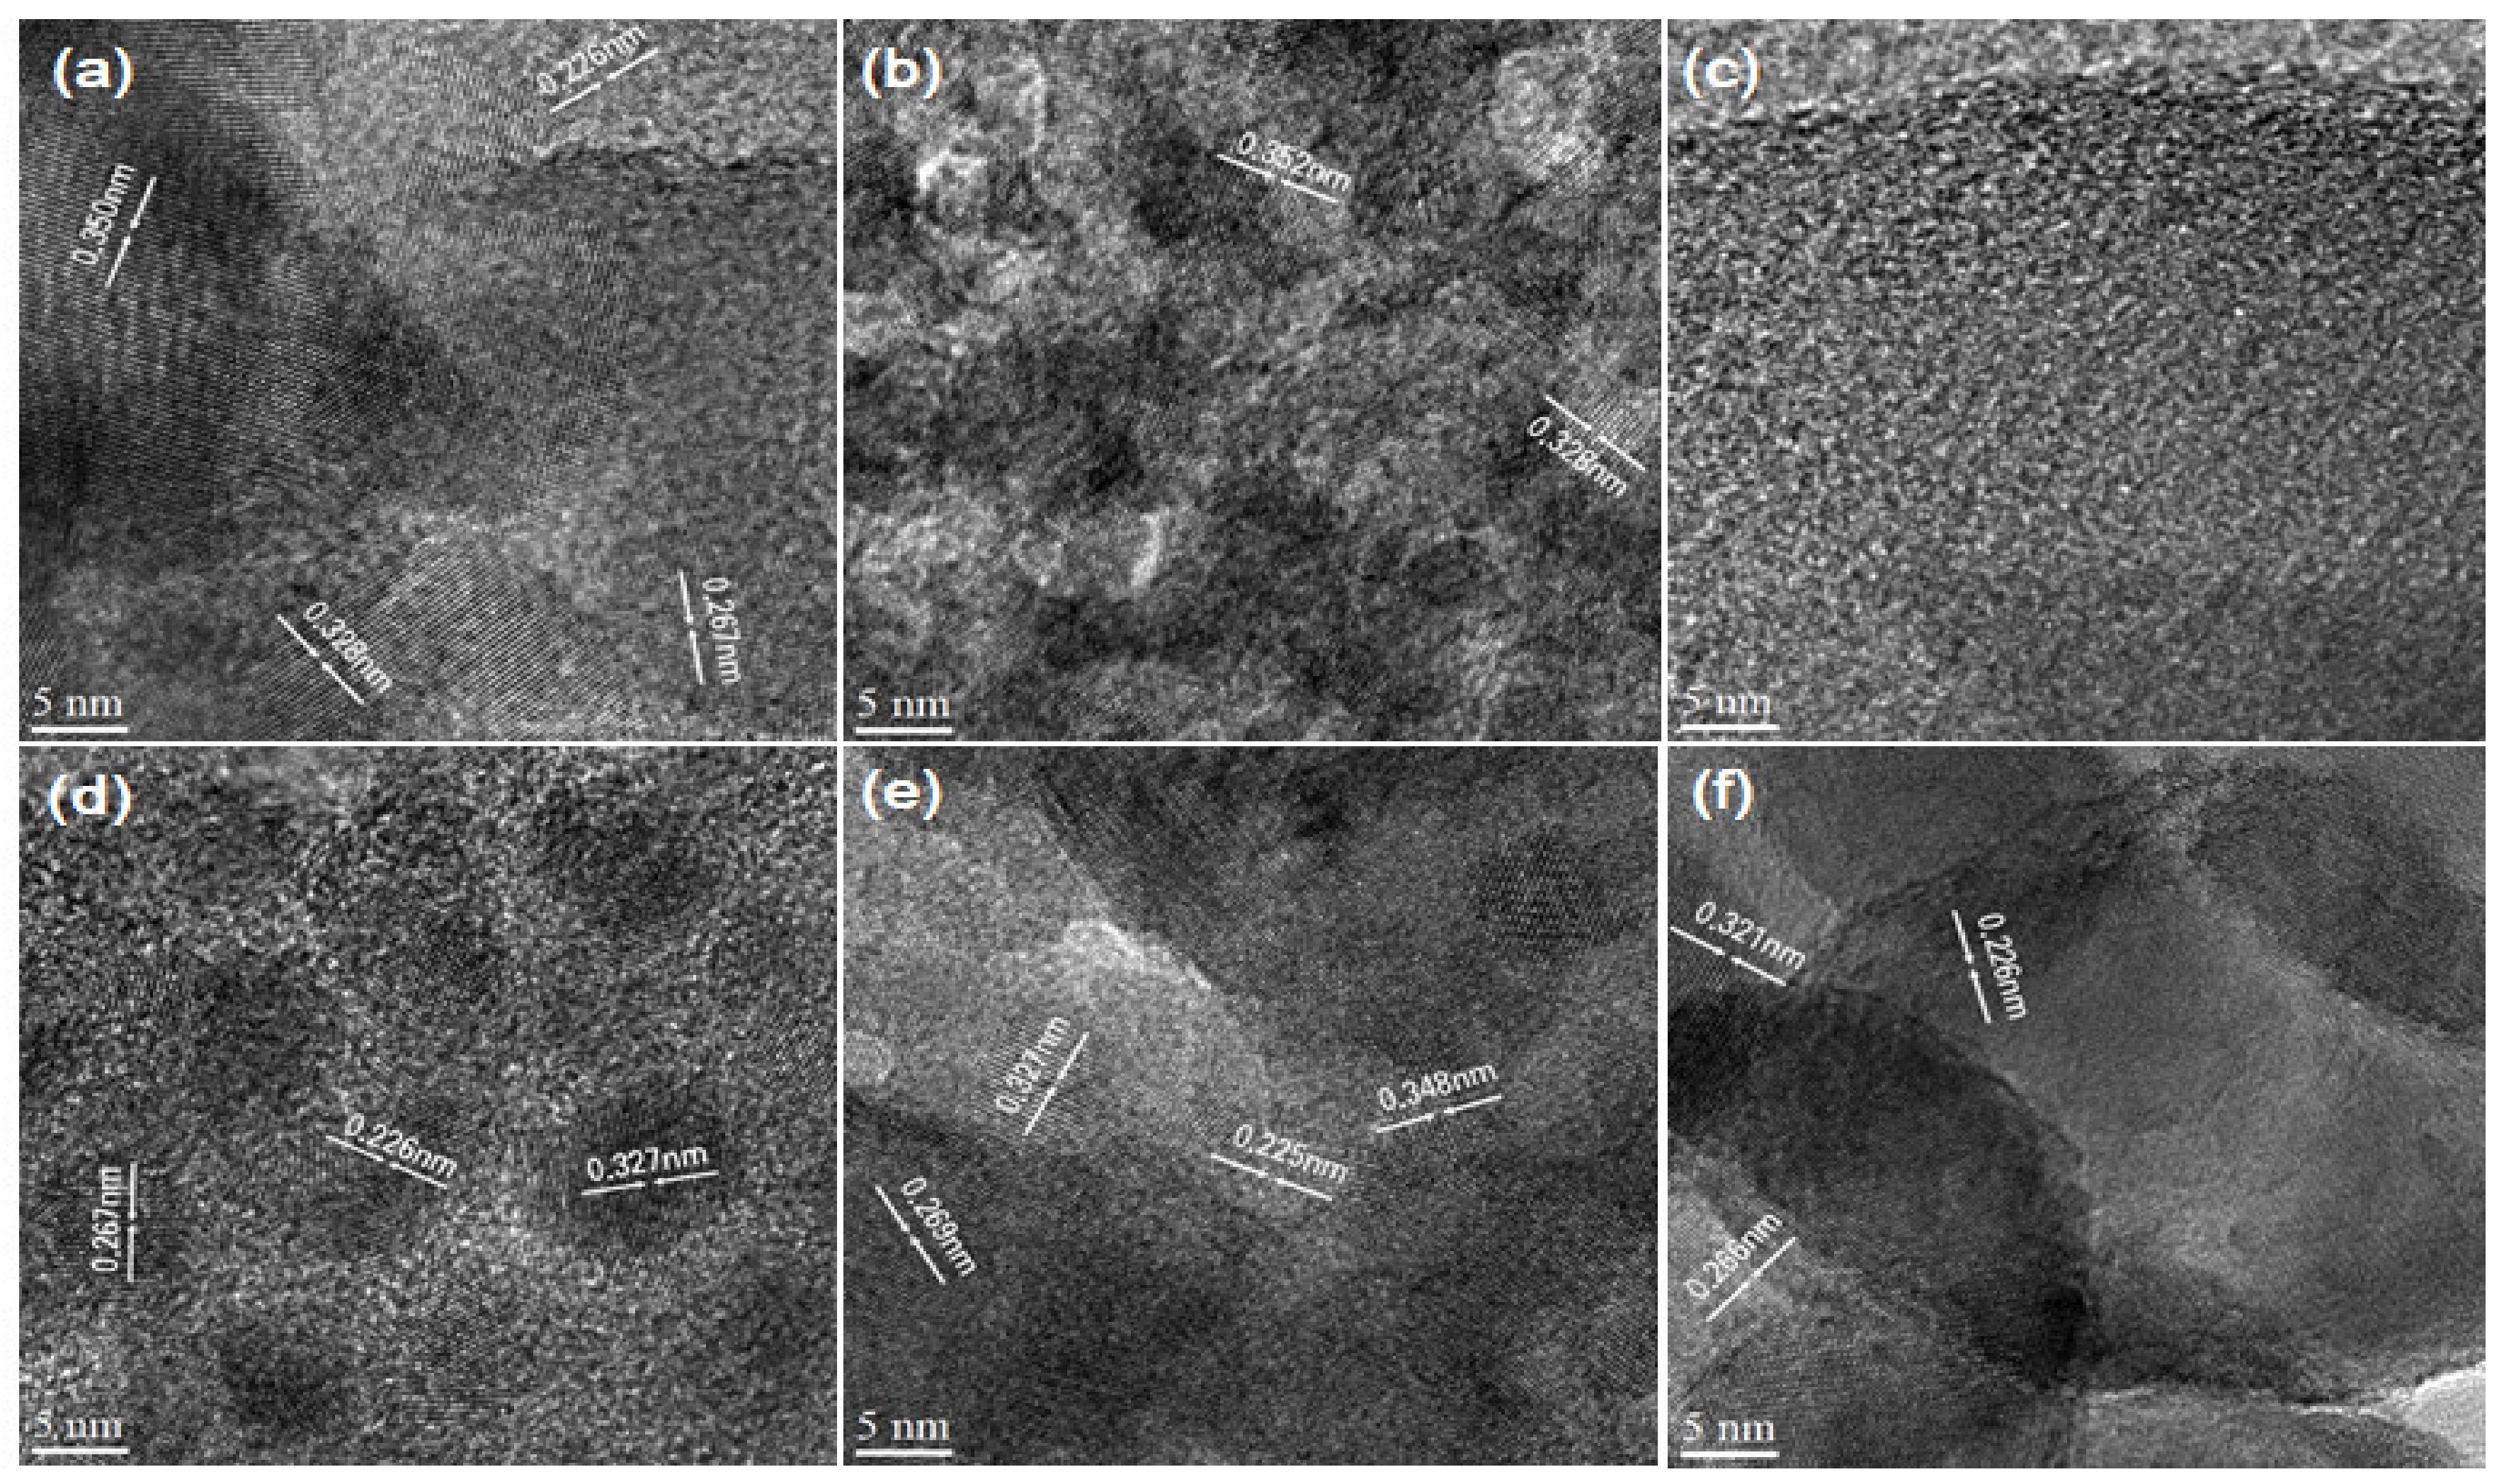
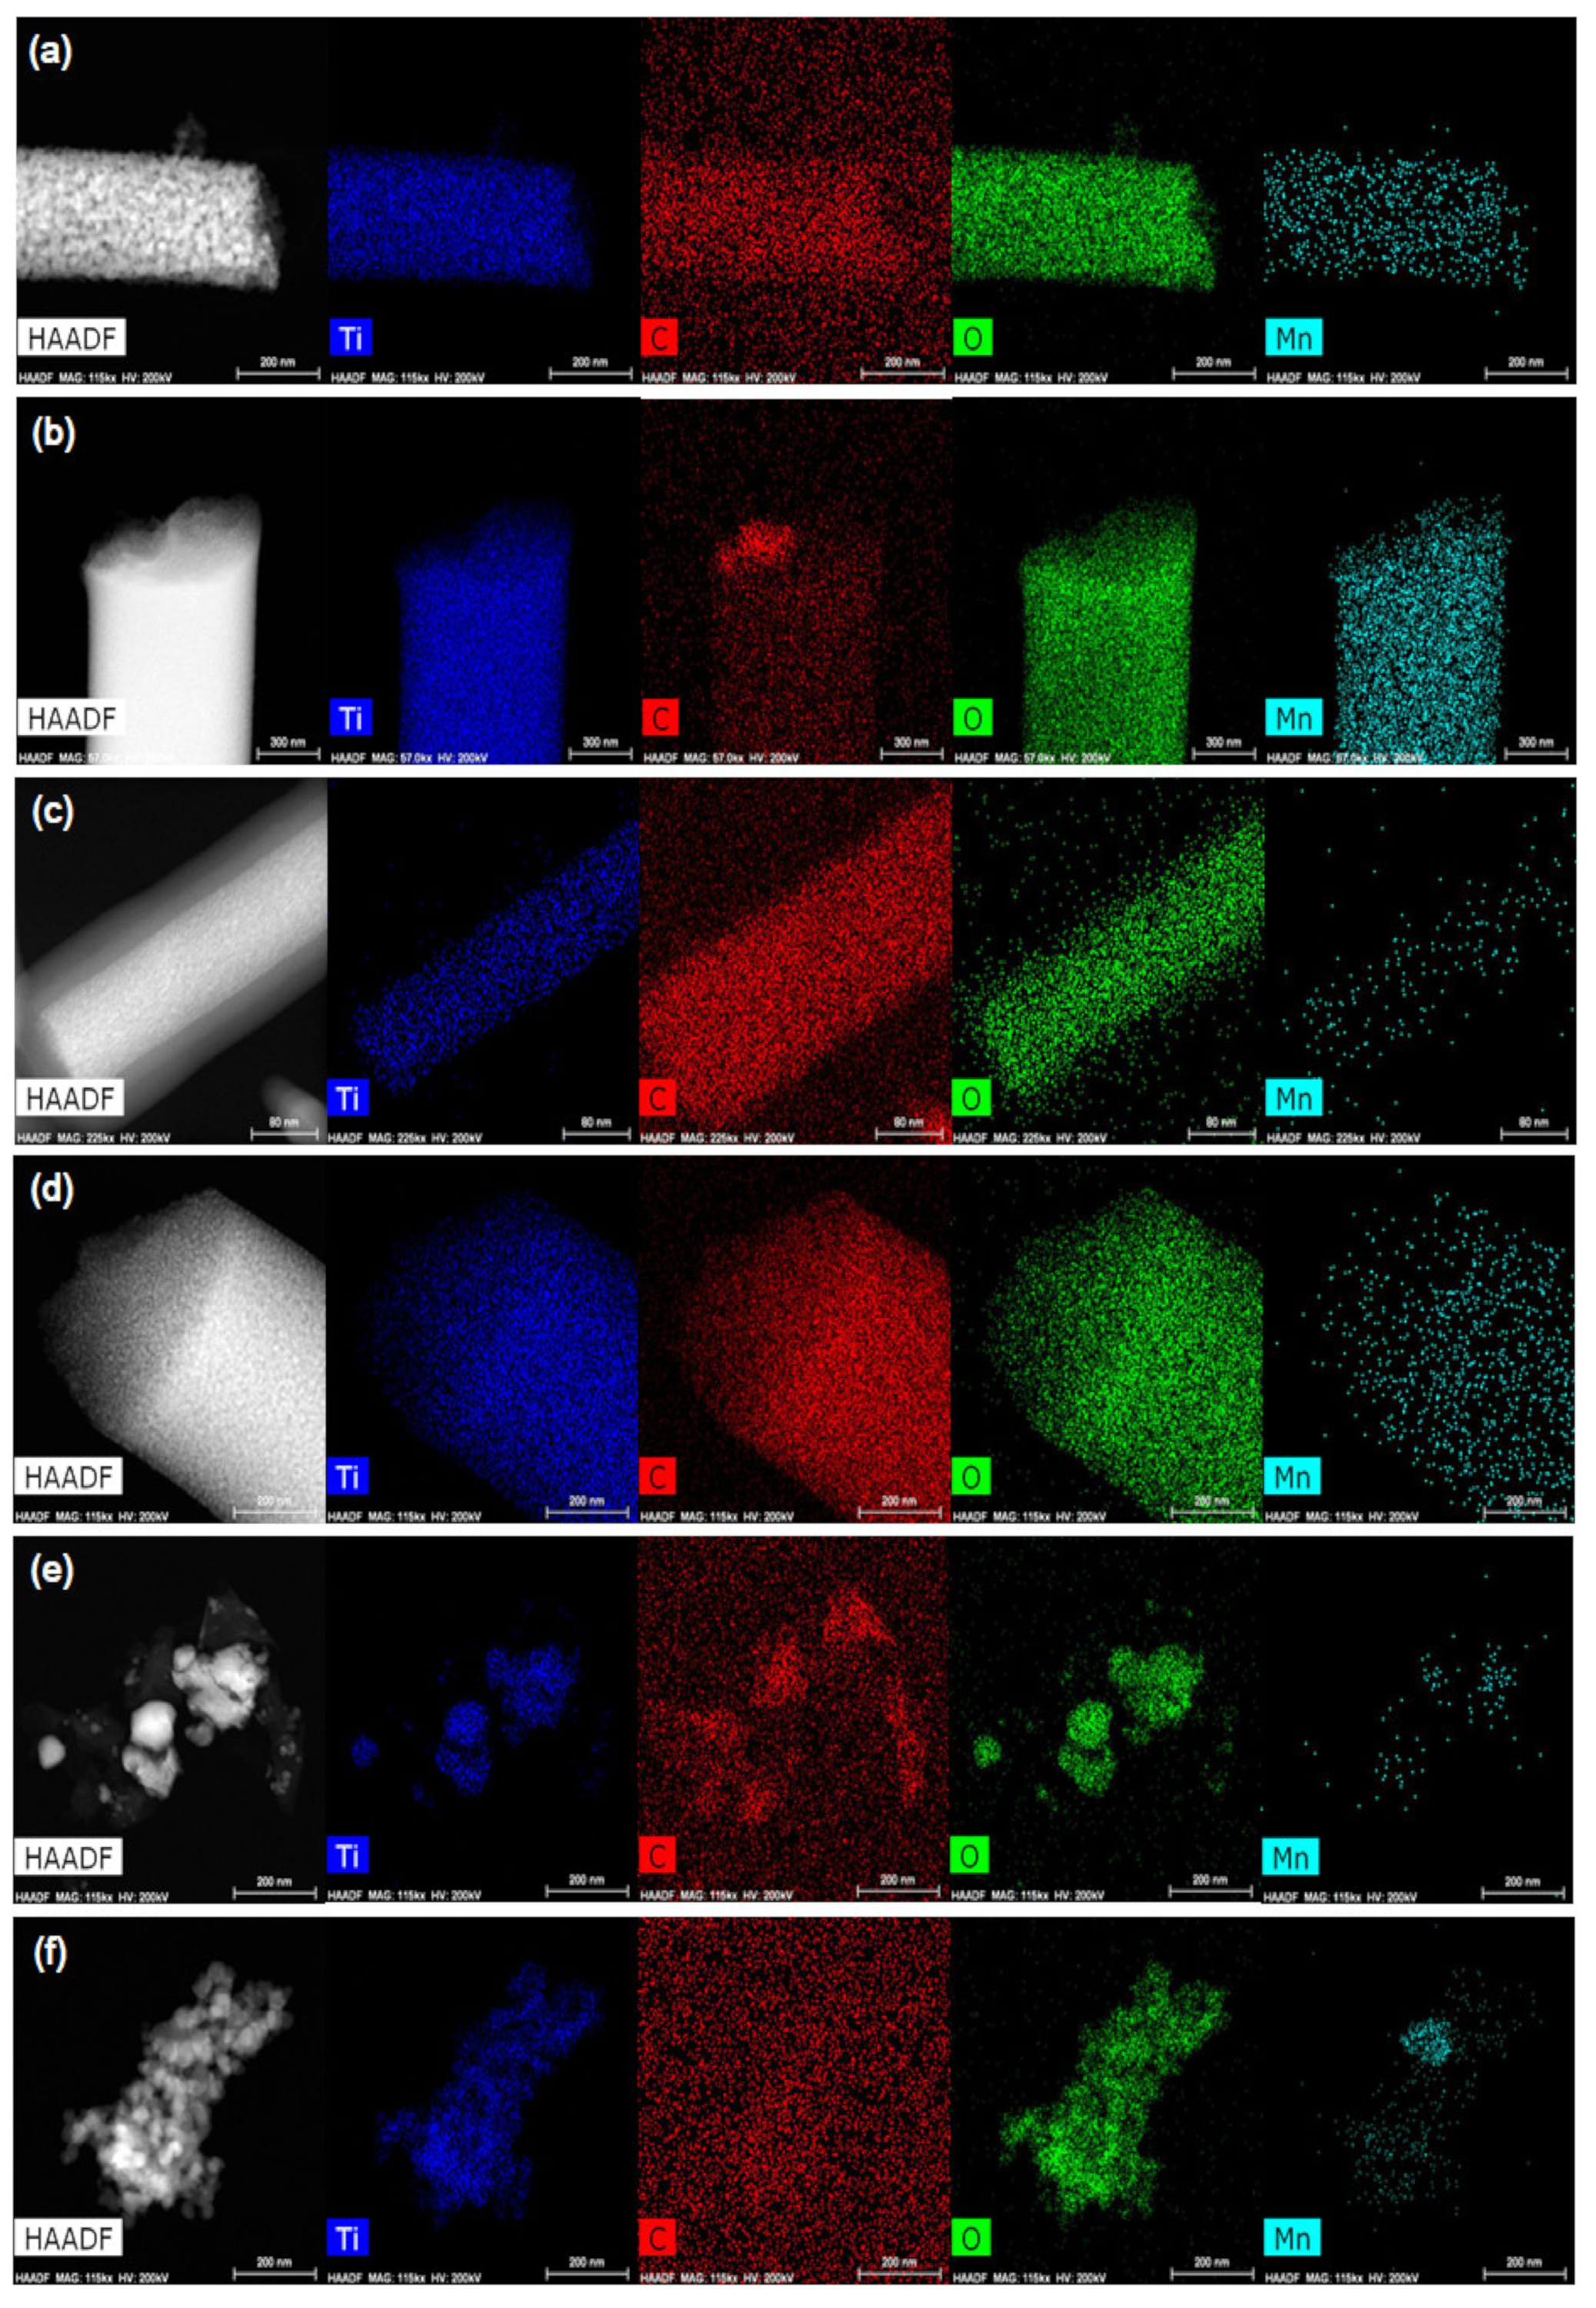
3.2. Probing Morphology Through SEM, TEM and HR-TEM

While, there is an increasing trend in the nanofiber diameter and length with an increase in Mn amount in the electrospinning precursor dope, between TP(G–Mn1) and TP(G–Mn2), a drastic decrease in diameter and length was witnessed for TP(G–Mn3) (Supplementary Material, Figure S1a–c). We believe that the inclusion of Mn in the titanate structure could be the reason for the variations in the diameter and length of the nanofibers. Figure 2 depicts the FE-SEM images of T(G–Mn1)(550) NW, (b) T(G–Mn2)(550) NW, (c) T(G–Mn3)(550) NW, (d) T(G–Mn1)(800) NW, (e) T(G–Mn2)(800) NW, and (f) T(G–Mn1)(800) NW. The variations in the lattice parameters of the calcined samples (Table 1) partially justify our proposal. FE-SEM images of 550 °C and 800 °C (Figure 2) calcined samples exhibit NW morphology with a decrease in diameter and length of NWs. To note, 800 °C calcined P(G–Mn3) showed the lowest the diameter and length amongst the G–Mn including TiO2 NWs.
TEM (Supplementary Material, Figure S2a–f) and HR-TEM (Figure 3a–f) images were further acquired to probe the NWs morphologies and crystal structures. TEM images of single NWs of 550 °C annealed samples, T(G)Mn1(550), T(G)Mn2(550), and T(G)Mn3(550) (Supplementary Material, Figure S2a–f) inform us that surface of NW is smooth with variations in the diameters. While the diameter of T(G)Mn2(550) NW is larger (~790 nm) than T(G)Mn1 (500) NW (~270 nm), the diameter of T(G)Mn3(550) is much decreased to ~150 nm. HR-TEM images of T(G)Mn1(550), T(G)Mn2(550) and T(G)Mn3(550) inform that T(G)Mn1(550) and T(G)Mn2(550) are polycrystalline and T(G)Mn1(550) and T(G)Mn3(550) are amorphous (Figure 3). The amorphous characteristics of T(G)Mn3(550) are evident from the TEM (Supplementary Material, Figure S2a–f) and very well corroborate XRD (Figure 1). The distance between the adjacent lattice fringes are investigated for the polycrystalline samples to ascertain the lattice plane of the as-developed NWs. HR-TEM images of T(G)Mn1(550) and T(G)Mn2(550) showed lattice spacing of d = 0.354 nm for the (101) plane of the anatase phase, and d = 0.325 A is assigned to the interplanar distance of the rutile phase of the (110) plane. Thus, T(G)Mn1(550) and T(G)Mn2(550) comprised of anatase-rutile mixed phases (Figure 3) (Table 2).
The elemental distribution within the NWs are presented in Figure 4. One can notice that both carbon (graphene) and Mn species are distributed within the NWs. However, there is a difference in Mn distribution throughout the NWs. While Mn species are densely distributed within the NWs, in the case of T(G)Mn1(550) and T(G)Mn2(550), Mn species are randomly distributed in T(G)Mn3 (550) NWs with a lesser density of distribution (Figure 4). A similar trend can be seen in the distribution of oxygen species within the NWs. We presume that the inclusion of Mn within the NW using different amounts of Mn precursors (Table 2) alters the structure of TiO2. Figure 4 presents the Ti, O, C, and Mn elemental mappings of the 800 °C annealed samples, (TG)Mn1(800), T(G)Mn2(800) and T(G)Mn3(800). TEM images of the single NW of the (TG)Mn1(800) shows the formation of longer NW(few µm long) with a diameter of ~560 nm and smooth surfaces (Supplementary Material, Figure S2a–f). On comparing the diameter of the T(G)Mn1(500) NW (~270 nm) annealed at 550 °C, the diameter of T(G)Mn1(800) increased to 560 nm. However, TEM images of (TG)Mn2(800) and (TG)Mn3(800) show the presence of shorter NWs. Hence, we believe that heat treatment at an elevated temperature causes collapse in the structure of the NWs. HR-TEM of T(G)Mn1(800), T(G)Mn2(800), and T(G)Mn3(800) showed lattice spacing of d = 0.325 nm for the (001) plane and 0.267 nm for the plane of the rutile phase (Figure 3). Thus, the 800 °C annealed TiO2 samples predominantly exhibited rutile phases, and the TEM observation confirms the anatase to rutile phase transformation as evident from XRD results (Table 1). The elemental distributions of Ti, O, C, and Mn in the NW of the samples are presented (Figure 4a–f). In conjunction with the results from TEM, HR-TEM and elemental mapping, we conclude that the length and diameter of the NWs; phase composition; and Ti, O, C, and Mn elemental distributions are dependent on calcination temperatures as well the amount of Mn precursor used in the fabrication procedure of the as-prepared photocatalysts (Table 2).

3.3. X-ray Photoelectron Spectroscopy (XPS), Raman and Diffuse Reflectance Spectra

Details pertaining to XPS, Raman and diffuse reflectance spectra are provided in the Supplementary Information. (XPS (Figures S3–S5), Raman (Figures S6 and S7) and diffuse reflectance (Figures S8 and S9).

3.4. Photocatalytic Performance
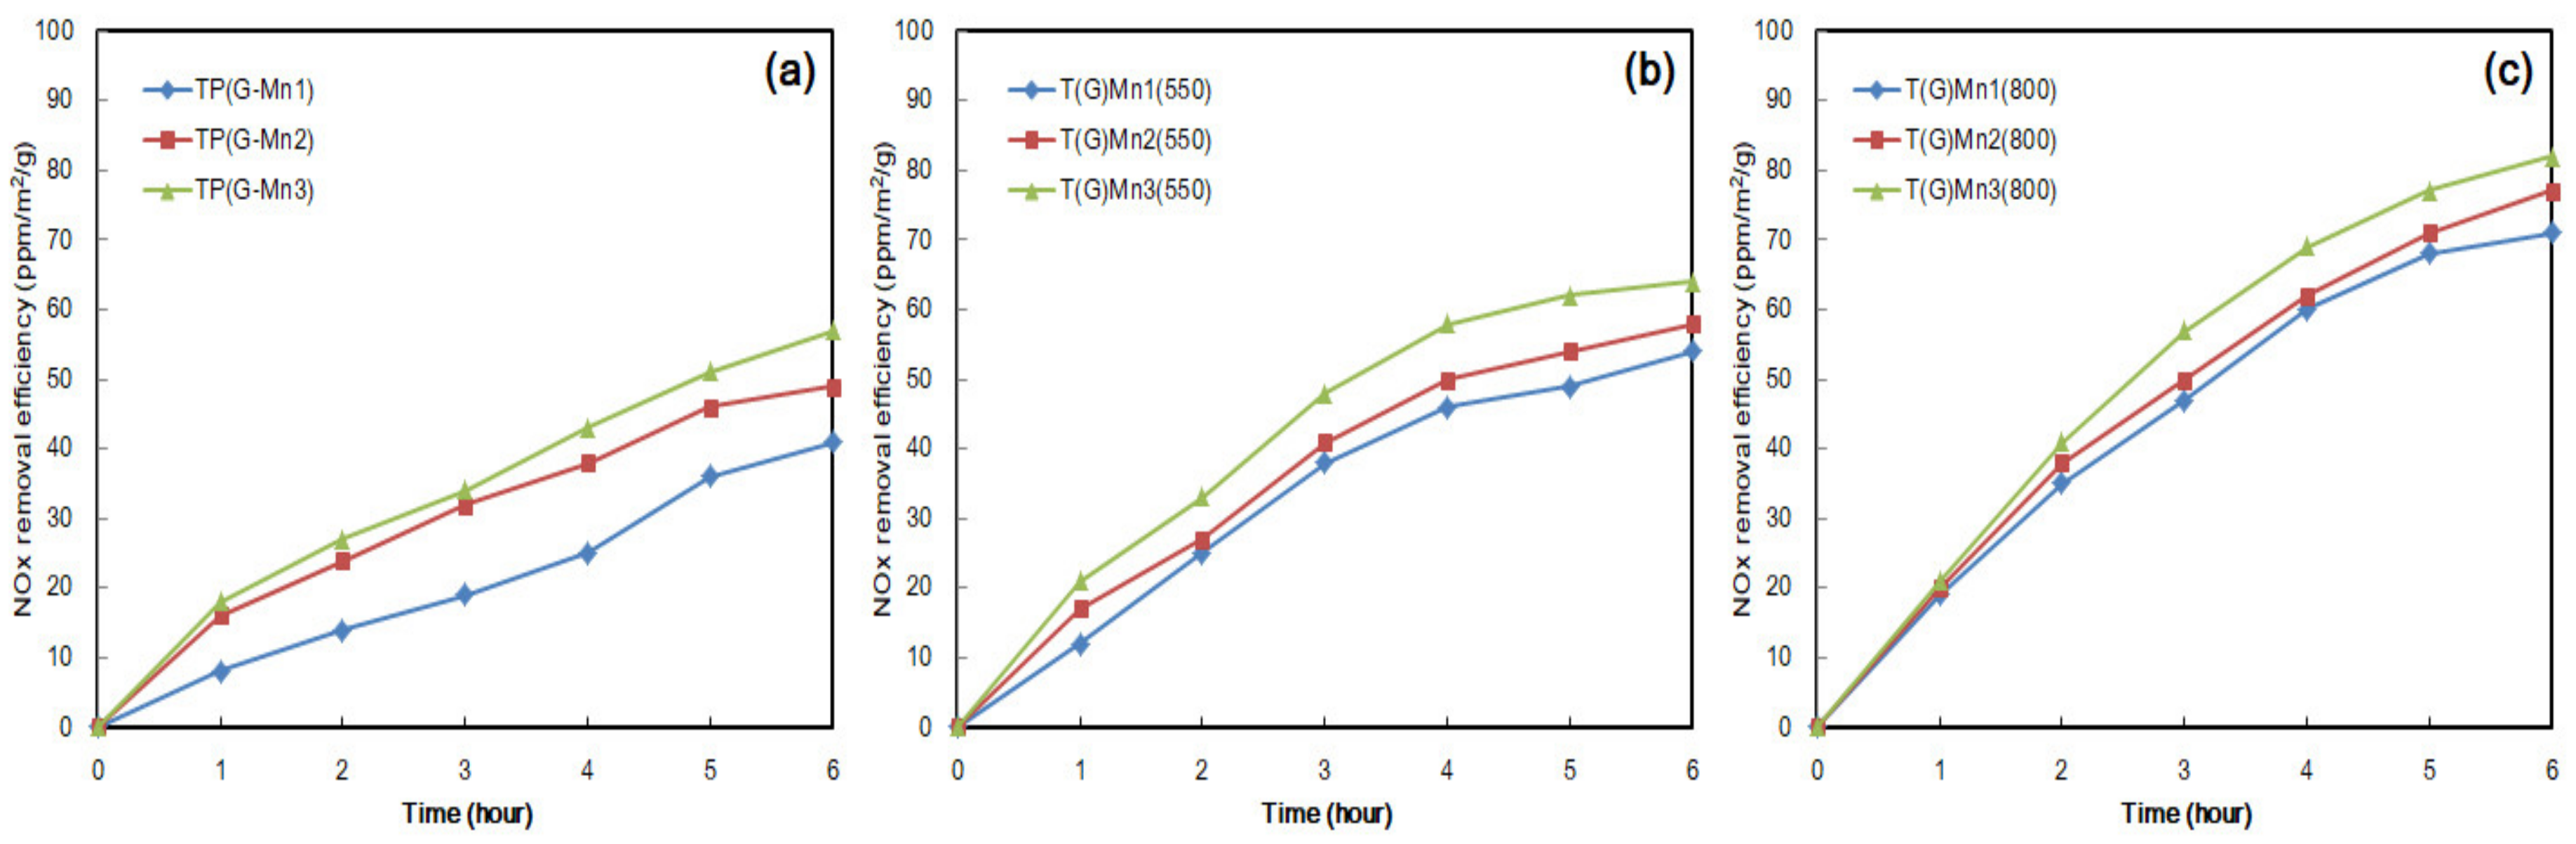
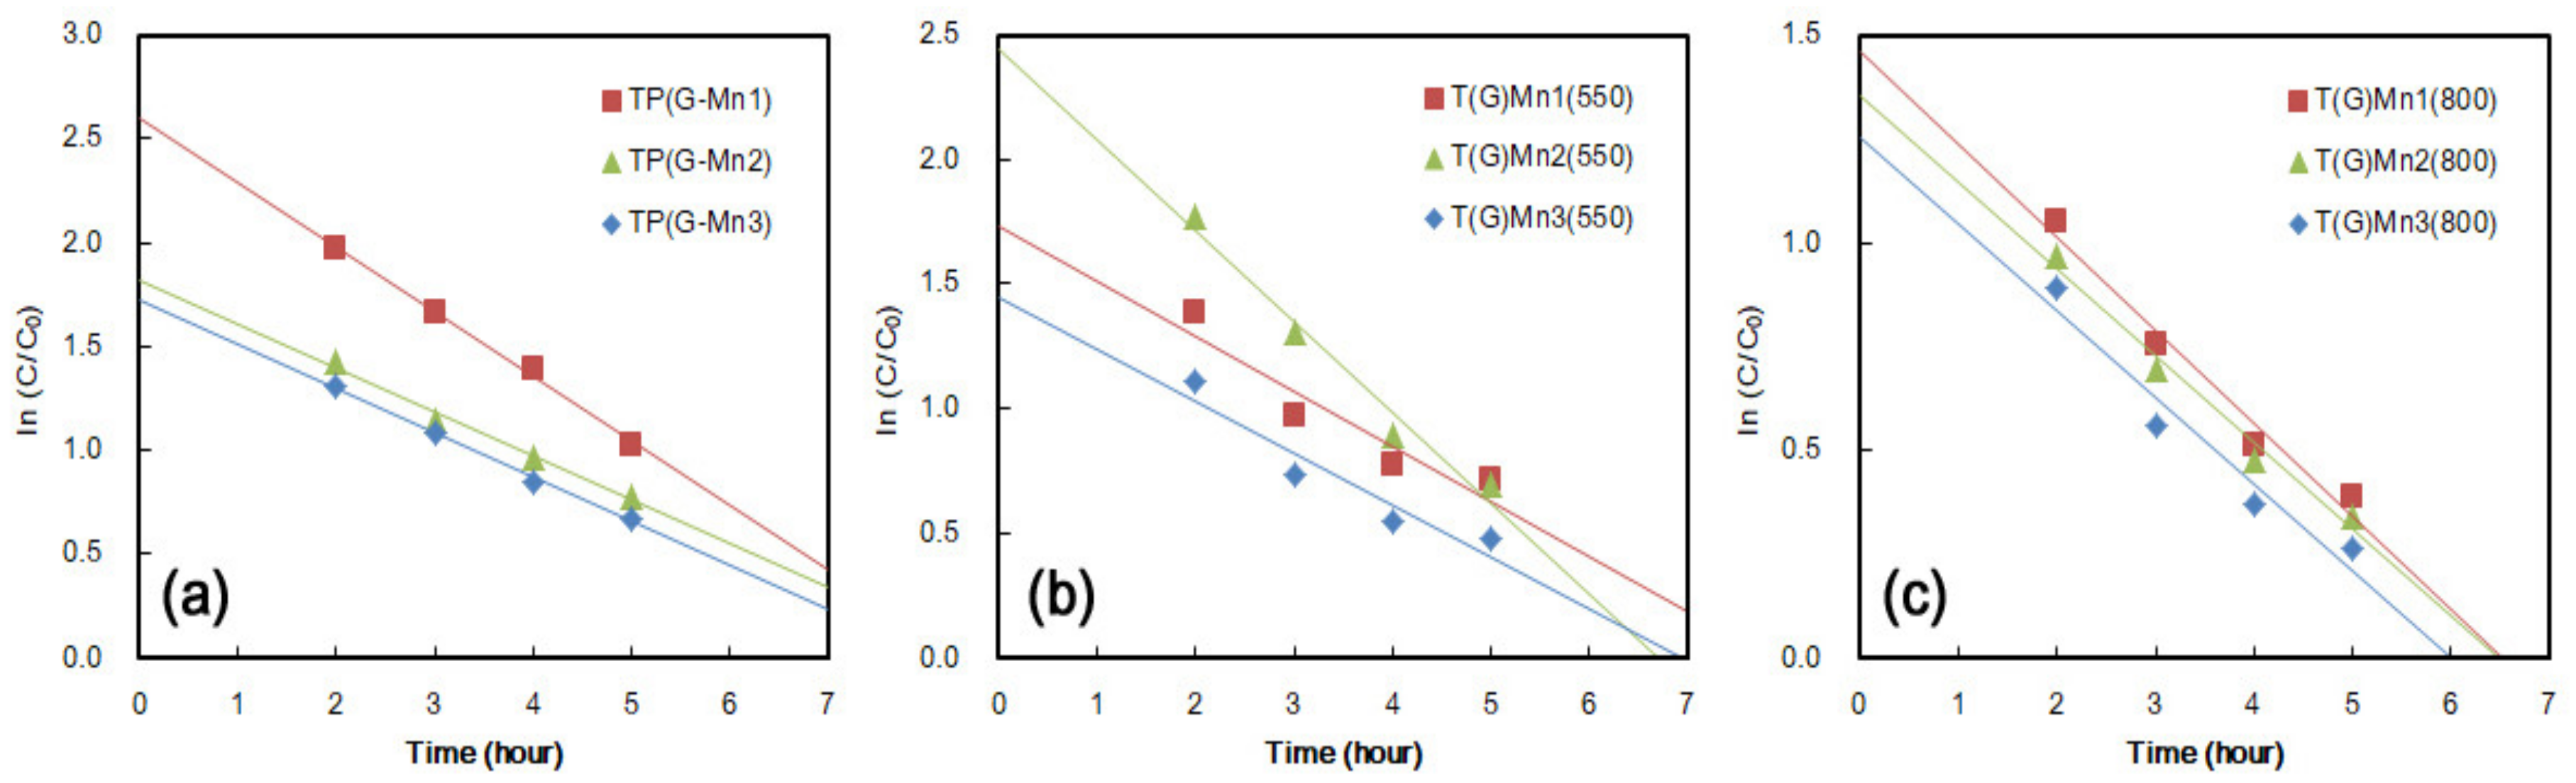
3.4.1. NOx Removal

The photocatalytic degradation NOx of the as-prepared G–Mn co-doped samples was investigated under light irradiation and presented in Figure 5. The plots showing the NOx removal efficiency against irradiation time over different photocatalysts are presented in Figure 5. The photocatalytic NOx removal efficiency takes the following order: T(G)Mn3 (800) > T(G)Mn2 (800) > T(G)Mn1 (800) > T(G)Mn3 (550) > T(G)Mn2 (500) > T(G)Mn10) > TP(G–Mn3) > TP(G–Mn2) > TP(G–Mn1), respectively. The results informed that under the similar condition for G inclusion in the samples, both Mn concentrations used for the preparation and annealing temperature influence the photocatalytic NOx removal efficiency. Typically, increasing the Mn doping amount in the samples results in enhanced NOx removal efficiency. This trend could be seen among the non-annealed and their annealed counterparts. The NOx removal efficiency of TP(G–Mn3) was found to be 1.4 times higher than TP(G–Mn1). A similar trend could be witnessed between T(G)Mn3 (550) and T(G)Mn1(550), as well as between T(G)Mn3 (800) and T(G)Mn1 (800). A more quantitative comparison for the NOx removal efficiencies between the G and Mn co-doped samples was performed using the Langmuir–Hinshelwood model in the initial time period to evaluate the reaction rates of NOx photodegradation. Clearly, the 800 °C calcined samples show higher NOx removal efficiency as compared to 550 °C annealed samples. In conjunction with the confirmation from the XRD data that 800 °C annealed samples predominantly have a rutile structure (Table 1), we conclude that rutile phase along with G and Mn co-doping enhanced the photocatalytic efficiency. It must also be noted that G and Mn co-doped samples show better NOx removal performance as compared to pristine TiO2 and G-doped TiO2 samples.
The photocatalytic degradation of NOx was found to follow mass transfer controlled first-order kinetics, as evidenced by the linear plot of ln(C/C0) versus photocatalytic reaction time t (Figure 6). We also compared the photocatalytic NOx degradation rate (mol/h) of the samples at 6 h, which followed the order: T(G)Mn3 (800) > T(G)Mn2 (800) > T(G)Mn1 (800) > T(G)Mn3 (550) > T(G)Mn2 (500) > T(G)Mn10) > TP(G–Mn3) > TP(G–Mn2) > TP(G–Mn1) with rates as 0.137, 0.128, 0.118, 0.107, 0.097, 0.095, 0.090, 0.082, and 0.068 μmol/h, respectively. It is commonly known that anatase is a better photocatalyst (compared to rutile and brookite) based on the photocatalytic application of TiO2 (with specific reference to the anatase crystalline phase) [71]. On the contrary, rutile TiO2 (r-TiO2) has scarcely reported to be active for the photodegradation of organic compounds. However, a proportionate or significant photocatalytic activity has been exhibited by samples containing mixtures of anatase and rutile [72,73]. Nevertheless, r-TiO2 possess more advantageous characteristics than anatase such as high chemical inertness, superior light scattering characteristics and lower cost [74]. In this regard, Wang et al. reported the high photocatalytic activity of r-TiO2 for the decomposition of Rhodamine-B in water under artificial solar light irradiation [75]. Bacsa and Kiwi found that the presence of r-TiO2 showed enhanced catalytic activity compared to pure anatase TiO2 towards the degradation of p-coumaric acid [76]. The r-TiO2 has also been shown to be more active than anatase in photo-decomposition of H2S [77] and photo-oxidation of H2O with Fe3+ [78]. The reproducibility of the photocatalytic activity was also tested by measuring the photocatalytic activity of the similarly prepared photocatalyst (for three times). The experimental results are represented in terms of changes in the photocatalytic performances (Figure 5). While doing so, we could estimate the stability of the photocatalyst by performing three subsequent experiments by utilizing the same amount of sample. A decrease of ~5% photocatalytic activity was witnessed after three experiments. Among the investigated samples, T(G–Mn3) (800) NW showed superior photocatalytic performance.
On perusal of literature, the Mn–graphene co-doped TiO2 NW with rutile rich phase reported in this work exhibited superior photocatalytic NOx removal performance as compared to pristine TiO2 NWs and Mn-doped TiO2 materials, and thus, signifies the importance of Mn–G simultaneous co-doping and transformation to rutile TiO2.

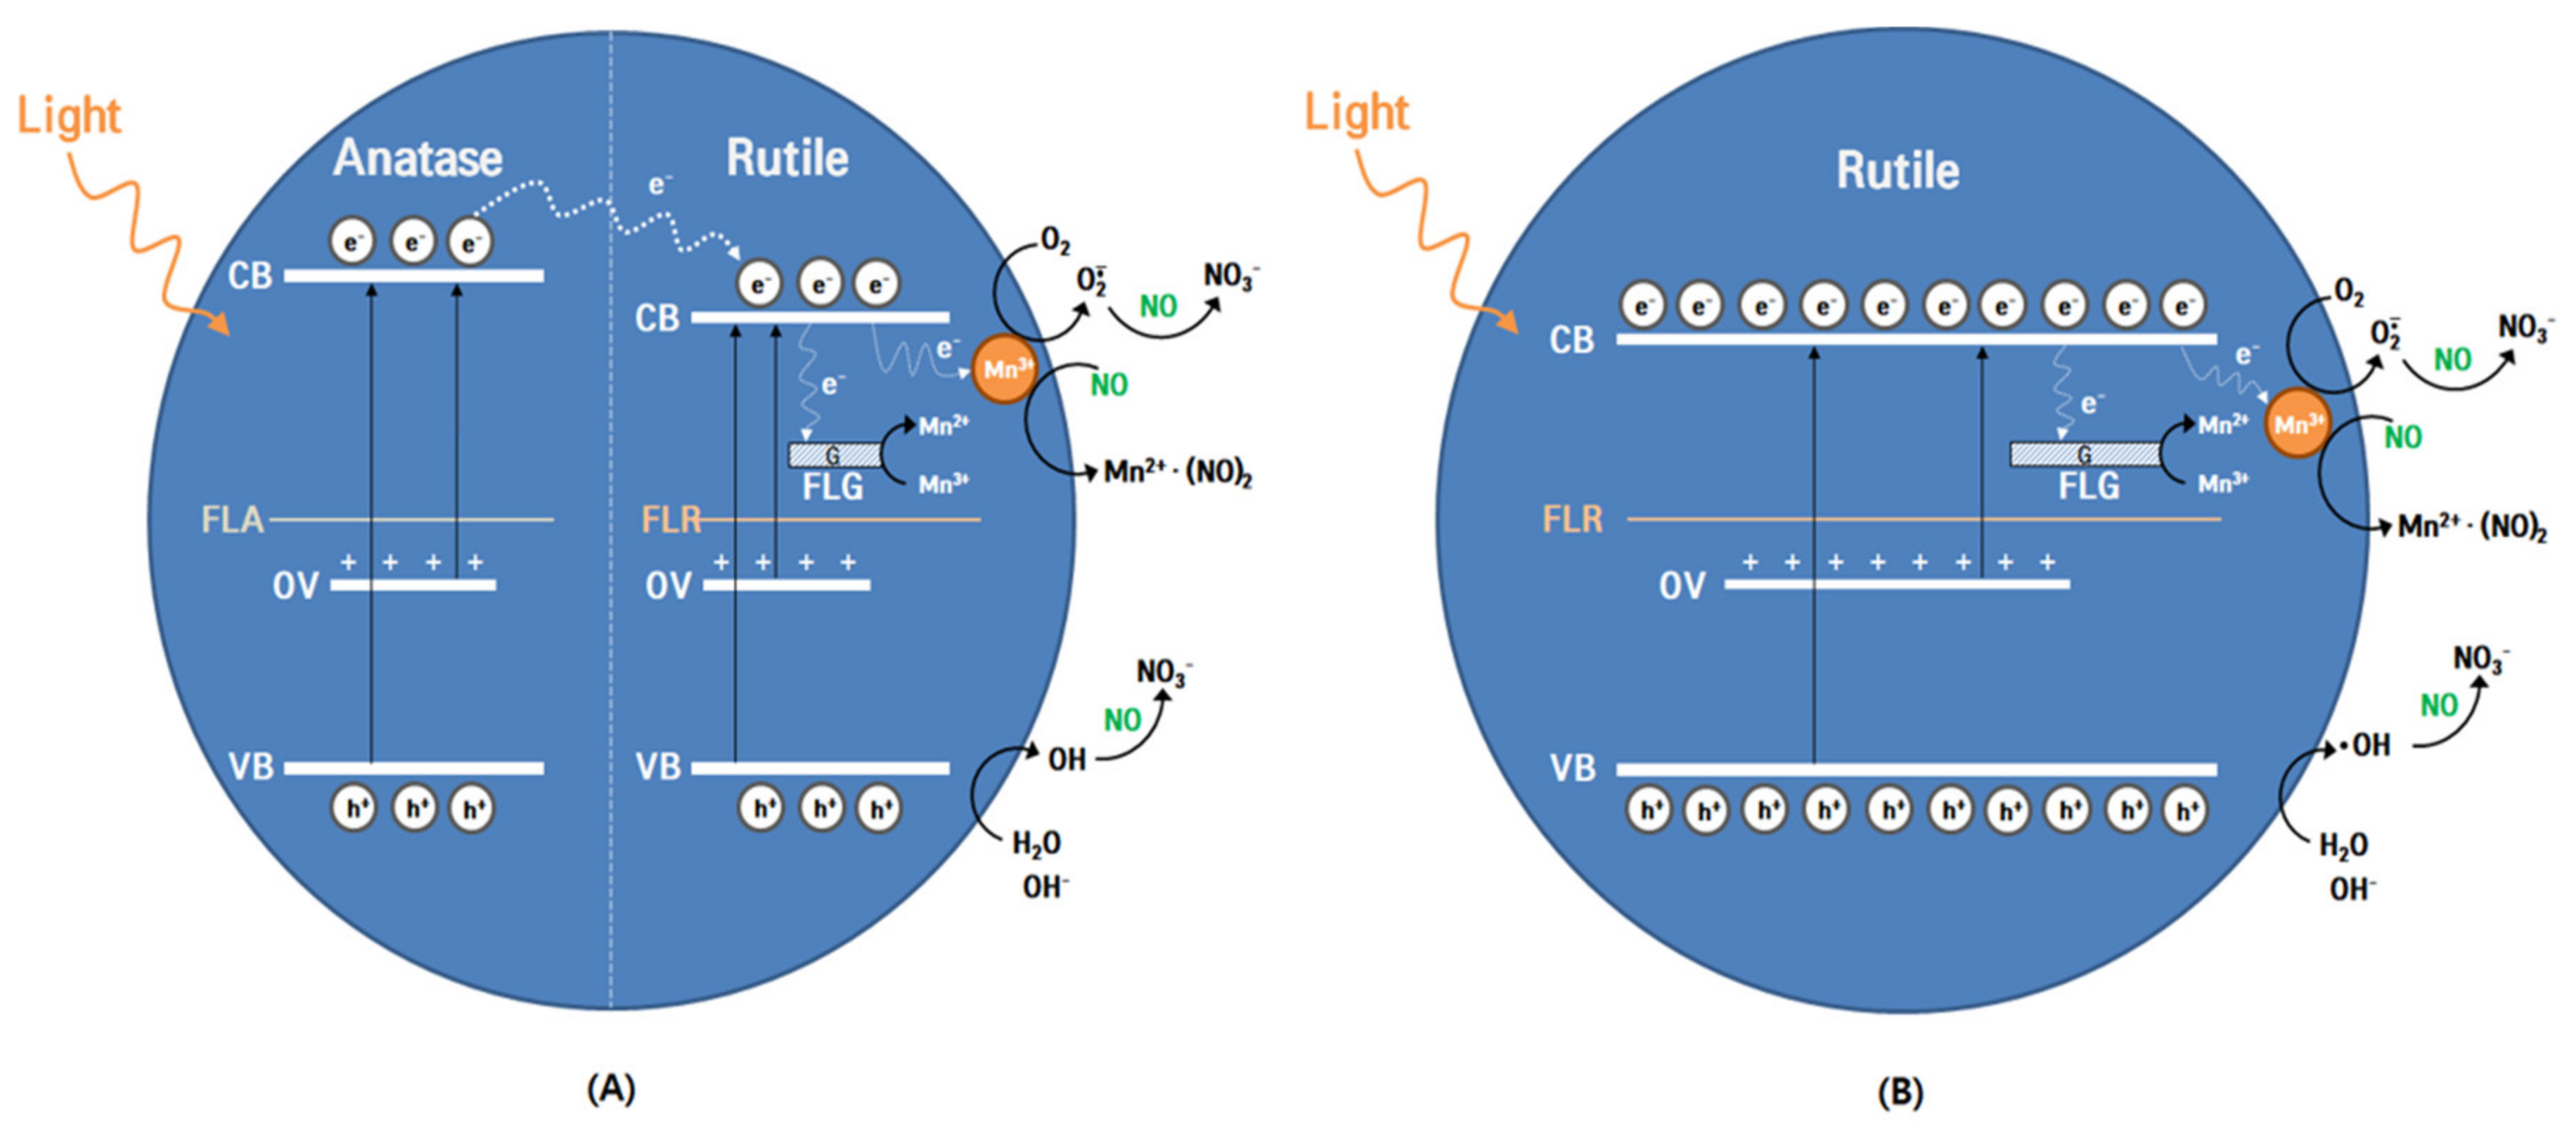
3.4.2. Plausible Mechanism

In general, we believe the formation of TiO2 (anatase and rutile mixed phase upon annealing at 550 °C or pure rutile phase upon annealing at 800 °C) with oxygen vacancy as well as G–Mn co-doping has been found to boost the photocatalytic performance under visible-light irradiation. We propose a plausible mechanism for the photocatalytic NOx removal for the G–Mn co-doped and annealed at 550 °C and 800 °C, respectively (Scheme 1A,B). Firstly, we explain the mechanism for 550 °C annealed samples. When light irradiates on surface of the T(G)–Mn samples, both the anatase and the rutile TiO2 generate holes (h+) and electrons (e) as presented in Scheme 1. Then the generated electrons are migrated from the valence band (VB) of TiO2 to conduction bands (CB) of the TiO2 anatase phase, and further the electrons are transferred to the CB of rutile TiO2. As the band gap of rutile TiO2 is smaller than anatase TiO2, the electrons from VB of rutile TiO2 could also be simultaneously excited to VB of rutile TiO2. The inter-state energy levels that are generated by oxygen vacancies (OV) can also populate the electron to the VB of anatase and rutile TiO2. The photogenerated electrons are expected to be efficiently trapped by Mn(III) sites to convert to Mn(II) states, and the Mn(III/II)-trapped electrons react towards atmospheric oxygen efficiently as the reaction can kinetically compensate the lower thermodynamic driving force for the reduction of oxygen; the NO species adsorbed at the Mn(II) sites (Mn2+(NO)2, ads) and re-oxidation of Mn2+ to Mn3+ through the formed hydroxyl radicals are expected to occur through the following reaction:
Mn2+(NO)2 + Ti − OH → Mn3+(NO)2, ads + Ti − OH
The re-oxidation of Mn2+ to Mn3+ reduces the amount of π back bonding with NO and regenerating the catalytic activities. The formation of intermediates such as O2- and OH· can dramatically influence the photocatalytic performances of TiO2, which are dependent on the recombination rate of the bound (e–h) pairs. Therefore, the existence of an electron sink within a TiO2 lattice can promote the separation of the election-hole pairs and in turn can enhance the photocatalytic performance. G is proved to be a competent material because of its highest theoretical electron mobility. The photo-generated electrons in the CB of TiO2 can rapidly transport into G owing to a more positive Fermi level of the TiO2 [24,25,79]. Thus, electrons in the CB of TiO2 could interact with adsorbed O2, generating O2−, HO2 and OH radicals via one-step or multi-step reactions, and these active species enhance the NOx oxidation processes. Also, the residual holes in the VB of TiO2 or in the Mn3+ impurity level could interact with adsorbed water to produce OH radicals or directly react with NOx to form nitrate [80]. The holes are transferred from VB of anatase TiO2 to rutile TiO2, which in turn promote the charge separation efficiently and increase the lifetime of the charge carriers. Consequently, the photocatalytic activity is enhanced. The sequence of reactions that cause photocatalytic NOx degradation are presented below in terms of the G–Mn-mediated recombination mechanism for the photo-generated electrons and holes.
Light + TiO2− → e + h+
Ti(O2)ads + e−k1 − → Ti(O2)ads
Ti − OH + h+ → Ti − OH•
Mn3+ + e−k3 − → Mn2+
Mn2+ + 2NO → Mn2+(NO)2,ads
G + + e → G(e)
Mn3+(NO)2,ads→ Mn3+ + 2 NO(g)
h+ + NO + 2H2O → NO3 + 4H+
•O2+NO → NO3
h+ + H2O → •OH
2•OH + NO → NO2 + H2O
NO2 + •OH → NO3
Mn + (NO)2 + Ti − OH• → Mn3+(NO)2,ads + Ti − OH
The difference between the reaction mechanisms for 550 °C annealed and 800 °C annealed G–Mn-co-doped TiO2 is illustrated in Scheme 1B. What is intriguing about the difference is the fact that 800 °C annealed G–Mn-co-doped TiO2 exhibited higher photocatalytic performance as compared to 550 °C annealed G–Mn-co-doped TiO2. While TiO2 exists in mixed (anatase and rutile) phases at 550 °C annealing conditions, TiO2 predominantly exists as rutile phase at 800 °C annealed G–Mn-co-doped TiO2. Besides, one must notice that Mn doping could induce striking variation in the quantity and nature of OV [81,82]. Electrons introduced by OV in rutile can be distributed at crystal sites and one OV in rutile can release two nominal electrons to the crystal lattice [82]. OV concentrations in the bulk and at the surface of TiO2 vary depending on the heat treatment and the Ti–OH; in addition, defects are expected to significantly influence the TiO2 optical absorption and photocatalytic performances [81]. We attribute the enhanced photocatalytic activity for 800 °C annealed G–Mn-co-doped TiO2 to the variations in OV concentrations and the Ti-O defects that arise because of the inclusion of Mn and G in the crystal lattice. In summary, our photocatalytic results indicate that G and Mn, whether they are introduced in the lattice or on the surface of TiO2, could promote the separation of photo-generated electron–hole pairs and enhance the photocatalytic performances.

4. Conclusions

In summary, we have carried out an extensive investigation on the microstructural, morphological, optical, and photocatalytic properties of graphene–Mn co-incorporated composites of TiO2 nanowires. The co-doping of graphene and Mn2+/Mn3+ partially replace Ti4+ ions and creates oxygen vacancies. Consequently, phase transformation and band gap tuning can be manipulated with enhanced photocatalytic properties. The photocatalytic studies confirm that the NOx degradation efficiency of rutileTiO2(G–Mn) NW is higher than their anatase-rich counterparts. Among the investigated materials, T(G)Mn3 (800) exhibited optimal results from the photocatalytic performance point of view. Thus, our results demonstrate the potential of developing structurally modified rutile TiO2 as an efficient photocatalyst. We envisage that our study will stimulate a flurry of research activities on designing schemes for robust and cheap, rutile TiO2-based photocatalytic materials.

Supplementary Materials

The following are available online at https://www.mdpi.com/2079-4991/10/3/456/s1, Figure S1: FE-SEM images of TP(G-Mn1) (b) TP(G-Mn2) and (c) TP(G-Mn3); Figure S2: TEM images of a) T(G-Mn1)(550) NW, b) T(G-Mn2)(550) NW, c) T(G-Mn3)(550) NW, d) T(G-Mn1)(800) NW, e) a) T(G-Mn2)(800) NW and f) T(G-Mn1)(800) NW; Figure S3. Core level XPS spectrum of A) T(G-Mn1)(550) NW, T(G-Mn2)(550) NW, and T(G-Mn3)(550) NW, and B) T(G-Mn1)(800) NW, T(G-Mn2)(800) NW and T(G-Mn1)(800) NW. Figure S4. Narrow scan XPS spectrum of Ti 2p, O1s and Mn 3d region for A)T(G-Mn1)(550) NW, T(G-Mn2)(550) NW, and T(G-Mn3)(550) NW. Figure S5. Narrow scan XPS spectrum of Ti2p, O1s and Mn 3d region for B) T(G-Mn1)(800) NW, T(G-Mn2)(800) NW and T(G-Mn1)(800) NW. Figure S6. Raman spectrum of T(G-Mn1)(550) NW, T(G-Mn2)(550) NW and T(G-Mn3)(550) NW. Figure S7. Raman spectrum of T(G-Mn1)(800) NW, T(G-Mn2)(800) NW and T(G-Mn3)(800) NW. Figure S8. UV-Visible diffuse reflectance spectrum of A) T(G-Mn1)(550) NW, T(G-Mn2)(550) NW and T(G-Mn3)(550) NW and B) T(G-Mn1)(800) NW, T(G-Mn2)(800) NW and T(G-Mn3)(800) NW. Figure S9. Optical band gap determination for A) T(G-Mn1) (550) NW, T(G-Mn2) (550) NW and T(G-Mn3) (550) NW and B) T(G-Mn1) (800) NW, T(G-Mn2) (800) NW and T(G-Mn3) (800) NW.

Author Contributions

J.-C.L.–Conceptualization, experimentation, writing: A.-I.G.–Conceptualization, methodology evolution, data interpretation and writing; G.S.–Data interpretation, writing; K.-P.L.–Materials management, supervision; W.-J.K.–Supervision, logical interpretation, visualization and constructive suggestions. All authors have read and agreed to the published version of the manuscript.

Funding

This work was supported by the National Research Foundation of Korea (NRF) grant funded by the Korea government (No. NRF-2018R1A2B2003832).

Conflicts of Interest

The authors declare no conflict of interest.

References

  1. Ren, W.; Ai, Z.; Jia, F.; Zhang, L.; Fan, X.; Zou, Z. Low temperature preparation and visible light photocatalytic activity of mesoporous carbon-doped crystalline TiO2. Appl. Catal. B Environ. 2007, 69, 138–144. [Google Scholar] [CrossRef]
  2. Lee, K.; Yoon, H.; Ahn, C.; Park, J.; Jeon, S. Strategies to improve the photocatalytic activity of TiO2: 3D nanostructuring and heterostructuring with graphitic carbon nanomaterials. Nanoscale. 2019, 11, 7025–7040. [Google Scholar] [CrossRef]
  3. Schneider, J.; Matsuoka, M.; Takeuchi, M.; Zhang, J.; Horiuchi, Y.; Anpo, M.; Bahnemann, D.W. Understanding TiO2 Photocatalysis: Mechanisms and Materials. Chem. Rev. 2014, 114, 9919–9986. [Google Scholar] [CrossRef] [PubMed]
  4. Sridara, T.; Upan, J.; Saianand, G.; Tuantranont, A.; Karuwan, C.; Jakmunee, J. Non-Enzymatic Amperometric Glucose Sensor Based on Carbon Nanodots and Copper Oxide Nanocomposites Electrode. Sensors 2020, 20, 808. [Google Scholar] [CrossRef] [PubMed] [Green Version]
  5. Rashmi, M.; Padmanaban, R.; Karthikeyan, V.; Roy, V.A.L.; Gopalan, A.-I.; Saianand, G.; Kim, W.; Kannan, V. A Comparative Evaluation of Physicochemical Properties and Photocatalytic Efficiencies of Cerium Oxide and Copper Oxide Nanofluids. Catalysts 2019, 10, 34. [Google Scholar]
  6. Bui, Q.-T.; Yu, I.-K.; Gopalan, A.I.; Saianand, G.; Kim, W.; Choi, S.-H. Facile Fabrication of Metal Oxide Based Catalytic Electrodes by AC Plasma Deposition and Electrochemical Detection of Hydrogen Peroxide. Catalysts 2019, 9, 888. [Google Scholar] [CrossRef] [Green Version]
  7. Saianand, G.; Gopalan, A.-I.; Lee, J.-C.; Sathish, C.I.; Gopalakrishnan, K.; Unni, G.E.; Shanbhag, D.; Dasireddy, V.D.B.C.; Yi, J.; Xi, S.; et al. Mixed Copper/Copper-Oxide Anchored Mesoporous Fullerene Nanohybrids as Superior Electrocatalysts toward Oxygen Reduction Reaction. Small 2019. [Google Scholar] [CrossRef]
  8. Benzigar, M.R.; Joseph, S.; Saianand, G.; Gopalan, A.; Sarkar, S.; Srinivasan, S.; Park, D.H.; Kim, S.; Talapaneni, S.N.; Ramadass, K.; et al. Highly ordered iron oxide-mesoporous fullerene nanocomposites for oxygen reduction reaction and supercapacitor applications. Microporous Mesoporous Mater. 2019, 285, 21–31. [Google Scholar] [CrossRef]
  9. Sai-Anand, G.; Dubey, A.; Gopalan, A.-I.; Venkatesan, S.; Ruban, S.; Reza, K.M.; Choi, J.; Lakhi, K.S.; Xu, B.; Qiao, Q.; et al. Additive assisted morphological optimization of photoactive layer in polymer solar cells. Sol. Energy Mater. Sol. Cells 2018, 182, 246–254. [Google Scholar] [CrossRef]
  10. Xu, B.; Sai-Anand, G.; Jeong, H.-M.; Kim, S.W.; Kim, J.S.; Kwon, J.B.; Kang, S.W. Improving Air-Stability and Performance of Bulk Heterojunction Polymer Solar Cells Using Solvent Engineered Hole Selective Interlayer. Materials 2018, 11, 1143. [Google Scholar] [CrossRef] [Green Version]
  11. Xu, B.; Sai-Anand, G.; Gopalan, A.-I.; Qiao, Q.; Kang, S.-W. Improving Photovoltaic Properties of P3HT:IC60BA through the Incorporation of Small Molecules. Polymers 2018, 10, 121. [Google Scholar] [CrossRef] [PubMed] [Green Version]
  12. Jiang, Y.; Sai-Anand, G.; Xu, B.; Jae-Sung, L.; Sae-Wan, K.; Se-Hyuk, Y.; Jin-Hyuk, B.; Shin-Won, K. Enhancing the Photovoltaic Performance of Polymer Solar Cells by Manipulating Photoactive/Metal Interface. J. Nanosci. Nanotechnol. 2017, 17, 8024–8030. [Google Scholar] [CrossRef]
  13. Xu, B.; Gopalan, S.; Gopalan, A.; Muthuchamy, N.; Lee, K.; Lee, J.; Jiang, Y.; Lee, S.; Kim, S.; Kim, J.; et al. Functional solid additive modified PEDOT:PSS as an anode buffer layer for enhanced photovoltaic performance and stability in polymer solar cells. Sci. Rep. 2017, 7, 45079. [Google Scholar] [CrossRef]
  14. Lee, S.; Choi, K.; Kang, B.; Lee, J.; Kim, S.; Kwon, J.; Gopalan, S.; Bae, J.; Kim, E.; Kwon, D.; et al. Low dark current and improved detectivity of hybrid ultraviolet photodetector based on carbon-quantum-dots/zinc-oxide-nanorod composites. Org. Electron. 2016, 39, 250–257. [Google Scholar] [CrossRef]
  15. Lee, S.; Cha, S.; Choi, K.; Kang, B.; Lee, J.; Kim, S.; Kim, J.; Jeong, H.; Gopalan, S.; Kwon, D.; et al. Low Dark-Current, High Current-Gain of PVK/ZnO Nanoparticles Composite-Based UV Photodetector by PN-Heterojunction Control. Sensors 2016, 16, 74. [Google Scholar] [CrossRef] [PubMed] [Green Version]
  16. Kang, B.H.; Kim, J.S.; Lee, J.S.; Lee, S.W.; Sai-Anand, G.; Jeong, H.M.; Lee, S.H.; Kwon, D.H.; Kang, S.W. Solution Processable CdSe/ZnS Quantum Dots Light-Emitting Diodes Using ZnO Nanocrystal as Electron Transport Layer. J. Nanosci. Nanotechnol. 2015, 15, 7416–7420. [Google Scholar] [CrossRef] [PubMed]
  17. Sai-Anand, G.; Sivanesan, A.; Benzigar, M.R.; Singh, G.; Gopalan, A.-I.; Baskar, A.V.; Ilbeygi, H.; Ramadass, K.; Kambala, V.; Vinu, A. Recent Progress on the Sensing of Pathogenic Bacteria Using Advanced Nanostructures. Bull. Chem. Soc. Jpn. 2019, 92, 216–244. [Google Scholar] [CrossRef] [Green Version]
  18. Yang, J.; Zhang, X.; Liu, H.; Wang, C.; Liu, S.; Sun, P.; Wang, L.; Liu, Y. Heterostructured TiO2/WO3 porous microspheres: Preparation, characterization and photocatalytic properties. Catal. Today 2013, 201, 195–202. [Google Scholar] [CrossRef]
  19. Zhang, X.; Cui, H.; Humayun, M.; Qu, Y.; Fan, N.; Sun, X.; Jing, L. Exceptional performance of photoelectrochemical water oxidation of single-crystal rutile TiO2 nanorods dependent on the hole trapping of modified chloride. Sci. Rep. 2016, 6, 21430. [Google Scholar] [CrossRef] [Green Version]
  20. Bahrami, B.; Mabrouk, S.; Adhikari, N.; Elbohy, H.; Gurung, A.; Reza, K.M.; Pathak, R.; Chowdhury, A.H.; Saianand, G.; Yue, W.; et al. Nanoscale control of grain boundary potential barrier, dopant density and filled trap state density for higher efficiency perovskite solar cells. InfoMat 2019. [Google Scholar] [CrossRef] [Green Version]
  21. Chen, X.; Mao, S.S. Synthesis of Titanium Dioxide (TiO2) Nanomaterials. J. Nanosci. Nanotechnol. 2006, 6, 906–925. [Google Scholar] [CrossRef]
  22. Nakata, K.; Fujishima, A. TiO2 photocatalysis: Design and applications. J. Photochem. Photobiol. C Photochem. Rev. 2012, 13, 169–189. [Google Scholar] [CrossRef]
  23. Kim, S.J.; Cho, Y.K.; Seok, J.; Lee, N.S.; Son, B.; Lee, J.W.; Baik, J.M.; Lee, C.; Lee, Y.; Kim, M.H. Highly Branched RuO2 Nanoneedles on Electrospun TiO2 Nanofibers as an Efficient Electrocatalytic Platform. Acs Appl. Mater. Interfaces 2015, 7, 15321–15330. [Google Scholar] [CrossRef]
  24. Lee, J.-C.; Gopalan, A.-I.; Sai-Anand, G.; Lee, K.-P.; Kim, W.-J. Preparation of Visible Light Photocatalytic Graphene Embedded Rutile Titanium(IV) Oxide Composite Nanowires and Enhanced NOx Removal. Catalysts 2019, 9, 170. [Google Scholar] [CrossRef] [Green Version]
  25. Lee, H.-G.; Sai-Anand, G.; Komathi, S.; Gopalan, A.-I.; Kang, S.-W.; Lee, K.-P. Efficient visible-light-driven photocatalytic degradation of nitrophenol by using graphene-encapsulated TiO2 nanowires. J. Hazard. Mater. 2015, 283, 400–409. [Google Scholar] [CrossRef] [PubMed]
  26. Lee, H.-G.; Gopalan, A.-I.; Sai-Anand, G.; Kang, S.-W.; Lee, K.-P. New Heterojunction Titanium Dioxide Nanowire as Photocatalyst. J. Nanosci. Nanotechnol. 2015, 15, 7421–7425. [Google Scholar] [CrossRef]
  27. Lee, H.-G.; Gopalan, A.-I.; Sai-Anand, G.; Lee, B.-C.; Kang, S.-W.; Lee, K.-P. Facile synthesis of functionalized graphene-palladium nanoparticle incorporated multicomponent TiO2 composite nanofibers. Mater. Chem. Phys. 2015, 154, 125–136. [Google Scholar] [CrossRef]
  28. Shanmugasundaram, K.; Sai-Anand, G.; Gopalan, A.-I.; Lee, Hy.; Yeo, H.K.; Kang, S.-W.; Lee, K.-P. Direct electrochemistry of cytochrome c with three-dimensional nanoarchitectured multicomponent composite electrode and nitrite biosensing. Sens. Actuators B Chem. 2016, 228, 737–747. [Google Scholar] [CrossRef]
  29. Asahi, R.; Morikawa, T.; Irie, H.; Ohwaki, T. Nitrogen-Doped Titanium Dioxide as Visible-Light-Sensitive Photocatalyst: Designs, Developments, and Prospects. Chem. Rev. 2014, 114, 9824–9852. [Google Scholar] [CrossRef] [PubMed]
  30. Bessegato, G.G.; Cardoso, J.C.; Zanoni, M.V.B. Enhanced photoelectrocatalytic degradation of an acid dye with boron-doped TiO2 nanotube anodes. Catal. Today 2015, 240, 100–106. [Google Scholar] [CrossRef]
  31. Cavalcante, R.P.; Dantas, R.F.; Bayarri, B.; González, O.; Giménez, J.; Esplugas, S.; Juniora, A.M. Synthesis and characterization of B-doped TiO2 and their performance for the degradation of metoprolol. Catal. Today 2015, 252, 27–34. [Google Scholar] [CrossRef]
  32. Kumar, S.G.; Devi, L.G. Review on Modified TiO2 Photocatalysis under UV/Visible Light: Selected Results and Related Mechanisms on Interfacial Charge Carrier Transfer Dynamics. J. Phys. Chem. A 2011, 115, 13211–13241. [Google Scholar] [CrossRef] [PubMed]
  33. Chen, X.; Burda, C. The Electronic Origin of the Visible-Light Absorption Properties of C-, N- and S-Doped TiO2 Nanomaterials. J. Am. Chem. Soc. 2008, 130, 5018–5019. [Google Scholar] [CrossRef] [PubMed]
  34. Asahi, R.; Morikawa, T.; Ohwaki, T.; Aoki, K.; Taga, Y. Visible-Light Photocatalysis in Nitrogen-Doped Titanium Oxides. Science 2001, 293, 269–271. [Google Scholar] [CrossRef] [PubMed]
  35. Batzill, M.; Morales, E.H.; Diebold, U. Influence of Nitrogen Doping on the Defect Formation and Surface Properties of ${\mathrm{TiO}}_{2}$ Rutile and Anatase. Phys. Rev. Lett. 2006, 96, 026103. [Google Scholar] [CrossRef] [PubMed]
  36. Thunkhamrak, C.; Chuntib, P.; Ounnunkad, K.; Banet, P.; Aubert, P.-H.; Saianand, G.; Gopalan, A.-I.; Jakmunee, J. Highly sensitive voltammetric immunosensor for the detection of prostate specific antigen based on silver nanoprobe assisted graphene oxide modified screen printed carbon electrode. Talanta 2020, 208, 120389. [Google Scholar] [CrossRef]
  37. Gopalan, A.; Komathi, S.; Muthuchamy, N.; Lee, K.; Whitcombe, M.J.; Dhana, L.; Sai-Anan, G. Functionalized conjugated polymers for sensing and molecular imprinting applications. Prog. Polym. Sci. 2019, 88, 1–129. [Google Scholar]
  38. Bhatia, V.; Malekshoar, G.; Dhir, A.; Ray, A.K. Enhanced photocatalytic degradation of atenolol using graphene TiO2 composite. J. Photochem. Photobiol. A Chem. 2017, 332, 182–187. [Google Scholar] [CrossRef]
  39. Jiang, G.; Lin, Z.; Chen, C.; Zhu, L.; Chang, Q.; Wang, N.; Wei, W.; Tang, H. TiO2 nanoparticles assembled on graphene oxide nanosheets with high photocatalytic activity for removal of pollutants. Carbon 2011, 49, 2693–2701. [Google Scholar] [CrossRef]
  40. Pan, X.; Zhao, Y.; Liu, S.; Korzeniewski, C.L.; Wang, S.; Fan, Z. Comparing Graphene-TiO2 Nanowire and Graphene-TiO2 Nanoparticle Composite Photocatalysts. ACS Appl. Mater. Interfaces 2012, 4, 3944–3950. [Google Scholar] [CrossRef]
  41. Nallal, M.; Anantha Iyengar, G.; Pill-Lee, K. New Titanium Dioxide-Based Heterojunction Nanohybrid for Highly Selective Photoelectrochemical–Electrochemical Dual-Mode Sensors. ACS Appl. Mater. Interfaces 2017, 9, 37166–37183. [Google Scholar] [CrossRef] [PubMed]
  42. Atchudan, R.; Jebakumar Immanuel Edison, T.N.; Perumal, S.; Karthikeyan, D.; Lee, Y.R. Effective photocatalytic degradation of anthropogenic dyes using graphene oxide grafting titanium dioxide nanoparticles under UV-light irradiation. J. Photochem. Photobiol. A Chem. 2017, 333, 92–104. [Google Scholar] [CrossRef]
  43. Xing, M.; Li, X.; Zhang, J. Synergistic effect on the visible light activity of Ti3+ doped TiO2 nanorods/boron doped graphene composite. Sci. Rep. 2014, 4, 5493. [Google Scholar] [CrossRef] [PubMed]
  44. Tang, B.; Chen, H.; Peng, H.; Wang, Z.; Huang, W. Graphene Modified TiO2 Composite Photocatalysts: Mechanism, Progress and Perspective. Nanomaterials 2018, 8, 105. [Google Scholar] [CrossRef] [Green Version]
  45. Patil, S.B.; Basavarajappa, P.S.; Ganganagappa, N.; Jyothi, M.S.; Raghu, A.V.; Reddy, K.R. Recent advances in non-metals-doped TiO2 nanostructured photocatalysts for visible-light driven hydrogen production, CO2 reduction and air purification. Int. J. Hydrog. Energy 2019, 44, 13022–13039. [Google Scholar] [CrossRef]
  46. Ismael, M. Highly effective ruthenium-doped TiO2 nanoparticles photocatalyst for visible-light-driven photocatalytic hydrogen production. New J. Chem. 2019, 43, 9596–9605. [Google Scholar] [CrossRef]
  47. Devi, L.G.; Kottam, N.; Murthy, B.N.; Kumar, S.G. Enhanced photocatalytic activity of transition metal ions Mn2+, Ni2+ and Zn2+ doped polycrystalline titania for the degradation of Aniline Blue under UV/solar light. J. Mol. Catal. A Chem. 2010, 328, 44–52. [Google Scholar] [CrossRef]
  48. Shao, G. Electronic Structures of Manganese-Doped Rutile TiO2 from First Principles. J. Phys. Chem. C 2008, 112, 18677–18685. [Google Scholar] [CrossRef]
  49. Wei, F.; Ni, L.; Cui, P. Preparation and characterization of N–S-codoped TiO2 photocatalyst and its photocatalytic activity. J. Hazard. Mater. 2008, 156, 135–140. [Google Scholar] [CrossRef]
  50. Zhang, S.; Song, L. Preparation of visible-light-active carbon and nitrogen codoped titanium dioxide photocatalysts with the assistance of aniline. Catal. Commun. 2009, 10, 1725–1729. [Google Scholar] [CrossRef]
  51. Song, K.; Zhou, J.; Bao, J.; Feng, Y. Photocatalytic Activity of (Copper, Nitrogen)-Codoped Titanium Dioxide Nanoparticles. J. Am. Ceram. Soc. 2008, 91, 1369–1371. [Google Scholar] [CrossRef]
  52. Sun, X.; Liu, H.; Dong, J.; Wei, J.; Zhang, Y. Preparation and Characterization of Ce/N-Codoped TiO2 Particles for Production of H2 by Photocatalytic Splitting Water Under Visible Light. Catal. Lett. 2010, 135, 219–225. [Google Scholar] [CrossRef]
  53. Biswas, S.K.; Pathak, A.; Pramanik, N.K.; Dhak, D.; Pramanik, P. Codoped Cr and W rutile nanosized powders obtained by pyrolysis of triethanolamine complexes. Ceram. Int. 2008, 34, 1875–1883. [Google Scholar] [CrossRef]
  54. Feng, Z.; Kaiming, L. Preparation of Ce4+, Sb3+ -Codoped TiO2 Films in Electric Field Heating-Treatment. J. Rare Earths 2006, 24, 68–70. [Google Scholar] [CrossRef]
  55. Kato, H.; Kudo, A. Visible-Light-Response and Photocatalytic Activities of TiO2 and SrTiO3 Photocatalysts Codoped with Antimony and Chromium. J. Phys. Chem. B 2002, 106, 5029–5034. [Google Scholar] [CrossRef]
  56. Niishiro, R.; Kato, H.; Kudo, A. Nickel and either tantalum or niobium-codoped TiO2 and SrTiO3 photocatalysts with visible-light response for H2 or O2 evolution from aqueous solutions. Phys. Chem. Chem. Phys. 2005, 7, 2241–2245. [Google Scholar] [CrossRef] [PubMed]
  57. Singh, I.; Birajdar, B. Effective La-Na Co-Doped TiO2 Nano-Particles for Dye Adsorption: Synthesis, Characterization and Study on Adsorption Kinetics. Nanomaterials 2019, 9, 400. [Google Scholar] [CrossRef] [PubMed] [Green Version]
  58. Zhao, L.; Xie, Y.; Lin, Q.; Zheng, R.; Diao, Y. Preparation of C, N and P co-doped TiO2 and its photocatalytic activity under visible light. Funct. Mater. Lett. 2019, 12, 1950045. [Google Scholar] [CrossRef]
  59. Zhu, W.; Qiu, X.; Iancu, V.; Chen, X.-Q.; Pan, H.; Wang, W.; Dimitrijevic, N.M.; Rajh, T.; Meyer, H.M., III; Paranthaman, M.P.; et al. Band Gap Narrowing of Titanium Oxide Semiconductors by Noncompensated Anion-Cation Codoping for Enhanced Visible-Light Photoactivity. Phys. Rev. Lett. 2009, 103, 226401. [Google Scholar] [CrossRef] [Green Version]
  60. Wang, Y.; Cheng, Z.; Tan, S.; Shao, X.; Wang, B.; Hou, J.G. Characterization of Cr–N codoped anatase TiO2(001) thin films epitaxially grown on SrTiO3(001) substrate. Surf. Sci. 2013, 616, 93–99. [Google Scholar] [CrossRef]
  61. Zhengwang, C.; Lili, Z.; Shihui, D.; Xiaochuan, M.; Huanxin, J.; Junfa, Z.; Xuefeng, C.; Jin, Z.; Bing, W. Electronic properties of Cr-N codoped rutile TiO2(110) thin films. Surf. Sci. 2017, 666, 84–89. [Google Scholar]
  62. Li, H.; Yu, Q.; Huang, Y.; Yu, C.; Li, R.; Wang, J.; Guo, F.; Jiao, S.; Gao, S.; Zhang, Y.; et al. Ultralong Rutile TiO2 Nanowire Arrays for Highly Efficient Dye-Sensitized Solar Cells. ACS Appl. Mater. Interfaces 2016, 8, 13384–13391. [Google Scholar] [CrossRef] [PubMed]
  63. Di Valentin, C.; Pacchioni, G.; Selloni, A. Reduced and n-Type Doped TiO2: Nature of Ti3+ Species. J. Phys. Chem. C 2009, 113, 20543–20552. [Google Scholar] [CrossRef]
  64. Wetchakun, N.; Incessungvorn, B.; Wetchakun, K.; Phanichphant, S. Influence of calcination temperature on anatase to rutile phase transformation in TiO2 nanoparticles synthesized by the modified sol–gel method. Mater. Lett. 2012, 82, 195–198. [Google Scholar] [CrossRef]
  65. Pal, M.; García Serrano, J.; Santiago, P.; Pal, U. Size-Controlled Synthesis of Spherical TiO2 Nanoparticles:  Morphology, Crystallization, and Phase Transition. J. Phys. Chem. C 2007, 111, 96–102. [Google Scholar] [CrossRef]
  66. Shannon, R.D. Revised effective ionic radii and systematic studies of interatomic distances in halides and chalcogenides. Acta Crystallogr. Sect. A 1976, 32, 751–767. [Google Scholar] [CrossRef]
  67. Lin, C.Y.W.; Channei, D.; Koshy, P.; Nakaruk, A.; Sorrell, C.C. Multivalent Mn-doped TiO2 thin films. Phys. E Low-Dimens. Syst. Nanostructures 2012, 44, 1969–1972. [Google Scholar] [CrossRef]
  68. Hanaor, D.A.H.; Sorrell, C.C. Review of the anatase to rutile phase transformation. J. Mater. Sci. 2011, 46, 855–874. [Google Scholar] [CrossRef] [Green Version]
  69. Iida, Y.; Ozaki, S. Grain Growth and Phase Transformation of Titanium Oxide During Calcination. J. Am. Ceram. Soc. 1961, 44, 120–127. [Google Scholar] [CrossRef]
  70. Reidy, D.J.; Holmes, J.D.; Nagle, C.; Morris, M.A. A highly thermally stable anatase phase prepared by doping with zirconia and silica coupled to a mesoporous type synthesis technique. J. Mater. Chem. 2005, 15, 3494–3500. [Google Scholar] [CrossRef]
  71. Lee, B.I.; Wang, X.; Bhave, R.; Hu, M. Synthesis of brookite TiO2 nanoparticles by ambient condition sol process. Mater. Lett. 2006, 60, 1179–1183. [Google Scholar] [CrossRef]
  72. Jing, L.; Li, S.; Song, S.; Xue, L.; Fu, H. Investigation on the electron transfer between anatase and rutile in nano-sized TiO2 by means of surface photovoltage technique and its effects on the photocatalytic activity. Sol. Energy Mater. Sol. Cells 2008, 92, 1030–1036. [Google Scholar] [CrossRef]
  73. Bersani, D.; Antonioli, G.; Lottici, P.P.; Lopez, T. Raman study of nanosized titania prepared by sol–gel route. J. Non-Cryst. Solids 1998, 232, 175–181. [Google Scholar] [CrossRef]
  74. Kominami, H.; Kato, J.; Murakami, S.; Kera, Y.; Inoue, M.; Inui, T.; Ohtani, B. Synthesis of titanium(IV) oxide of ultra-high photocatalytic activity: High-temperature hydrolysis of titanium alkoxides with water liberated homogeneously from solvent alcohols. J. Mol. Catal. A Chem. 1999, 144, 165–171. [Google Scholar] [CrossRef] [Green Version]
  75. Bacsa, R.R.; Kiwi, J. Effect of rutile phase on the photocatalytic properties of nanocrystalline titania during the degradation of p-coumaric acid. Appl. Catal. B Environ. 1998, 16, 19–29. [Google Scholar] [CrossRef]
  76. Wang, Y.; Zhang, L.; Deng, K.; Chen, X.; Zou, Z. Low Temperature Synthesis and Photocatalytic Activity of Rutile TiO2 Nanorod Superstructures. J. Phys. Chem. C 2007, 111, 2709–2714. [Google Scholar] [CrossRef]
  77. Beck, D.D.; Siegel, R.W. The dissociative adsorption of hydrogen sulfide over nanophase titanium dioxide. J. Mater. Res. 1992, 7, 2840–2845. [Google Scholar] [CrossRef]
  78. Ohno, T.; Haga, D.; Fujihara, K.; Kaizaki, K.; Matsumura, M. Unique Effects of Iron(III) Ions on Photocatalytic and Photoelectrochemical Properties of Titanium Dioxide. J. Phys. Chem. B 1997, 101, 6415–6419. [Google Scholar] [CrossRef]
  79. Bointon, T.H.; Jones, G.F.; De Sanctis, A.; Hill-Pearce, R.; Craciun, M.F.; Russo, S. Large-area functionalized CVD graphene for work function matched transparent electrodes. Sci. Rep. 2015, 5, 16464. [Google Scholar] [CrossRef] [Green Version]
  80. Li, G.; Zhang, D.; Yu, J.C.; Leung, M.K.H. An Efficient Bismuth Tungstate Visible-Light-Driven Photocatalyst for Breaking Down Nitric Oxide. Environ. Sci. Technol. 2010, 44, 4276–4281. [Google Scholar] [CrossRef]
  81. Amore Bonapasta, A.; Filippone, F.; Mattioli, G.; Alippi, P. Oxygen vacancies and OH species in rutile and anatase TiO2 polymorphs. Catal. Today 2009, 144, 177–182. [Google Scholar] [CrossRef]
  82. Liu, R.; Fang, L.; Hao, Y.; Chi, Y. Influence of Oxygen Vacancy Density on the Polaronic Configuration in Rutile. Materials 2018, 11, 2156. [Google Scholar] [CrossRef] [PubMed] [Green Version]
Figure 1. X-ray diffraction patterns of (a) T(G–Mn1)(550) NW, T(G–Mn2)(550) NW, and T(G–Mn3)(550) NW; and (b) T(G–Mn1)(800) NW, T(G–Mn2)(800) NW, and T(G–Mn1)(800) NW.
Nanomaterials 10 00456 g001
Figure 2. FE-SEM images of (a) T(G–Mn1)(550) NW, (b) T(G–Mn2)(550) NW, (c) T(G–Mn3)(550) NW, (d) T(G–Mn1)(800) NW, (e) (a) T(G–Mn2)(800) NW, and (f) T(G–Mn1)(800) NW.
Nanomaterials 10 00456 g002
Figure 3. HR-TEM images of (a) T(G–Mn1)(550) NW, (b) T(G–Mn2)(550) NW, (c) T(G–Mn3)(550) NW, (d) T(G–Mn1)(800) NW, (e) (a) T(G–Mn2)(800) NW, and (f) T(G–Mn1)(800) NW showing the lattice fringes.
Nanomaterials 10 00456 g003
Figure 4. Elemental mapping for Ti, C, O, and Mn as deduced from HR-TEM images of (a) T(G–Mn1)(550) NW, (b) T(G–Mn2)(550) NW, (c) T(G–Mn3)(550) NW, (d) T(G–Mn1)(800) NW, (e) (a) T(G–Mn2)(800) NW, and (f) T(G–Mn1)(800) NW.
Nanomaterials 10 00456 g004
Figure 5. Photocatalytic NOx removal efficiency for (a) TP(G–Mn1), TP(G–Mn2) and TP(G–Mn3); (b) T(G–Mn1)(550) NW, T(G–Mn2)(550) NW, and T(G–Mn1)(550) NW; and (c) T(G–Mn1)(800) NW, T(G–Mn2)(800) NW, and T(G–Mn3)(800) NW. Photocatalytic experiments were performed three times and the results are represented in terms of error bar.
Nanomaterials 10 00456 g005
Figure 6. Kinetics of photocatalytic NOx degradation: (a) TP(G–Mn1), TP(G–Mn2) and TP(G–Mn3); (b) T(G–Mn2)(550) NW, T(G–Mn3)(550) NW, and T(G–Mn1)(550) NW; and (c) T(G–Mn1)(800) NW, T(G–Mn2)(800) NW and T(G–Mn1)(800) NW.
Nanomaterials 10 00456 g006
Scheme 1. Plausible photocatalytic NOx degradation mechanisms for (A) anatase-rutile mixed phase T(G–Mn) NW and (B) rutile T(G–Mn) NW. (h: Holes, e: Electrons, CB: Conduction band, VB: Valence band, OV: Oxygen vacancy, FLA: Forbidden level anatase, FLR: Forbidden level rutile and FLG: Forbidden level band-gap).
Nanomaterials 10 00456 sch001
Table 1. Electrospun dope compositions and product designations.
Titanium PrecursorPolymer (PVP) (g)Doping PrecursorsMnElectrospun ProductsCalcination Temperature
TIIP (g)Molecular Weight (40,000)Molecular Weight (1,300,000)Graphene (g)Designation550 °C800 °C
1.52.40.4000TPT(550)T(800)
0.0800TP(G)T(G)(550)T(G)(800)
0.0800.04TP(G-Mn1)T(G)Mn1(550)T(G)Mn1 (800)
0.0800.08TP(G-Mn2)T(G)Mn1(550)T(G)Mn2 (800)
0.0800.12TP(G-Mn3)T(G)Mn3(550)T(G)Mn3 (880)
Table 2. Summary of textural parameters (lattice parameters, mass fractions) for various sample designations obtained from XRD patterns.
Lattice Parameters Mass Fraction (%)
Sample Designationd-spacing (A)a (Å)b (Å)c (Å)Unit Cell Volume (a3)Crystallite Size (t) (nm)Anatase XARutile
XR
T(G)Mn1(550)3.5313.7803.7809.867140.9818.779.1620.84
T(G)Mn2(550)3.5313.7803.7809.867140.9824.172.7027.30
T(G)Mn3(550)-----2.58--
T(550)3.5153.7823.7829.499136.7821.090.149.86
T(G)(550)3.5183.7813.7819.495136.4315.693.766.24
T(G)Mn1(800)3.2464.6004.6004.56496.5748.120.8799.13
T(G)Mn2(800)3.2514.6004.6004.56496.57466.8Trace~100
T(G)Mn3(880)3.2514.6004.6004.56496.57429.9-100
T(800)3.2504.5944.5942.95962.45049.51.0099.0
T(G)(800)3.5074.5934.5932.95962.4231.9Trace100

