Toward Large-Scale Production of Oxidized Graphene


 ,
,  ,
, 

Abstract

1. Introduction
2. Materials and Methods
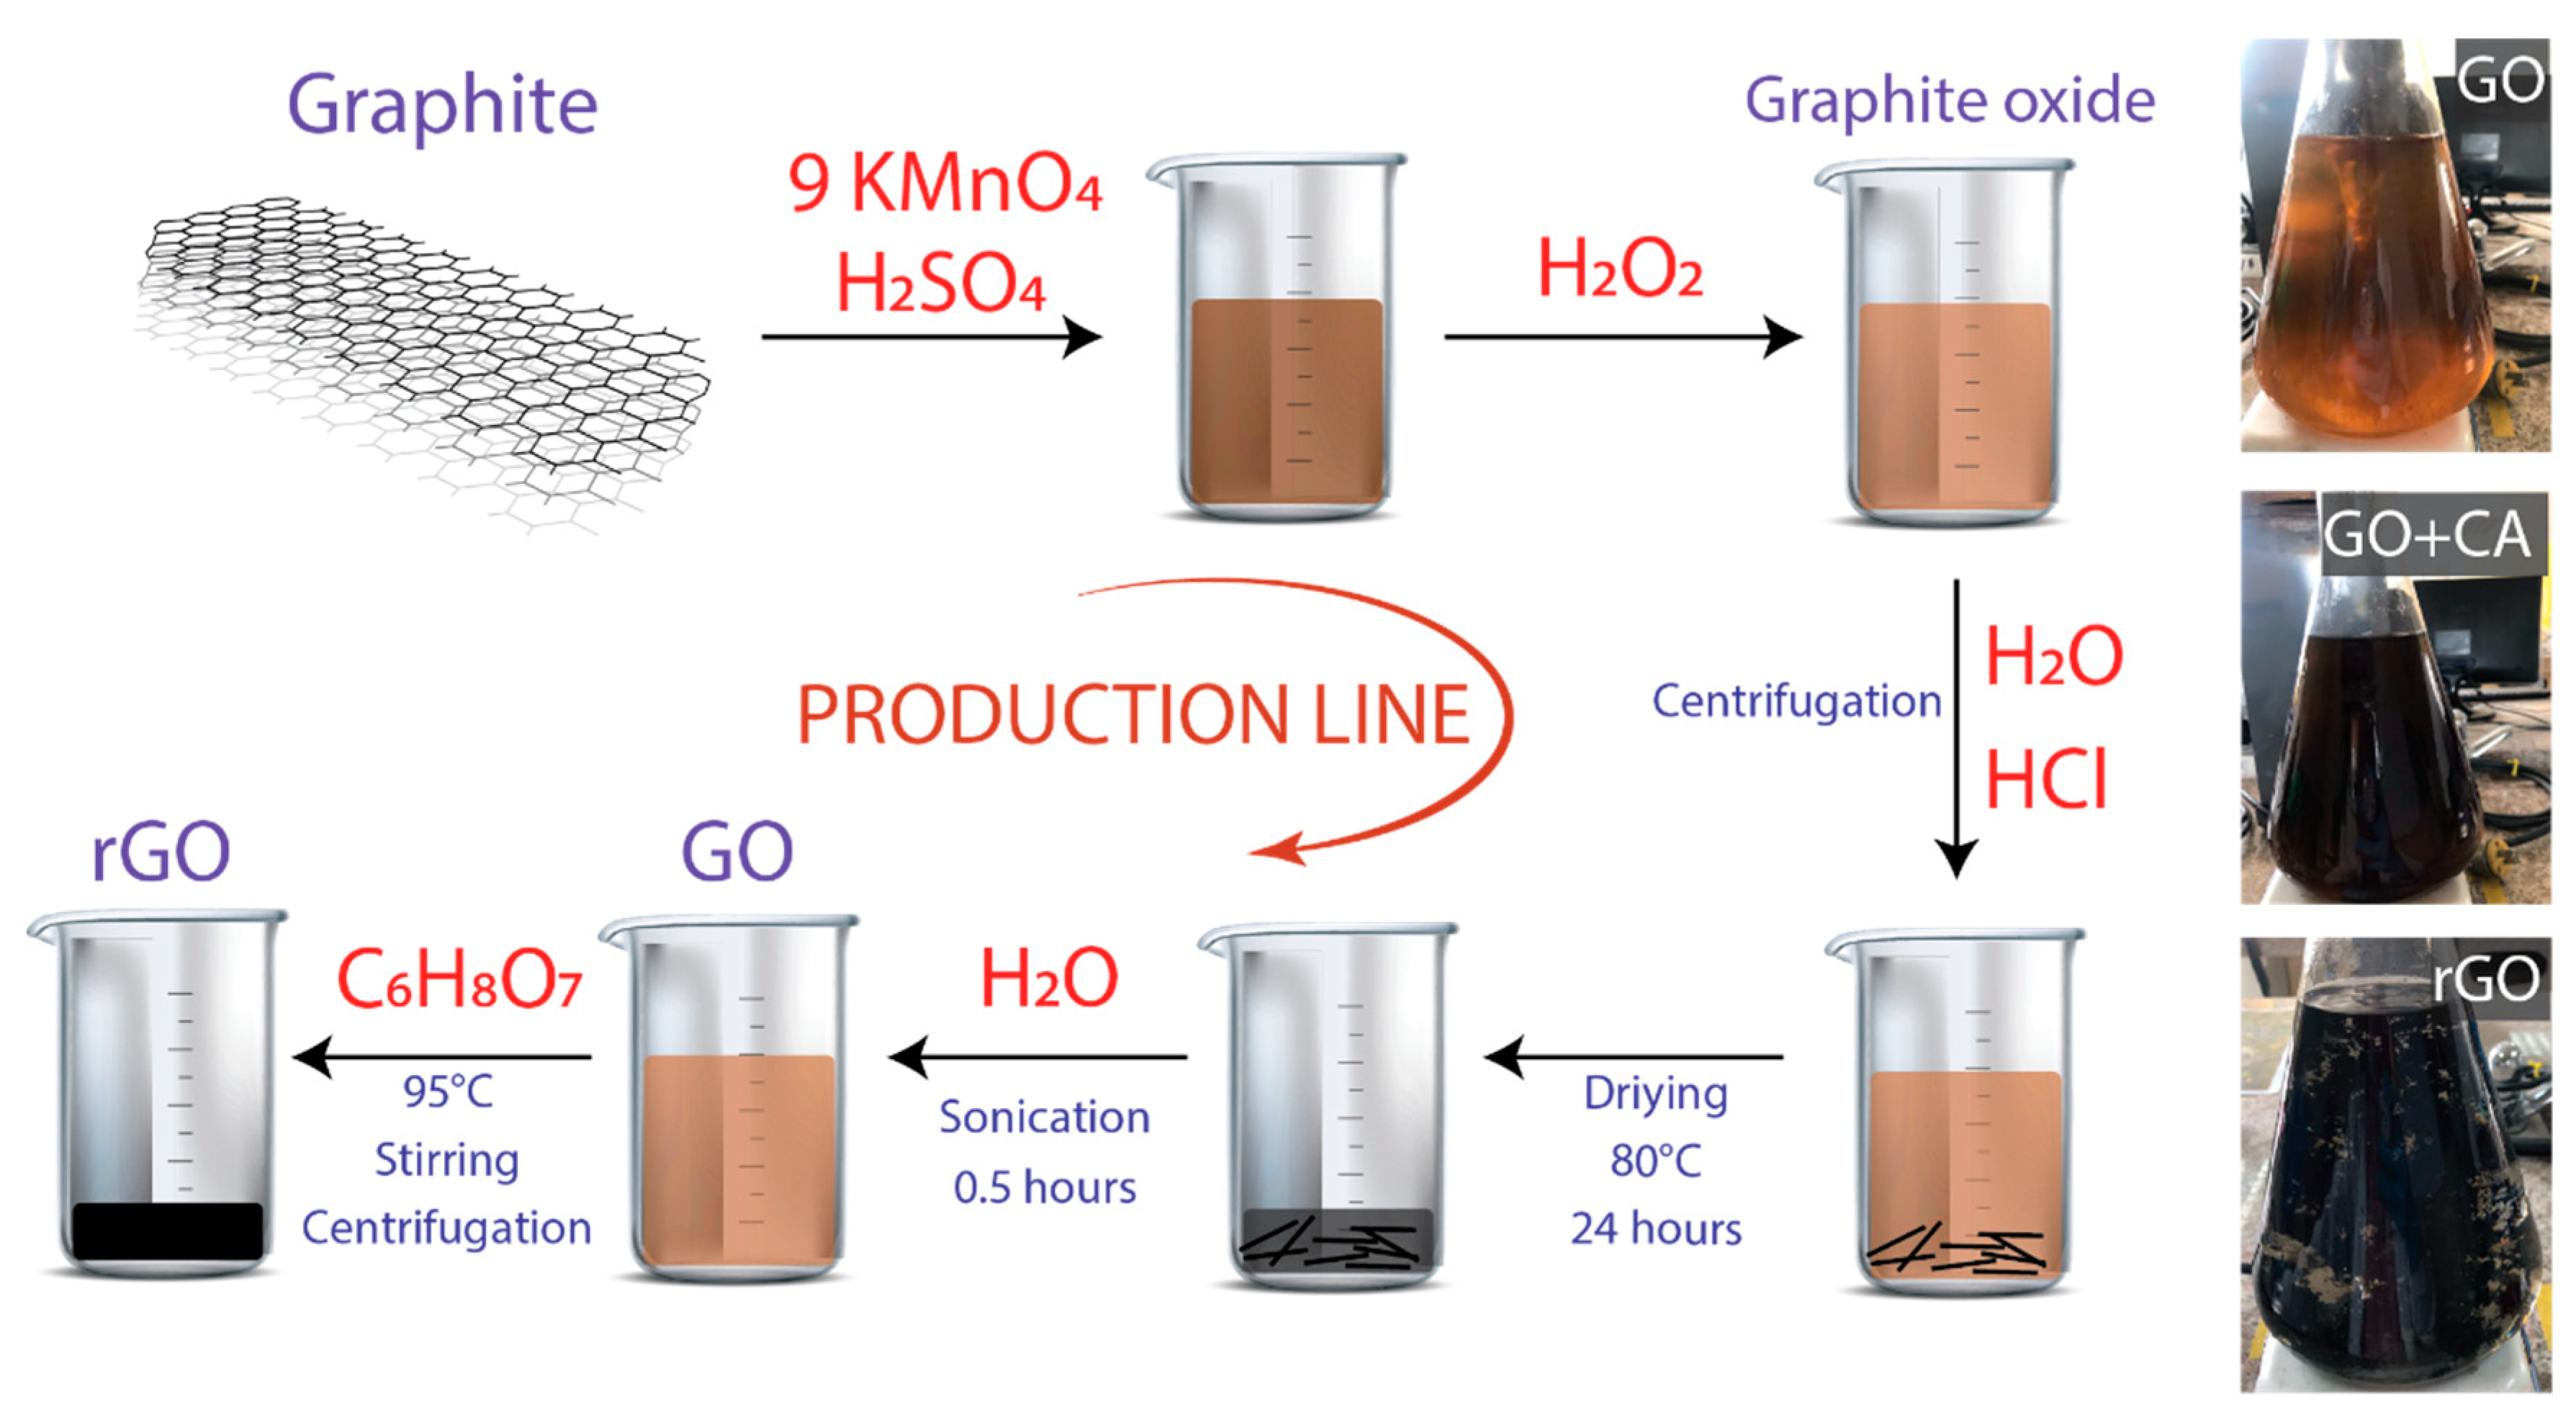
2.1. Synthesis of GO
2.2. Synthesis of rGO
2.3. Characterization
3. Results and Discussion
4. Conclusions
Supplementary Materials
Author Contributions
Funding
Acknowledgments
Conflicts of Interest
References
- Neto, A.C.; Guinea, F.; Peres, N.M.; Novoselov, K.S.; Geim, A.K. The electronic properties of graphene. Rev. Mod. Phys. 2009, 81, 109. [Google Scholar] [CrossRef]
- Coello-Fiallos, D.; Tene, T.; Guayllas, J.L.; Haro, D.; Haro, A.; Gomez, C.V. DFT comparison of structural and electronic properties of graphene and germanene: Monolayer and bilayer systems. Mater. Today Proc. 2017, 4, 6835–6841. [Google Scholar] [CrossRef]
- Sindona, A.; Pisarra, M.; Vacacela Gomez, C.; Riccardi, P.; Falcone, G.; Bellucci, S. Calibration of the fine-structure constant of graphene by time-dependent density-functional theory. Phys. Rev. B 2017, 96, 201408. [Google Scholar] [CrossRef]
- Villamagua, L.; Carini, M.; Stashans, A.; Vacacela Gomez, C. Band gap engineering of graphene through quantum confinement and edge distortions. Ric. Mat. 2016, 65, 579–584. [Google Scholar] [CrossRef]
- Vacacela Gomez, C.; Pisarra, M.; Gravina, M.; Sindona, A. Tunable plasmons in regular planar arrays of graphene nanoribbons with armchair and zigzag-shaped edges. Beilstein J. Nanotechnol. 2017, 8, 172–182. [Google Scholar] [CrossRef]
- Geim, A.K. Graphene prehistory. Phys. Scr. 2012, 146, 014003. [Google Scholar] [CrossRef]
- Reina, A.; Jia, X.; Ho, J.; Nezich, D.; Son, H.; Bulovic, V.; Kong, J. Large area, few-layer graphene films on arbitrary substrates by chemical vapor deposition. Nano Lett. 2008, 9, 30–35. [Google Scholar] [CrossRef]
- Charlier, J.C.; Gonze, X.; Michenaud, J.P. Graphite interplanar bonding: Electronic delocalization and van der Waals interaction. EPL Europhys. Lett. 1994, 28, 403. [Google Scholar] [CrossRef]
- Hernandez, Y.; Nicolosi, V.; Lotya, M.; Blighe, F.M.; Sun, Z.; De, S.; Boland, J.J. High-yield production of graphene by liquid-phase exfoliation of graphite. Nat. Nanotechnol. 2008, 3, 563. [Google Scholar] [CrossRef]
- Ciesielski, A.; Samorì, P. Graphene via sonication assisted liquid-phase exfoliation. Chem. Soc. Rev. 2014, 43, 381–398. [Google Scholar] [CrossRef]
- Zhu, Y.; Murali, S.; Cai, W.; Li, X.; Suk, J.W.; Potts, J.R.; Ruoff, R.S. Graphene and graphene oxide: Synthesis, properties, and applications. Adv. Mater. 2010, 22, 3906–3924. [Google Scholar] [CrossRef] [PubMed]
- Zhu, Y.; James, D.K.; Tour, J.M. New routes to graphene, graphene oxide and their related applications. Adv. Mater. 2012, 24, 4924–4955. [Google Scholar] [CrossRef] [PubMed]
- Gilje, S.; Han, S.; Wang, M.; Wang, K.L.; Kaner, R.B. A chemical route to graphene for device applications. Nano Lett. 2007, 7, 3394–3398. [Google Scholar] [CrossRef]
- Eftekhari, A.; Garcia, H. The necessity of structural irregularities for the chemical applications of graphene. Mater. Today Chem. 2017, 4, 1–16. [Google Scholar] [CrossRef]
- Tubón Usca, G.; Vacacela Gomez, C.; Fiallos, D.C.; Tavolaro, P.; Martino, G.; Caputi, L.S.; Tavolaro, A. Preparation of graphene oxide as biomaterials for drug adsorption. In AIP Conference Proceedings, College Park, MD, USA, 19 February 2015; American Institute of Physics: College Park, MD, USA, 2015; Volume 1646, pp. 79–86. [Google Scholar]
- Fiallos, D.C.; Vacacela Gomez, C.; Tubon Usca, G.; Pérez, D.C.; Tavolaro, P.; Martino, G.; Tavolaro, A. Removal of acridine orange from water by graphene oxide. In AIP Conference Proceedings, College Park, MD, USA, 19 February 2015; American Institute of Physics: College Park, MD, USA, 2015; Volume 1646, pp. 38–45. [Google Scholar]
- Paton, K.R.; Varrla, E.; Backes, C.; Smith, R.J.; Khan, U.; O’Neill, A.; Higgins, T. Scalable production of large quantities of defect-free few-layer graphene by shear exfoliation in liquids. Nat. Mater. 2014, 13, 624. [Google Scholar] [CrossRef]
- Vacacela Gomez, C.; Tene, T.; Guevara, M.; Tubon Usca, G.; Colcha, D.; Brito, H.; Molina, R.; Bellucci, S.; Tavolaro, A. Preparation of Few-Layer Graphene Dispersions from Hydrothermally Expanded Graphite. Appl. Sci. 2019, 9, 2539. [Google Scholar] [CrossRef]
- Tubon Usca, G.; Vacacela Gomez, C.; Guevara, M.; Tene, T.; Hernandez, J.; Molina, R.; Caputi, L.S. Zeolite-Assisted Shear Exfoliation of Graphite into Few-Layer Graphene. Crystals 2019, 9, 377. [Google Scholar] [CrossRef]
- He, T.; Dai, Q.; Huang, W.; Wang, X. Colloidal suspension of graphene oxide in ionic liquid as lubricant. Appl. Phys. A 2018, 124, 777. [Google Scholar] [CrossRef]
- Wu, T.T.; Ting, J.M. Preparation and characteristics of graphene oxide and its thin films. Surf. Coat. Technol. 2013, 231, 487–491. [Google Scholar] [CrossRef]
- Yan, J.A.; Chou, M.Y. Oxidation functional groups on graphene: Structural and electronic properties. Phys. Rev. B 2010, 82, 125403. [Google Scholar] [CrossRef]
- Vacacela Gomez, C.; Robalino, E.; Haro, D.; Tene, T.; Escudero, P.; Haro, A.; Orbe, J. Structural and electronic properties of graphene oxide for different degree of oxidation. Mater. Today Proc. 2016, 3, 796–802. [Google Scholar] [CrossRef]
- Savazzi, F.; Risplendi, F.; Mallia, G.; Harrison, N.M.; Cicero, G. Unravelling some of the structure–property relationships in graphene oxide at low degree of oxidation. J. Phys. Chem. Lett. 2018, 9, 1746–1749. [Google Scholar] [CrossRef]
- Sheng, Y.; Tang, X.; Peng, E.; Xue, J. Graphene oxide based fluorescent nanocomposites for cellular imaging. J. Mater. Chem. B 2013, 1, 512–521. [Google Scholar] [CrossRef]
- Lee, D.W.; Seo, J.W. sp2/sp3 carbon ratio in graphite oxide with different preparation times. J. Phys. Chem. C 2011, 115, 2705–2708. [Google Scholar] [CrossRef]
- Talyzin, A.V.; Mercier, G.; Klechikov, A.; Hedenström, M.; Johnels, D.; Wei, D.; Moons, E. Brodie vs Hummers graphite oxides for preparation of multi-layered materials. Carbon 2017, 115, 430–440. [Google Scholar] [CrossRef]
- Poh, H.L.; Šaněk, F.; Ambrosi, A.; Zhao, G.; Sofer, Z.; Pumera, M. Graphenes prepared by Staudenmaier, Hofmann and Hummers methods with consequent thermal exfoliation exhibit very different electrochemical properties. Nanoscale 2012, 4, 3515–3522. [Google Scholar] [CrossRef]
- William, S.; Hummers, J.R.; Offeman, R.E. Preparation of graphitic oxide. J. Am. Chem. Soc. 1958, 80, 1339. [Google Scholar]
- Marcano, D.C.; Kosynkin, D.V.; Berlin, J.M.; Sinitskii, A.; Sun, Z.; Slesarev, A.; Tour, J.M. Improved synthesis of graphene oxide. ACS Nano 2010, 4, 4806–4814. [Google Scholar] [CrossRef]
- Chen, J.; Yao, B.; Li, C.; Shi, G. An improved Hummers method for eco-friendly synthesis of graphene oxide. Carbon 2013, 64, 225–229. [Google Scholar] [CrossRef]
- Paredes, J.I.; Villar-Rodil, S.; Fernández-Merino, M.J.; Guardia, L.; Martínez-Alonso, A.; Tascon, J.M.D. Environmentally friendly approaches toward the mass production of processable graphene from graphite oxide. J. Mater. Chem. 2011, 21, 298–306. [Google Scholar] [CrossRef]
- Abdolhosseinzadeh, S.; Asgharzadeh, H.; Kim, H.S. Fast and fully-scalable synthesis of reduced graphene oxide. Sci. Rep. 2015, 5, 10160. [Google Scholar] [CrossRef] [PubMed]
- Arao, Y.; Kubouchi, M. High-rate production of few-layer graphene by high-power probe sonication. Carbon 2015, 95, 802–808. [Google Scholar] [CrossRef]
- Garino, N.; Castellino, M.; Sacco, A.; Risplendi, F.; Muñoz-Tabares, J.A.; Armandi, M.; Cicero, G. Proving the existence of Mn porphyrin-like complexes hosted in reduced graphene oxide with outstanding performance as oxygen reduction reaction catalysts. 2D Mater. 2019, 6, 045001. [Google Scholar] [CrossRef]
- Randviir, E.P.; Brownson, D.A.; Banks, C.E. A decade of graphene research: Production, applications and outlook. Mater. Today 2014, 17, 426–432. [Google Scholar] [CrossRef]
- Parvez, K.; Worsley, R.; Alieva, A.; Felten, A.; Casiraghi, C. Water-based and inkjet printable inks made by electrochemically exfoliated graphene. Carbon 2019, 149, 213–221. [Google Scholar] [CrossRef]
- Ortega-Amaya, R.; Matsumoto, Y.; Flores-Conde, A.; Pérez-Guzmán, M.A.; Ortega-López, M. In situ formation of rGO quantum dots during GO reduction via interaction with citric acid in aqueous medium. Mater. Res. Express 2016, 3, 105601. [Google Scholar] [CrossRef]
- Krishna, R.; Fernandes, D.M.; Venkataramana, E.; Dias, C.; Ventura, J.; Freire, C.; Titus, E. Improved reduction of graphene oxide. Mater. Today Proc. 2015, 2, 423–430. [Google Scholar] [CrossRef]
- Ahirwar, S.; Mallick, S.; Bahadur, D. Electrochemical method to prepare graphene quantum dots and graphene oxide quantum dots. ACS Omega 2017, 2, 8343–8353. [Google Scholar] [CrossRef]
- Xu, Y.; Bai, H.; Lu, G.; Li, C.; Shi, G. Flexible graphene films via the filtration of water-soluble noncovalent functionalized graphene sheets. J. Am. Chem. Soc. 2008, 130, 5856–5857. [Google Scholar] [CrossRef]
- Bouchareb, S.; Doufnoune, R.; Riahi, F.; Cherif-Silini, H.; Lassaad, B. Non-covalent functionalization of graphene oxide using self-assembly of silver-triphenylphosphine for bactericidal formulations. Mater. Chem. Phys. 2019, 243, 122598. [Google Scholar] [CrossRef]
- Eda, G.; Ball, J.; Mattevi, C.; Acik, M.; Artiglia, L.; Granozzi, G.; Chhowalla, M. Partially oxidized graphene as a precursor to graphene. J. Mater. Chem. 2011, 21, 11217–11223. [Google Scholar] [CrossRef]
- Babu, K.J.; Nahm, K.S.; Hwang, Y.J. A facile one-pot green synthesis of reduced graphene oxide and its composites for non-enzymatic hydrogen peroxide sensor applications. RSC Adv. 2014, 4, 7944–7951. [Google Scholar]
- McAllister, M.J.; Li, J.L.; Adamson, D.H.; Schniepp, H.C.; Abdala, A.A.; Liu, J.; Aksay, I.A. Single sheet functionalized graphene by oxidation and thermal expansion of graphite. Chem. Mater. 2007, 19, 4396–4404. [Google Scholar] [CrossRef]
- Bajpai, R.; Roy, S.; Rafiee, J.; Koratkar, N.; Misra, D.S. Graphene supported nickel nanoparticle as a viable replacement for platinum in dye sensitized solar cells. Nanoscale 2012, 4, 926–930. [Google Scholar] [CrossRef] [PubMed]
- Jaworski, S.; Wierzbicki, M.; Sawosz, E.; Jung, A.; Gielerak, G.; Biernat, J.; Stobiński, L. Graphene oxide-based nanocomposites decorated with silver nanoparticles as an antibacterial agent. Nanoscale Res. Lett. 2018, 13, 116. [Google Scholar] [CrossRef] [PubMed]
- Yin, F.; Wu, S.; Wang, Y.; Wu, L.; Yuan, P.; Wang, X. Self-assembly of mildly reduced graphene oxide monolayer for enhanced Raman scattering. J. Solid State Chem. 2016, 237, 57–63. [Google Scholar] [CrossRef]
- Perumbilavil, S.; Sankar, P.; Priya Rose, T.; Philip, R. White light Z-scan measurements of ultrafast optical nonlinearity in reduced graphene oxide nanosheets in the 400–700 nm region. Appl. Phys. Lett. 2015, 107, 051104. [Google Scholar] [CrossRef]
- Zamora-Ledezma, C.; Puech, N.; Zakri, C.; Grelet, E.; Moulton, S.E.; Wallace, G.G.; Poulin, P. Liquid crystallinity and dimensions of surfactant-stabilized sheets of reduced graphene oxide. J. Phys. Chem. Lett. 2012, 3, 2425–2430. [Google Scholar] [CrossRef]
- Walch, N.J.; Nabok, A.; Davis, F.; Higson, S.P. Characterisation of thin films of graphene–surfactant composites produced through a novel semi-automated method. Beilstein J. Nanotechnol. 2016, 7, 209–219. [Google Scholar] [CrossRef]


© 2020 by the authors. Licensee MDPI, Basel, Switzerland. This article is an open access article distributed under the terms and conditions of the Creative Commons Attribution (CC BY) license (http://creativecommons.org/licenses/by/4.0/).
Share and Cite
Tene, T.; Tubon Usca, G.; Guevara, M.; Molina, R.; Veltri, F.; Arias, M.; Caputi, L.S.; Vacacela Gomez, C. Toward Large-Scale Production of Oxidized Graphene. Nanomaterials 2020, 10, 279. https://doi.org/10.3390/nano10020279
Tene T, Tubon Usca G, Guevara M, Molina R, Veltri F, Arias M, Caputi LS, Vacacela Gomez C. Toward Large-Scale Production of Oxidized Graphene. Nanomaterials. 2020; 10(2):279. https://doi.org/10.3390/nano10020279
Chicago/Turabian StyleTene, Talia, Gabriela Tubon Usca, Marco Guevara, Raul Molina, Francesco Veltri, Melvin Arias, Lorenzo S. Caputi, and Cristian Vacacela Gomez. 2020. "Toward Large-Scale Production of Oxidized Graphene" Nanomaterials 10, no. 2: 279. https://doi.org/10.3390/nano10020279
APA StyleTene, T., Tubon Usca, G., Guevara, M., Molina, R., Veltri, F., Arias, M., Caputi, L. S., & Vacacela Gomez, C. (2020). Toward Large-Scale Production of Oxidized Graphene. Nanomaterials, 10(2), 279. https://doi.org/10.3390/nano10020279