Novel Benchtop Magnetic Particle Spectrometer for Process Monitoring of Magnetic Nanoparticle Synthesis

 , , , and
Abstract
1. Introduction
2. Materials and Methods
2.1. MPS Device
2.1.1. Excitation Path
2.1.2. Signal Acquisition and Excitation Cancellation
2.1.3. Signal Generation and Data Acquisition
2.1.4. Flow Cell
2.2. Chemicals and Samples for Calibration
2.3. Micromixer Synthesis
3. Results and Discussion
3.1. Calibration of the Benchtop MPS System by Commercial MNP Systems
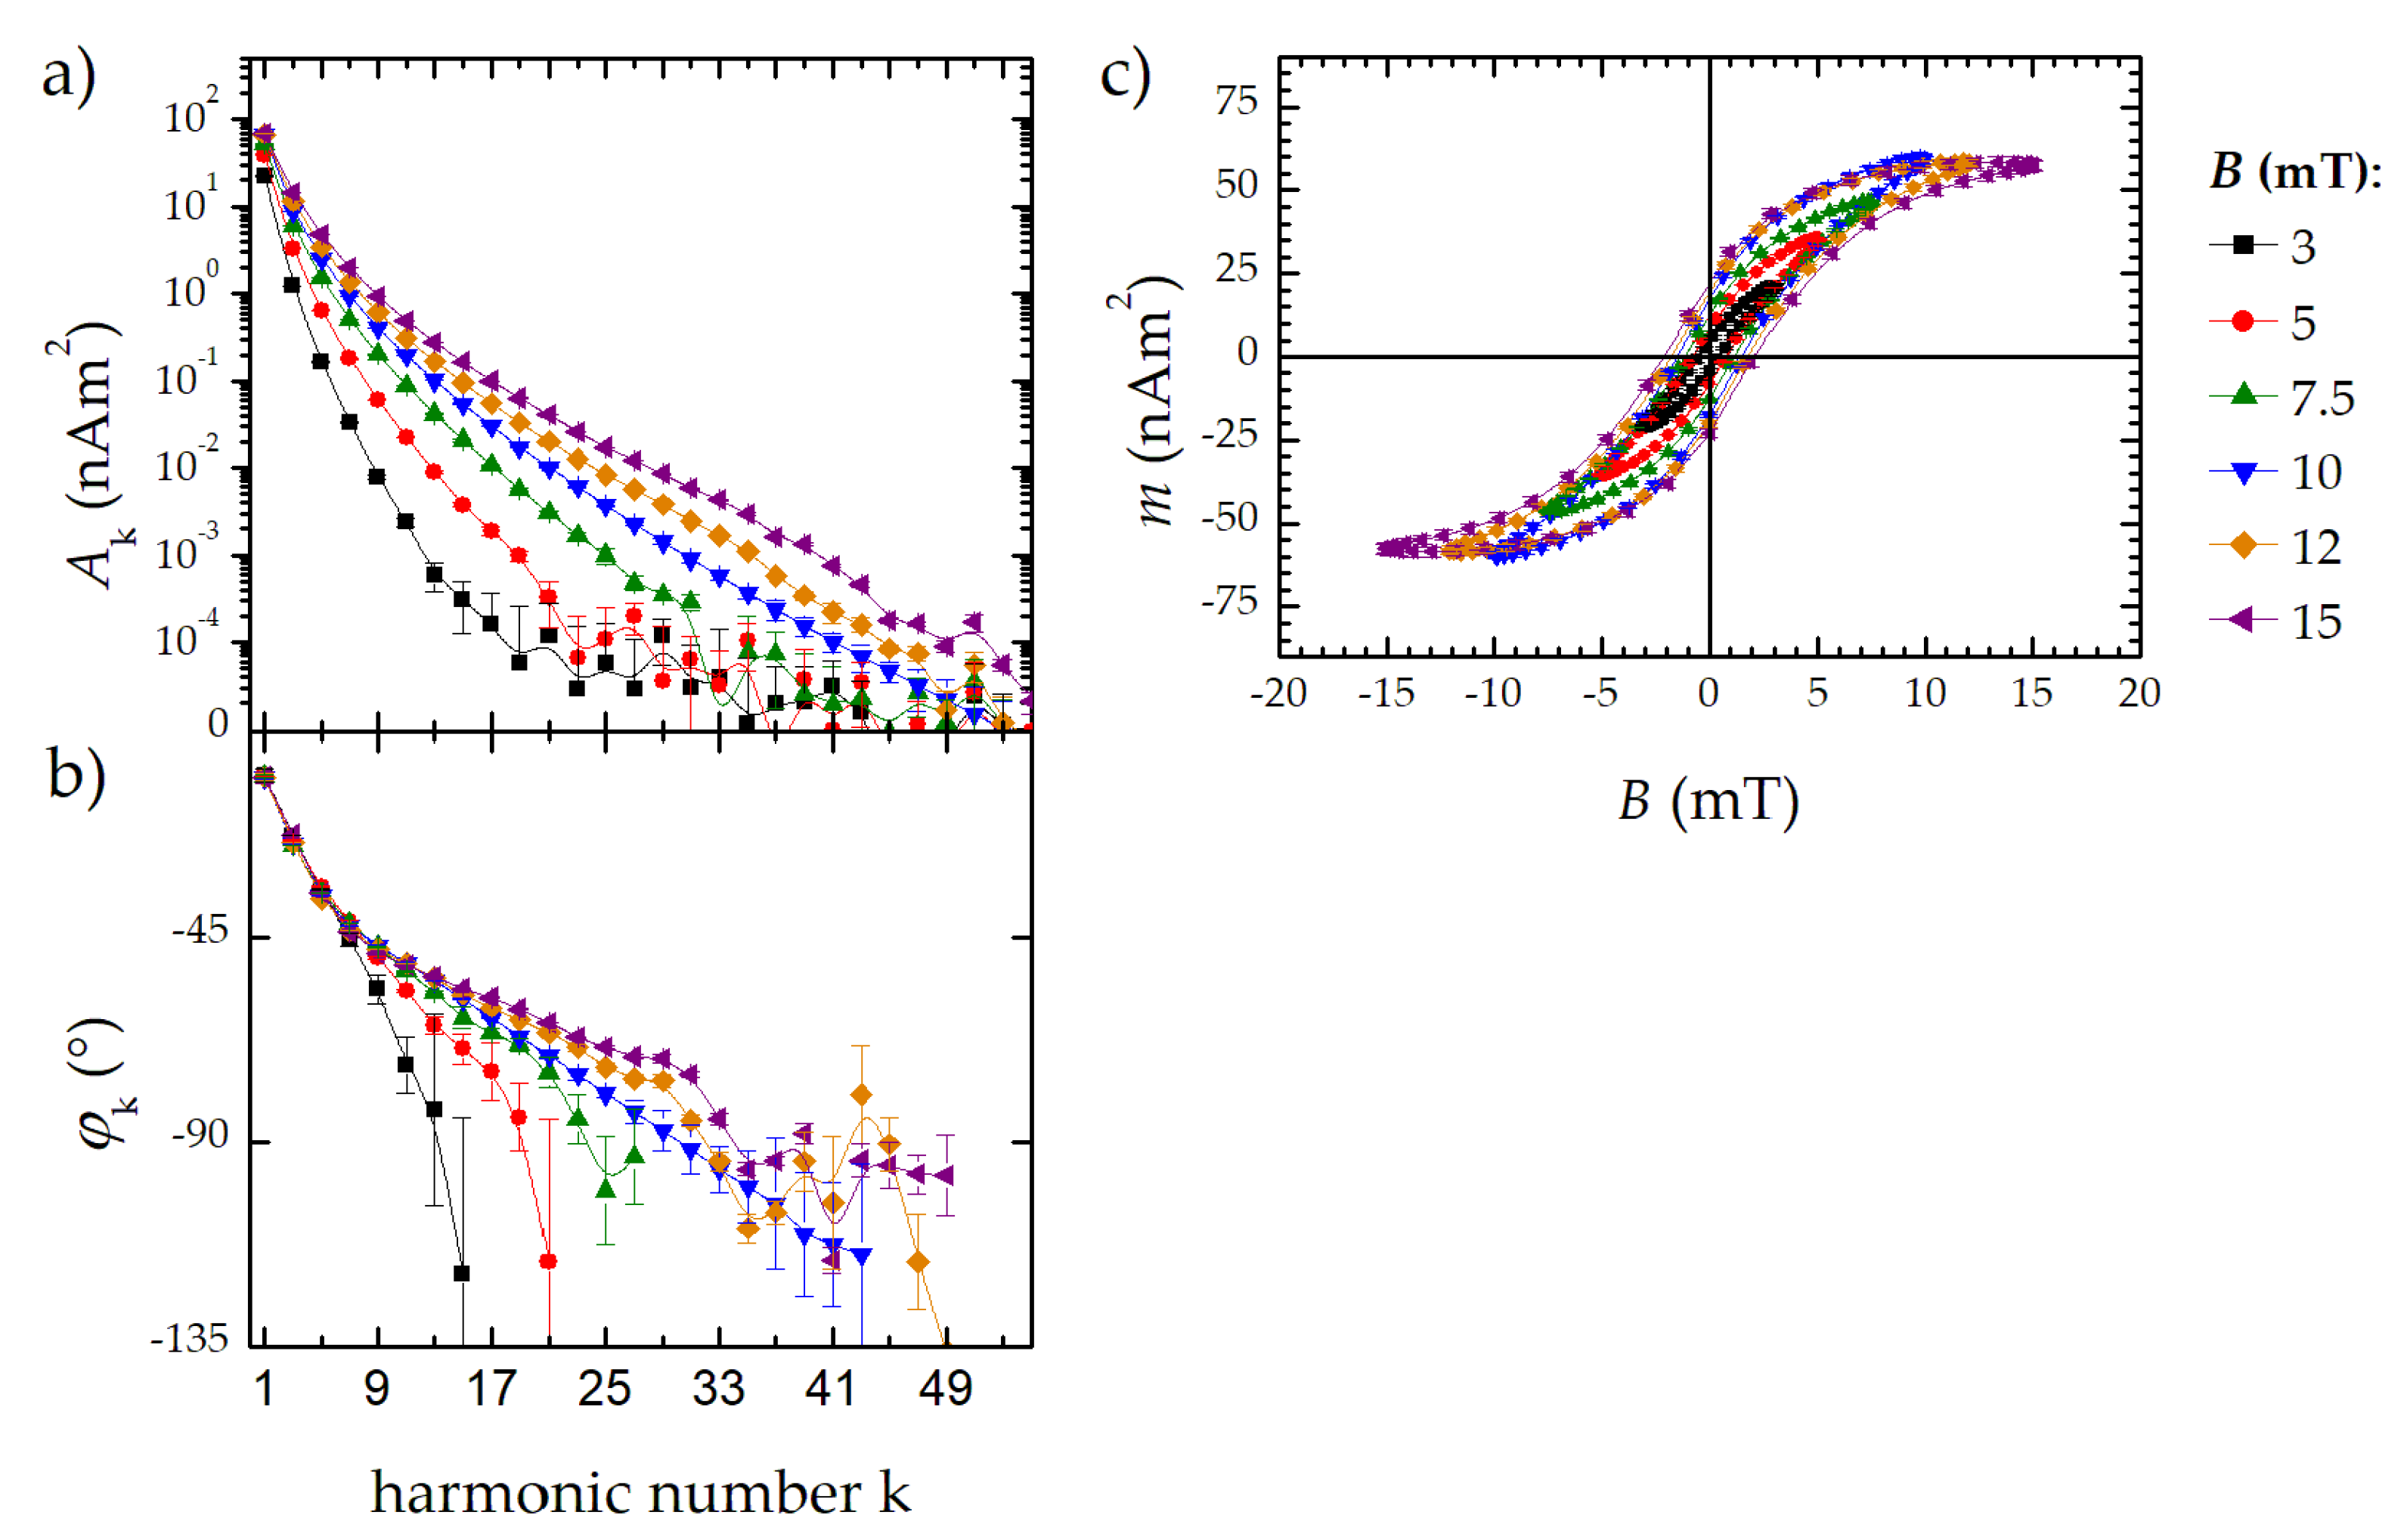
3.2. Determination of the Full Dynamic Measurement Range
3.3. Full Spectral Information Measurement
3.4. Synthesis Monitoring
3.4.1. Changing the Flow Rate Ratio
3.4.2. Varying the Synthesis Temperature
4. Summary and Conclusions
Author Contributions
Funding
Acknowledgments
Conflicts of Interest
References
- Krishnan, K.M. Fundamentals and Applications of Magnetic Materials; Oxford University Press: Oxford, UK, 2016; ISBN 978-0-19-106640-5. [Google Scholar]
- Gleich, B.; Weizenecker, J. Tomographic imaging using the nonlinear response of magnetic particles. Nature 2005, 435, 1214–1217. [Google Scholar] [CrossRef] [PubMed]
- Obaidat, I.M.; Issa, B.; Haik, Y. Magnetic Properties of Magnetic Nanoparticles for Efficient Hyperthermia. Nanomaterials 2015, 5, 63–89. [Google Scholar] [CrossRef] [PubMed]
- Chen, L.; Xie, J.; Wu, H.; Li, J.; Wang, Z.; Song, L.; Zang, F.; Ma, M.; Gu, N.; Zhang, Y. Precise Study on Size-Dependent Properties of Magnetic Iron Oxide Nanoparticles for In Vivo Magnetic Resonance Imaging. Available online: https://www.hindawi.com/journals/jnm/2018/3743164/ (accessed on 24 June 2020).
- Li, Q.; Kartikowati, C.W.; Horie, S.; Ogi, T.; Iwaki, T.; Okuyama, K. Correlation between particle size/domain structure and magnetic properties of highly crystalline Fe3O4 nanoparticles. Sci. Rep. 2017, 7, 9894. [Google Scholar] [CrossRef] [PubMed]
- Dennis, C.L.; Krycka, K.L.; Borchers, J.A.; Desautels, R.D.; Van Lierop, J.; Huls, N.F.; Jackson, A.J.; Gruettner, C.; Ivkov, R. Internal Magnetic Structure of Nanoparticles Dominates Time-Dependent Relaxation Processes in a Magnetic Field. Adv. Funct. Mater. 2015, 25, 4300–4311. [Google Scholar] [CrossRef]
- Mosayebi, J.; Kiyasatfar, M.; Laurent, S. Synthesis, Functionalization, and Design of Magnetic Nanoparticles for Theranostic Applications. Adv. Healthc. Mater. 2017, 6, 1700306. [Google Scholar] [CrossRef]
- Baki, A.; Löwa, N.; Thiermann, R.; Bantz, C.; Maskos, M.; Wiekhorst, F.; Bleul, R. Continuous synthesis of single core iron oxide nanoparticles for MPI tracer development. Int. J. Magn. Part. Imaging 2017, 3, 1703004. [Google Scholar]
- Baki, A.; Löwa, N.; Remmo, A.; Wiekhorst, F.; Bleul, R. Micromixer Synthesis Platform for a Tuneable Production of Magnetic Single-Core Iron Oxide Nanoparticles. Nanomaterials 2020, 10, 1845. [Google Scholar] [CrossRef]
- Hergeth, W.-D. On-Line Monitoring of Chemical Reactions. In Ullmann’s Encyclopedia of Industrial Chemistry; American Cancer Society: Atlanta, GA, USA, 2006; ISBN 978-3-527-30673-2. [Google Scholar]
- Bemetz, J.; Wegemann, A.; Saatchi, K.; Haase, A.; Häfeli, U.O.; Niessner, R.; Gleich, B.; Seidel, M. Microfluidic-Based Synthesis of Magnetic Nanoparticles Coupled with Miniaturized NMR for Online Relaxation Studies. Anal. Chem. 2018, 90, 9975–9982. [Google Scholar] [CrossRef]
- Malhotra, A.; Von Gladiss, A.; Behrends, A.; Friedrich, T.; Neumann, A.; Buzug, T.M.; Lüdtke-Buzug, K. Tracking the Growth of Superparamagnetic Nanoparticles with an In-Situ Magnetic Particle Spectrometer (INSPECT). Sci. Rep. 2019, 9, 10538. [Google Scholar] [CrossRef]
- Giustini, A.J.; Perreard, I.; Rauwerdink, A.M.; Hoopes, P.J.; Weaver, J.B. Noninvasive assessment of magnetic nanoparticle-cancer cell interactions. Integr. Biol. 2012, 4, 1283–1288. [Google Scholar] [CrossRef][Green Version]
- Arami, H.; Krishnan, K.M. Intracellular performance of tailored nanoparticle tracers in magnetic particle imaging. J. Appl. Phys. 2014, 115, 17B306. [Google Scholar] [CrossRef] [PubMed]
- Poller, W.C.; Löwa, N.; Schleicher, M.; Münster-Wandowski, A.; Taupitz, M.; Stangl, V.; Ludwig, A.; Wiekhorst, F. Initial interaction of citrate-coated iron oxide nanoparticles with the glycocalyx of THP-1 monocytes assessed by real-time magnetic particle spectroscopy and electron microscopy. Sci. Rep. 2020, 10, 3591. [Google Scholar] [CrossRef] [PubMed]
- Teeman, E.; Shasha, C.; Evans, J.E.; Krishnan, K.M. Intracellular dynamics of superparamagnetic iron oxide nanoparticles for magnetic particle imaging. Nanoscale 2019, 11, 7771–7780. [Google Scholar] [CrossRef]
- Ortega, D.; Pankhurst, Q.A. Magnetic hyperthermia. In Nanoscience; Royal Society of Chemistry: Cambridge, UK, 2012; pp. 60–88. [Google Scholar]
- Wu, K.; Su, D.; Saha, R.; Wong, D.; Wang, J.-P. Magnetic particle spectroscopy-based bioassays: Methods, applications, advances, and future opportunities. J. Phys. D Appl. Phys. 2019, 52, 173001. [Google Scholar] [CrossRef]
- Möddel, M.; Meins, C.; Dieckhoff, J.; Knopp, T. Viscosity quantification using multi-contrast magnetic particle imaging. New J. Phys. 2018, 20, 083001. [Google Scholar] [CrossRef]
- Zheng, B.; Goodwill, P.W.; Dixit, N.; Xiao, D.; Zhang, W.; Gunel, B.; Lu, K.; Scott, G.C.; Conolly, S.M. Optimal Broadband Noise Matching to Inductive Sensors: Application to Magnetic Particle Imaging. IEEE Trans. Biomed. Circuits Syst. 2017, 11, 1041–1052. [Google Scholar] [CrossRef]
- Graeser, M.; Knopp, T.; Szwargulski, P.; Friedrich, T.; Von Gladiss, A.; Kaul, M.; Krishnan, K.M.; Ittrich, H.; Adam, G.; Buzug, T.M. Towards Picogram Detection of Superparamagnetic Iron-Oxide Particles Using a Gradiometric Receive Coil. Sci. Rep. 2017, 7, 6872. [Google Scholar] [CrossRef]
- Garraud, N.; Dhavalikar, R.; Maldonado-Camargo, L.; Arnold, D.P.; Rinaldi, C. Design and validation of magnetic particle spectrometer for characterization of magnetic nanoparticle relaxation dynamics. AIP Adv. 2017, 7, 056730. [Google Scholar] [CrossRef]
- Löwa, N.; Radon, P.; Gutkelch, D.; August, R.; Wiekhorst, F. Hyphenation of Field-Flow Fractionation and Magnetic Particle Spectroscopy. Chromatography 2015, 2, 655–668. [Google Scholar] [CrossRef]
- Löwa, N.; Fabert, J.-M.; Gutkelch, D.; Paysen, H.; Kosch, O.; Wiekhorst, F. 3D-printing of novel magnetic composites based on magnetic nanoparticles and photopolymers. J. Magn. Magn. Mater. 2019, 469, 456–460. [Google Scholar] [CrossRef]
- Löwa, N.; Radon, P.; Kosch, O.; Wiekhorst, F. Concentration Dependent MPI Tracer Performance. Int. J. Magn. Part. Imaging 2016, 2, 1601001. [Google Scholar]
- Biederer, S.; Knopp, T.; Sattel, T.F.; Erbe, M.; Buzug, T.M. Improved Estimation of the Magnetic Nanoparticle Diameter with a Magnetic Particle Spectrometer and Combined Fields. In Proceedings of the 2010 International Society for Magnetic Resonance in Medicine, Stockholm, Sweden, 1–7 May 2010; p. 954. [Google Scholar]
- Biederer, S.; Knopp, T.; Sattel, T.F.; Lüdtke-Buzug, K.; Gleich, B.; Weizenecker, J.; Buzug, T.M. Estimation of Magnetic Nanoparticle Diameter with a Magnetic Particle Spectrometer. In Proceedings of the World Congress on Medical Physics and Biomedical Engineering, Munich, Germany, 7–12 September 2009; Springer: Berlin/Heidelberg, Germany, 2009; Volume 25/VIII, pp. 61–64. [Google Scholar]
- Rauwerdink, A.M.; Weaver, J.B. Viscous effects on nanoparticle magnetization harmonics. J. Magn. Magn. Mater. 2010, 322, 609–613. [Google Scholar] [CrossRef]
- Löwa, N.; Meier, F.; Welz, R.; Kratz, H.; Paysen, H.; Schnorr, J.; Taupitz, M.; Klein, T.; Wiekhorst, F. Novel platform for the multidimensional analysis of magnetic nanoparticles. J. Magn. Magn. Mater. 2020, 518, 167443. [Google Scholar] [CrossRef]
- Weaver, J.B.; Rauwerdink, A.M.; Sullivan, C.R.; Baker, I. Frequency distribution of the nanoparticle magnetization in the presence of a static as well as a harmonic magnetic field. Med. Phys. 2008, 35, 1988–1994. [Google Scholar] [CrossRef]
- Viereck, T.; Draack, S.; Schilling, M.; Ludwig, F. Multi-spectral Magnetic Particle Spectroscopy for the investigation of particle mixtures. J. Magn. Magn. Mater. 2019, 475, 647–651. [Google Scholar] [CrossRef]
- Viereck, T.; Schilling, M. Multivariate Magnetic Particle Spectroscopy for Magnetic Nanoparticle Characterization. AIP Conf. Proc. 2010, 1311, 267–270. [Google Scholar] [CrossRef]
- Weaver, J.B.; Zhang, X.; Kuehlert, E.; Toraya-Brown, S.; Reeves, D.B.; Perreard, I.M.; Fiering, S. Quantification of magnetic nanoparticles with low frequency magnetic fields: Compensating for relaxation effects. Nanotechnology 2013, 24, 325502. [Google Scholar] [CrossRef][Green Version]
- Draack, S.; Viereck, T.; Nording, F.; Janssen, K.-J.; Schilling, M.; Ludwig, F. Determination of dominating relaxation mechanisms from temperature-dependent Magnetic Particle Spectroscopy measurements. J. Magn. Magn. Mater. 2019, 474, 570–573. [Google Scholar] [CrossRef]
- Kuhlmann, C.; Khandhar, A.P.; Ferguson, R.M.; Kemp, S.; Wawrzik, T.; Schilling, M.; Krishnan, K.M.; Ludwig, F. Drive-Field Frequency Dependent MPI Performance of Single-Core Magnetite Nanoparticle Tracers. IEEE Trans. Magn. 2015, 51, 1–4. [Google Scholar] [CrossRef]
- Tay, Z.W.; Goodwill, P.W.; Hensley, D.W.; Taylor, L.A.; Zheng, B.; Conolly, S.M. A High-Throughput, Arbitrary-Waveform, MPI Spectrometer and Relaxometer for Comprehensive Magnetic Particle Optimization and Characterization. Sci. Rep. 2016, 6, 34180. [Google Scholar] [CrossRef]
- Behrends, A.; Graeser, M.; Buzug, T.M. Introducing a frequency-tunable magnetic particle spectrometer. Curr. Dir. Biomed. Eng. 2015, 1, 249–253. [Google Scholar] [CrossRef]
- Zhao, W.; Liu, Q.; Zhang, X.; Su, B.; Zhao, C. Rationally designed magnetic nanoparticles as anticoagulants for blood purification. Colloids Surf. B Biointerfaces 2018, 164, 316–323. [Google Scholar] [CrossRef] [PubMed]


Publisher’s Note: MDPI stays neutral with regard to jurisdictional claims in published maps and institutional affiliations. |
© 2020 by the authors. Licensee MDPI, Basel, Switzerland. This article is an open access article distributed under the terms and conditions of the Creative Commons Attribution (CC BY) license (http://creativecommons.org/licenses/by/4.0/).
Share and Cite
Löwa, N.; Gutkelch, D.; Welge, E.-A.; Welz, R.; Meier, F.; Baki, A.; Bleul, R.; Klein, T.; Wiekhorst, F. Novel Benchtop Magnetic Particle Spectrometer for Process Monitoring of Magnetic Nanoparticle Synthesis. Nanomaterials 2020, 10, 2277. https://doi.org/10.3390/nano10112277
Löwa N, Gutkelch D, Welge E-A, Welz R, Meier F, Baki A, Bleul R, Klein T, Wiekhorst F. Novel Benchtop Magnetic Particle Spectrometer for Process Monitoring of Magnetic Nanoparticle Synthesis. Nanomaterials. 2020; 10(11):2277. https://doi.org/10.3390/nano10112277
Chicago/Turabian StyleLöwa, Norbert, Dirk Gutkelch, Ernst-Albrecht Welge, Roland Welz, Florian Meier, Abdulkader Baki, Regina Bleul, Thorsten Klein, and Frank Wiekhorst. 2020. "Novel Benchtop Magnetic Particle Spectrometer for Process Monitoring of Magnetic Nanoparticle Synthesis" Nanomaterials 10, no. 11: 2277. https://doi.org/10.3390/nano10112277
APA StyleLöwa, N., Gutkelch, D., Welge, E.-A., Welz, R., Meier, F., Baki, A., Bleul, R., Klein, T., & Wiekhorst, F. (2020). Novel Benchtop Magnetic Particle Spectrometer for Process Monitoring of Magnetic Nanoparticle Synthesis. Nanomaterials, 10(11), 2277. https://doi.org/10.3390/nano10112277