Abstract
Micromixer technology is a novel approach to manufacture magnetic single-core iron oxide nanoparticles that offer huge potential for biomedical applications. This platform allows a continuous, scalable, and highly controllable synthesis of magnetic nanoparticles with biocompatible educts via aqueous synthesis route. Since each biomedical application requires specific physical and chemical properties, a comprehensive understanding of the synthesis mechanisms is not only mandatory to control the size and shape of desired nanoparticle systems but, above all, to obtain the envisaged magnetic particle characteristics. The accurate process control of the micromixer technology can be maintained by adjusting two parameters: the synthesis temperature and the residence time. To this end, we performed a systematic variation of these two control parameters synthesizing magnetic nanoparticle systems, which were analyzed afterward by structural (transmission electron microscopy and differential sedimentation centrifugation) and, especially, magnetic characterization methods (magnetic particle spectroscopy and AC susceptibility). Furthermore, we investigated the reproducibility of the microtechnological nanoparticle manufacturing process compared to batch preparation. Our characterization demonstrated the high magnetic quality of single-core iron oxide nanoparticles with core diameters in the range of 20 nm to 40 nm synthesized by micromixer technology. Moreover, we demonstrated the high capability of a newly developed benchtop magnetic particle spectroscopy device that directly monitored the magnetic properties of the magnetic nanoparticles with the highest sensitivity and millisecond temporal resolution during continuous micromixer synthesis.
1. Introduction
Due to their unique imaging, optoelectronics, catalysis, sensing, and drug delivery properties [1,2,3], nanocarriers and nanoparticulate systems have drawn significant attention in recent decades. Especially, magnetic iron oxide nanoparticles (MNP) with their unique properties comprising high magnetic moments, good biocompatibility [4], and highly flexible surface chemistry [5], belong to a material class suitable for a wide range of biomedical applications [6,7,8]. These include cell labeling, magnetic drug targeting [9], magnetic fluid hyperthermia [10,11], and diagnostic imaging [12]. Already in 1988, MNP (Resovist®) had been clinically evaluated as a negative contrast agent for magnetic resonance imaging of the liver [13]. Since 2005, MNP is also in development as tracer material for magnetic particle imaging (MPI), a novel quantitative imaging technology with potential for cancer diagnosis using MNP as local probes [14].
For the versatile biomedical applications of MNP, different requirements concerning their specific structural and chemical properties have to be considered by establishing an appropriate synthesis strategy. The particle properties, including size, crystal structure, and chemical composition of the core, in combination with surface chemistry [15] and surface charge (zeta potential) [16], influence the colloidal stability in a dispersion medium [17] as well as interactions with the biological environment. However, the most significant factor contributing to the characteristics of MNP for these applications is the magnetic behavior, which is determined in addition to the chemical composition, mainly by size, size distribution, and dispersion stability [18]. Bawendi et al. showed that very small MNP with a core magnetic diameter of about 3 nm and an ultrathin hydrophilic shell of about 1 nm was superior to larger particles as a positive T1 contrast agent for magnetic resonance imaging and magnetic resonance angiography [19]. Contrary, theoretical models suggest that single-core iron oxide nanoparticles of about 30 nm core diameter are optimal for MPI [14]. The tailoring of size and morphology with an easy and controllable technique is the key to optimize the magnetic behavior of MNP for their envisaged in vivo applications. Thus, a deep and comprehensive understanding of the synthesis mechanisms is not only mandatory to control the size and shape of synthesized MNP but, above all, to obtain the envisaged magnetic particle functionality.
To date, conventional batch methods of synthesizing MNP like micro-emulsion, hydrothermal reactions, sol-gel, and coprecipitation have been mostly used [20,21,22,23,24,25,26,27,28]. The simplest route already proposed in 1980 by Khalafalalla and Reimes [29] and Massart [30] produces MNP depending on a precipitating iron salt Fe(III)/Fe(II) mixture with a base, normally NaOH, followed by oxidation. The resulting diameters in the range of 5 to 15 nm usually show a rather broad size distribution, and nanoparticles are rarely stabilized as single cores in aqueous media. An exceptional technique to produce unique MNP is biosynthesis. Faivre and Schüler used magnetotactic bacteria and magnetosomes to prepare 20–45 nm magnetite MNP with uniform morphology and excellent magnetic properties for different applications, especially for hyperthermia [31]. Probably, due to their immunogenic bacterial lipid layer containing (glyco)proteins coating, biosynthesized MNPs have not found their way into the clinic, yet. Additionally, preparation, cultivation, and harvesting of the bacteria and magnetosomes are time- and labor-intensive and take up to several weeks. Another common technique to produce MNP with narrow size distribution and good control over size and morphology is the thermal decomposition of organometallic precursor in a boiling organic solvent. Many groups use this technique to produce high-quality MNP [32,33,34]. Ferguson and Krishnan et al. presented tailored 26–28 nm ±1.5 nm single-core MNP with polyethylene glycol coating for MPI application [35,36]. Although these MNP show two to three-fold higher signal amplitudes compared to Resovist®, their thermal decomposition route requires heating of the mixture for at least 24 h at 320 °C, followed by a phase transfer, resulting in a rather limited product quantity. Recently, Laurent et al. reported a continuous flow approach with a simple capillary reactor via the thermal decomposition synthesis route to obtain very small iron oxide nanoparticles. In this study, different synthesis parameters were varied, such as temperatures (200 to 300 °C), pressure (5 to 100 psi), and concentration of the surfactant. The system was operated at relatively low flow rates between 0.05 and 2 mL·min−1, and the process included further downstream processing by multiple precipitation and resuspension steps. Variation of the synthesis parameters resulted in MNP in a relatively limited core size range between 3.4 ± 0.64 and 5.86 ± 1.38 nm [37].
Generally, conventional batch synthesis methods suffer from limited reaction control, scalability issues, and often require high temperature and post-treatment, such as washing or phase-transfer from organic solvents, leading to the time-consuming multi-step procedure. Complex methods additionally lead to pure reproducibility and cause high batch-to-batch variations of resulting particle characteristics [38]. Issues of insufficient mixing and mass and heat transfer challenges even increase with increasing batch sizes [39]. Thus, further advances in MNP development is impeded, and the transfer of academic results into the technological and medical application is often hindered. Even though during the last decade, several authors have dealt with the continuous synthesis of magnetic nanoparticles, many of these issues remain unsolved [40,41,42,43]. The described processes often do not comprise the entire production procedures, including purification and stabilization steps; thus, the single cores are not stably dispersed in an aqueous medium, but clusters are obtained. Moreover, microfluidic processes based on PDMS (polydimethylsiloxane) structures usually do not tolerate high flow rates with the consequence that they often have to be operated at very low flow rates in the microliter per minute range, which limits the throughput and scalability [44,45].
To surmount these obstacles, a microtechnological manufacturing platform using flow chemistry for the controlled synthesis of magnetic iron oxide nanoparticles via an aqueous synthesis route has been developed. Microreaction technology in flow chemistry has been known and well-studied in the last decades. Outstanding is the simplicity of the approach together with the ability to precisely control reactions’ parameters, e.g., temperature, residence time, rapid heat and mass transfer, high mixing efficacy, and hence reproducibility [46,47,48]. However, producing nanoparticles in micromixers remains challenging as precipitating solid materials can block the microchannels of the reactors and endanger the process stability. Thus, a comprehensive process understanding is required to be able to exploit the advantages of a microstructured device and successfully run a micromixer for nanoparticles’ synthesis.
In the micromixer, permanent homogenous nucleation of core seeds takes place by the reaction of two or more educts, continuously administered by pumps. Connected to the micromixer, locally separated dwell zones ensure optimal control of particle growth. Hence, the micromixer setup enables both the spatial as well as the temporal separation of nucleation and growth stages during the continuous synthesis of MNP [38].
Generally, the size and shape of MNP can be tailored by the variation of synthesis parameters, e.g., the used precursor, iron salt ratio Fe2+/Fe3+, temperature, pH, and the base used to precipitate the magnetic iron oxide core [49].
In this study, we presented the use of aqueous micromixer synthesis to produce high-quality magnetic single-core iron oxide nanoparticles using biocompatible educts. Solely by the adjustment of two significant process parameters: the temperature and the residence time during particles’ growth, a tunable production of single-core magnetic nanoparticles could be achieved. A comparison with the conventional batch approach was carried out to study the properties and reproducibility of the two methods. The influence of temperature and variation of residence time by both changing the total flow rate as well as adjusting the volume of the residence loop was demonstrated.
To determine the resulting magnetic properties of synthesized MNP, a thoroughly magnetic characterization was carried out, mainly using a technique named magnetic particle spectroscopy (MPS). MPS can be considered as 0-dimensional MPI, e.g., it detects the non-linear dynamic magnetic response of MNP exposed to an alternating magnetic field but without technical challenging gradient fields used for spatial encoding. Originally MPS was developed to assess the MPI performance of tracer materials, but here, we used MPS to determine the reproducibility of the continuous MNP manufacturing process compared to batch synthesis using the same precursors and to quantify magnetic effects in the synthesis caused by changes in reaction temperature and reaction time. Since MPS is a very fast (2 ms) and sensitive (moments below 10−11 Am2 can be detected) technique, we presented the first results using MPS directly during continuous micromixer synthesis. Furthermore, linear AC-susceptibility measurements were used to obtain supporting information about the linear magnetization dynamics and aggregation behavior of the MNP when a small oscillating magnetic field was applied. The characterization of size, size distribution, particle shape, and morphology was determined using transmission electron microscopy (TEM) and differential centrifugal sedimentation (DCS).
2. Materials and Methods
2.1. Micromixer Synthesis
Single-core iron oxide nanoparticles were synthesized by precipitation from aqueous, alkaline solutions of iron salts based on a micromixer set-up, as previously reported [50,51]. The microfluidic synthesis platform consisted of HPLC pumps (Knauer, Berlin, Germany), a caterpillar micromixer (Fraunhofer IMM, Mainz, Germany) with 10 µL inner volume to induce particle nucleation, and several temperature-controlled reaction loops (Teflon tubing) with 3.2 mm diameter at lengths in the range 5 m to 50 m to control particle growth. Educt solutions were preheated, and a thermostatic bath (Huber, Offenburg, Germany) ensured the control of the reaction temperature Ts of the micromixer as well as the residence loop (temperature stability < 1.5 K). By adjusting the length of the reaction loops and the flow rate Q, the residence time tr, available for particle growth, could be controlled. The synthesis platform was enhanced by a downstream-processing-module to remove reactive agents and excess of a stabilizing agent. Briefly, solutions of iron chloride, sodium nitrate as an oxidizing agent, and sodium hydroxide (all reagents were used without further purification, purity grade ≥98%, Sigma Aldrich, Schnelldorf. Germany), prepared in degassed and deionized water, were mixed in a caterpillar micromixer (Fraunhofer IMM, Mainz, Germany) with symmetric liquid ratios and piped in a temperature-controlled reaction loop. Nanoparticle dispersions were prevented from further oxidation as well as agglomeration with the addition of tannic acid (1.7 kDa, Fluka, Schwerte, Germany) as a stabilizing agent. Though tannic acid, as a natural product, is not well defined and characterized, our experiences have shown that it can be successfully utilized to enhance dispersion stability in aqueous media and is able to prevent aggregation behavior. Since tannic acid acts mainly as an electrostatic stabilizer to ensure dispersion stability also in media with higher salt concentration, further functionalization by a sterically stabilizing agent is required. This can be realized, e.g., by pegylation.
Finally, nanoparticles were purified by the removal of unreacted educts and access of a stabilizing agent via diafiltration and magnetic separation and stored at room temperature for further analysis. In the present study, the size of the magnetic nanoparticles was adjusted by the two individual process parameters: the synthesis temperature Ts and the residence time tr. While Ts was directly adjusted by the temperature chosen in the heat bath with Ts in the range of 30 to 65 °C, there were two ways to set the residence time tr, either by the tubing length L of the dwell zone or by flow rate Q in the range of 0.6 to 11.3 min. To avoid any residence time distribution deterioration generally observed in long tubing, the inner diameter of the tubes should not be larger than 4 mm for the flow rates used in our experiments. At larger diameters, we observed a significant increase in heterogeneity of the resulting particles. Other parameters, including educts solutions, mixing ratios, and flow rates, were kept constant. With our laboratory setup, a temperature and reaction time-dependent production yield in the range of 20–50% could be achieved. The yield was calculated from total iron content used in the starting reaction mixture relative to the amount quantified by phenanthroline protocol (described below in the section: photospectroscopical determination of iron concentration) of the final product after purification. We observed the general trend that with increasing temperature and residence time, the production yield increased, e.g., at Ts = 52.5 °C from about 21% at tr = 3.4 min to 48% at tr = 7.5 min).
Within 3 h, a total volume of more than 4 L could be provided with our current lab-scale set-up. By adapting the inner dimensions of the microfluidic mixer (internal scale-up) or by using several mixers in parallel (parallelization scale-up), the throughput can be increased easily by a factor of 15 [52,53].
Additionally, MNPs were synthesized by a batch precipitation approach in a flask (total volume 100 mL) with preheated educt solutions, vigorously mixed, and stirred using the same reagents and reaction times to determine batch-to-batch variations compared to micromixer MNP.
2.2. Physicochemical Characterization
2.2.1. Transmission Electron Microscopy (TEM)
TEM measurements were performed with a Zeiss Libra 120 (Zeiss, Oberkochen, Germany) electron microscope of nanoparticles’ dispersion dried on carbon-coated copper grids at 120 kV acceleration voltage. A magnetic field was applied to the grids for a short period of time (about 10 min) to accumulate MNP for subsequent TEM imaging. The images were taken by a CCD camera, and from a selection of N > 5000 individual nanoparticles, the mean diameter and standard deviation of the core diameter were determined automatically using the open-source software ImageJ (National Institutes of Health, Bethesda, MD, USA).
2.2.2. Differential Centrifugal Sedimentation (DCS)
Accurate information on the dispersion properties of MNP in colloidal systems can be obtained by DCS (often termed analytical ultracentrifugation), where the measured sedimentation properties of the particle are directly linked to the hydrodynamic particle size distribution [54].
In contrast to characterization techniques based on light scattering, the measurement of even broad size distributions or highly light-absorbing materials is possible by DCS as different size fractions become differentially accelerated in the gravitational field. Compared to TEM, the statistics obtained in this ensemble method were much better due to the fact that the counting of individual particles is not necessary. DCS measurements were performed at 20,000 rpm (=21,504 relative centrifugal force) (CPS Instruments Inc. Measurements, Darmstadt, Germany) after calibration with a silicon dioxide (SiO2) standard (255 nm). The sucrose gradient was built up using 24% to 8% sucrose. Peak maximum and full width at half maximum (FWHM) were evaluated using Origin® software (ADDITIVE Soft- und Hardware für Technik und Wissenschaft GmbH, Friedrichsdorf, Germany).
2.2.3. Photospectroscopical Determination of Iron Concentration c(Fe)
The iron concentration c(Fe) of the nanoparticle samples was determined photospectroscopically following a phenanthroline protocol [55]. Ten microliters of nanoparticles were dissolved in 20 µL hydrochloric acid (37%). After complete dissolution, 470 µL of H2O was added. Fifty microliters of hydroxylamine hydrochloride (10%) and 150 µL of 1,10-phenanthrolinehydrochloride (0.1%) were added to the 50 µL of this solution. After a reaction time of 15 min, the absorbance of the formed ferroin complexes was measured photospectroscopically by a microplate reader at a wavelength of 510 nm (SpectraMax Plus 348, Molecular Devices, CA, USA), and the iron concentrations were calculated using an iron standard calibration curve (ICP (inductively coupled plasma) iron standard, c(Fe) = 1.25 µg/mL to 80 µg/mL, Merck, Darmstadt, Germany).
2.3. Magnetic Characterization
2.3.1. Magnetic Particle Spectroscopy (MPS)
MPS measurements of single nanoparticle samples were performed using a commercial magnetic particle spectrometer (MPS-3, Bruker Biospin, Etllingen, Germany) operating at an amplitude Bex = 25 mT and a frequency f0 = 25 kHz. MPS detected the non-linear dynamic magnetic response of MNP exposed to an alternating magnetic field, from which their MPI performance could be assessed. For the measurement, a fast reaction tube (Applied Biosystems®, MicroAmp, ThermoFischer, Schwerte, Germany) containing a sample volume of 30 µL was placed in the detection coil of the MPS system. The induced magnetization could be measured simultaneously by the coils. By Fourier transform of the detected time signal, the spectral components of an MPS measurement were obtained, showing distinctive amplitudes at odd multiples (harmonics) of the excitation frequency f0. We used three characteristic parameters of the MPS harmonic spectra, the amplitude of the third harmonic normalized to the iron amount of the sample, A3*, the (concentration-independent) ratio between 5th and 3rd harmonic, A5/A3, and the phase of the 3rd harmonic ϕ3. All values were correlated to the MPI performance with the general observation that the higher the A3* and A5/A3, the better the MPI images. The phase ϕ3 described how well the particle moments could follow the excitation field at the given frequency f0. Generally, it is observed that the smaller the particle, the better the magnetic moments follow the excitation field, and the closer is the value of ϕ3 to zero. For comparison, we used measurements of the MRI liver contrast agent Resovist with an A3* = 8.7 Am2/kg(Fe) at 25 mT [56] excitation amplitude. Resovist is appreciated as a gold standard due to good dynamic magnetic properties in MPS. Though withdrawn from the market, the precursor Ferucarbotran, offering the same magnetic properties, can be purchased from Meito Sanyo, Japan.
Online-MPS measurements were performed using a novel benchtop magnetic particle spectrometer with an integrated flow cell so that it could be connected directly to the growth stage of the micromixer platform. This device was recently developed at Physikalisch-Technische Bundesanstalt and is described in detail in [57]. It operates at the same basic frequency of 25 kHz as the commercial MPS device and is calibrated using reference samples measured with the calibrated commercial MPS device before. All online-MPS measurements were carried out at Be = 12 mT to avoid any heat transfer contribution from the heating of the excitation coil of the device that might influence the synthesis of nanoparticles.
2.3.2. Alternating Current Susceptibility (ACS)
The linear dynamic magnetic susceptibility of MNP at room temperature was determined using an AC susceptometer (DynoMag, RISE Acreo, Goeteborg, Sweden). The complex linear dynamic magnetization response χ′, χ″ of 100 µL stock MNP suspension filled into a glass vial was measured in the frequency range 1 Hz to 100 kHz at an excitation amplitude of 0.2 mT. Typical ACS spectra normalized to the iron amount are shown in the appendix for single-core iron oxide nanoparticles synthesized at different residence times tr (Figure A1) and as a function of synthesis temperature Ts (Figure A2). From the measurements, the initial mass susceptibility χini (χ′ normalized to the sample’s iron mass and extrapolated to f → 0 Hz) in units of m3/kg(Fe) and the frequency fp= f(max(χ″(ω))) were extracted. We used χini to assess the particle moment (χini is proportional to the square of the particle moment, and fp is a magnetic measure of the hydrodynamic diameter). The overall shape of the spectra was used as an indicator if aggregation occurred in a sample.
2.3.3. X-ray Diffraction (XRD)
X-ray diffraction scans at room temperature were carried using a diffractometer (Rigaku SmartLab diffractometer, Neu-Isenburg, Germany) in parallel beam reflection geometry, equipped with a monochromatic copper radiation source (λ = 1.540593 Å). The patterns were collected in the 20–70° (2θ) range with a scan step of 0.01° at a speed of 0.1°/min. The main peak positions of the XRD spectra were analyzed according to the JCPDS card no. #75-0033 (Fe3O4) and # 39-1346 (γ-Fe2O3).
3. Results and Discussion
Magnetic single-core iron oxide nanoparticles were manufactured using a micromixer synthesis platform via an aqueous synthesis route. Additionally, batch syntheses employing identical educt solutions were carried out to assess performance and reproducibility between continuous micromixer and batch synthesis approach. For a comprehensive understanding of the particle formation process during continuous synthesis, the influence of the two main parameters—reaction temperature Ts and reaction time tr—on particle properties were investigated. To evaluate the magnetic properties of the single-core nanoparticles, MPS and ACS measurements were carried out. In addition to the magnetic measurements, XRD measurements of three samples with core sizes in the range 25 nm to 35 nm were performed to confirm the crystal structure and iron oxide phase (Appendix A Figure A3). Furthermore, the physicochemical analysis was augmented by TEM to assess core size and morphology and DSC to determine the hydrodynamic diameter size distribution. Since MPS is an outstanding sensitive (magnetic moments below 10−11 Am2 can be detected) and fast (2 ms for a single measurement) technique, its capability for magnetic online analysis during the continuous MNP production process was presented for the first time. Thus, direct quantitative monitoring of relevant process parameters during synthesis becomes feasible.
3.1. Reproducibility of Continuous Micromixer Synthesis Compared to Conventional Batch Synthesis
The magnetic properties of iron oxide nanoparticles depend on their composition, crystal structure, crystal quality, and morphology. Hence, a suitable synthesis route should be selected, which allows optimum control over shape, size, size distribution, and crystallinity of the particles. Several different synthesis routes to produce iron oxide nanoparticles exist. Well-established methods are thermal decomposition, sol-gel-approaches, mini emulsion, as well as coprecipitation [58]. Though all batch methods are based on different synthetic routes, each of them is usually running in a reaction vessel or flask at a predetermined reaction temperature while stirring. Thus, inhomogeneities in mixing and temperature within the reaction volume cause concentration gradients and hot spots, which influence the product quality. With increasing reaction volume, sufficient mixing and adequate reaction temperature control become even more challenging. For these reasons, the continuous synthesis approach of using microfluidics has gained a strong interest in recent years. However, particularly the synthesis of inorganic nanoparticles remains challenging because precipitated solids tend to block the microchannels and endanger the process stability.
We investigated the process reproducibility and stability of MNP obtained from our micromixer approach with particles manufactured by a conventional batch coprecipitation. We chose one specific set of synthesis parameters where we expected to obtain single-core nanoparticles with core sizes below 25 nm. In this case, a stable aqueous dispersion was easily achieved since interparticle interactions at these small diameters were rather negligible. Since we intended to show how insufficient mixing efficiency leads to inhomogeneous seed formation and, consequently, to broader size distribution, we did not investigate the influence of the different synthesis parameters here. To this end, we performed five individual continuous synthesis runs and compared the resulting nanoparticle samples with the properties of samples synthesized by five analogous batch synthesis runs using identical parameters. For the batch synthesis, we prepared 100 mL total volume with preheated educt solutions in a temperature-controlled reaction vial. Analogous to the continuous synthesis run, it was mixed vigorously in a 1:1 ratio at 52.5 °C and stirred for a reaction time of 2.5 min. The physicochemical characterization of representative nanoparticle samples by TEM and DSC for both synthesis routes is displayed in Figure 1.
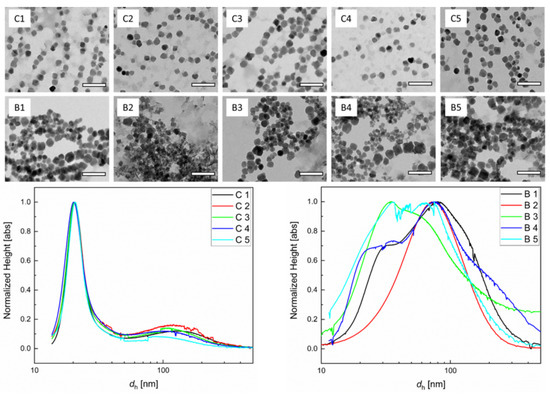
Figure 1.
Comparison of structural nanoparticle properties between continuous micromixer synthesis and batch synthesis: Representative transmission electron microscopy (TEM) images of five individual continuous micromixers (C1–C5) at a total flow rate of 8 mL/min and batch (B1–B5) synthesis runs with 100 mL total reaction volume (scale bar 100 nm). Experiments were performed with preheated educt solutions at 52.5 °C, mixing ratio of 1:1, and a reaction time of 2.5 min. Bottom: Corresponding hydrodynamic diameter dh distribution determined by differential centrifugal sedimentation (DCS) measurements of these samples (left: continuous micromixer synthesis, right: batch synthesis). Each line depicts the size distribution of one individual synthesis run. The narrower size distribution and higher homogeneity of the magnetic iron oxide nanoparticles (MNP) synthesized by continuous micromixer synthesis approach compared to batch synthesis were clearly visible in both TEM and ACS measurements.
The TEM images clearly indicated that core size distribution and morphology for the continuously manufactured samples were superior over the batch synthesis samples. Since the nucleation that determines the size distribution is a very fast process, the efficient mixing in the micromixer synthesis ensures a more homogenous distribution of core seeds, which, in the second stage, can uniformly grow at similar velocities because of the homogenous distribution of ripening educts as well as homogenous temperature conditions. This was confirmed by DSC measurements, which showed a larger variation of the hydrodynamic size distribution within the individual synthesis runs for the batch samples. Furthermore, the size distribution of the batch samples was generally broader and showed aggregates with average sizes even above 100 nm, while the core diameters were less than 30 nm. The DSC measurements of the continuous micromixer samples displayed similar and narrow hydrodynamic size distributions with relative standard deviations σ < 0.2. We attributed the observed stronger variation in hydrodynamic diameters in the batch synthesis to be caused by the more inhomogeneous seed nucleation conditions due to incomplete or insufficient mixing of educts compared to the micromixer approach. This resulted not only in a broader distribution of core sizes but in the cohesion of cores, as well. As a consequence, this led to observed increased hydrodynamic diameters.
Regarding the magnetic properties of the five individual synthesis runs, Figure 2 shows the mean and the standard variation (plotted as uncertainty bar) of the characteristic MPS parameters A3*, A5/A3, and ϕ3 of the five individual runs synthesized either by micromixer (red) or batch synthesis (green). The specific amplitude A3* was a measure of the sensitivity of the MNP to give a dynamic magnetization response at a chosen excitation frequency f0 per unit amount of iron, whereas the ratio A5/A3 could be considered as a parameter to describe the shape of the harmonics spectrum [59,60,61]. Finally, phase ϕ3 was related to the relaxation effects of the MNP and parametrized the lag of the MNP moments to follow the excitation field. Though the same general synthetic route and the same chemical reagents were used, the MNP resulting from the micromixer synthesis showed a higher MPS performance and a much smaller variation of A3*, indicating the superior defined process control. The resulting value for A3* = 20(1) Am2/kg(Fe) of the micromixer samples was about twice the value of A3* = 10(2) Am2/kg(Fe) found for the batch samples, while the standard deviation of the batch samples was twice the value of the micromixer samples. Note, the value in brackets denotes the format standard variation of the five samples, e.g., 20(1) Am2/kg(Fe) = 20 +/− 1 Am2/kg(Fe). Both samples exhibited a higher specific MPS amplitude compared with A3* = 8.7 Am2/kg(Fe) reported for Resovist® at 25 mT excitation amplitude [56]. Showing such high signal amplitudes, MNPs obtained by micromixer synthesis MNP were capable of competing with single-core iron oxide nanoparticles synthesized by sophisticated thermal decomposition synthesis with subsequent phase transfer [36]. Similarly, the mean value of A5/A3 = 35.6(3)% of the micromixer samples was far above the value of A5/A3 = 26(2)%, with six times higher standard deviation of the batch synthesis samples. This was a consequence of the much broader and more varying core and hydrodynamic size distributions found by TEM and DCS for the batch synthesis samples, which led to reduced A3 and A5/A3 values. Accordingly, the mean value and standard deviation of phase ϕ3 were increased (note the negative sign to emphasize the increased phase lag) for the batch synthesis samples.
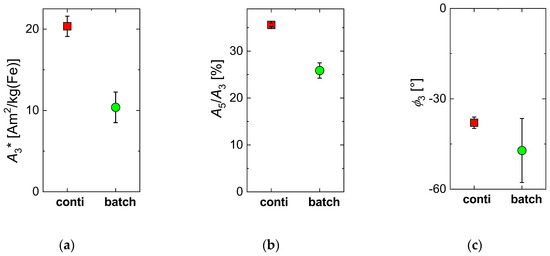
Figure 2.
Mean (symbols) and standard deviation (displayed as uncertainty bars) of the variation of magnetic particle spectroscopy (MPS) parameters (Be = 25 mT) of MNP samples synthesized by the two different synthesis approaches, micromixer (squares) and conventional batch (circles) procedure. For each synthesis procedure, five individual runs were carried out. (a) specific amplitude A3*; (b) ratio A5/A3; (c) phase ϕ3.
In a simplified description, the non-linear dynamic response, on which MPS relies, crucially depends on the size and mobility of the magnetic moments of the nanoparticles, which are exposed to the magnetic excitation field. The larger the magnetic moment of the particle, the larger the values of A3* and A5/A3 will be, as long as the moments can follow the excitation. With the increasing magnetic moment, its mobility to align (or switch) with the excitation field will decrease, which, in turn, will lead to a phase lag, e.g., increasing (by convention negative) ϕ3 value and resulting decrease of the two parameters A3* and A5/A3. Since the size of the magnetic moment is mainly determined by the particle size and core crystal quality, whereas the mobility is given by the viscosity of the suspending medium and by the effective anisotropy, there will be an optimum particle size at a given MPS excitation frequency f0. Smaller particles (low moments with high mobility) will have reduced values of A3* and A5/A3, and a ϕ3 value close to zero, while particles larger than the optimum size (huge moments but with low mobility) will also show reduced values of A3* and A5/A3 and an increased ϕ3 value—above the optimum phase value. Therefore, samples with broad distributions will always exhibit reduced MPS parameters compared to a sample with optimum particle size and crystal structure for a given frequency f0.
3.2. Influence of Residence Time Adjusted by the Total Flow Rate
The micromixer synthesis platform provided the spatial and temporal separation of nucleation and growth. Core seeds formed in the micromixer at the first contact of the educts were then piped into the residence loop where subsequent particle ripening took place, e.g., the cores grew to a certain size depending on the time as well as the temperature in the residence loop. Different effects influencing the MNP properties could become addressable by changing the mixing profile (or efficiency) and the duration the particles stay in the growth stage. The residence time tr was one main parameter that could be used to accurately control the MNP growth in continuous micromixer synthesis. With increasing tr, larger MNPs were obtained because of the longer time interval, and the seed particles produced in the micromixer resided in the growth stage. One possibility to adjust the residence time was to change the total flow rate. The higher the flow rate, the shorter the residence time in the growth stage (assuming a constant loop volume); thus, particles had less time to grow, leading to smaller particles. Reversely, lower flow rates implied longer residence times, resulting in larger particles.
However, the total flow rate not only determined the residence time but, at the same time, affected the mixing efficiency in the micromixer stage. Optimal mixing could be achieved in a relatively small window only. Since the micromixer is a static mixer without rotation or stirring elements, its mixing efficiency strongly depends on the flow conditions [62].
Therefore, the influence of the residence time tr adjusted by the total flow rate on the structural and magnetic nanoparticle characteristics was investigated. To this end, total flow rates were varied from 4 mL/min to 18 mL/min, which corresponded to residence times from tr = 7.5 min to 1.7 min for a constant residence volume V = 30 mL, since tr = V/Q.
As expected, the average particle size decreased with increasing flow rate since residence time tr was decreased. In the parameter window investigated, mean hydrodynamic MNP diameters ranging from about 20 nm to 33 nm (Figure 3) were found. Larger particles displayed a slightly more broadened size distribution (displayed as uncertainty bars in Figure 3b); nevertheless, no larger agglomerates with diameters larger than 50 nm were detected. Thus, the chosen flow rate range of 4 to 18 mL/min resembled a reliable process parameter window in the present setup.
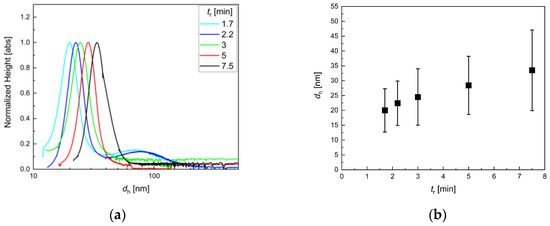
Figure 3.
DCS analysis for iron oxide single-core nanoparticles manufactured by continuous micromixer synthesis at different total flow rates Q from 4 to 18 mL/min (resulting residence times tr depicted in the legend). The reaction temperature was kept at 52.5 °C. (a) Hydrodynamic particle size distributions as measured by DCS; (b) Resulting peak maximum (symbols), resembling the mean diameter, and full width at half maximum (FWHM) (plotted as uncertainty bars), indicating the width of size distribution. Varying the total flow rate was one possibility to manipulate the particle size in the growth stage. The higher the flow rate, the smaller the resulting particles since the time for particle growth was too short for reaching an equilibrium in the residence loop.
TEM data (Figure 4) confirmed the DCS observations. The core sizes increased in the same way as the hydrodynamic sizes. Moreover, particles, particularly at lower tr, were clearly separated from each other again, confirming the stable dispersion as single cores in aqueous media. This was rarely observed for particles from aqueous synthesis, even for very small cores obtained from continuous synthesis with the aid of a T-mixer [63]. However, at lower flow rates, the particle homogeneity was slightly lower than at higher flow rates. This indicated that the micromixer was not operated at optimum flow conditions, and thus, the mixing efficiency was not sufficient to ensure a homogenous distribution of core seeds, leading to the broader size distribution observed for the final particles. Furthermore, at very high flow rates (=lower tr), the final concentration seemed to decrease, indicating that, in this case, not only the core size but also the total number of seeds was reduced or that the reduced residence time allowed not all seeds to form magnetic cores.
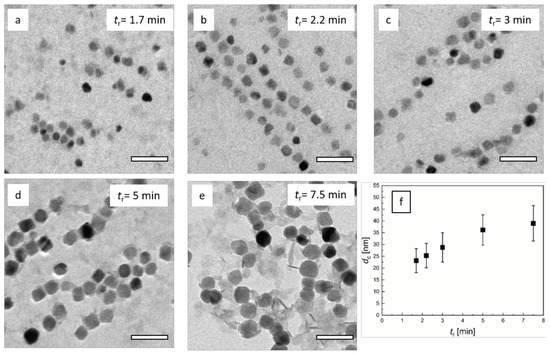
Figure 4.
TEM analysis of micromixer nanoparticle synthesis at a reaction temperature of 52.5 °C. a–e: Variation of residence time tr by adjusting the flow rate. Residence times from 1.7 min (Q = 18 mL/min) to 7.5 min (Q = 4 mL/min). With increasing tr, particle size increased, and homogeneity slightly decreased for the largest particles. f: Resulting mean diameter (symbol) and standard deviation (uncertainty bar) determined by analysis of N > 5000 individual nanoparticles imaged by TEM as a function of tr.
The impact of the residence time adjusted by the flow rate on the dynamic magnetic properties of the MNP, as characterized by the three MPS parameters A3*, A5/A3, and ϕ3, is shown in Figure 5. While the specific amplitude exhibited a distinct maximum of A3* ≈ 28 Am2/kg(Fe) at a residence time tr of about 3 min, the ratio A5/A3 showed a weak decrease with increasing tr, only. The phase ϕ3 showed the same, but more pronounced trend as A5/A3. Since at diameters dc > 20 nm, the magnetic moments of the MNP were blocked at room temperature, we assumed that the dynamics of the MNP moments were determined by Brownian rotation (the whole particle was rotating to follow the MPS excitation field). Therefore, we found, at the excitation parameters used for MPS (f0 = 25 kHz, Be = 25 mT), a corresponding core size of about 25 nm (see Figure 4f), and hydrodynamic diameter of about 27 nm (Figure 3b).
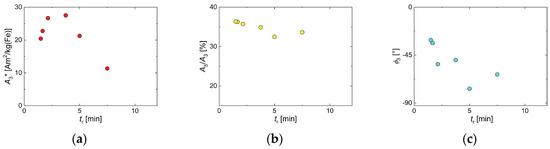
Figure 5.
MPS parameters of MNP samples obtained by continuous micromixer synthesis at different residence times tr = 1.7, 2.2, 3, 5, 7.5 min by adjusting the flow rate Q. (a) specific amplitude A3*; (b) ratio A5/A3; (c) phase ϕ3.
The ACS measurements (Appendix A Figure A1) confirmed that with increasing tr, the resulting initial susceptibility χini (e.g., core size) was increasing. Accordingly, the peak frequency f(χ″), which was related to the hydrodynamic diameter of the MNP, was shifting towards lower frequency with increasing tr, e.g., the resulting particle became larger, slowing down the Brownian rotation. A slight aggregation tendency of larger MNP produced at lower flow rates resulting in residence times ≥ 5 min Q < 20 mL/min was observed in the ACS measurements indicated by distorted, broader spectra with a pronounced shift of f(χ″) towards lower frequencies (supplemental data shown in Appendix A). The tendency of agglomeration was observed also for larger single-core nanoparticles with core sizes of 27.8 nm, which are synthesized by thermal decomposition during the phase transfer [16].
3.3. Influence of Residence Time Adjusted by the Volume of the Growth Stage Tubing
An alternative way to adjust the residence time tr was by selecting the reaction volume of the growth stage, e.g., by the length of the tubing of the growth section. In this case, tr could be adjusted while keeping all other synthesis parameters constant, e.g., without any further secondary effects as inhomogeneities caused by insufficient mixing (e.g., at very low flow rates). To this end, we varied, at Q = 8 mL/min total flow rate and Ts = 52.5 °C, the length of the tubing to adjust tr, while the inner diameter was kept constant to avoid flow profile changes by modifying the tubing diameter. By this, tr in the range 1 min to 12 min (corresponding to a tubing volume of 5 mL to 90 mL) was adjusted, which was slightly larger than the range that was addressed by the flow rate, as presented in Section 3.2.
The DCS analysis for samples synthesized at different residence times tr identified an optimal process window, wherein a safe control over particles’ characteristics was feasible (Figure 6a). In the tr range from 1.3 min to 7.5 min, DCS revealed narrow monomodal hydrodynamic size distributions with mean diameters of about 18 nm to 25 nm. Analogous to the experiments with a variation of the total flow rate, again, the average particle size in this process parameter range increased gradually with increasing tr For longer residence times tr = 8.8 min and 11.3 min, multimodal and broad size distributions became visible in the DCS analysis, as visualized by the uncertainty bars in Figure 6b. This clearly indicated agglomeration or aggregation behavior due to larger magnetic moments of larger cores. At a certain critical core size, the stabilizing agent could no longer protect the strong particle-particle interactions, and agglomeration occurred by forming superstructures. This was partly reversible, and the superstructures could be dissembled by stirring or vortexing; nevertheless, also stable aggregates were formed that could not be separated anymore.
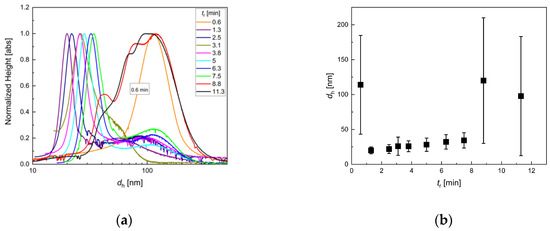
Figure 6.
DCS analysis for iron oxide single-core nanoparticles manufactured by continuous micromixer synthesis at Q = 8 mL/min total flow rate and Ts = 52.5 °C for various residences times tr = 0.6, 1.3, 2.5, 3.1, 3.8, 5, 6.3, 7.5, 8.8, 11.3 min: (a) hydrodynamic size distribution extracted from DCS measurements; (b) mean hydrodynamic diameter dh (symbols) and FWHM values (plotted as uncertainty bars) as a function of tr.
Interestingly, also, at very short residence times below 1 min (tr = 0.6 min), MNPs with larger hydrodynamic sizes and broad size distribution were observed in DCS analysis. However, in this case, the agglomeration or aggregation did not seem to be caused by strong magnetic interaction between large magnetic cores but indicated the presence of insoluble intermediate states. The corresponding TEM analysis (Figure 7a) showed aggregates of inhomogeneous particles of different size and morphology, which supported this hypothesis. It has been reported that the reaction mechanism of metal oxide synthesis in aqueous media generally involves hydrolysis of metal salts, followed by dehydration of the resulting hydroxides. A large number of different redox reactions are possible; thus, also hydroxide networks can be formed during hydrolysis [64]. If the residence time was below a critical value, the particle formation process was interrupted at a non-final stage; thus, particles were resulting, which were neither uniform nor electrostatically stabilized. Furthermore, these particles might contain fractions of non-magnetic iron hydroxides, which were able to crosslink and lead to agglomerates (See also Figure 8).
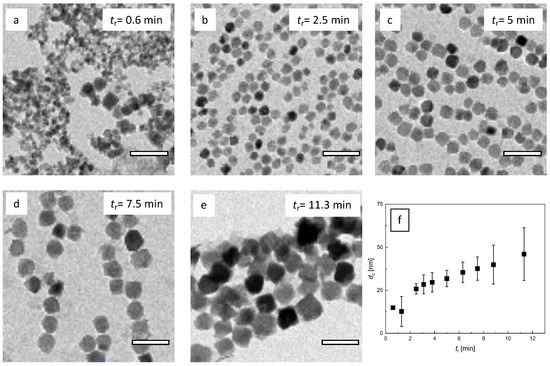
Figure 7.
TEM analysis of micromixer nanoparticle synthesis at Q = 8 mL/min total flow rate and Ts = 52.5 °C. a–e: Variation of residence time tr by adjusting the tubing length. Residence times from 0.6 min (V = 5 mL) to 11.3 min (L = 90 mL). With increasing residence time, particle core size increased. Off optimal process window, size control was limited, and the particle homogeneity decreased (a and e); f: Resulting mean diameter (symbol) and standard deviation (plotted as uncertainty bar) determined by the analysis of N > 5000 individual nanoparticles imaged by TEM as a function of residence time tr. Note, the TEM image analysis of particles synthesized at the lowest residence time tr = 0.6 min did not yield reliable core diameter values.
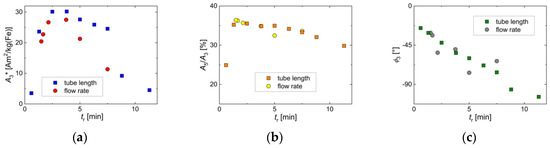
Figure 8.
MPS parameters of MNP samples were obtained by continuous synthesis at different residence times tr by adjusting the tubing length. For comparison, the corresponding MPS parameters obtained by the flow rate in Section 3.2 were added to the graphs. (a) specific amplitude A3*; (b) ratio A5/A3; (c) phase ϕ3.
As depicted in Figure 7, the TEM data confirmed the observations of DCS analysis. Increasing tr resulted in MNP with larger core sizes. Particles in the optimal process window were relatively homogenous in size and shape. Even the larger particles obtained at tr = 11.3 min were still relatively homogenous in size, though shape transition from spherical to more cubic morphology was visible. The core sizes between 13 +/− 3 and 46 +/−7 nm were obtained. The sample synthesized at tr = 0.6 min showed inhomogeneous MNP, indicating non-stable intermediate states, as discussed above.
Considering the effect of the residence time variation adjusted by the tubing length on the dynamic magnetic properties of the MNP, we saw a similar behavior as found for tr variation by flow rate adjustment in Section 3.2. The three MPS parameters—A3*, A5/A3, and ϕ3—are shown in Figure 8, together with the results of Section 3.2 (Figure 5). Again, the specific amplitude exhibited a distinct maximum at a residence time tr of about 3 min, but with a slightly increased value of A3* ≈ 30 Am2/kg(Fe). The corresponding A5/A3 parameter showed the same weak decrease with increasing tr. At the A3* maximum, the same A5/A3 value of 35% was determined for tr adjustment by tubing length as well as by flow rate. The phase ϕ3 showed a linear (negative) increase with increasing tr with a value of about −45° at the A3* maximum, where tr = 3 min. Thus, also, here, we found the core size of about 25 nm (see Figure 7f) and hydrodynamic diameter of about 27 nm (Figure 6b) to be optimum. Comparing the two ways of tr selection, the tubing length adjustment seemed to result in a more stable MNP synthesis than by controlling the flow rate, leading to slightly higher MPS values.
The crystallographic analysis by X-ray diffraction (see Figure A3 in the Appendix A) according to the JCPDS card no. #75-0033 (Fe3O4) confirmed a pure magnetic phase for three representative samples with core sizes between 25 and 35 nm. All diffraction patterns exhibited the characteristic XRD spectrum of Fe3O4 (or γ-Fe2O3) nanoparticles without any significant fraction of FeO (indicated by the lack of a (200) peak or α-Fe2O3 (no (104) and (110) peaks) phases [65]. The γ-Fe2O3 phase would exhibit a small peak shift to higher angles and the appearance of two weak characteristic superlattice diffractions from the (210) and (213) planes at lower angles (around 24.8 and 26.8°, respectively). Consistent with this, the samples in this size range obtained by micromixer synthesis exhibited a very high room temperature saturation magnetization in the range 111–117 Am2/kg(Fe), as recently published [66]. These values were close to the value for bulk magnetite or maghemite, indicating the high crystallinity of the magnetic phases with a low amount of disorder reached by our synthesis.
3.4. Influence of Reaction Temperature Ts
The reaction temperature Ts is the second important parameter to control the micromixer synthesis. During the aqueous synthesis of iron oxide nanoparticles, the reaction temperature determines the reaction velocity, particularly during particle growth, since the nucleation is a very fast process even at low temperatures. Therefore, the impact of different reaction temperatures Ts in the range from 30 °C to 65 °C on particle growth at a fixed residence time of tR= 3.4 min was investigated. All Ts were far below the boiling point of water and well above the room temperature (to suppress interfering seasonal variation of Ts if a sufficient temperature-controlled lab environment could not be maintained). Temperature control in the micromixer set-up was provided by a thermostat bath (Huber), preheated educt solutions, and thin-walled tubing (Teflon material); thus, temperature stability better than 1.5 K was achieved over the whole Ts range.
We observed a general trend to yield larger particles at higher Ts, as also reported in the literature for iron oxide particle growth during a hydrothermal process [67]. Higher Ts enhanced the mobility of active educts and accelerated the particle growth; thus, at an identical residence time, particles grew larger, as long as enough educt material was provided. As displayed in Figure 9, DSC resolved a single fraction of particles with hydrodynamic diameters (peak position) ranging from 12 nm for Ts = 30 °C up to about 36 nm for Ts = 62.5 °C with narrow size distribution. Especially in the range from Ts = 40 °C to 57.5 °C, the hydrodynamic size smoothly increased, exhibiting a narrow and nearly constant size distribution. Particles synthesized at higher temperatures showed a tendency for the formation of suprastructures, e.g., chains of several particles, visible in the DCS data by peak broadening and a shoulder at higher diameters.
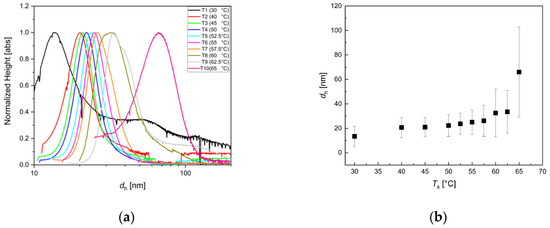
Figure 9.
DCS analysis for iron oxide single-core nanoparticles manufactured by continuous micromixer synthesis at Q = 8 mL/min total flow rate and tr = 3.4 min for different synthesis temperatures Ts = 30, 40, 45, 50, 52.5, 55, 57.5, 60, 62.5 and 65 °C. (a) Hydrodynamic size distribution extracted from DCS measurements; (b) mean hydrodynamic diameter dh (symbols) and FWHM values (depicted as uncertainty bars) as a function of Ts.
For the highest reaction temperature, Ts = 65°C, MNP with hydrodynamic diameters even about 70 nm and a much broader distribution were detected. This indicated the growing tendency of aggregation due to the increasing magnetic particle-particle interaction of MNP of this size, which no longer could be prevented with the chosen shell stabilization (surfactant layer) [68]. For the lowest reaction temperature Ts = 30 °C, the formation of aggregates was clearly visible by a distinct second broad distribution with a maximum at about 50 nm. Here, a similar effect, as at very low residence times discussed above, could cause this aggregation behavior. If the reaction temperature was too low at a given residence time, the dynamic particle formation process might not be finalized within this time frame, resulting in intermediate growth states with an inhomogeneous structure, which were insufficiently stabilized during particle growth. Thus, the subsequent addition of a protective layer could not avoid agglomeration efficiently.
The TEM images confirmed the results obtained by DCS measurements. The core size of the monotonic increased with increasing Ts. The TEM analysis, shown in Figure 10f, revealed mean cores sizes from less than 20 nm to almost 40 nm for the Ts range. For particles synthesized at Ts = 30 °C, TEM clearly showed that at this temperature, the residence time of tr = 3.4 min was too short for obtaining homogeneous well-separated single-core nanoparticles but resulted in a significant amount of agglomerated small size iron oxide structures with rather diffuse morphology (Figure 10a). Therefore, a large proportion of the sample could not be considered as isolated single nanoparticles. Besides, the geometry of MNP synthesized at Ts =30 °C was not very uniform, containing spherical as well as disk-like particle shapes. Furthermore, the particle concentration obtained after magnetic separation was very low, which indicated the presence of a significant amount of poor-quality magnetic particles.
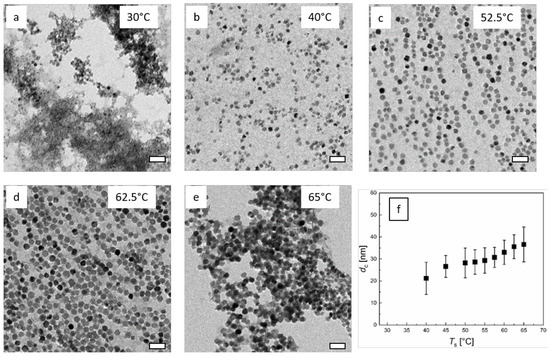
Figure 10.
TEM images of continuous micromixer-synthesized nanoparticles at Q = 8 mL/min total flow rate and tr = 3.4 min. a–e: Variation of synthesis temperature Ts. Images of MNP obtained by continuous synthesis at defined reaction temperatures in the range of 30 °C to 65 °C. The scale bar is 100 nm. f: Resulting mean diameter (symbols) and standard deviation (uncertainty bars) determined by the analysis of N > 5000 individual nanoparticles imaged by TEM as a function of Ts.
The mean core diameter obtained by TEM image analysis of N > 5000 single MNP ranged from 21.2 nm for Ts = 40 °C up to 36.6 nm Ts = 65 °C, smoothly increasing with increasing Ts, as shown in Figure 10f. The standard deviation (displayed as uncertainty bars in Figure 10f) remained quite constant at about 5.5 nm in the central range of Ts = 40 °C to 62.5 °C. Only for syntheses at the lowest and the highest reaction temperature, the standard deviations in the core size analysis increased to 7.3 nm for Ts = 30 °C and 7.9 nm for Ts= 65 °C, respectively. The corresponding relative standard deviations (σ = mean/standard deviation) of about 0.25 were determined. The number of particles per unit TEM grid area clearly increased with increasing Ts, as can be seen in Figure 10. Regarding the core sizes accessible by the micromixer synthesis of up to about 40 nm, we assumed a single domain magnetic structure of the single-core iron oxide MNP. Theoretically, a critical core size for forming a multi-domain structure larger than 75 nm for cubic and even larger than 120 nm for spherical particle shape has been estimated [69]. Whereas experimentally, a much lower border between single and multidomain structure at critical sizes in the range 30 nm to 50 nm has been reported for cubic MNP. Therefore, a fraction of particles with a multi-domain structure cannot be excluded, which would require further analysis methods to clarify.
From DCS and TEM measurements, we identified an optimal process operation window between Ts = 40 °C and 60 °C, in which tunable MNP with core sizes between 20 nm and 35 nm could be produced that were stable in an aqueous suspension medium. Particles of this size range are particularly interesting for versatile biomedical applications like magnetic fluid hyperthermia, magnetic separation, or drug targeting, where huge magnetic moments are advantageous [70]. In a recently published paper, we investigated single-core magnetic nanoparticles of this size range for their capacity in biomedical applications as MRI contrast agents, as tracer materials for magnetic particle imaging, or as heating agents for hyperthermia applications [66]. For instance, for single-core nanoparticles with an average core diameter of 30 nm, relaxivities of r1 = 8.8(1) L mol−1 s−1 and r2 = 289(8) L mol−1 s−1 were determined. This clearly exceeded the r2 value of Resovist® (r2 = 95 L mol−1 s−1, reported in the literature at the same field B0 = 1.5 T) [71], indicating a good performance as a negative contrast agent. Usually, single-core iron oxide nanoparticles in this size range are not easily accessible by other synthesis methods, especially nanoparticles that are stably dispersed in an aqueous environment. For instance, Hufschmid et al. presented a method based on thermal decomposition envisaging this specific core size range. Producing a set of particles in this size range required numerous synthesis runs, each with different educt solutions and reaction times for more than 10 h, followed by time-consuming phase transfer to aqueous media [72].
To assess the magnetic behavior that can be adjusted by Ts variation, we carried out MPS and ACS measurements. The dynamic magnetic response at Be = 25 mT, parametrized by the three characteristic MPS quantities—the specific amplitude A3*, the ratio A5/A3, and the phase ϕ3 as a function of Ts—is summarized in Figure 11. The nanoparticles synthesized at Ts = 30 °C exhibited a rater low A3* value of about 5 Am2/kg(Fe), indicating a low magnetic moment of the MNP responding to the dynamic excitation at f0 = 25 kHz. For Ts = 40 °C and higher, A3* significantly increased far above 20 Am2/kg(Fe) due to the increasing size and more uniform morphology compared to particles synthesized at Ts = 30 °C. The magnetic response reached a maximum at about Ts = 50 °C, and for higher temperatures, A3* gradually decreased again. Though the particle moments still increased in size, they became too slow to follow the excitation frequency. At the highest temperature of Ts = 65 °C, A3* had dropped down to a value slightly above 5 Am2/kg(Fe). The (concentration-independent) harmonic amplitude A5/A3 showed the same behavior as a function of Ts with a maximum value of about 38% at Ts = 42 °C, but with less pronounced reduction at the lowest and highest temperatures. The phase angle ϕ3 showed a linear (negative) increase with increasing Ts passing −45° at the maximum values of A3 and A5/A3, indicating that for angles larger than −45°, the moments could not follow the excitation fast enough and were thereby reducing A3* and A5/A3.
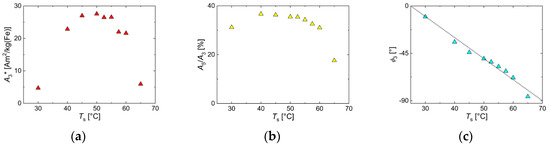
Figure 11.
MPS parameters of MNP samples obtained by continuous synthesis at different synthesis temperatures Ts. (a) Specific amplitude A3*; (b) ratio A5/A3; (c) phase ϕ3. The dotted line in (c) displays the phenomenological linear relation (ϕ3 = 50° − 2·Ts) between phase and Ts.
MPS and ACS results could be combined by relating them to the corresponding residence times tr or synthesis temperatures Ts, respectively. Hence, the MPS parameters—A3*, A5/A3, and ϕ3 as a function of the initial susceptibility χini obtained by ACS (Appendix A Figure A2)—are displayed in Figure 12 for the different micromixer synthesis parameters. The initial susceptibility χini, reflecting the moment of the MNP achieved at a synthesis parameter tr or Ts, served as the x-axis for the three MPS parameters—A3*, A5/A3, and ϕ3. It showed that synthesis temperature Ts and residence time tr impacted the magnetic properties in a slightly different manner. Though the curves for both parameters showed a very similar shape, the maximum in A3* was reached at lower χini values. The same was observed for the A5/A3 parameter.
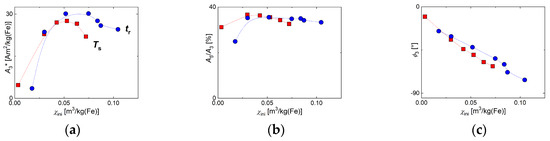
Figure 12.
MPS parameters of MNP samples obtained by continuous synthesis at different reaction temperatures Ts (red squares) and residence time tr adjusted by tubing length (blue circles) plotted against the corresponding initial susceptibility χini determined by alternative current susceptibility (ACS). (a) Specific amplitude A3*; (b) ratio A5/A3; (c) phase ϕ3. Note the lines are guide to the eyes.
The results indicated the significant influence of Ts on the reaction, the obtained single-core nanoparticle structures, and finally, the resulting magnetic characteristics determined by size, size distribution, stability, and magnetic properties. Increasing the reaction temperature of the micromixer synthesis already in a very narrow interval of 2.5 K significantly affected the MNP characteristics and confirmed the rapid and efficient heat transfer of the continuous micromixer synthesis. Compared with this, the residence time tr seemed to have a finer setting of magnetic parameters with slightly higher A3* values than obtained by Ts adjustment. Furthermore, MPS and ACS were two highly sensitive magnetic techniques capable of resolving the changes in magnetic parameters addressed by Ts variation.
3.5. Online-MPS as a Valuable Tool for Efficient Magnetic Process Analysis During the Continuous, Tunable Synthesis of High-Quality Single-Core MNP by Micromixer Synthesis
Though MPS is a powerful technique to evaluate the dynamic magnetic behavior of the micromixer synthesis products, it generally requires taking individual samples after each synthesis. Nevertheless, the short measurement time of a few milliseconds combined with the extremely high sensitivity to detect magnetic moments below 10−11 Am2 makes the MPS technique ideally suited to detect the magnetic properties during the entire micromixer synthesis process. For this purpose, a compact MPS device was developed capable of easy looping into the dwell-zone tubing system used to adjust the residence time during micromixer synthesis. The setup and operation of this novel device are described in detail in the following article of this volume [61]. For the first demonstration of the capability of this device for magnetic process control, we performed a micromixer synthesis run, where Ts was stepwise increased by 5 K (except for an intermediate 2.5 K temperature step at 52.5 °C) every 10 min starting at Ts = 30 °C while keeping all other synthesis parameters constant. During the complete synthesis run, the online-MPS device was looped into the growth stage tubing used for residence time adjustment, and MPS measurements were continuously acquired with a temporal resolution of Δt = 1 s at an excitation field strength of Be = 12 mT.
Figure 13 displays the MPS parameter A5/A3 (red line) during the synthesis run, sensitively reflecting changes in the magnetic properties directly after each increase of Ts (red line). Starting the synthesis at t = 0, it took about 4 min (at 30 °C) until the first reliable MPS spectra with A5/A3 values above noise floor appeared, which, then after a small overshoot within the following 4 min approach, reached a stable value of about 20%. With the next Ts set-point at 35 °C, a significant increase in A5/A3—maximum value of about 25%—was observed, while for all higher Ts values, A5/A3 dropped again. Roughly, this behavior was in accordance with the MPS results of the previous Section 3.3. Note, the maximum value detected inside the dwell-zone tubing by online-MPS was significantly lower than the maximum found by MPS of extracted individual samples of about 35%. The reason is that for the online MPS measurements, we chose a much lower excitation field amplitude (Be = 12 mT) than for all other MPS measurements (Be = 25 mT), which mainly explains the difference in the absolute values of A5/A3. By this excitation field reduction, we intended to avoid any additional heat transfer from the excitation coil of the online-MPS device. Additional experiments are envisaged to further characterize any heat transfer effects of the coil at higher temperatures on micromixer synthesis in the growth stage tubing.
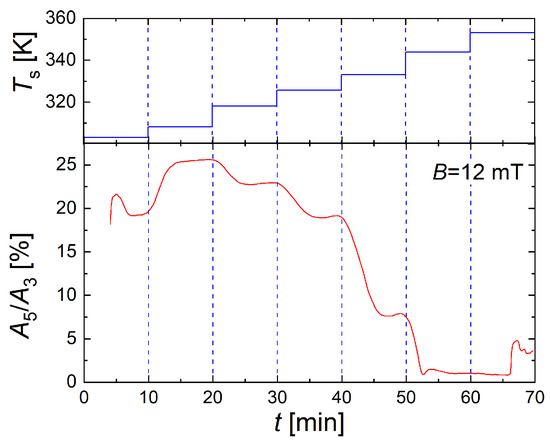
Figure 13.
Monitoring of micromixer synthesis by online-MPS. The concentration-independent MPS parameter A5/A3 directly reflected changes in the magnetic properties during MNP synthesis, here provoked by step-wisely increasing Ts. Every 10 min, Ts (top panel, blue line) was increased by 5 K (with one additional intermediate Ts setpoint at 52.5 °C) starting at Ts = 30 °C. The synthesis started at t = 0 and was monitored by continuous MPS acquisition (Δt = 1 s, Be = 12 mT) to obtain the parameter A5/A3 values (bottom panel, red line). The synthesis was performed at Q = 8 mL/min total flow rate and tr = 3.4 min.
The general benefit of probing the magnetic properties inline during synthesis has been demonstrated in [73], where an NMR detection scheme was developed and tested for online characterization of iron oxide nanoparticles synthesized in a flow-based microreactor. To this end, an automated NMR relaxometer device was presented to determine the transversal and longitudinal relaxation times of magnetic iron oxide nanoparticles obtained by online flow-based microreactor synthesis. Though this system showed very high sensitivity, it requires a rather long time (minutes) to determine the relaxation times compared to the MPS measurement time of the system presented here. Furthermore, the magnetic field of 0.5 T required to detect the proton resonance was much higher than the excitation field of some tens of millitesla and might lead to aggregation or chain formation of the MNP during the NMR-measurements. However, both techniques are efficient tools capable of speeding up synthesis optimization and product characterization of MNP to be developed for biomedical, theranostic, and biosensing applications.
4. Summary and Conclusions
In this work, the continuous micromixer synthesis of single-core iron oxide magnetic nanoparticles was presented and compared with batch synthesis. Continuous micromixer synthesis has many advantages over conventional batch synthesis regarding reproducibility, simplicity, time exposure, quality of the product, and upscaling capability of the procedure. The influence of the two (most) important synthesis parameters—the reaction temperature and the residence time (either adjusted by the total flow rate or the tubing volume)—of the reaction was studied. The impact of Ts and tr on size, size distribution, and the stability of the MNP was directly reflected in the magnetic properties measured by magnetic particles spectroscopy and AC-susceptibility measurements. In this way, the tunability of our approach was clearly demonstrated since, by variation of input parameters, the resulting product properties are changed in a unique and highly reproducible way.
The operation of the newly developed benchtop MPS device connected to the growth stage of the micromixer platform directly probing the magnetic properties during the synthesis pointed out the great potential of this highly sensitive and fast magnetic technique. Once established as an integrated inline analytic process tool, it could substantially accelerate particle development while monitoring the magnetic quality of the nanoparticles.
The advantage of the micromixer technology is that the influence of different process parameters can be investigated comprehensively to gain a better process understanding. With this, the superiority of microfluidics can be fully exploited, i.e., its excellent mass and heat transfer and its rapid and controlled synthesis conditions. We understand that our micromixer approach in this way is unique, that is, it is tunable: by variation of input parameters, the resulting product properties are manipulated in a highly reproducible way. Moreover, the micromixer technology is capable of operating under nearly identical process conditions at large scales (at least in the decaliter range), as well.
The presented continuous micromixer technology to produce high-quality single-core iron oxide magnetic nanoparticles might become a valuable tool to promote the standardized manufacturing of magnetic nanoparticle systems for nanomedicine applications, thereby fostering the translation of laboratory nanoparticle systems into clinical products, including safety, regulatory, and ethical requirements.
Author Contributions
A.B. performed the synthesis and physicochemical characterization of the samples; A.R. carried out magnetic characterization; N.L., A.B. performed online-MPS measurements; A.B., R.B., F.W. wrote the manuscript; R.B., F.W. reviewed and edited the manuscript. Work was supervised by R.B. (synthesis, characterization) and F.W. (magnetic measurements); project administration, R.B. and F.W.; funding acquisition, R.B. and F.W. All authors have read and agreed to the published version of the manuscript.
Funding
This research was funded by the Deutsche Forschungsgemeinschaft (DFG) within the research grants “Core Facility: Metrology of Ultra-Low Magnetic Fields”, grant numbers KO5321/3 and TR408/11” and the collaborative research center “Matrix in Vision” (SFB 1340/1 2018, no 372486779, projects A02). R.B. thanks the Fraunhofer-Gesellschaft for the support within the Fraunhofer TALENTA program. Abdulkader Baki thanks the Friedrich Ebert Stiftung for a Ph.D. fellowship supporting his work related to this project.
Acknowledgments
Many thanks to Michael Steiert from the Department of Physical Chemistry of Polymers at the Max Planck Institute for Polymer Research for supporting XRD measurements. Special thanks to Helen Onyema for the proofreading of the manuscript.
Conflicts of Interest
The authors declare no conflict of interest.
Appendix A
The magnetic AC susceptibility (ACS) was a complex signal measured in the form χ = χ′ + iχ″, where the real part χ′ denoted the susceptibility component of the nanoparticle moments that was in-phase with the applied AC magnetic field, and the imaginary part χ″ was the corresponding out-of-phase component. The relative ratio of the two components revealed the phase lag between particle moment and applied AC field, and this led for χ′ = χ″ to a 45° phase angle. The maximum of χ″ was reached for blocked nanoparticles (no Néel relaxation, e.g., iron oxide cores with diameters larger 20 nm at room temperature) when the Brownian relaxation time was equal to the rotational cycle time of the applied field. This was revealed as a peak in the χ″ susceptibility component as a function of frequency. For larger hydrodynamic sizes, e.g., for longer Brownian relaxation times, this peak shifted to lower frequencies. Thus, ACS measurements as a function of frequency enabled the assessment of hydrodynamic sizes of magnetic nanoparticles.
Figure A1 shows the ACS signals normalized to the iron amount of single-core iron oxide nanoparticles synthesized by continuous micromixer synthesized at different residence times tr (adjusted by tube length) as a function of frequency. At low frequencies, χ′ was constant, e.g., the moments could follow the AC field, from which the initial susceptibility χini could be determined, extrapolating χ′ for f→0. At higher frequencies, χ′ was gradually decreasing, and the larger moments no longer could follow the excitation, leading to a phase lag, and thus the imaginary part χ″ was increasing, showing a pronounced peak at the inflection point of χ′. With increasing residence time tr, e.g., increasing core particle size, the initial susceptibility χini increased. At the same time, the peak in χ″ was shifted towards lower frequencies because with increasing core size, the hydrodynamic diameter increased, as well.

Figure A1.
AC susceptibility versus frequency of continuous micromixer samples synthesized at different residence times adjusted by tubing length. (a) real part c′, (b) imaginary part c″.

Similar behavior was observed for the ACS signals normalized to the iron amount of single-core iron oxide nanoparticles synthesized by continuous micromixer at different reaction temperatures Ts. As displayed in Figure A2, here again, an increase of χini with increasing Ts was observed. But for Ts ≥ 60 °C, χini dropped again. The sample synthesized at Ts = 65 °C showed an aggregation tendency since it exhibited a non-zero χ″ component and no constant plateau in the χ′ component for lower frequencies.

Figure A2.
AC susceptibility versus frequency of continuous micromixer samples synthesized at different reaction temperatures Ts. (a) real part c′, (b) imaginary part c″.

The initial susceptibility χini was proportional to the (mean) size of the magnetic nanoparticle moments and could be related to the characteristic three MPS parameters—A3*, A5/A3, and ϕ3—via the corresponding residence time tr or synthesis temperature Ts, as shown in Figure 12. This allowed the magnetic assessment of the impact of Ts and tr variation on the magnetic behavior of the resulting nanoparticles.
To assess the crystal structure and iron oxide phase of samples manufactured at three different core diameter sizes in the range 25 nm to 35 nm by variation of the residence time, XRD 2θ wide-angle scans were carried out, as shown in Figure A3. The corresponding indices of a magnetite crystal structure (which are nearly the same as for γ-Fe2O3) at the main peak positions were taken from the JCPDS card no. #75-0033 (Fe3O4) and # 39-1346 (γ-Fe2O3).

Figure A3.
XRD spectra of three micromixer samples with average core diameters dc of about 25 nm (blue), 27 nm (red), and 35 nm (green) obtained by micromixer synthesis at different residence times tr at a synthesis temperature of Ts = 52 °C.

References
- Weissleader, R.; Elizondo, G.; Wittenberg, J.; Rabito, C.A.; Bangele, H.H.; Josephon, L. Ultrasmall superparamagnetic iron oxide: Characterization of a new class of contrast agents for MR imaging. Radiology 1990, 489–493. [Google Scholar] [CrossRef]
- Jariwala, D.; Sangwan, V.K.; Lauhon, L.J.; Marks, T.J.; Hersam, M.C. Carbon nanomaterials for electronics, optoelectronics, photovoltaics, and sensing. Chem. Soc. Rev. 2013, 42, 2824–2860. [Google Scholar] [CrossRef] [PubMed]
- Astruc, D. Nanoparticles and Catalysis; Wiley-VCH: Weinheim, Germany, 2008; Volume 1. [Google Scholar]
- Cornell, R.M.; Schwertmann, U. The Iron Oxides: Structure, Properties, Reactions, Occurences and Uses, 2nd ed.; Wiley-VCH: Weinheim, Germany, 2003. [Google Scholar]
- Gupta, A.G.; Gupta, M. Synthesis and surface engineering of iron oxide nanoparticles for biomedical applications. Biomaterials 2005, 3995–4021. [Google Scholar] [CrossRef] [PubMed]
- Moghimi, S.M.; Hunter, A.C.; Murray, J.C. Long-circulating and target-specific nanoparticles: Theory to practice. Pharmacol. Rev. 2001, 53, 283–318. [Google Scholar] [PubMed]
- Curtis, A.S.G.; Wilkonson, C. Nanotechniques and approaches in biotechnology. Trends Biotechnol. 2001, 97–101. [Google Scholar] [CrossRef]
- Wilkinson, J.M. Nanotechnology applications in medicine. Med. Device Technol. 2003, 14, 29–31. [Google Scholar]
- Mody, V.V.; Cox, A.; Shah, S.; Singh, A.; Bevins, W.; Parihar, H. Magnetic nanoparticle drug delivery systems for targeting tumor. Appl. Nanosci. 2014, 4, 385–392. [Google Scholar] [CrossRef]
- Dutz, S.; Hergt, R. Magnetic nanoparticle heating and heat transfer on a microscale: Basic principles, realities and physical limitations of hyperthermia for tumour therapy. Int. J. Hyperth. 2013, 29, 790–800. [Google Scholar] [CrossRef]
- Dennis, C.L.; Ivkov, R. Physics of heat generation using magnetic nanoparticles for hyperthermia. Int. J. Hyperth. 2013, 29, 715–729. [Google Scholar] [CrossRef]
- Jin, R.; Lin, B.; Li, D.; Ai, H. Superparamagnetic iron oxide nanoparticles for MR imaging and therapy: Design considerations and clinical applications. Curr. Opin. Pharmacol. 2014, 18, 18–27. [Google Scholar] [CrossRef]
- Stark, D.D.; Weissleder, R.; Elizondo, C.; Hahn, P.F.; Saini, S.; Todd, L.E.; Wittenberg, J.; Ferrucci, J.T. Superparamagnetic iron oxide: Clinical application as a contrast agent for MR imaging of the liver. Radiology 1988, 168, 297–301. [Google Scholar] [CrossRef] [PubMed]
- Gleich, B.; Weizenecker, J. Tomographic imaging using the nonlinear response of magnetic particles. Nature 2005, 1214–1217. [Google Scholar] [CrossRef] [PubMed]
- Ali, A.; Zafar, H.; Zia, M.; Ul Haq, I.; Phull, A.R.; Ali, J.S.; Hussain, A. Synthesis, characterization, applications, and challenges of iron oxide nanoparticles. Nanotechnol. Sci. Appl. 2016, 9, 49–67. [Google Scholar] [CrossRef] [PubMed]
- Teeman, E.; Shasha, C.; Evans, J.E.; Krishnan, K.M. Intracellular dynamics of superparamagnetic iron oxide nanoparticles for magnetic particle imaging. Nanoscale 2019, 11, 7771–7780. [Google Scholar] [CrossRef]
- Ludwig, F.; Guillaume, A.; Schilling, M.; Frickel, N.; Schmidt, A.M. Determination of core and hydrodynamic size distributions of CoFe2O4 nanoparticle suspensions using ac susceptibility measurements. J. Appl. Phys. 2010, 108, 33918. [Google Scholar] [CrossRef]
- Patsula, V.; Moskvin, M.; Dutz, S.; Horák, D. Size-dependent magnetic properties of iron oxide nanoparticles. J. Phys. Chem. Solids 2016, 24–30. [Google Scholar] [CrossRef]
- Wei, H.; Bruns, O.T.; Kaul, M.G.; Hansen, E.C.; Barch, M.; Wiśniowska, A.; Chen, O.; Chen, Y.; Li, N.; Okada, S.; et al. Exceedingly small iron oxide nanoparticles as positive MRI contrast agents. Proc. Natl. Acad. Sci. USA 2017, 114, 2325–2330. [Google Scholar] [CrossRef]
- Yu, W.W.; Falkner, J.C.; Yavuz, C.T.; Colvin, V.L. Synthesis of monodisperse iron oxide nanocrystals by thermal decomposition of iron carboxylate salts. Chem. Commun. (Camb.) 2004, 2306–2307. [Google Scholar] [CrossRef]
- Gash, A.E.; Tillostonm, T.M.; Stacher, J.H.; Poco, J.F.; Hrubesh, L.W.; Simpson, R.L. Use of Epoxides in the Sol−Gel Synthesis of Porous Iron(III) Oxide Monoliths from Fe(III) Salts. Chem. Mater. 2001, 999–1007. [Google Scholar] [CrossRef]
- Fernandes, M.T.C.; Garcia, R.B.R.; Leite, C.A.P.; Kawachi, E.Y. The competing effect of ammonia in the synthesis of iron oxide/silica nanoparticles in microemulsion/sol–gel system. Colloids Surf. A Physicochem. Eng. Asp. 2013, 422, 136–142. [Google Scholar] [CrossRef]
- Kandpal, N.D.; Sah, N.; Loshali, R.; Prasad, J. Co-Precipitation method of synthesis and characterization of iron oxide nanoparticles. J. Sci. Ind. Res. 2014, 73, 87–90. [Google Scholar]
- Okoli, C.; Sanchez-Dominguez, M.; Boutonnet, M.; Jaras, S.; Civera, C.; Solans, C.; Kuttuva, G.R. Comparison and Functionalization Study of Microemulsion-Prepared Magnetic Iron Oxide Nanoparticles. Langmuir 2012, 8479–8485. [Google Scholar] [CrossRef] [PubMed]
- Lv, Y.; Wang, H.; Wang, X.; Bai, J. Synthesis, characterization and growing mechanism of monodisperse Fe3O4 microspheres. J. Cryst. Growth 2009, 311, 3445–3450. [Google Scholar] [CrossRef]
- Hoa, Y.; Teja, A.S. Continuous hydrothermal crystallization of α–Fe2O3 and Co3O4 nanoparticles. J. Mater. Res. 2003, 415–422. [Google Scholar] [CrossRef]
- Chen, D.; Xu, R. Hydrothermal synthesis and characterization of nanocrystalline Fe3O4 powders. Mater. Res. Bull. 1998, 1015–1021. [Google Scholar] [CrossRef]
- Xu, C.; Teja, A.S. Continuous hydrothermal synthesis of iron oxide and PVA-protected iron oxide nanoparticles. J. Supercrit. Fluids 2008, 44, 85–91. [Google Scholar] [CrossRef]
- Khalafalla, S.; Reimers, G. Preparation of dilution-stable aqueous magnetic fluids. IEEE Trans. Magn. 1980, 178–183. [Google Scholar] [CrossRef]
- Massart, R. Preparation of aqueous ferrofluids without using surfactant—Behavior as a function of the pH and the counterions. Comptes Rendus Hebd. Seances Acad. Sci. Serie C 1980, 291, 1–3. [Google Scholar]
- Faivre, D.; Schuler, D. Magnetotactic Bacteria and Magnetosomes. Chem. Rev. 2008, 4875–4898. [Google Scholar] [CrossRef]
- Hyeon, T.; Lee, S.S.; Park, J.; Chung, Y.; Bin Na, H. Synthesis of highly crystalline and monodisperse maghemite nanocrystallites without a size-selection process. J. Am. Chem. Soc. 2001, 12798–12801. [Google Scholar] [CrossRef]
- Park, J.; Lee, E.; Hwang, N.M.; Kang, M.S.; Kim, S.C.; Hwang, Y.; Park, J.G.; Noh, H.J.; Kini, J.Y.; Park, J.H.; et al. One-nanometer-scale size-controlled synthesis of monodisperse magnetic iron oxide nanoparticles. Angew. Chem. Int. Ed. 2005, 2872–2877. [Google Scholar] [CrossRef]
- Pablico-Lansigan, M.H.; Situ, S.F.; Samia, A.C.S. Magnetic particle imaging: Advancements and perspectives for real-time in vivo monitoring and image-guided therapy. Nanoscale 2013, 5, 4040–4055. [Google Scholar] [CrossRef] [PubMed]
- Khandhar, A.P.; Ferguson, R.M.; Simon, J.A.; Krishnan, K.M. Tailored magnetic nanoparticles for optimizing magnetic fluid hyperthermia. J. Biomed. Mater. Res. A 2012, 100, 728–737. [Google Scholar] [CrossRef] [PubMed]
- Ferguson, R.M.; Khandhar, A.P.; Kemp, S.J.; Arami, H.; Saritas, E.U.; Croft, L.R.; Konkle, J.; Goodwill, P.W.; Halkola, A.; Rahmer, J.; et al. Magnetic Particle Imaging with Tailored Iron Oxide Nanoparticel Tracers. IEEE Trans. Magn. 2015, 1077–1084. [Google Scholar] [CrossRef]
- Vangijzegem, T.; Stanicki, D.; Panepinto, A.; Socoliuc, V.; Vekas, L.; Muller, R.N.; Laurent, S. Influence of Experimental Parameters of a Continuous Flow Process on the Properties of Very Small Iron Oxide Nanoparticles (VSION) Designed for T1-Weighted Magnetic Resonance Imaging (MRI). Nanomaterials 2020, 10, 757. [Google Scholar] [CrossRef]
- Ma, J.; Lee, S.M.-Y.; Yi, C.; Li, C.-W. Controllable synthesis of functional nanoparticles by microfluidic platforms for biomedical applications—A review. Lab Chip 2017, 17, 209–226. [Google Scholar] [CrossRef]
- Gutierrez, L.; Gomez, L.; Irusta, S.; Arruebo, M.; Santamaria, J. Comparative study of the synthesis of silica nanoparticles in micromixer–microreactor and batch reactor systems. Chem. Eng. 2011, 171, 674–683. [Google Scholar] [CrossRef]
- Girod, M.; Vogel, S.; Szczerba, W.; Thünemann, A.F. How temperature determines formation of maghemite nanoparticles. J. Magn. Magn. Mater. 2015, 380, 163–167. [Google Scholar] [CrossRef]
- Panariello, L.; Wu, G.; Besenhard, M.O.; Loizou, K.; Storozhuk, L.; Thanh, N.T.K.; Gavriilidis, A. A Modular Millifluidic Platform for the Synthesis of Iron Oxide Nanoparticles with Control over Dissolved Gas and Flow Configuration. Materials 2020, 13, 1019. [Google Scholar] [CrossRef]
- Suryawanshi, P.L.; Sonawane, S.H.; Bhanvase, B.A.; Ashokkumar, M.; Pimplapure, M.S.; Gogate, P.R. Synthesis of iron oxide nanoparticles in a continuous flow spiral microreactor and Corning® advanced flow™ reactor. Green Process. Synth. 2018, 7, 1–11. [Google Scholar] [CrossRef]
- Simmons, M.; Wiles, C.; Rocher, V.; Francesconi, M.G.; Watts, P. The Preparation of Magnetic Iron Oxide Nanoparticles in Microreactors. J. Flow Chem. 2013, 3, 7–10. [Google Scholar] [CrossRef]
- Abou Hassan, A.; Sandre, O.; Cabuil, V.; Tabeling, P. Synthesis of iron oxide nanoparticles in a microfluidic device: Preliminary results in a coaxial flow millichannel. Chem. Commun. (Camb.) 2008, 1783–1785. [Google Scholar] [CrossRef]
- Norfolk, L.; Rawlings, A.E.; Bramble, J.P.; Ward, K.; Francis, N.; Waller, R.; Bailey, A.; Staniland, S.S. Macrofluidic Coaxial Flow Platforms to Produce Tunable Magnetite Nanoparticles: A Study of the Effect of Reaction Conditions and Biomineralisation Protein Mms6. Nanomaterials 2019, 9, 1729. [Google Scholar] [CrossRef] [PubMed]
- Niu, G.; Ruditskiy, A.; Vara, M.; Xia, Y. Toward continuous and scalable production of colloidal nanocrystals by switching from batch to droplet reactors. Chem. Soc. Rev. 2015, 44, 5806–5820. [Google Scholar] [CrossRef] [PubMed]
- Xu, Y.; Musumeci, V.; Aymonier, C. Chemistry in supercritical fluids for the synthesis of metal nanomaterials. React. Chem. Eng. 2019, 4, 2030–2054. [Google Scholar] [CrossRef]
- Khan, I.U.; Serra, C.A.; Anton, N.; Vandamme, T. Microfluidics: A focus on improved cancer targeted drug delivery systems. J. Control. Release 2013, 1065–1074. [Google Scholar] [CrossRef]
- Biehl, P.; von der Lühe, M.; Dutz, S.; Schacher, F.H. Synthesis, Characterization, and Applications of Magnetic Nanoparticles Featuring Polyzwitterionic Coatings. Polymers 2018, 10, 91. [Google Scholar] [CrossRef]
- Baki, A.; Bleul, R.; Banz, C.; Thiermann, R.; Maskos, M. Continuous synthesis of single-core iron oxide nanoparticles for biomedical applications. In 6th International Workshop on Magnetic Particle Imaging (IWMPI); Infinite Science Publishing: Lübeck, Germany, 2016; p. 100. [Google Scholar]
- Baki, A.; Löwa, N.; Thiermann, R.; Banz, C.; Maskos, M.; Wiekhorst, F.; Bleul, R. Continuous synthesis of single core iron oxide nanoparticles for MPI tracer development. IJMPI 2017, 3. [Google Scholar] [CrossRef]
- Hessel, V.; Löwe, H.; Stange, T. Micro chemical processing at IMM--from pioneering work to customer-specific services. Lab Chip 2002, 2, 14–21. [Google Scholar] [CrossRef]
- Schönfeld, F.; Hessel, V.; Hofmann, C. An optimised split-and-recombine micro-mixer with uniform chaotic mixing. Lab Chip 2004, 4, 65–69. [Google Scholar] [CrossRef]
- Walter, J.; Thajudeen, T.; Süß, S.; Segets, D.; Peukert, W. New possibilities of accurate particle characterisation by applying direct boundary models to analytical centrifugation. Nanoscale 2015, 7, 6574–6587. [Google Scholar] [CrossRef] [PubMed]
- Pyenson, H.; Tracy, P.H. A 1,10—Phenanthroline Method for the Determination of Iron in Powdered Milk. Int. J. Dairy Sci. 1945, 28, 401–412. [Google Scholar] [CrossRef]
- Löwa, N.; Seidel, M.; Radon, P.; Wiekhorst, F. Magnetic nanoparticles in different biological environments analyzed by magnetic particle spectroscopy. J. Magn. Magn. Mater. 2017, 427, 133–138. [Google Scholar] [CrossRef]
- Löwa, N.; Gutkelch, D.; Welge, E.A.; Welz, R.; Meier, F.; Baki, A.; Bleul, R.; Klein, T.; Wiekhorst, F. Novel benchtop Magnetic Particle Spectrometer for process monitoring of magnetic nanoparticle synthesis. Nanomaterials 2020, in press. [Google Scholar]
- Dadfar, S.M.; Roemhild, K.; Drude, N.I.; von Stillfried, S.; Knüchel, R.; Kiessling, F.; Lammers, T. Iron oxide nanoparticles: Diagnostic, therapeutic and theranostic applications. Adv. Drug Deliv. Rev. 2019, 138, 302–325. [Google Scholar] [CrossRef]
- Poller, W.C.; Löwa, N.; Wiekhorst, F.; Taupitz, M.; Wagner, S.; Möller, K.; Baumann, G.; Stangl, V.; Trahms, L.; Ludwig, A. Magnetic Particle Spectroscopy Reveals Dynamic Changes in the Magnetic Behavior of Very Small Superparamagnetic Iron Oxide Nanoparticles During Cellular Uptake and Enables Determination of Cell-Labeling Efficacy. J. Biomed. Nanotechnol. 2016, 12, 337–346. [Google Scholar] [CrossRef]
- Schilling, M.; Ludwig, F.; Kuhlmann, C.; Wawrzik, T. Magnetic particle imaging scanner with 10-kHz drive-field frequency. Biomed. Eng. Biomed. Tech. 2013, 58. [Google Scholar] [CrossRef]
- Eberbeck, D.; Löwa, N.; Steinhoff, U.; Viereck, T.; Schilling, M.; Trahms, L. Characterization of magnetic nanoparticle systems with respect to their magnetic particle imaging performance. Biomed. Tech. (Berl) 2013, 58, 1–11. [Google Scholar] [CrossRef]
- Ziegenbalg, D.; Kompter, C.; Schönfeld, F.; Kralisch, D. Evaluation of different micromixers by CFD simulations for the anionic polymerisation of styrene. Green Process. Synth. 2012, 1. [Google Scholar] [CrossRef]
- LaGrow, A.P.; Besenhard, M.O.; Hodzic, A.; Sergides, A.; Bogart, L.K.; Gavriilidis, A.; Thanh, N.T.K. Unravelling the growth mechanism of the co-precipitation of iron oxide nanoparticles with the aid of synchrotron X-Ray diffraction in solution. Nanoscale 2019, 11, 6620–6628. [Google Scholar] [CrossRef]
- Blesa, M.A.; Matijević, E. Phase transformations of iron oxides, oxohydroxides, and hydrous oxides in aqueous media. Adv. Colloid Interface Sci. 1989, 173–221. [Google Scholar] [CrossRef]
- Hou, Y.; Xu, Z.; Sun, S. Controlled synthesis and chemical conversions of FeO nanoparticles. Angew. Chem. Int. Ed. Engl. 2007, 46, 6329–6332. [Google Scholar] [CrossRef] [PubMed]
- Bleul, R.; Baki, A.; Freese, C.; Paysen, H.; Kosch, O.; Wiekhorst, F. Continuously manufactured single-core iron oxide nanoparticles for cancer theranostics as valuable contribution in translational research. Nanoscale Adv. 2020. [Google Scholar] [CrossRef]
- Ozel, F.; Kockar, H.; Karaagac, O. Growth of Iron Oxide Nanoparticles by Hydrothermal Process: Effect of Reaction Parameters on the Nanoparticle Size. J. Supercond Nov Magn. 2015, 28, 823–829. [Google Scholar] [CrossRef]
- Lu, A.-H.; Salabas, E.L.; Schüth, F. Magnetische Nanopartikel: Synthese, Stabilisierung, Funktionalisierung und Anwendung. Angew. Chem. 2007, 119, 1242–1266. [Google Scholar] [CrossRef]
- Li, Q.; Kartikowati, C.W.; Horie, S.; Ogi, T.; Iwaki, T.; Okuyama, K. Correlation between particle size/domain structure and magnetic properties of highly crystalline Fe3O4 nanoparticles. Sci. Rep. 2017, 7, 9894. [Google Scholar] [CrossRef]
- Gul, S.; Khan, S.B.; Rehman, I.U.; Khan, M.A.; Khan, M.I. A Comprehensive Review of Magnetic Nanomaterials Modern Day Theranostics. Front. Mater. 2019, 6, 179. [Google Scholar] [CrossRef]
- Modo, M.M.J.; Bulte, J.W.M.; Kim, E.E. Molecular and Cellular MR Imaging, 1st ed.; CRC Press: Boca Raton, FL, USA, 2007. [Google Scholar]
- Hufschmid, R.; Arami, H.; Ferguson, R.M.; Gonzales, M.; Teeman, E.; Brush, L.N.; Browning, N.D.; Krishnan, K.M. Synthesis of phase-pure and monodisperse iron oxide nanoparticles by thermal decomposition. Nanoscale 2015, 7, 11142–11154. [Google Scholar] [CrossRef]
- Bemetz, J.; Wegemann, A.; Saatchi, K.; Haase, A.; Häfeli, U.O.; Niessner, R.; Gleich, B.; Seidel, M. Microfluidic-Based Synthesis of Magnetic Nanoparticles Coupled with Miniaturized NMR for Online Relaxation Studies. Anal. Chem. 2018, 90, 9975–9982. [Google Scholar] [CrossRef]


© 2020 by the authors. Licensee MDPI, Basel, Switzerland. This article is an open access article distributed under the terms and conditions of the Creative Commons Attribution (CC BY) license (http://creativecommons.org/licenses/by/4.0/).