Article

CO2 Adsorption in Metal-Organic Framework Mg-MOF-74: Effects of Inter-Crystalline Space

School of Earth Sciences, The Ohio State University, 275 Mendenhall Laboratory, 125 S Oval Mall, Columbus, OH 43210, USA
*
Author to whom correspondence should be addressed.
Nanomaterials 2020, 10(11), 2274; https://doi.org/10.3390/nano10112274
Submission received: 13 October 2020 / Revised: 9 November 2020 / Accepted: 13 November 2020 / Published: 17 November 2020
(This article belongs to the Section Inorganic Materials and Metal-Organic Frameworks)

Abstract

:
Metal-Organic Frameworks (MOF) have been identified as highly efficient nanoporous adsorbents for CO2 storage. In particular, Mg-MOF-74 has been shown to promise exceptionally high CO2 sorption. Although several studies have reported adsorption isotherms of CO2 in Mg-MOF-74, the effect of inter-crystalline spacing in Mg-MOF-74 on the sorption of CO2 has not been addressed. These effects have been shown to be profound for a quadrupolar molecule like CO2 in the case of silicalite (Phys. Chem. Chem. Phys. 22 (2020) 13951). Here, we report the effects of inter-crystalline spacing on the adsorption of CO2 in Mg-MOF-74, studied using grand canonical Monte Carlo (GCMC) simulations. The inter-crystalline spacing is found to enhance adsorption at the crystallite surfaces. Larger inter-crystalline spacing up to twice the kinetic diameter of CO2 results in higher adsorption and larger crystallite sizes suppress adsorption. Magnitudes of the inter-crystalline space relative to the kinetic diameter of the adsorbed fluid and the surface to volume ratio of the adsorbent crystallites are found to be important factors determining the adsorption amounts. The results of this study suggest that the ideal Mg-MOF-74 sample for CO2 storage applications should have smaller crystallites separated from each other with an inter-crystalline space of approximately twice the kinetic diameter of CO2.

Graphical Abstract

1. Introduction

Over the past two centuries, atmospheric CO2 abundance has risen substantially [1]. As CO2 is a major contributor to the total energy balance that is resulting in a rise in the Earth’s temperature [2], the rise in CO2 abundance in the atmosphere is a cause of concern. Several strategies have been proposed to contain this rise and include, among others, CO2 capture and storage [3,4]. Nano-porous adsorbent materials, due to their high surface areas, can store a large amount of CO2 [5]. Prominent among these nano-porous materials are zeolites [6], and metal-organic frameworks (MOF) [7]. In addition to a large surface area, MOFs offer strong interaction of CO2 with open metal sites, thereby enhancing the adsorption amounts. In particular, Mg-MOF-74 has been found to adsorb large amounts of CO2 especially at low partial pressures, a condition relevant to possible applications in selectively adsorbing CO2 from a mixture in flue gas [8]. For this reason, several computational as well as experimental studies have been carried out to investigate various aspects of CO2 in Mg-MOF-74 [9,10,11,12,13].
In an experiment of adsorption of a fluid on a nano-porous material, the adsorbent normally consists of a large number of crystallites forming particle grains. These particle grains in turn are separated from each other and give a powder sample the grainy appearance. As a result of this, a substantial amount of empty space exists in a powder sample of an adsorbent in addition to the pores in each crystallite. The effects of this extra-crystalline space on the structural and dynamical properties of sorbed fluid have been reported in several systems [14,15,16]. In a recent computational study [17] on the adsorption of ethane and CO2 in silicalite, it was found that the inter-crystalline space can profoundly affect the adsorption behavior. Further, it was found that these effects are more important for CO2 as compared to ethane. This is possibly due to the quadrupole moment of CO2 that makes its interaction with the substrate stronger than that of ethane. The quadrupolar nature of CO2 also results in a stronger adsorption of CO2 compared to hydrocarbons [18,19,20,21,22] and facilitates the separation of CO2 from a mixture with hydrocarbons [23,24]. Because of this selective adsorption, CO2 can also enhance the motion of confined hydrocarbons [25,26,27,28].
To the best of our knowledge, no systematic study, computational or experimental, on the effects of inter-crystalline spaces on the adsorption of CO2 in Mg-MOF-74 has been reported. Given the importance of adsorption of CO2 in Mg-MOF-74, a study of the effects of inter-crystalline space on this system is needed. With this objective, we report here grand canonical Monte Carlo (GCMC) simulation studies on the adsorption of CO2 in Mg-MOF-74. In Section 2, we provide details of the simulations. Results from the study are presented in Section 3 while their implications are discussed in Section 4. Major conclusions drawn from the study are listed in Section 5.

2. Materials and Methods

All simulations reported in this study were carried out using DL_Monte [29]. Unit cell coordinates of Mg-MOF-74 have been optimized by Yazgir et al. [8] and a cif file of this optimized cell was obtained from the repository [30] of the software package RASPA developed by an international collaboration between the University of Amsterdam and Delft University of Technology from the Netherlands, Universidad Pablo de Olavide, Seville, Spain and Northwestern University, Evanston, IL, USA [31]. They were used without further refinement. A single unit cell was replicated 2 × 2 × 6 times using the visualization software Vesta developed by Momma and Izumi, Ibaraki, Japan [32]. This simulation cell is designated as S0 (0 denoting the absence of any inter-crystalline spacing) and constitutes a crystallite. Further simulation cells were obtained by leaving an empty space of 1.5, 2.5, 5.0, or 7.5 Å on all sides of S0 to obtain 4 different simulation cells. These are designated S1, S2, S3, and S4, respectively. A representative snapshot from the simulation of CO2 adsorption in S4 is shown in Figure 1a,b. The simulation cell S0 or the crystallite can be seen within the colored boundaries in Figure 1a,b, while the boundary of the simulation cell S4 is marked with black lines (S4 = S0 + empty space). Surfaces of the crystallite parallel to the cell vectors a, b, and c, respectively named A, B, and C, can also be identified. With periodic boundary conditions applied in all directions, these simulation cells thus represent an infinite number of crystallites separated from each other by inter-crystalline spaces of 3, 5, 10, or 15 Å, respectively, as can be seen in Figure 1c for the representative case of S4. Results reported below indicate that S1 and S2 progressively exhibited significantly higher amounts of CO2 compared to S0, whereas further widening of the inter-crystalline space in S3 and S4 resulted in only marginal increase in the adsorbed amount. For this reason, additional simulations on different simulation cells with the same inter-crystalline space as in S2 were carried out to investigate the effects of variable surfaces and crystallite size. To investigate the difference in the behavior of different surfaces of S0 exposed, we prepared three simulation cells with empty spacing only on two of the six surfaces while the other four surfaces had no empty spacings. In other words, only two surfaces at a time were exposed to the inter-crystalline space in these systems. These are named A2, B2 and C2 according to the surface that is exposed to the inter-crystalline space (see Figure 1). Finally to probe the effect of crystallite size, we prepared both a small and large supercell using 1 × 1 × 4 and 3 × 3 × 9 unit cells, respectively, with empty spacing of 2.5 Å on all sides (resulting in an inter-crystalline spacing of 5 Å). These are labelled as T2 (small/tiny) and L2 (large), respectively. A summary of all the simulation cells used in this study is provided in Table 1.
The initial configuration considered one CO2 molecule placed in all the simulation cells in a pore. During the simulation, the guest molecules, i.e., CO2, could be inserted/deleted, translated, or rotated with respective probabilities of 0.5, 0.25, and 0.25, while all Mg-MOF-74 atoms were kept rigid. Although use of flexible MOF in the simulations has been found to result in more accurate adsorption isotherms, the flexible framework is found to have a significant effect only for tight-fitting larger molecules, while for a small molecule like CO2 a rigid framework can provide reasonable accuracy [33]. All simulations were carried out using a series of gas partial pressures (up to 100 atm) at 298 K. In DL_Monte, it is possible to directly use partial pressure of the gas instead of chemical potential as the imposed quantity. This is done by using the following selection procedures for the insertion (Pi) or deletion (Pd) of a molecule.
Pi = min{1,(βVP)exp(−βΔU)/(N + 1)}
Pd = min{1,(N/βVP)exp(−βΔU)}
where V is the simulation cell volume, P is the partial pressure of the gas, U represents the potential energy, N is the number of molecules and β = (kBT)−1; kB being the Boltzmann constant. To investigate possible temperature dependence in the effects of inter-crystalline space on the adsorption of CO2 additional simulations at 0.1, 1.0, and 10.0 atm partial pressures were carried out at 278, 288, and 308 K for S0, S2, and S4. CO2 was modeled with the TraPPE-UA force field [34], while the force field and partial charges identified by Yazgir et al. [8] were used to model Mg-MOF-74. This latter force field in turn employed a combination of UFF [35] and DREIDIG [36] force fields. All cross-term interactions were calculated using the Lorentz–Berthelot mixing rules [37]. Following the recommendation for TraPPE force field as used in this work, we have used a cut-off radius of 14 Å. The long-range electrostatic interactions were calculated using the Ewald sum method [37]. Each simulation used 2 million Monte Carlo steps, out of which the first 500,000 steps were discarded to ensure the best values at equilibrium. Coordinates were sampled every 10,000 steps. The total number of CO2 molecules adsorbed in the simulation cell at a given partial pressure were recorded after every 10,000 MC steps, as a result of which a large data for the number adsorbed molecules were obtained over the 2 million steps after discarding the first 500,000 MC steps for equilibration. The number of adsorbed molecules (Nads) at a given pressure as reported here was calculated from this data set by averaging over the 150 recorded values. The uncertainty in this was estimated as the standard deviation in the value of Nads. The symbol size in all the figures reported in the results section is either equal to or larger than the uncertainties in the data points.

3. Results

3.1. Effects of the Size of Inter-Crystalline Spacing

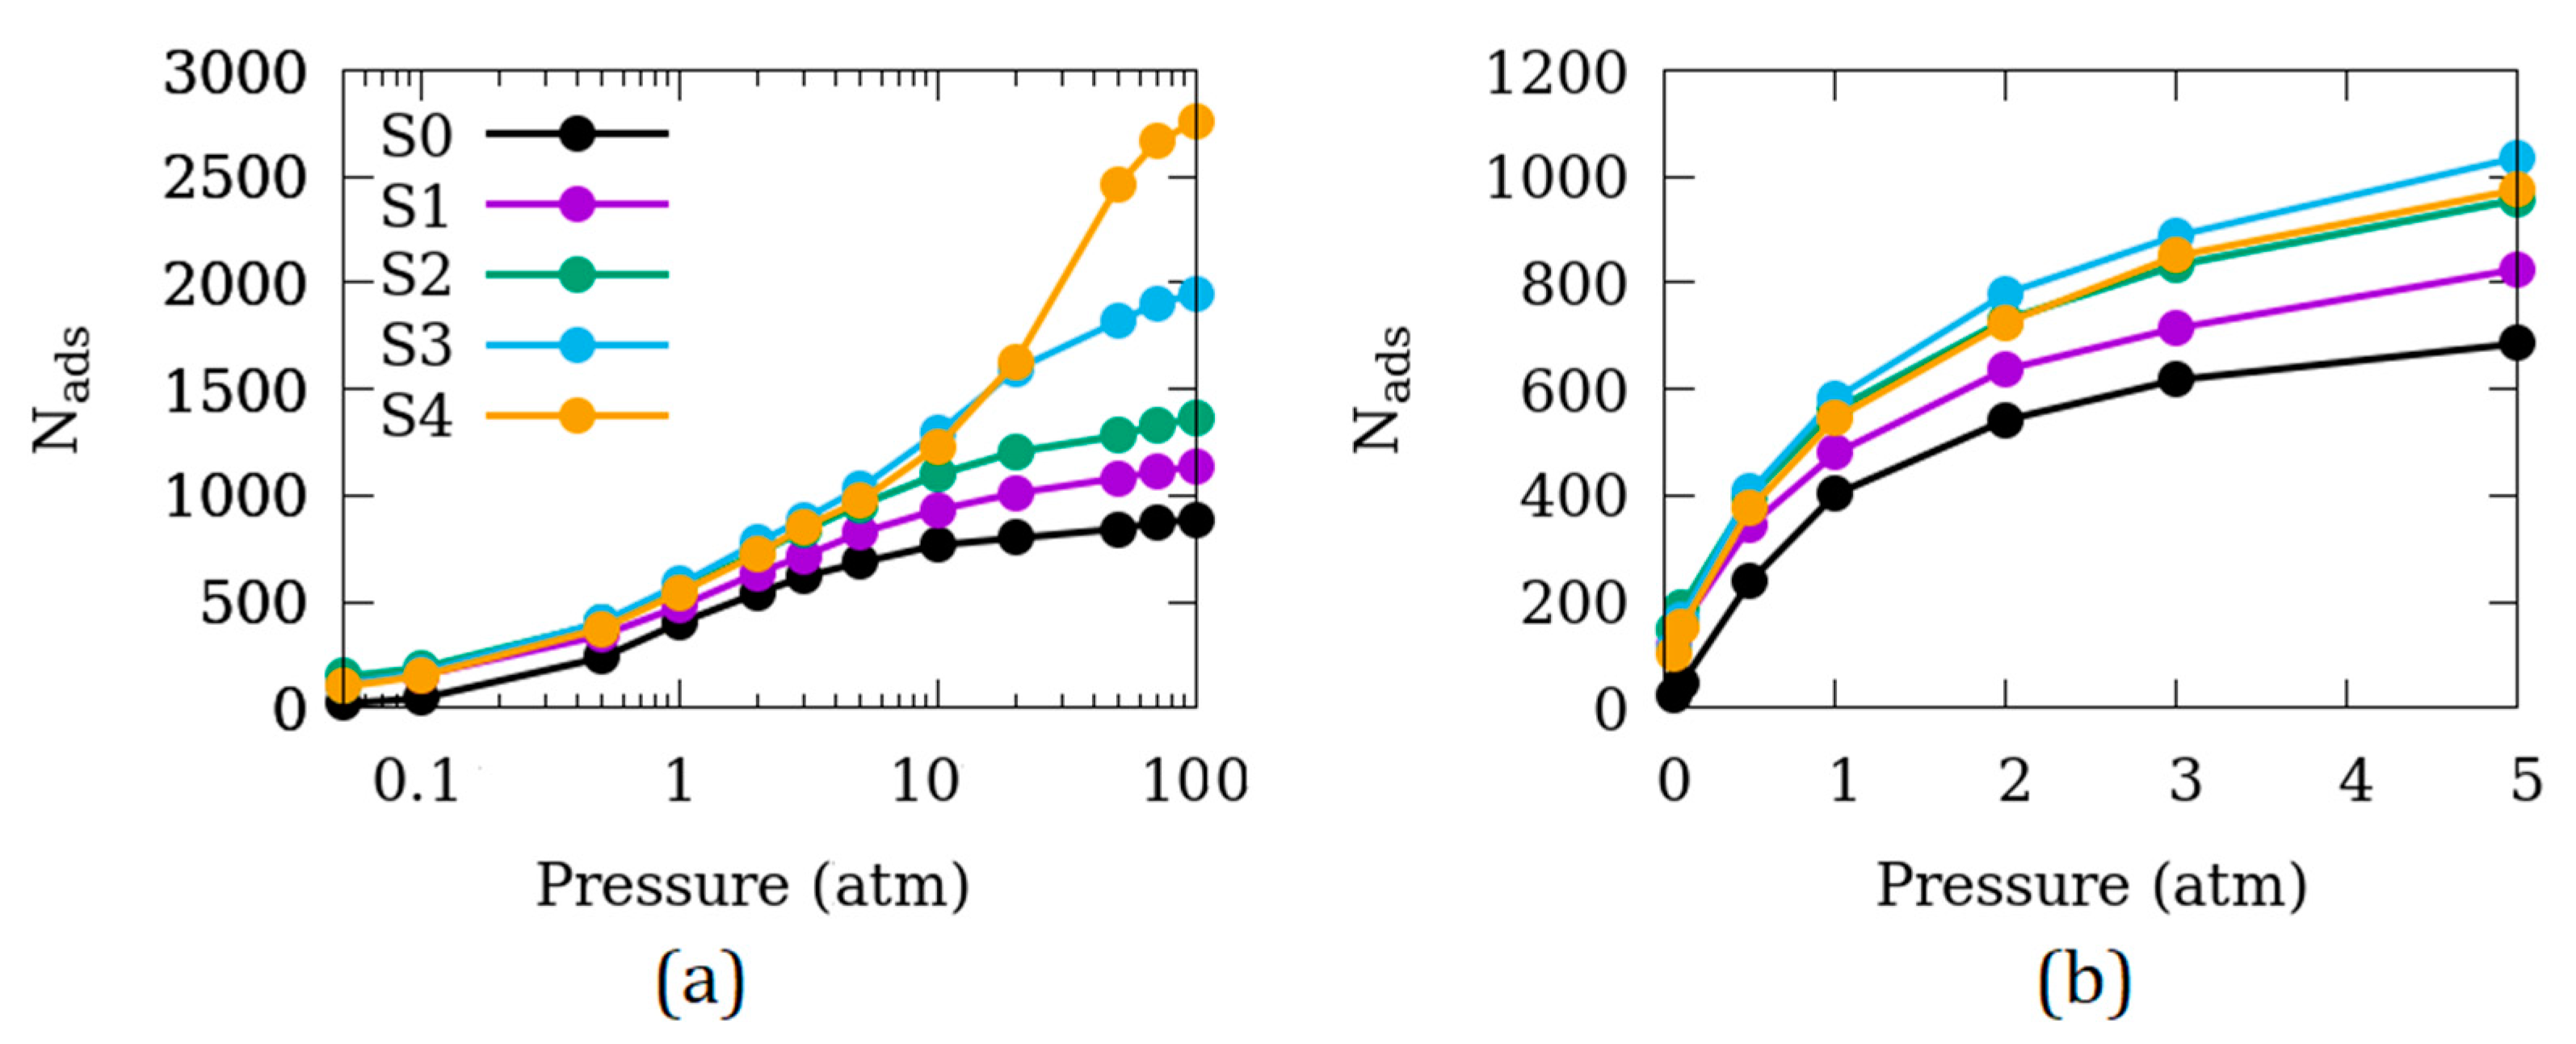
The number of CO2 molecules adsorbed (Nads) in the simulation cells S0–S4 is shown in Figure 2 as a function of the partial pressure of CO2. No normalization with respect to the adsorbent amount is carried out to represent the adsorption isotherms here, as the objective is to directly compare the amount adsorbed in different simulation cells (S0–S4). A wide range of adsorption isotherms with partial pressures up to 100 atm is shown in Figure 2a while the data at relatively low pressures relevant to applications are shown in Figure 2b. In Figure 2b, symbol size corresponds to the largest uncertainty in Nads. At high pressures (Figure 2a), the effect of inter-crystalline space on the adsorbed amount is monotonous—larger inter-crystalline space leads to higher adsorption. However, at the pressures relevant for applications (Figure 2b), this effect is non-monotonous. Initially, the adsorbed amount increases significantly adding inter-crystalline space from S0 to S2. Enhancement in the adsorption, however, is minimal from S2 to S3, and S4 even exhibits suppressed adsorption compared to S3. Based on these findings, we selected the inter-crystalline spacing of 5 Å (S2) to probe other effects as discussed in the next subsections.
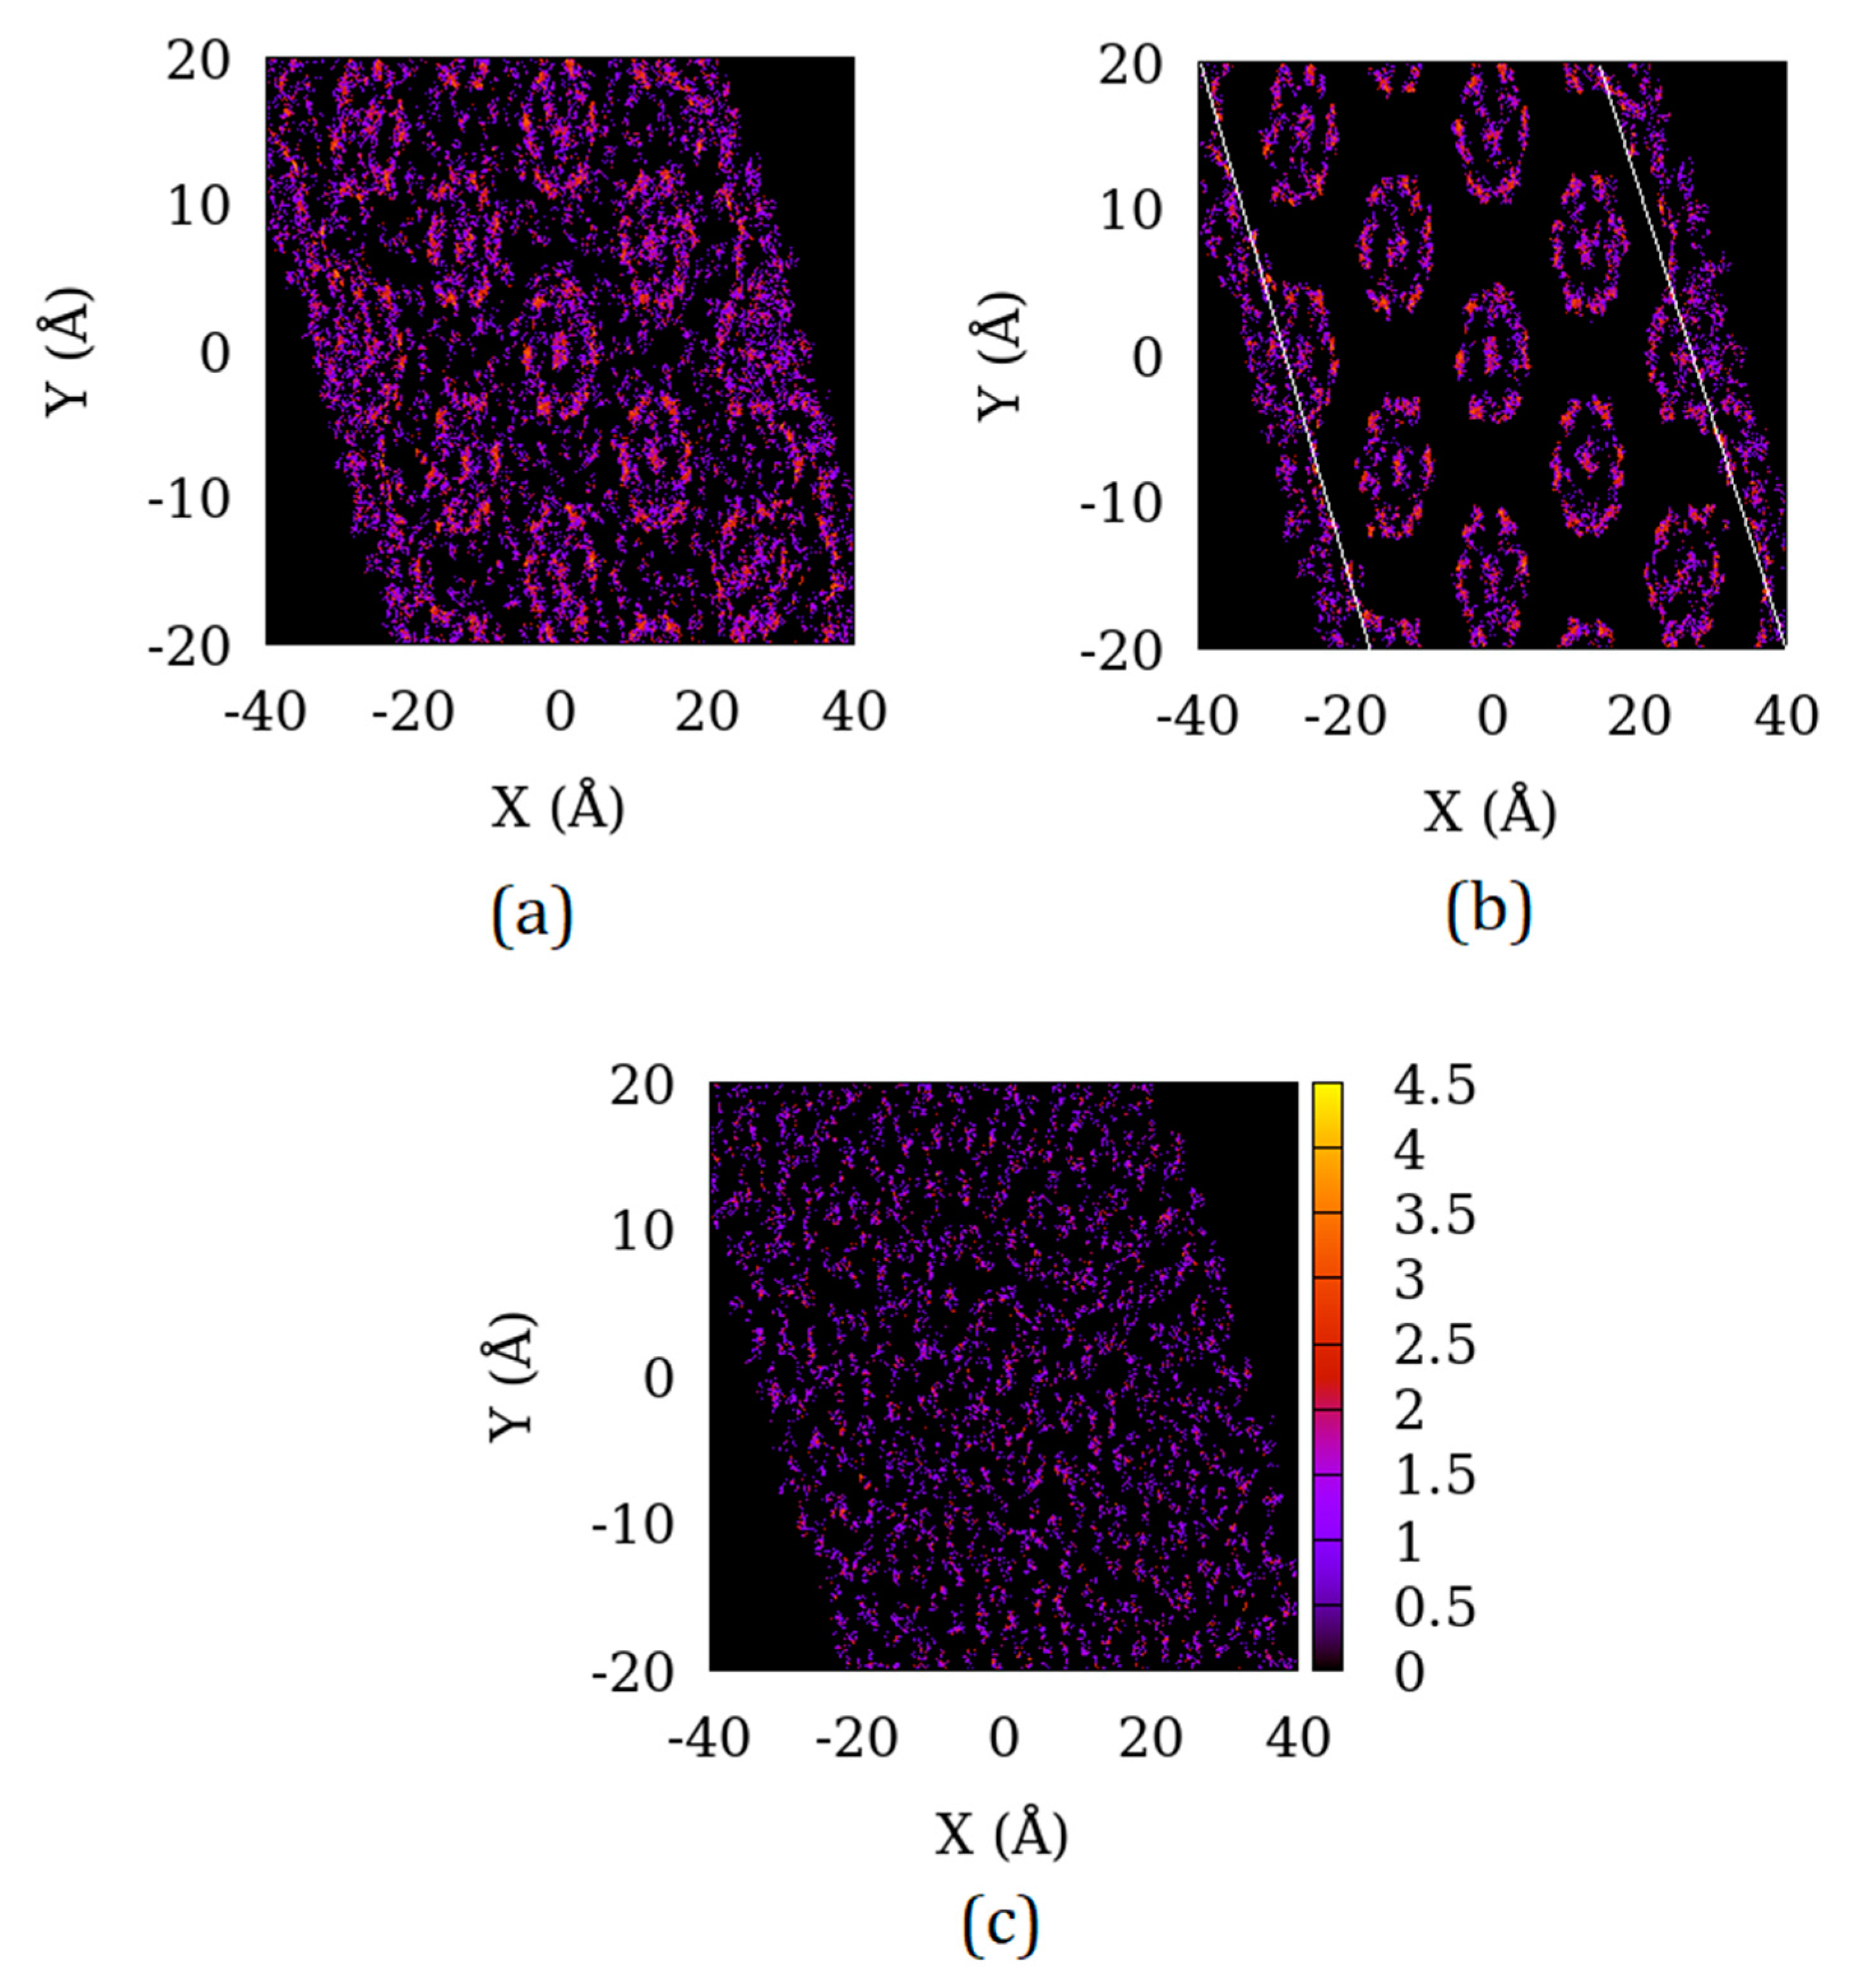
In Figure 3, the distribution of the adsorbed CO2 molecules in the X–Y plane of the system S4 is shown. When all the adsorbed molecules are considered, (Figure 3a), a pattern of random distribution superimposed on a pattern of circular high adsorption points can be seen. When the molecules adsorbed in the inter-crystalline space outside the crystallite in the Z-direction are excluded, a pattern of strong adsorption in the crystallite pores (circular regions of high intensity in Figure 3b) are seen. In addition to the pores, the molecules adsorbed in the inter-crystalline space in the Y–Z plane can be seen making a random pattern (outside the crystallite boundary marked by white lines). The fact that the distribution of molecules in the inter-crystalline space is indeed random can be seen in Figure 3c where only molecules outside the crystallite in the Z-direction are included.
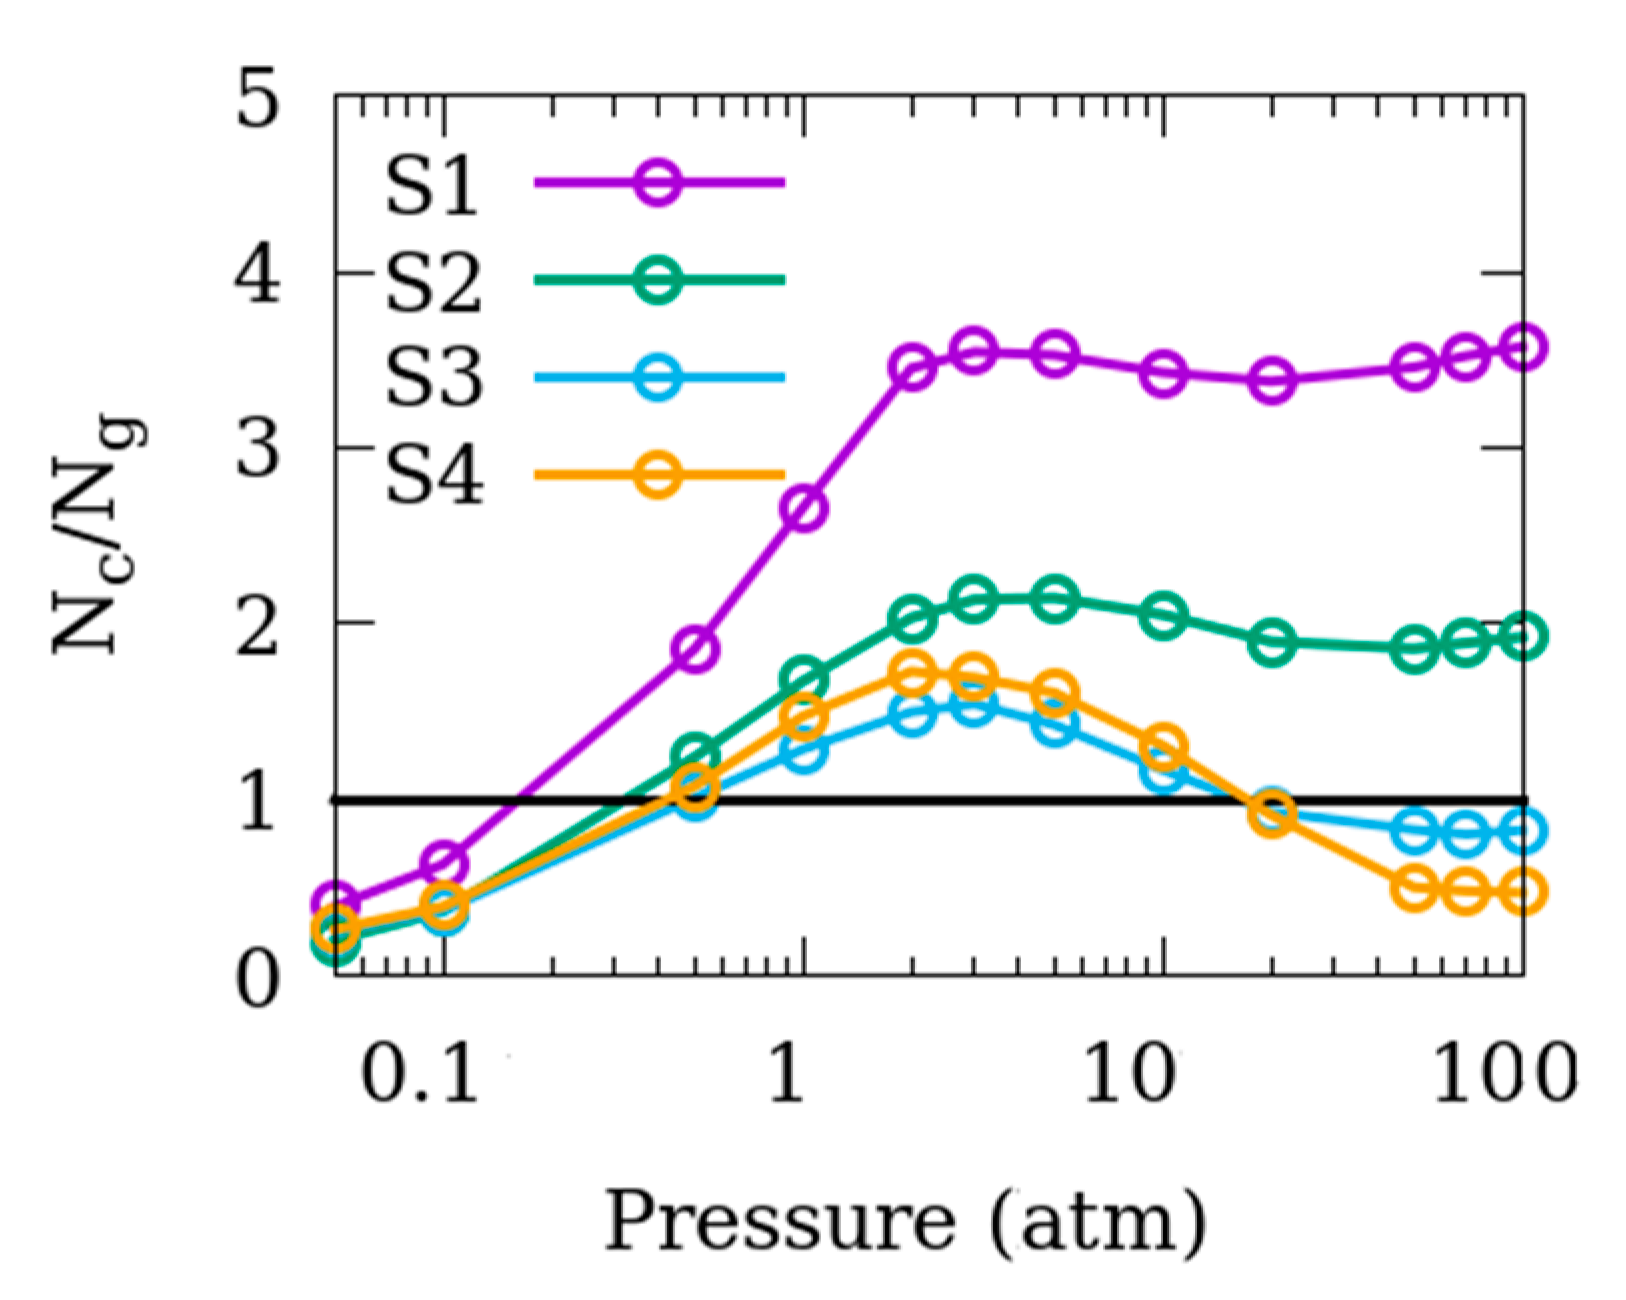
Figure 4 shows the distribution of the adsorbed CO2 molecules in Mg-MOF-74 in terms of the ratio of the number of molecules adsorbed within the crystallite (Nc) to those on the surface of the crystallite and in the inter-crystalline space (Ng). At very low pressures, more molecules are adsorbed on the surface as compared to inside the crystallites. As pressure increases the pores within the crystallite start to fill while the amount of CO2 adsorbed on the crystallite surfaces increases relatively slowly thereby yielding (Nc/Ng) values larger than 1. This ratio increases consistently up to about 2 atm, after which it plateaus for S1 and S2 and decreases again for S3 and S4. The difference in the high pressure behavior between S1 and S2, and S3 and S4, is because of a smaller inter-crystalline space in the former two systems, which saturates with CO2 molecules at these pressures, whereas the latter two samples with a larger inter-crystalline space can accommodate a larger number of molecules thereby resulting in lower Nc/Ng ratio at higher pressures.

3.2. Difference in the Surface Exposed

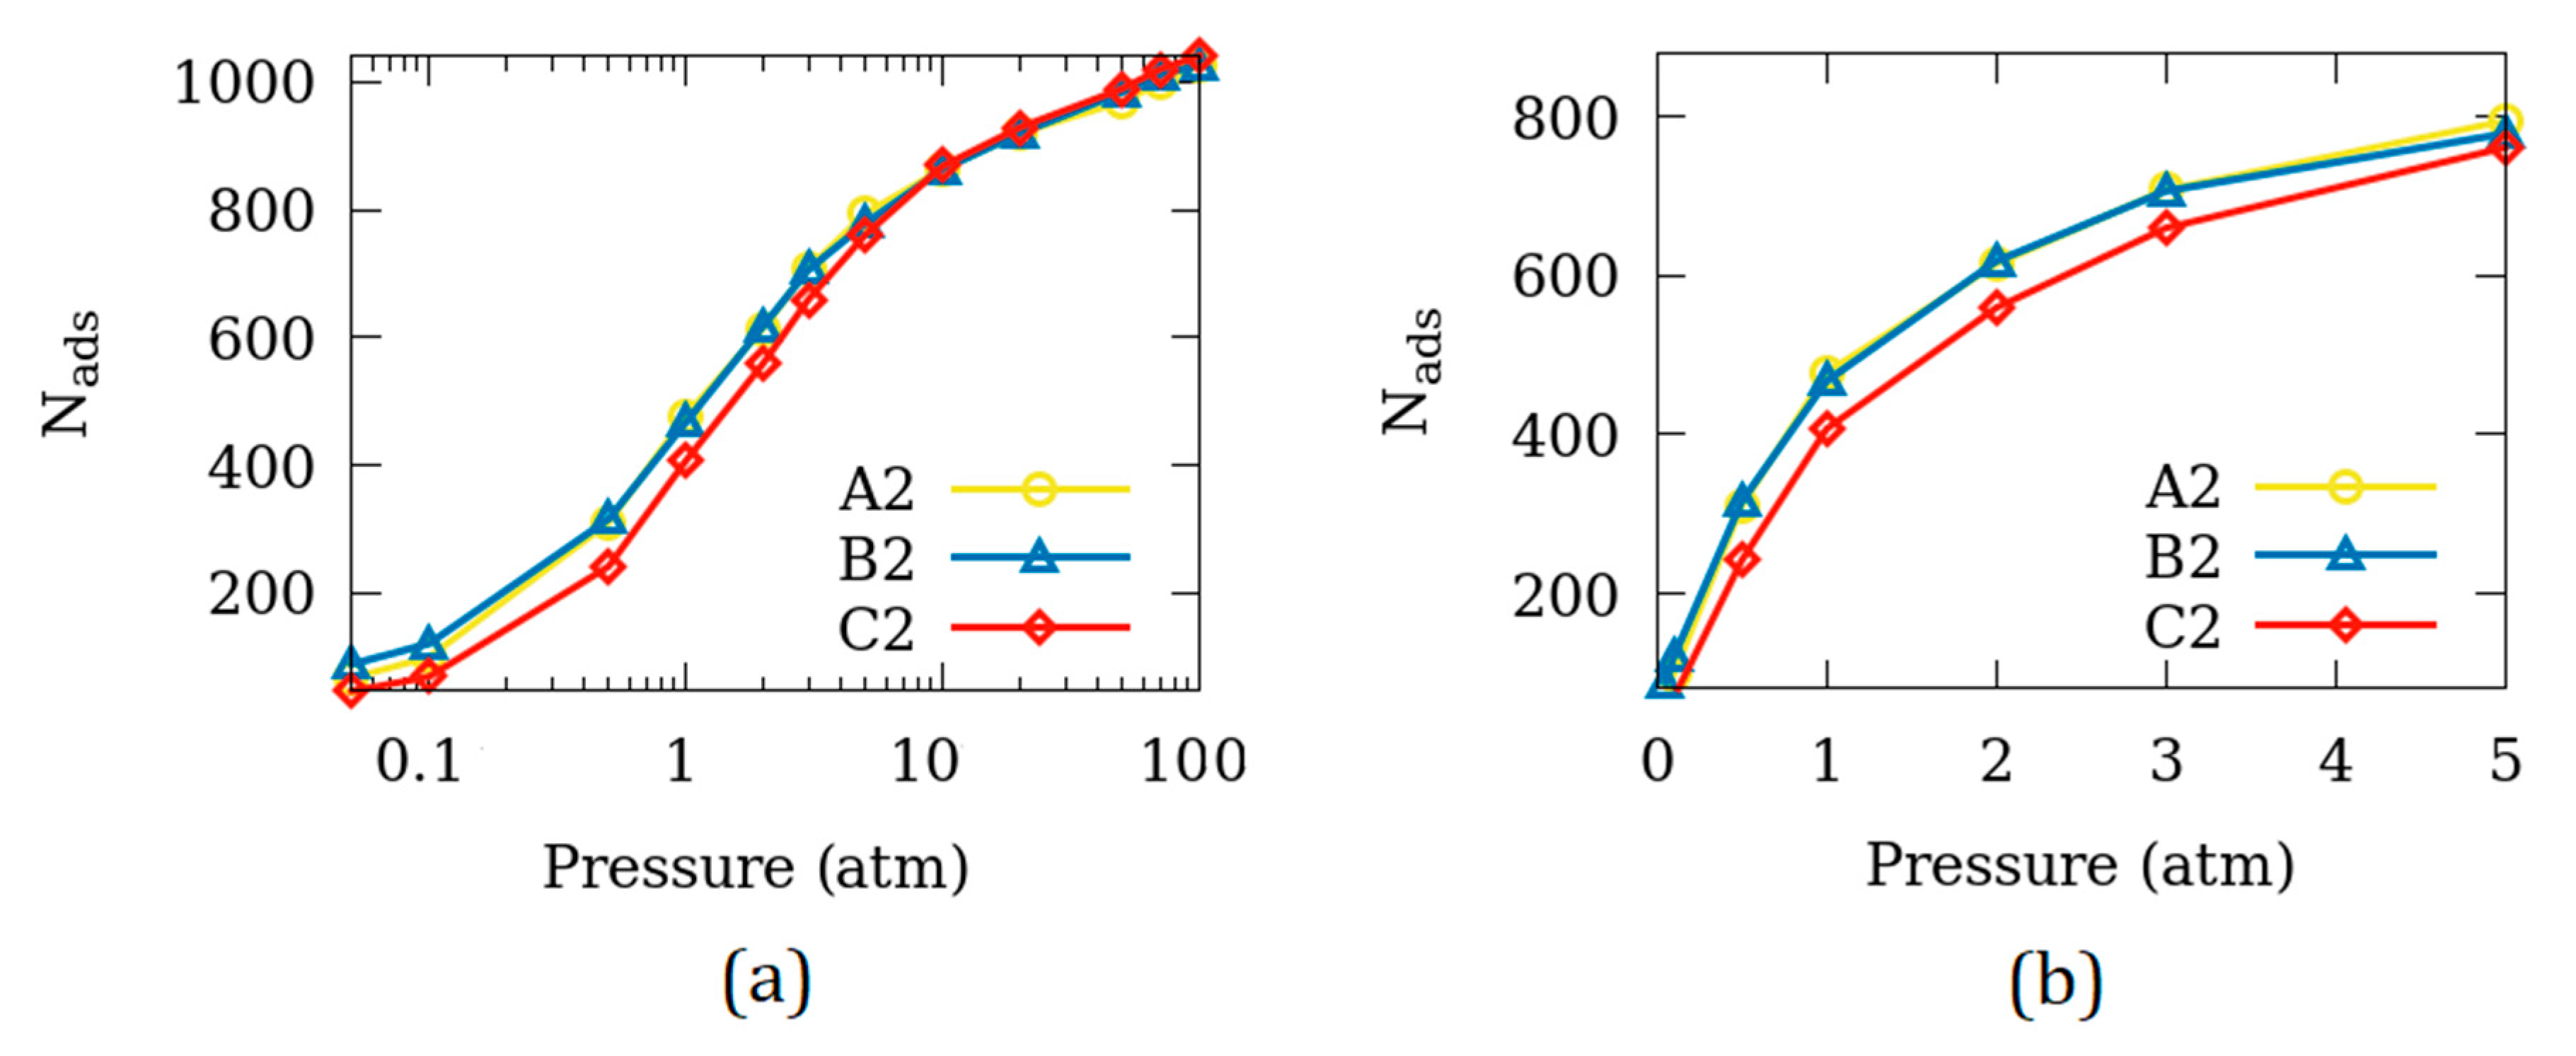
Figure 5 shows the comparison of adsorption amounts between the simulation cells A2, B2 and C2. These simulation cells differ in the surfaces that are exposed to the inter-crystalline space while the remaining surfaces remain un-exposed. Very little difference is observed in the behavior of the adsorption isotherms in A2 and B2 while the adsorption amounts at low pressures for C2 are slightly lower. We note that the surface area of C2 is slightly different from that of A2 and B2. The slight suppression in the amount of CO2 adsorbed on C2 compared to that on A2 and B2 may be a consequence of this difference in the surface areas.

3.3. Effects of Temperature

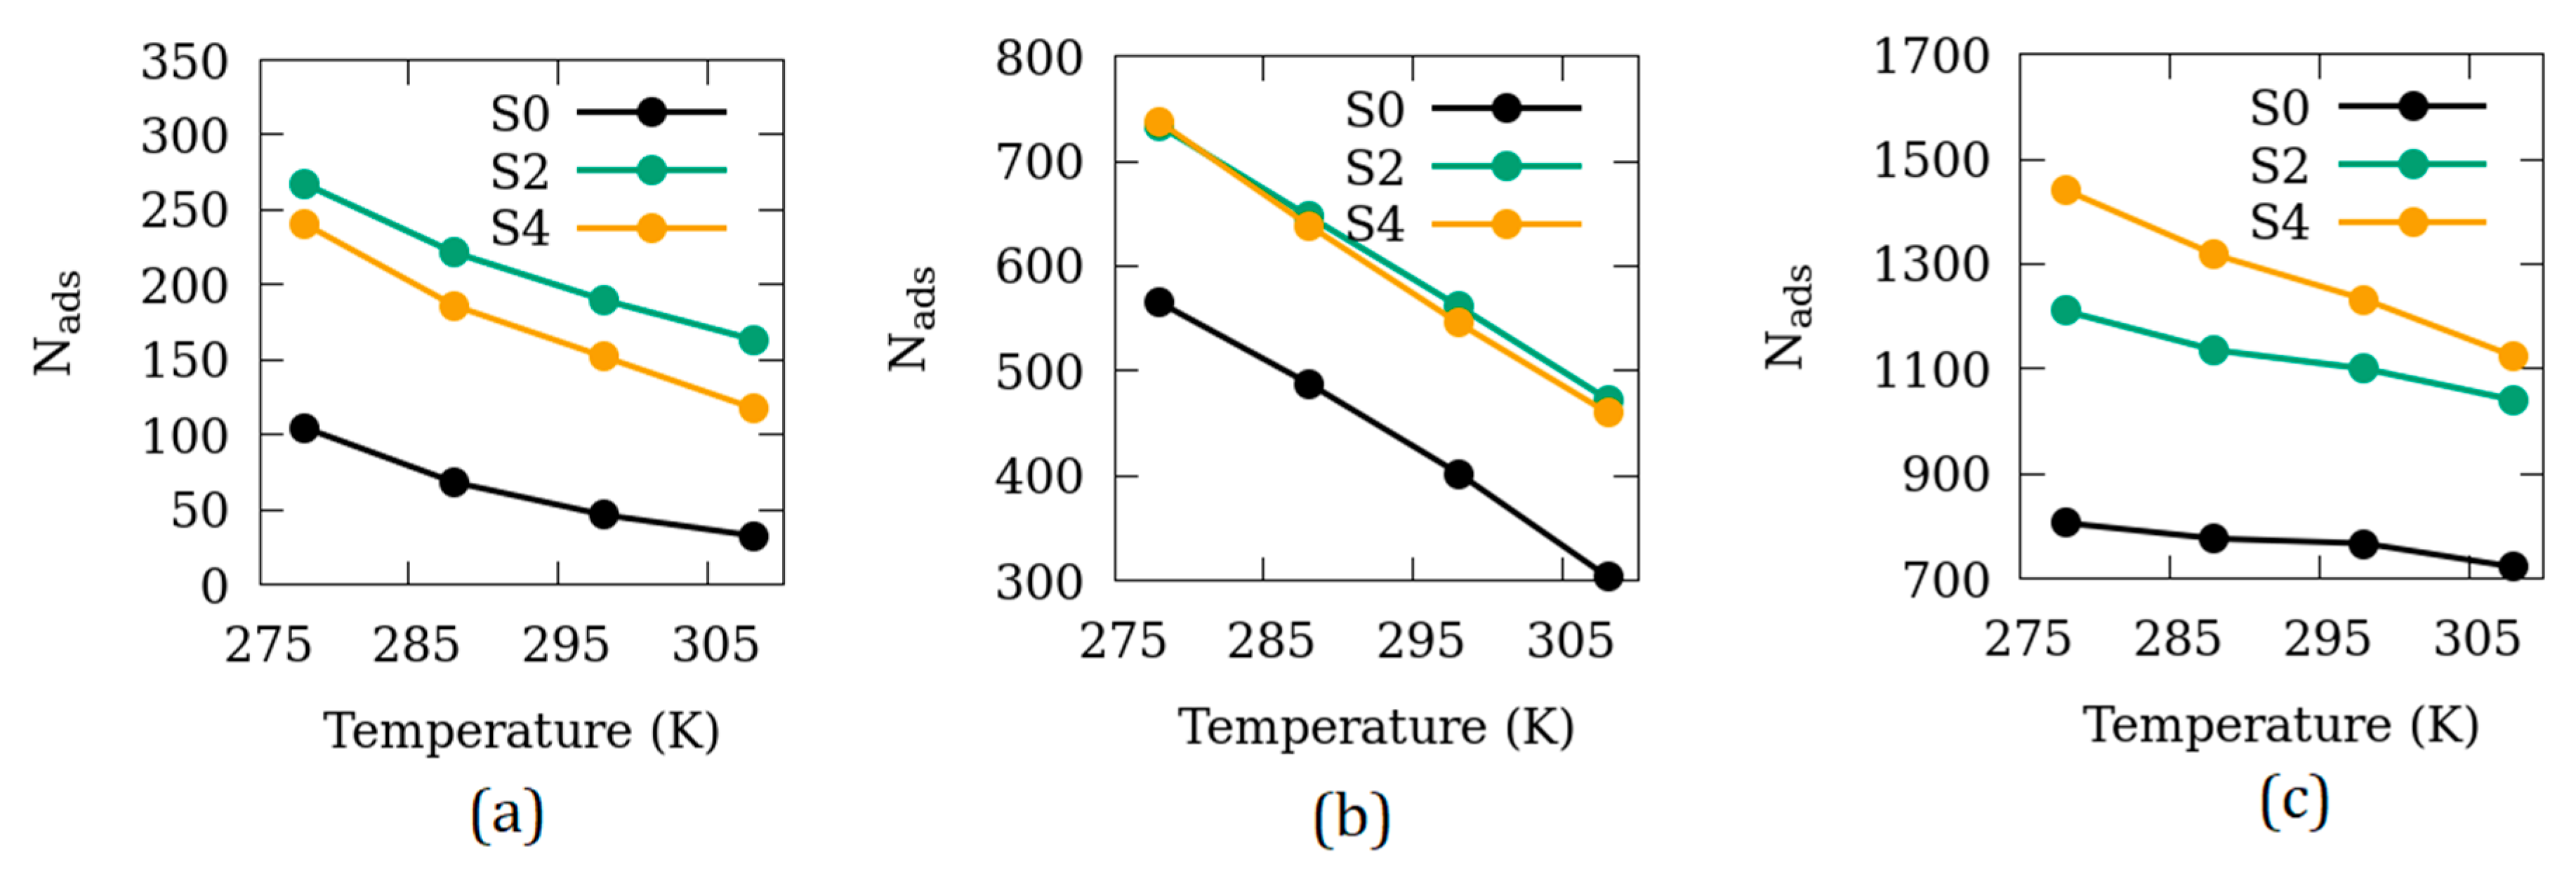
To investigate if there exists any temperature dependence in the effects of inter-crystalline space on the adsorption of CO2 in Mg-MOF-74, we carried out more simulations at three pressure points at different temperatures. The results of these simulations are shown in Figure 6 in terms of Nads as a function of temperature for the systems S0, S2, and S4. The temperature dependence of the adsorbed amount seems to be similar for the three systems at lower pressures. However, at high pressure, S4 adsorption exhibits a stronger temperature dependence (steeper slope for S4 in Figure 6c) compared to S0 and S2. This is probably due to the larger inter-crystalline void volume available in S4.

3.4. Effects of the Crystallite Size

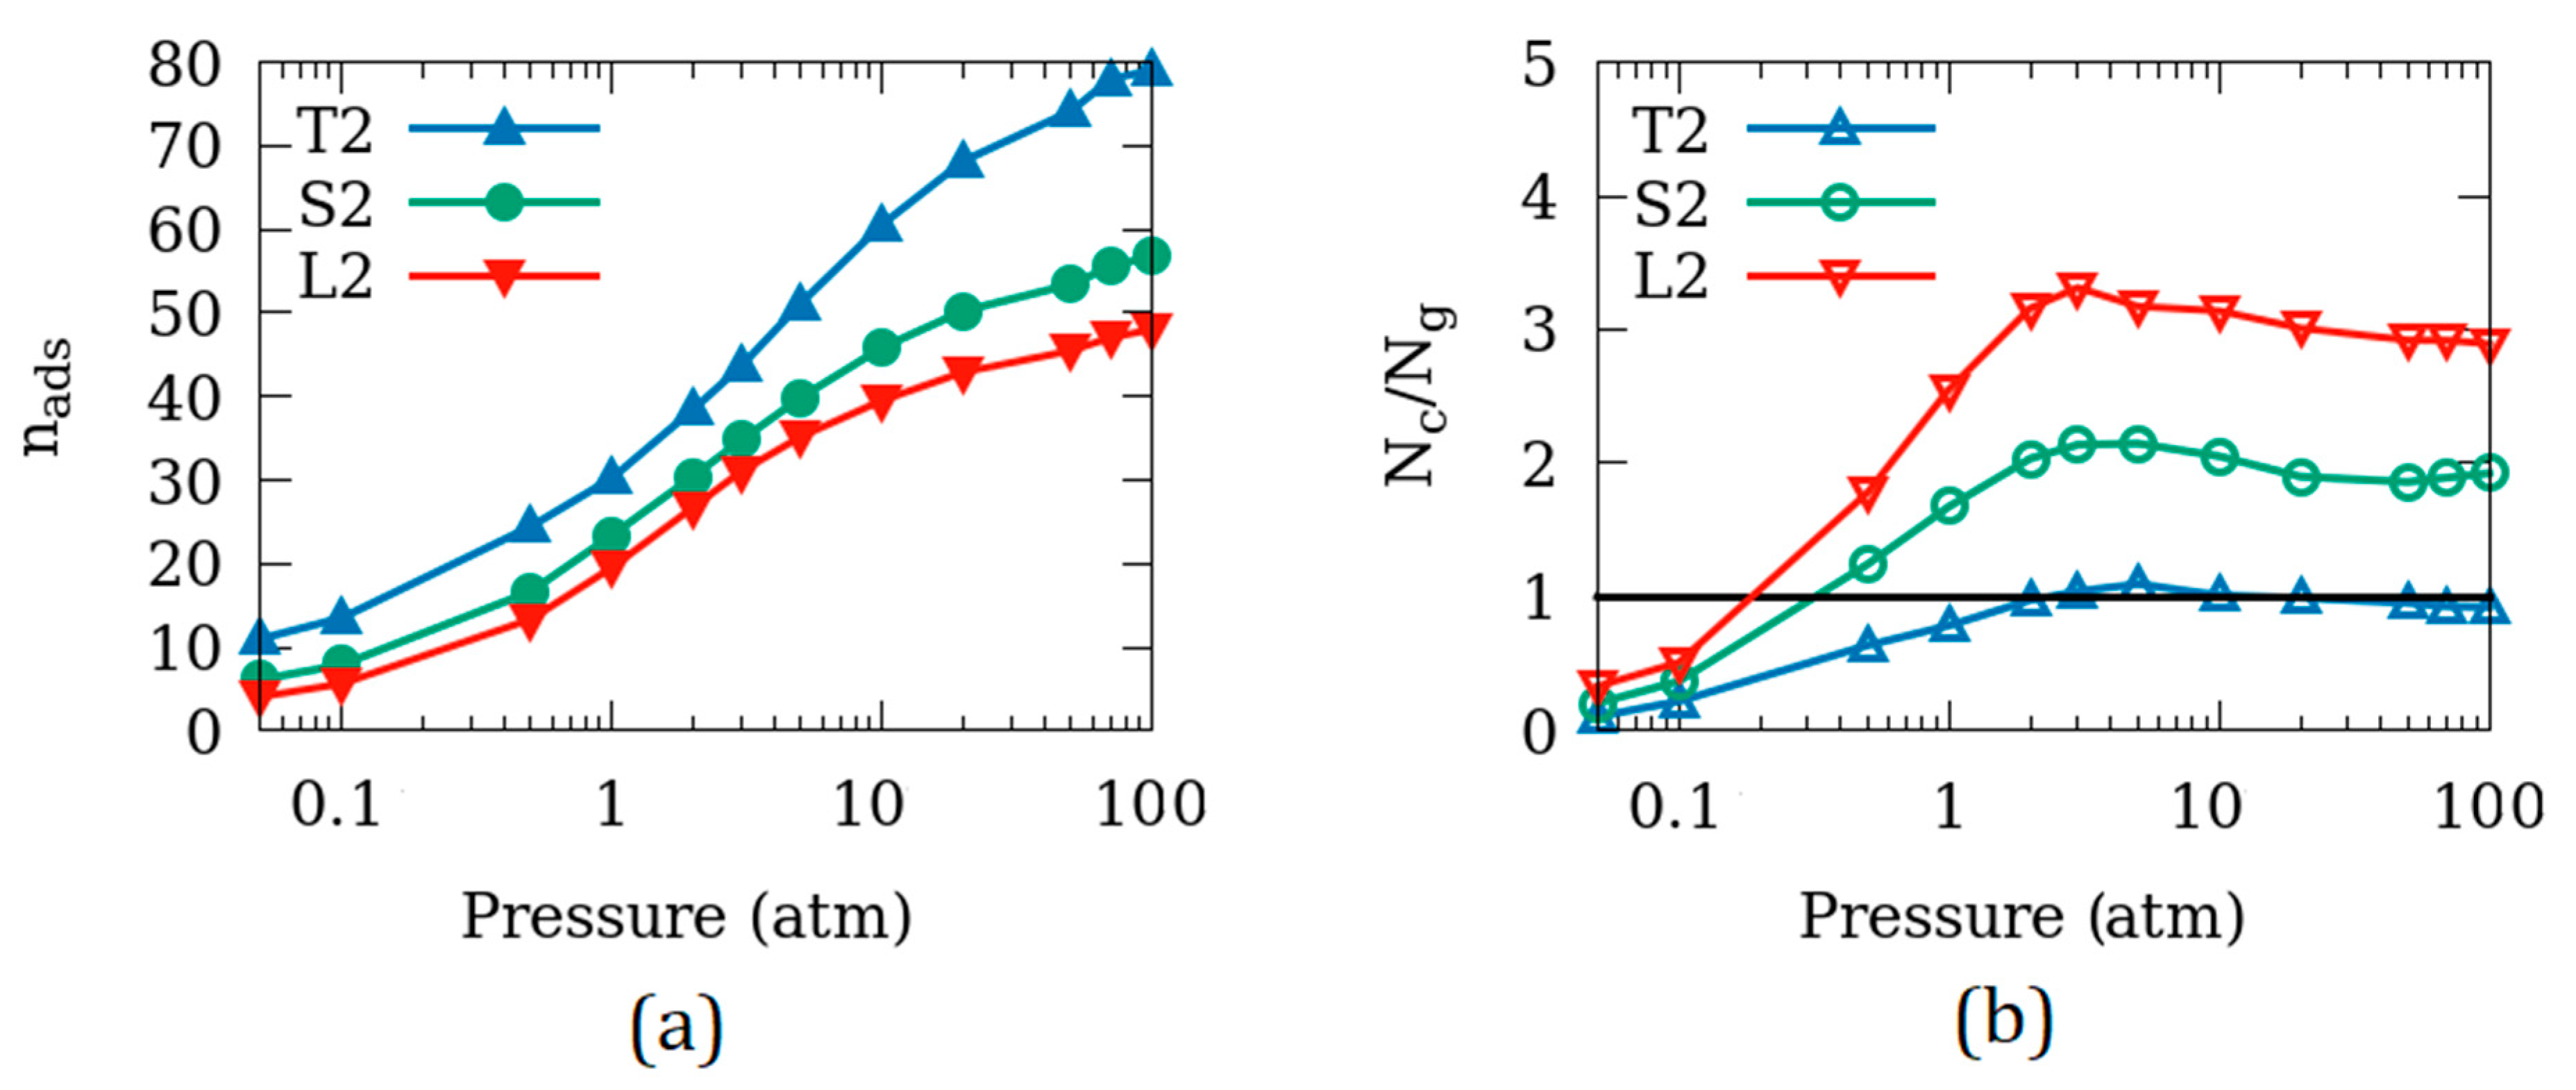
Figure 7a shows the adsorption isotherms of CO2 in Mg-MOF-74 with different crystallite sizes–T2, S2, and L2–all with the same amount of inter-crystalline spacing. To make the comparison between crystallites of different sizes objective, the amount of adsorption has been normalized to one unit cell. Thus, number of CO2 molecules adsorbed per unit cell of Mg-MOF-74 (nads) for the systems T2, S2, and L2 are shown in Figure 7a. The amount of adsorption per unit cell decreases as the crystallite size increases. Further, the difference between S2 and L2 (the larger two of the three sizes) is smaller than that between T2 and S2. This is probably because the surface to volume ratio of the crystallites increases strongly from T2 to S2 and relatively weakly from S2 to L2.
Figure 7b reveals that CO2 molecules are predominantly adsorbed on the crystallite surface of T2 at most pressures. The amount of inter-crystalline space available in T2 is larger than the pore space available within the crystallite for adsorption. As the surface to volume ratio of the crystallite decreases in S2 and L2, more and more CO2 molecules are adsorbed within the crystallite increasing the Nc/Ng ratio beyond 1 for all but the lowest pressures.

4. Discussion

The data reported in Figure 2 show that the amount of CO2 adsorbed in Mg-MOF-74 is significantly enhanced as inter-crystalline space is introduced between the crystallites. Further, at application-relevant low pressures, the adsorption amount increases as the extent of the inter-crystalline space is increased. This enhancement starts diminishing when increasing this space beyond 5 Å, while at high pressures, the adsorbed amount keeps increasing with the inter-crystalline spacing. This is because, at lower pressures, strong adsorption sites are needed for the CO2 molecules. These are available on the crystallite surface or in the crystallite pores. At an inter-crystalline space of 3 Å, the surface of the crystallite becomes exposed, making additional adsorption sites available, thereby resulting in an enhanced adsorption in S1 compared to S0. However, because the kinetic diameter of CO2 (3.3 nm) [38] is larger than this inter-crystalline space, adsorption on the surface is difficult and the enhancement in adsorbed amount is limited by geometrical restriction. As more inter-crystalline space larger than the kinetic diameter of CO2 is added in S2, the adsorption amount is significantly enhanced because of the relaxation of geometrical restriction. The inter-crystalline space is further widened to more than twice the kinetic diameter in S3. This means that the surfaces of two adjacent crystallites facing each other can each accommodate a single layer of CO2 and so the adsorption amount is increased again though marginally. However, further addition of inter-crystalline space does not enhance the amount of adsorption at low pressures because the adsorption sites available on the surface are saturated. At high pressures, the extra available space can accommodate more CO2 molecules in bulk-like region leading to an overall enhanced adsorption. This is also consistent with the fact that, for smaller inter-crystalline spacings, the adsorption amount is dominated by the CO2 molecules adsorbed within the crystallite pores whereas for larger inter-crystalline space and especially at high pressures, the adsorption is predominantly at the crystallite surface (see Figure 4).
Comparing the Nc/Ng ratios in Figure 4 obtained for CO2 adsorption in Mg-MOF-74, with those reported earlier [17] for CO2 in silicalite, important and insightful differences are observed. In the case of silicalite, the adsorption of CO2 occurred predominantly on the surface of the crystallites at all pressures and irrespective of the extent of inter-crystalline space (Nc/Ng < 1 for all cases, see Figure 3, reference [17]). In contrast, results in Figure 4 indicate more CO2 molecules are adsorbed in the crystallite pores compared to the surface at all but the lowest two pressures for S1 and S2. For S3 and S4, the ratio (Nc/Ng) is greater than 1 for partial pressures between 0.5 and 10 atm. This demonstrates that the crystallite pore adsorption of CO2 in Mg-MOF-74 is much stronger as compared to that in silicalite, revealing the superiority of Mg-MOF-74 as an adsorbent in CO2 storage applications compared to silicalite and other zeolites. This superiority has been attributed to the ionic character of the Mg-O bond in Mg-MOF-74 [39].
Temperature does not appear to significantly affect the role of inter-crystalline space in the adsorption of CO2 in Mg-MOF-74. The systems S0, S2, and S4 all exhibited similar trends with temperature of the adsorbed amount at 0.1 and 1.0 atm partial pressures. At a higher partial pressure of 10.0 bar, however, the adsorption amount in S4 shows stronger temperature dependence. This is because, in S4 at this pressure, more CO2 molecules are weakly adsorbed close to the crystallite surface in the inter-crystalline space. While molecules adsorbed strongly within the crystallite pores and crystallite surface are affected by temperature in the same way as those in the systems S0 and S2, the additional weakly adsorbed molecules in S4 in the inter-crystalline space away from the crystallite surface are affected more by the temperature and are easily desorbed at higher temperatures. This leads to a stronger temperature dependence of adsorption in S4.
The dependence of adsorption amounts on the size of the crystallites shown in Figure 7 is consistent with the dependence observed in ref. [17] of the amount of CO2 adsorbed in/on the crystallites of silicalite. This dependence on the crystallite size is probably dominated by the geometric effects of the surface to volume ratio rather than the chemistry of the substrate. As the introduction of inter-crystalline space enhances the adsorbed amount by making the crystallite surface available for adsorption, in addition to the crystallite pores, this enhancement can be expected to be proportional to the size of the exposed surface. As the size of the crystallite gets larger, the surface to volume ratio decreases and hence the adsorbed amount decreases. This suggests that, for applications in CO2 storage, the ideal Mg-MOF-74 substrate should have small crystallite size.
The dependence of adsorption amount of CO2 on the surface area has been experimentally investigated for Mg-MOF-74 by Yao et al. [40]. They synthesized Mg-MOF-74 materials of three different morphologies and sizes (200 nm–4 μm). The amount of adsorption was found to be higher for samples with higher surface area. This is consistent with our results reported here. In a recent work, Campbell and Tokay [41] have also shown that the crystal size of Mg-MOF-74 can be controlled by varying the fraction of ethanol and water in the reaction solution relative to dimethyl formamide. By varying this composition, they obtained smaller crystallites with sizes varying between 8 nm to 50 nm. It is also possible to make hierarchical MOF with multi-porosity introduced in the system [42]. These hierarchical systems, however, have crystallites arranged in an ordered fashion along with mesoporous or even macroporous formations. As found in this work, inter-crystalline spaces larger than a few angstroms need not necessarily result in an enhancement in adsorption. Conversely, the trends of adsorption capacity with the crystallite size suggest that a single unit cell of MOF might be the best for adsorption. This single unit cell would represent a metal–organic polyhedral (MOP) [43]. However, limitations of computational accuracy forbid the calculation of adsorption in a single unit cell. With a potential cut-off of 14 Å as used here, the smallest simulation cell dimension cannot be smaller than 28 Å while the unit cell dimension of Mg-MOF without any inter-crystalline space is 26.136 × 26.136 × 6.942 Å3. Therefore, it is not possible to verify with GCMC if the MOP analogue of Mg-MOF-74 can show better adsorption capacities for CO2. While we are not aware of an experimental study on the adsorption of CO2 in MOP analogue of Mg-MOF-74, we note here the work by Lorzing et al. [44] on gas adsorption in metal–organic polyhedra. In this work, the authors observe that MOP have significantly lower surface areas compared to their MOF analogues. This would imply that MOP analogue of Mg-MOF-74 might not achieve significantly higher adsorption of CO2. However, further experimental investigations are needed to verify this. Inter-crystalline spaces larger than twice the kinetic diameter of CO2 is enough to enhance the adsorption. Thus, an ideal Mg-MOF-74 adsorbent would have small size crystallites separated by inter-crystalline space of approximately twice the kinetic diameter of the adsorbed fluid.

5. Conclusions

We have studied the effects of inter-crystalline space on the adsorption of CO2 in Mg-MOF-74. The inter-crystalline spacing is found to enhance adsorption by making the adsorption sites at the crystallite surfaces available for adsorption. At pressures relevant to capture applications, increasing the inter-crystalline spacing up to twice the kinetic diameter of CO2 results in higher adsorption while further increasing this space does not lead to any significant increase in the adsorption amounts. Larger crystallite sizes suppress adsorption amounts due to a smaller surface to volume ratio in large crystallites. The size of the inter-crystalline space relative to the kinetic diameter of the adsorbed fluid and the surface to volume ratio of the crystallite size of the adsorbents thus play an important role in determining the adsorption amounts. The results of this study help guide our strategies for the tailoring of Mg-MOF-74 samples for high performance as CO2 adsorbents. The ideal Mg-MOF-74 sample for CO2 storage applications should have smaller crystallites separated from each other with an inter-crystalline space of roughly twice the kinetic diameter of CO2.

Author Contributions

Conceptualization, S.G.; Formal analysis, S.G.; Funding acquisition, D.C.; Investigation, S.G.; Methodology, S.G.; Writing—original draft, S.G.; Writing—review and editing, S.G. and D.C. All authors have read and agreed to the published version of the manuscript.

Funding

This research was funded by the U.S. Department of Basic Energy, Office of Science, Office of Basic Energy Sciences, Division of Chemical Sciences, Geosciences and Biosciences, Geosciences Program, grant number DESC000687, and A. P. Sloan Foundation funded Deep Carbon Observatory.

Acknowledgments

We would like to acknowledge STFC’s Daresbury Laboratory for providing the package DL-Monte which was used in this work. We would also like to acknowledge computational support from the Deep Carbon Observatory cluster, hosted by Rensselaer Polytechnic Institute (Peter Fox and Patrick West). Figures in this manuscript were made using the freely available visualization and plotting softwares Vesta [32] (Figure 1) and Gnuplot [45] (Figure 2, Figure 3, Figure 4, Figure 5, Figure 6 and Figure 7).

Conflicts of Interest

The authors declare no conflict of interest. The funders had no role in the design of the study; in the collection, analyses, or interpretation of data; in the writing of the manuscript, or in the decision to publish the results.

References

  1. IPCC. 2013: Climate Change 2013: The Physical Science Basis. Contribution of Working Group I to the Fifth Assessment Report of the Intergovernmental Panel on Climate Change; Stocker, T.F., Qin, D., Plattner, G.-K., Tignor, M., Allen, S.K., Boschung, J., Nauels, A., Xia, Y., Bex, V., Midgley, P.M., Eds.; Cambridge University Press: Cambridge, UK; New York, NY, USA, 2013; p. 1535. [Google Scholar]
  2. Anderson, T.R.; Hawkins, E.; Philip, D.J. CO2, the greenhouse effect and global warming: From the pioneering work of Arrhenius and Callendar to today’s Earth System Models. Endeavour 2016, 40, 178–187. [Google Scholar] [CrossRef] [Green Version]
  3. Fanchi, J.R.; Fanchi, C.J. Energy in the 21st Century; World Scientific Publishing Company: Singapore, 2016. [Google Scholar]
  4. Lackner, K.S. A guide to CO2 sequestration. Science 2003, 300, 1677–1678. [Google Scholar] [CrossRef]
  5. Arindam, M.; Subhra, J. Advances in Porous Adsorbents for CO2 Capture and Storage, Carbon Dioxide Chemistry, Capture and Oil Recovery, Iyad Karame´, Janah Shaya and Hassan Srour; IntechOpen: London, UK, 20 December 2017; Available online: https://www.intechopen.com/books/carbon-dioxide-chemistry-capture-and-oilrecovery/advances-in-porous-adsorbents-for-co2-capture-andstorage (accessed on 2 October 2020). [CrossRef] [Green Version]
  6. Regufe, M.J.; Ribeiro, A.M.; Ferreira, A.F.P. Rodrigues ACO2 Storage on Zeolites Other Adsorbents. In Nanoporous Materials for Gas Storage. Green Energy and Technology; Kaneko, K., Rodríguez-Reinoso, F., Eds.; Springer: Singapore, 2019. [Google Scholar] [CrossRef]
  7. Ding, M.; Flaig, R.W.; Jiang, H.L.; Yaghi, O.M. Carbon capture and conversion using metal–organic frameworks and MOF-based materials. Chem. Soc. Rev. 2019, 48, 2783–2828. [Google Scholar] [CrossRef] [PubMed]
  8. Yazaydın, A.O.; Snurr, R.Q.; Park, T.H.; Koh, K.; Liu, J.; LeVan, M.D.; Benin, A.I.; Jakubczak, P.; Lanuza, M.; Galloway, D.B.; et al. Screening of metal-organic frameworks for carbon dioxide capture from flue gas using a combined experimental and modeling approach. J. Am. Chem. Soc. 2009, 131, 18198–18199. [Google Scholar] [CrossRef] [PubMed]
  9. Herm, Z.R.; Swisher, J.A.; Smit, B.; Krishna, R.; Long, J.R. Metal-Organic frameworks as adsorbents for hydrogen purification and precombustion carbon dioxide capture. J. Am. Chem. Soc. 2011, 133, 5664–5667. [Google Scholar] [CrossRef] [PubMed]
  10. Dzubak, A.L.; Lin, L.C.; Kim, J.; Swisher, J.A.; Poloni, R.; Maximoff, S.N.; Smit, B.; Gagliardi, L. Ab initio carbon capture in open-site metal–organic frameworks. Nat. Chem. 2012, 4, 810–816. [Google Scholar] [CrossRef] [PubMed] [Green Version]
  11. Qasem, N.A.; Ben-Mansour, R. Energy and productivity efficient vacuum pressure swing adsorption process to separate CO2 from CO2/N2 mixture using Mg-MOF-74: A CFD simulation. Appl. Energy 2018, 209, 190–202. [Google Scholar] [CrossRef]
  12. Bendt, S.; Dong, Y.; Keil, F.J. Diffusion of Water and Carbon Dioxide and Mixtures Thereof in Mg-MOF-74. J. Phys. Chem. C 2018, 123, 8212–8220. [Google Scholar] [CrossRef]
  13. Becker, T.M.; Heinen, J.; Dubbeldam, D.; Lin, L.C.; Vlugt, T.J. Polarizable force fields for CO2 and CH4 adsorption in M-MOF-74. J. Phys. Chem. C 2017, 121, 4659–4673. [Google Scholar] [CrossRef] [Green Version]
  14. Thomas, A.M.; Subramanian, Y. Bridging the gap between diffusivities from experiment and molecular dynamics: N-hexane and 2,2-dimethyl butane in zeolite BEA. Microporous Mesoporous Mater. 2019, 287, 124–134. [Google Scholar] [CrossRef]
  15. Thomas, A.M.; Subramanian, Y. Simulations on “Powder” Samples for Better Agreement with Macroscopic Measurements. J. Phys. Chem. C 2019, 123, 16172–16178. [Google Scholar] [CrossRef]
  16. Thomas, A.M.; Subramanian, Y. Diffusion processes in a poly-crystalline zeolitic material: A molecular dynamics study. J. Chem. Phys. 2018, 149, 064702. [Google Scholar] [CrossRef] [PubMed]
  17. Gautam, S.; Cole, D.R. Effects of inter-crystalline space on the adsorption of ethane and CO2 in silicalite: Implications for enhanced adsorption. Phys. Chem. Chem. Physics. 2020, 22, 13951–13957. [Google Scholar] [CrossRef] [PubMed]
  18. Gautam, S.; Liu, T.; Cole, D. Sorption, Structure and Dynamics of CO2 and Ethane in Silicalite at High Pressure: A Combined Monte Carlo and Molecular Dynamics Simulation Study. Molecules 2019, 24, 99. [Google Scholar] [CrossRef] [PubMed] [Green Version]
  19. Elola, M.D.; Rodriguez, J. Preferential Adsorption in Ethane/Carbon Dioxide Fluid Mixtures Confined within Silica Nanopores. J. Phys. Chem. C 2019, 123, 30937–30948. [Google Scholar] [CrossRef]
  20. Le, T.; Striolo, A.; Cole, D.R. CO2–C4H10 mixtures simulated in silica slit pores: Relation between structure and dynamics. J. Phys. Chem. C 2015, 119, 15274–15284. [Google Scholar] [CrossRef] [Green Version]
  21. Choudhary, V.R.; Mayadevi, S. Adsorption of methane, ethane, ethylene, and carbon dioxide on silicalite-I. Zeolites 1996, 17, 501–507. [Google Scholar] [CrossRef]
  22. García-Pérez, E.; Parra, J.B.; Ania, C.O.; García-Sánchez, A.; van Baten, J.M.; Krishna, R.; Dubbeldam, D.; Calero, S. A computational study of CO2, N2, and CH4 adsorption in zeolites. Adsorption 2007, 13, 469–476. [Google Scholar] [CrossRef] [Green Version]
  23. Yan, J.; Zhang, B.; Wang, Z. Highly selective separation of CO2, CH4, and C2–C4 hydrocarbons in ultramicroporous semicycloaliphatic polyimides. ACS Appl. Mater. Interfaces 2018, 10, 26618–26627. [Google Scholar] [CrossRef]
  24. Duan, J.; Higuchi, M.; Horike, S.; Foo, M.L.; Rao, K.P.; Inubushi, Y.; Fukushima, T.; Kitagawa, S. High CO2/CH4 and C2 hydrocarbons/CH4 selectivity in a chemically robust porous coordination polymer. Adv. Funct. Mater. 2013, 23, 3525–3530. [Google Scholar] [CrossRef]
  25. Gautam, S.; Liu, T.; Rother, G.; Jalarvo, N.; Mamontov, E.; Welch, S.; Sheets, J.; Droege, M.; Cole, D.R. Dynamics of propane in nanoporous silica aerogel: A quasielastic neutron scattering study. J. Phys. Chem. C 2015, 119, 18188–18195. [Google Scholar] [CrossRef]
  26. Patankar, S.; Gautam, S.; Rother, G.; Podlesnyak, A.; Ehlers, G.; Liu, T.; Cole, D.R.; Tomasko, D.L. Role of confinement on adsorption and dynamics of ethane and an ethane–CO2 mixture in mesoporous CPG silica. J. Phys. Chem. C 2016, 120, 4843–4853. [Google Scholar] [CrossRef]
  27. Liu, T.; Gautam, S.; Cole, D.R.; Patankar, S.; Tomasko, D.; Zhou, W.; Rother, G. Structure and dynamics of ethane confined in silica nanopores in the presence of CO2. J. Chem. Phys. 2020, 152, 084707. [Google Scholar] [CrossRef] [PubMed]
  28. Chathoth, S.M.; He, L.; Mamontov, E.; Melnichenko, Y.B. Effect of Carbon Dioxide and Nitrogen on the Diffusivity of Methane Confined in Nano-Porous Carbon. Microporous Mesoporous Mater. 2012, 148, 101–106. [Google Scholar] [CrossRef]
  29. Purton, J.A.; Crabtree, J.C.; Parker, S.C. DL_Monte: A general purpose program for parallel Monte Carlo simulation. Mol. Simul. 2013, 39, 1240–1252. [Google Scholar] [CrossRef]
  30. Available online: https://github.com/iRASPA/RASPA2/tree/master/structures/mofs/cif (accessed on 28 September 2020).
  31. Dubbeldam, D.; Calero, S.; Ellis, D.E.; Snurr, R.Q. RASPA: Molecular simulation software for adsorption and diffusion in flexible nanoporous materials. Mol. Simul. 2016, 42, 81–101. [Google Scholar] [CrossRef] [Green Version]
  32. Momma, K.; Izumi, F. VESTA: A three-dimensional visualization system for electronic and structural analysis. J. Appl. Crystallogr. 2008, 41, 653–658. [Google Scholar] [CrossRef]
  33. Greathouse, J.A.; Kinnibrugh, T.L.; Allendorf, M.D. Adsorption and separation of noble gases by IRMOF-1: Grand canonical Monte Carlo simulations. Ind. Eng. Chem. Res. 2009, 48, 3425–3431. [Google Scholar] [CrossRef]
  34. Potoff, J.J.; Siepmann, J.I. Vapor–liquid equilibria of mixtures containing alkanes, carbon dioxide, and nitrogen. Aiche J. 2001, 47, 1676–1682. [Google Scholar] [CrossRef]
  35. Rappé, A.K.; Casewit, C.J.; Colwell, K.S.; Goddard, W.A., III; Skiff, W.M. UFF, a full periodic table force field for molecular mechanics and molecular dynamics simulations. J. Am. Chem. Soc. 1992, 114, 10024–10035. [Google Scholar] [CrossRef]
  36. Mayo, S.L.; Olafson, B.D.; Goddard, W.A. DREIDING: A generic force field for molecular simulations. J. Phys. Chem. 1990, 94, 8897–8909. [Google Scholar] [CrossRef]
  37. Allen, M.P.; Tildesley, D.J. Computer Simulation of Liquids; Clarendon: Oxford, UK, 1987. [Google Scholar]
  38. Yang, J.; Zhao, Q.; Xu, H.; Li, L.; Dong, J.; Li, J. Adsorption of CO2, CH4, and N2 on Gas Diameter Grade Ion-exchange Small Pore Zeolites. J. Chem. Eng. Data 2012, 57, 3701–3709. [Google Scholar] [CrossRef]
  39. Caskey, S.R.; Wong-Foy, A.G.; Matzger, A.J. Dramatic tuning of carbon dioxide uptake via metal substitution in a coordination polymer with cylindrical pores. J. Am. Chem. Soc. 2008, 130, 10870–10871. [Google Scholar] [CrossRef] [PubMed]
  40. Yao, Z.Y.; Guo, J.H.; Wang, P.; Liu, Y.; Guo, F.; Sun, W.Y. Controlled synthesis of micro/nanoscale Mg-MOF-74 materials and their adsorption property. Mater. Lett. 2018, 223, 174–177. [Google Scholar] [CrossRef]
  41. Campbell, J.; Tokay, B. Controlling the size and shape of Mg-MOF-74 crystals to optimise film synthesis on alumina substrates. Microporous Mesoporous Mater. 2017, 251, 190–199. [Google Scholar] [CrossRef]
  42. Feng, L.; Wang, K.Y.; Willman, J.; Zhou, H.C. Hierarchy in Metal–Organic Frameworks. ACS Cent. Sci. 2020, 6, 359–367. [Google Scholar] [CrossRef]
  43. Gosselin, E.J.; Rowland, C.A.; Bloch, E.D. Permanently Microporous Metal–Organic Polyhedra. Chem. Rev. 2020, 120, 8987–9014. [Google Scholar] [CrossRef]
  44. Lorzing, G.R.; Trump, B.A.; Brown, C.M.; Bloch, E.D. Selective gas adsorption in highly porous chromium (II)-based metal–organic polyhedra. Chem. Mater. 2017, 29, 8583–8587. [Google Scholar] [CrossRef]
  45. Williams, T.; Kelley, C.; Lang, R.; Kotz, D.; Campbell, J. Gnuplot 4.6: An Interactive Ploƫting Program. 2014. Available online: http://gnuplot.info (accessed on 16 September 2020).
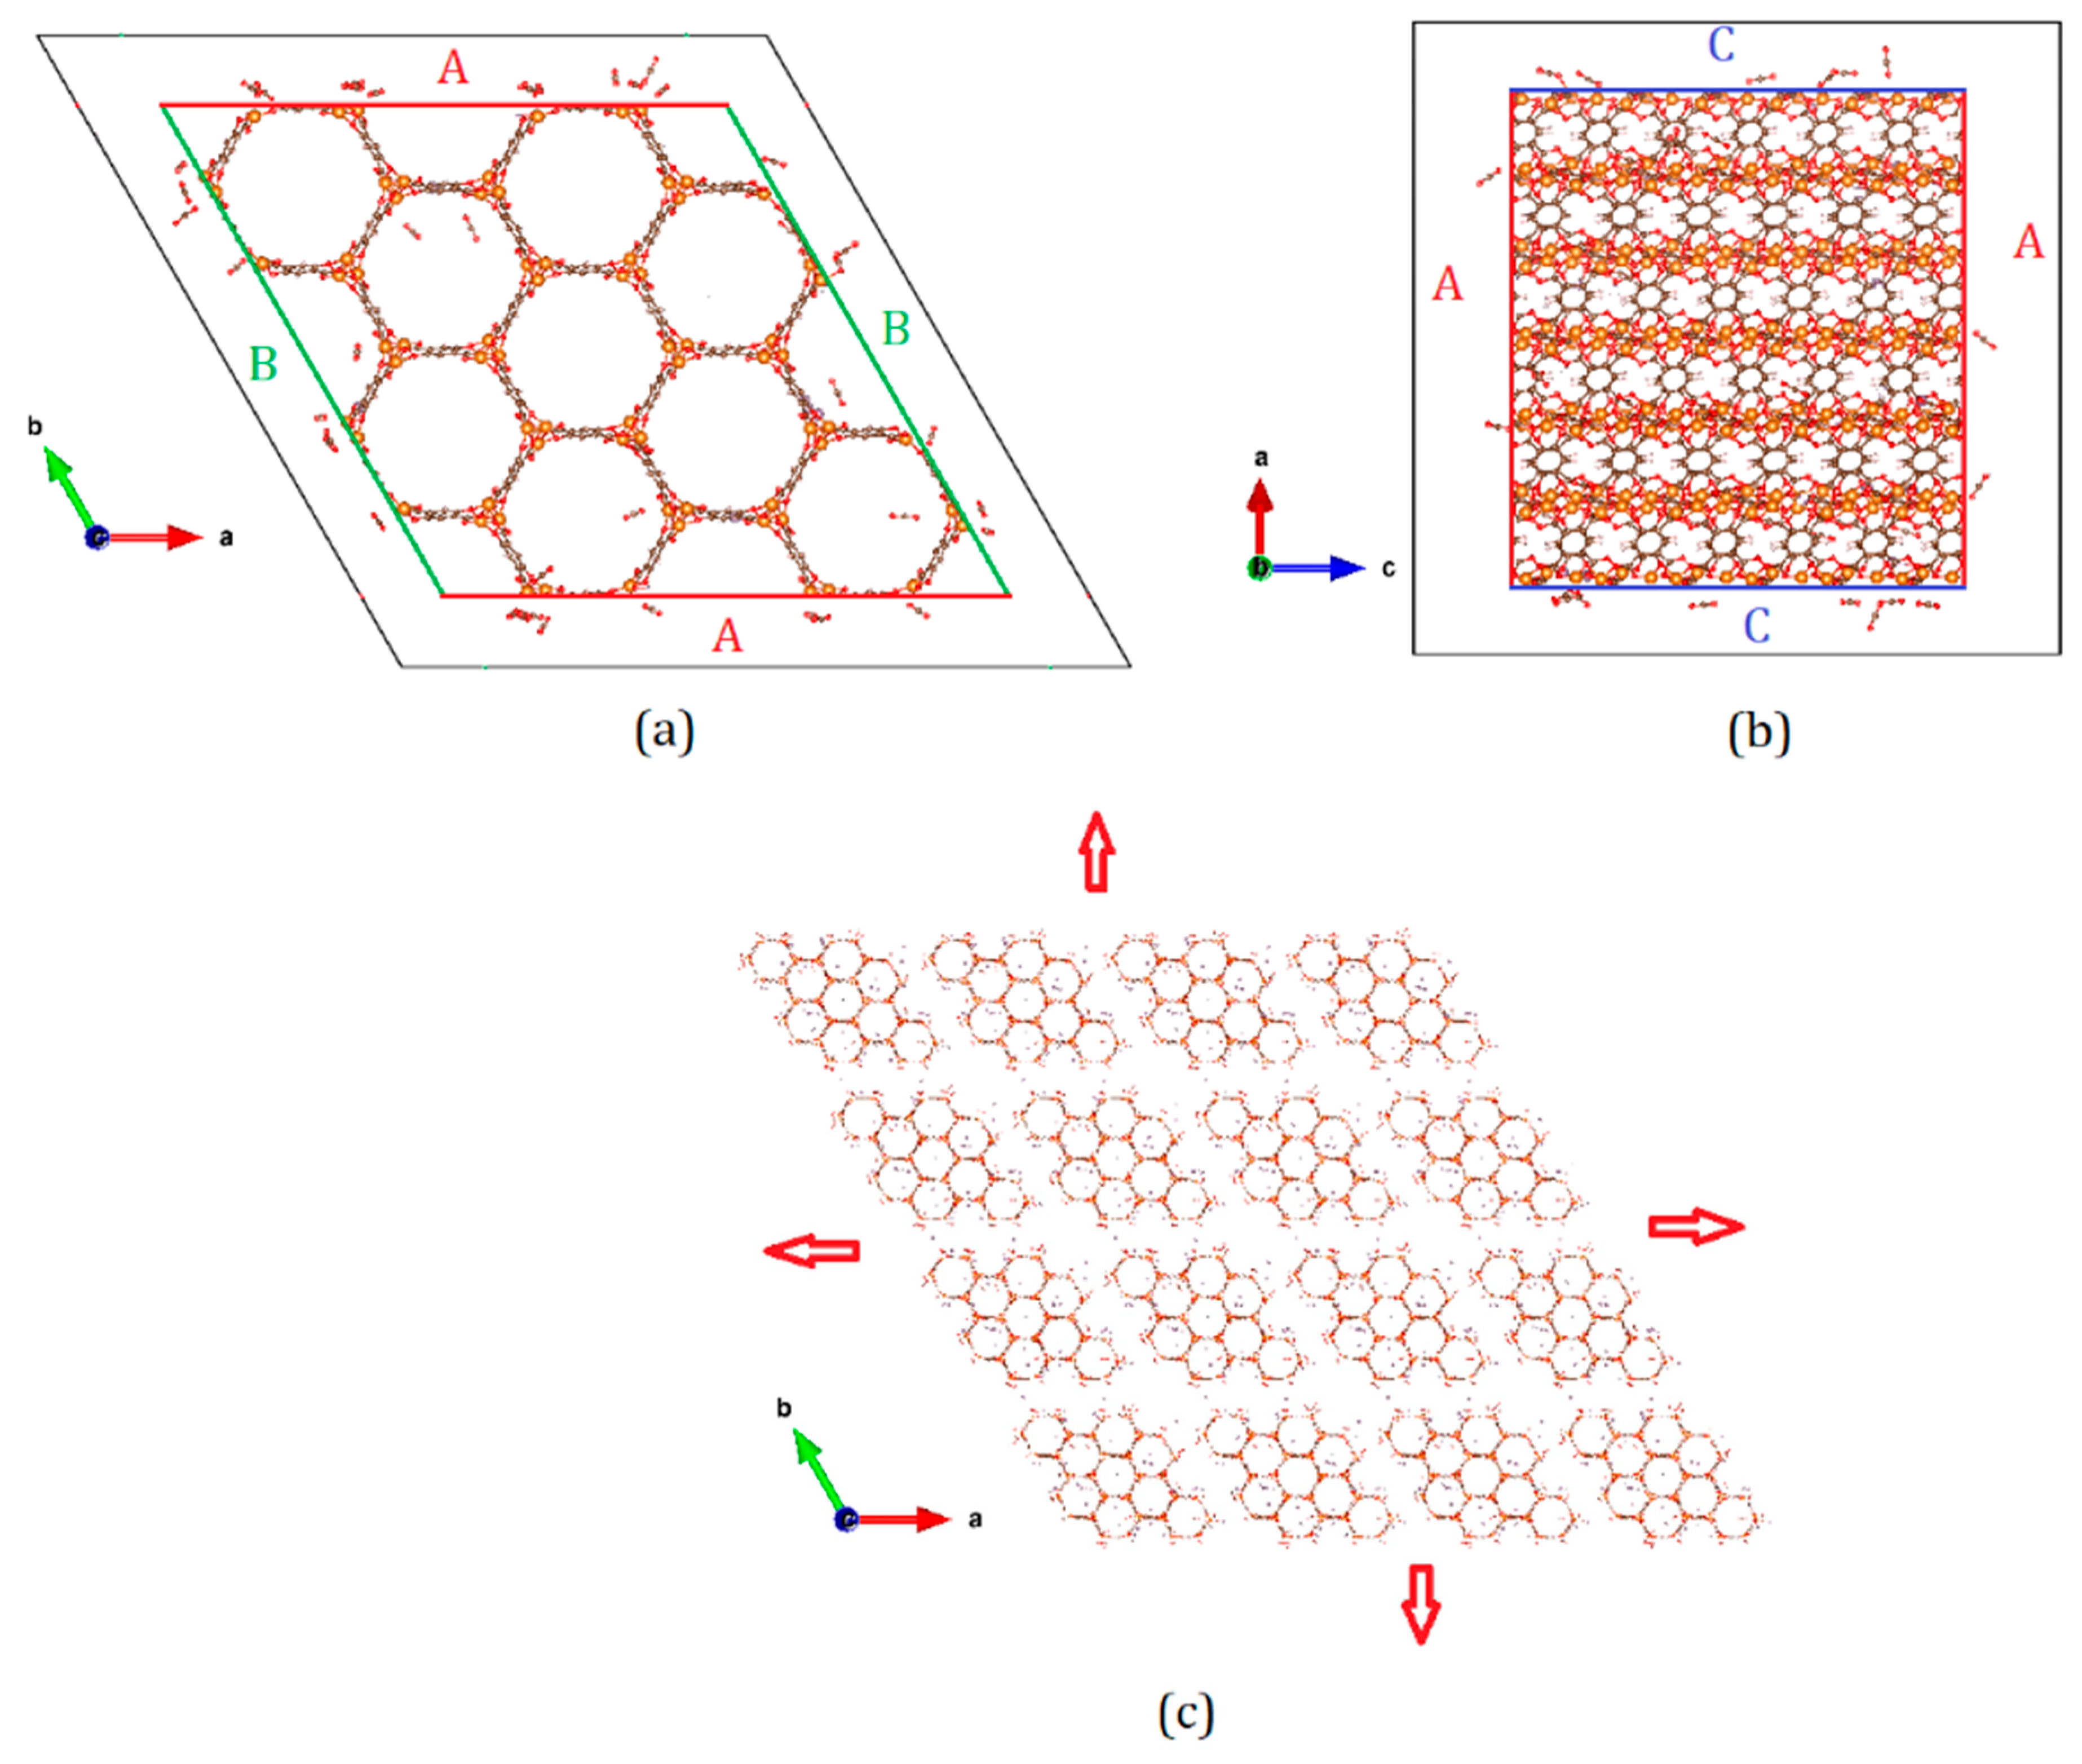
Figure 1. (a) Simulation cell in the system S4 in the X-Y plane. Simulation cell boundary is marked by the black border lines, while the borders of the supercell made by replicating a unit cell of Mg-MOF-74 2 × 2 × 6 times along the cell vectors a and b are marked by red and green lines, respectively. The colored lines thus enclose a crystallite while the space between the black and colored lines is the inter-crystalline space. Some CO2 molecules adsorbed within the crystallite as well as in the inter-crystalline space can be seen. (b) The simulation cell in the S4 system in the X-Z plane. As in (a) colored and black lines mark the boundaries of the crystallite and the simulation cell, respectively. (c) A rendering of the simulation cell in S4 in the X-Y plane with periodic boundary conditions applied. Crystallites separated by inter-crystalline space can be seen. The red arrows indicate that the system is repeated in all directions infinitely.
Nanomaterials 10 02274 g001
Figure 2. Adsorption isotherms of CO2 in Mg-MOF-74 over (a) wide range of partial pressures up to 100 atm, (b) partial pressures relevant to applications. In (b) size of the symbols present the largest uncertainty in Nads. Symbols in panel (b) have the same meaning as in panel (a).
Nanomaterials 10 02274 g002
Figure 3. Distribution of the projection of center of mass of the adsorbed CO2 molecules in the X–Y plane of (a) S4 sample (b) S4 sample with the adsorbed molecules outside the substrate in the Z-direction excluded and (c) S4 sample with the adsorbed molecules inside the substrate in the Z-direction excluded.
Nanomaterials 10 02274 g003
Figure 4. Ratio of the number of CO2 molecules adsorbed in the Mg-MOF-74 crystallites (Nc) to the number of molecules adsorbed in the inter-crystalline space (Ng) for the systems S1–S4.
Nanomaterials 10 02274 g004
Figure 5. Effect of the surface exposed on the adsorbed amount over (a) full range of partial pressures and (b) the range of partial pressures relevant for applications. Only C2 sample shows a slight under-adsorption, probably due to the difference in the dimensions of the three surfaces. The uncertainty in Nads is smaller than the symbols.
Nanomaterials 10 02274 g005
Figure 6. Number of adsorbed CO2 molecules in the systems S0, S2 and S4 as a function of temperature at (a) 0.1 atm; (b) 1 atm; (c) 10 atm.
Nanomaterials 10 02274 g006
Figure 7. (a) Amount of CO2 molecules adsorbed per unit cell of Mg-MOF-74; (b) Nc/Ng ratio of the CO2 molecules adsorbed in crystallites of different sizes.
Nanomaterials 10 02274 g007
Table 1. Summary of simulation cells used in the study.
Name of the Simulation Cell (System)Number of Unit Cells in the Simulation CellSurfaces Exposed to Empty Space (Side Exposed*)Size of the Empty Space (2× Space on Each Surface, in Å)
S02 × 2 × 600
S12 × 2 × 663.0
S22 × 2 × 665.0
S32 × 2 × 6610.0
S42 × 2 × 6615.0
A22 × 2 × 62 (A*)5.0
B22 × 2 × 62 (B*)5.0
C22 × 2 × 62 (C*)5.0
T21 × 1 × 465.0
L23 × 3 × 965.0
Publisher’s Note: MDPI stays neutral with regard to jurisdictional claims in published maps and institutional affiliations.