Imaging and Characterization of Sustained Gadolinium Nanoparticle Release from Next Generation Radiotherapy Biomaterial

 ,
, 
Abstract
1. Introduction
2. Materials and Methods
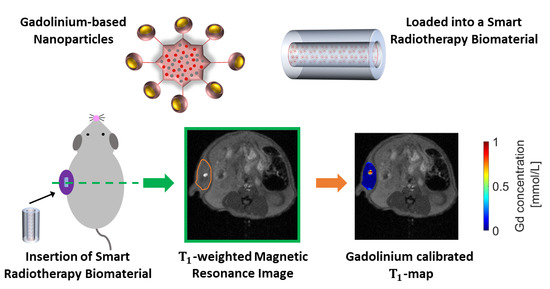
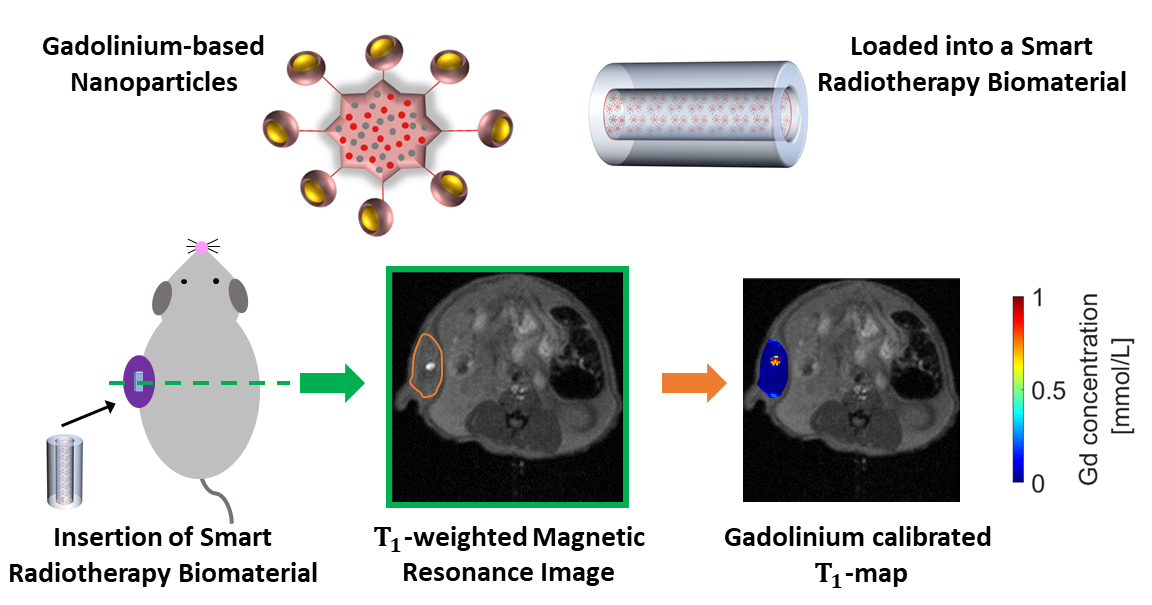
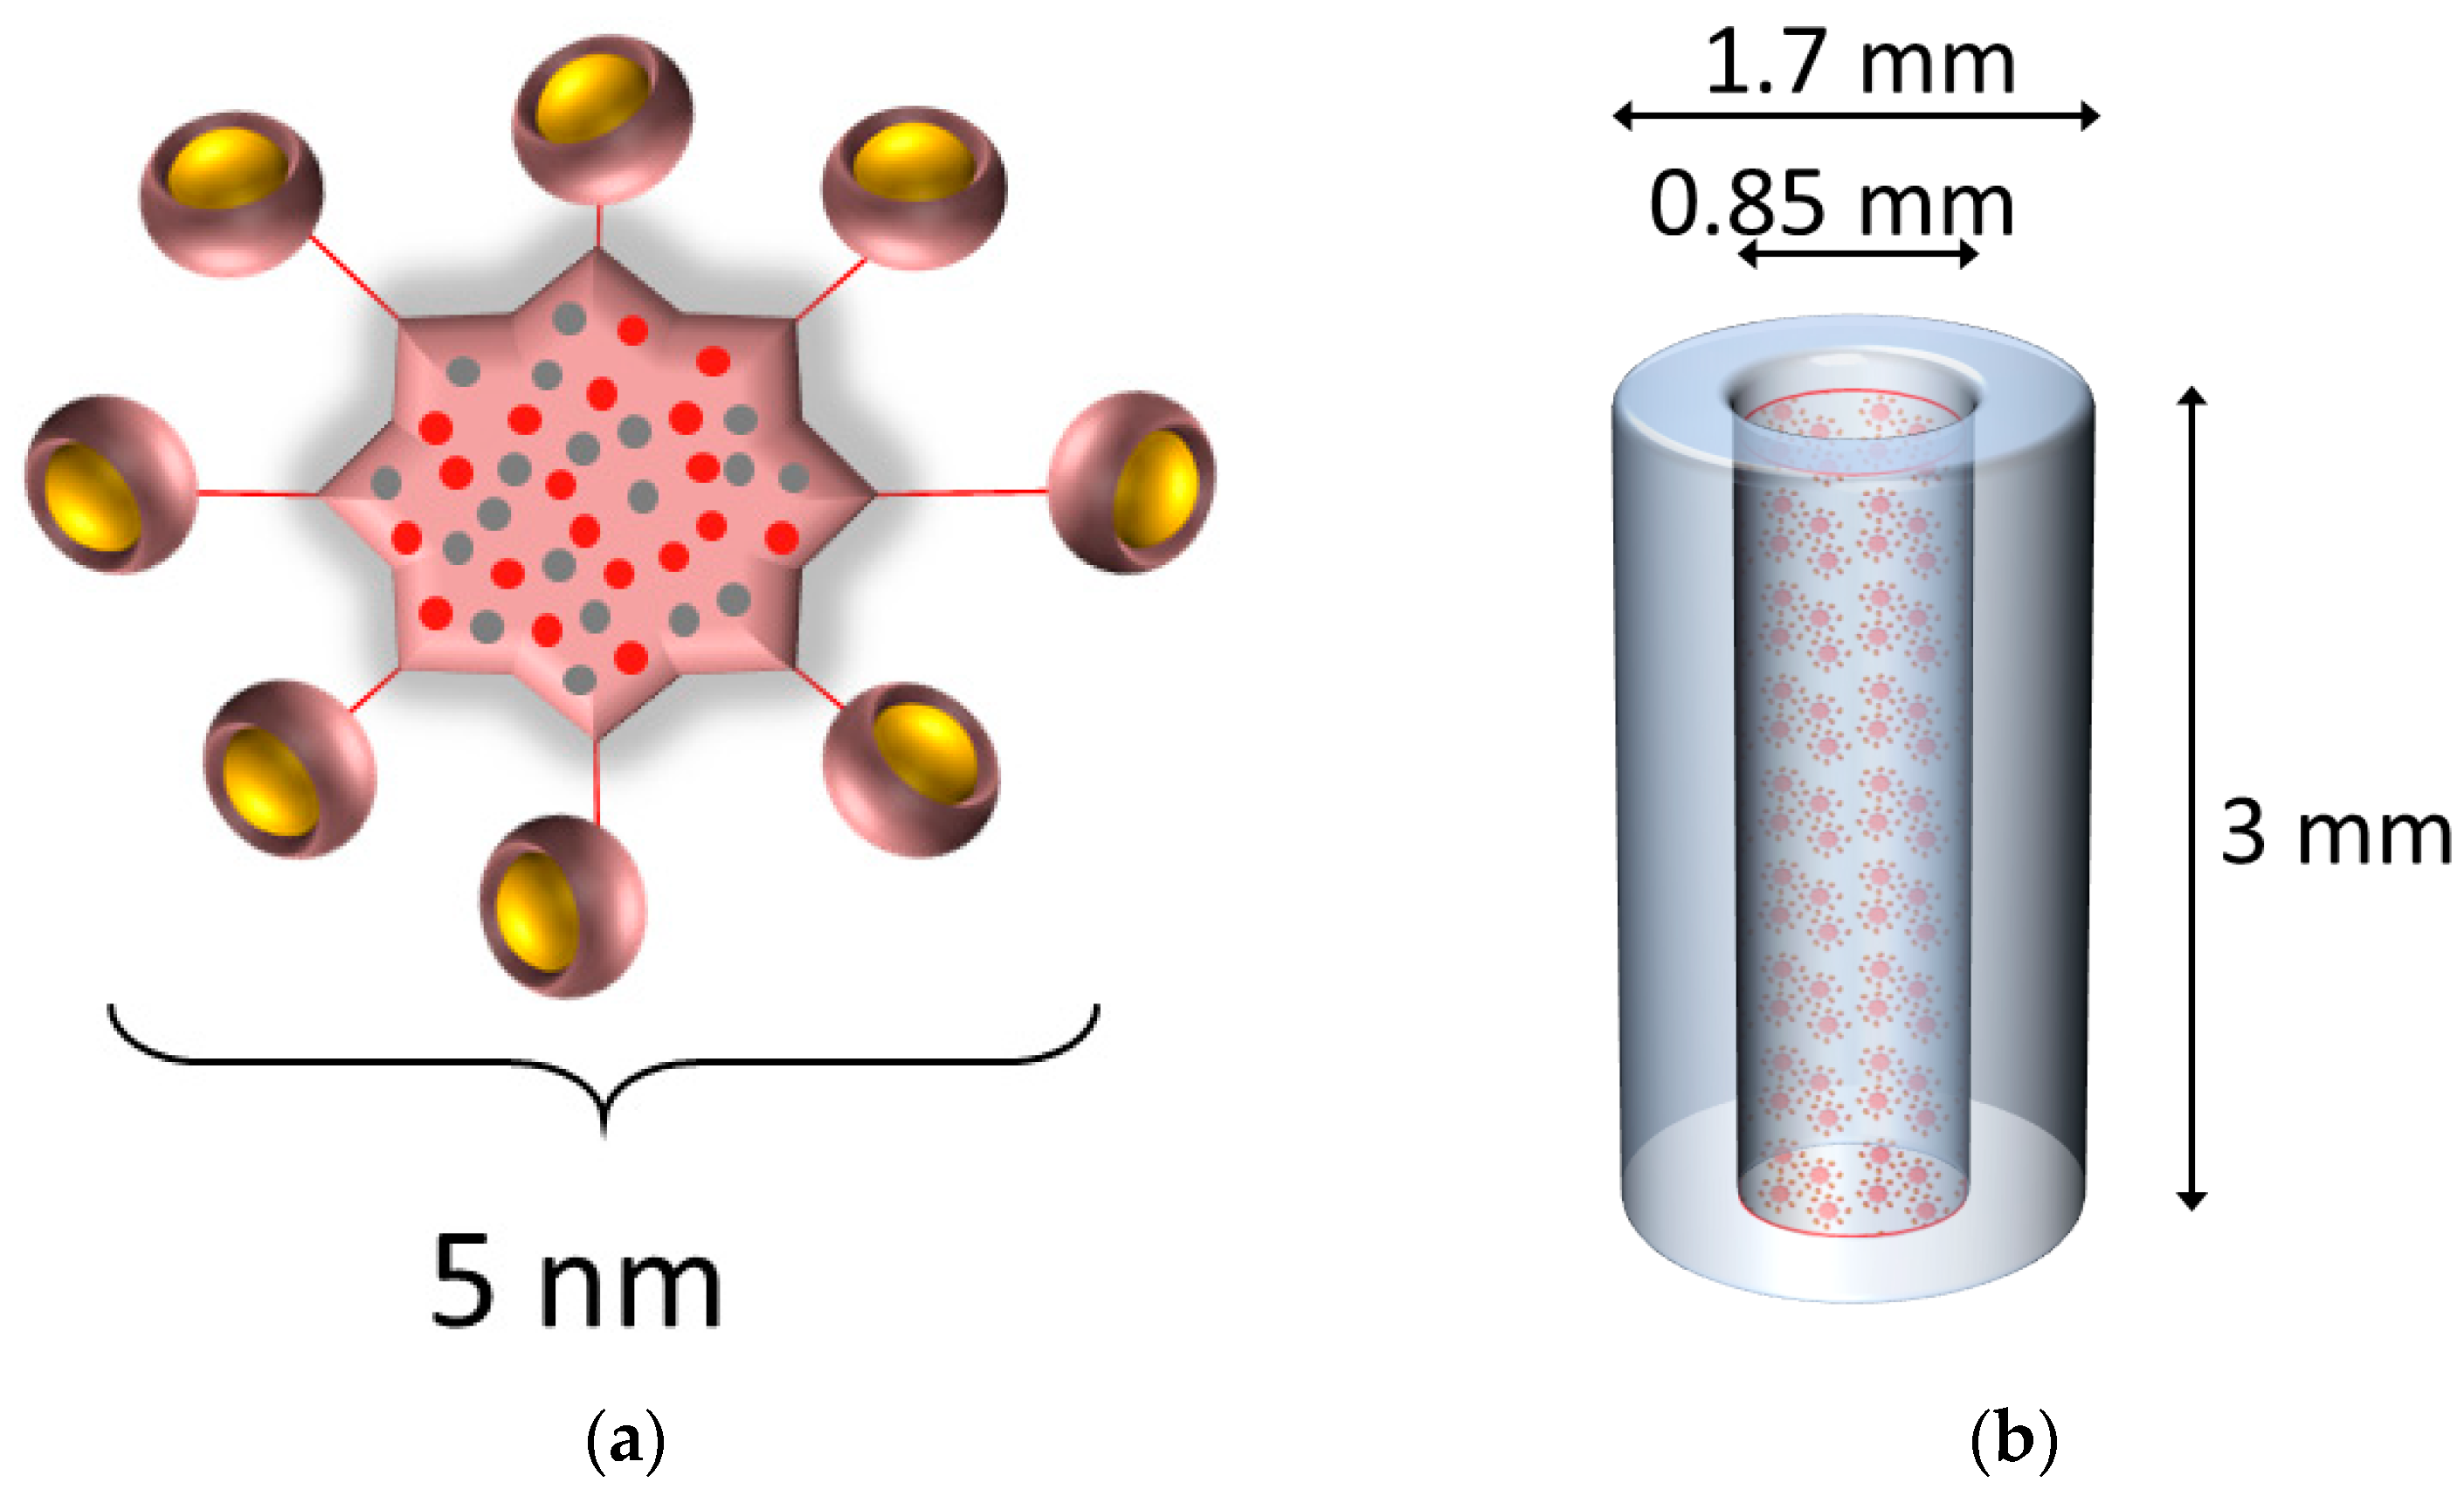
2.1. Gadolinium-Based Nanoparticles (GdNPs)
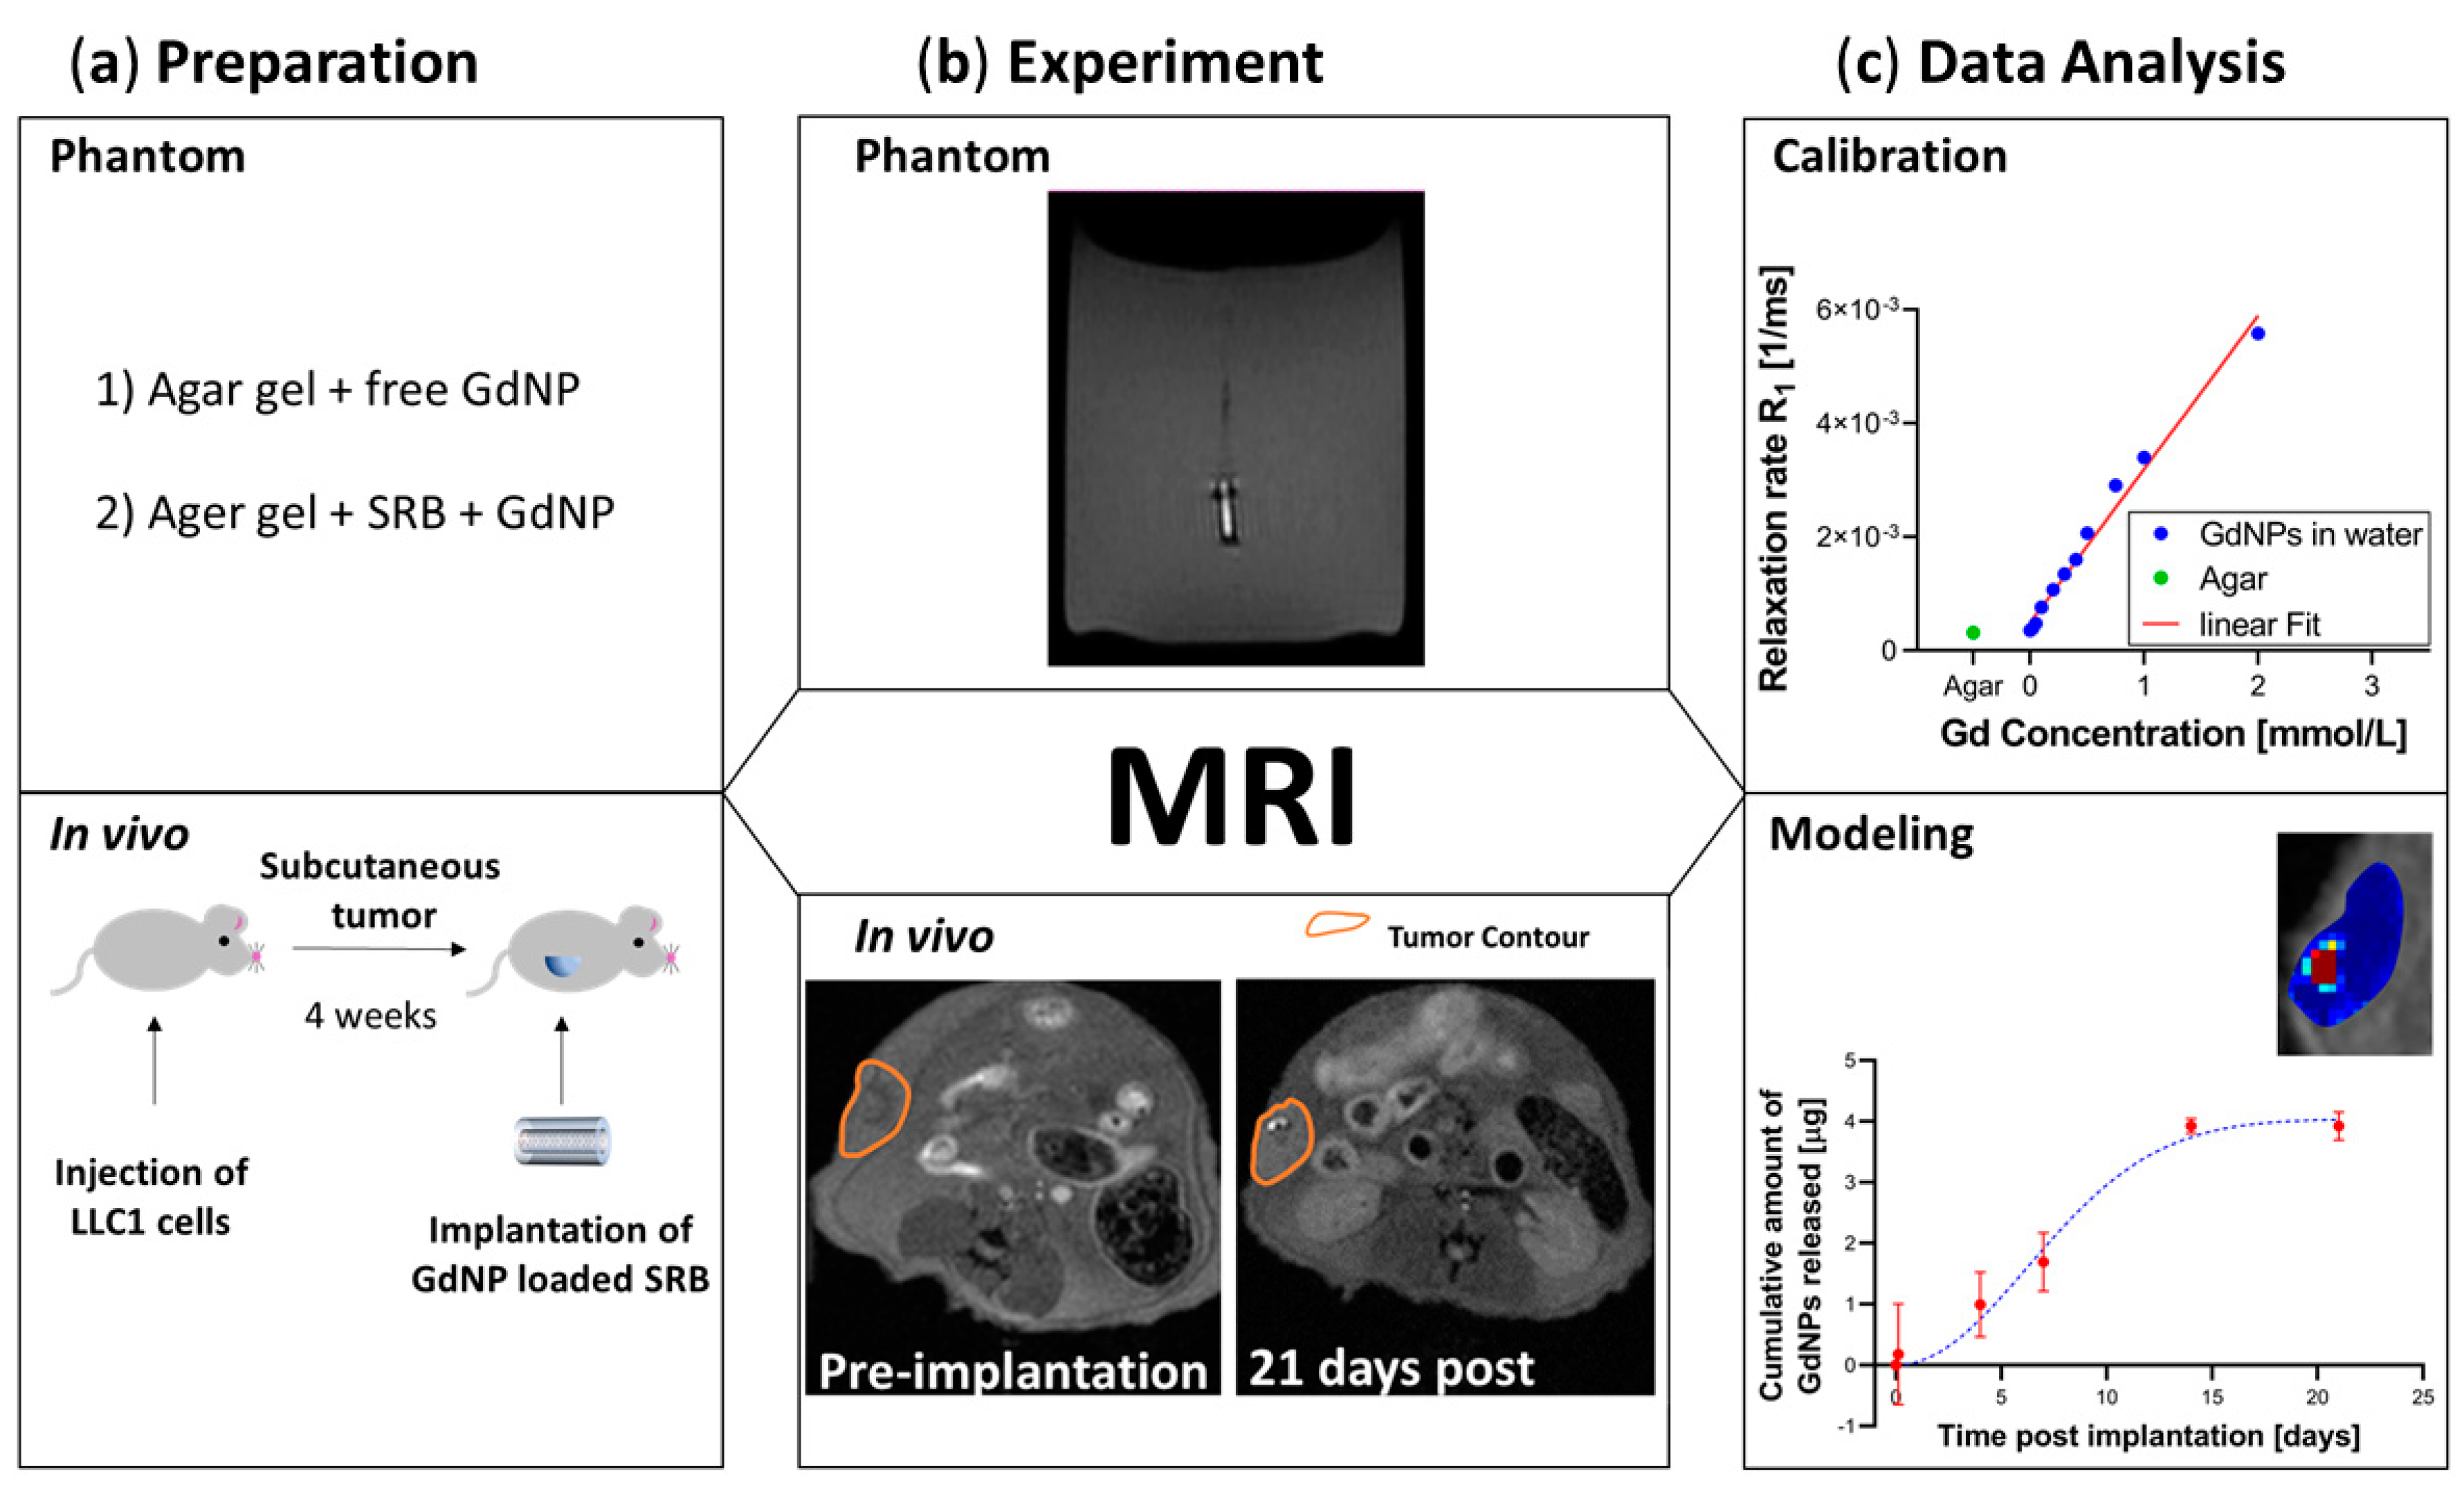
2.2. Agar Samples
2.3. Smart Radiotherapy Biomaterial (SRB)
2.4. Mouse Tumor Model
2.5. MR Imaging
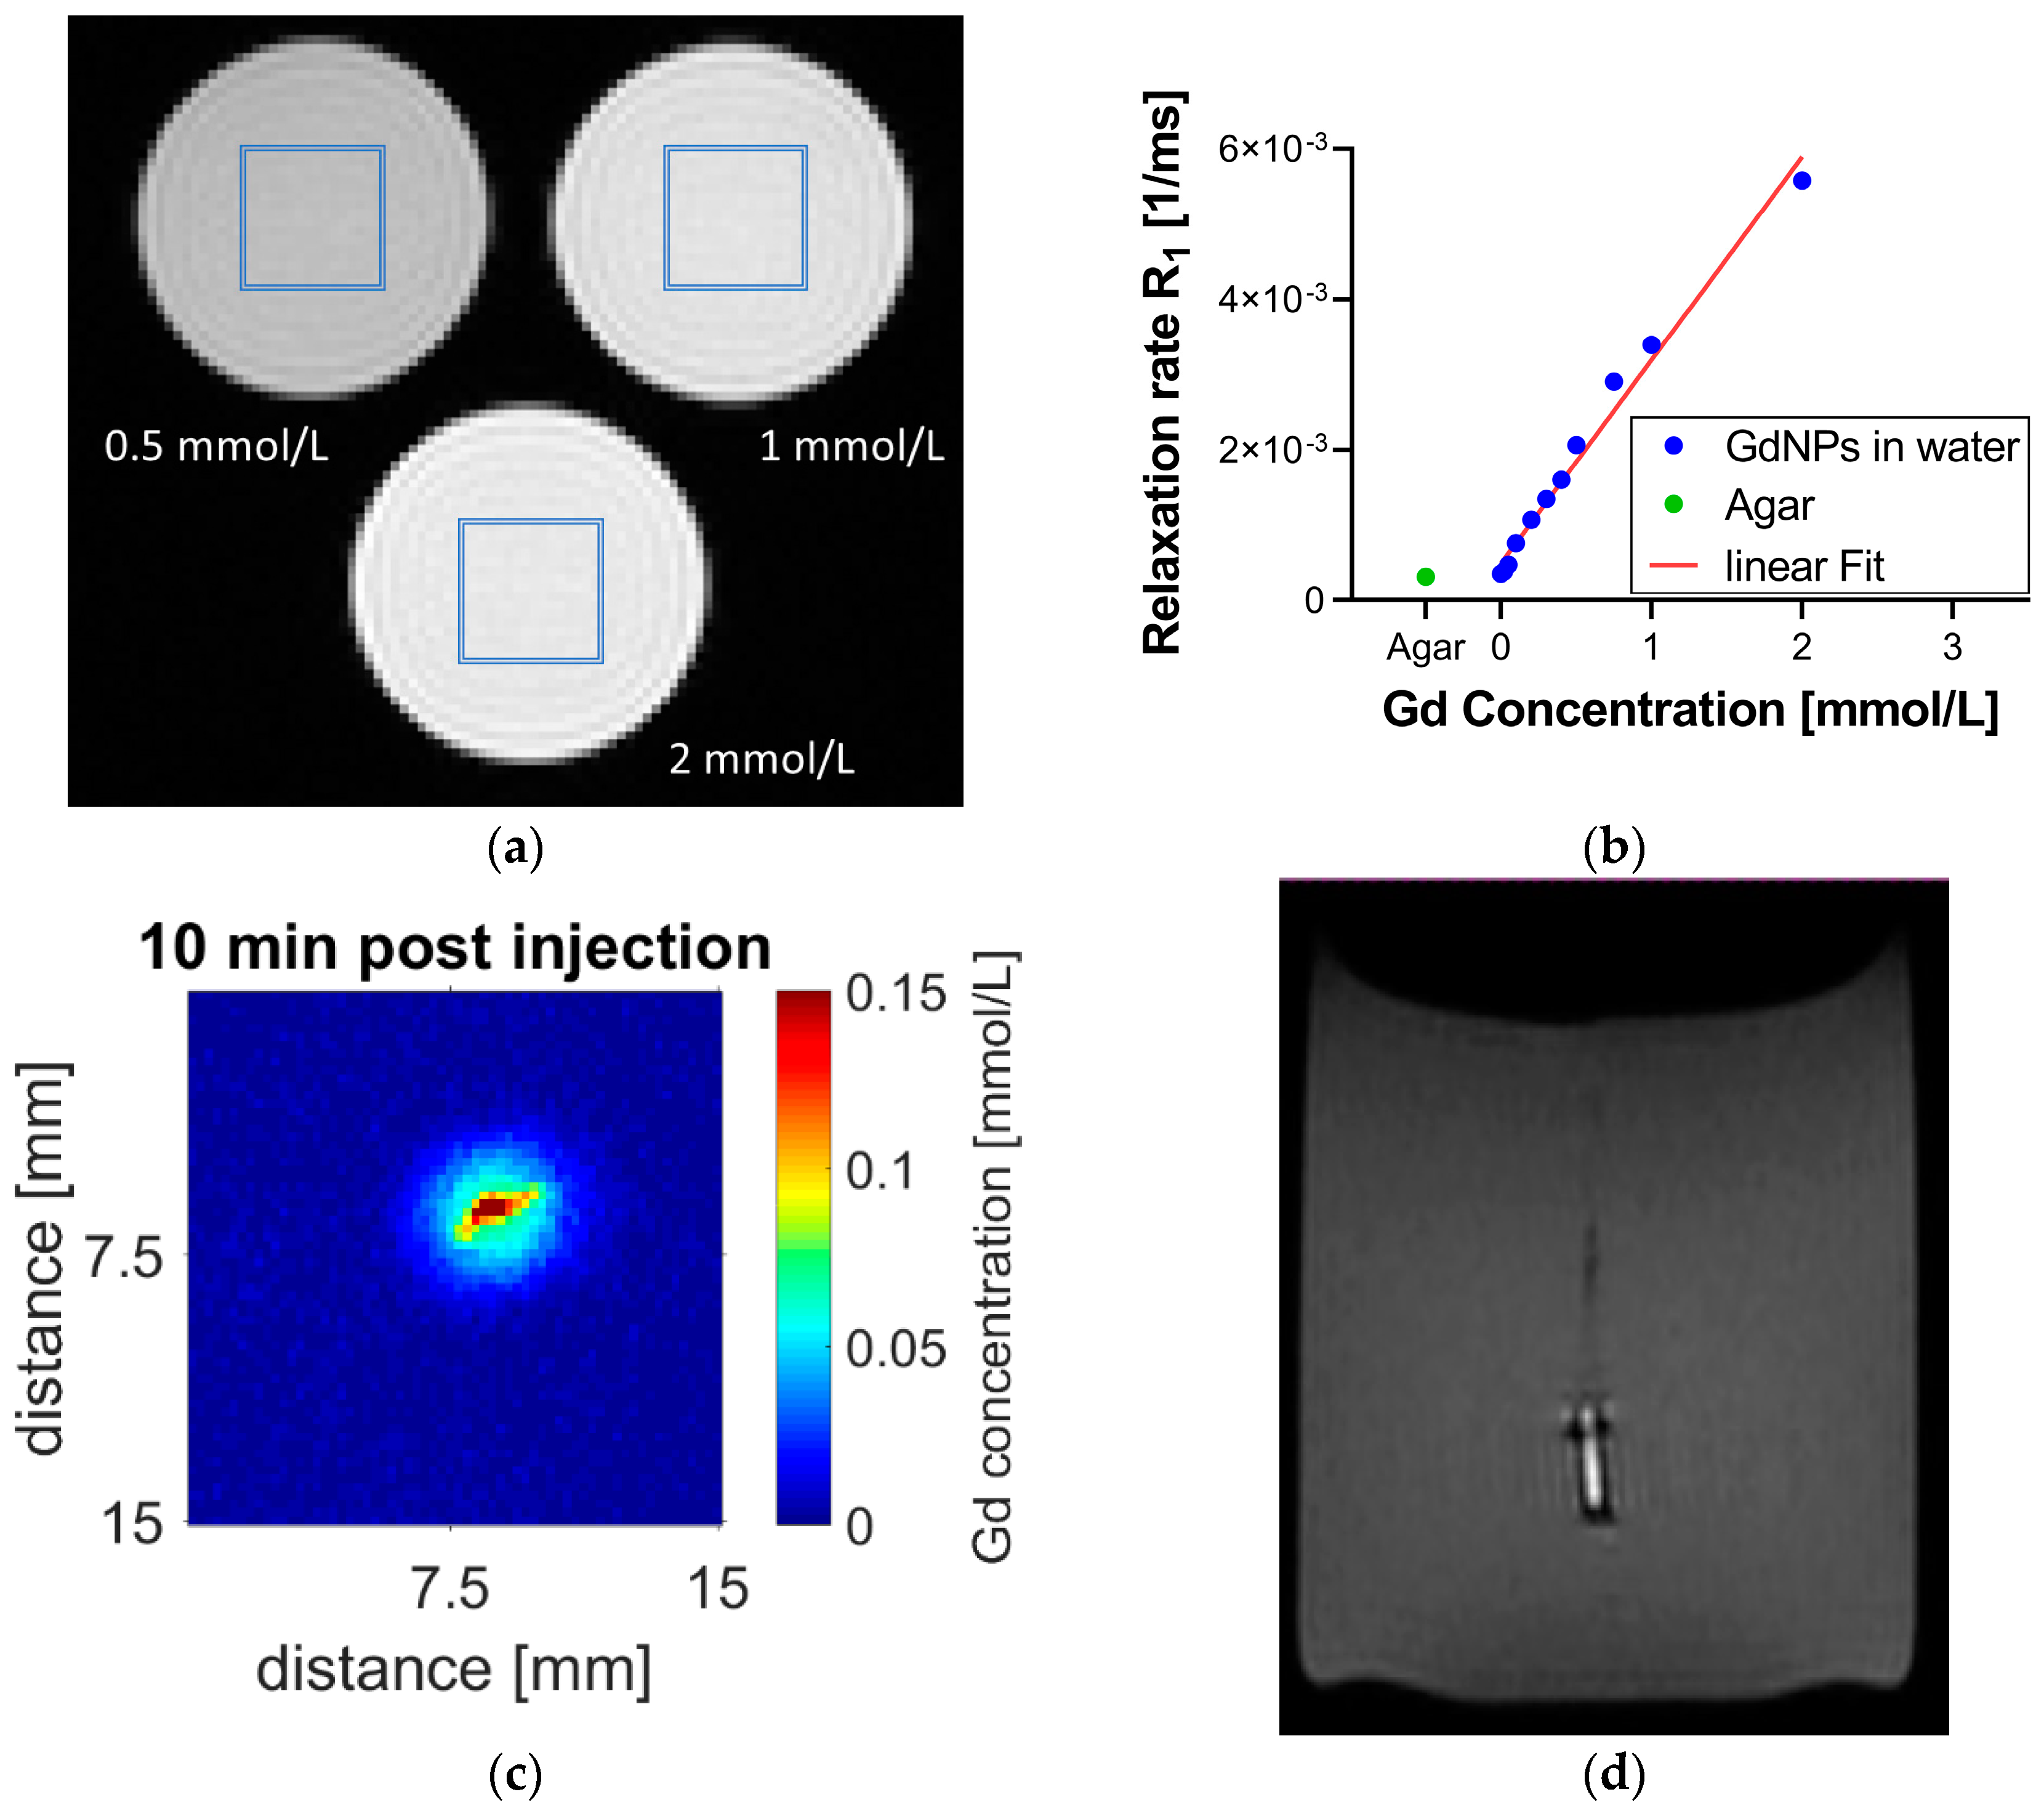
2.6. MR Calibration
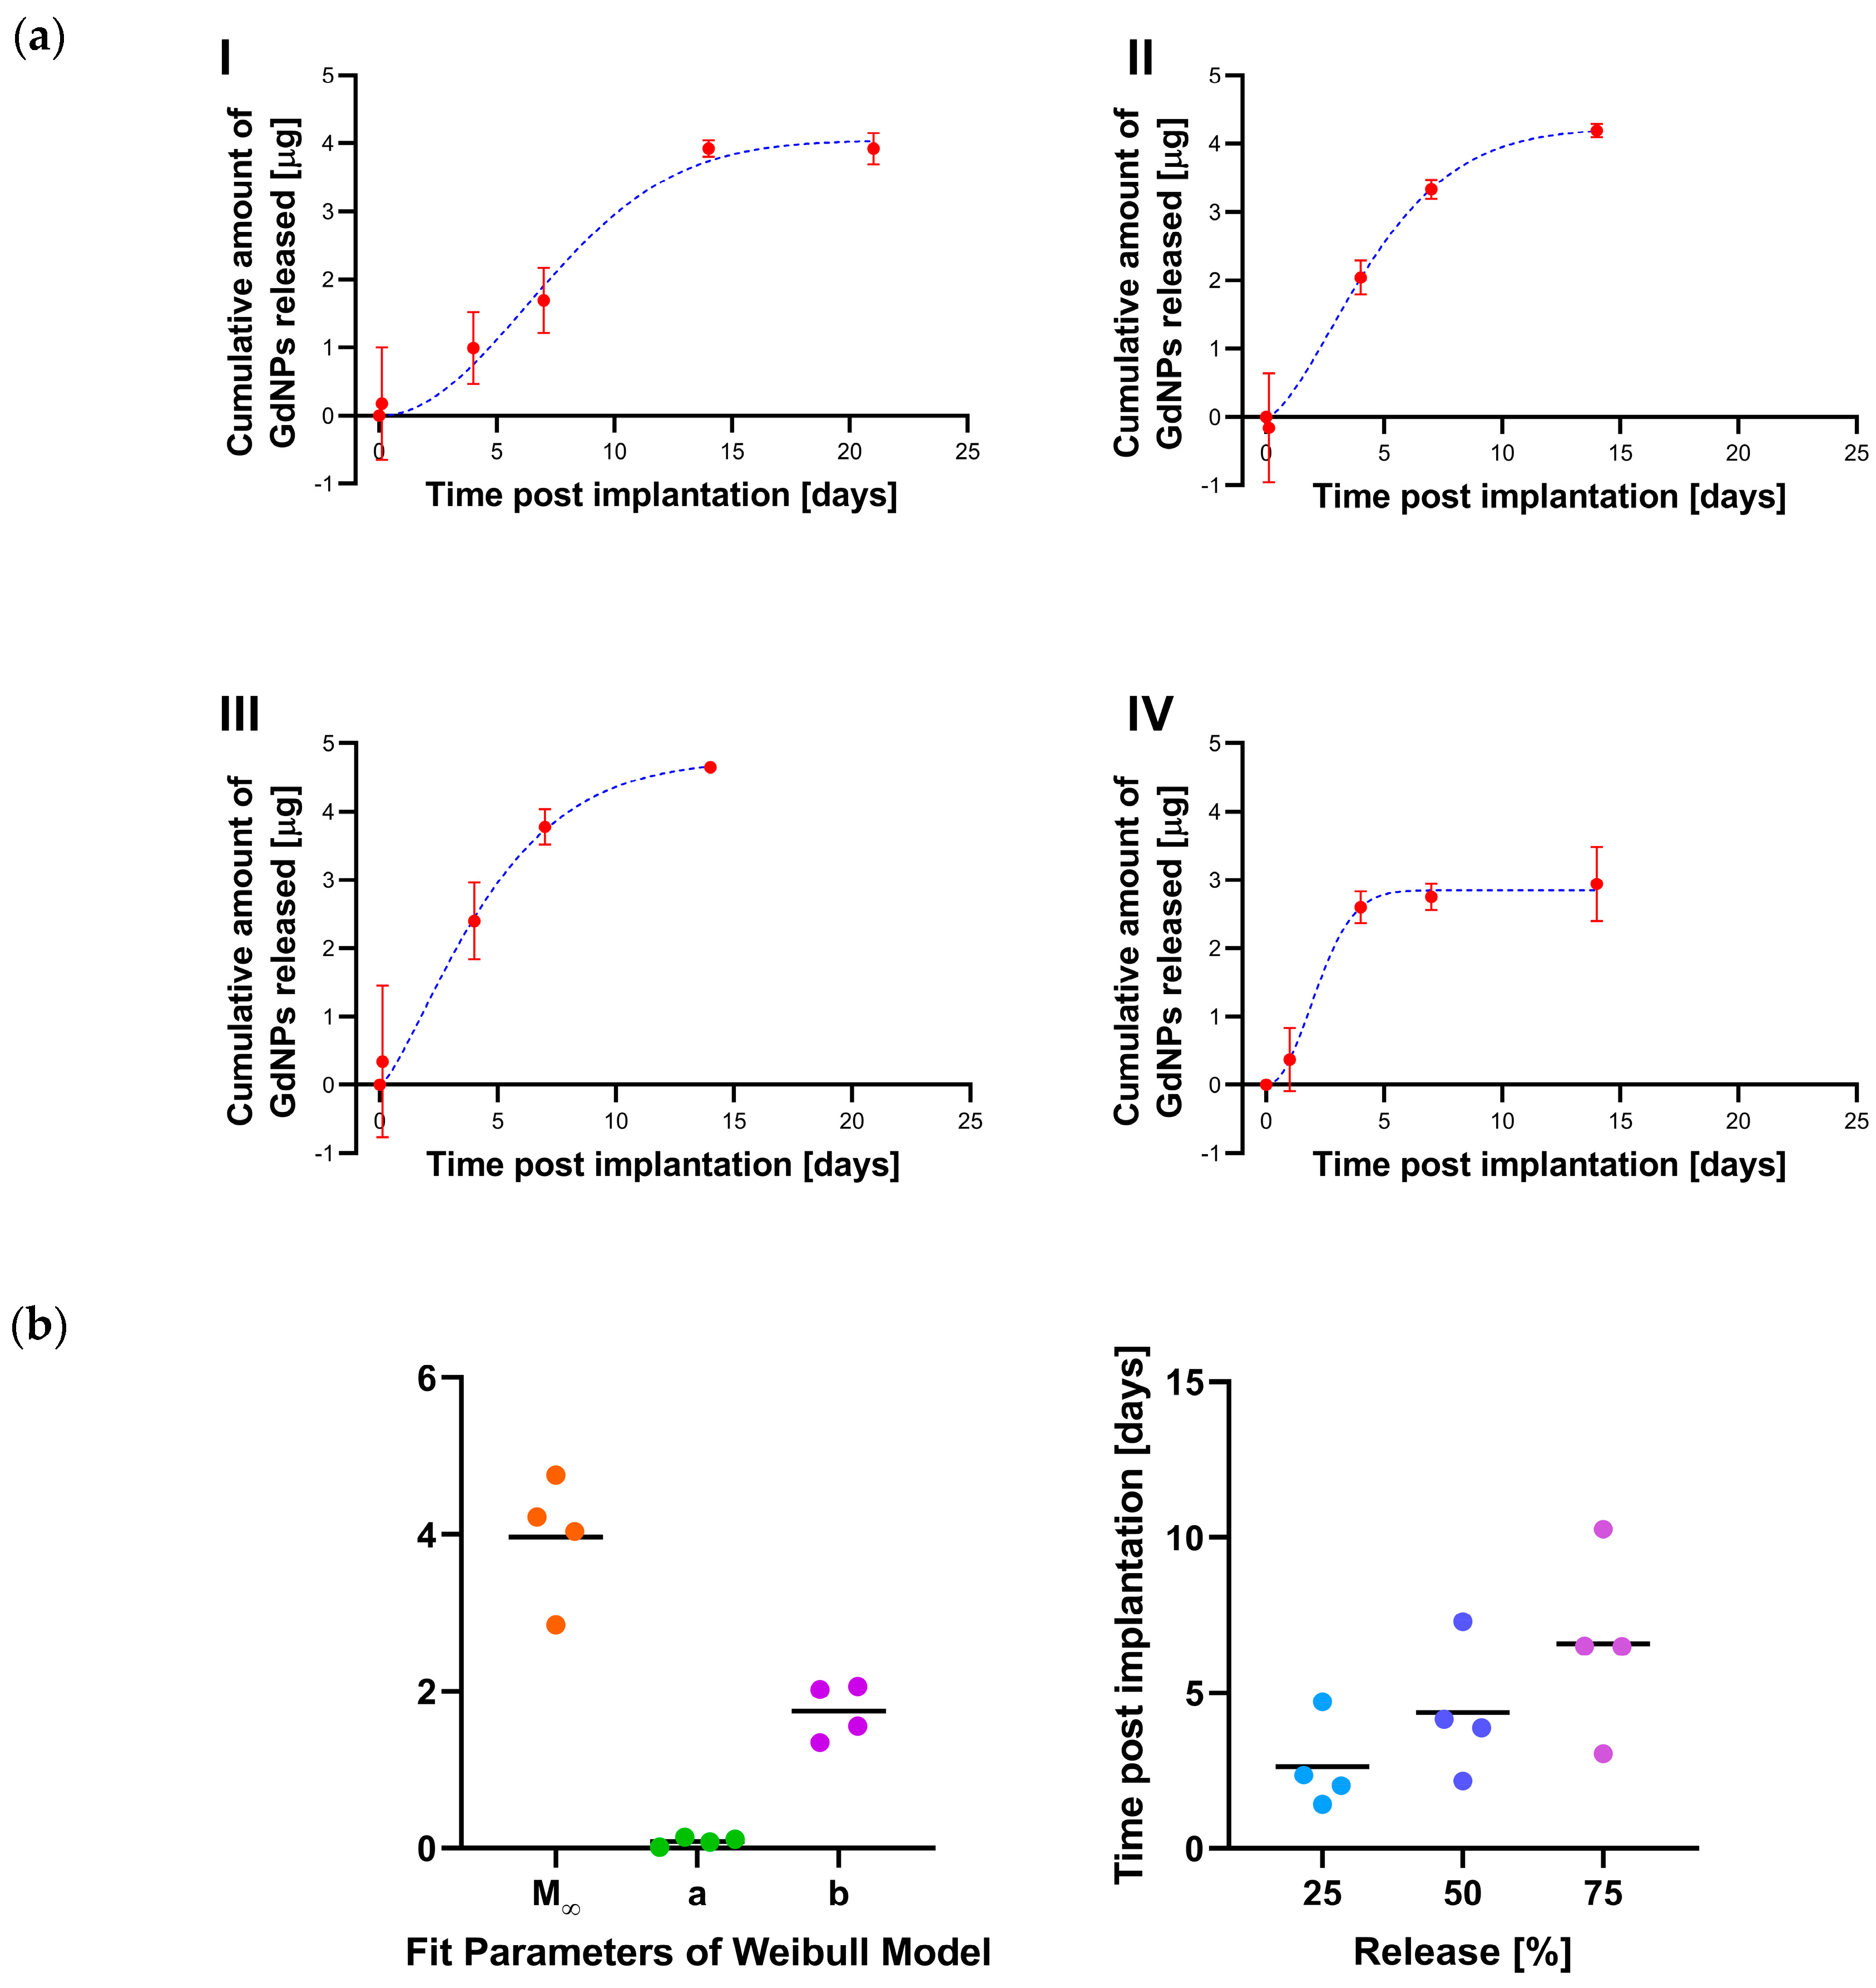
2.7. Release Kinetics
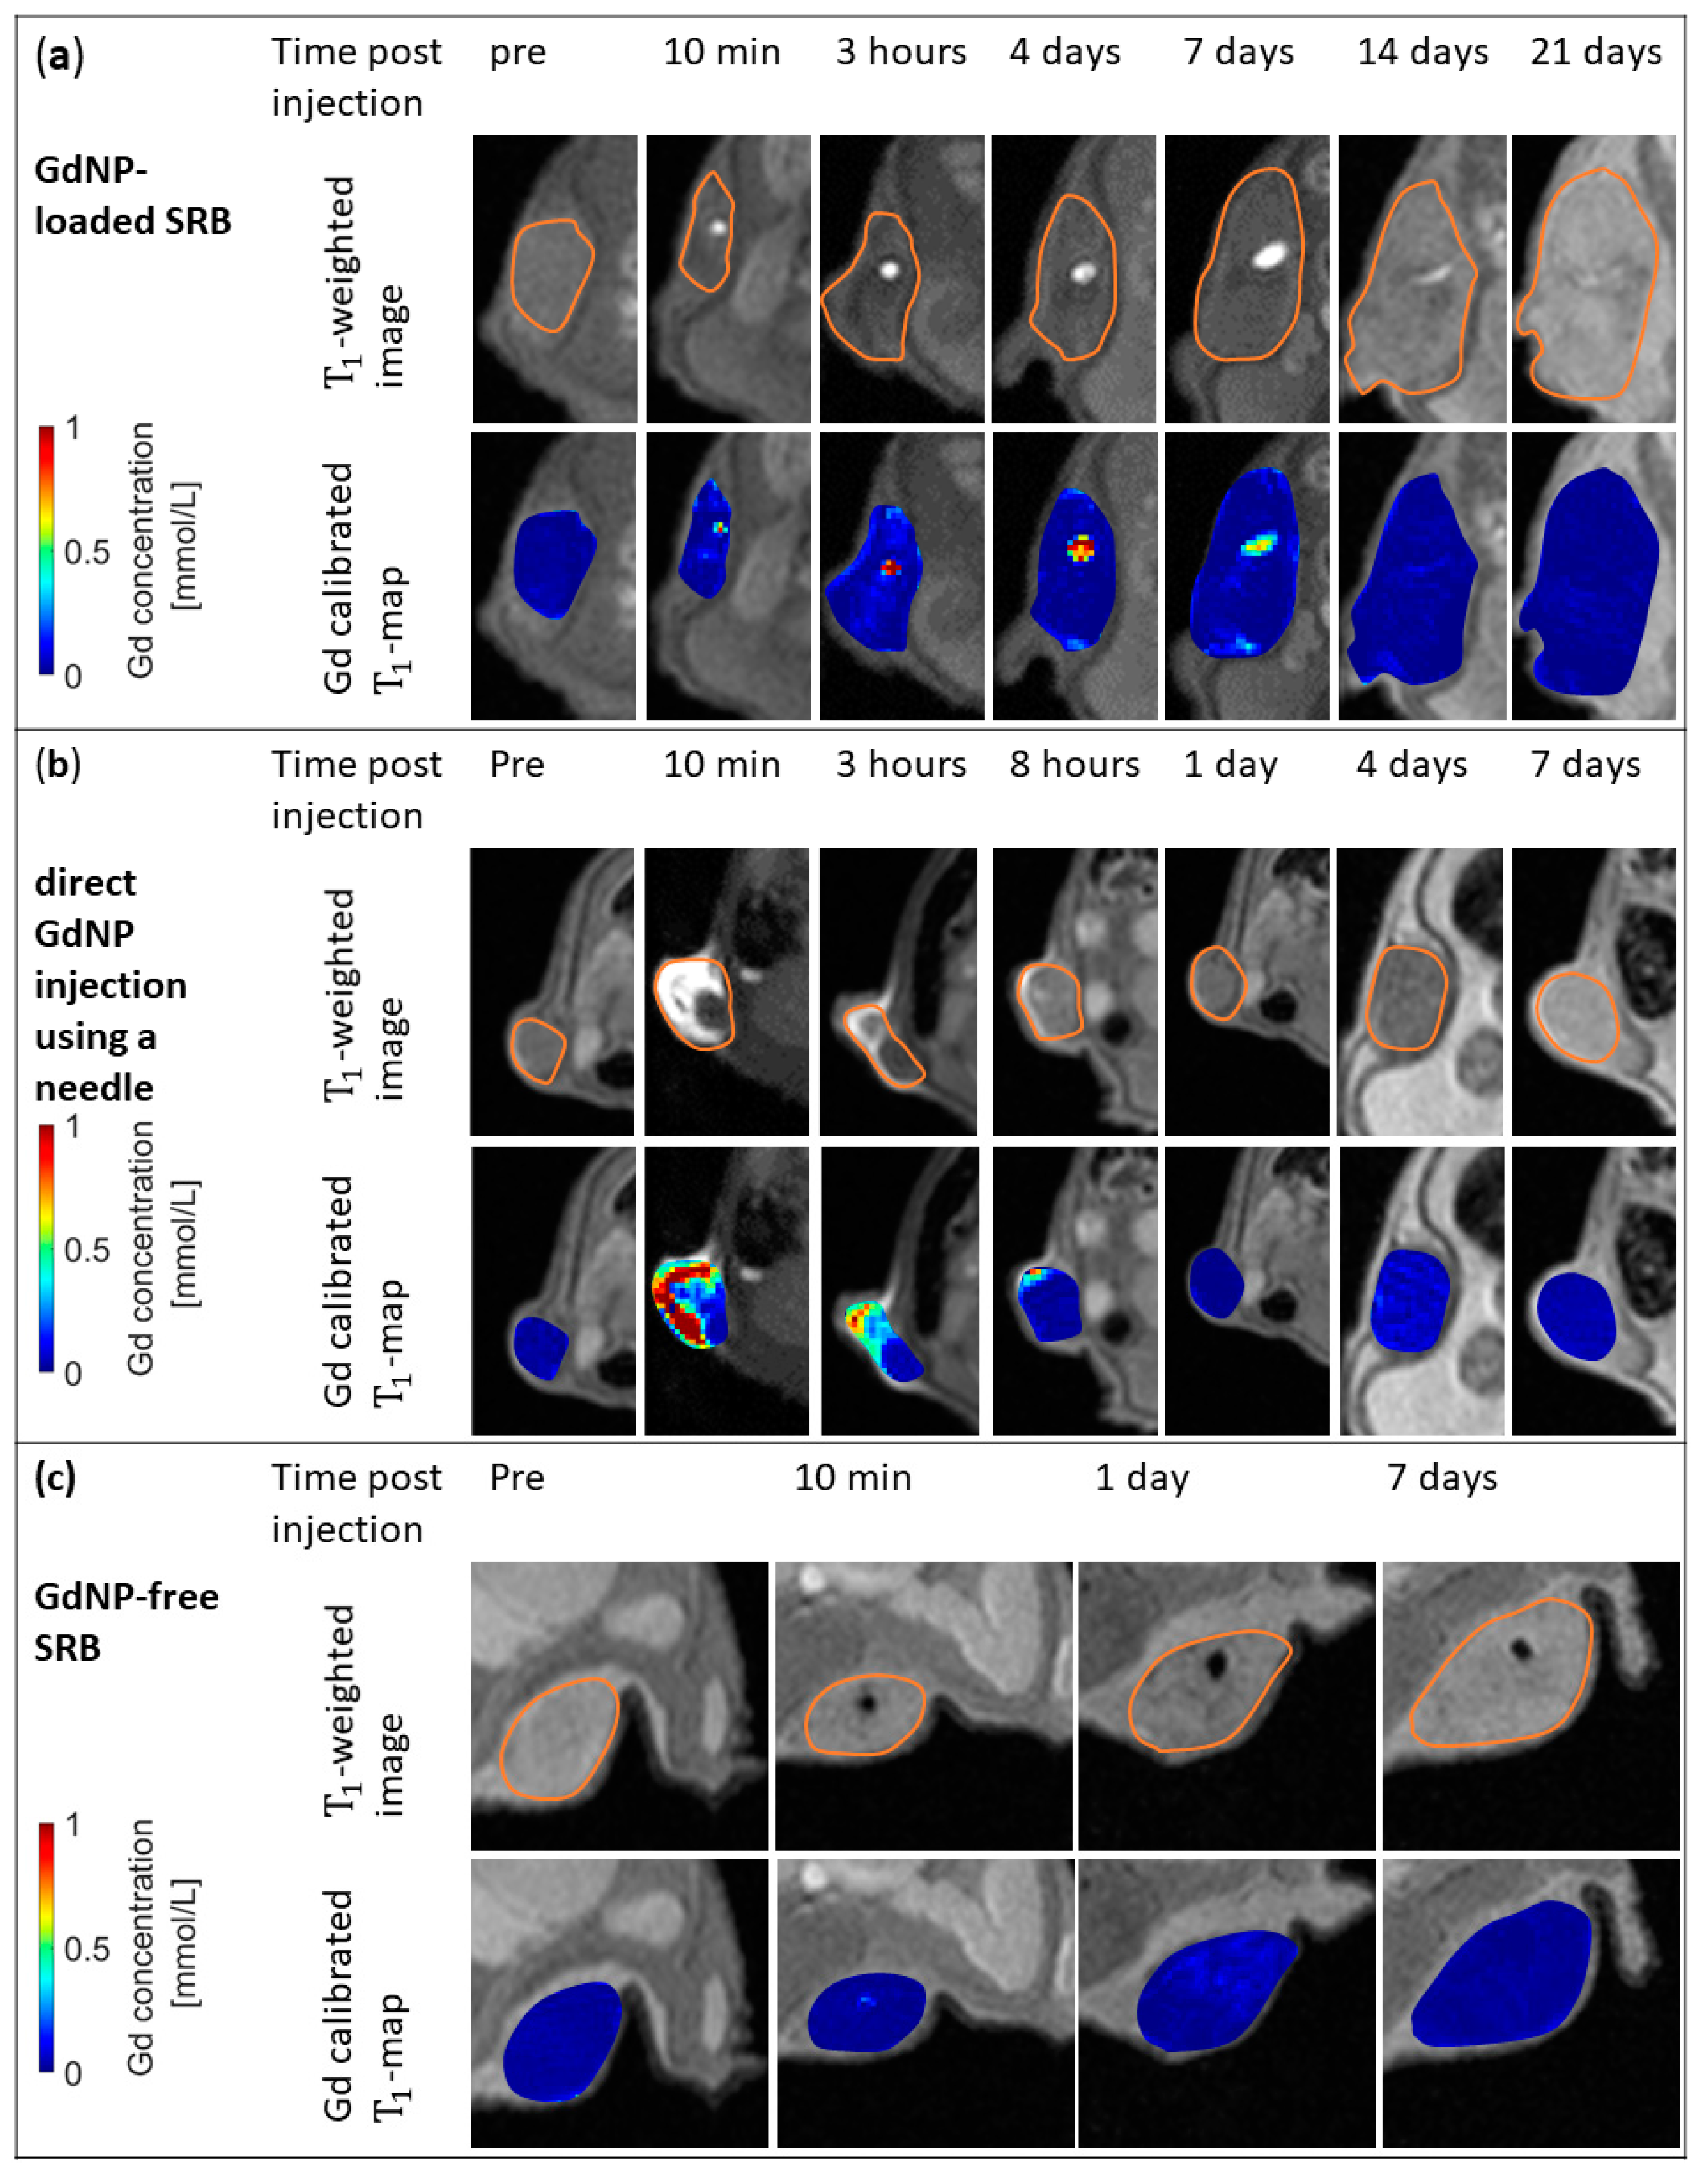
3. Results
4. Discussion
5. Summary and Outlook
Author Contributions
Funding
Acknowledgments
Conflicts of Interest
References
- World Cancer Report 2014. World Health Organization. Available online: http://www.iarc.fr/en/publications/books/wcr/wcr-order.php (accessed on 17 April 2015).
- Atun, R.; Jaffray, D.A.; Barton, M.B.; Bray, F.; Baumann, M.; Vikram, B.; Hanna, T.P.; Knaul, F.M.; Lievens, Y.; Lui, T.Y.; et al. Expanding global access to radiotherapy. Lancet Oncol. 2015, 16, 1153–1186. [Google Scholar] [CrossRef]
- Ngwa, W.; Boateng, F.; Kumar, R.; Irvine, D.J.; Formenti, S.; Ngoma, T.; Herskind, C.; Veldwijk, M.R.; Hildenbrand, G.L.; Hausmann, M.; et al. Smart Radiation Therapy Biomaterials. Int. J. Radiat. Oncol. 2017, 97, 624–637. [Google Scholar] [CrossRef] [PubMed]
- Ngwa, W.; Irabor, O.; Schoenfeld, J.; Hesser, J.; Demaria, S.; Formenti, S. Using immunotherapy to boost the abscopal effect. Nat. Rev. Cancer 2018, 18, 313–322. [Google Scholar] [CrossRef] [PubMed]
- Yasmin-Karim, S.; Moreau, M.; Mueller, R.; Sinha, N.; Dabney, R.; Herman, A.; Ngwa, W. Enhancing the therapeutic efficacy of cancer treatment with cannabinoids. Front. Oncol. 2018, 8, 114. [Google Scholar] [CrossRef] [PubMed]
- Lao, L.L.; Peppas, N.A.; Boey, F.Y.C.; Venkatraman, S.S. Modeling of drug release from bulk-degrading polymers. Int. J. Pharm. 2011, 418, 28–41. [Google Scholar] [CrossRef]
- Dong, Y.; Chin, S.-F.; Blanco, E.; Bey, E.A.; Kabbani, W.; Xie, X.-J.; Bornmann, G.W.; Boothman, D.A.; Gao, J. Intratumoral Delivery of β-Lapachone via Polymer Implants for Prostate Cancer Therapy. Clin. Cancer Res. 2009, 15, 131–139. [Google Scholar] [CrossRef]
- Wolinsky, J.B.; Colson, Y.L.; Grinstaff, M.W. Local drug delivery strategies for cancer treatment: Gels, nanoparticles, polymeric films, rods, and wafers. J. Control. Release 2012, 159, 14–26. [Google Scholar] [CrossRef]
- Fransen, M.F.; Cordfunke, R.A.; Sluijter, M.; Van Steenbergen, M.J.; Drijfhout, J.W.; Ossendorp, F.; Hennink, W.E.; Melief, C.J.M. Effectiveness of slow-release systems in CD40 agonistic antibody immunotherapy of cancer. Vaccine 2014, 32, 1654–1660. [Google Scholar] [CrossRef]
- Sandin, L.C.; Orlova, A.; Gustafsson, E.; Ellmark, P.; Tolmachev, V.; Tötterman, T.H.; Mangsbo, S.M. Locally Delivered CD40 Agonist Antibody Accumulates in Secondary Lymphoid Organs and Eradicates Experimental Disseminated Bladder Cancer. Cancer Immunol. Res. 2014, 2, 80–90. [Google Scholar] [CrossRef]
- Cormack, R.A.; Sridhar, S.; Suh, W.W.; D’Amico, A.V.; Makrigiorgos, G.M. Biological in situ dose painting for image-guided radiation therapy using drug-loaded implantable devices. Int. J. Radiat. Oncol. Biol. Phys. 2010, 76, 615–623. [Google Scholar] [CrossRef]
- Sinha, N.; Cifter, G.; Sajo, E.; Kumar, R.; Sridhar, S.; Nguyen, P.L.; Cormack, R.A.; Makrigiorgos, G.M.; Ngwa, W. Brachytherapy Application With In Situ Dose Painting Administered by Gold Nanoparticle Eluters. Int. J. Radiat. Oncol. Biol. Phys. 2015, 91, 385–392. [Google Scholar] [CrossRef] [PubMed]
- Kumar, R.; Belz, J.; Markovic, S.; Jadhav, T.; Fowle, W.; Niedre, M.; Cormack, R.; Makrigiorgos, M.G.; Sridhar, S. Nanoparticle-Based Brachytherapy Spacers for Delivery of Localized Combined Chemoradiation Therapy. Radiat. Oncol. Biol. 2015, 91, 393–400. [Google Scholar] [CrossRef] [PubMed]
- Moreau, M.; Yasmin-Karim, S.; Kunjachan, S.; Sinha, N.; Gremse, F.; Kumar, R.; Chow, K.F.; Ngwa, W. Priming the abscopal effect using multifunctional smart radiotherapy biomaterials loaded with immunoadjuvants. Front. Oncol. 2018, 8, 56. [Google Scholar] [CrossRef] [PubMed]
- Tóth, É.; Helm, L.; Merbach, A.S. Relaxivity of gadolinium (III) complexes: Theory and Mechanism. In The Chemistry of Contrast Agents in Medical Magnetic Resonance Imaging; John Wiley & Sons, Ltd.: Hoboken, NJ, USA, 2013; pp. 25–81. [Google Scholar]
- Sancey, L.; Lux, F.; Kotb, S.; Roux, S.; Dufort, S.; Bianchi, A.; Cremillieux, Y.; Fries, P.; Coll, J.-L.; Rodriguez-Lafrasse, C.; et al. The use of theranostic gadolinium-based nanoprobes to improve radiotherapy efficacy. Br. J. Radiol. 2014, 87, 20140134. [Google Scholar] [CrossRef] [PubMed]
- Verry, C.; Sancey, L.; Dufort, S.; Le Duc, G.; Mendoza, C.; Lux, F.; Grand, S.; Arnaud, J.; Quesada, J.; Louis Villa, J.; et al. Treatment of multiple brain metastases using gadolinium nanoparticles and radiotherapy: NANO-RAD, a phase I study protocol. BMJ Open 2019, 9, e023591. [Google Scholar] [CrossRef] [PubMed]
- Bianchi, A.; Dufort, S.; Lux, F.; Courtois, A.; Tillement, O.; Coll, J.-L.; Crémillieux, Y. Quantitative biodistribution and pharmacokinetics of multimodal gadolinium-based nanoparticles for lungs using ultrashort TE MRI. Magn. Reson. Mater. Phys. Biol. Med. 2014, 27, 303–316. [Google Scholar] [CrossRef]
- Lux, F.; Tran, V.L.; Thomas, E.; Dufort, S.; Rossetti, F.; Martini, M.; Truillet, C.; Doussineau, T.; Bort, G.; Denat, F. AGuIX® from bench to bedside—Transfer of an ultrasmall theranostic gadolinium-based nanoparticle to clinical medicine. Br. J. Radiol. 2019, 92, 20180365. [Google Scholar] [CrossRef]
- Mignot, A.; Truillet, C.; Lux, F.; Sancey, L.; Louis, C.; Denat, F.; Boschetti, F.; Bocher, L.; Gloter, A.; Stéphan, O. A Top-Down synthesis route to ultrasmall multifunctional Gd-Based silica nanoparticles for theranostic applications. Chem. A Eur. J. 2013, 19, 6122–6136. [Google Scholar] [CrossRef]
- Lux, F.; Mignot, A.; Mowat, P.; Louis, C.; Dufort, S.; Bernhard, C.; Denat, F.; Boschetti, F.; Brunet, C.; Antoine, R. Ultrasmall rigid particles as multimodal probes for medical applications. Angew. Chem. Int. Ed. 2011, 50, 12299–12303. [Google Scholar] [CrossRef]
- Faucher, L.; Guay-Bégin, A.-A.; Lagueux, J.; Côté, M.-F.; Petitclerc, É.; Fortin, M.-A. Ultra-small gadolinium oxide nanoparticles to image brain cancer cells in vivo with MRI. Contrast Media Mol. Imaging 2011, 6, 209–218. [Google Scholar] [CrossRef]
- Marangoni, V.S.; Neumann, O.; Henderson, L.; Kaffes, C.C.; Zhang, H.; Zhang, R.; Bishnoi, S.; Ayala-Orozco, C.; Zucolotto, V.; Bankson, J.A. Enhancing T1 magnetic resonance imaging contrast with internalized gadolinium (III) in a multilayer nanoparticle. Proc. Natl. Acad. Sci. USA 2017, 114, 6960–6965. [Google Scholar] [CrossRef] [PubMed]
- Verry, C.; Dufort, S.; Lemasson, B.; Grand, S.; Pietras, J.; Troprès, I.; Crémillieux, Y.; François, L.; Mériaux, S.; Larrat, B.; et al. Targeting brain metastases with theranostic nanoparticles, a first-in-human trial from an MRI perspective. Sci. Adv. 2020, 6, eaay5279. [Google Scholar] [CrossRef] [PubMed]
- Macheras, P.; Dokoumetzidis, A. On the heterogeneity of drug dissolution and release. Pharm. Res. 2000, 17, 108–112. [Google Scholar] [CrossRef] [PubMed]
- Papadopoulou, V.; Kosmidis, K.; Vlachou, M.; Macheras, P. On the use of the Weibull function for the discernment of drug release mechanisms. Int. J. Pharm. 2006, 309, 44–50. [Google Scholar] [CrossRef] [PubMed]
- Armbruster, D.A.; Pry, T. Limit of blank, limit of detection and limit of quantitation. Clin. Biochem. Rev. 2008, 29, S49. [Google Scholar]
- McRobbie, D.W.; Moore, E.A.; Graves, M.J.; Prince, M.R. MRI from Picture to Proton; Cambridge University Press: Cambridge, UK, 2017. [Google Scholar]
- Prasad, P.V. Magnetic Resonance Imaging: Methods and Biologic Applications; Humana Press: Totowa, NJ, USA, 2006. [Google Scholar]
- Sancey, L.; Kotb, S.; Truillet, C.; Appaix, F.; Marais, A.; Thomas, E.; van der Sanden, B.; Klein, J.-P.; Laurent, B.; Cottier, M. Long-term in vivo clearance of gadolinium-based AGuIX nanoparticles and their biocompatibility after systemic injection. ACS Publ. 2015, 9, 2477–2488. [Google Scholar] [CrossRef]
- Rohrer, M.; Bauer, H.; Mintorovitch, J.; Requardt, M.; Weinmann, H.-J. Comparison of magnetic properties of MRI contrast media solutions at different magnetic field strength. Investig. Radiol. 2005, 40, 715–724. [Google Scholar] [CrossRef]
- Caravan, P.; Farrar, C.T.; Frullano, L.; Uppal, R. Influence of molecular parameters and increasing magnetic field strength on relaxivity of gadolinium-and manganese-based T1 contrast agents. Contrast Media Mol. Imaging 2009, 4, 89–100. [Google Scholar] [CrossRef]
- Block, K.T.; Uecker, M.; Frahm, J. Suppression of MRI truncation artifacts using total variation constrained data extrapolation. Int. J. Biomed. Imaging 2008, 2008, 184123. [Google Scholar] [CrossRef]
- Raymond, K.N.; Pierre, V.C. Next generation, high relaxivity gadolinium MRI agents. Bioconjug. Chem. 2005, 16, 3–8. [Google Scholar] [CrossRef]
- Strijkers, G.; Mulder, W.; Van Heeswijk, R.; Frederik, P.; Bomans, P.; Magusin, P.; Nicolay, K. Relaxivity of liposomal paramagnetic MRI contrast agents. Magn. Reson. Mater. Phys. Biol. Med. 2005, 18, 186–192. [Google Scholar] [CrossRef] [PubMed]
- Liu, J.; Zhang, R.; Xu, Z.P. Nanoparticle-Based Nanomedicines to Promote Cancer Immunotherapy: Recent Advances and Future Directions. Small 2019, 15, 1900262. [Google Scholar] [CrossRef] [PubMed]
- Chao, Y.; Xu, L.; Liang, C.; Feng, L.; Xu, J.; Dong, Z.; Tian, L.; Yi, X.; Yang, K.; Liu, Z. Combined local immunostimulatory radioisotope therapy and systemic immune checkpoint blockade imparts potent antitumour responses. Nat. Biomed. Eng. 2018, 2, 611–621. [Google Scholar] [CrossRef] [PubMed]
- Nagesha, D.K.; Tada, D.B.; Stambaugh, C.K.K.; Gultepe, E.; Jost, E.; Levy, C.O.; Cormack, R.; Makrigiorgos, G.M.; Sridhar, S. Radiosensitizer-eluting nanocoatings on gold fiducials for biological in-situ image-guided radio therapy (BIS-IGRT). Phys. Med. Biol. 2010, 55, 6039–6052. [Google Scholar] [CrossRef]
- Bouziotis, P.; Stellas, D.; Thomas, E.; Truillet, C.; Tsoukalas, C.; Lux, F.; Tsotakos, T.; Xanthopoulos, S.; Paravatou-Petsotas, M.; Gaitanis, A.; et al. 68Ga-radiolabeled AGuIX nanoparticles as dual-modality imaging agents for PET/MRI-guided radiation therapy. Nanomedicine 2017, 12, 1561–1574. [Google Scholar] [CrossRef]
- Dufort, S.; Appelboom, G.; Verry, C.; Barbier, E.L.; Lux, F.; Bräuer-Krisch, E.; Sancey, L.; Chang, S.D.; Zhang, M.; Roux, S.; et al. Ultrasmall theranostic gadolinium-based nanoparticles improvehigh-grade rat glioma survival. J. Clin. Neurosci. 2019, 67, 215–219. [Google Scholar] [CrossRef]
- Luchette, M.; Korideck, H.; Makrigiorgos, M.; Tillement, O.; Berbeco, R. Radiation dose enhancement of gadolinium-based AGuIX nanoparticles on HeLa cells. Nanomed. Nanotechnol. Biol. Med. 2014, 10, 1751–1755. [Google Scholar] [CrossRef]
- Mowat, P.; Mignot, A.; Rima, W.; Lux, F.; Tillement, O.; Roulin, C.; Dutreix, M.; Bechet, D.; Huger, S.; Humbert, L. In vitro radiosensitizing effects of ultrasmall gadolinium based particles on tumour cells. J. Nanosci. Nanotechnol. 2011, 11, 7833–7839. [Google Scholar] [CrossRef]
- Verma, N.; Cowperthwaite, M.C.; Burnett, M.G.; Markey, M.K. Differentiating tumor recurrence from treatment necrosis: A review of neuro-oncologic imaging strategies. Neuro Oncol. 2013, 15, 515–534. [Google Scholar] [CrossRef]


Publisher’s Note: MDPI stays neutral with regard to jurisdictional claims in published maps and institutional affiliations. |
© 2020 by the authors. Licensee MDPI, Basel, Switzerland. This article is an open access article distributed under the terms and conditions of the Creative Commons Attribution (CC BY) license (http://creativecommons.org/licenses/by/4.0/).
Share and Cite
Mueller, R.; Moreau, M.; Yasmin-Karim, S.; Protti, A.; Tillement, O.; Berbeco, R.; Hesser, J.; Ngwa, W. Imaging and Characterization of Sustained Gadolinium Nanoparticle Release from Next Generation Radiotherapy Biomaterial. Nanomaterials 2020, 10, 2249. https://doi.org/10.3390/nano10112249
Mueller R, Moreau M, Yasmin-Karim S, Protti A, Tillement O, Berbeco R, Hesser J, Ngwa W. Imaging and Characterization of Sustained Gadolinium Nanoparticle Release from Next Generation Radiotherapy Biomaterial. Nanomaterials. 2020; 10(11):2249. https://doi.org/10.3390/nano10112249
Chicago/Turabian StyleMueller, Romy, Michele Moreau, Sayeda Yasmin-Karim, Andrea Protti, Olivier Tillement, Ross Berbeco, Jürgen Hesser, and Wilfred Ngwa. 2020. "Imaging and Characterization of Sustained Gadolinium Nanoparticle Release from Next Generation Radiotherapy Biomaterial" Nanomaterials 10, no. 11: 2249. https://doi.org/10.3390/nano10112249
APA StyleMueller, R., Moreau, M., Yasmin-Karim, S., Protti, A., Tillement, O., Berbeco, R., Hesser, J., & Ngwa, W. (2020). Imaging and Characterization of Sustained Gadolinium Nanoparticle Release from Next Generation Radiotherapy Biomaterial. Nanomaterials, 10(11), 2249. https://doi.org/10.3390/nano10112249