Article

Organic-Inorganic Hybrid Materials for Room Temperature Light-Activated Sub-ppm NO Detection

by
Abulkosim Nasriddinov
1,2,
Marina Rumyantseva
1,*,
Tatyana Shatalova
1,
Sergey Tokarev
1,3,
Polina Yaltseva
1,
Olga Fedorova
1,3,
Nikolay Khmelevsky
4 and
Alexander Gaskov
1
1
Chemistry Department, Moscow State University, Moscow 119991, Russia
2
Faculty of Materials Science, Moscow State University, Moscow 119991, Russia
3
A.N. Nesmeyanov Institute of Organoelement Compounds RAS, Moscow 119991, Russia
4
LISM, Moscow State Technological University Stankin, Moscow 127055, Russia
*
Author to whom correspondence should be addressed.
Nanomaterials 2020, 10(1), 70; https://doi.org/10.3390/nano10010070
Submission received: 23 November 2019 / Revised: 16 December 2019 / Accepted: 24 December 2019 / Published: 28 December 2019
(This article belongs to the Special Issue Nanostructured Gas Sensors)

Abstract

:
Nitric oxide (NO) is one of the main environmental pollutants and one of the biomarkers noninvasive diagnosis of respiratory diseases. Organic-inorganic hybrids based on heterocyclic Ru (II) complex and nanocrystalline semiconductor oxides SnO2 and In2O3 were studied as sensitive materials for NO detection at room temperature under periodic blue light (λmax = 470 nm) illumination. The semiconductor matrixes were obtained by chemical precipitation with subsequent thermal annealing and characterized by XRD, Raman spectroscopy, and single-point BET methods. The heterocyclic Ru (II) complex was synthesized for the first time and characterized by 1H NMR, 13C NMR, MALDI-TOF mass spectrometry and elemental analysis. The HOMO and LUMO energies of the Ru (II) complex are calculated from cyclic voltammetry data. The thermal stability of hybrids was investigated by thermogravimetric analysis (TGA)-MS analysis. The optical properties of Ru (II) complex, nanocrystalline oxides and hybrids were studied by UV-Vis spectroscopy in transmission and diffuse reflectance modes. DRIFT spectroscopy was performed to investigate the interaction between NO and the surface of the synthesized materials. Sensor measurements demonstrate that hybrid materials are able to detect NO at room temperature in the concentration range of 0.25–4.0 ppm with the detection limit of 69–88 ppb.

1. Introduction

Nitric oxide (NO) and nitrogen dioxide (NO2) gases are among the main environmental pollutants produced from transports, industrial activities, and at high temperatures during the combustion processes [1]. Approximately 90% of nitrogen oxides are formed in the form of nitrogen monoxide, the remaining 10% is attributed to a strong oxidant and corrosive gas—nitrogen dioxide. However, a significant part of NO is oxidized in air in ambient conditions by oxygen, ozone, and VOCs to form NO2. The NOx gases in indoor and outdoor air may cause respiratory and lung diseases [2,3], allergy and eczema [4], acid rain [5], photochemical smog [6].
The great interest in the quantification of nitric oxide NO is due to the fact that this molecule is one of the key regulators of cellular metabolism in the human body. On the other hand, exhaled NO is a biomarker of inflammatory respiratory and lung diseases, including asthma and chronic obstructive pulmonary disease (COPD). Analysis of NO concentration in exhaled air is a promising approach in noninvasive diagnosis of respiratory diseases [7,8,9]. In this case, the limitation of the quantitative determination of NO in exhaled air is due to the low level of its concentration (20–200 ppb) among a wide range of interfering gases [10].
Direct determination of nitrogen monoxide in the gas phase is possible using conductometric gas sensors based on various semiconductor metal oxides [7,10,11,12,13,14,15,16,17,18,19,20,21,22]. To increase selectivity of such analysis along with lower power consumption, complete or partial replacement of thermal heating with photoactivation is a promising approach. Activation of the sensor response under illumination occurs through various mechanisms depending on the nature of the target gas. For oxidizing gases (NO2, O3), which compete with oxygen for the same adsorption sites, photogeneration of electron-hole pairs plays a major role in the photodesorption process. On the contrary, for the detection of reducing gases (CO, NH3, H2S), the presence of chemisorbed oxygen on the surface of the semiconductor oxide is necessary. In this case, the increase in the sensor response under illumination is due to the unpinning of Fermi level of the semiconductor. In most works NO is detected as oxidizing gas. The similar routes of NO and NO2 sensing was recently evidenced by in situ DRIFT spectroscopy [23]. Our previous works show that highly selective NO2 detection is possible using visible light photoactivation [24,25,26,27]. To shift the optical sensitivity of semiconductor oxides into the visible range, it is necessary to create defects in the semiconductor matrix or introduce photosensitizers. The use of quantum dots-semiconductor nanocrystals, the optical properties of which depend on their size, allows to vary the light energy corresponding to the maximum absorption of the sensitizer. A similar effect is achieved when creating hybrid materials in which the photosensitizer is an organic dye. However, in this case, there is an additional advantage: in addition to the generation of photoexcited charge carriers and their spatial separation, the appearance of a specific activity of the organic component in reactions with gas phase molecules is possible.
Ru (II) heterocyclic complexes are among the most effective photosensitizers due to its electrochemical and photophysical properties, high molar extinction coefficient in the visible range, long lifetime of the excited state, and high luminescence intensity [28,29,30,31,32,33]. Comparison of the sensor properties of nanocomposites based on nanocrystalline oxides ZnO, SnO2, In2O3, and CdSe quantum dots in room temperature NO2 detection under visible light photoactivation showed that semiconductor matrices SnO2 and In2O3 provide higher sensitivity of nanocomposites toward NO2 [25]. In present work, the hybrid materials based on nanocrystalline SnO2 and In2O3 and Ru (II) heterocyclic complex as the photosensitizer were studied as sensitive materials for sub-ppm NO detection at room temperature under periodic illumination with blue light (λmax = 470 nm) corresponding to the MLCT transition in photosensitizer.

2. Materials and Methods

2.1. Materials Synthesis

2.1.1. Synthesis of Ru (II) Complex

The heteroleptic Ru (II) complex bis(2,2′-bipyridin-k2N1,N1′)[4-{(E)-2-[5-(1H-imidazo[4,5-f] [1,10]phenanthrolin-2-yl)thiophen-2-yl]ethynyl}-1-methylpyridinium iodide] ruthenium (II) dichloride (RuITP) was prepared by several steps as shown in Schemes S1–S3 (Supplementary Materials). The synthesized ligand and its respective heteroleptic ruthenium complex were characterized by 1H NMR, 13C NMR, MALDI-TOF mass spectrometry, and elemental analysis (Supplementary Materials).

2.1.2. Synthesis of Nanocrystalline SnO2 and In2O3

Nanocrystalline SnO2 was synthesized by chemical precipitation method [25]. Tin (IV) chloride pentahydrate SnCl4·5H2O (15.00 g, 98%, Sigma-Aldrich, St. Louis, MO, USA) was dissolved in deionized water (150 mL). Aqueous ammonia (25%) was added dropwise to the resulting solution with vigorous stirring with a magnetic stirrer until pH = 7. The synthesis was carried out at room temperature. The gel-like precipitate was separated by centrifugation (3500 rpm, 3 min.), washed several times with deionized water and then with 0.01 M solution of NH4NO3 (99%, Sigma-Aldrich) until complete removal of chloride anions (AgNO3 test). The resulting precipitate of the α-stannic acid gel was dried at 100 °C for 24 h, then the vitreous product was ground in an agate mortar and annealed in air at 300 °C for 24 h.
To obtain nanocrystalline In2O3, aqueous ammonia solution (25%) was added dropwise to the stirred solution of In(NO3)3·4.5Н2O (5.00 g in 50 mL deionized water) until pH = 7 at room temperature. The resulting white gel of indium (III) hydroxide was separated by centrifugation and repeatedly washed several times with deionized water until the beginning of the peptization process. The obtained precipitate was dried at 100 °C for 24 h, then was ground in an agate mortar and annealed in air at 300 °C for 24 h.

2.1.3. Synthesis of Hybrid Materials

Hybrid materials were formed by adsorption of Ru (II) on the surface of semiconductor oxides. This method provides, on the one hand, direct contact between the photosensitizer and the semiconductor matrix, and on the other hand, allows to keep open the part of the surface of the semiconductor oxide for interaction with the gas phase.
Hybrid materials based on nanocrystalline SnO2 and In2O3 and RuITP heterocyclic complex were prepared by two different procedures:
(i)
in the form of powders to investigate optical properties and thermal stability. The RuITP organic dye was dissolved in methanol, and then 10 μL of the prepared solution was added dropwise to the weighed SnO2 or In2O3 powder. The obtained paste was dried at room temperature, the addition of each subsequent portion of the solution was carried out after complete evaporation of the solvent. The concentration of the solution was adjusted so that the Ru content in the hybrid material was 1 wt.%.
(ii)
in the form of thick films over specially designed micro-hotplates, provided with Pt contact electrodes and Pt contact heater to investigate gas sensor properties. Weighed nanocrystalline SnO2 or In2O3 powder was mixed with a vehicle (α-terpineol in ethanol). The paste obtained was deposited by microdroping technique (GeSim multi-dos 2 with NanoTipHV head) on the surface of microhotplate to cover the contact electrodes. Thick films were dried at 50 °C for 24 h and sintered at 300 °C for 24 h in air. The thickness of the films, estimated from the preliminary calibration carried out by scanning electron microscopy, was about 1 μm. The obtained films were functionalized by RuITP methanol solution and dried at 50 °C for 24 h in air.

2.2. Materials Characterization

The phase composition of the nanocrystalline SnO2 and In2O3 was confirmed by X-ray powder diffraction (XRD) using DRON-4 diffractometer (Burevestnik, Moscow, Russia) with Cu Kα1 radiation (λ = 1.54059 Å) and Raman spectroscopy using Renishaw InVia multichannel spectrometer (Renishaw plc., Wotton-under-Edge, UK) with an argon laser (λ = 514 nm) as the radiation source. The crystallite size (dXRD) of the SnO2 and In2O3 was calculated from the broadening of the most intense XRD peaks using Scherer equation. The specific surface area (Ssurf) and pore size distribution were determined by nitrogen adsorption with the ASAP 2020 instrument (Micromeritics Inc., Norcross, GA, USA). The surface area available for adsorption was calculated from the Brunauer–Emmett–Teller (BET) model. The pore size distribution was determined using Barrett–Joyner–Halenda (BJH) model.
The microstructure of the powders of semiconductor oxides was characterized by high resolution transmission electron microscopy (HRTEM). The study was performed at a Tecnai Osiris transmission electron microscope (FEI Company, Hillsboro, Oregon, USA) FEI Osiris microscope (FEI Company, Hillsboro, OR, USA) operated at 200 kV. The morphology and composition of thick films of hybrid materials were characterized by scanning electron microscopy (SEM) with energy dispersive X-ray spectroscopy (EDX) using Zeiss NVision 40 (Carl Zeiss NTS GmBH, Oberkochen, Germany) microscope.
X-ray photoelectron spectroscopy (XPS) analysis was carried out on the XPS system (Thermo Fisher Scientific, Waltham, MA, USA) equipped with a hemispherical analyzer and using monochromatic Al Kα radiation as X-ray source (1486.7 eV).
UV/Vis absorption spectra of the Ru-ITP heterocyclic complex solution and hybrid materials’ powders were recorded in the wavelength range of 200–800 nm on Varian Cary 50 (Varian Inc., Melbourne, Australia) and Lambda-950 (Perkin Elmer Inc., Waltham, MA, USA), respectively. For liquid samples 10-mm quartz cell was used. Absorption spectra of the powders were measured using diffuse reflectance method. WS-1-SL Spectralon material (Labsphere, North Sutton, NH, USA) was used as diffuse reflectance standard for calibration. Thermogravimetric analysis combined with mass spectral analysis of gaseous products (TG-MS) was used to study thermal stability of the hybrid materials by STA 409 PC Luxx thermal analyzer with a quadrupole mass spectrometer QMS 403 C Aëolos (Netzsch-Gerätebau GmbH, Selb, Germany). The powders of hybrids based on semiconductor oxides and RuITP complex were heated up to 500 °C with the heating rate of 10 °C/min in air.
Diffuse reflectance infrared Fourier transform spectroscopy (DRIFTS) was performed to investigate the interaction between NO and the surface of the synthesized materials. DRIFTS measurements were performed on Perkin-Elmer Spectrum One Fourier Transform Infrared spectrometer (Perkin Elmer Inc., Beaconsfield, UK) with the DiffusIR annex and flow chamber HC900 (Pike Technologies, Cottonwood Dr., Madison, WI, USA) in the range of 4000–400 cm−1 with a resolution of 4 cm−1 and accumulation of 30 scans. The window of chamber was made of KBr disc (32 mm diameter, 3 mm thickness). Samples (30 mg) were placed in ceramic crucibles (5.0 mm diameter, 2.0 mm depth), set into the heat chamber attached with water coolant line, preheated to 50 °C for 1 h and then cooled down to the room temperature. The DRIFT spectra were recorded at room temperature under a controlled gas flow rate of 100 mL/min. The gas mixture containing 50 ppm of NO was prepared by dilution of certified gas mixture 100 ± 5 ppm of NO in N2 (Monitoring, St. Petersburg, Russia) with background purified air from a pure air generator (Granat-Engineering Co. Ltd., Moscow, Russia).
Electrochemical characterization of heterocyclic Ru (II) complex was effectuated at 22 °C using IPC-Pro M potentiostat (Volta, St. Petersburg, Russia) (Supplementary Materials). Cyclic voltammetry measurements (CVA) were carried out in a 1.0 mL cell equipped with a glassy carbon (GC) electrode (2.0 mm disk), Ag/AgCl/KCl (aq. saturated; reference electrode), and platinum electrode (counter electrode). The complex was dissolved in degassed dry CH3CN containing 0.1 M tetra-(butyl) ammonium perchlorate (Bu4NClO4) as the supporting electrolyte. Before cyclic voltammetry experiments dry argon gas was bubbled through the solutions for 30 min. The scan rate was 200 mVs−1. The calibration was performed using 10−3 M solution of ferrocene with 0.1 M TBAP in the same solvent.
The energies of HOMO and LUMO of RuITP complex were calculated using the methodology described in [34] by the following equations:
ЕHOMO = −4.73 − Еonset(Ox)
ЕLUMO = −4.73 − Еonset(Red)
Gas sensor measurements have been carried out at room temperature under constant flux of 100 mL/min controlled by electronic mass-flow controllers EL-FLOW F-221M (Bronkhorst, Netherlands). DC measurements using electronic module (MGA-2-1, Senseria, Russia) have been carried out in situ to monitor the electrical conductivity of the samples during exposure to NO/air (0.25–4.0 ppm NO in dry air) gas mixtures under periodic blue (λmax = 470 nm) light illumination. Miniature LED of 20 mW/cm2 power (Star, Betlux Electronics Co., Ltd., Zhenhai, Ningbo, China) was used as an illumination source. An automatic cyclic relay (REV-114, Novatech-Electro, St. Petersburg, Russia) was used to open and close the circuit with period of 2 min, allowing illumination to be made in a pulsed mode. A detailed description of the specially designed micro-hotplates and sensor measurements setup is given in our previous work [27].

3. Results and Discussion

3.1. Characteristics of Nanocrystalline Semiconductor Oxides

According to the XRD data (Figure S5, Supplementary Materials), the investigated nanocrystalline metal oxides powders are single phase. The XRD patterns of the SnO2 corresponds to the tetragonal cassiterite structure (ICDD 41-1445), and In2O3 exhibits a cubic bixbyite structure (ICDD 6-416).
The N2 adsorption-desorption curves for nanocrystalline In2O3 and SnO2 (Figure S6, Supplementary Materials) can be attributed to type IV. In both cases the hysteresis is observed, that indicates the irreversible capillary condensation. According to the IUPAC classification, in the case of SnO2, the hysteresis is of the H1 type, which is characteristic for porous, spatially ordered structure that has minimal connectivity between adjacent pores. The hysteresis of the N2 adsorption-desorption curve of the nanocrystalline In2O3 is of the H2a type indicating that the pore cavity size distribution is wide compared with the neck size distribution [35]. For In2O3, the average pore size determined by the BJH model is 3–4 nm. In the case of SnO2 on the pore size distribution (Figure S7, Supplementary Materials) two maxima can be distinguished, corresponding to 3–5 nm and 70–80 nm. Comparison of particle size and pore diameter suggests that in the case of In2O3, the main contribution to the total volume is made by pores formed by crystallites, while for SnO2, the maximum volume is accounted for large pores formed by agglomerates.
HRTEM images and particle size distribution for the nanocrystalline oxides SnO2 and In2O3 are shown in Figure 1a,b. The obtained average particle sizes are in good agreement with the average size of the crystallites estimated by the Scherrer formula (Table 1). Figure 1c,d presents the micrographs of SnO2 and In2O3 thick films formed on the dielectric substrate of the measuring chip. Thick films are porous and consist of agglomerated and sintered grains. The size of agglomerates is about 100 nm. The microstructure characteristics of synthesized semiconductor oxides are presented in Table 1.
Figure 2a,b shows representative Raman spectra of the nanocrystalline SnO2 and In2O3 in the frequency range of 110–850 cm−1. Three characteristic vibrational modes of the tetragonal rutile structure of SnO2 are observed at 480.5 (Eg), 631 (A1g), and 772.8 cm−1 (B2g) frequencies. The A1g and B2g modes are attributed to symmetric and asymmetric Sn–O stretching, respectively. The translational Eg mode is due to the oxygen anions motion along the c-axis [36,37]. The band at 137 cm−1 is associated with B1g mode and appears only in the spectra of nanocrystalline SnO2 in the range of 100–184 cm−1 [38,39]. The second wide band at 563 cm−1 is associated with in-plane oxygen vacancies of the nanocrystalline SnO2 [40,41,42]. The bands at 309 and 352 cm−1 and the band at 444 cm−1 are assigned to the Eu and B1u modes, respectively, associated with transformation of an IR to Raman active modes [43].
Characteristic Raman vibrational modes corresponding to the body-centered cubic In2O3 are observed at 132, 307.7, 366.7, 494.6, and 628.5 cm−1 and their positions are in agreement with previously reported data [44,45,46]. The peak at 132 cm−1 is attributed to the In-O vibration of [InO6] structural units, the peak at 307.7 cm−1 is due to the bending vibration of the δ-[InO6] octahedrons, the peaks at 494.6 and 628.5 cm−1 are assigned to the stretching vibrations of the ν-[InO6] octahedrons, and the peak at 366.7 cm−1 is attributed to the stretching vibrations of the In-O-In bonds [47,48,49]. The broad peak at 458 cm−1 probably has the same nature as SnO2 wide band at 563 cm−1 corresponding to a local structural defects due to small particle size of nanocrystalline In2O3 [50].

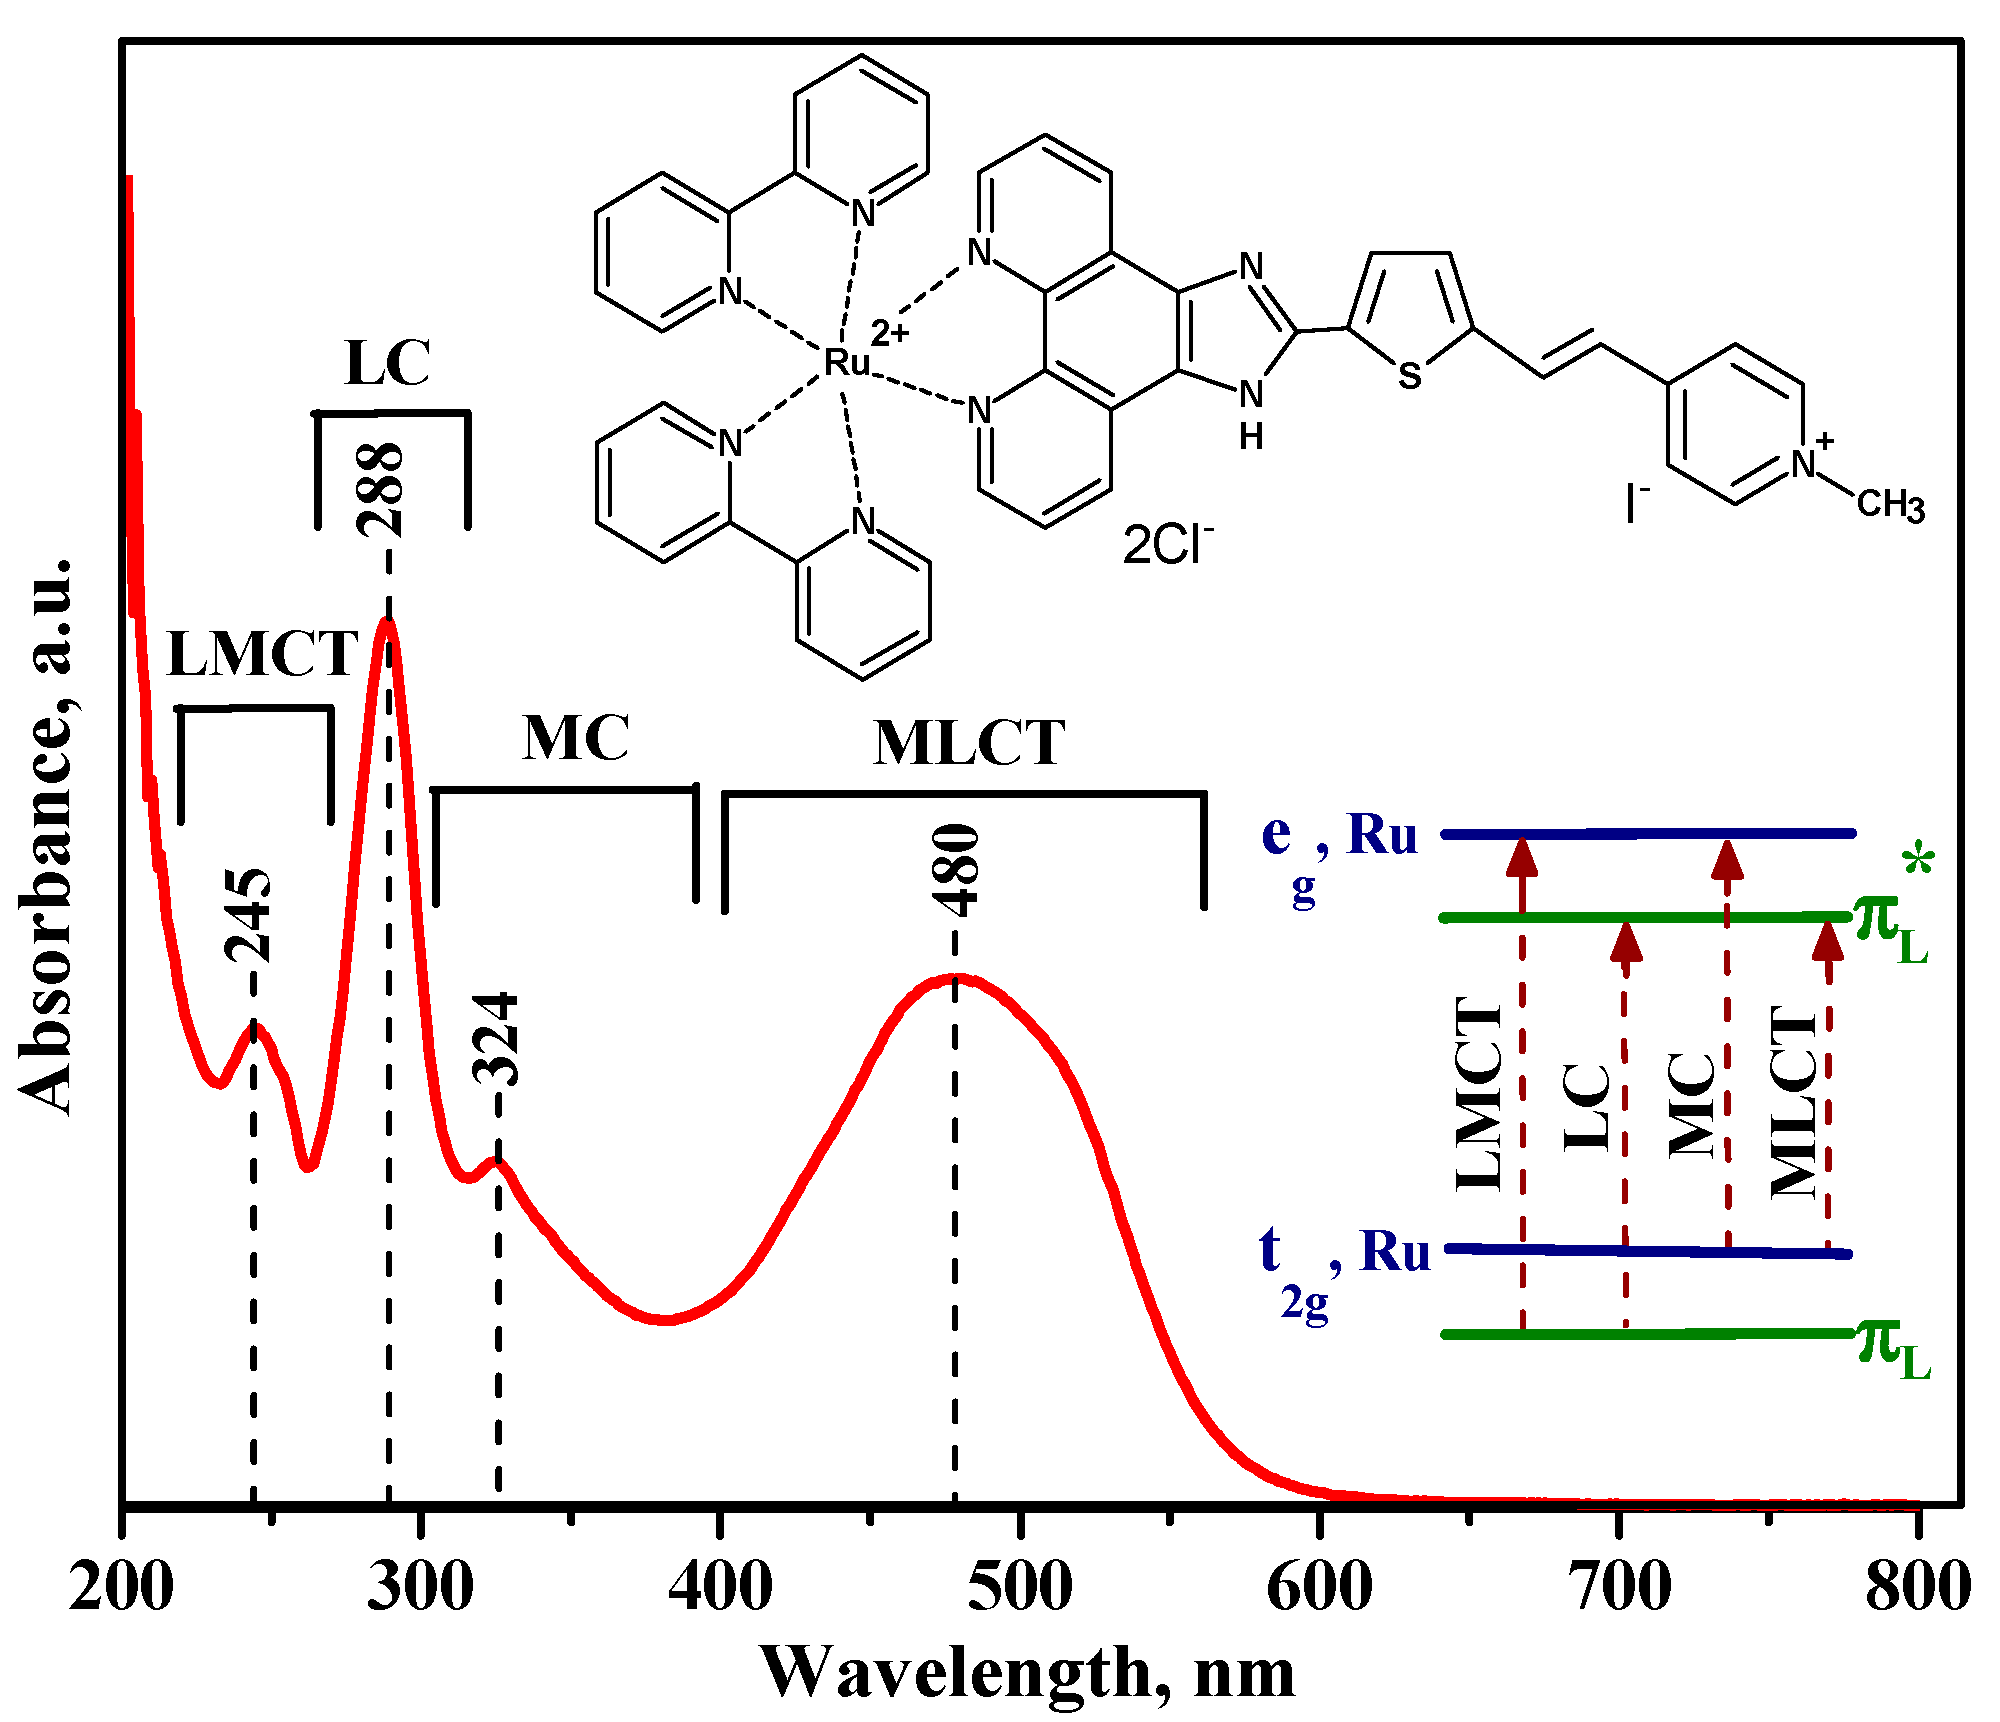
3.2. Characteristics of Ru (II) Heterocyclic Complex

As a result of overlapping ruthenium d-orbitals with π*—anti-bonding ligand orbitals, the highest occupied molecular orbitals (HOMO) and the lowest unoccupied molecular orbitals (LUMO) are formed, as shown in Figure 3. As a result of the large energy difference between the occupied Ru d-orbitals and the unoccupied ligand orbitals, the HOMO is mainly localized at the metal and the LUMO belongs to the ligand anti-bonding orbitals. Therefore, the excitation and transition of an electron from the HOMO to the LUMO is called metal-to-ligand charge transfer (MLCT) and leads to the appearance of a photoabsorption band in the wavelength range between 380 and 520 nm [33,51]. MLCT transition corresponds to the visible spectral range; therefore, it is the most important characteristic of the complex molecule that can be used as a photosensitizer.
The optical absorption spectrum of Ru (II) heterocyclic complex is presented in Figure 4. The electronic transitions in this compound are observed both in the visible and in the near UV region. In addition to the MLCT transition, other important electronic transitions are summarized in the inset of Figure 4. The wide absorption band at 480 nm can be the result of overlapping of π → π* charge transfer in 1H-imidazo-phenantroline ligand and two MLCT processes: (t2g, Ru → π* substituted 1H-imidazo-phenantroline (ImPh) ligand) and (t2g, Ru → π* bpy ligand) transitions. In the UV range, high-energy transitions dominate in the process of intraligand π → π* charge transfer in bipyridine ligands (LC-ligand-centered) and ligand-to-metal charge transfer (LMCT) (πL → eg, Ru). The weak absorption band at 324 nm can be attributed to the transition between the metal orbitals (MC-metal-centered) (t2g, Ru → eg, Ru) [33,52,53].

3.3. Characteristics of Hybrid Samples

The distribution of the Ru complex over the surface of SnO2 and In2O3 films was studied by EDX mapping (Figure 1e,f). For both hybrid materials, extended regions with uniform distribution of the photosensitizer over the surface of the semiconductor oxide were found.
The optical properties of unmodified and sensitized nanocrystalline SnO2 and In2O3 were studied by UV-VIS spectroscopy (Figure 5). The results show that pure nanocrystalline SnO2 and In2O3 have an excellent optical transparency in the visible region. The strong absorption in the UV region between 260–360 nm wavelengths is attributed to the fundamental band gap electron transitions. In the spectra of hybrid samples the broad absorption band ranging from 370 nm to 600 nm is associated with RuITP complex. Compared with the spectrum of RuITP complex, a shift of ~20 nm to the short-wavelength region (blue shift) is observed, which may be due to the decrease in electron density on the Ru centers for hybrid materials. In addition, for In2O3 + RuITP sample a broad shoulder appears in the green region.
In the Raman spectra of hybrid materials (Figure 2), serial bands in the high-frequency region due to the Ru (II) heterocyclic complex were observed. The low-frequency region also consists of the contribution from SnO2 and In2O3 nanoparticles. The band at 1047.7 cm−1 in pure SnO2 and In2O3 probably attributed to longitudinal optical (LO) phonon vibrations. The wavelength of the laser used as the radiation source (514 nm) coincides with the wide shoulder of the In2O3+RuITP sample (Figure 5). This can lead to the resonance of the molecules in the excited state. Therefore, the bands associated with Ru (II) heterocyclic complex for In2O3+RuITP are more intense than for SnO2+RuITP.
The bands near 1600 cm−1 are assigned to valence vibrations of the C=C bonds of the bpy ligand rings mixed with the C-C links. The region between 1563–1540 cm−1 belongs to the vibration of the C=C and C=N bonds of the bpy cycles. The bands at about 1480 cm−1 are due to the C-C links vibrations that play a significant role in the electron transfer during light absorption [54,55]. The bands at 1310–1423 cm−1 associated with C-C inter-rings stretching vibration mixed with the deformation of the СН bonds [56]. There are a number of mixed vibrations in the middle region of the spectra. The C=C and C=N stretching frequencies are sensitive to the charge density on the bpy ligand [57]. Therefore, the spectral shifts in the low-frequency region can be associated with the interaction of the semiconductors with ruthenium (II) complex and the change in charge density.
Table 2 summarizes the observed frequencies of the Raman spectra for the nanocrystalline SnO2, In2O3, and hybrid materials according to [55,56,57].
Thermogravimetric analysis (TGA) and mass spectrometry (MS) measurements data for In2O3+RuITP sample are shown in Figure 6. According to TGA, the thermal decomposition process of the sample proceeds in two steps (Figure 6a, green curve). The first decomposition step (Step I) is observed at the range of 35–150 °C, with a weight loss of 0.5%. The second step (Step II) with a weight loss of 2.8% occurs at 290–440 °C. Comparing with mass-spectra signals (Figure 6b) of the CO2 (m/z = 12, m/z = 44), H2O (m/z = 17, m/z = 18), NO (m/z = 30), NO2 (m/z = 46) one can conclude that “Step I” corresponds to the release of physically adsorbed water. “Step II” corresponds to the full exothermic decomposition of the Ru-ITP complex (Figure 6a, blue curve) over 200 °C which led to removal of CO2, H2O, NO, and NO2 from the hybrid material. TGA and MS data for the SnO2+RuITP sample have the same character.

3.4. Gas Sensor Properties

Based on previous studies, the following basic points describing the sensor properties of semiconductor oxides to NO and NO2 can be formulated:
(i)
The interaction of n-type semiconductor oxides with NO2 is accompanied by a decrease in electrical conductivity, since nitrogen dioxide is an electron acceptor. It was shown by Raman spectroscopy [58] that the conductivity of n-type metal oxides in the presence of NO2 correlates with the concentration of surface bidentate nitrite groups. Surface groups observed on DRIFT spectra [23] suggest that NO2 adsorption on n-type semiconductor oxides occurs in the following possible ways:
NO2(gas) = NO2(ads),
NO2(gas) + e = NO2(ads),
2 NO2(gas) + ½ O2(gas) + 2 e = NO2(ads) + NO3(ads),
NO2(ads) + ½ O2(gas) = NO3(ads).
(ii)
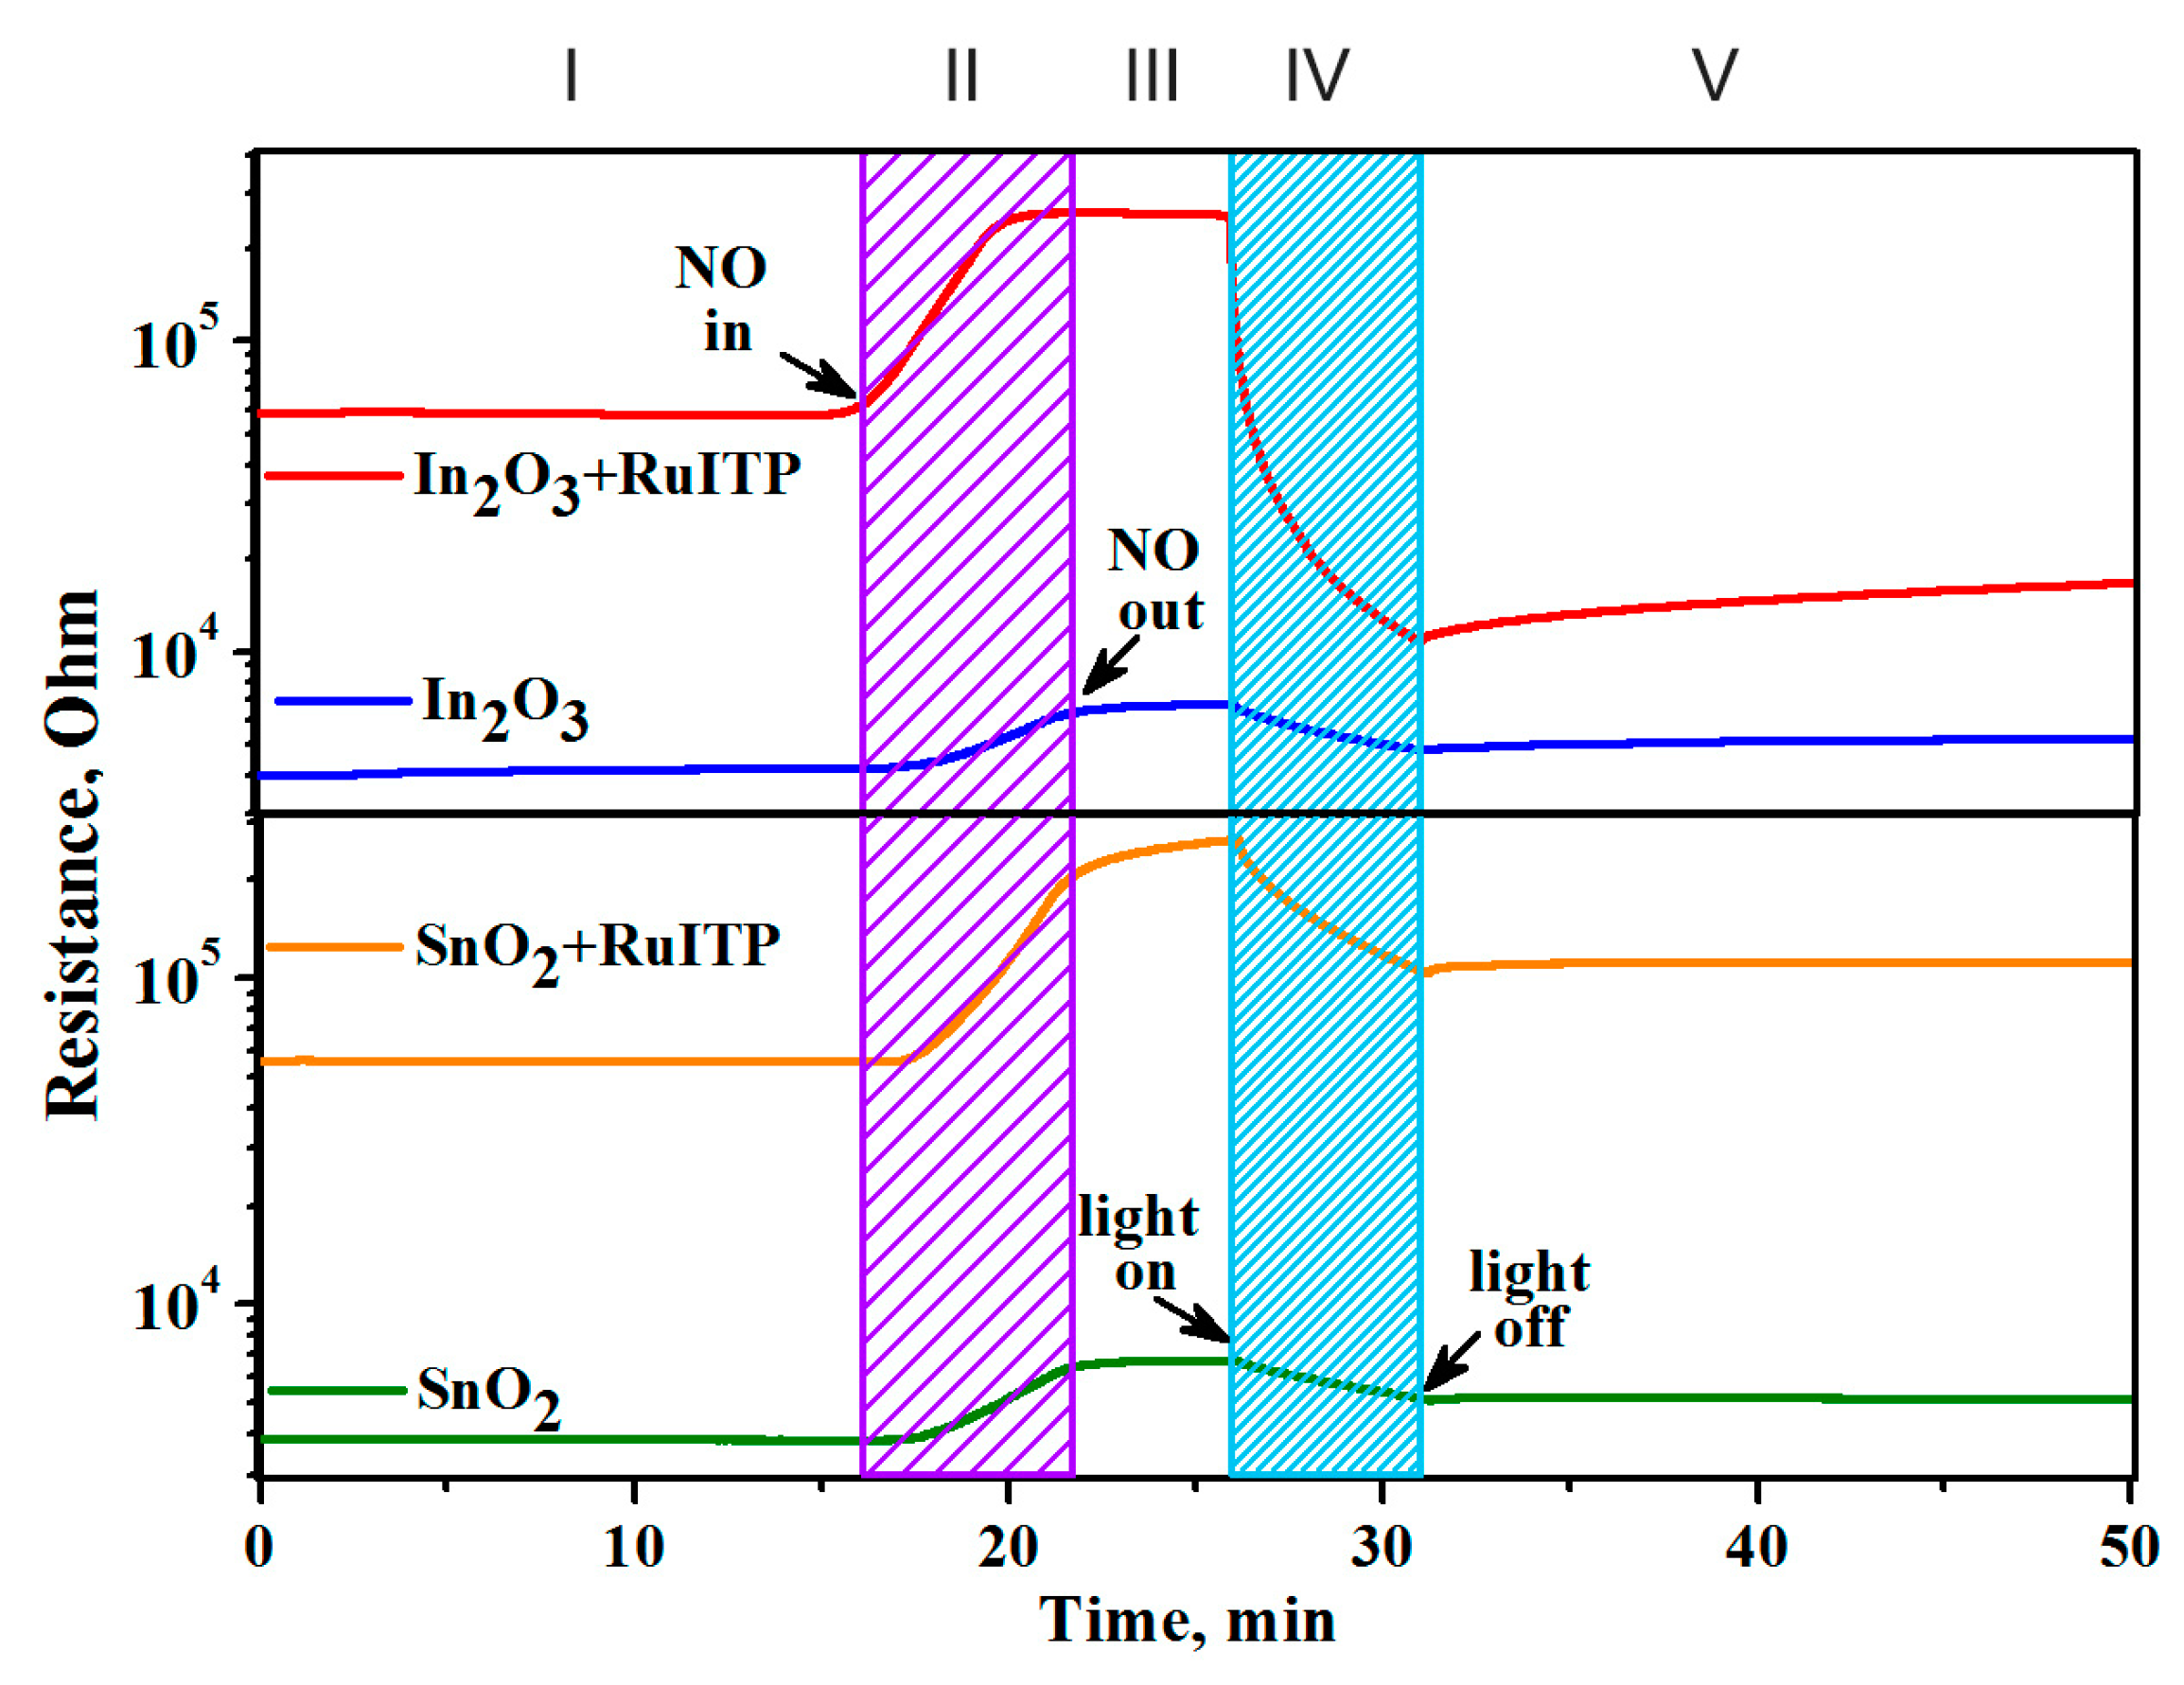
At room temperature under dark conditions, the adsorption of NO2 on the surface of n-type semiconductor oxides is an irreversible process: when NO2 is removed from the atmosphere, there is no return of the conductivity (resistance) to its initial value in pure air [24,59]. The role of illumination probably consists in the photogeneration of holes that ensure the conversion of chemisorbed NO2 particles into physically adsorbed NO2, which can be desorbed from the surface of the semiconductor oxide even at room temperature.
(iii)
Usually, NO is also detected by various n-type semiconductor metal oxides as an oxidizing gas. Based on the results obtained by DRIFT method, the authors [23] suggested that NO sensing by semiconductor oxides is determined by the following reaction:
NO(gas) + ½ O2(gas) + e = NO2(ads).
Figure 7 reveals the effect of blue light (λmax = 470 nm) on the interaction of semiconductor oxides SnO2 and In2O3 and hybrid materials with NO at room temperature. In dark conditions in pure air the resistance of samples is constant. When the target gas (4 ppm NO) is introduced into the atmosphere (Figure 7, II), the resistance of all samples increases due to reaction (7). The reached resistance values remain nearly constant when NO is removed from the measurement cell (Figure 7, III). So, at room temperature in dark conditions, adsorption of NO on the surface of semiconductor oxides proceeds irreversibly similarly to NO2 [24].
Blue light illumination (Figure 7, IV) results in the decrease in the resistance for all samples. This indicates elimination of NO2 from the surface of semiconductors:
NO2(ads) + h+ = NO2(gas).
This effect is more pronounced for hybrid SnO2+RuITP and In2O3+RuITP samples as compared with corresponding pure oxides SnO2 and In2O3. For In2O3+RuITP sample the achieved resistance value is even lower than that in dark conditions. For this sample, turning light off (Figure 7, V) leads to the very slow resistance increase tending to the dark value. This additional change in the resistance probably is due to chemosorption of oxygen in dark conditions (Equation (9)) and its photodesorption under illumination (Equation (10))
O2(gas) + e = O2(ads),
O2(ads) + h+ = O2(gas).
Note that for pure oxides SnO2 and In2O3 there is a decrease in resistance under blue light. The photosensitivity of these materials to light with an energy (E = 2.63 eV) lower than the band gap (Eg(SnO2) = 3.6 eV, Eg(In2O3) = 3.5 eV) is obviously due to the presence of a large number of defects in nanocrystalline materials. This effect was considered in detail in our previous work [27]. Thus, when nitrogen monoxide NO is detected at room temperature, the use of illumination ensures that the electrophysical characteristics of hybrid materials are restored when the target gas is removed from the atmosphere.
The sensor properties of the obtained nanocrystalline SnO2 and In2O3 and hybrid materials were studied in the concentration range of 0.25–4.0 ppm NO in dry air. The measurements were effectuated first with an increase and then a decrease in the concentration of the target gas. Gas sensor measurements were carried out under periodic illumination with periods of 2 min switching on and 2 min switching off the LED. Such periodic illumination results in the equivalent change in the sensors resistance, which becomes an alternation of the rise and fall curves of photoconductivity [27]. In the stationary state these curves are characterized by the minimum Rlight and maximum Rdark resistances achieved when the sensor is illuminated and in dark conditions, respectively. This effective photoresponse Sph = Rdark/Rlight depends on the target gas concentration and can be used as the sensor signal (Figure 8). The resistive response can be calculated [24] as the ratio S = Rdark gas/Rdark air of dark resistances (measured at the end of 2 min “light off” period, Figure 8) at a given NO concentration Rdark gas and in pure air Rdark air. This method of sensor signal calculation corresponds to maximum NO adsorption in dark conditions.
Figure 9 presents the change of room temperature electrical resistances of nanocrystalline oxides SnO2 and In2O3 and hybrid samples SnO2+RuITP and In2O3+RuITP under periodic blue LED illumination during stepwise change of NO concentration. All samples exhibit similar behavior. Under illumination the resistance of the sensors decreases due to the discharge of chemisorbed anions by photogenerated holes following by desorption of adsorbed species. When the diode is switched off, the resistance of the sensors increases due to the chemisorption of oxygen and target gas accompanied by the capture of electrons from the conduction band of the semiconductor [25,26].
The analysis of the data obtained is presented in Figure 10 and discussed below.

3.5. Influence of RuITP Complex on SnO2 and In2O3 Dark Resistance in Pure Air

First of all, it should be noted that modification of SnO2 and In2O3 by the RuITP complex leads to a significant (approximately 10-fold) increase in resistance under dark conditions in pure air (Figure 10a,b). To explain this effect, the surface of semiconductor oxides and hybrid materials was additionally investigated by XPS. The oxygen XP-spectra O 1s are shown in Figure 11. In all cases, the O 1s spectra can be deconvoluted into two components. The O(1) component (~530.5 eV) corresponds to the oxygen anions in the crystal structure of SnO2 and In2O3. The O(2) component (531.5–532.0 eV) is caused by the presence of various oxygen-containing species on the surface of materials. Modification of SnO2 and In2O3 with RuITP leads to an increase in the contribution of the higher-energy component O(2) from 19% to 37% in SnO2 based hybrids and from 31% to 47% in In2O3 based hybrids, indicating an increase in the concentration of chemisorbed oxygen on the surface of hybrid materials. Thus, the chemisorption of oxygen with electron capture of the conduction band of the semiconductor oxide (Equation (9)) leads to an increase in the resistance of hybrid samples compared to unmodified oxides SnO2 and In2O3.

3.6. Resistive Response in Dark Conditions

For all samples, the dependence of the resistive response on the NO concentration is linearized in double log coordinates (Figure 10c,d) that indicates their power-law nature, typical for the resistive type sensors S p N O 2 m . Using the average values (Rdark av) and the standard deviation (σ) of the dark resistance in air from Figure 9 the detection limit of NO (LDLNO) has been determined from obtained calibration curves for each sensor. The value (Rdark av + 3σ)/Rdark av was taken as the minimum measurable resistive response. The LDLNO values for SnO2, SnO2+RuITP, In2O3, and In2O3+RuITP samples were 140 ppb, 69 ppb, 91 ppb, and 88 ppb, respectively. Thus, modification of semiconductor oxides by the RuITP complex differently affects the sensitivity of SnO2 and In2O3 to NO under dark conditions.
To reveal the influence of RuITP complex on the interaction of semiconductor oxides SnO2 and In2O3 with NO, in situ studies were performed by DRIFTS method. Figure 12a depicts the time evolution of in situ DRIFT spectra at room temperature for In2O3+RuITP sample during NO (50 ppm) exposure. Firstly, during the adsorption process, the adsorbed species accumulate on free sites; almost all bands increased until saturation and then became stable. Some additional peaks were observed in the spectra of the In2O3+RuITP sample because of the more charge carriers (electrons) in the conduction band compared to other samples which leads to greater interaction with the typical Lewis acids. The peaks at 1145–1175 cm−1 and 1220–1240 cm−1 increased as well, indicating there is an accumulation of nitrite species and could be ascribed to corresponding vibrational modes of chelating and bridging bidentate NO2 species [60].
The ν (N=O) vibrations of monodentate NO2 species coordinated by its oxygen atoms can be assumed at the range of 1450–1475 cm−1 while coordinated via its N atom nitro compound NO2 was detected at the frequency of 1420 cm−1. The monodentate NO3 species result in absorption bands at the ranges of 1036–1050 cm−1, 1240–1285 cm−1, and 1540 cm−1. Absorption bands related to the chelating bidentate NO3 anions are located in the region between 1575 and 1592 cm−1 [61]. At low temperatures, in particular at room temperature, the NO molecules tend to form dimers during adsorption [62]. Also in the presence of oxygen the molecule of nitrogen dioxide can be easily formed from nitrogen monoxide. However, in NO adsorption spectra (Figure 12b) there was not found any bands attributed to NO dimers and to nitrosyl anion (NO) since it is difficult for NO molecule to accept an electron because of the existence of one unpaired electron on antibonding 2π orbital.
Since the preheating procedure was performed at 50 °C, the surface-adsorbed water was not fully desorbed and affected the interaction with NO. The band at 3226 cm−1 is due to hydrogen-bonded OH groups. The negative bands developed during the gas exposure time at 1630 cm−1 and in the range of 3580–3700 cm−1. The band at 1630 cm−1 is due to bending H2O vibration modes and the sharp bands between 3580 and 3700 cm−1 can be attributed to non-hydrogen-bonded hydroxyl groups and indicated as ‘‘free’’ OH groups on the surface [63,64,65,66,67,68,69,70]. These negative band changes are due to the interaction and/or replacement of hydroxyls with adsorbed NOx species. As mentioned in literature, the formation of NOx anions is often accompanied by releasing of water because the NOx species replace surface OH groups [64,65,66]. Also, NOx species are produced on wet surfaces and previously adsorbed water leads to a shift the frequency of N-O stretching modes toward lower wavenumbers [67,68]. A summary of the absorption bands upon NO exposure is presented in Table 3.
Comparison of DRIFT spectra for unmodified semiconductor oxides and hybrids reveals the role of RuITP complex in the interaction of sensitive materials with NO. Compared to SnO2 spectrum, DRIFT spectrum of SnO2+RuITP is characterized by increased intensity of oscillation bands with frequencies of 1540 cm−1 and 1592 cm−1 corresponding to monodentate NO3(ads) and chelating bidentate NO3(ads) respectively. The growth of NO3(ads) concentration is determined by Equations (5) and (6). Equation (5) involves the interaction of the sensitive material with NO2(gas). Therefore, an increase in the concentration of NO3(ads) may indicate an increase in the NO2 concentration in the NO + air gas mixture due to reaction
2NO(gas) + O2(gas) = NO2(gas).
It is known that ruthenium compounds are active catalysts for the oxidation of nitrogen compounds [71,72,73,74]. This catalytic effect was also noted in the detection of nitrogen containing gases by SnO2 based gas sensitive materials [75,76]. At the same time, the sensitivity of n-type semiconductor oxides to NO2 significantly exceeds their sensitivity to NO [23]. Thus, an increase in the resistive response of SnO2+RuITP (compared to unmodified SnO2) towards NO may be due to the catalytic action of RuITP in the oxidation of NO to NO2 in the gas phase.
Contrary, In2O3+RuITP and In2O3 demonstrate very close values of the resistive response toward NO. Comparing the DRIFT spectra of these samples, in the case of In2O3+RuITP, we can note an increase in the intensity of oscillations with a frequency of 1220 cm−1, corresponding to bridging bidentate NO2 and the appearance of oscillations with a frequency of 1420 cm−1, due to the formation of nitro groups NO2. This indicates a change in the coordination of some of the chemisorbed NO2(ads) species. In this case, there is no change in the intensity of oscillations corresponding to NO3(ads). Thus, in In2O3 based hybrid material the catalytic action of RuITP in the oxidation of NO to NO2 in the gas phase is not shown.

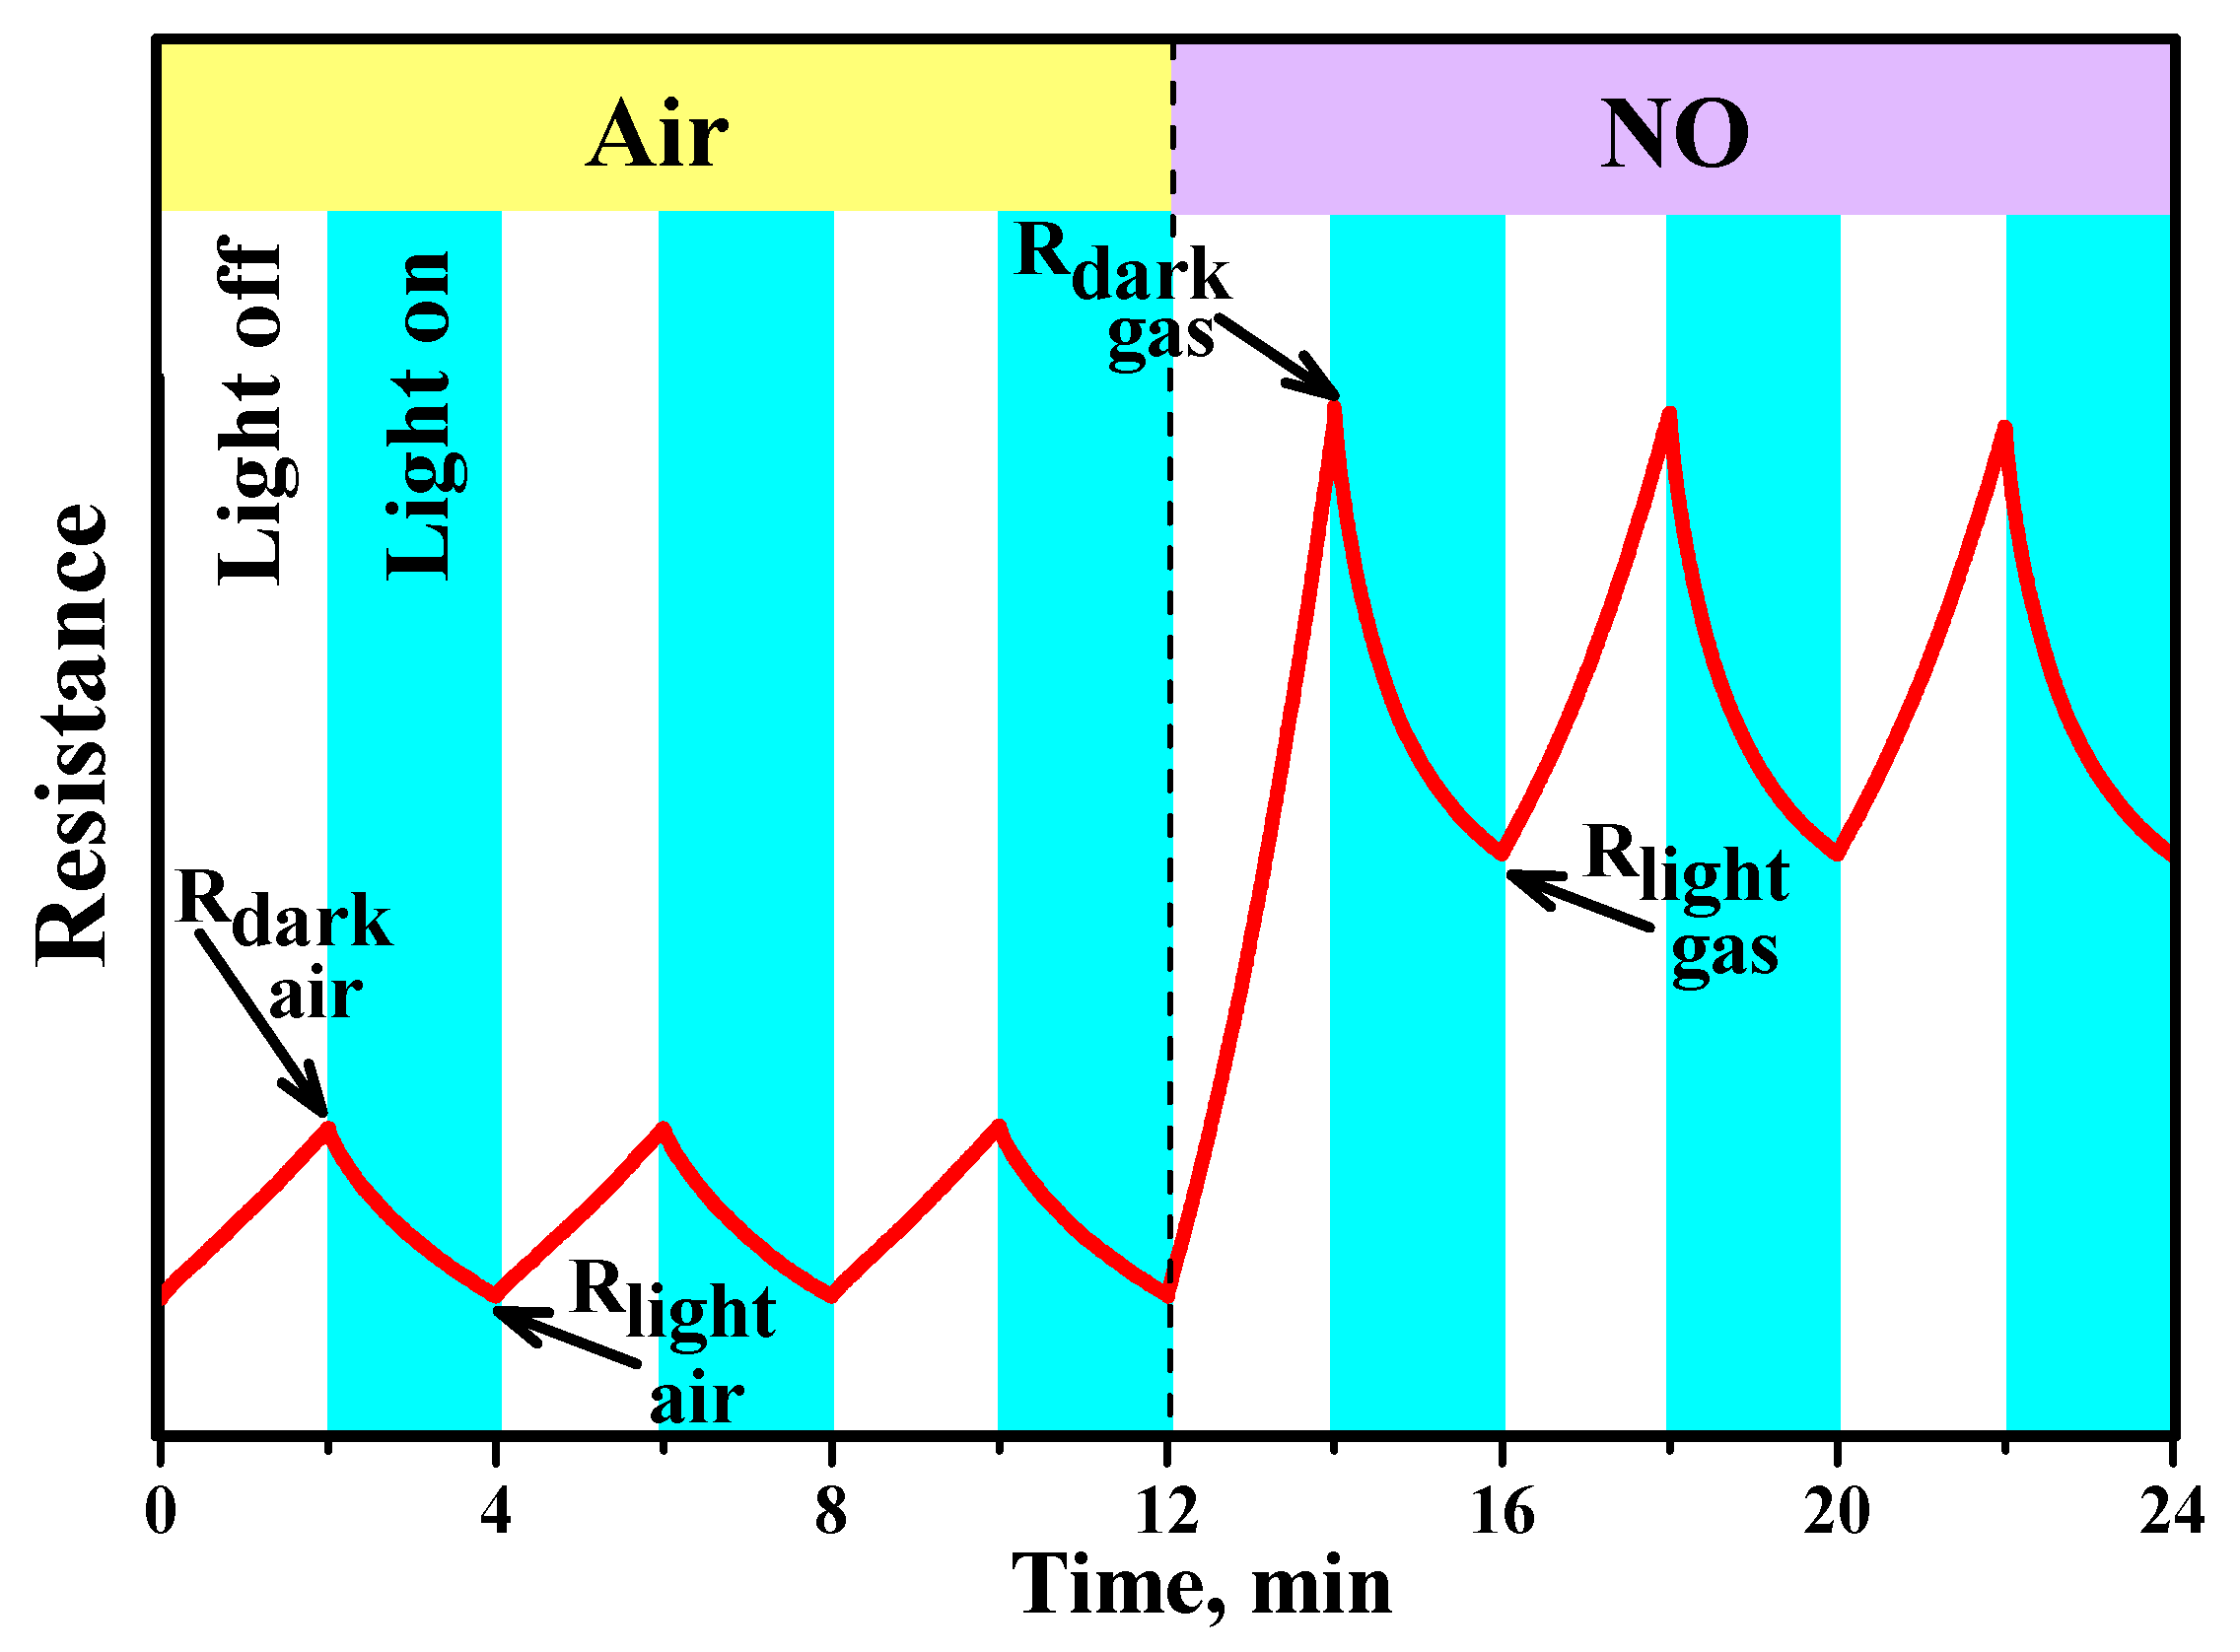
3.7. Effective Photoresponse

Unmodified SnO2 does not exhibit photosensitivity under blue light illumination and shows very low change in photoresponse with the increase in NO concentration (Figure 10e). At the same time unmodified In2O3 exhibits high photoresponse, which strongly depends on NO concentration (Figure 10f). The photosensitivity of In2O3 may be due to the excitation of electrons from acceptor levels lying in the forbidden band of metal oxide. Under visible light illumination electrons are excited from such levels into the conduction band of the semiconductor, the thermal equilibrium in the system is violated, as a result of which, the electrons must be excited from the valence band into acceptor levels in order to recover this equilibrium. The result of this process will be the formation of holes in the valence band of the semiconductor, which can cause photodesorption of gas molecules from the surface.
Surface modification of SnO2 and In2O3 with RuITP complex leads to the growth of photosensitivity accompanied by the reproducible change in photoresponse depending on NO concentration (Figure 10e,f). The ratios of effective photoresponse Sph in the presence of 4 ppm NO for hybrid materials and corresponding unmodified oxides are Sph(SnO2+RuITP)/Sph(SnO2) = 2.2 and Sph(In2O3+RuITP)/Sph(In2O3) = 5.5. The greater amplification of the photoresponse in the case of In2O3 sensibilization is due to the mutual arrangement of the energy levels for bulk SnO2, In2O3, HOMO, and LUMO of the RuITP complex (Figure 13.) The positions of the respective valence band (EV) and conduction band (EC) were taken from the literature [25,77,78,79]. In this case, photoexcited charge carriers, which are generated upon irradiation of hybrids with the light corresponding to the absorption band of Ru (II) heterocyclic complex, play a key role in ensuring the reversible interaction of the hybrids with the gas phase. During photoexcitation of Ru (II) heterocyclic complex, electron-hole pairs are generated in them and electrons are transferred from the LUMO level of the RuITP complex to the conduction band of the oxide matrix, which is lower in energy. As a result, the conductivity will increase. The bottom of the In2O3 conduction band lies about 0.5 eV below the bottom of the SnO2 conduction band. This leads to an increase in the energy difference between EС In2O3 and LUMO of the RuITP complex from which the electron is injected (∆E = LUMO—EС is 1.1 eV for SnO2 and 1.6 eV for In2O3). According to Marcus theory of electron transfer [80], the larger ∆E value will correspond to the larger rate constant of the electron transfer into the semiconductor matrix. This explains the more efficient sensitization of In2O3 matrix compared to SnO2.
At the same time, photoexcited holes remain in the HOMO level of the organic complex, which undergo recombination with electrons localized in chemisorbed species of oxidizing gases. These species lose their charge and become weakly bonded. As a result, photodesorption of oxidizing gases under visible light becomes possible (Equation (8) and (10)).
Figure 14 shows a comparison of the effective photoresponse (a) and resistive response (b) of hybrid materials when detecting different gases at room temperature under periodic blue light illumination. As follows from the DRIFT spectra discussed above and the literature data [23], the interaction of NO and NO2 with the surface of semiconductor oxides occurs in a similar way, through the mechanism of adsorption with the localization of electrons of the semiconductor conduction band. However, the lower sensitivity of hybrid materials to NO, compared to NO2, should be due to different initial steps in the detection routes. In reaction with NO2, it is a simple one-electron reduction (Equation (4)) favored by the strong oxidative activity of nitrogen dioxide. The interaction with NO (Equation (7)) is essentially an oxidation of the target gas mediated by oxygen on the surface of the semiconductor oxide. This should be the main reason for the different sensitivities to NO2 and NO, although the surface species produced in both interaction pathways are similar [23].
The hybrid materials show very low sensitivity to CO and NH3 (Figure 14). As it was mentioned in the Introduction, for the detection of these reducing gases, the presence of chemisorbed oxygen on the surface of the semiconductor oxide is necessary. At the same time, the use of illumination leads to photodesorption of oxygen (Equation (9)) and, consequently, a decrease in the sensitivity of materials to CO and NH3.
An interesting fact is the noticeable sensor signal of hybrid materials to SO2. This may be due to the fact that on the surface of semiconductor oxides, SO2 and NO2 adsorb in a similar way, and the surface sulfate groups formed during SO2 adsorption can be desorbed only at high temperatures [81,82]. The higher basicity of In2O3 compared to SnO2 provides a higher sensor response of the In2O3+RuITP hybrid material to the acid gas SO2.
Thus, at room temperature under periodic blue light illumination, hybrid materials SnO2+RuITP and In2O3+RuITP will be able to detect NO (in sub-ppm concentration range) in the presence of high concentration (tens of ppm) of a wide range of reducing gases, the detection of which is due to their oxidation by chemisorbed oxygen on the surface of semiconductor oxides. At the same time, in the presence of such strong electronic acceptors as NO2 and O3 [23,27,83], selective detection of NO will be impossible. However, neither NO2 nor ozone are found in the exhaled air [84]. Thus, hybrid materials SnO2+RuITP and In2O3+RuITP are extremely promising for the analysis of NO concentration in exhaled air for noninvasive diagnosis of respiratory diseases.
The stability of the sensors was tested under the conditions of periodic measurements for 2 months (Figure S8, Supplementary Materials). Before each test, the sensors were kept in dry air for 2 h under periodic illumination. The values of the photoresponse and resistive response of hybrid materials to a fixed NO concentration vary within 10 rel.%. For unmodified matrices SnO2 and In2O3, a gradual decrease in the values of the photoresponse and the resistive response was found (on average by 30 rel.% in 60 days), as well as an increase in the resistance of these materials in pure air. This may be due to incomplete desorption of NOx species from the surface of semiconductor oxides under blue light.
So, comparing the values of the sensor response (Figure 10), selectivity (Figure 14), and stability (Figure S8, Supplementary Materials) of the studied materials, we can conclude that the hybrid material In2O3+RuITP is the most promising for practical application.

4. Conclusions

Synthesized organo-inorganic hybrid materials based on nanocrystalline oxides SnO2 and In2O3 and heterocyclic Ru (II) complex (RuITP) showed high sensitivity in detecting nitrogen monoxide NO (0.25–4.0 ppm) at room temperature under periodic illumination with blue light (λmax = 470 nm). The resistive response calculated as the ratio S = Rdark gas/Rdark air of dark resistances and effective photoresponse Sph = Rdark/Rlight were used as the sensor signal.
Modification of semiconductor oxides by the RuITP complex differently affects the sensitivity of SnO2 and In2O3 to NO under dark conditions. The LDLNO values calculated from resistive response for SnO2+RuITP and In2O3+RuITP samples were 69 ppb and 88 ppb, respectively. Based on the results of in situ DRIFT analysis it was assumed, that an increase in the resistive response of SnO2+RuITP (compared to unmodified SnO2) towards NO may be due to the catalytic action of RuITP in the oxidation of NO to NO2 in the gas phase.
Surface modification of SnO2 and In2O3 with RuITP complex leads to the growth of photosensitivity accompanied by the reproducible change in photoresponse depending on NO concentration. The ratios of Sph in the presence of 4 ppm NO for hybrid materials and corresponding unmodified oxides are Sph(SnO2+RuITP)/Sph(SnO2) = 2.2 and Sph(In2O3+RuITP)/Sph(In2O3) = 5.5. The greater amplification of the photoresponse in the case of In2O3 sensibilization is explained by the larger ∆E = LUMO(RuITP)—EС(In2O3) value providing larger rate constant of the photoelectron transfer from Ru (II) complex into semiconductor matrix.

Supplementary Materials

The following are available online at https://www.mdpi.com/2079-4991/10/1/70/s1, Figure S1: Structure of the 5-(1H-imidazo[4,5-f][1,10]phenanthrolin-2-yl)thiophene-2-carbaldehyde and 2,5-bis(1H-imidazo[4,5-f][1,10]phenanthrolin-2-yl)thiophene; Figure S2: Structure of the (E)-4-(2-(5-(1H-imidazo[4,5-f][1,10]phenanthrolin-2-yl)thiophen-2-yl)vinyl)-1-methylpyridin-1-ium iodide; Figure S3: Structure of the bis(2,2′-bipyridin-k2N1,N1′)[4-{(E)-2-[5-(1H-imidazo[4,5-f][1,10]phenanthrolin-2-yl)thiophen-2-yl]ethynyl}-1-methylpyridinium iodide] ruthenium (II) dichloride; Figure S4: Voltammogram of the RuITP complex; Figure S5: XRD patterns of nanocrystalline SnO2 (a) and In2O3 (b) samples; Figure S6: N2 adsorption-desorption isotherms for nanocrystalline In2O3 and SnO2 powders; Figure S7: Pore size distribution (BJH) for nanocrystalline In2O3 and SnO2 powders; Figure S8: Change in photoresponse (a) and resistive response (b) of nanocrystalline oxides SnO2 and In2O3 and hybrids SnO2+RuITP and In2O3+RuITP in the presence of 4 ppm NO within 60 days; Table S1: Electrochemical data and calculated values of HOMO and LUMO of RuITP complex in MeCN with 0.1 M TBAP as supporting electrolyte; potentials were measured relative to Ag|AgCl|KCl aq. sat. reference electrode.

Author Contributions

Conceptualization, M.R., O.F., and A.G.; data curation, A.N., S.T., and P.Y.; formal analysis, A.N., S.T., and P.Y.; investigation, A.N., T.S., S.T., P.Y., and N.K.; methodology, A.N., M.R., and O.F.; supervision, M.R.; writing of the original draft, A.N., M.R., S.T., and O.F.; writing of review and editing, M.R., O.F., and A.G. All authors have read and agreed to the published version of the manuscript.

Funding

This research was funded by the Russian Science Foundation, grant number 19-19-00357.

Acknowledgments

The TG-MS analysis and spectral research were carried out using the equipment purchased by funds of Lomonosov Moscow State University Program of the Development.

Conflicts of Interest

The authors declare no conflict of interest.

References

  1. World Health Organization (WHO). WHO Guidelines for Indoor Air Quality: Selected Pollutants. Available online: www.euro.who.int_data/assets/pdf_file/0009/128169/e94535/pdf (accessed on 20 November 2019).
  2. Rasmussen, R.E.; Mannix, R.C.; Oldham, M.J.; Phalen, R.F. Effects of nitrogen dioxide on respiratory tract clearance in the ferret. J. Toxicol. Environ. Health 1994, 41, 109–120. [Google Scholar] [CrossRef] [PubMed] [Green Version]
  3. Witschi, H. Ozone, nitrogen dioxide and lung cancer: A review of some recent issues and problems. Toxicology 1988, 48, 1–20. [Google Scholar] [CrossRef]
  4. Morgenstern, V.; Zutavern, A.; Cyrys, J.; Brockow, I.; Koletzko, S.; Krämer, U.; Behrendt, H.; Herbarth, O.; Berg, A.; Bauer, C.P.; et al. Atopic diseases, allergic sensitization, and exposure to traffic-related air pollution in children. Am. J. Respir. Crit. Care Med. 2008, 177, 1331–1337. [Google Scholar] [CrossRef]
  5. Seinfeld, J.H.; Pandis, S.N. Chapter 20. Wet deposition. In Atmospheric Chemistry and Physics: From Air Pollution to Climate Change, 3rd ed.; John Wiley & Sons, Inc.: Hoboken, NJ, USA, 2006; pp. 856–888. [Google Scholar]
  6. Warneck, P. Chapter 9. Nitrogen compounds in the troposphere. In Chemistry of the Natural Atmosphere, 2nd ed.; Academic Press: San Diego, CA, USA, 2000; Volume 71, pp. 511–586. [Google Scholar]
  7. Kharitonov, S.A.; Barnes, P.J. Biomarkers of some pulmonary diseases in exhaled breath. Biomarkers 2002, 7, 1–32. [Google Scholar] [CrossRef] [PubMed]
  8. Baraldi, E.; Carraro, S. Exhaled NO and breath condensate. Pediatr. Respir. Rev. 2006, 7, 20–22. [Google Scholar] [CrossRef]
  9. Lu, Z.; Huang, W.; Wang, L.; Xu, N.; Ding, Q.; Cao, C. Exhaled nitric oxide in patients with chronic obstructive pulmonary disease: A systematic review and meta-analysis. Int. J. Chron. Obstruct. Pulmon. Dis. 2018, 13, 2695–2705. [Google Scholar] [CrossRef] [Green Version]
  10. Righettoni, M.; Amann, A.; Pratsinis, S.E. Breath analysis by nanostructured metal oxides as chemoresistive gas sensors. Mater. Today 2015, 18, 163–171. [Google Scholar] [CrossRef]
  11. Righettoni, M.; Ragnoni, A.; Guntner, A.; Loccioni, C.; Pratsinis, S.; Risby, T. Monitoring breath markers under controlled conditions. J. Breath Res. 2015, 9, 047101. [Google Scholar] [CrossRef]
  12. Ganas, K.; Loukidis, S.; Papatheodorou, G.; Panagou, P. Total nitrite/nitrate in expire breath condensate of patients with asthma. Resp. Med. 2001, 95, 649–654. [Google Scholar] [CrossRef] [Green Version]
  13. Marquis, B.T.; Vetelino, J.F. A semiconducting metal oxide sensor array for the detection of NOx and NH3. Sens. Actuators B Chem. 2001, 77, 100–110. [Google Scholar] [CrossRef]
  14. Lee, C.-T.; Lee, H.-Y.; Chiu, Y.-S. Performance improvement of nitrogen oxide gas sensors using Au catalytic metal on SnO2/WO3 complex nanoparticle sensing layer. IEEE Sens. J. 2016, 16, 7581–7585. [Google Scholar] [CrossRef]
  15. Yin, L.; Chen, D.; Fan, B.; Lu, H.; Wang, H.; Xu, H.; Yang, D.; Shao, G.; Zhang, R. Enhanced selective response to nitric oxide (NO) of Au-modified tungsten trioxide nanoplates. Mater. Chem. Phys. 2013, 143, 461–469. [Google Scholar] [CrossRef]
  16. Tomchenko, A.A.; Khatko, V.V.; Emelianov, I.L. WO3 thick-film gas sensors. Sens. Actuators B Chem. 1998, 46, 8–14. [Google Scholar] [CrossRef]
  17. Zhao, J.; Tan, R.; Shen, W.; Yang, Y.; Guo, Y.; Li, J.; Zhou, Z.; Jian, J.; Song, W. Highly selective Sn2O3-based sensors for NO detection. Mater. Lett. 2012, 84, 94–96. [Google Scholar] [CrossRef]
  18. Li, F.; Chen, Y.; Ma, J. Porous SnO2 nanoplates for highly sensitive NO detection. J. Mater. Chem. A 2014, 2, 7175–7178. [Google Scholar] [CrossRef]
  19. Singkammo, S.; Wisitsoraat, A.; Jaruwongrangsee, K.; Tuantranont, A.; Phanichphant, S.; Liewhiran, C. Roles of catalytic PtO2 nanoparticles on nitric oxide sensing mechanisms of flame-made SnO2 nanoparticles. Appl. Surf. Sci. 2018, 458, 281–292. [Google Scholar] [CrossRef]
  20. Wu, M.-R.; Li, W.-Z.; Tung, C.-Y.; Huang, C.-Y.; Chiang, Y.-H.; Liu, P.-L.; Horng, R.-H. NO gas sensor based on ZnGa2O4 epilayer grown by metalorganic chemical vapor deposition. Sci. Rep. 2019, 9, 7459. [Google Scholar] [CrossRef]
  21. Verma, V.P.; Das, S.; Hwang, S.; Choi, H.; Jeon, M.; Choi, W. Nitric oxide gas sensing at room temperature by functionalized single zinc oxide nanowire. Mater. Sci. Eng. B 2010, 171, 45–49. [Google Scholar] [CrossRef]
  22. Samanta, C.; Ghatak, A.; Raychaudhuri, A.K.; Ghosh, B. ZnO/Si nanowires heterojunction array based nitric oxide (NO) gas sensor with noise-limited detectivity approaching 10 ppb. Nanotechnology 2019, 30, 305501. [Google Scholar] [CrossRef]
  23. Yang, L.; Marikutsa, A.; Rumyantseva, M.; Konstantinova, E.; Khmelevsky, N.; Gaskov, A. Quasi similar routes of NO2 and NO sensing by nanocrystalline WO3: Evidence by in situ drift spectroscopy. Sensors 2019, 19, 3405. [Google Scholar] [CrossRef] [Green Version]
  24. Chizhov, A.S.; Rumyantseva, M.N.; Vasiliev, R.B.; Filatova, D.G.; Drozdov, K.A.; Krylov, I.V.; Abakumov, A.M.; Gaskov, A.M. Visible light activated room temperature gas sensors based on nanocrystalline ZnO sensitized with CdSe quantum dots. Sens. Actuators B Chem. 2014, 205, 305–312. [Google Scholar] [CrossRef]
  25. Chizhov, A.; Rumyantseva, M.; Vasiliev, R.; Filatova, D.; Drozdov, K.; Krylov, I.; Marchevsky, A.; Karakulina, O.; Abakumov, A.; Gaskov, A. Visible light activation of room temperature NO2 gas sensors based on ZnO, SnO2 and In2O3 sensitized with CdSe quantum dots. Thin Solid Films 2016, 618, 253–262. [Google Scholar] [CrossRef]
  26. Chizhov, A.; Vasiliev, R.; Rumyantseva, M.; Krylov, I.; Drozdov, K.; Batuk, M.; Hadermann, J.; Abakumov, A.; Gaskov, A. Light-activated sub-ppm NO2 detection by hybrid ZnO/QD nanomaterials vs. charge localization in core-shell QD. Front. Mater. 2019, 6, 1–14. [Google Scholar] [CrossRef]
  27. Rumyantseva, M.; Nasriddinov, A.; Vladimirova, S.; Fedorova, O.; Tokarev, S.; Krylov, I.; Drozdov, K.; Baranchikov, A.; Gaskov, A. Photosensitive organic-inorganic hybrid materials for room temperature gas sensor applications. Nanomaterials 2018, 8, 671. [Google Scholar] [CrossRef] [PubMed] [Green Version]
  28. Peng, L.; Qin, P.; Zeng, Q.; Song, H.; Lei, M.; Mwangi, J.J.N.; Wang, D.; Xie, T. Improvement of formaldehyde sensitivity of ZnO nanorods by modifying with Ru(dcbpy)2(NCS)2. Sens. Actuators B 2011, 160, 39–45. [Google Scholar] [CrossRef]
  29. Dongare, P.; Myron, B.D.B.; Wang, L.; Thompson, D.W.; Meyer, T.J. [Ru(bpy)3]2+ * revisited. Is it localized or delocalized? How does it decay? Coord. Chem. Rev. 2017, 345, 86–107. [Google Scholar] [CrossRef]
  30. Hussain, M.; Islam, A.; Bedja, I.; Gupta, R.K.; Hanb, L.; El-Shafei, A. A comparative study of Ru(II) cyclometallated complexes versus thiocyanated heteroleptic complexes: Thermodynamic force for efficient dye regeneration in dye-sensitized solar cells and how low could it be? Phys. Chem. Chem. Phys. 2014, 16, 14874–14881. [Google Scholar] [CrossRef] [Green Version]
  31. Gao, F.; Wang, Y.; Shi, D.; Zhang, J.; Wang, M.; Jing, X.; Baker, R.H.; Wang, P.; Zakeeruddin, S.; Graetzel, M. Enhance the Optical Absorptivity of Nanocrystalline TiO2 Film with High Molar Extinction Coefficient Ruthenium Sensitizers for High Performance Dye-Sensitized Solar Cells. J. Am. Chem. Soc. 2008, 130, 10720–10728. [Google Scholar] [CrossRef]
  32. Balasingam, S.K.; Lee, M.; Kang, M.G.; Jun, Y. Improvement of dye-sensitized solar cells toward the broader light harvesting of the solar spectrum. Chem. Commun. 2013, 49, 1471–1487. [Google Scholar] [CrossRef] [Green Version]
  33. Aghazad, S.; Nazeeruddin, M.K. Ruthenium Complexes as Sensitizers in Dye-Sensitized Solar Cells. Inorganics 2018, 6, 52. [Google Scholar] [CrossRef] [Green Version]
  34. Rumyantseva, M.; Makeeva, E.; Gaskov, A.; Shepel, N.; Peregudova, S.; Khoroshutin, A.; Tokarev, S.; Fedorova, O. H2S sensing by hybrids based on nanocrystalline SnO2 functionalized with Cu(II) organometallic complexes: The role of the ligand platform. Nanomaterials 2017, 7, 384. [Google Scholar] [CrossRef] [PubMed] [Green Version]
  35. Cychosz, K.A.; Thommes, M. Progress in the Physisorption Characterization on Nanoporous Gas Storage Materials. Engineering 2018, 4, 559–566. [Google Scholar] [CrossRef]
  36. Peercy, P.S.; Morosin, B. Pressure and temperature dependences of the Raman-active phonons in SnO2. Phys. Rev. B 1973, 7, 2779–2786. [Google Scholar] [CrossRef]
  37. Garcia-Tecedor, M.; Maestre, D.; Cremades, A.; Piqueras, J. Growth and characterization of Cr doped SnO2 microtubes with resonant cavity modes. J. Mater. Chem. C 2016, 4, 5709–5716. [Google Scholar] [CrossRef]
  38. Caoshui, X.; Yonghong, X.; Hong, Z.; Yuheng, Z.; Yulong, L. Investigation of Raman spectrum for nano-SnO2. Sci. China Ser. A 1997, 40, 1222–1227. [Google Scholar]
  39. Ferreira, C.S.; Santos, P.L.; Bonacin, J.A.; Passos, R.R.; Pocrifka, L.A. Rice husk reuse in the preparation of SnO2/SiO2 nanocomposite. Mat. Res. 2015, 18, 639–643. [Google Scholar] [CrossRef]
  40. Abello, L.; Bochu, B.; Gaskov, A.; Koudryavtseva, S.; Lucazeau, G.; Roumyantseva, M. Structural characterization of nanocrystalline SnO2 by X-ray and Raman spectroscopy. J. Solid State Chem. 1998, 135, 78–85. [Google Scholar] [CrossRef]
  41. Dieguez, A.; Romano-Rodriguez, A.; Vila, A.; Morante, J.R. The complete Raman spectrum of nanometric SnO2 particles. J. Appl. Physics. 2001, 90, 1550–1557. [Google Scholar] [CrossRef] [Green Version]
  42. Liu, L.Z.; Li, T.H.; Wu, X.L.; Shen, J.C.; Chu, P.K. Identification of oxygen vacancy types from Raman spectra of SnO2 nanocrystals. J. Raman Spectrosc. 2012, 43, 1423–1426. [Google Scholar] [CrossRef]
  43. Nasriddinov, A.; Rumyantseva, M.; Marikutsa, A.; Gaskov, A.; Lee, J.H.; Kim, J.H.; Kim, J.Y.; Kim, S.S.; Kim, H.W. Sub-ppm Formaldehyde Detection by n-n TiO2@SnO2 Nanocomposites. Sensors 2019, 19, 3182. [Google Scholar] [CrossRef] [Green Version]
  44. White, W.B.; Keramidas, V.G. Vibrational spectra of oxides with the C-type rare earth oxide structure. Spectrochim. Acta 1972, 28, 501–509. [Google Scholar] [CrossRef]
  45. Kranert, C.; Schmidt-Grund, R.; Grundmann, M. Raman active phonon modes of cubic In2O3. Phys. Status Solidi RRL 2014, 8, 554–559. [Google Scholar] [CrossRef]
  46. Garcia-Domene, B.; Ortiz, H.M.; Gomis, O.; Sans, J.A.; Manjon, F.J.; Munoz, A.; Rodrıguez-Hernandez, P.; Achary, S.N.; Errandonea, D.; Martınez-Garcıa, D.; et al. High-pressure lattice dynamical study of bulk and nanocrystalline In2O3. J. Appl. Phys. 2012, 112, 123511. [Google Scholar] [CrossRef]
  47. Arooj, S.; Xu, T.; Hou, X.; Wang, Y.; Tong, J.; Chu, R.; Liu, B. Green emission of indium oxide via hydrogen treatment. RSC Adv. 2018, 8, 11828–11833. [Google Scholar] [CrossRef] [Green Version]
  48. Yin, W.; Su, J.; Cao, M.; Ni, C.; Cloutier, C.G.; Huang, Z.; Ma, X.; Ren, L.; Hu, C.; Wei, B. In(OH)3 and In2O3 micro/nanostructures: Controllable NaOAc-assisted microemulsion synthesis and Raman properties. J. Phys. Chem. C 2009, 113, 19493–19499. [Google Scholar] [CrossRef]
  49. Baszczuk, A.; Jasiorski, M.; Nyk, M.; Hanuza, J.; Mączka, M.; Stręk, W. Luminescence properties of europium activated SrIn2O4. J. Alloy. Compd. 2005, 394, 88–92. [Google Scholar] [CrossRef]
  50. Kim, W.J.; Pradhan, D.; Sohn, Y. Fundamental nature and CO oxidation activities of indium oxide nanostructures: 1D-wires, 2D-plates and 3D-cubes and donuts. J. Mater. Chem. A 2013, 1, 10193. [Google Scholar] [CrossRef]
  51. Juris, A.; Balzani, V.; Barigelletti, F.; Campagna, S.; Belser, P.; Zelewsky, A. Ru(II) polypyridine complexes: Photophysics, photochemistry, eletrochemistry, and chemiluminescence. Coord. Chem. Rev. 1988, 84, 85–277. [Google Scholar] [CrossRef]
  52. Calzaferri, G.; Rytz, R. Electronic Transition Oscillator Strength by the Extended Hueckel Molecular Orbital Method. J. Phys. Chem. 1995, 99, 12141–12150. [Google Scholar] [CrossRef]
  53. Kalyanasundaram, K. Photophysics, photochemistry and solar energy conversion with tris(bipyridyl)ruthenium(II) and its analogues. Coord. Chem. Rev. 1982, 46, 159–244. [Google Scholar] [CrossRef]
  54. Minaev, B.; Minaeva, V.; Vahtras, O. Electronic structure and spectra of dyes for sensitizing nanocrystalline solar cells. In Proceedings of the Nano-Sol-Net International Symposium: Trends in Organic Electronics and Hybrid Photovoltaic’s, Eforie Nord, Romania, 12–14 June 2008. [Google Scholar]
  55. Minaev, B.; Minaeva, V.; Baryshnikov, G.; Girtu, M.; Agren, H. IR, Raman and UV-Visible spectra of the Ru(II) cyano complexes studied by DFT. Mol. Simul. 2011, 37, 670–677. [Google Scholar] [CrossRef]
  56. Silverstein, D.W.; Milojevich, C.B.; Camden, J.P.; Jensen, L. Investigation of linear and nonlinear Raman scattering for isotopologues of Ru(bpy)32+. J. Phys. Chem. C 2013, 117, 20855–20866. [Google Scholar] [CrossRef]
  57. Ghosh, P.K.; Bard, A.J. Photochemistry of Tris(2,2’-bipyridyl) ruthenium(II) in colloidal clay suspensions. J. Phys. Chem. 1984, 88, 5519–5526. [Google Scholar] [CrossRef]
  58. Sergent, N.; Epifani, M.; Comini, E.; Faglia, G.; Pagnier, T. Interactions of nanocrystalline tin oxide powder with NO2: A Raman spectroscopic study. Sens. Actuators B 2007, 126, 1–5. [Google Scholar] [CrossRef]
  59. Ilin, A.; Martyshov, M.; Forsh, E.; Forsh, P.; Rumyantseva, M.; Abakumov, A.; Gaskov, A.; Kashkarov, P. UV effect on NO2 sensing properties of nanocrystalline In2O3. Sens. Actuators B Chem. 2016, 231, 491–496. [Google Scholar] [CrossRef]
  60. Hadjiivanov, K.I. Identification of neutral and charged NxOy surface species by IR spectroscopy. Catal. Rev. Sci. Eng. 2000, 42, 71–144. [Google Scholar] [CrossRef]
  61. Azambre, B.; Zenboury, L.; Delacroix, F.; Weber, J.V. Adsorption of NO and NO2 on ceria–zirconia of composition Ce0.69Zr0.31O2: A DRIFTS study. Catal. Today 2008, 137, 278–282. [Google Scholar] [CrossRef]
  62. Hess, C.; Ozensoy, E.; Yi, C.W.; Goodman, D.W. NO Dimer and Dinitrosyl formation on Pd (111): From ultra-high-vacuum to elevated pressure conditions. J. Am. Chem. Soc. 2006, 128, 2988–2994. [Google Scholar] [CrossRef]
  63. Coates, J. Interpretation of Infrared Spectra, a Practical Approach. In Encyclopedia of Analytical Chemistry; Meyers, R.A., Ed.; John Wiley & Sons Ltd: Chichester, UK, 2000; pp. 10815–10837. [Google Scholar]
  64. Hadjiivanov, K.; Knözinger, H.; Tsyntsarski, B.; Dimitrov, L. Effect of water on the reduction of NOx with propane on Fe-ZSM-5. An FTIR mechanistic study. Catal. Lett. 1999, 62, 35–40. [Google Scholar] [CrossRef]
  65. Kantcheva, M.; Bushev, V.; Hadjiivanov, K. Nitrogen dioxide adsorption on deuteroxylated titania (anatase). J. Chem. Soc. Faraday Trans. 1992, 88, 3087–3089. [Google Scholar] [CrossRef]
  66. Hadjiivanov, K.; Klissurski, D.; Bushev, V. IR spectroscopic study of NO2 adsorption on chromia. J. Chem. Soc. Faraday Trans. 1995, 91, 149–153. [Google Scholar] [CrossRef]
  67. Hadjiivanov, K.; Klissurski, D.; Ramis, G.; Busca, G. Fourier transform IR study of NOx adsorption on a CuZSM-5 DeNOx catalyst. Appl. Catal. B Environ. 1996, 7, 251–267. [Google Scholar] [CrossRef]
  68. Djonev, B.; Tsyntsarski, B.; Klissurski, D.; Hadjiivanov, K. IR spectroscopic study of NOx adsorption and NOx–O2 coadsorption on Co2+/SiO2 catalysts. J. Chem. Soc. Faraday Trans. 1997, 93, 4055–4063. [Google Scholar] [CrossRef]
  69. Nakamoto, K. Infrared and Raman Spectra of Inorganic and Coordination Compounds. Part A: Theory and Applications in Inorganic Chemistry, 6th ed.; John Wiley & Sons, Inc.: Hoboken, NJ, USA, 2009. [Google Scholar]
  70. Socrates, G. Infrared and Raman Characteristic Group Frequencies: Tables and Charts, 3rd ed.; John Wiley & Sons Ltd: West Sussex, UK, 2001. [Google Scholar]
  71. Cui, X.; Zhou, J.; Ye, Z.; Chen, H.; Li, L.; Ruan, M.; Shi, J. Selective catalytic oxidation of ammonia to nitrogen over mesoporous CuO/RuO2 synthesized by co-nanocasting-replication method. J. Catal. 2010, 270, 310–317. [Google Scholar] [CrossRef]
  72. Yin, S.F.; Xu, B.Q.; Zhou, X.P.; Au, C.T. A mini-review on ammonia decomposition catalysts for on-site generation of hydrogen for fuel cell applications. Appl. Catal. A 2004, 277, 1–9. [Google Scholar] [CrossRef]
  73. Lorenzut, B.; Montini, T.; Pavel, C.C.; Comotti, M.; Vizza, F.; Bianchini, C.; Fornasiero, P. Embedded Ru@ZrO2 Catalysts for H2 Production by Ammonia Decomposition. ChemCatChem 2010, 2, 1096–1106. [Google Scholar] [CrossRef]
  74. Hong, Z.; Wang, Z.; Li, X. Catalytic oxidation of nitric oxide (NO) over different catalysts: An overview. Catal. Sci. Technol. 2017, 7, 3440–3452. [Google Scholar] [CrossRef]
  75. Marikutsa, A.; Rumyantseva, M.; Gaskov, A. Specific interaction of PdOx- and RuOy modified tin dioxide with CO and NH3 gases: Kelvin probe and DRIFT studies. J. Phys. Chem. C 2015, 119, 24342–24350. [Google Scholar] [CrossRef]
  76. Marikutsa, A.; Krivetskiy, V.; Yashina, L.; Rumyantseva, M.; Konstantinova, E.; Ponzoni, A.; Comini, E.; Abakumov, A.; Gaskov, A. Catalytic impact of RuOx clusters to high ammonia sensitivity of tin dioxide. Sens. Actuators B Chem. 2012, 175, 186–193. [Google Scholar] [CrossRef]
  77. Robertson, J. Electronic structure of SnO2, GeO2, PbO2, TeO2 and MgF2. J. Phys. C Solid State Phys. 1979, 12, 4767–4772. [Google Scholar] [CrossRef]
  78. Klein, A. Electronic properties of In2O3 surfaces. Appl. Phys. Lett. 2000, 77, 2009–2011. [Google Scholar] [CrossRef]
  79. Ganose, A.M.; Scanlon, D.O. Band gap and work function tailoring of SnO2 for improved transparent conducting ability in photovoltaic. J. Mater. Chem. C 2016, 4, 1467–1475. [Google Scholar] [CrossRef] [Green Version]
  80. Tvrdy, K.; Frantsuzov, P.A.; Kamat, P.V. Photoinduced electron transfer from semiconductor quantum dots to metal oxide nanoparticles. Proc. Natl. Acad. Sci. USA 2011, 108, 29–34. [Google Scholar] [CrossRef] [PubMed] [Green Version]
  81. Prades, J.D.; Cirera, A.; Morante, J.R. First-Principles Study of NOx and SO2 Adsorption onto SnO2 (110). J. Electrochem. Soc. 2007, 154, H675–H680. [Google Scholar] [CrossRef]
  82. Prades, J.D.; Cirera, A.; Morante, J.R. Ab initio calculations of NO2 and SO2 chemisorption onto non-polar ZnO surfaces. Sens. Actuators B 2009, 142, 179–184. [Google Scholar] [CrossRef]
  83. Wang, C.Y.; Becker, R.W.; Passow, T.; Pletsche, W.; Kohler, K.; Cimalla, V.; Ambacher, O. Photon-stimulated sensor based on indium oxide nanoparticles I: Wide-concentration-range ozone monitoring in air. Sens. Actuators B 2011, 152, 235–240. [Google Scholar] [CrossRef]
  84. Konvalina, G.; Haik, H. Sensors for Breath Testing: From Nanomaterials to Comprehensive Disease Detection. Acc. Chem. Res. 2014, 47, 66–76. [Google Scholar] [CrossRef]
Figure 1. High resolution transmission electron microscopy (HRTEM) (a,b) images of SnO2 (a) and In2O3 (b) nanoparticles. SEM (c,d) images of SnO2 (c) and In2O3 (d) thick films deposited over functional substrates and sintered at 300 °C. Energy dispersive X-ray spectroscopy (EDX) maps (e,f) of element distribution on the surface of the hybrid SnO2+RuITP (e) and In2O3+RuITP (f) thick films.
Nanomaterials 10 00070 g001
Figure 2. Raman spectra of nanocrystalline SnO2 (a) and In2O3 (b) based samples.
Nanomaterials 10 00070 g002
Figure 3. Energy level scheme of the molecular orbitals of Ru (II) heterocyclic complex. The four possible metal-to-ligand charge transfer (MLCT) states are indicated by the vertical arrows.
Nanomaterials 10 00070 g003
Figure 4. UV-Vis absorption spectra of the Ru (II) heterocyclic complex in methanol solution (C = 5 × 10⁻⁵ М). The inset shows the four possible transitions, labeled according to the involved molecular orbitals.
Nanomaterials 10 00070 g004
Figure 5. Absorption spectra of the RuITP dye, unmodified and sensitized nanocrystalline SnO2 (a) and In2O3 (b).
Nanomaterials 10 00070 g005
Figure 6. Thermal analysis (a) and mass spectrometry curves (b) of the In2O3+RuITP sample.
Nanomaterials 10 00070 g006
Figure 7. Room temperature resistance of unmodified oxides SnO2 and In2O3 and hybrids SnO2+RuITP and In2O3+RuITP in the presence of 4 ppm NO in dark conditions and under blue light LED illumination (λmax = 470 nm). I—air, dark conditions; II—in the presence of target gas, dark conditions; III—air, dark conditions; IV—air, light illumination; V—air, dark conditions.
Nanomaterials 10 00070 g007
Figure 8. Scheme of changes in the resistance of semiconductor materials under periodic blue light LED illumination (λmax = 470 nm) in pure air and in the presence of NO.
Nanomaterials 10 00070 g008
Figure 9. Room-temperature electrical resistance of the nanocrystalline SnO2 and In2O3 and hybrid samples under periodic illumination during stepwise change of the NO concentration.
Nanomaterials 10 00070 g009
Figure 10. Room-temperature Rdark and Rlight resistance values (a,b), resistive response (c,d), and photoresponse (e,f) depending on NO concentration for SnO2 based (a,c,e) and In2O3 based (b,d,f) samples.
Nanomaterials 10 00070 g010
Figure 11. X-ray photoelectron spectra O 1s of the (a) SnO2-based and (b) In2O3-based samples.
Nanomaterials 10 00070 g011
Figure 12. (a) In situ diffuse reflectance infrared Fourier transform spectroscopy (DRIFT) spectra of the In2O3+RuITP sample during NO (50 ppm) exposure at room temperature. (b) In situ DRIFT spectra of nanocrystalline SnO2 and In2O3 and hybrid materials after 60 min NO (50 ppm) exposure at room temperature.
Nanomaterials 10 00070 g012
Figure 13. Scheme of the mutual arrangement of the energy levels for bulk SnO2, In2O3, HOMO, and LUMO of the RuITP complex.
Nanomaterials 10 00070 g013
Figure 14. Comparison of the effective photoresponse (a) and resistive response (b) of hybrid materials when detecting different gases at room temperature under periodic blue light illumination.
Nanomaterials 10 00070 g014
Table 1. Microstructure characteristics of synthesized semiconductor oxides.
SamplePhase CompositiondXRD (a), nmdTEM (b), nmSsurf (c), m2/gAverage Pore
Diameter, nm
SnO2SnO2, cassiterite4 ± 14 ± 1115 ± 53–5; 70–80
In2O3In2O3, bixbyite7 ± 17 ± 290 ± 53–4
(a) crystallite size from XRD; (b) particle size from TEM; (c) specific surface area.
Table 2. Assignment of Raman vibrational modes (cm−1).
SnO2In2O3SnO2+RuITPIn2O3+RuITP
137 (B1g)132 (Ag)141 (B1g)307.8 (Tg)
309, 352 (IR Eu)307.7 (Tg)245.7 (IR)433 (surface mode)
444 (IR B1u)366.7 (Tg)299, 344.7 (IR Eu)484 (Ag)
480.5 (Eg)458 (surface mode)497.5 (Eg)665.6 (Tg)
563 (surface mode)494.6 (Ag)543.5 (surface mode)930 (ring breathing)
631 (A1g)628.5 (Tg)620 (A1g)1028.6 (δ(ring) + ν(Ru-N))
772.8 (B2g) 681 (Ru-N str., ring breathing)1071.4, 1098.5 (δ(CH) + ν(ring))
755.6 (B2g), ring breathing)1187 (δ(CH))
1024 (δ(ring) + ν(Ru-N))1218, 1255 (ν(C=N) + ν(C=C) + δ(CH))
1168, 1186.5 (δ(CH))1311.5, 1345 (ν(C-C) + δ(CH))
1265 (ν(C=N) + ν(C=C) + δ(CH))1434 (δ(CH) + ν(C=N) chel.)
1314, 1364 (ν(C-C) + δ(CH))1479 (ν(C-C), in phase)
1433.6 (δ(CH) + ν(C=N) chel.)1540, 1558 (ν(C=C), ν(C=N))
1482.7 (ν(C-C), in phase)1600.8 (ν(C=C), ν(C-C))
1556 (ν(C=C), ν(C=N))
1600.6 (ν(C=C), ν(C-C))
Table 3. Assignments of IR bands (cm−1) appeared in DRFIT spectra as a result of NO adsorption on the surface of prepared samples at room temperature according to [60,69,70].
SampleWavenumber, cm−1Assignments
SnO2/SnO2+RuITP1050, 1285, 1540monodentate NO3
1450monodentate NO2
1592chelating bidentate NO3
1630bending H2O
3600–3700‘‘free’’ OH groups
In2O3/In2O3+RuITP1036, 1240, 1285monodentate NO3
1145, 1175chelating bidentate NO2
1198, 1220bridging bidentate NO2
1420nitro compound NO2
1075, 1450, 1475monodentate NO2
1575chelating bidentate NO3
1630bending H2O
3226H-bonded OH groups
3580–3700‘‘free’’ OH groups

