Article

Transparent 3-Layered Bacterial Nanocellulose as a Multicompartment and Biomimetic Scaffold for Co-Culturing Cells

by
Karla Pollyanna Vieira de Oliveira
1,2,
Michael Yilma Yitayew
3,
Ana Paula Almeida Bastos
4,
Stefanie Cristine Nied Mandrik
1,
Luismar Marques Porto
1 and
Maryam Tabrizian
2,3,*
1
Department of Chemical Engineering and Food Engineering, Technology Center, Federal University of Santa Catarina (UFSC), Campus Reitor João David Ferreira Lima, Florianópolis 88040-900, SC, Brazil
2
Faculty of Dental Medicine and Oral Health Sciences, McGill University, 2002 Avenue McGill College, Suite 500, Montreal, QC H2A 1G1, Canada
3
BiomatX Lab, Department of Biomedical Engineering, Faculty of Medicine and Health Sciences, McGill University, 3775 University Street, Montreal, QC, H3A 2B6, Canada
4
Embrapa Swine and Poultry, BR153, km 110, Tamanduá District, Concórdia 89715-899, SC, Brazil
*
Author to whom correspondence should be addressed.
J. Funct. Biomater. 2025, 16(6), 208; https://doi.org/10.3390/jfb16060208
Submission received: 30 April 2025 / Revised: 24 May 2025 / Accepted: 30 May 2025 / Published: 3 June 2025
(This article belongs to the Section Bone Biomaterials)

Abstract

Three-dimensional (3D) cell culture models are widely used to provide a more physiologically relevant microenvironment in which to host and study desired cell types. These models vary in complexity and cost, ranging from simple and inexpensive to highly sophisticated and costly systems. In this study, we introduce a novel translucent multi-compartmentalized stacked multilayered nanocellulose scaffold and describe its fabrication, characterization, and potential application for co-culturing multiple cell types. The scaffold consists of bacterial nanocellulose (BNC) layers separated by interlayers of a lower density of nanocellulose fibers. Using this system, we co-cultured the MDA-MB-231 cell line with two tumor-associated cell types, namely BC-CAFs and M2 macrophages, to simulate the tumor microenvironment (TME). Cells remained viable and metabolically active for up to 15 days. Confocal microscopy showed no signs of cell invasion. However, BC-CAFs and MDA-MB-231 cells were frequently observed within the same layer. The expression of breast cancer-related genes was analyzed to assess the downstream functionality of the cells. We found that the E-cadherin expression was 20% lower in cancer cells co-cultured in the multi-compartmentalized scaffold than in those cultured in 2D plates. Since E-cadherin plays a critical role in preventing the initial dissociation of epithelial cells from the primary tumor mass and is often downregulated in the tumor microenvironment in vivo, this finding suggests that our scaffold more effectively recapitulates the complexity of a tumor microenvironment.

1. Introduction

Cells grow in a three-dimensional (3D) environment, surrounded by other cells and by the extracellular matrix (ECM), which is a complex and dynamic acellular network primarily composed of proteins and polysaccharides [1,2,3,4]. The ECM plays a vital role in cell development, differentiation, and tissue homeostasis, influencing gene expression and signaling pathways [2,5,6,7]. Its physical properties can change in response to disease, such as the increased stiffness observed in cancerous tissue [5,8].
To better mimic the characteristics of the ECM, cell culture models have become essential tools in the fields of cancer research, tissue engineering, and drug discovery. Knowing that the cells in two-dimensional (2D) environments [8,9,10,11] exhibit different growth patterns and motility compared to those in 3D systems [9,10], the current research focuses on the development of 3D cell models to more adequately mimic the complex and dynamic microenvironments of living tissues [7,10,11]. In contrast to the 3D model, cells in the 2D model grow in monolayers, have a higher proliferation rate and equal access to nutrients, typically adopt an elongated morphology, and tend to show greater sensitivity to drugs that are completely different from their native environment [10,11,12,13]. As a result, 3D models are increasingly recognized for their ability to mimic the tumor microenvironments (TMEs) and to investigate cancer progression, metastasis, and therapeutic resistance [14,15,16].
Several factors need to be considered when designing a 3D cell culture model. In addition to mechanical properties, porosity, pore interconnectivity and biocompatibility [17,18,19,20], the ability of the model to mimic the biological tissue microenvironment, and cell–cell interactions should also be considered.
Among the various materials used for 3D cell culture, hydrogels have emerged as promising scaffolds due to their ability to mimic key properties of the native ECM [21,22]. Their mechanical properties are similar to those of soft tissues [23], they are able to sequester and retain proteins within their structure, and they support cell adhesion. Among hydrogels, bacterial nanocellulose (BNC) is an ideal candidate for biomimetic scaffolds. BNC is a naturally derived, inert hydrogel composed of D-glucose chains secreted by Gram-negative bacteria of various genera such as Komagataeibacter. These bacteria produce long, non-aggregated fibrils up to 100 nm in diameter that are characterized by high purity and crystallinity [24,25,26,27].
The physical structure of BNC is similar to that of ECM and possesses some key properties relevant to tissue engineering, including high crystallinity (84–89%) [28], tensile strength (79–88GPa), and a water-holding capacity of 99% [24,29,30]. Moreover, the properties of BNC can be tailored when used as a composite scaffold to enhance cell adhesion and differentiation [31]. For instance, surface modifications such as the adsorption of (Ile-Lys-Val-Ala-Val) IKVAV peptide [32], collagen [33], or alginate [34] can significantly improve the cell adhesion.
BNC is a cost-effective polymer with high biocompatibility and non-toxicity [34,35,36]. It has been used as a scaffold for the culture of various cell lines, including HUVECs [37], SMCs [24], hASCs and iPSCs [38], chondrocytes [34], fibroblasts [39], neuroblastoma SH-SY5Y cells [33], and human skeletal muscle myoblasts [40], among many others.
Typically, BNC is produced by static bacterial culture and exhibits two distinct surfaces with different fiber densities. The air–liquid interface is more entangled and denser, while the liquid–contact interface is more porous [24,37]. This structural variation allows the fabrication of multilayered scaffolds where different cell types are cultured in separate compartments, allowing for the study of cell–cell interactions in a co-culture system [41,42]. Such co-culture systems are of particular interest for simulating the TME, where multiple cell types, including cancer cells, cancer-associated fibroblasts, and tumor-associated macrophages, interact to drive tumorigenesis and therapeutic resistance.
To date, research focusing on triple-cell co-cultures in BNC scaffolds, particularly in compartmentalized designs, remains largely unexplored, with few studies employing this technology to model complex, multi-cellular environments [43,44,45]. In this work, we introduce a transparent, compartmentalized, triple-layered BNC scaffold designed for the simultaneous co-culture of triple-negative breast cancer (TNBC) cells (MDA-MB-231), primary cancer-associated fibroblasts (CAFs) and tumor-associated macrophages (TAM, M2). By embedding each cell type in separate layers of the BNC scaffold, we have developed a multicompartment system that is expected to mimic the TME more accurately than traditional 2D or 3D models. Furthermore, we biomimetically characterized the material, assessed gene expression associated with TNBC metastasis, and demonstrated that the BNC scaffold supports long-term cell viability and metabolic activity.

2. Materials and Methods

2.1. Material and Chemical Origins

All chemical reagents utilized in this study were of analytical grade and procured from commercial suppliers unless specified differently. Mannitol, yeast extract, peptone, and agar were procured from Himedia® (Kennett Square, PA, USA) for the formulation of Mannitol Agar medium. Sodium hydroxide (NaOH), ethanol (for dehydration processes), and paraformaldehyde were acquired from Sigma-Aldrich (Saint-Louis, MO, USA).
Culture media, including Dulbecco’s Modified Eagle Medium (DMEM, #11885-084), RPMI-1640 (#11875-093), and supplements such as fetal bovine serum (FBS, #FBS001), penicillin–streptomycin (#15140122), and β-mercaptoethanol (#M6250), were procured from Gibco (Thermo Fisher Scientific, Waltham, MA, USA) and Neuromics (Minneapolis, MN, USA) as indicated. CellTracker™ dyes (Invitrogen™/ThermoFisher Scientific, San Diego, CA, USA, #C34552, #C7025, #C2110), the Live/Dead Viability/Cytotoxicity Kit (Biotium, Fremont, CA, USA, #30002-T), and MTS assay reagents (Promega, Madison, WI, USA, #G358A) were utilized for cellular labeling and viability assessment. TRIzol™ reagent (ThermoFisher Scientific, #15596026) was employed for RNA extraction. All solutions were formulated with ultrapure water (Milli-Q®, Millipore/Sigma-Aldrich, San Francisco, CA, USA).

2.2. Multilayered BNC Fabrication

An aliquot of K. hansenii (ATCC 23769) was obtained from the Fundação André Tosello—Coleção de Culturas Tropical (Campinas, SP, Brazil) and expanded by culturing these bacteria in a Petri dish on Mannitol Agar medium (10 g/L mannitol, 2 g/L yeast extract, 1.2 g/L peptone, and 6 g/L agar) for 7 days under static conditions at 26 °C in BOD (Novatecnica, Piracicaba, SP, Brazil, model NT705).
To fabricate the multilayered scaffolds, an inoculum with an optical density of 1–1.3 (Thermoplate, λ = 630 nm, Thermo Fisher Scientific) was prepared by diluting a few colonies of K. hansenii in Defined Minimal Culture Medium (DMCM) [46], followed by bacteria lysis using vortexing at maximum speed. This inoculum was then diluted to 2.5% (v/v) in DMCM. Three milliliters of this dilution was distributed in 15 mL conical polystyrene tubes and incubated under static conditions at 26 °C to form the first layer of the scaffold (Figure 1A). After 7 and 14 days of incubation, 750 µL of DMCM was carefully pipetted into the tubes to form the second and third layers, respectively. To eliminate bacteria, samples were incubated in 0.1 M sodium hydroxide (NaOH) at 50 °C for 24 h, followed by multiple rinses with distilled water until the pH reached 6.5. The samples were then sterilized at 121 °C for 20 min.
The above protocol was repeated to produce a sufficient number of samples for various analyses, with the desired layers of BNC (Table 1). For some analyses, the individual layers of the 3LBNC scaffold were separated, with the order indicated as 1 being the bottom layer and the 3 being the top layer.

2.3. Thickness and Transparency Measurement

The 3LBNC samples were carefully dried with absorbent paper towels before the thickness was measured using a digital micrometer (Mitutoyo 293-561-30, Mitutoyo Corporation, Kanagawa, Japan). After measuring the total scaffold thickness, the layers were separated individually with forceps, measured, and compared to the total scaffold. All measurements were made in triplicate using two independent batches (n = 6). The height of each interlayer was calculated using the following equation:
interlayer thickness = 3 LBNC thickness individual   layer thickness   n interlayer
where 3LBNCthickness is the thickness of the entire 3-layer BNC, ∑individual layerthickness refers to the sum of the thickness of each individual layer of 3LBNC, and ninterlayer is the number of interlayers in the samples.
To assess the transparency of the samples, the transmittance of the SLBNC control, 2LBNC, and 3LBNC samples was measured using a spectrophotometer (λ = 550 nm), according to the method described by Saito et al. [47]. The average thickness of the samples was used for transparency conversion.

2.4. Pore Size Analysis

The 3LBNC samples were dehydrated using an increasing ethanol gradient (20–100%, 15 min each), followed by supercritical drying. After drying, the samples were immersed in liquid nitrogen (N2), cross-sectioned, and prepared for Scanning Electron Microscopy (SEM). SEM analysis was conducted on three samples from two different batches of BNC (n = 3) using a JEOL JSM-6390LV microscope (JEOL, Akishima, Tokyo, Japan), with images captured at an acceleration voltage of 10 kV. The pore size of the scaffold was determined using ImageJ software (version 1.52) from SEM images at 5000× magnification, using the ‘analyze particles’ function of the software. The Feret diameter was then compared among samples.

2.5. Nutrient Transport

To evaluate whether SLBNC and 2LBNC samples allowed glucose transport, a protocol adapted from Papenburg et al. [48] was used. Briefly, two polystyrene flasks were connected by a 5 mm hole and sealed with the samples. The upper flask contained a 1 g/L glucose solution, while the lower flask was filled with glucose-free liquid. The glucose concentration in both containers was determined using an enzymatic PGO assay (Sigma-Aldrich, #P7119-10CAP) with a spectrophotometer (SpectraMax i3 Platform, Molecular Devices, San Jose, CA, USA; λ = 450 nm). Calculations were performed as described by the authors. To simulate cell culture conditions, 20 mL of supplemented DMEM (Gibco, #11885092) was added to the donor flask, and an equal volume of 1× PBS was added to the receptor tube. Glucose solution and deionized water were used as controls in the donor and receptor flasks, respectively. Samples of 0.5 mL were taken from both containers at t = 0 (baseline), and at 15 min, 30 min, 1 h, 2 h, 4 h, 8 h, and 24 h intervals, unless there was no remaining volume in the donor flask.

2.6. Rheological Analysis

The 2LBNC and 3LBNC samples were characterized using uniaxial compression tests and shear stress analysis via a torsional rheometer (Discovery HR-2, TA Instruments, New Castle, DE, USA) equipped with a 20 mm circular plate positioned on a Peltier stage set at 37 °C. Compression data were obtained by applying 90% compressive strain at a rate of 10 µm/s. Young’s modulus (E) was calculated from the strain–stress curves in the 5–10% strain range.
Amplitude sweep tests were performed at an angular frequency of 10 rad/s over a strain range of 0.01% to 500%, at a constant temperature of 37 °C, with 10 data points collected per decade. The storage modulus (G’) of the 2LBNC and 3LBNC samples was obtained from the linear portion of the oscillatory strain/module curve. All tests were performed in triplicate and analyzed using TRIOS software (version 4.5.0.42498).

2.7. Standardization of Cell Culture Protocol

The cell culture was standardized in 2LBNC and 3LBNC prior to triple co-culture (Table 1). EOMA (mouse hemangioendothelioma endothelial cell line, ATCC #CRL-2586), EA.hy926 (human umbilical vein cell line, BCRJ #0345), and MDA-MB-231 (ATCC #HTB-26) cells were cultured in DMEM (Gibco, #11885-084) supplemented with 10% fetal bovine serum (FBS, Neuromics, #FBS001) and 1% penicillin–streptomycin (Pen/Strep, Gibco, #15140122). BC-CAFs (Neuromics, #CAF116) were maintained in the manufacturer’s recommended medium (MSC-GRO®, Neuromics, #PC00B1).
The THP-1 cell line was kindly provided by Dr. Cerruti’s lab (ATCC, TIB-202) and differentiated into M0 macrophages [49], and subsequently polarized into M2 cells [50]. Both monocytes and macrophages were cultured in RPMI-1640 (Gibco, #11875-093) supplemented with 10% FBS, 1% Pen/Strep, and 50 µM β-mercaptoethanol (Sigma-Aldrich, #M6250), followed by 0.22 µm filtration (Sigma, #S2GVU05RE).
All cultures were maintained in humidified incubators at 37 °C with 5% CO2, and the corresponding media were renewed every 2–3 days. Cells were plated at greater than 80% confluency, after which the MDA-MB-231 conditioned medium (CM) was prepared by 0.22 µm media filtration.

2.8. Cell Viability

The live/dead assay for EOMA cells cultured on the 2LBNC and 3LBNC scaffolds was performed according to the manufacturer’s instructions (Biotium, #30002-T). Images were captured using a Nikon Eclipse TE2000-U (Nikon, Melville, NY, USA) inverted microscope with NIS Element D 4.11.00 software. To assess the cell metabolic activity, the MTS assay (Promega, #G358A) was performed at 3, 5, 7, 10, and 15 days after injection of MDA-MB-231 cells into 2LBNC samples (Table 1). Data from cells grown in 24-well plates (8 × 10⁴ cells/well) at the same time points were used as a reference. Three biological and three technical replicates were used for comparison. Absorbance was recorded at λ = 490 nm using a spectrophotometer. Cell growth was also visualized using a TE2000-U microscope.

2.9. Triple Co-Culturing into 3LBNC Scaffolds

First, 1 × 10⁶ EA.hy926 cells were injected into the second interlayer of the 3LBNC scaffolds to confirm that the cells could be maintained within the compartments of the scaffold. Cells were maintained in standard cell culture inserts for 15 days under the same conditions as above. On days 1, 5, 10, and 15, the scaffolds were rinsed twice with 1 mL of 1X PBS, fixed with 4% paraformaldehyde for 1 h, and stained with DAPI at a dilution of 1:2000 for 30 min. Cells within the scaffold were then imaged using an inverted phase microscope (Carl Zeiss, Jena, Germany, Axio Vert. A1) and analyzed using FIJI (version 2.14.0/1.54f). For the triple co-culture, a conditioned medium (1:1) was used to prime BC-CAFs for at least two days before their seeding at the bottom of 3LBNC samples. This medium was maintained until MDA-MB-231 cells were injected into the first interlayer (Figure 1B). MSC-GRO®/DMEM (1:1) was used to replace the CM immediately after the injection. When M2 macrophages were injected into the second interlayer (Figure 1B), the system was maintained in MSC-GRO®/DMEM/RPMI-1640 (1:1:1) medium.
Confocal microscopy and gene expression analysis were performed at 1, 5, 10, and 15 days after cell seeding/injection. Samples were maintained in non-treated 24-well culture plates throughout the analysis period and were transferred to new wells on the day of media replacement. Injections were performed using a 25G 1½ inch needle (BD, Franklin Lakes, NJ, USA, #305127).

2.10. Confocal Microscopy

Red-stained (Invitrogen, #C34552) BC-CAFs were seeded at the bottom of the scaffold and incubated for 2 days prior to injecting of green-stained MDA-MB-231 cells (Invitrogen, #C7025). After an additional 2 days (4 days total since BC-CAF seeding), blue-stained M2 macrophages (Invitrogen, #C2110) were injected into the 3LBNC samples. All cell trackers were used at a concentration of 25 µM. At the appropriate time point, samples were removed, rinsed twice with 1 mL of 1× PBS, and fixed with 4% paraformaldehyde for 1 h. Samples were then washed three times in 1× PBS (5 min each), mounted with Aqua-Poly/Mount (Polysciences, Warrington, PA, USA, #18606-20), and stored at 4 °C until imaging using the ABIF Opera Phenix High Content Screening system with a 5× objective and a 20× water immersion objective, at 30 µm and 15 µm intervals, respectively.

2.11. RNA Quantification by qPCR

MDA-MB-231 and M2 cell cultures were injected into the scaffolds at intervals of 3 and 7 days, respectively, after BC-CAF seeding. RNA was extracted using TRIzol™ (ThermoFisher Scientific, #15596026) according to the manufacturer’s instructions. RNA concentration and purity were assessed using a Nanodrop spectrophotometer (ThermoFisher Scientific). Expression of breast cancer-associated genes was normalized to GAPDH and evaluated by RT-qPCR (Promega, #A6010) using three replicates per time point. The primers listed in this study (Table 2) were used at a concentration of 100 µM.

2.12. Statistical Analysis

Two-way analysis of variance (ANOVA) with Tukey’s post hoc test was used to compare multiple groups for Feret diameter. Two-way ANOVA with Šidák correction was used to compare gene expression between groups. Data are presented as the mean ± standard deviation of results from three independent experiments unless otherwise specified. p < 0.05 was considered statistically significant (* 0.01 < p < 0.05, ** 0.001 < p < 0.01, *** p < 0.001, and **** p < 0.0001). The Pearson correlation test was used to correlate individual layers. All analyses were performed using GraphPad (version 9.1.0.221).

3. Results

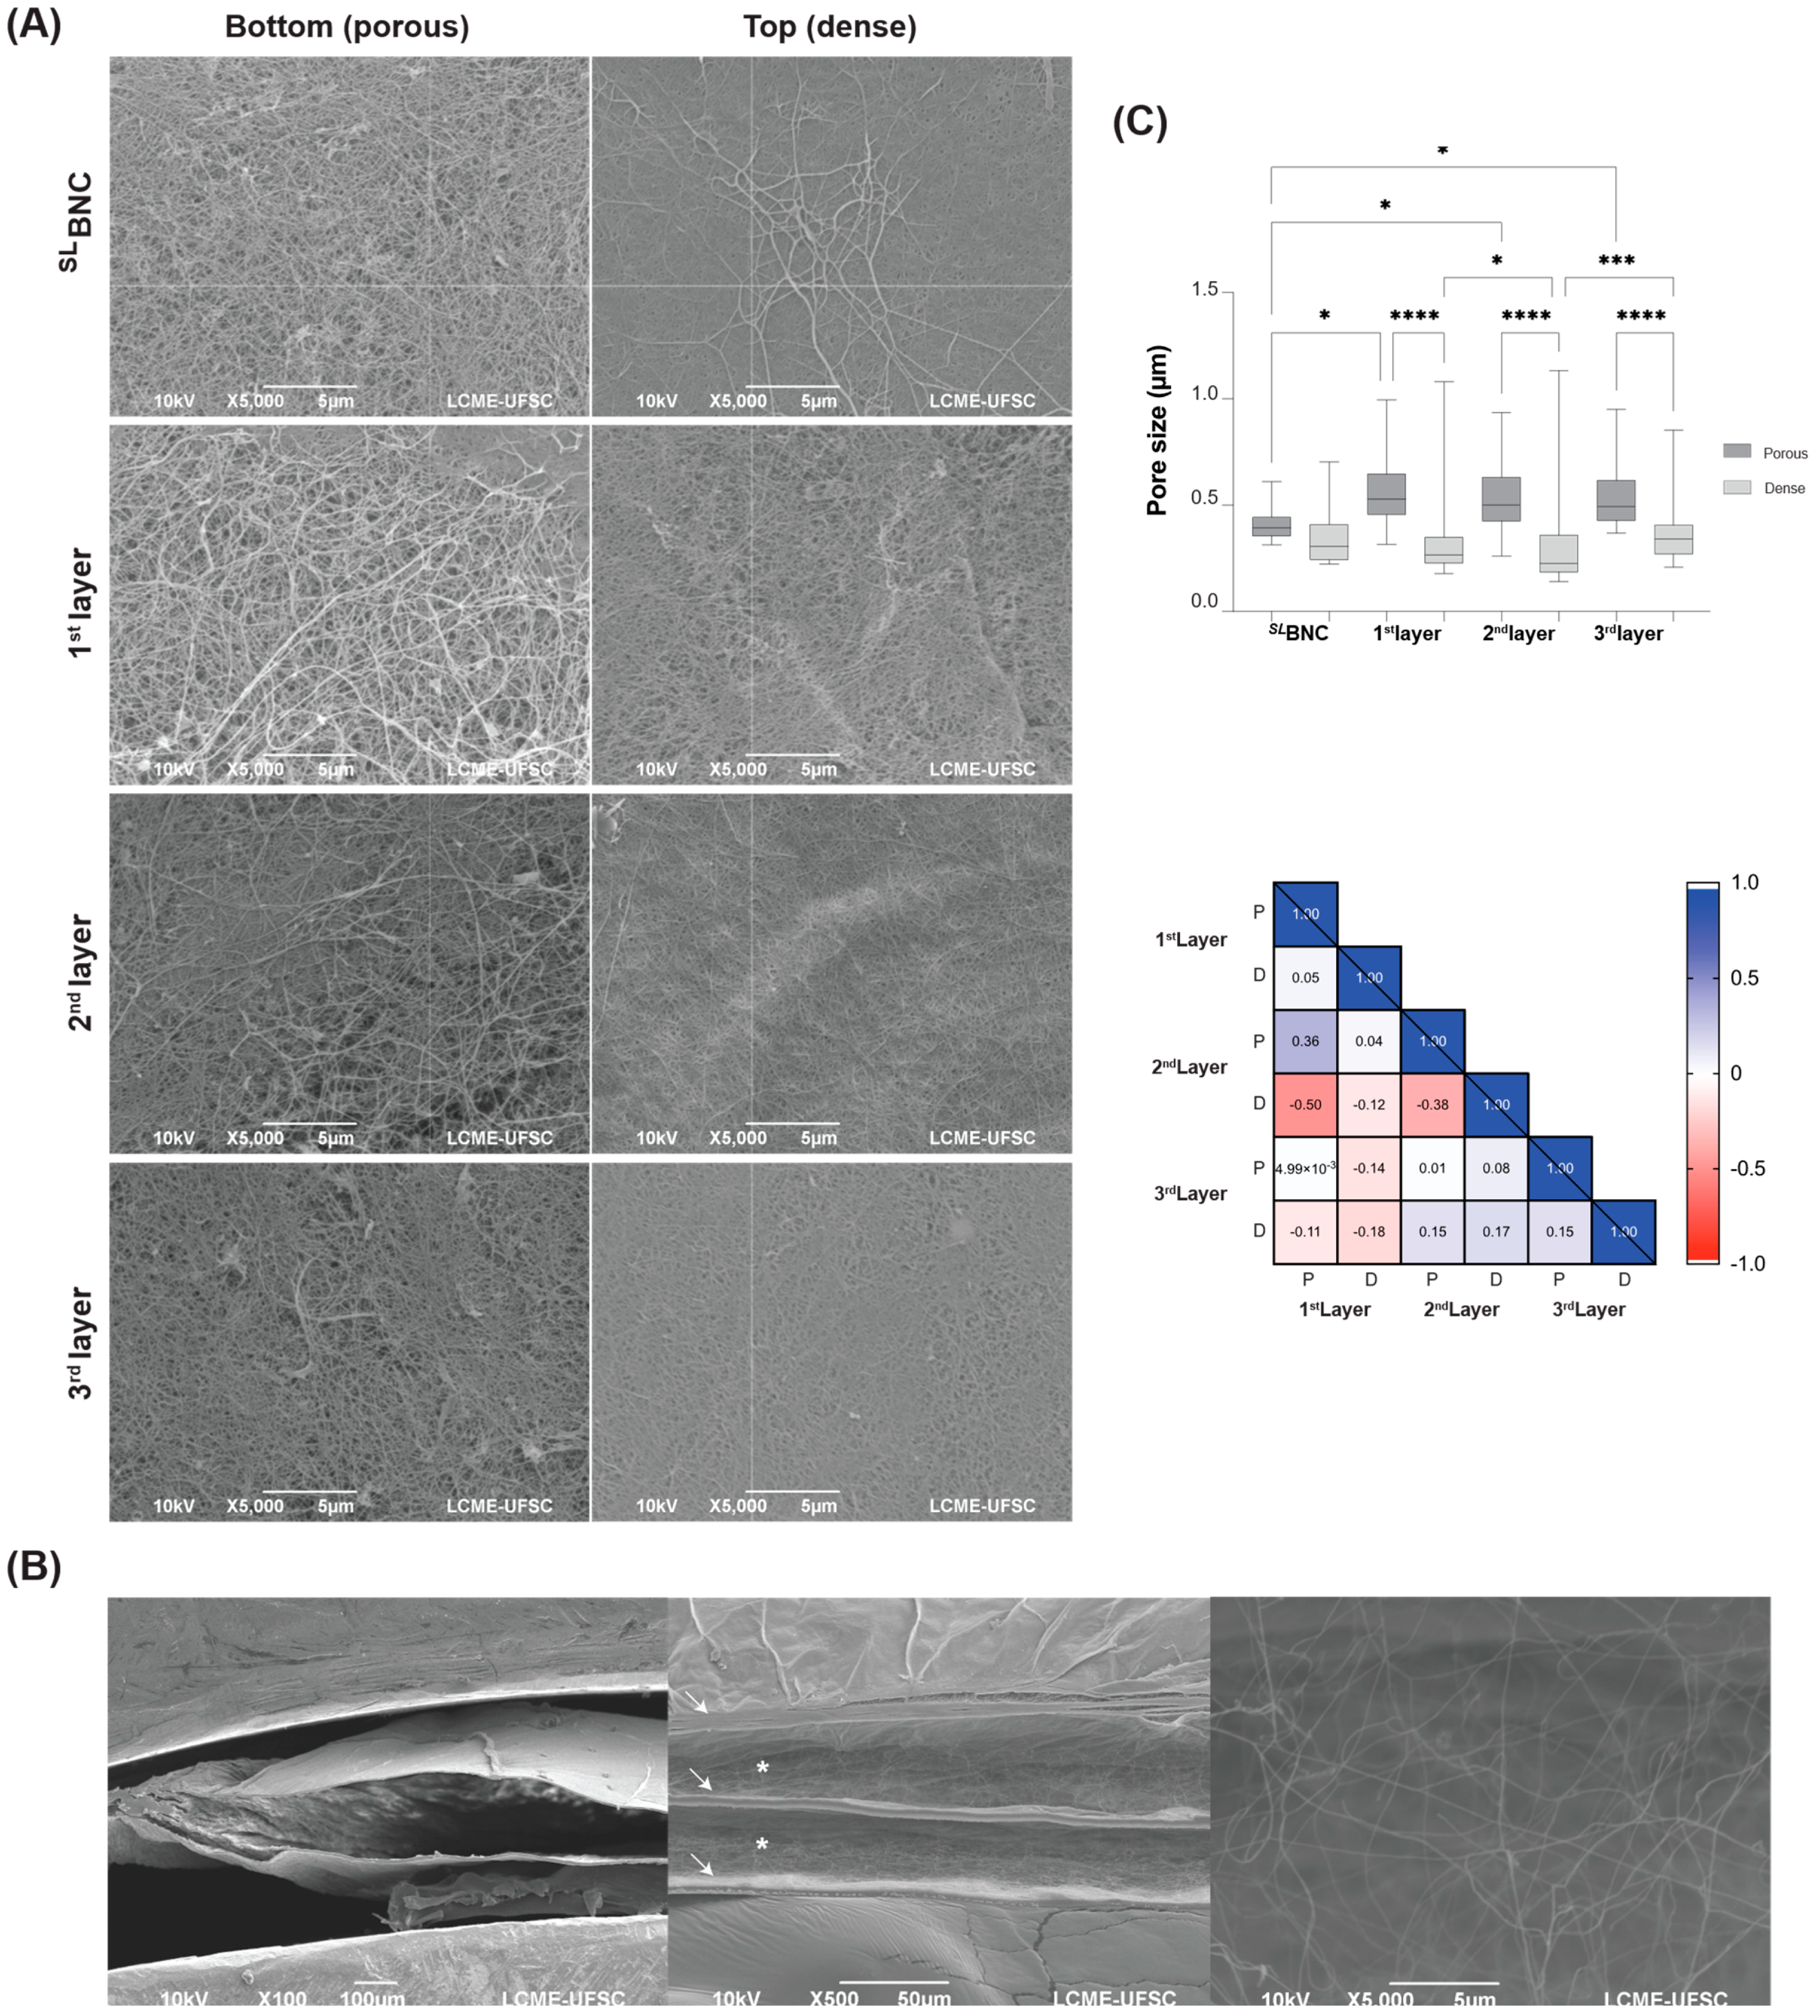
3.1. Physicochemical Properties of the 3LBNC Scaffold

The 3LBNC samples had an average thickness of 7.0385 ± 0.6146 mm. The thicknesses of the individual layers were 1.975 ± 0.298 mm, 2.030 ± 0.273 mm, and 1.979 ± 0.315 mm for the first, second, and third layers, respectively. These values are comparable to the SLBNC control, which had a thickness of 2.312 ± 0.471 mm. SEM micrographs showed different nanofiber densities, resulting in porous (bottom) and dense (top) surfaces in each individual layer, similar to the SLBNC control (Figure 2A). In addition, differences in pore sizes were observed between the surfaces of each individual layer and across different layers. However, these differences were not significantly correlated, suggesting that the fibers on both surfaces are randomly arranged on both surfaces (Figure 2B and Table S1).
Regarding the interlayers, they showed a height of 0.4157 ± 0.0396 mm and featured larger interconnected pores with an average size of 2.386 ± 0.981 µm (Figure 2C). The transparency of the SLBNC control was twice that of the 2LBNC and four times that of the 3LBNC scaffolds, 31.3 ± 4.2% vs. 14.2 ± 1.3%, respectively (Figure S1).
The rheological properties of 2LBNC and 3LBNC are reported in Table 3 and Figure S2. The 3LBNC exhibited a 75% higher stiffness (E) and a 36.5% higher storage modulus (G) compared to 2LBNC (p < 0.05), indicating that increasing the number of layers directly affects the viscoelastic properties of the scaffold.

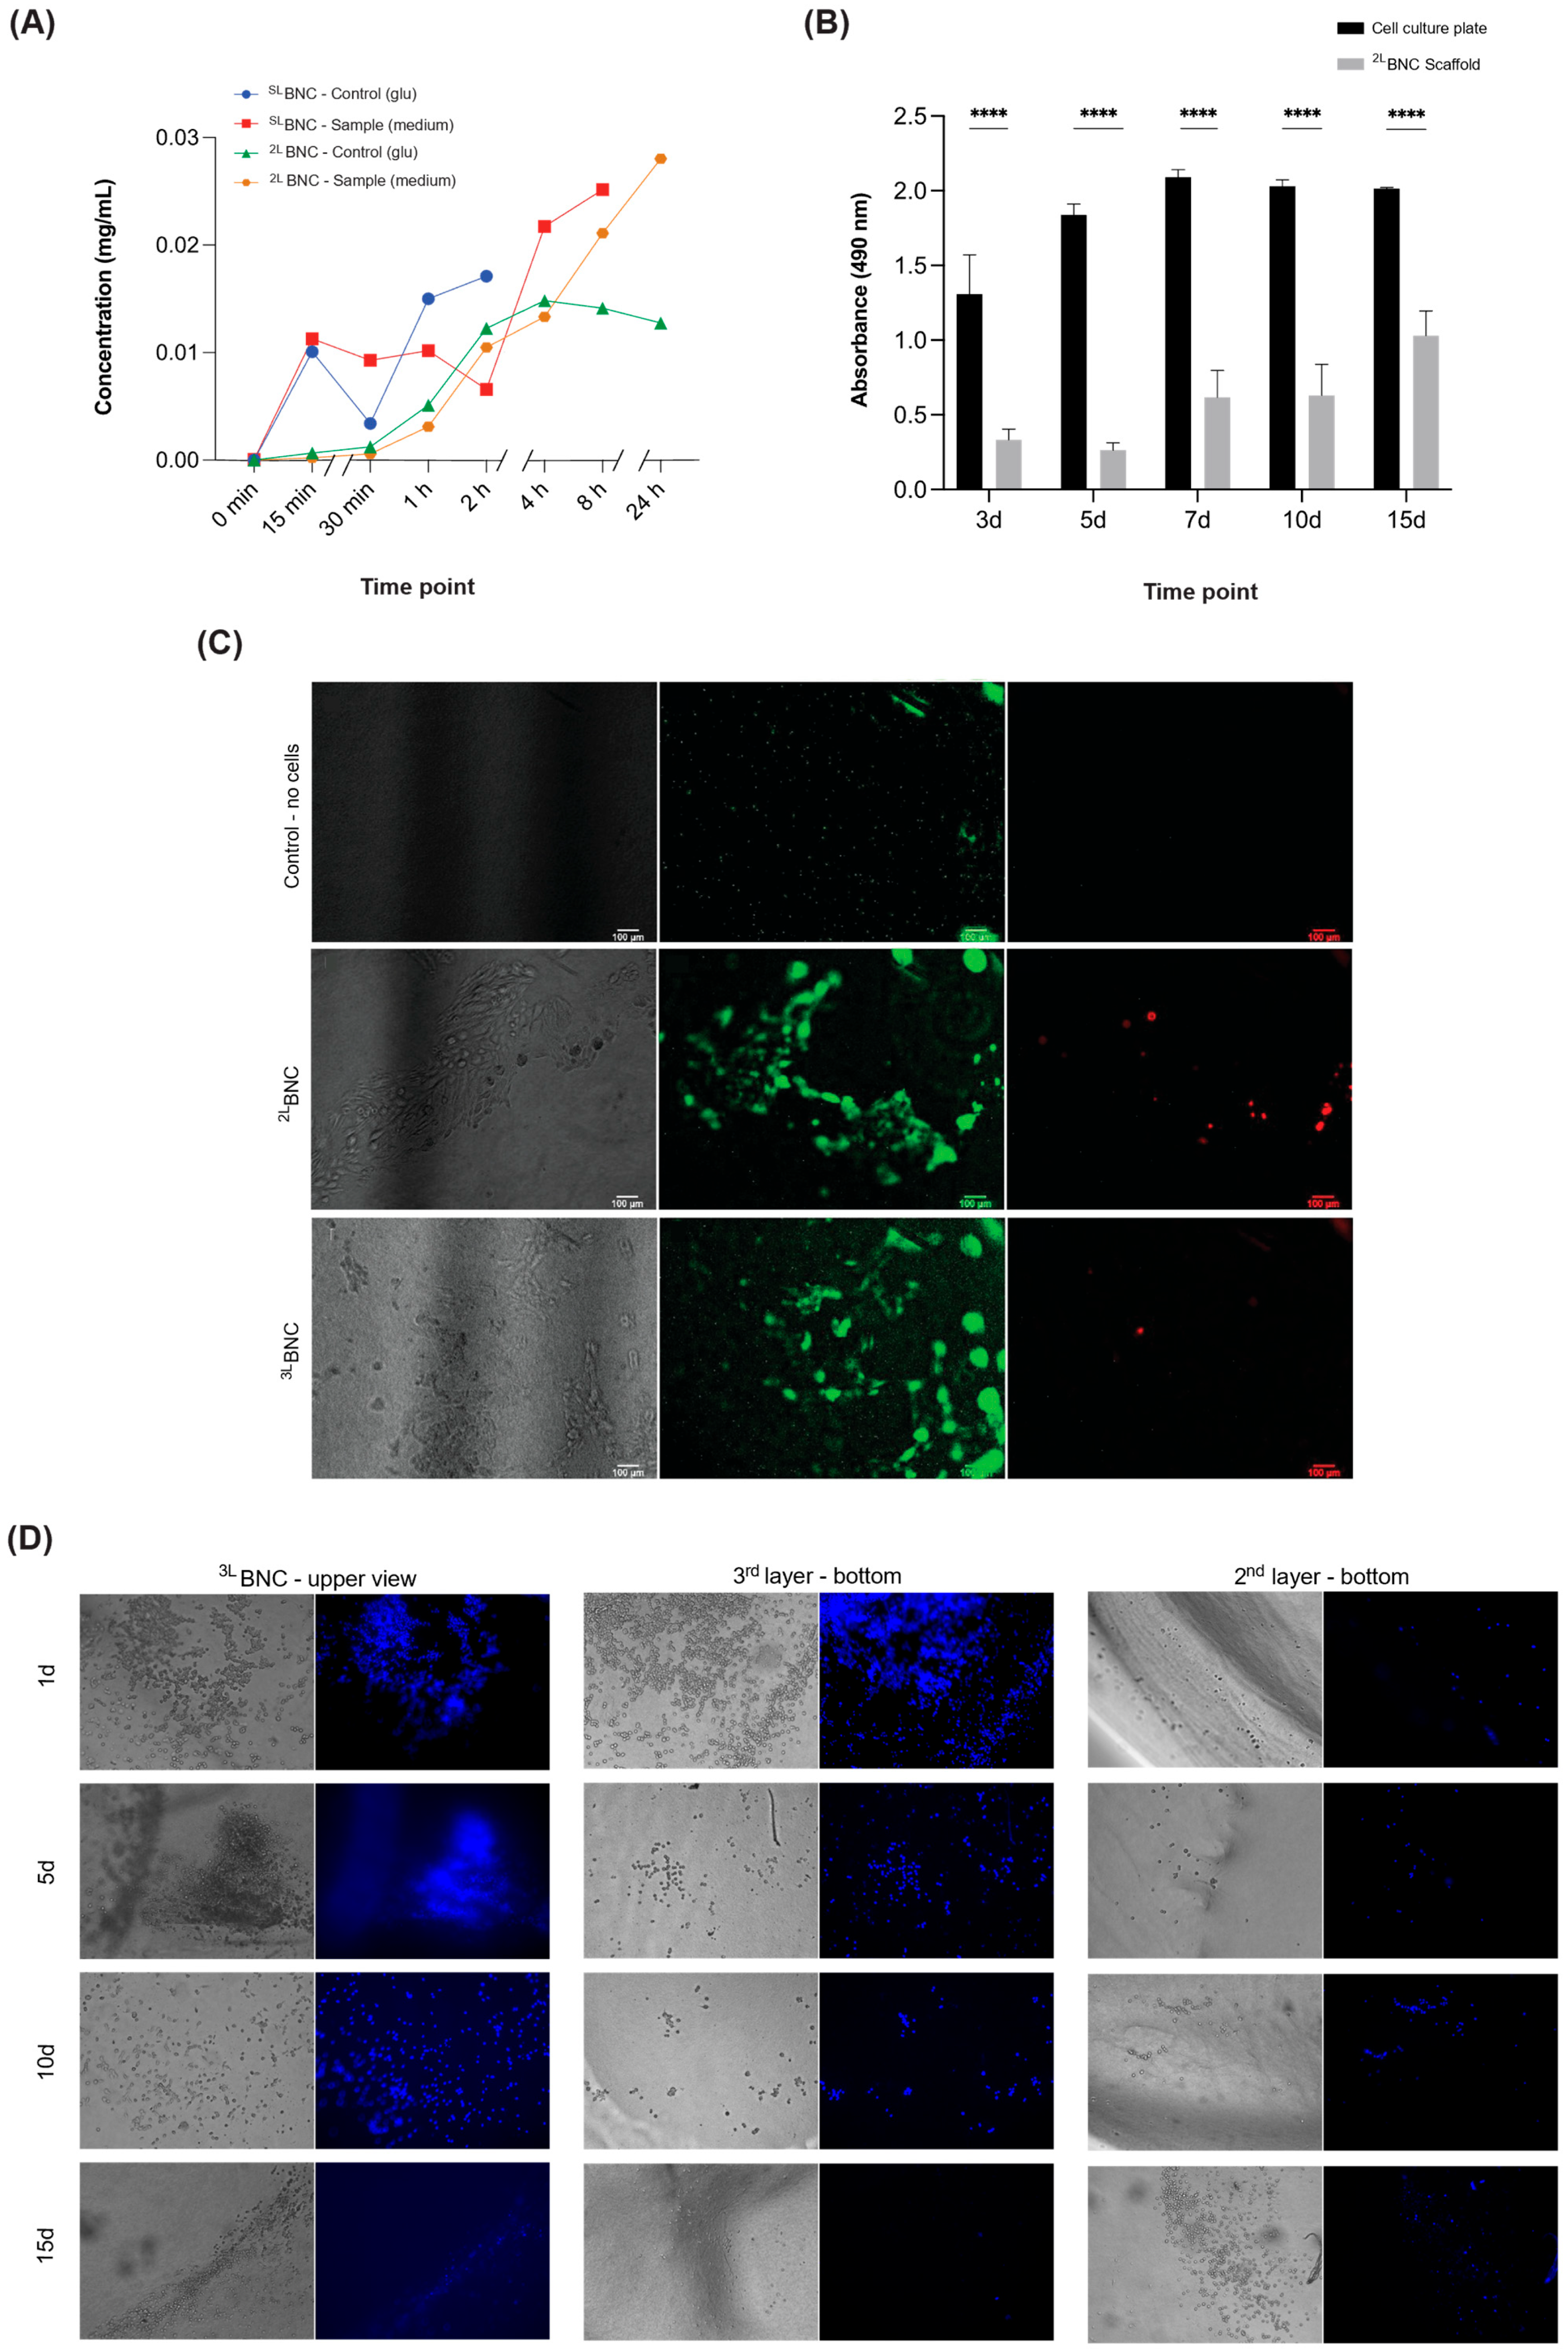
3.2. Cellular Viability and Proliferation of Cells Cultured in Layered BNC Scaffolds

It was assessed that both glucose solution and DMEM-supplemented medium can flow through the BNC scaffolds for up to 24 h (Figure 3A). EOMA cells cultured on 2LBNC or 3LBNC scaffolds were viable for up to one week (Figure 3C and Figure S3).
The MDA-MB-231 cells remained metabolically active for up to 15 days, as revealed by the MTS assay (Figure 3B). No differences in metabolic activities of cells were noticed after cell seeding/injection between days 3 and 5 or between days 7 and 10 of culture. Furthermore, for this reason, further analyses were performed after 1-, 5-, 10-, and 15-day seeding/injection of cells.
EA.hy926 cells injected in the second interlayer of the 3LBNC and imaged at the designated time points consistently showed the presence of these cells at the injected interfacial layer for the entire duration of analysis (Figure 3D and Figure S4). This was confirmed after separating the third and second layers and subsequently imaging their bottom surfaces. (p < 0.05).

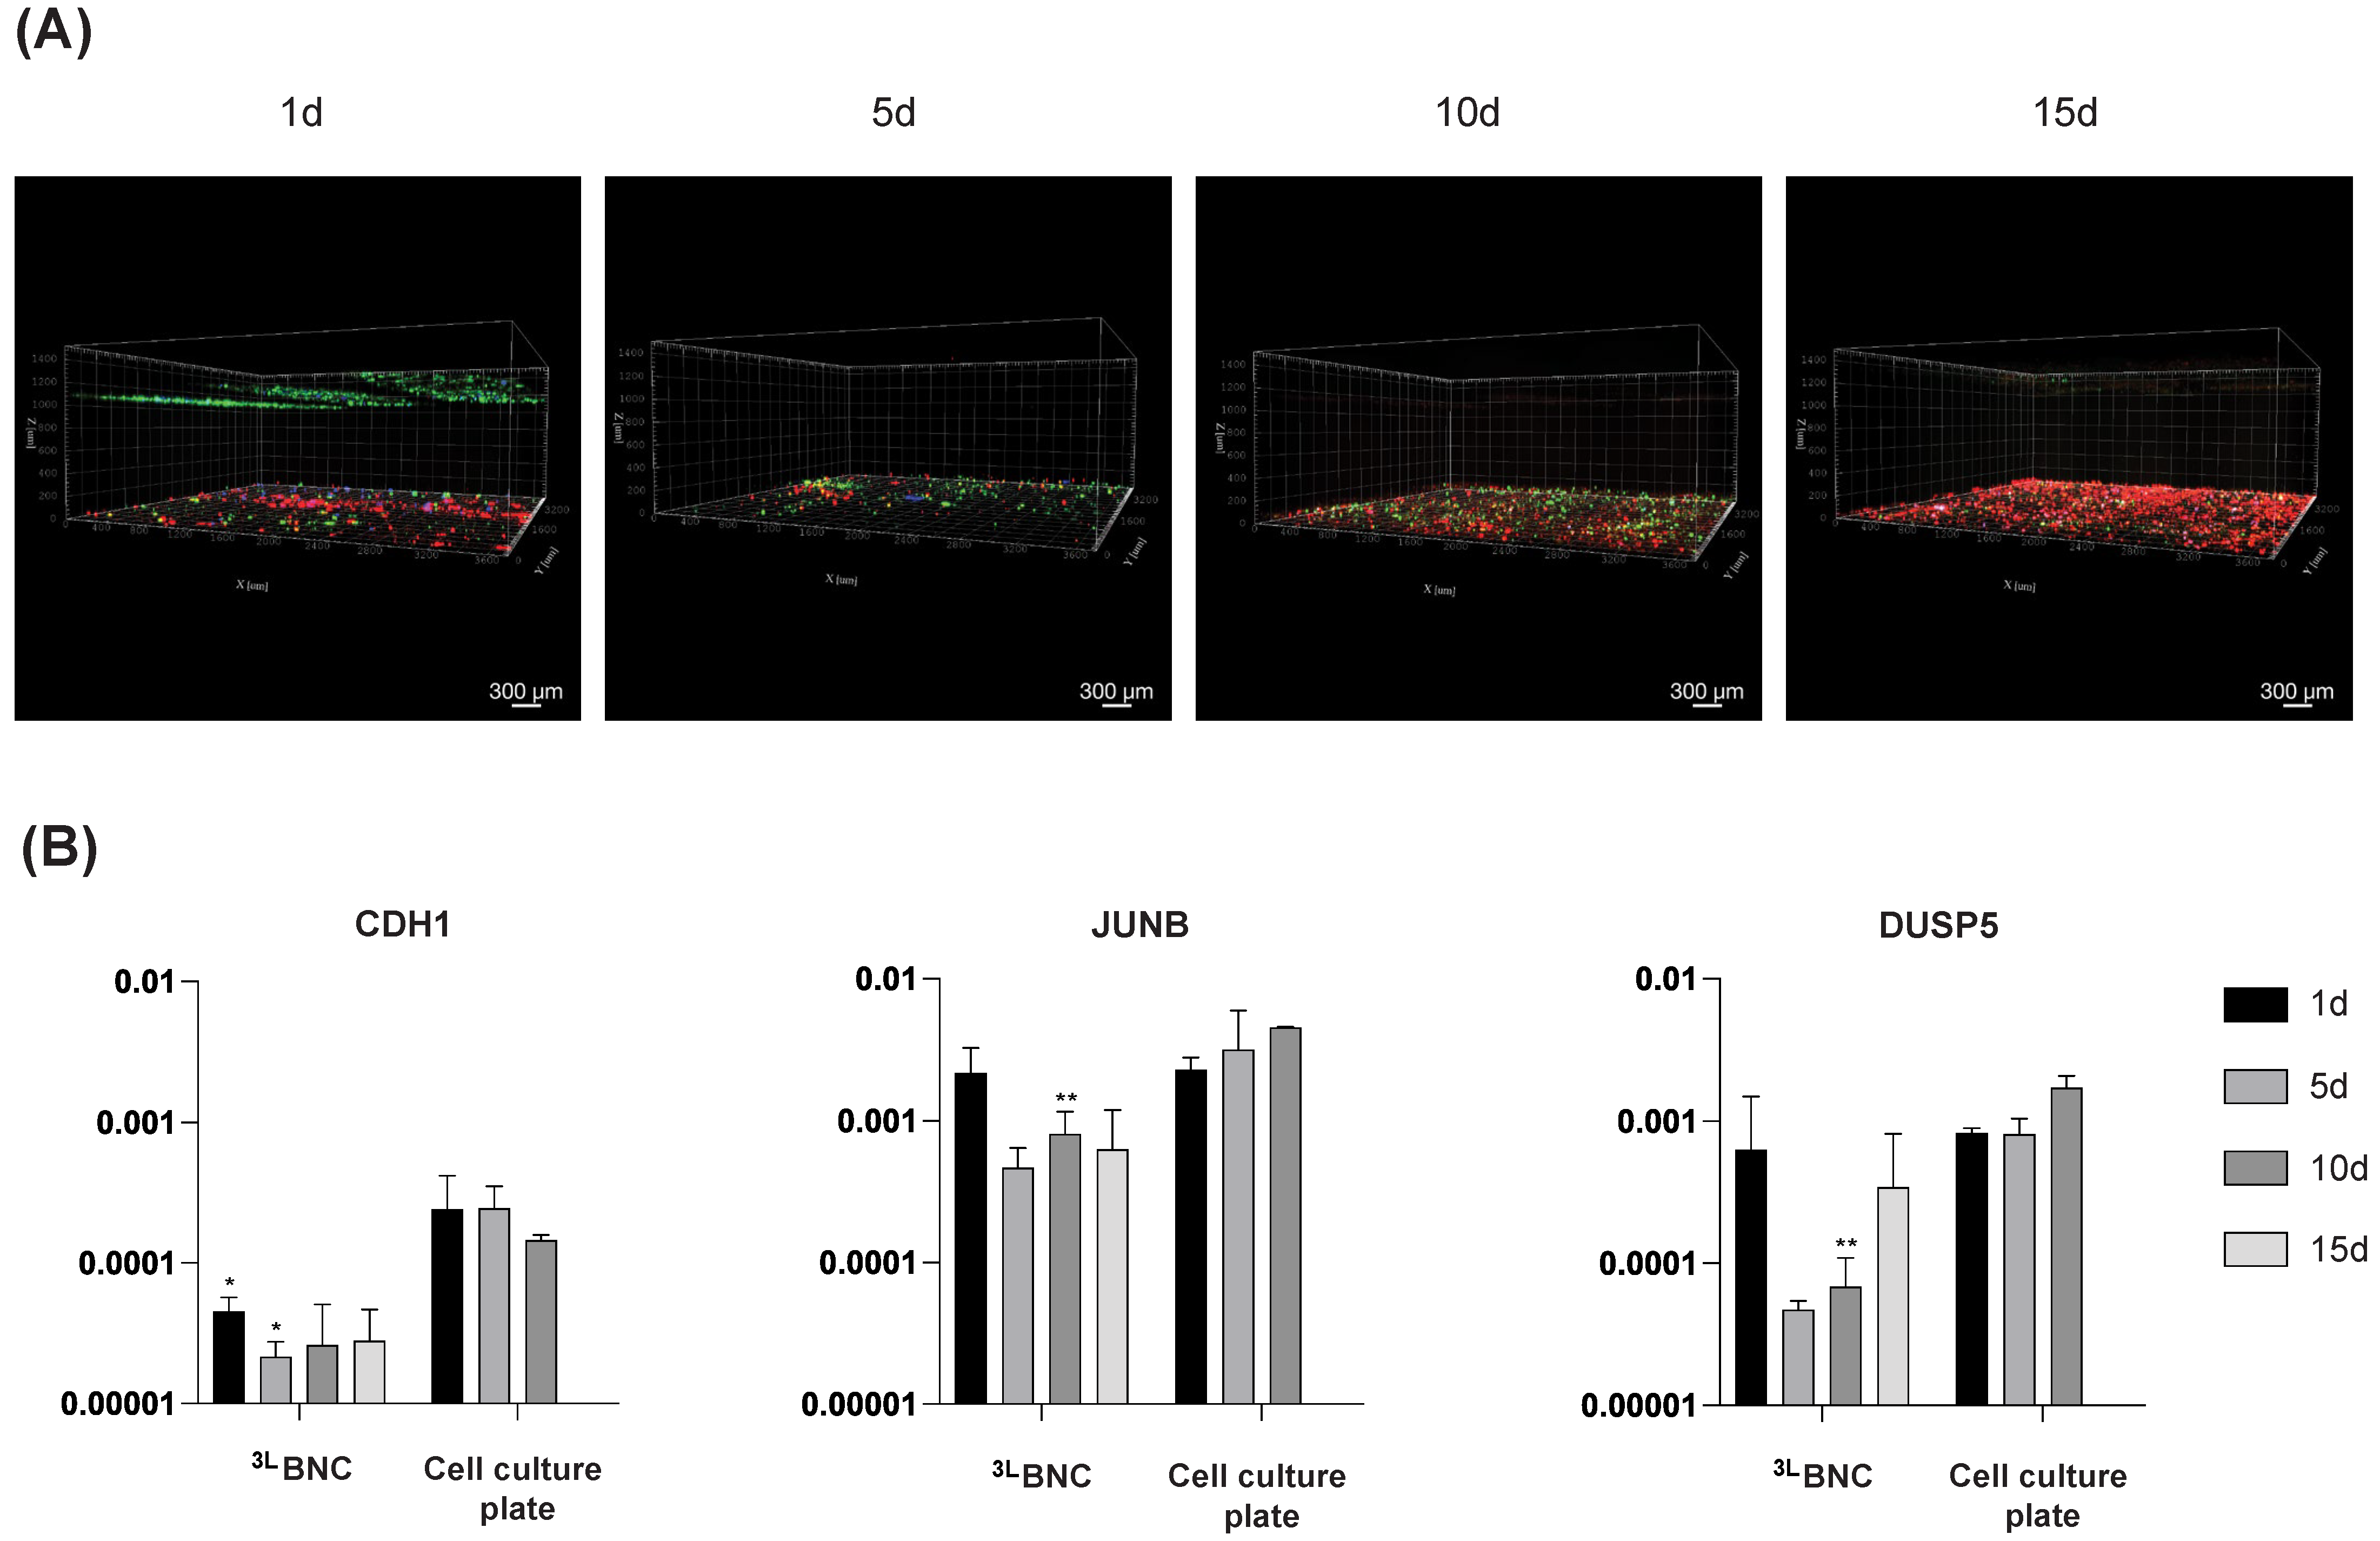
3.3. Triple-Cell Co-Culture in 3LBNC Scaffolds

The cell migration assay was performed with the triple-cell co-culture of BC-CAFs, MDA-MB-231 cells, and M2 macrophages in different compartments of 3LBNC samples. Confocal microscopy on day 1 showed that BC-CAFs and MDA-MB-231 cells remained at their respective locations (Figure 4A). In contrast, blue-stained M2 macrophages injected into the second interlayer migrated rapidly toward other cells, as indicated by the colocalization of blue, red, and green colors in the confocal images. Interestingly, at day 5, MDA-MB-231 cells migrated to the BC-CAF injected site in the bottom layer of the 3LBNC. However, M2 macrophages were not easily distinguishable. To confirm the presence of M2 in the same layer, the confocal images were filtered for the blue color corresponding to macrophage staining. Except for day 5, all images for other time points exhibited blue dots consistent with M2 macrophage presence (Figure S5).
Breast cancer gene expression was measured at each time point, and relative expression levels were normalized to GAPDH (Figure 4B and Table S2). CDH1 (E-cadherin) showed the lowest expression among all genes in the 3LBNC samples. JUNB exhibited similar expression levels between scaffolds and plates on day 1, but its expression decreased at later time points, although it remained the most highly expressed gene overall. DUSP5 expression declined by day 5, followed by a gradual increase at later time points.

4. Discussion

We fabricated a non-functionalized, triple-layered BNC (3LBNC) scaffold that enables the compartmentalized culture of cells to study intercellular interactions and signaling between primary cancer-associated fibroblasts (CAFs), the triple-negative breast cancer cell line MDA-MB-231, and M2 macrophages, each seeded or injected into separate layers. CAFs are a heterogeneous population of activated fibroblasts [51] that promote tumor cells [52,53], enhance angiogenesis [53], confer drug resistance [54], and recruit and polarize monocytes into pro-tumor M2 macrophages [55]. Macrophages, in turn, participate in almost all stages of tumor progression, and their high infiltration in breast cancer is associated with poorer prognosis [56]. The synergistic interactions and crosstalk between CAFs and M2 macrophages have been highlighted in several recent reviews [57,58].
The translucency of the 3LBNC scaffold makes it compatible with a variety of imaging modalities, allowing us to visualize the cell morphology throughout the scaffold. Using bright-field microscopy, we observed that breast cancer cells exhibited a range of shapes, from round to stellate, over the course of the observation period, consistent with the typical morphology for these cells in soft hydrogels [59]. Interestingly, distinct morphologies of the same cell line were observed when analyzed by fluorescence confocal microscopy. This observation aligns with previous reports indicating that the MDA-MB-231 cells adopt a spherical or spindle-shaped morphology depending on the scaffold’s composition and stiffness [60], and that larger rounded cells are associated with higher metastatic potential [61].
Cell morphology depended on the BNC surface to which cells were exposed [24,37] and seeding density [37]. Human umbilical vein endothelial cells and smooth muscle cells exhibited more elongated shapes when cultured on an entangled BNC surface compared to the porous surface. The effect of cell number was evident in the stellate and spindle-shaped morphologies after 1 day after seeding, likely due to the lower number of BC-CAFs used compared to the MDA-MB-231 cells. Nevertheless, the observed morphologies were consistent with previously reported patterns [62], even when cells were cultured on the underside of the BNC, which features larger pores. These findings suggest that the 3LBNC scaffold supports diverse cell morphologies across its surface and that different cell types respond uniquely to its topography. Furthermore, the morphological features of MDA-MB-231 cells in the 3LBNC scaffold are indicative of high metastatic potential.
Scaffold pore size plays a pivotal role in cell morphology [63], cell growth [64], nutrient supply [65], ECM secretion [65], cell invasion [66], and gene expression [63]. We observed significant differences in pore size between layers and interlayers. While interlayer compartments featured pores in the micrometer range, the pores within each layer were in the nanometer range. The lack of correlation between pore sizes across the layers supports the structural independence of each layer. Consequently, the scaffold effectively accommodates and compartmentalizes distinct cell populations. This was exemplified in the culture of EA.hy926 cells, which largely remained localized at the injection site, with minimal migration into other regions of the scaffold.
Similarly, the MDA-MB-231 cell line remained compartmentalized on day 1. However, over time, both the MDA-MB-231 cells and M2 macrophages migrated toward the first layer containing BC-CAFs. This behavior can be explained by several key factors.
First, the term “invasion” traditionally refers to the destructive movement of cells through a 3D barrier [67]. However, since human cells lack cellulase, the cell movement observed in our scaffold is more accurately described as “3D migration”, a non-destructive, non-proteolytic process in which cells traverse 3D tissues without degrading the matrix, as described by Kramer et al. [67].
Second, the MDA-MB-231 cells are highly motile and invasive, particularly in the presence of CAF conditioned medium, in both two- and three-dimensional environments [68]. Additionally, cell migration is further supported by the presence of different CAF subtypes, which are commonly found in primary and metastatic tumor stroma and possess varying capacities to migrate and to create a pro-tumorigenic microenvironment that facilitates cancer cell movement [69,70].
Third, M2 macrophages typically display lower adhesion and higher motility compared to classically activated macrophages [71] and they are often found near CAFs [55]. It is important to consider the source of macrophages, as their phenotype can vary significantly. The THP-1-derived macrophages used in this study may have different characteristics compared to bone marrow-derived macrophages [72]. Thus, the observed cell motility within the 3LBNC scaffold may be attributed to cell detachment and migration along signaling gradients established by the scaffold’s multilayered architecture.
Fourth, mechanical properties are also key regulators of cell migration. Cells modulate their migration speed according to substrate stiffness [73], which varies across healthy tissues [74] and is frequently altered in pathological conditions [75]. In our study, the stiffness of our scaffold increased when comparing 2LBNC and 3LBNC. This increase mirrors the mechanical characteristics of tumor-associated stroma and premalignant breast tissue [76], suggesting that the 3LBNC scaffold provides a physiologically relevant platform for studying breast tumor behavior.
Finally, pore size and interconnectivity are critical factors in cell migration. Unlike the cellular ingrowth observed for HUVEC cells in BNC hydrogels [37], confocal images of our 3LBNC system did not reveal the presence of cells within the scaffold layers, likely due to their smaller pore size compared to the interlayer compartments. Nevertheless, our findings indicate that the pore size of the 3LBNC scaffold is adequate to support nutrient diffusion and maintain cell viability within the interlayers.
Both pore size and mechanical properties influence gene expression [63,77], primarily through cell mechanosensing. To assess the impact of the 3LBNC on gene expression, we evaluated the levels of E-cadherin, JUNB, and DUSP5, three genes associated with breast cancer. E-cadherin (CDH1) encodes a cell–cell adhesion protein of the same name, and its downregulation is linked to increased invasiveness and metastasis [78,79,80,81]. MDA-MB-231 cells, a highly proliferative phenotype [82] and an E-cadherin-negative triple-negative breast cancer cell line, typically exhibit low CDH1 expression. Consistent with this phenotype, we observed lower CDH1 expression in cells cultured within 3LBNC compared to the plate-cultured controls. This suggests that the scaffold effectively recapitulates the complexity of the TME, aligning with the enhanced migratory behavior of MDA-MB-231 cells observed in our system.
The enhanced metastatic behavior of MDA-MB-231 cells cultured in 3LBNC is further supported by our findings on JUNB, a gene encoding a key AP-1 family transcription factor induced by TGF-ß [83,84]. JUNB plays a dual role in regulating cell proliferation, acting as both a promoter and an inhibitor, depending on cellular context [85]. It is also essential for breast cancer invasion, progression, and metastasis [83], and is known to be highly expressed in circulating tumor cells [86,87]. Transcriptomic analyses have previously confirmed elevated JUNB mRNA levels in the MDA-MB-231 cell line [86,87]. In our study, JUNB was the most highly expressed gene of the three genes, with expression levels approximately 16% and 10% higher than CDH1 and DUSP5, respectively. However, JUNB expression was lower in cells cultured in the 3LBNC scaffold compared to standard well plates, suggesting that the scaffold recapitulates aspects of the tumor microenvironment that influence the fine-tuned regulation of gene expression.
Finally, we evaluated DUSP5 expression due to its reported association with paclitaxel (PTX) resistance in basal-like breast cancer [88]. Dual-specificity phosphatases (DUSPs) comprise a family of 25 proteins that dephosphorylate threonine/serine residues of MAPK components and can function as either tumor suppressors or activators, depending on ERK signaling context and the specific DUSP family member [89]. In colorectal cancer, low DUSP5 expression has been linked to poor prognosis. Moreover, a positive correlation between DUSP5 and CDH1 expression suggests a role for DUSP5 in regulating epithelial–mesenchymal transition, a key process in metastasis [89]. In our study, DUSP5 exhibited intermediate expression relative to JUNB and CDH1, and its expression was lower in cells cultured in the 3LBNC scaffold compared to conventional plate culture, further supporting the scaffold’s ability to replicate features of the in vivo tumor microenvironment.
It is important to note that the RNA yield extracted from cells cultured in BNC scaffolds was approximately three times lower than that obtained from cells cultured in standard well plates. This reduction is attributable to the hydrogel nature of BNC, which has a water-holding capacity of up to 99% [24,90]. In our study, the SLBNC and 2LBNC scaffolds exhibited swelling degrees of approximately 86% and 200%, respectively. This high swelling capacity hinders the complete release of hydrophilic molecules, such as RNA, thereby complicating downstream molecular analyses. As a result, gene expression studies involving BNC scaffolds are often omitted in the literature.

5. Conclusions

This work lays the foundation for using triple-layered bacterial nanocellulose scaffolds as customizable, multifunctional platforms for modeling complex tumor microenvironments. We demonstrated that this translucent scaffold exhibits mechanical properties comparable to those of tumor-associated stroma and supports the compartmentalized co-culture of breast cancer cells, M2 macrophages, and cancer-associated fibroblasts. This design enabled spatially controlled co-culture and dynamic analysis of cell migration, offering a more physiologically relevant 3D model that overcomes key limitations of conventional transwell-based migration assays.
Differential expression of key metastasis-associated genes (CDH1, JUNB, and DUSP5) confirmed the scaffold’s ability to recapitulate important molecular features of the tumor microenvironment. Additionally, the scaffold’s optical transparency allowed for morphological assessment and real-time visualization of cell–cell interactions, typically not possible with standard in vitro systems.
The potential for chemical functionalization and structural customization further expands the scaffold’s utility in drug discovery and therapeutic development. While the aim here was to develop an in vitro model for mimicking the tumor microenvironment, its translucid properties also open avenues for investigating photosensitive treatments, such as cancer photothermal and photodynamic therapies. It is worth noting that bacterial nanocellulose is a biocompatible and scalable material already utilized in FDA-approved biomedical devices, such as wound dressings. This precedent may facilitate future regulatory translation, particularly if the scaffold is adapted for use in diagnostics, in therapeutic testing platforms, or as a 3D construct for in vivo applications.

Supplementary Materials

The following supporting information can be downloaded at: https://www.mdpi.com/article/10.3390/jfb16060208/s1, Figure S1: Image of SLBNC control and 3LBNC scaffolds acquired by a stereoscope; Figure S2: Graphs presenting rheology properties of the BNC scaffolds form which the average Young’s modulus-E, Storage modulus–G’. Loss modulus-G” are calculated. n = 3 for each sample, except for Storage and Loss modulus of individual layers; Figure S3: Live/Dead assay of one-week EOMA cells culture into the 2LBNC (A) and into 3LBNC (B) scaffolds at two different densities (1 × 10⁴ and 1 × 10⁵ cells); Figure S4: EA.hy926 cultured in the 3LBNC Scaffolds; Figure S5: Images of M2 macrophages alone (first column) in comparison with their presence with all other cells simultaneously (second column) at different time-points: MDA-MB-231 in green, BC-CAFs in red and M2 macrophages in blue. Magnification 20×; Table S1: Feret diameter (µm) of porous and dense surfaces of each layer of 3LBNC scaffolds and SLBNC control; Table S2: Nanodrop results from RNA extraction by Trizol of cells grown in 3LBNC Scaffold and cell culture plates. NC: negative control–no cells.

Author Contributions

Conceptualization, K.P.V.d.O., L.M.P. and M.T.; Methodology, K.P.V.d.O., M.Y.Y. and M.T.; Validation, K.P.V.d.O., A.P.A.B., L.M.P. and M.T.; Formal analysis, K.P.V.d.O., A.P.A.B. and M.T.; Investigation, K.P.V.d.O., M.Y.Y. and S.C.N.M.; Resources, L.M.P., A.P.A.B. and M.T.; Data curation, K.P.V.d.O. and M.T.; Writing—original draft, K.P.V.d.O. and M.T.; Writing—review & editing, A.P.A.B., L.M.P. and M.T.; Visualization, K.P.V.d.O., M.Y.Y. and M.T.; Supervision, L.M.P. and M.T.; Project administration, M.T.; Funding acquisition, K.P.V.d.O., L.M.P. and M.T. All authors have read and agreed to the published version of the manuscript.

Funding

This study was financed by the Coordenação de Aperfeiçoamento de Pessoal de Nível Superior—Brasil (Capes)—Finance Code 001 and by the Canadian Institutes of Health Research and Canada Research Chair in Regenerative medicine and Nanomedicine awarded to M.T.

Institutional Review Board Statement

Not applicable.

Informed Consent Statement

Not applicable.

Data Availability Statement

The original contributions presented in this study are included in the article and Supplementary Materials. Further inquiries can be directed to the corresponding author.

Acknowledgments

The authors thank the Laboratory of Food Physical Properties (Profi/UFSC); the Central Laboratory of Electron Microscopy (LCME/UFSC); the Electrical Materials Laboratory (LAMATE/UFSC); and the Multiusers Lab in Biological Studies (LAMEB) in Brazil for their involvement in the characterization of the BNC samples. From McGill University, the authors acknowledge Guangyu Bao from Mongeau’s Research Group, Emily Buck from Cerruti’s group, and Galenvs Science Inc. for their assistance with rheology, macrophage experiments, and gene expression analysis, respectively, and Celine Agnes and Mariam Saad for proofreading of the manuscript.

Conflicts of Interest

All authors declare that they have no conflicts of interest. EA.hy929 experiments were performed at EMBRAPA, under approval of A.P.A.B. The company has no conflict of interest on this work.

References

  1. Muiznieks, L.D.; Keeley, F.W. Molecular assembly and mechanical properties of the extracellular matrix: A fibrous protein perspective. Biochim. Biophys. Acta 2013, 1832, 866–875. [Google Scholar] [CrossRef] [PubMed]
  2. Karamanos, N.K.; Theocharis, A.D.; Piperigkou, Z.; Manou, D.; Passi, A.; Skandalis, S.S.; Vynios, D.H.; Orian-Rousseau, V.; Ricard-Blum, S.; Schmelzer, C.E.H. A guide to the composition and functions of the extracellular matrix. FEBS J. 2021, 288, 6850–6912. [Google Scholar] [CrossRef] [PubMed]
  3. Frantz, C.; Stewart, K.M.; Weaver, V.M. The extracellular matrix at a glance. J. Cell Sci. 2010, 123, 4195–4200. [Google Scholar] [CrossRef] [PubMed]
  4. Filipe, E.C.; Chitty, J.L.; Cox, T.R. Charting the unexplored extracellular matrix in cancer. Int. J. Exp. Pathol. 2018, 99, 58–76. [Google Scholar] [CrossRef]
  5. Armingol, E.; Officer, A.; Harismendy, O.; Lewis, N.E. Deciphering cell–cell interactions and communication from gene expression. Nat. Rev. Genet. 2021, 22, 71–88. [Google Scholar] [CrossRef]
  6. Herrmann, D.; Conway, J.R.W.; Vennin, C.; Magenau, A.; Hughes, W.G.; Morton, J.P.; Timpson, P. Three-dimensional cancer models mimic cell-matrix interactions in the tumour microenvironment. Carcinogenesis 2014, 35, 1671–1679. [Google Scholar] [CrossRef]
  7. Schwartz, M.A.; Chen, C.S. Deconstructing Dimensionality. Cell Biol. 2013, 339, 402–405. [Google Scholar] [CrossRef]
  8. Najafi, M.; Farhood, B.; Mortezaee, K. Extracellular matrix (ECM) stiffness and degradation as cancer drivers. J. Cell Biochem. 2019, 120, 2782–2790. [Google Scholar] [CrossRef]
  9. Duval, K.; Grover, H.; Han, L.H.; Mou, Y.; Pegoraro, A.F.; Fredberg, J.; Chen, Z. Modeling physiological events in 2D vs. 3D cell culture. Physiology 2017, 32, 266–277. [Google Scholar] [CrossRef]
  10. Jensen, C.; Teng, Y. Is It Time to Start Transitioning From 2D to 3D Cell Culture? Front. Mol. Biosci. 2020, 7, 33. [Google Scholar] [CrossRef]
  11. Breslin, S.; Driscoll, L.O. The relevance of using 3D cell cultures, in addition to 2D monolayer cultures, when evaluating breast cancer drug sensitivity and resistance. Oncotarget 2016, 7, 45745–45756. [Google Scholar] [CrossRef] [PubMed]
  12. Fontoura, J.C.; Viezzer, C.; dos Santos, F.G.; Ligabue, R.A.; Weinlich, R.; Puga, R.D.; Antonow, D.; Severino, P.; Bonorino, C. Comparison of 2D and 3D cell culture models for cell growth, gene expression and drug resistance. Mater. Sci. Eng. C 2020, 107, 110264. [Google Scholar] [CrossRef] [PubMed]
  13. Fitzgerald, K.A.; Malhotra, M.; Curtin, C.M.; O’Brien, F.J.; O’Driscoll, C.M. Life in 3D is never flat: 3D models to optimise drug delivery. J. Control. Release 2015, 215, 39–54. [Google Scholar] [CrossRef] [PubMed]
  14. Monferrer, E.; Martín-Vañó, S.; Carretero, A.; García-Lizarribar, A.; Burgos-Panadero, R.; Navarro, S.; Samitier, J.; Noguera, R. A three-dimensional bioprinted model to evaluate the effect of stiffness on neuroblastoma cell cluster dynamics and behavior. Sci. Rep. 2020, 10, 6370. [Google Scholar] [CrossRef]
  15. Moghimi, N.; Hosseini, S.A.; Dalan, A.B.; Mohammadrezaei, D.; Goldman, A.; Kohandel, M. Controlled tumor heterogeneity in a co-culture system by 3D bio-printed tumor-on-chip model. Sci. Rep. 2023, 13, 13648. [Google Scholar] [CrossRef]
  16. Larracuente, A.M.; Ferree, P.M. Simple method for fluorescence DNA in situ hybridization to squashed chromosomes. J. Vis. Exp. 2015, 95, 52288. [Google Scholar] [CrossRef]
  17. Saji Joseph, J.; Tebogo Malindisa, S.; Ntwasa, M. Two-Dimensional (2D) and Three-Dimensional (3D) Cell Culturing in Drug Discovery. In Cell Culture; IntechOpen: London, UK, 2019. [Google Scholar] [CrossRef]
  18. Loh, Q.L.; Choong, C. Three-dimensional scaffolds for tissue engineering applications: Role of porosity and pore size. Tissue Eng. Part. B Rev. 2013, 19, 485–502. [Google Scholar] [CrossRef]
  19. Rana, D.; Arulkumar, S.; Vishwakarma, A.; Ramalingam, M. Considerations on Designing Scaffold for Tissue Engineering. In Stem Cell Biology and Tissue Engineering in Dental Sciences; Elsevier Inc.: Amsterdam, The Netherlands, 2015. [Google Scholar] [CrossRef]
  20. Sultana, N. Mechanical and biological properties of scaffold materials. In Functional 3D Tissue Engineering Scaffolds: Materials, Technologies, and Applications; Elsevier: Amsterdam, The Netherlands, 2018; pp. 1–21. [Google Scholar] [CrossRef]
  21. Caliari, S.R.; Burdick, J.A. A practical guide to hydrogels for cell culture. Nat. Methods 2016, 13, 405–414. [Google Scholar] [CrossRef]
  22. González-Díaz, E.C.; Varghese, S. Hydrogels as Extracellular Matrix Analogs. Gels 2016, 2, 20. [Google Scholar] [CrossRef]
  23. Padrão, J.; Melro, L.; Fernandes, M.; Fernandes, R.D.V.; Ribeiro, A.I.; Song, X.; Yu, L.; Zille, A. Biocompatibility of Nanocellulose. In Handbook of Biopolymers; Thomas, S., Ar, A., Chirayil, C.J., Thomas, B., Eds.; Springer: Singapore, 2023; Volume 1, pp. 975–1006. [Google Scholar]
  24. Bäckdahl, H.; Helenius, G.; Bodin, A.; Nannmark, U.; Johansson, B.R.; Risberg, B.; Gatenholm, P. Mechanical properties of bacterial cellulose and interactions with smooth muscle cells. Biomaterials 2006, 27, 2141–2149. [Google Scholar] [CrossRef]
  25. Bown, A.J. The Chemical Action of Pure Cultivation of Bacterium Aceti. J. Chem. Soc. Trans. 1886, 49, 172–187. [Google Scholar]
  26. Ryngajłło, M.; Kubiak, K.; Jędrzejczak-Krzepkowska, M.; Jacek, P.; Bielecki, S. Comparative genomics of the Komagataeibacter strains—Efficient bionanocellulose producers. Microbiologyopen 2019, 8, e00731. [Google Scholar] [CrossRef] [PubMed]
  27. Čolić, M.; Tomić, S.; Bekić, M. Immunological aspects of nanocellulose. Immunol. Lett. 2020, 222, 80–89. [Google Scholar] [CrossRef] [PubMed]
  28. Xue, Y.; Mou, Z.; Xiao, H. Nanocellulose as a sustainable biomass material: Structure, properties, present status and future prospects in biomedical applications. Nanoscale 2017, 9, 14758–14781. [Google Scholar] [CrossRef]
  29. Rebelo, A.R.; Archer, A.J.; Chen, X.; Liu, C.; Yang, G.; Liu, Y. Dehydration of bacterial cellulose and the water content effects on its viscoelastic and electrochemical properties. Sci. Technol. Adv. Mater. 2018, 19, 203–211. [Google Scholar] [CrossRef]
  30. Aditya, T.; Allain, J.P.; Jaramillo, C.; Restrepo, A.M. Surface Modification of Bacterial Cellulose for Biomedical Applications. Int. J. Mol. Sci. 2022, 23, 610. [Google Scholar] [CrossRef]
  31. Shah, N.; Ul-Islam, M.; Khattak, W.A.; Park, J.K. Overview of bacterial cellulose composites: A multipurpose advanced material. Carbohydr. Polym. 2013, 98, 1585–1598. [Google Scholar] [CrossRef]
  32. Reis, E.M.; Berti, F.V.; Colla, G.; Porto, L.M. Bacterial nanocellulose-IKVAV hydrogel matrix modulates melanoma tumor cell adhesion and proliferation and induces vasculogenic mimicry in vitro. J. Biomed. Mater. Res. Part B 2017, 106, 2741–2749. [Google Scholar] [CrossRef]
  33. Innala, M.; Riebe, I.; Kuzmenko, V.; Sundberg, J.; Gatenholm, P.; Hanse, E.; Johannesson, S. 3D Culturing and differentiation of SH-SY5Y neuroblastoma cells on bacterial nanocellulose scaffolds. Artif. Cells Nanomed. Biotechnol. 2013, 42, 302–308. [Google Scholar] [CrossRef]
  34. Martínez Ávila, H.; Feldmann, E.M.; Pleumeekers, M.M.; Nimeskern, L.; Kuo, W.; de Jong, W.C.; Schwarz, S.; Müller, R.; Hendriks, J.; Rotter, N.; et al. Novel bilayer bacterial nanocellulose scaffold supports neocartilage formation in vitro and in vivo. Biomaterials 2015, 44, 122–133. [Google Scholar] [CrossRef]
  35. Reshmy, R.; Philip, E.; Thomas, D.; Madhavan, A.; Sindhu, R.; Binod, P.; Varjani, S.; Awasthi, M.K.; Pandley, A. Bacterial nanocellulose: Engineering, production, and applications. Bioengineered 2021, 12, 11463–11483. [Google Scholar] [CrossRef]
  36. Gama, F.M.; Gatenholm, P.; Klemm, D. Bacterial NanoCellulose: A Sophisticated Multifunctional Material; CRC Press: Boca Raton, FL, USA, 2016. [Google Scholar]
  37. Berti, F.V.; Rambo, C.R.; Dias, P.F.; Porto, L.M. Nanofiber density determines endothelial cell behavior on hydrogel matrix. Mater. Sci. Eng. C 2013, 33, 4684–4691. [Google Scholar] [CrossRef] [PubMed]
  38. Oliveira, C.R.D.; Carvalho, J.L.; Novikoff, S.; Berti, F.V.; Porto, L.M.; Assis, D.; de Goes, A.M. Bacterial Cellulose Membranes Constitute Biocompatible Biomaterials for Mesenchymal and Induced Pluripotent Stem Cell Culture and Tissue Engineering. J. Tissue Sci. Eng. 2012, 11, 5. [Google Scholar] [CrossRef]
  39. Hu, Y.; Catchmark, J.M.; Zhu, Y.; Abidi, N.; Zhou, X.; Wang, J.; Liang, N. Engineering of porous bacterial cellulose toward human fi broblasts ingrowth for tissue engineering. J. Mater. Res. 2014, 29, 2682–2693. [Google Scholar] [CrossRef]
  40. Mastrodimos, M.; Jain, S.; Badv, M.; Shen, J.; Montazerian, H.; Meyer, C.E.; Annabi, N.; Weiss, P.S. Human Skeletal Muscle Myoblast Culture in Aligned Bacterial Nanocellulose and Commercial Matrices. ACS Appl. Mater. Interfaces 2024, 16, 47150–47162. [Google Scholar] [CrossRef]
  41. Schmidt, B.V.K.J. Multicompartment Hydrogels. Macromol. Rapid Commun. 2022, 43, 2100895. [Google Scholar] [CrossRef]
  42. Meng, Y.; Giannini Beillon, G.; Lauby, M.; Elharar, I.; Schoefs, B.; Marchand, J.; Nicol, E. Triphasic hydrogel for cell co-culture in compartmentalized all-liquid micro-bioreactor. Algal Res. 2024, 84, 103803. [Google Scholar] [CrossRef]
  43. Jedrusik, N.; Meyen, C.; Finkenzeller, G.; Stark, G.B.; Meskath, S.; Schulz, S.D.; Steinberg, T.; Eberwein, P.; Strassburg, S.; Tomakidi, P. Nanofibered Gelatin-Based Nonwoven Elasticity Promotes Epithelial Histogenesis. Adv. Healthc. Mater. 2018, 7, 1700895. [Google Scholar] [CrossRef]
  44. Taymour, R.; Chicaiza-Cabezas, N.A.; Gelinsky, M.; Lode, A. Core-shell bioprinting of vascularized in vitro liver sinusoid models. Biofabrication 2022, 14, 045019. [Google Scholar] [CrossRef]
  45. Vinson, B.T.; Phamduy, T.B.; Shipman, J.; Riggs, B.; Strong, A.L.; Sklare, S.C.; Murfee, W.L.; Burow, M.E.; Bunnell, B.A.; Huang, Y.; et al. Laser direct-write based fabrication of a spatially-defined, biomimetic construct as a potential model for breast cancer cell invasion into adipose tissue. Biofabrication 2017, 9, 025013. [Google Scholar] [CrossRef]
  46. Souza, S.S.d.; Berti, F.V.; Oliveira, K.P.V.d.; Pittella, C.Q.P.; Castro, J.V.d.; Pelissari, C.; Rambo, C.R.; Porto, L.M. Nanocellulose biosynthesis by Komagataeibacter hansenii in a defined minimal culture medium. Cellulose 2018, 4, 1641–1655. [Google Scholar] [CrossRef]
  47. Saito, H.; Sakurai, A.; Sakakibara, M.; Saga, H. Preparation and properties of transparent cellulose hydrogels. J. Appl. Polym. Sci. 2003, 90, 3020–3025. [Google Scholar] [CrossRef]
  48. Papenburg, B.J.; Vogelaar, L.; Bolhuis-Versteeg, L.A.M.; Lammertink, R.G.H.; Stamatialis, D.; Wessling, M. One-step fabrication of porous micropatterned scaffolds to control cell behavior. Biomaterials 2007, 28, 1998–2009. [Google Scholar] [CrossRef] [PubMed]
  49. Lund, M.E.; To, J.; O’Brien, B.A.; Donnelly, S. The choice of phorbol 12-myristate 13-acetate differentiation protocol influences the response of THP-1 macrophages to a pro-inflammatory stimulus. J. Immunol. Methods 2016, 430, 64–70. [Google Scholar] [CrossRef]
  50. Genin, M.; Clement, F.; Fattaccioli, A.; Raes, M.; Michiels, C. M1 and M2 macrophages derived from THP-1 cells differentially modulate the response of cancer cells to etoposide. BMC Cancer 2015, 15, 577. [Google Scholar] [CrossRef]
  51. Sugimoto, H.; Mundel, T.M.; Kieran, M.W.; Kalluri, R. Identification of fibroblast heterogeneity in the tumor microenvironment. Cancer Biol. Ther. 2006, 5, 1640–1646. [Google Scholar] [CrossRef]
  52. Liu, T.; Lin, B.; Qin, J. Carcinoma-associated fibroblasts promoted tumor spheroid invasion on a microfluidic 3D co-culture device. Lab. Chip 2010, 10, 1671–1677. [Google Scholar] [CrossRef]
  53. Eiro, N.; González, L.; Martínez-Ordoñez, A.; Fernandez-Garcia, B.; González, L.O.; Cid, S.; Dominguez, F.; Perez-Fernandez, R.; Vizoso, F.J. Cancer-associated fibroblasts affect breast cancer cell gene expression, invasion and angiogenesis. Cell. Oncol. 2018, 41, 369–378. [Google Scholar] [CrossRef]
  54. Wei, L.; Ye, H.; Li, G.; Lu, Y.; Zhou, Q.; Zheng, S.; Lin, Q.; Liu, Y.; Li, Z.; Chen, R. Cancer-associated fibroblasts promote progression and gemcitabine resistance via the SDF-1/SATB-1 pathway in pancreatic cancer. Cell Death Dis. 2018, 9, 1065. [Google Scholar] [CrossRef]
  55. Yavuz, B.G.; Gunaydin, G.; Gedik, M.E.; Kosemehmetoglu, K.; Karakoc, D.; Ozgur, F.; Guc, D. Cancer associated fibroblasts sculpt tumour microenvironment by recruiting monocytes and inducing immunosuppressive PD-1 + TAMs. Sci. Rep. 2019, 9, 1–15. [Google Scholar]
  56. Noy, R.; Pollard, J.W. Tumor-Associated Macrophages: From Mechanisms to Therapy. Immunity 2014, 41, 49–61. [Google Scholar] [CrossRef] [PubMed]
  57. Ireland, L.V.; Mielgo, A. Macrophages and fibroblasts, key players in cancer chemoresistance. Front. Cell Dev. Biol. 2018, 6, 131. [Google Scholar] [CrossRef] [PubMed]
  58. An, Y.; Liu, F.; Chen, Y.; Yang, Q. Crosstalk between cancer-associated fibroblasts and immune cells in cancer. J. Cell Mol. Med. 2020, 24, 13–24. [Google Scholar] [CrossRef] [PubMed]
  59. Rehfeldt, F.; Engler, A.J.; Eckhardt, A.; Ahmed, F.; Discher, D.E. Cell responses to the mechanochemical microenvironment-Implications for regenerative medicine and drug delivery. Adv. Drug Deliv. Rev. 2007, 59, 1329–1339. [Google Scholar] [CrossRef]
  60. Peter, M.; Singh, A.; Mohankumar, K.; Jeenger, R.; Joge, P.A.; Gatne, M.M.; Tayalia, P. Gelatin-Based Matrices as a Tunable Platform to Study in Vitro and in Vivo 3D Cell Invasion. ACS Appl. Bio Mater. 2019, 2, 916–929. [Google Scholar] [CrossRef]
  61. Wu, P.H.; Gilkes, D.M.; Phillip, J.M.; Narkar, A.; Cheng, T.W.T.; Marchand, J.; Lee, M.H.; Li, R.; Wirtz, D. Single-cell morphology encodes metastatic potential. Sci. Adv. 2020, 6, eaaw6938. [Google Scholar] [CrossRef]
  62. Gascard, P.; Tlsty, T.D. Carcinoma-associated fibroblasts: Orchestrating the composition of malignancy. Genes. Dev. 2016, 30, 1002–1019. [Google Scholar] [CrossRef]
  63. Matsiko, A.; Gleeson, J.P.; O’Brien, F.J. Scaffold mean pore size influences mesenchymal stem cell chondrogenic differentiation and matrix deposition. Tissue Eng. Part. A 2015, 21, 486–497. [Google Scholar] [CrossRef]
  64. Whang, K.; Ph, D.; Healy, K.E.; Ph, D.; Elenz, D.R.; Nam, E.K. Engineering Bone Regeneration with Bioabsorbable Scaffolds with Novel Microarchitecture. Tissue Eng. 1999, 5, 35–51. [Google Scholar] [CrossRef]
  65. Lien, S.; Ko, L.; Huang, T. Effect of pore size on ECM secretion and cell growth in gelatin scaffold for articular cartilage tissue engineering. Acta Biomater. 2009, 5, 670–679. [Google Scholar] [CrossRef]
  66. Tien, J.; Ghani, U.; Dance, Y.W.; Seibel, A.J.; Karakan, M.Ç.; Ekinci, K.L.; Nelson, C.M. Matrix Pore Size Governs Escape of Human Breast Cancer Cells from a Microtumor to an Empty Cavity. iScience 2020, 23, 101673. [Google Scholar] [CrossRef] [PubMed]
  67. Kramer, N.; Walzl, A.; Unger, C.; Rosner, M.; Krupitza, G.; Hengstschläger, M.; Dolznig, H. In vitro cell migration and invasion assays. Mutat. Res. Rev. Mutat. Res. 2013, 752, 10–24. [Google Scholar] [CrossRef] [PubMed]
  68. Dvorak, K.M.; Pettee, K.M.; Rubinic-Minotti, K.; Su, R.; Nestor-Kalinoski, A.; Eisenmann, K.M. Carcinoma associated fibroblasts (CAFs) promote breast cancer motility by suppressing mammalian Diaphanous-related formin-2 (mDia2). PLoS ONE 2018, 13, e0195278. [Google Scholar] [CrossRef] [PubMed]
  69. Duda, D.G.; Duyverman, A.M.M.J.; Kohno, M.; Snuderl, M.; Steller, E.J.A.; Fukumura, D.; Jain, R.K. Malignant cells facilitate lung metastasis by bringing their own soil. Proc. Natl. Acad. Sci. USA 2010, 107, 21677–21682. [Google Scholar] [CrossRef]
  70. McCarthy, J.B.; El-Ashry, D.; Turley, E.A. Hyaluronan, cancer-associated fibroblasts and the tumor microenvironment in malignant progression. Front. Cell Dev. Biol. 2018, 6, 48. [Google Scholar]
  71. Cui, K.; Ardell, C.L.; Podolnikova, N.P.; Yakubenko, V.P. Distinct migratory properties of M1, M2, and resident macrophages are regulated by αdβ2and αmβ2integrin-mediated adhesion. Front. Immunol. 2018, 9, 2650. [Google Scholar] [CrossRef]
  72. Tedesco, S.; De Majo, F.; Kim, J.; Trenti, A.; Trevisi, L.; Fadini, G.P.; Bolego, C.; Zandstra, P.W.; Cignarella, A.; Vitiello, L. Convenience versus biological significance: Are PMA-differentiated THP-1 cells a reliable substitute for blood-derived macrophages when studying in vitro polarization? Front. Pharmacol. 2018, 9, 200747. [Google Scholar] [CrossRef]
  73. Kashani, A.S.; Packirisamy, M. Cancer cells optimize elasticity for efficient migration: Migratory index. R. Soc. Open Sci. 2020, 7, 200747. [Google Scholar] [CrossRef]
  74. Gefen, A.; Dilmoney, B. Mechanics of the normal woman’s breast. Technol. Health Care 2007, 15, 259–271. [Google Scholar] [CrossRef]
  75. Bahcecioglu, G.; Basara, G.; Ellis, B.W.; Ren, X.; Zorlutuna, P. Breast cancer models: Engineering the tumor microenvironment. Acta Biomater. 2020, 106, 1–21. [Google Scholar] [CrossRef]
  76. Levental, K.R.; Yu, H.; Kass, L.; Lakins, J.N.; Egeblad, M.; Erler, J.T.; Fong, S.F.T.; Csiszar, K.; Giaccia, A.; Weninger, W.; et al. Matrix Crosslinking Forces Tumor Progression by Enhancing Integrin Signaling. Cell 2009, 139, 891–906. [Google Scholar] [CrossRef] [PubMed]
  77. Zigon-Branc, S.; Markovic, M.; Van Hoorick, J.; Van Vlierberghe, S.; Dubruel, P.; Zerobin, E.; Baudis, S.; Ovsianikov, A. Impact of Hydrogel Stiffness on Differentiation of Human Adipose-Derived Stem Cell Microspheroids Sara. Tissue Eng. Part A 2019, 25, 1369–1380. [Google Scholar] [CrossRef] [PubMed]
  78. Sarrió, D.; Palacios, J.; Hergueta-Redondo, M.; Gómez-López, G.; Cano, A.; Moreno-Bueno, G. Functional characterization of E- and P-cadherin in invasive breast cancer cells. BMC Cancer 2009, 9, 74. [Google Scholar] [CrossRef] [PubMed]
  79. Eslami Amirabadi, H.; Tuerlings, M.; Hollestelle, A.; SahebAli, S.; Luttge, R.; van Donkelaar, C.C.; Martens, J.W.M.; den Toonder, J.M.J. Characterizing the invasion of different breast cancer cell lines with distinct E-cadherin status in 3D using a microfluidic system. Biomed. Microdevices 2019, 21, 101. [Google Scholar] [CrossRef]
  80. Mbalaviele, G.; Dunstan, C.R.; Sasaki, A.; Williams, P.J.; Mundy, G.R.; Yoneda, T. E-cadherin expression in human breast cancer cells suppresses the development of osteolytic bone metastases in an experimental metastasis model. Cancer Res. 1996, 56, 4063–4070. [Google Scholar]
  81. Huang, Z.; Yu, P.; Tang, J. Characterization of triple-negative breast cancer MDA-MB-231 cell spheroid model. OncoTargets Ther. 2020, 13, 5395–5405. [Google Scholar] [CrossRef]
  82. Russo, G.C.; Karl, M.N.; Clark, D.; Cui, J.; Carney, R.; Su, B.; Starich, B.; Lih, T.S.; Zhang, Q.; Wu, P.H.; et al. E-cadherin promotes cell hyper-proliferation in breast cancer. bioRxiv 2020. [Google Scholar] [CrossRef]
  83. Sundqvist, A.; Morikawa, M.; Ren, J.; Vasilaki, E.; Kawasaki, N.; Kobayashi, M.; Koinuma, D.; Aburatani, H.; Miyazono, K.; Heldin, C.-H.; et al. JUNB governs a feed-forward network of TGFβ signaling that aggravates breast cancer invasion. Nucleic Acids Res. 2018, 46, 1180–1195. [Google Scholar] [CrossRef]
  84. Pang, M.F.; Georgoudaki, A.-M.; Lambut, L.; Johansson, J.; Tabor, V.; Hagikura, K.; Jin, Y.; Jansson, M.; Alexander, J.S.; Nelson, C.M.; et al. TGF-β1-induced EMT promotes targeted migration of breast cancer cells through the lymphatic system by the activation of CCR7/CCL21-mediated chemotaxis. Oncogene 2016, 35, 748–760. [Google Scholar] [CrossRef]
  85. Piechaczyk, M.; Farràs, R. Regulation and function of JunB in cell proliferation. In Biochemical Society Transactions; Portland Press: South Portland, ME, USA, 2008; Volume 36, pp. 864–867. [Google Scholar]
  86. Kallergi, G.; Tsintari, V.; Sfakianakis, S.; Bei, E.; Lagoudaki, E.; Koutsopoulos, A.; Zacharopoulou, N.; Alkahtani, S.; Alarif, S.; Stournaras, C.; et al. The prognostic value of JUNB-positive CTCs in metastatic breast cancer: From bioinformatics to phenotypic characterization. Breast Cancer Res. 2019, 21, 86. [Google Scholar] [CrossRef]
  87. Shi, Y.; Ye, P.; Long, X. Differential Expression Profiles of the Transcriptome in Breast Cancer Cell Lines Revealed by Next Generation Sequencing. Cell. Physiol. Biochem. 2017, 44, 804–816. [Google Scholar] [CrossRef] [PubMed]
  88. Liu, T.; Sun, H.; Liu, S.; Yang, Z.; Li, L.; Yao, N.; Cheng, S.; Dong, X.; Liang, X.; Chen, C.; et al. The suppression of DUSP5 expression correlates with paclitaxel resistance and poor prognosis in basal-like breast cancer. Int. J. Med. Sci. 2018, 15, 738–747. [Google Scholar] [CrossRef] [PubMed]
  89. Yan, X.; Liu, L.; Li, H.; Huang, L.; Yin, M.; Pan, C.; Qin, H.; Jin, Z. Dual Specificity Phosphatase 5 Is a Novel Prognostic Indicator for Patients with Advanced Colorectal Cancer. Am. J. Cancer Res. 2016, 6, 2323. [Google Scholar] [PubMed]
  90. Klemm, D.; Schumann, D.; Udhardt, U.; Marsch, S. Bacterial synthesized cellulose—Artificial blood vessels for microsurgery. Prog. Polym. Sci. 2001, 26, 1561–1603. [Google Scholar] [CrossRef]
Figure 1. Schematic of 3LBNC scaffold fabrication and triple-cell co-culture. (A) Three-layer structure after 21 days of incubation in DMCM. (B) Cell injection/seeding protocol into each interfacial layer of 3LBNC scaffold for confocal microscopy analysis. A total of 9.4 × 10⁴ BC-CAFs were seeded under the first layer, then 2 × 10⁶ MDA-MB-231 and 9.3 × 10⁴ M2 macrophages were injected into the first and the second interlayer, respectively.
Jfb 16 00208 g001
Figure 2. Microstructure and pore size of 3LBNC scaffolds. (A) SEM micrographs of individual layers of 3LBNC compared to the SLBNC control showing a more porous structure for the bottom layer (5000×). (B) Cross-section of 3LBNC showing layers (arrows) and interlayers (*) at 100×, 500×, and 5000× magnification. (C) Feret diameter of the 3LBNC-derived individual layers compared to SLBNC and Pearson’s correlation matrix of individual layers’ surfaces: P: porous; D: dense. n = 1 for SLBNC, and n = 3 for layers. * 0.01 < p < 0.05, *** p < 0.001, and **** p < 0.0001.
Jfb 16 00208 g002
Figure 3. Evaluation of cell culturing into layered scaffolds. (A) Diffusion assay in 2LBNC compared to SLBNC. DMEM tested and compared to glucose solution in both scaffolds. (B) Cell proliferation (MTS) assay with MDA-MB-231 in 2LBNC samples and in 2D cell culture plate (2 × 10⁶ cells/scaffold 3D culture and 8 × 10⁴ cells/well 2D culture). One-way ANOVA (p < 0.05) with n = 9. (C) Live/dead assay with EOMA cells after one-week cell culture in the 2LBNC and 3LBNC scaffolds (live cells in green, dead cells in red, merged images in last column, scale bars: 100 µm). (D) DAPI assay of EA.hy926 cultured in second interlayer of 3LBNC scaffolds for up to 15 days. Samples remained inside inserts to avoid lateral cell migration; from left to right: top view of entire scaffold, bottom view of third and second layers. **** p < 0.0001.
Jfb 16 00208 g003
Figure 4. Triple-cell co-culture in 3LBNC scaffold. (A) Three-dimensional confocal microscopy of cells seeded/injected into 3LBNC at different time points: MDA-MB-231 in green, BC-CAFs in red, M2 macrophages in blue. (B) CDH1, JUNB, and DUSP5 gene expression relative to GAPDH. The 15-day time point plate-grown cells was not tested. Asterisks refer to statistical significance of cells cultured in the 3LBNC versus cells cultured on the plates (* 0.01 < p < 0.05, ** 0.001 < p < 0.01).
Jfb 16 00208 g004
Table 1. Description of BNC stacked multilayered scaffolds and analysis for each.
AnalysisSLBNC2LBNC3LBNCIndividual LayersType of Cell: Number
Single-Layer (Control)
(7 Days Incubation)
Double-Layer
(14 Days Incubation)
Triple-Layer
(21 Days Incubation)
When Applicable
Physical CharacterizationThicknessn/an/a
Transparencyn/an/a
Pore sizen/an/a
Nutrient transportn/an/an/a
Rheologyn/an/an/a
Biological
Characterization
Cell viabilityn/an/aEOMA: 104 and 105
Cell metabolic activityn/an/an/aMDA-MB-231: 2 × 10⁶
Cell migrationn/an/an/aEA.hy926: 106
Confocal microscopyn/an/an/aBC-CAFs: 9 × 10⁴
MDA-MB-231: 2 × 10⁶
M2: 4 × 10⁵
Gene expressionn/an/an/aBC-CAFs: 9 × 10⁴
MDA-MB-231: 2 × 10⁶
M2: 4 × 10⁴
√: measurements and analysis performed; n/a: not applicable.
Table 2. List of primers and genes of interest.
NCBI IDGeneForward/
Reverse
Sequence (5′ → 3′)StartEnd
NM_002046.7GAPDHFCACCCACTCCTCCACCTTTG943963
RCCACCACCCTGTTGCTGTAG10521032
NM_002229.3JUNBFTTCAAGGAGGAACCGCAGAC10011021
RTGAGCGTCTTCACCTTGTCC11961176
NM_004419.4DUSP5FCCAACTTTGGCTTCATGGGC11201140
RGCTCAGTGTCTGCAAATGGC12531233
Z13009.1CDH1 *FGGTCTCTCTCACCACCTCCA14831503
RGGATGTGATTTCCTGGCCCA16151595
* Also known as E-cadherin.
Table 3. Scaffolds’ rheological properties.
1st Layer2nd Layer3rd Layer2LBNC3LBNC
Young’s Module—E (Pa)569.67 ± 515.39869.34 ± 366.51927.44 ± 102.29183.61 ± 85.22723.68 ± 306.53
Storage Modulus—G’ (Pa)712.36 ± 0.00 a1756.44 ± 0.00 a382.66 ± 0.00 a2067.95 ± 237.983257.93 ± 450.07
Loss Modulus—G” (Pa)125.74 ± 0.00 a219.17 ± 0.00 a53.64 ± 0.00 a309.21 ± 6.93540.28 ± 66.09
a Tests performed in only one sample. Different letters indicate significant differences.
Disclaimer/Publisher’s Note: The statements, opinions and data contained in all publications are solely those of the individual author(s) and contributor(s) and not of MDPI and/or the editor(s). MDPI and/or the editor(s) disclaim responsibility for any injury to people or property resulting from any ideas, methods, instructions or products referred to in the content.

