Binding Costs in Processing Efficiency as Determinants of Cognitive Ability


Abstract
:1. Introduction
1.1. Mental Speed as a Cognitive Ability and Its Measurement
1.2. Correlations of Performance on ECTs with Cognitive Abilities
1.3. Working Memory Capacity and Complexity in ECTs
1.4. The Present Study
- (1)
- increasing binding requirements results in higher task complexity which would be reflected by more effortful information processing in the difficult conditions of each ECT as contrasted with the easier conditions (slower response times, lower accuracies, and lower diffusion model drift rates);
- (2)
- as binding requirements were manipulated in each ECT, this constitutes an analogous increase in WM requirements. In turn, this constitutes a WMC-related communality which can be modeled as a specific factor across tasks;
- (3)
- the WMC-related specific factor is incrementally predictive of cognitive ability over and above basal speed. This implies that the predictiveness of complex ECTs is partly driven by WMC contributions to performance.
2. Methods and Materials
2.1. Participants and Procedure
2.2. Measures
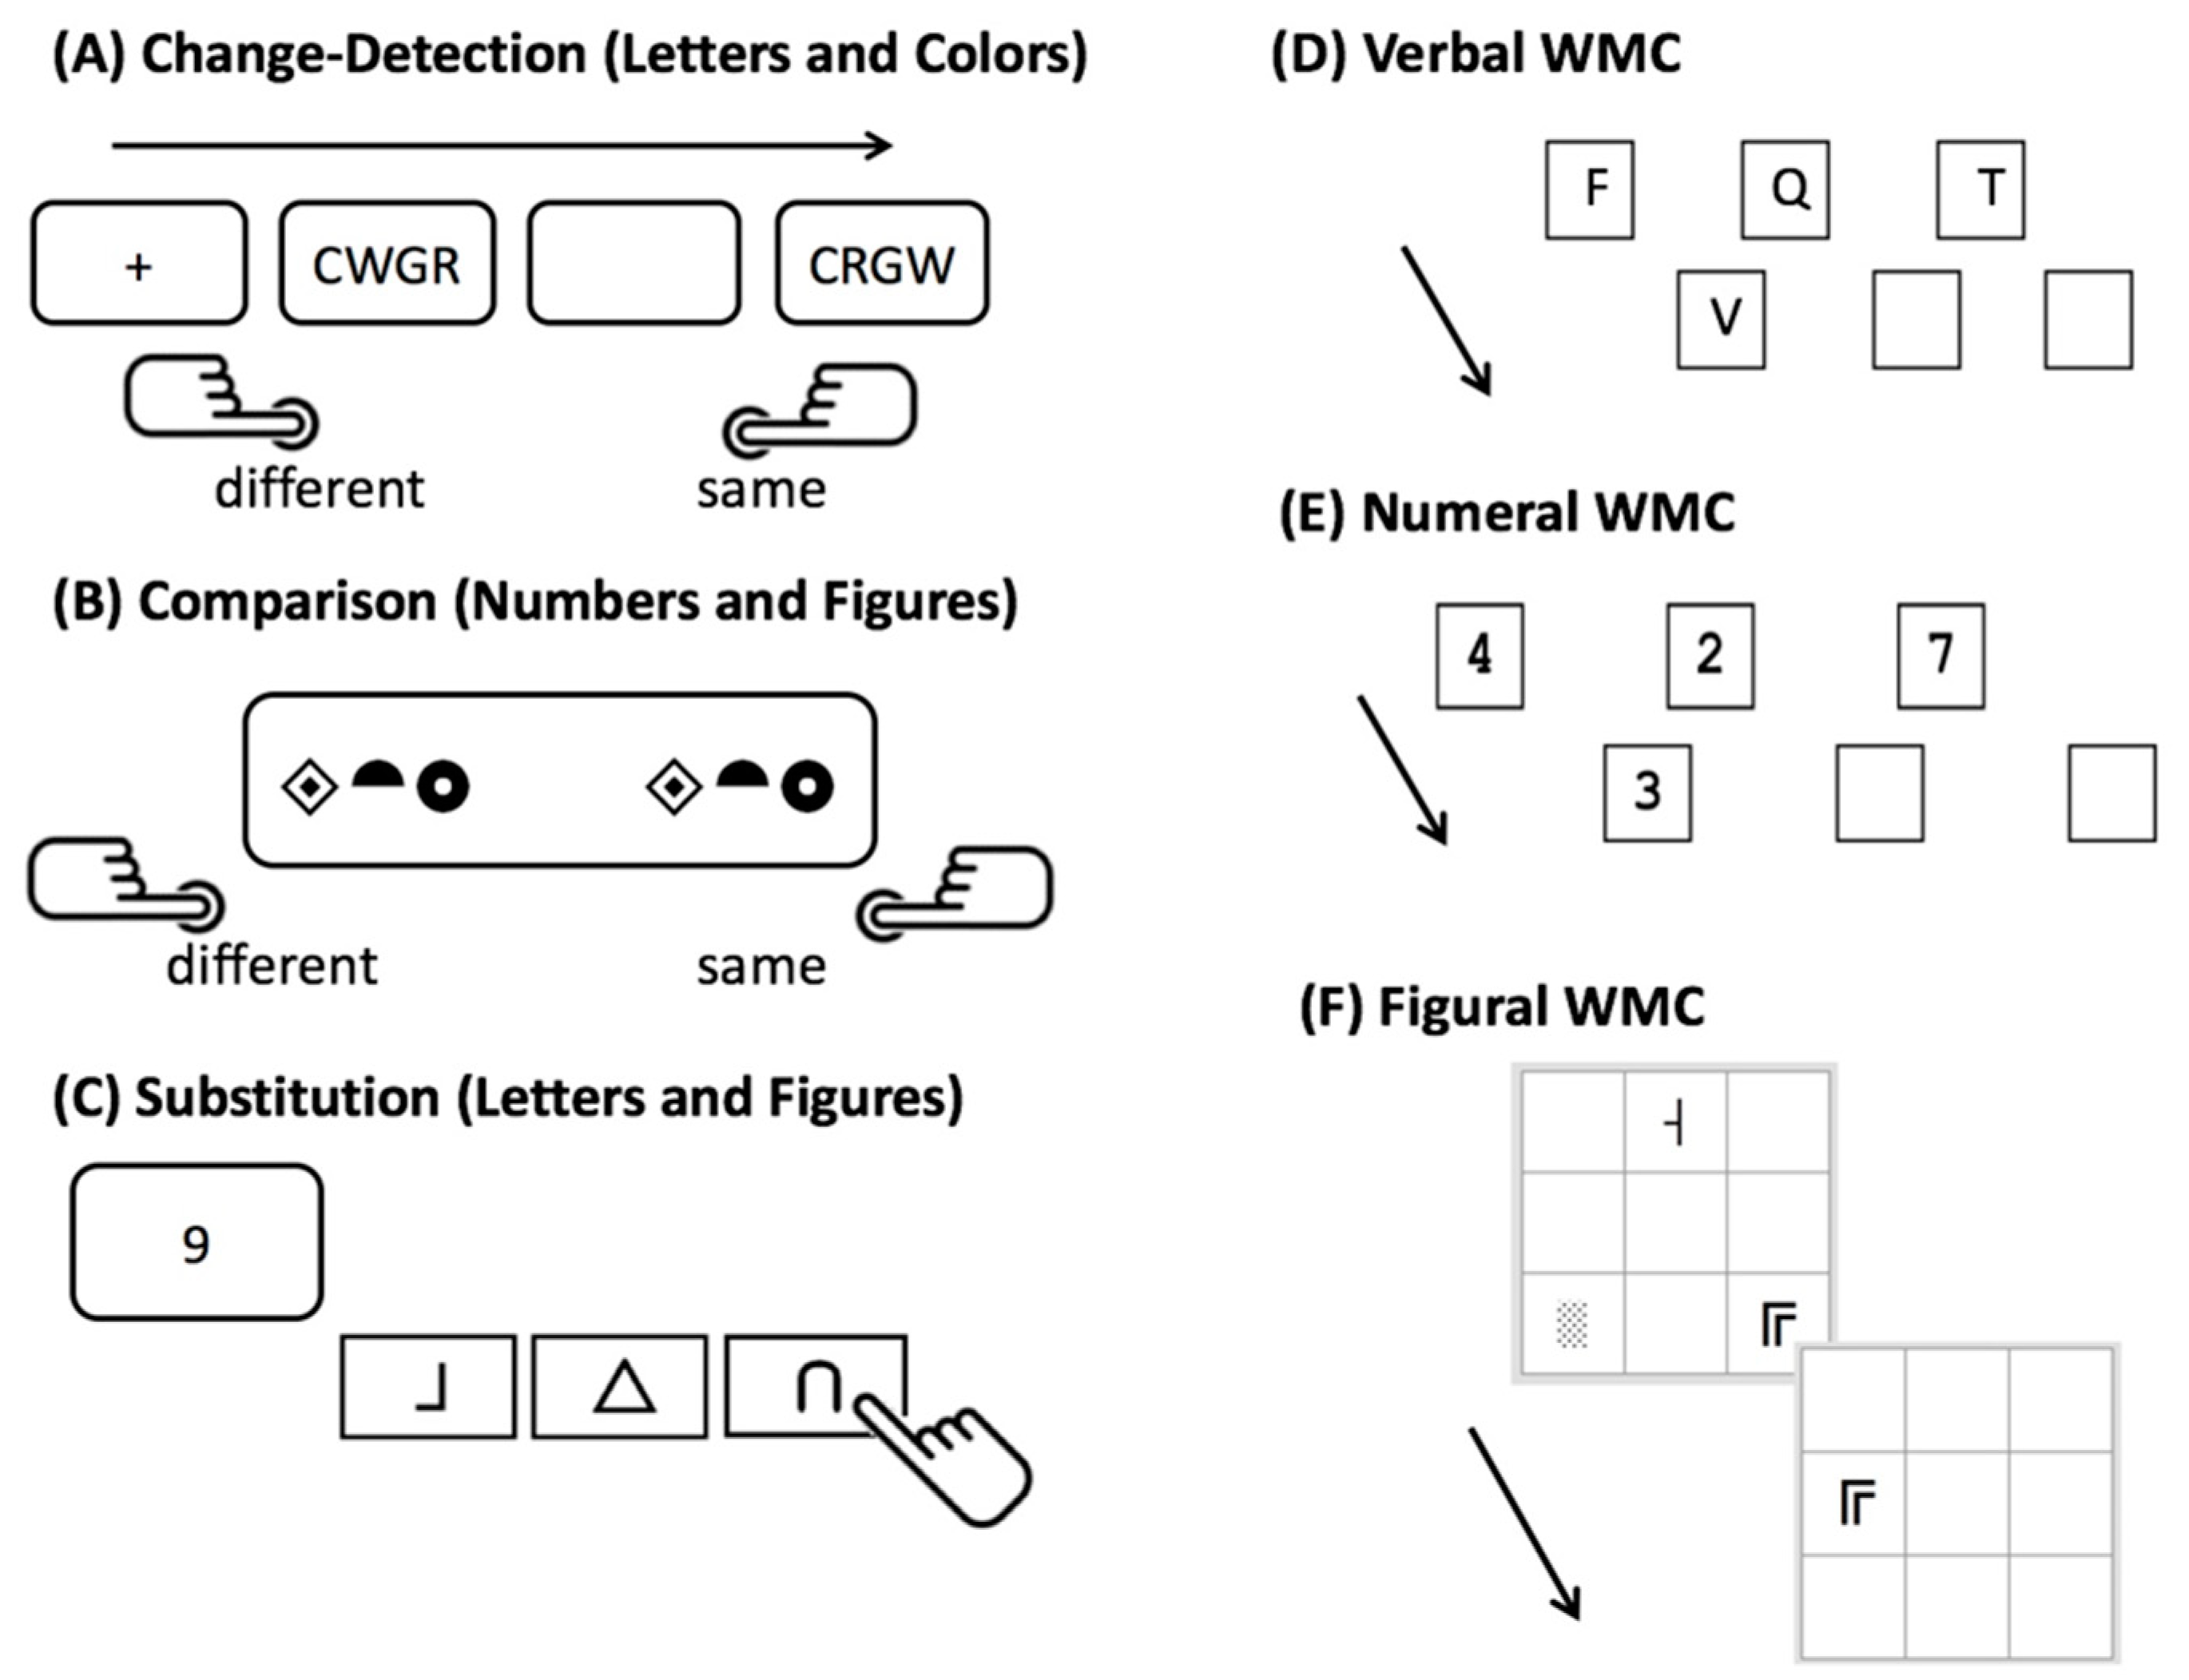
2.2.1. Speed Tasks
2.2.2. Working Memory Capacity
2.3. Statistical Analysis
2.3.1. Data Treatment
2.3.2. Scoring of ECT Performance
2.3.3. Structural Equation Modeling
3. Results
4. Discussion
4.1. Complexity Manipulations
4.2. Disentangling Tasks Requirements
4.3. Relations with Cognitive Ability
4.4. Desiderata for Future Research
5. Conclusions
Author Contributions
Funding
Institutional Review Board Statement
Informed Consent Statement
Data Availability Statement
Conflicts of Interest
References
- Ackerman, Phillip L., and Patrick C. Kyllonen. 1991. Trainee characteristics. In Training for Performance: Principles of Applied Human Learning. Edited by John E. Morrison. Hoboken: John Wiley and Sons, pp. 193–229. [Google Scholar]
- Baddeley, Alan. 2012. Working Memory: Theories, Models, and Controversies. Annual Review of Psychology 63: 1–29. [Google Scholar] [CrossRef] [Green Version]
- Barrouillet, Pierre, Sophie Bernardin, Sophie Portrat, Evie Vergauwe, and Valérie Camos. 2007. Time and cognitive load in working memory. Journal of Experimental Psychology: Learning, Memory, and Cognition 33: 570–85. [Google Scholar] [CrossRef] [PubMed] [Green Version]
- Barrouillet, Pierre, Sophie Portrat, Evie Vergauwe, Kevin Diependaele, and Valérie Camos. 2011. Further evidence for temporal decay in working memory: Reply to Lewandowsky and Oberauer 2009. Journal of Experimental Psychology: Learning, Memory, and Cognition 37: 1302–17. [Google Scholar] [CrossRef] [Green Version]
- Burns, Nicholas R., and Ted Nettelbeck. 2003. Inspection Time in the Structure of Cognitive Abilities: Where Does IT Fit? Intelligence 31: 237–255. [Google Scholar] [CrossRef]
- Carroll, John B. 1993. Human Cognitive Abilities: A Survey of Factor-Analytic Studies. Cambridge: Cambridge University Press. [Google Scholar] [CrossRef]
- Cattell, Raymond B. 1963. Theory of fluid and crystallized intelligence: A critical experiment. Journal of Educational Psychology 54: 1–22. [Google Scholar] [CrossRef]
- Chuderski, Adam, Maciej Taraday, Edward Nęcka, and Tomasz Smoleń. 2012. Storage capacity explains fluid intelligence but executive control does not. Intelligence 40: 278–95. [Google Scholar] [CrossRef]
- Cohen, Jacob. 1969. Statistical Power Analysis for the Behavioral Sciences. Cambridge: Academic Press. [Google Scholar]
- Conway, Andrew R. A., Michael J. Kane, Michael. F. Bunting, David Z. Hambrick, Oliver Wilhelm, and Randall W. Engle. 2005. Working memory span tasks: A methodological review and user’s guide. Psychonomic Bulletin and Review 12: 769–86. [Google Scholar] [CrossRef]
- Conway, Andrew R. A., Christopher Jarrold, Michael J. Kane, Akira Miyake, and John N. Towse. 2008. Variation in Working Memory: An Introduction. In Variation in Working Memory. Edited by Andrew R. A. Conway, Christopher Jarrold and Michael J. Kane. Oxford: Oxford University Press, pp. 3–17. [Google Scholar]
- Cowan, Nelson. 2005. Working Memory Capacity (Essays in Cognitive Psychology). London: Tayler and Francis Ltd. [Google Scholar]
- Cowan, Nelson. 2010. The Magical Mystery Four: How Is Working Memory Capacity Limited, and Why? Current Directions in Psychological Science 19: 51–57. [Google Scholar] [CrossRef] [Green Version]
- Danthiir, Vanessa, Oliver Wilhelm, Ralf Schulze, and Richard D. Roberts. 2005a. Factor structure and validity of paper-and-pencil measures of mental speed: Evidence for a higher-order model? Intelligence 33: 491–514. [Google Scholar] [CrossRef]
- Danthiir, Vanessa, Richard D. Roberts, Ralf Schulze, and Oliver Wilhelm. 2005b. Mental Speed: On Frameworks, Paradigms, and a Platform for the Future. In Handbook of Understanding and Measuring Intelligence. Edited by Oliver Wilhelm and Randall W. Engle. Thousand Oaks, CA: SAGE Publications, Inc., pp. 27–46. Available online: http://sk.sagepub.com/reference/handbook-of-understanding-and-measuring-intelligence/n3.xml (accessed on 15 October 2020).
- Danthiir, Vanessa, Oliver Wilhelm, and Richard D. Roberts. 2012. Further evidence for a multifaceted model of mental speed: Factor structure and validity of computerized measures. Learning and Individual Differences 22: 324–35. [Google Scholar] [CrossRef]
- Deary, Ian. 2003. Reaction Time and Psychometric Intelligence: Jensen’s Contributions. In The Scientific Study of General Intelligence: Tribute to Arthur R. Jensen. Edited by Helmuth Nyborg. Oxford: Pergamon, pp. 53–75. [Google Scholar] [CrossRef]
- Deary, Ian, Geoff Der, and Graeme Ford. 2001. Reaction times and intelligence differences A population-based cohort study. Intelligence 29: 389–99. [Google Scholar] [CrossRef]
- Doebler, Philipp, and Barbara Scheffler. 2016. The relationship of choice reaction time variability and intelligence: A meta-analysis. Learning and Individual Differences 52: 157–66. [Google Scholar] [CrossRef]
- Eid, Michael, Fridtjof W. Nussbeck, Christian Geiser, David A. Cole, Mario Gollwitzer, and Tanja Lischetzke. 2008. Structural equation modeling of multitrait-multimethod data: Different models for different types of methods. Psychological Methods 13: 230–53. [Google Scholar] [CrossRef]
- Engle, Randall. W. 2002. Working memory capacity as executive attention. Current Directions in Psychological Science 11: 19–23. [Google Scholar] [CrossRef]
- Eysenck, Hans J. 1987. Speed of information processing, reaction time, and the theory of intelligence. In Speed of Information-Processing and Intelligence. Edited by Philip. A. Vernon. Norwood: Ablex Publishing, pp. 21–67. [Google Scholar]
- Galton, Franics. 1883. Inquiries into Human Faculty and Its Development. London: MacMillan Co. [Google Scholar] [CrossRef] [Green Version]
- Hale, Sandra, and Jennifer Jansen. 1994. Global Processing-Time Coefficients Characterize Individual and Group Differences in Cognitive Speed. Psychological Science 5: 384–89. [Google Scholar] [CrossRef]
- Heathcote, Andrew, Stephen J. Popiel, and Douglas. J. Mewhort. 1991. Analysis of response time distributions: An example using the Stroop task. Psychological Bulletin 109: 340–47. [Google Scholar] [CrossRef]
- Hohle, Raymond. H. 1965. Inferred components of reaction times as functions of foreperiod duration. Journal of Experimental Psychology 69: 382–86. [Google Scholar] [CrossRef]
- Honaker, James, Gary King, and Matthew Blackwell. 2011. Amelia II: A Program for Missing Data. Journal of Statistical Software 45: 7. [Google Scholar] [CrossRef]
- Hu, Li, and Peter M. Bentler. 1999. Cutoff criteria for fit indexes in covariance structure analysis: Conventional criteria versus new alternatives. Structural Equation Modeling: A Multidisciplinary Journal 6: 1–55. [Google Scholar] [CrossRef]
- Hülür, Gizem, Doris Keye-Ehing, Klaus Oberauer, and Oliver Wilhelm. 2019. The Effect of Stimulus-Response Compatibility on the Association of Fluid Intelligence and Working Memory with Choice Reaction Times. Journal of Cognition 2: 14. [Google Scholar] [CrossRef]
- Jensen, Arthur R. 1982. Reaction Time and Psychometric g. In A Model for Intelligence. Edited by H. J. Eysenck. Berlin and Heidelberg: Springer, pp. 93–132. [Google Scholar] [CrossRef]
- Jensen, Arthur R. 2006. Clocking the Mind: Mental Chronometry and Individual Differences. Amsterdam: Elsevier. [Google Scholar]
- Jorgensen, Terrence D., Sunthud Pornprasertmanit, Alexander M. Schoemann, and Yves Rosseel. 2020. semTools: Useful Tools for Structural Equation Modeling. R Package Version 0.5-3. Available online: https://CRAN.R-project.org/package=semTools (accessed on 15 October 2020).
- Kail, Robert, and Timothy A. Salthouse. 1994. Processing speed as a mental capacity. Acta Psychologica 86: 199–225. [Google Scholar] [CrossRef]
- Kane, Michael J., David Z. Hambrick, and Andrew R. A. Conway. 2005. Working Memory Capacity and Fluid Intelligence Are Strongly Related Constructs: Comment on Ackerman, Beier, and Boyle 2005. Psychological Bulletin 131: 66–71. [Google Scholar] [CrossRef] [PubMed] [Green Version]
- Kovacs, Kristof, and Andrew R. A. Conway. 2016. Process Overlap Theory: A Unified Account of the General Factor of Intelligence. Psychological Inquiry 27: 151–77. [Google Scholar] [CrossRef]
- Kovacs, Kristof, and Andrew R. A. Conway. 2019. What Is IQ? Life Beyond “General Intelligence”. Current Directions in Psychological Science 28: 189–94. [Google Scholar] [CrossRef]
- Kranzler, John H., and Arthur R. Jensen. 1991. The nature of psychometric g: Unitary process or a number of independent processes? Intelligence 15: 397–422. [Google Scholar] [CrossRef]
- Kyllonen, Patrick C., and Raymond E. Christal. 1990. Reasoning ability is (little more than) working-memory capacity?! Intelligence 14: 389–433. [Google Scholar] [CrossRef]
- Larson, Gerald E., Charles R. Merritt, and Steven E. Williams. 1988. Information processing and intelligence: Some implications of task complexity. Intelligence 12: 131–47. [Google Scholar] [CrossRef]
- Lewandowsky, Stephan, Klaus Oberauer, and Gordon D. A. Brown. 2009. No temporal decay in verbal short-term memory. Trends in Cognitive Sciences 13: 120–26. [Google Scholar] [CrossRef]
- Little, Todd D., David W. Slegers, and Noel A. Card. 2006. A Non-arbitrary Method of Identifying and Scaling Latent Variables in SEM and MACS Models. Structural Equation Modeling: A Multidisciplinary Journal 13: 59–72. [Google Scholar] [CrossRef]
- Lohman, David F. 1989. Individual Differences in Errors and Latencies on Cognitive Tasks. Learning and Individual Differences 1: 179–202. [Google Scholar] [CrossRef]
- Luck, Steven J., and Edward K. Vogel. 1997. The capacity of visual working memory for features and conjunctions. Nature 390: 279–81. [Google Scholar] [CrossRef]
- Marshalek, Brachia, David F. Lohman, and Richard E. Snow. 1983. The complexity continuum in the radex and hierarchical models of intelligence. Intelligence 7: 107–127. [Google Scholar] [CrossRef]
- McGrew, Kevin S. 2005. The Cattell-Horn-Carroll Theory of Cognitive Abilities: Past, Present, and Future. In Contemporary Intellectual Assessment: Theories, Tests, and Issues. New York: The Guilford Press, pp. 136–81. [Google Scholar]
- McGrew, Kevin S. 2009. CHC theory and the human cognitive abilities project: Standing on the shoulders of the giants of psychometric intelligence research. Intelligence 37: 1–10. [Google Scholar] [CrossRef]
- Meiran, Nachshon, and Nitzan Shahar. 2018. Working memory involvement in reaction time and its contribution to fluid intelligence: An examination of individual differences in reaction-time distributions. Intelligence 69: 176–85. [Google Scholar] [CrossRef]
- Miyake, Akira, and Naomi P. Friedman. 2012. The Nature and Organization of Individual Differences in Executive Functions: Four General Conclusions. Current Directions in Psychological Science 21: 8–14. [Google Scholar] [CrossRef]
- Miyake, Akira, and Priti Shah, eds. 1999. Models of Working Memory: Mechanisms of Active Maintenance and Executive Control. Cambridge: Cambridge University Press. [Google Scholar]
- Nettelbeck, Ted. 2011. Basic processes of intelligence. In The Cambridge Handbook of Intelligence. Cambridge: Cambridge University Press, pp. 371–93. [Google Scholar] [CrossRef]
- Neubauer, Aljosha C., and Valentin Bucik. 1996. The mental speed—IQ relationship: Unitary or modular? Intelligence 22: 23–48. [Google Scholar] [CrossRef]
- Neubauer, Aljosha C., Frank M. Spinath, Rainer Riemann, Peter Borkenau, and Alois Angleitner. 2000. Genetic and Environmental Influences on Two Measures of Speed of Information Processing and their Relation to Psychometric Intelligence: Evidence from the German Observational Study of Adult Twins. Intelligence 28: 267–89. [Google Scholar] [CrossRef]
- O’Connor, Tess A., and Nicholas R. Burns. 2003. Inspection time and general speed of processing. Personality and Individual Differences 35: 713–24. [Google Scholar] [CrossRef] [Green Version]
- Oberauer, Klaus. 2005a. Binding and Inhibition in Working Memory: Individual and Age Differences in Short-Term Recognition. Journal of Experimental Psychology: General 134: 368–87. [Google Scholar] [CrossRef] [Green Version]
- Oberauer, Klaus. 2005b. The Measurement of Working Memory Capacity. In Handbook of Understanding and Measuring Intelligence. Edited by Oliver Wilhelm and Randall W. Engle. Thousand Oaks: SAGE Publications, Inc., pp. 393–407. [Google Scholar] [CrossRef]
- Oberauer, Klaus. 2019. Working Memory Capacity Limits Memory for Bindings. Journal of Cognition 2: 1–13. [Google Scholar] [CrossRef] [Green Version]
- Oberauer, Klaus, Ralf Schulze, Oliver Wilhelm, and Heinz-Martin Süß. 2005. Working Memory and Intelligence--Their Correlation and Their Relation: Comment on Ackerman, Beier, and Boyle 2005. Psychological Bulletin 131: 61–65. [Google Scholar] [CrossRef] [Green Version]
- Oberauer, Klaus, Heinz-Martin Süβ, Oliver Wilhelm, and Werner W. Wittmann. 2008. Which working memory functions predict intelligence? Intelligence 36: 641–52. [Google Scholar] [CrossRef] [Green Version]
- Phillips, Louise H., and Patrick M. A. Rabbitt. 1995. Impulsivity and Speed-Accuracy Strategies in Intelligence Test Performance. Intelligence 21: 13–29. [Google Scholar] [CrossRef]
- R Core Team. 2020. R: A Language and Environment for Statistical Computing. R Foundation for Statistical Computing: Available online: https://www.R-project.org/ (accessed on 15 October 2020).
- Ratcliff, Roger. 1978. A Theory of Memory Retrieval. Psychological Review 85: 59–108. [Google Scholar] [CrossRef]
- Ratcliff, Roger, and Russ Childers. 2015. Individual differences and fitting methods for the two-choice diffusion model of decision making. Decision 2: 237–79. [Google Scholar] [CrossRef] [PubMed]
- Ratcliff, Roger, and Gail McKoon. 2008. The Diffusion Decision Model: Theory and Data for Two-Choice Decision Tasks. Neural Computation 20: 873–922. [Google Scholar] [CrossRef] [Green Version]
- Ratcliff, Roger, and Jeff N. Rouder. 1998. Modeling Response Times for Two-Choice Decisions. Psychological Science 9: 347–56. [Google Scholar] [CrossRef]
- Ratcliff, Roger, Anjali Thapar, and Gail McKoon. 2010. Individual differences, aging, and IQ in two-choice tasks. Cognitive Psychology 60: 127–57. [Google Scholar] [CrossRef] [Green Version]
- Ratcliff, Roger, Anjali Thapar, and Gail McKoon. 2011. Effects of aging and IQ on item and associative memory. Journal of Experimental Psychology: General 140: 464–87. [Google Scholar] [CrossRef] [PubMed] [Green Version]
- Revelle, William. 2020. psych: Procedures for Psychological, Psychometric, and Personality Research. R package Version 2.0.9. Evanston: Northwestern University, Available online: https://CRAN.R-project.org/package=psych (accessed on 15 October 2020).
- Roberts, Richard D., and Lazar Stankov. 1999. Individual differences in speed of mental processing and human cognitive abilities: Toward a taxonomic model. Learning and Individual Differences 11: 1–120. [Google Scholar] [CrossRef]
- Rosseel, Yves. 2012. lavaan: An R Package for Structural Equation Moeling. Journal of Statistical Software 48: 1–36. [Google Scholar] [CrossRef] [Green Version]
- Roth, Erwin. 1964. Die Geschwindigkeit der Verarbeitung von Information und ihr Zusammenhang mit Intelligenz. Zeitschrift für experimentelle und angewandte Psychologie 11: 616–622. [Google Scholar]
- Rouder, Jeff N., Richard D. Morey, Candice C. Morey, and Nelson Cowan. 2011. How to measure working memory capacity in the change detection paradigm. Psychonomic Bulletin and Review 18: 324–30. [Google Scholar] [CrossRef] [Green Version]
- Schmiedek, Florian, Klaus Oberauer, Oliver Wilhelm, Heinz-Martin Süß, and Werner W. Wittmann. 2007. Individual differences in components of reaction time distributions and their relations to working memory and intelligence. Journal of Experimental Psychology: General 136: 414–29. [Google Scholar] [CrossRef] [Green Version]
- Schmitz, Florian, and Oliver Wilhelm. 2016. Modeling Mental Speed: Decomposing Response Time Distributions in Elementary Cognitive Tasks and Correlations with Working Memory Capacity and Fluid Intelligence. Journal of Intelligence 4: 13. [Google Scholar] [CrossRef] [Green Version]
- Schmitz, Florian, and Oliver Wilhelm. 2019. Mene Mene Tekel Upharsin: Clerical Speed and Elementary Cognitive Speed are Different by Virtue of Test Mode Only. Journal of Intelligence 7: 16. [Google Scholar] [CrossRef] [Green Version]
- Schmitz, Florian, Dominik Rotter, and Oliver Wilhelm. 2018. Scoring Alternatives for Mental Speed Tests: Measurement Issues and Validity for Working Memory Capacity and the Attentional Blink Effect. Journal of Intelligence 6: 47. [Google Scholar] [CrossRef] [Green Version]
- Schubert, Anna-Lena, Dirk Hagemann, Andreas Voss, Andrea Schankin, and Katharina Bergmann. 2015. Decomposing the relationship between mental speed and mental abilities. Intelligence 51: 28–46. [Google Scholar] [CrossRef]
- Sheppard, Leah D., and Philip A. Vernon. 2008. Intelligence and speed of information-processing: A review of 50 years of research. Personality and Individual Differences 44: 535–51. [Google Scholar] [CrossRef]
- Stahl, Christoph, Andreas Voss, Florian Schmitz, M. Nuszbaum, O. Tüscher, K. Lieb, and K. C. Klauer. 2014. Behavioral components of impulsivity. Journal of Experimental Psychology: General 143: 850–86. [Google Scholar] [CrossRef] [PubMed]
- Torchiano, Marco. 2020. Package effsize: Efficient Effect Size Computation. CRAN Repository. [Google Scholar] [CrossRef]
- Tukey, John W. 1977. Exploratory Data Analysis. Amsterdam: Addison-Wesley. [Google Scholar]
- Unsworth, Nash, and Randall W. Engle. 2006. Simple and complex memory spans and their relation to fluid abilities: Evidence from list-length effects. Journal of Memory and Language 54: 68–80. [Google Scholar] [CrossRef]
- Unsworth, Nash, and Randall W. Engle. 2007. The nature of individual differences in working memory capacity: Active maintenance in primary memory and controlled search from secondary memory. Psychological Review 114: 104–32. [Google Scholar] [CrossRef] [PubMed] [Green Version]
- van Ravenzwaaij, Don, and Klaus Oberauer. 2009. How to use the diffusion model: Parameter recovery of three methods: EZ, fast-dm, and DMAT. Journal of Mathematical Psychology 53: 463–73. [Google Scholar] [CrossRef]
- Vernon, Philip A., and Arthur R. Jensen. 1984. Individual and group differences in intelligence and speed of information processing. Personality and Individual Differences 5: 411–23. [Google Scholar] [CrossRef]
- Vernon, Philip A., and Sandra E. Weese. 1993. Predicting intelligence with multiple speed of information-processing tests. Personality and Individual Differences 14: 413–19. [Google Scholar] [CrossRef]
- Vigneau, Francois, Lise Blanchet, Michel Loranger, and Michel Pépin. 2002. Response latencies measured on IQ tests: Dimensionality of speed indices and the relationship between speed and level. Personality and Individual Differences 33: 165–82. [Google Scholar] [CrossRef]
- Voss, Andreas, Markus Nagler, and Veronika Lerche. 2013. Diffusion Models in Experimental Psychology: A Practical Introduction. Experimental Psychology 60: 385–402. [Google Scholar] [CrossRef]
- Wagenmakers, Eric-Jan. 2009. Methodological and empirical developments for the Ratcliff diffusion model of response times and accuracy. European Journal of Cognitive Psychology 21: 641–71. [Google Scholar] [CrossRef]
- Wagenmakers, Eric-Jan, Han L. J. Van Der Maas, and Raoul P. P. P. Grasman. 2007. An EZ-diffusion model for response time and accuracy. Psychonomic Bulletin & Review 14: 3–22. [Google Scholar] [CrossRef] [Green Version]
- Wilhelm, Oliver, and Klaus Oberauer. 2006. Why are reasoning ability and working memory capacity related to mental speed? An investigation of stimulus–response compatibility in choice reaction time tasks. European Journal of Cognitive Psychology 18: 18–50. [Google Scholar] [CrossRef]
- Wilhelm, Oliver, Andrea Hildebrandt, and Klaus Oberauer. 2013. What is working memory capacity, and how can we measure it? Frontiers in Psychology 4: 433. [Google Scholar] [CrossRef] [PubMed] [Green Version]


| Tasks | Set Size | MRT | Merr | a | v | Ter | dRT (95%-CI) | derr (95%-CI) | |
|---|---|---|---|---|---|---|---|---|---|
| Change detection | Color | 2 | 665 (135) | 0.08 (0.06) | 0.13 (0.03) | 0.21 (0.06) | 0.38 (0.07) | ||
| 4 | 843 (210) | 0.15 (0.06) | 0.13 (0.03) | 0.15 (0.05) | 0.49 (0.09) | 1.00 [0.73; 1.28] | 1.10 [0.82; 1.38] | ||
| 6 | 949 (253) | 0.25 (0.07) | 0.13 (0.03) | 0.09 (0.04) | 0.53 (0.12) | 1.35 [1.06; 1.64] | 2.60 [2.24; 2.95] | ||
| Letter | 2 | 563 (97) | 0.04 (0.03) | 0.13 (0.03) | 0.27 (0.06) | 0.32 (0.05) | |||
| 4 | 729 (135) | 0.09 (0.06) | 0.14 (0.03) | 0.19 (0.05) | 0.40 (0.07) | 1.42 [1.13; 1.71] | 0.96 [0.68; 1.23] | ||
| 6 | 981 (224) | 0.16 (0.08) | 0.16 (0.03) | 0.12 (0.03) | 0.50 (0.10) | 2.43 [2.09; 2.77] | 1.88 [1.56; 2.19] | ||
| Comparison | Figure | 2 | 954 (160) | 0.05 (0.04) | 0.15 (0.03) | 0.22 (0.05) | 0.64 (0.09) | ||
| 4 | 1307 (248) | 0.07 (0.06) | 0.19 (0.04) | 0.16 (0.04) | 0.78 (0.13) | 1.70 [1.40; 2.00] | 0.31 [0.05; 0.57] | ||
| 6 | 1739 (402) | 0.11 (0.08) | 0.21 (0.05) | 0.11 (0.03) | 1 (0.20) | 2.57 [2.22; 2.92] | 0.88 [0.61; 1.16] | ||
| Number | 2 | 767 (101) | 0.03 (0.03) | 0.12 (0.02) | 0.31 (0.06) | 0.58 (0.06) | |||
| 4 | 1072 (221) | 0.07 (0.04) | 0.15 (0.03) | 0.19 (0.04) | 0.70 (0.11) | 1.78 [1.47; 2.10] | 0.99 [0.72; 1.27] | ||
| 6 | 1563 (316) | 0.06 (0.04) | 0.21 (0.04) | 0.14 (0.03) | 0.91 (0.18) | 3.40 [2.99; 3.80] | 0.85 [0.57; 1.12] | ||
| Mcompound | |||||||||
| Substitution | Figure | 2 | 500 (89) | 0.01 (0.01) | 0 (0.59) | - | - | ||
| 4 | 634 (87) | 0.01 (0.02) | 0 (0.60) | - | - | 1.52 [1.22; 1.81] | 0.24 [0; 0.50] | ||
| 6 | 748 (115) | 0.02 (0.02) | 0 (0.66) | - | - | 2.40 [2.06; 2.74] | 0.56 [0.30; 0.83] | ||
| Letter | 2 | 486 (90) | 0.01 (0.02) | 0 (0.67) | - | - | |||
| 4 | 703 (116) | 0.04 (0.03) | 0 (0.67) | - | - | 2.08 [1.76; 2.41] | 0.99 [0.72; 1.27] | ||
| 6 | 854 (147) | 0.03 (0.03) | 0 (0.66) | - | - | 3.01 [2.64; 3.40] | 0.80 [0.53; 1.07] | ||
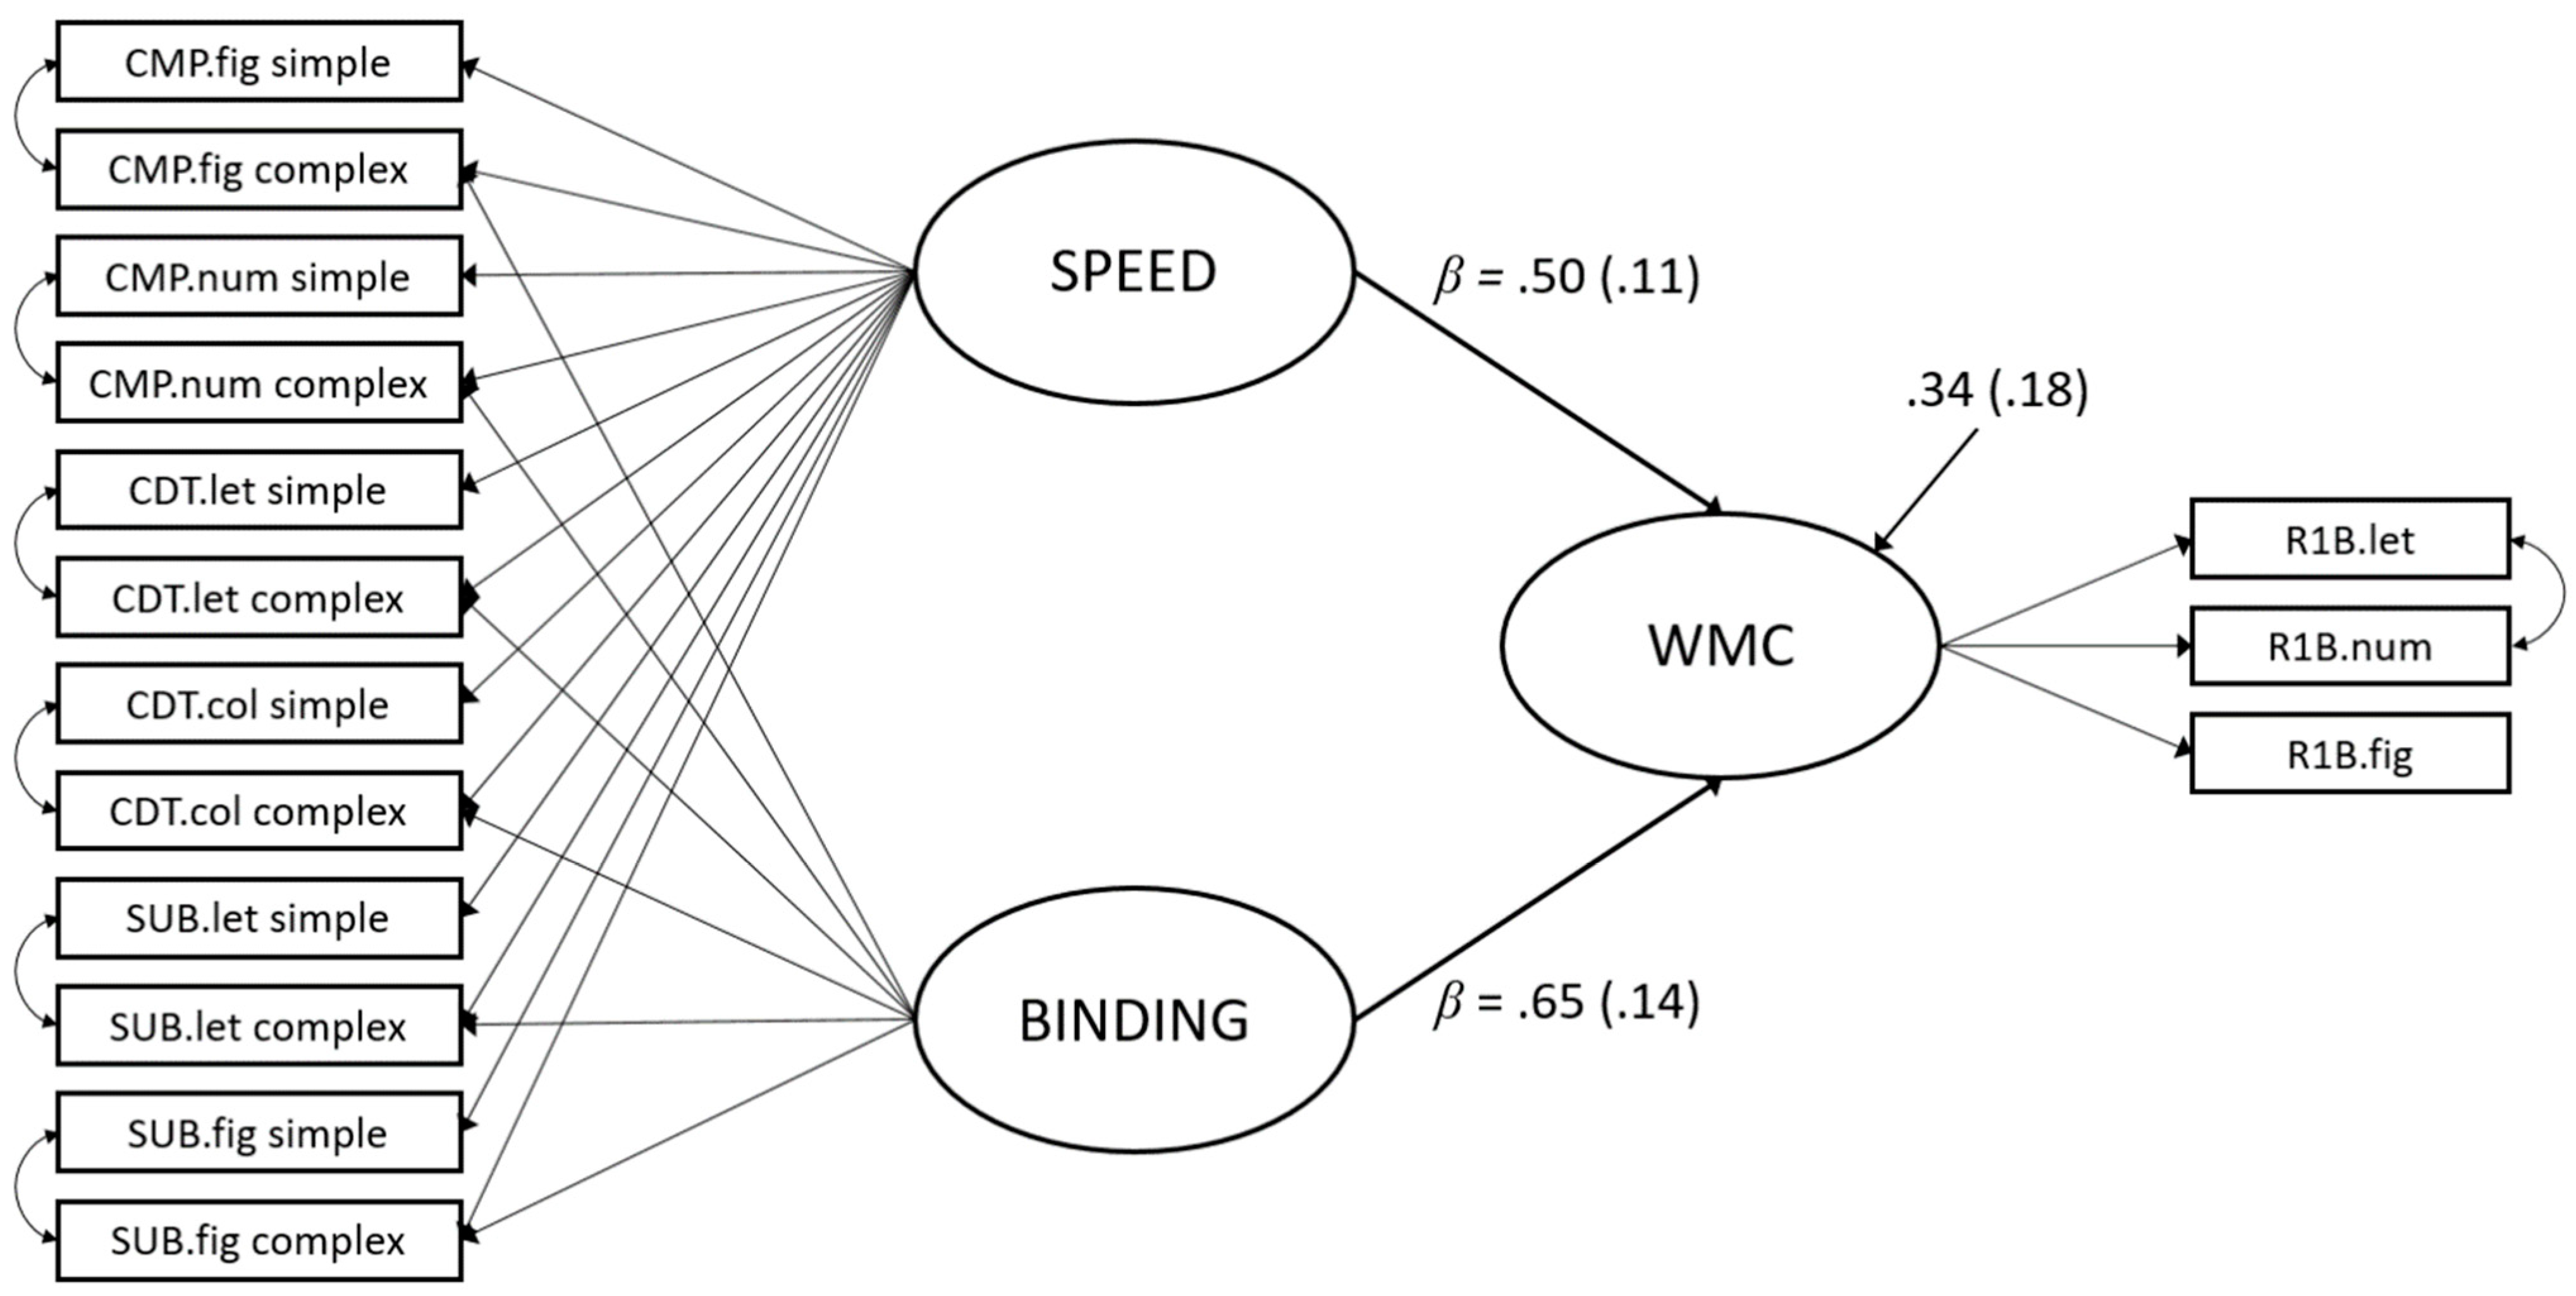
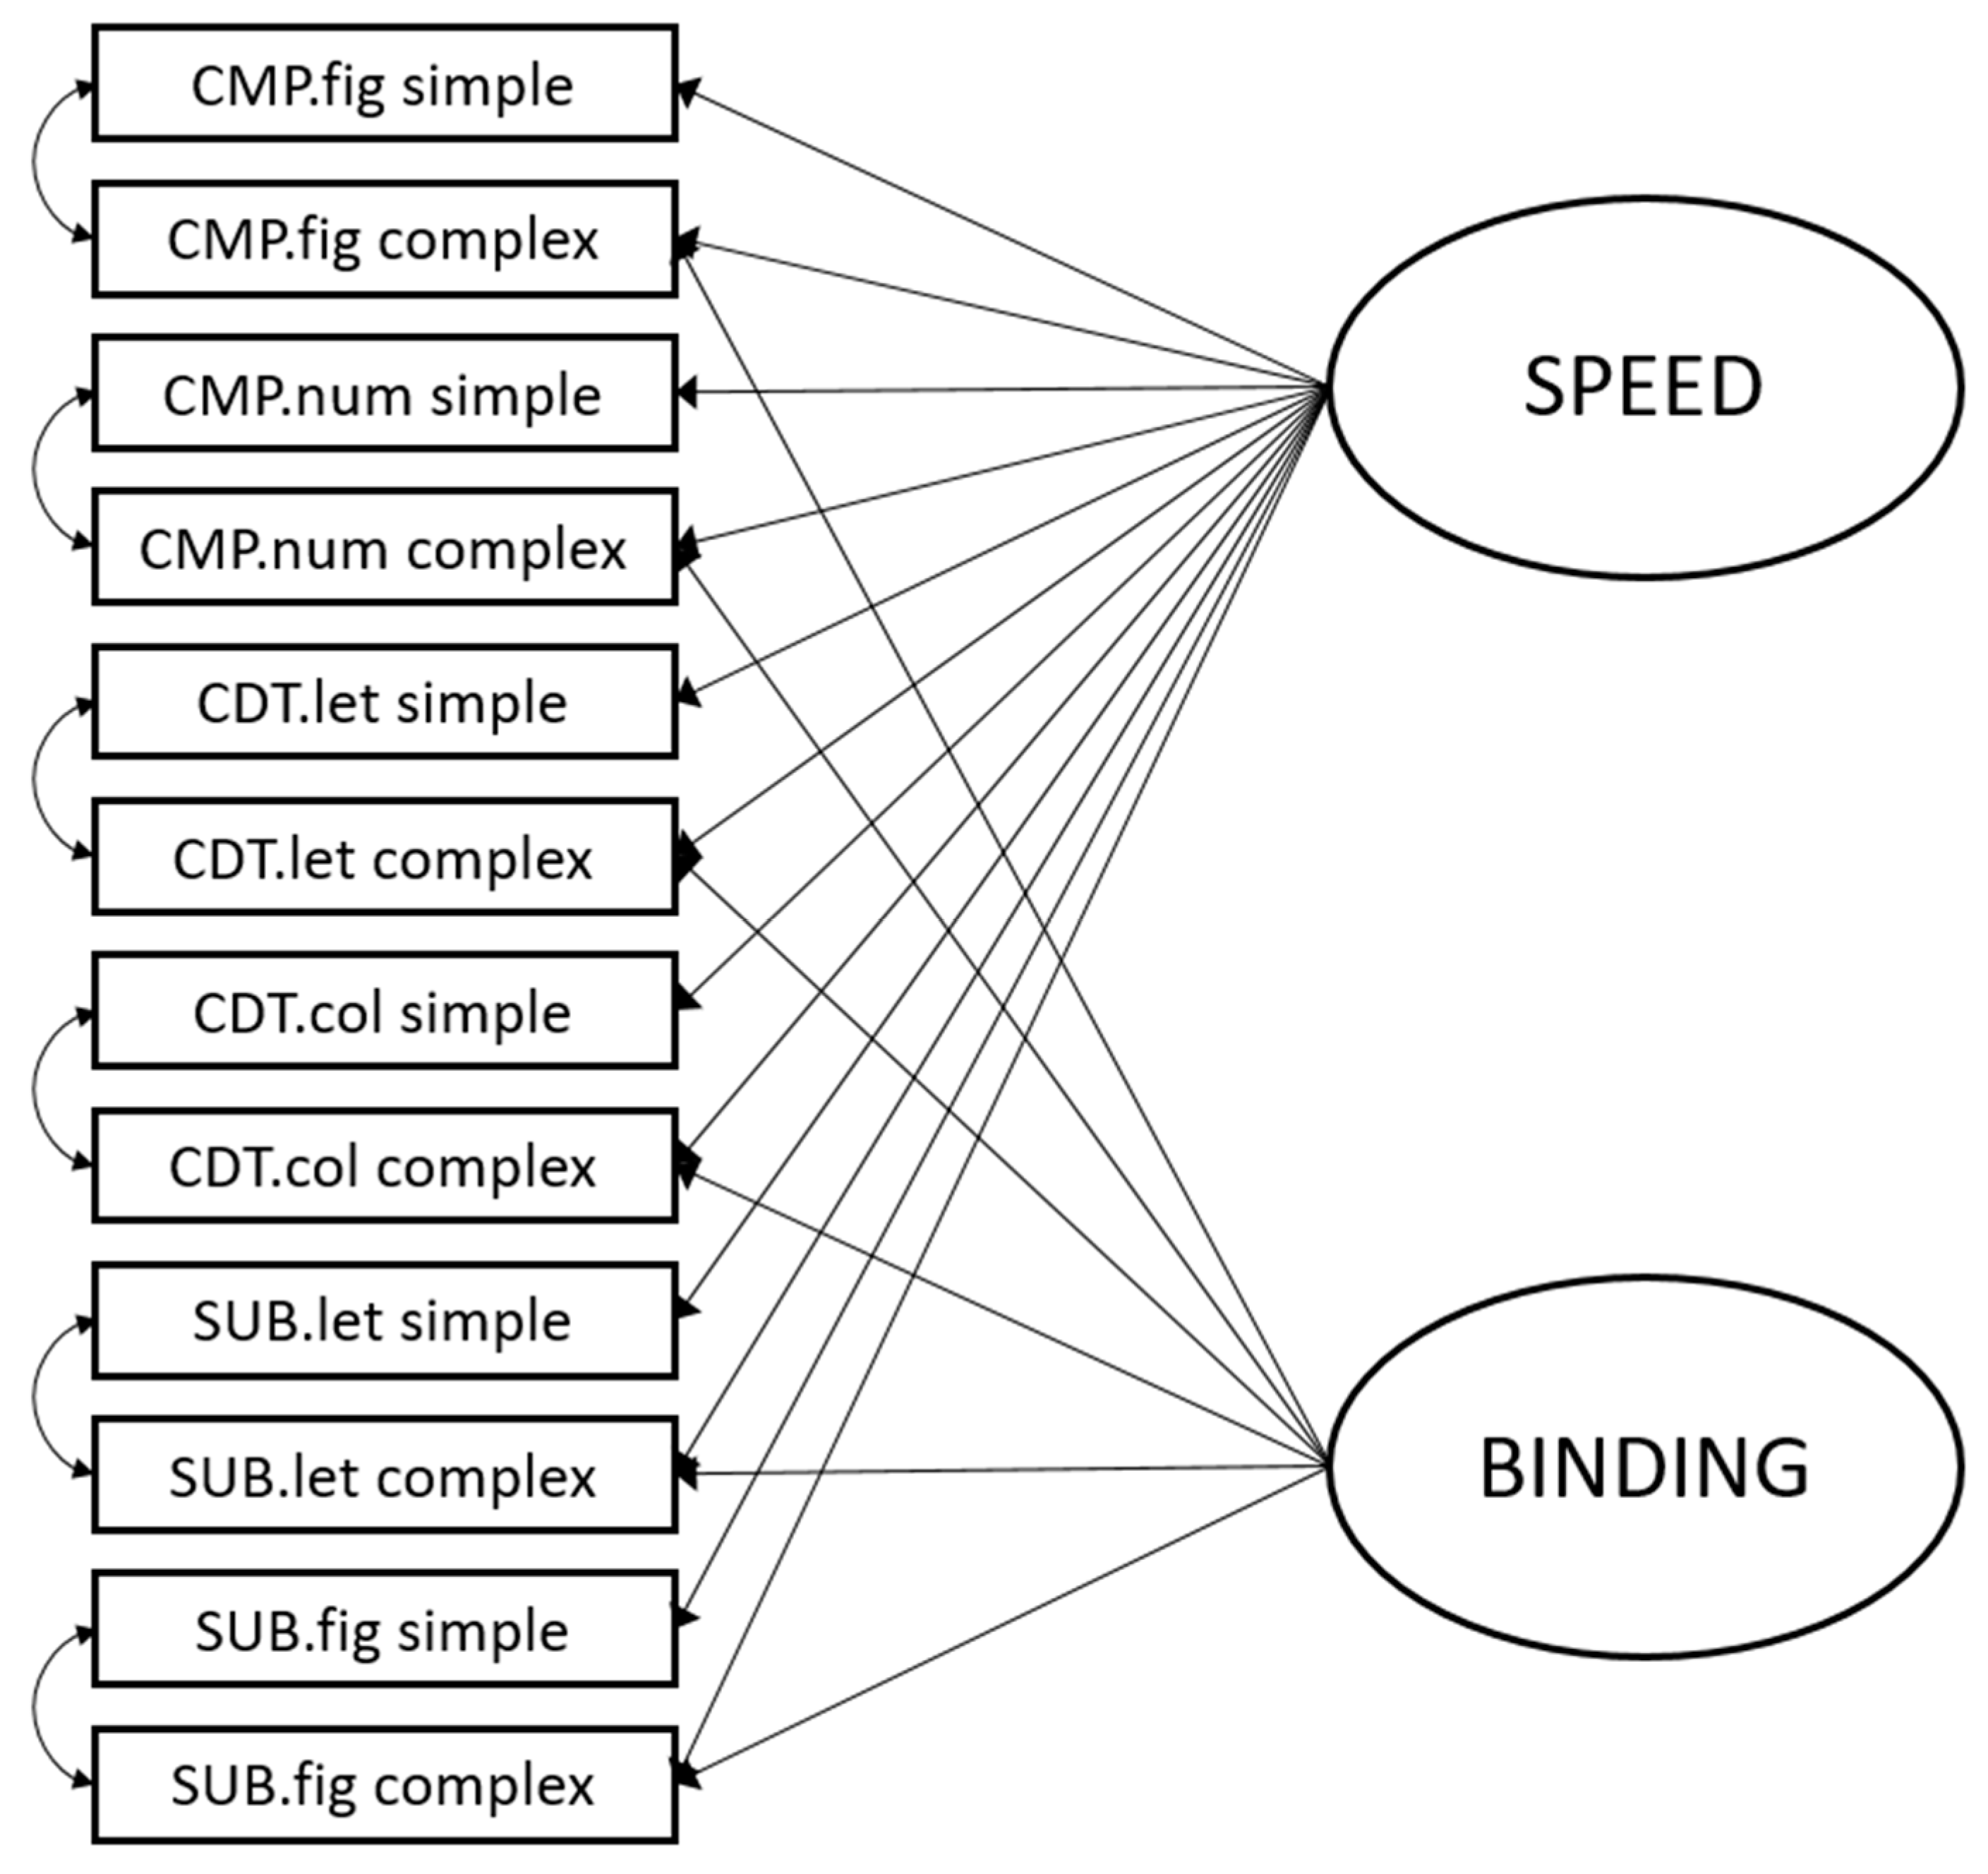
| Measurement Model (Figure 2) | Structural Model (Figure 3) | |||||
|---|---|---|---|---|---|---|
| λ (SE) | λ (SE) | |||||
| Condition | Indicator | Speed | Binding | Speed | Binding | WMC |
| simple | CMP.fig | 0.66 (0.06) | - | 0.66 (0.06) | - | - |
| CMP.num | 0.63 (0.07) | - | 0.63 (0.07) | - | - | |
| CDT.let | 0.84 (0.04) | - | 0.84 (0.04) | - | - | |
| CDT.col | 0.73 (0.05) | - | 0.74 (0.05) | - | - | |
| SUB.let | 0.52 (0.08) | - | 0.52 (0.08) | - | - | |
| SUB.fig | 0.45 (0.08) | - | 0.45 (0.08) | - | - | |
| complex | CMP.fig | 0.60 (0.07) | 0.20 (0.10) | 0.60 (0.07) | 0.29 (0.09) | - |
| CMP.num | 0.52 (0.08) | 0.15 (0.11) | 0.52 (0.08) | 0.15 (0.11) | - | |
| CDT.let | 0.43 (0.09) | 0.18 (0.12) | 0.40 (0.09) | 0.36 (0.11) | - | |
| CDT.col | 0.37 (0.09) | 0.35 (0.12) | 0.35 (0.09) | 0.37 (0.11) | - | |
| SUB.let | 0.47 (0.08) | 0.44 (0.12) | 0.47 (0.08) | 0.38 (0.10) | - | |
| SUB.fig | 0.35 (0.09) | 0.53 (0.13) | 0.35 (0.09) | 0.36 (0.11) | - | |
| R1B.let | - | - | - | - | 0.65 (0.09) | |
| R1B.num | - | - | - | - | 0.50 (0.10) | |
| R1B.fig | - | - | - | - | 0.64 (0.09) | |
Publisher’s Note: MDPI stays neutral with regard to jurisdictional claims in published maps and institutional affiliations. |
© 2021 by the authors. Licensee MDPI, Basel, Switzerland. This article is an open access article distributed under the terms and conditions of the Creative Commons Attribution (CC BY) license (https://creativecommons.org/licenses/by/4.0/).
Share and Cite
Goecke, B.; Schmitz, F.; Wilhelm, O. Binding Costs in Processing Efficiency as Determinants of Cognitive Ability. J. Intell. 2021, 9, 18. https://doi.org/10.3390/jintelligence9020018
Goecke B, Schmitz F, Wilhelm O. Binding Costs in Processing Efficiency as Determinants of Cognitive Ability. Journal of Intelligence. 2021; 9(2):18. https://doi.org/10.3390/jintelligence9020018
Chicago/Turabian StyleGoecke, Benjamin, Florian Schmitz, and Oliver Wilhelm. 2021. "Binding Costs in Processing Efficiency as Determinants of Cognitive Ability" Journal of Intelligence 9, no. 2: 18. https://doi.org/10.3390/jintelligence9020018
APA StyleGoecke, B., Schmitz, F., & Wilhelm, O. (2021). Binding Costs in Processing Efficiency as Determinants of Cognitive Ability. Journal of Intelligence, 9(2), 18. https://doi.org/10.3390/jintelligence9020018