Article

Structure and Properties of High and Low Free Volume Polymers Studied by Molecular Dynamics Simulation

1
N. N. Semenov Institute of Chemical Physics RAS, 119991 Moscow, Russia
2
Institute of Mathematical Problems of Biology RAS—The Branch of Keldysh Institute of Applied Mathematics RAS, Pushchino, 142290 Moscow Region, Russia
3
A. V. Topchiev Institute of Petrochemical Synthesis RAS, 119991 Moscow, Russia
*
Author to whom correspondence should be addressed.
Computation 2019, 7(2), 27; https://doi.org/10.3390/computation7020027
Submission received: 28 April 2019 / Revised: 23 May 2019 / Accepted: 30 May 2019 / Published: 31 May 2019

Abstract

:
Using molecular dynamics, a comparative study was performed of two pairs of glassy polymers, low permeability polyetherimides (PEIs) and highly permeable Si-containing polytricyclononenes. All calculations were made with 32 independent models for each polymer. In both cases, the accessible free volume (AFV) increases with decreasing probe size. However, for a zero-size probe, the curves for both types of polymers cross the ordinate in the vicinity of 40%. The size distribution of free volume in PEI and highly permeable polymers differ significantly. In the former case, they are represented by relatively narrow peaks, with the maxima in the range of 0.5–1.0 Å for all the probes from H2 to Xe. In the case of highly permeable Si-containing polymers, much broader peaks are observed to extend up to 7–8 Å for all the gaseous probes. The obtained size distributions of free volume and accessible volume explain the differences in the selectivity of the studied polymers. The surface area of AFV is found for PEIs using Delaunay tessellation. Its analysis and the chemical nature of the groups that form the surface of free volume elements are presented and discussed.

Graphical Abstract

1. Introduction

During the last decade, atomistic modeling using molecular dynamics (MD) [1,2] has become an efficient tool for the elucidation and prediction of various properties of polymers and, in particular, potential and applicable materials for gas and vapor separation membranes. Free volume and size distribution of free volume elements (FVEs) [3,4,5,6], energy barriers of inner rotation of the main chains [4,7,8], gas diffusion, solubility and permeability coefficients in polymers [3,5,7,9], gas and vapor sorption isotherms [10,11,12] can all be evaluated and predicted by MD in polymers with various chemical structures.
A typical approach in such studies is an investigation of a group of polymers that belong to the same class and have similar properties. Thus, polyimides, an important class of membrane materials, have been extensively studied [5,8,10,12,13,14]. On the other hand, high free volume, highly permeable polymers have attracted great attention [4,7,15]. Very rarely have highly permeable and low permeability polymers been evaluated jointly in a single work using the same technique of calculation (the research by Hofmann et al. [3] is a rare exception).
In this work, we compare the results of atomistic modeling using the molecular dynamics o four glassy polymers with different properties. Two of them are polyetherimides (PEIs), whose structure is shown in Table 1. It can be seen that they have the same dianydride moiety but different diamines. Another pair is represented by isomeric, highly permeable polytricyclononenes containing two SiMe3 groups attached to the main chain differently (Table 1). A detailed study of the latter has already been performed [15]. Some properties of these polymers are compared in Table 2. It shows a dramatic variation in the properties of glassy polymers depending on their chemical structure.
Both PEIs have relatively flexible main chains, which are revealed by their low glass transition temperature as compared with other polyimides. On the other hand, for both Si-containing polytricyclononenes, the glass transition is not observed below the onset of thermal decomposition. PEIs are characterized by very low free volume, which manifests in their fractional free volume (FFV) values. Meanwhile, the FFV values observed for another pair of polymers are among the greatest among all studied polymers [25,26]. Particularly dramatic differences are observed for the gas permeation properties of the two groups of polymers. Permeability coefficients of Si-containing polymers are greater by several orders, while their selectivity is much smaller. So it will be interesting to discover which features of the nanostructures of these materials, as evaluated by MD technique, are responsible for such significant differences in physical properties.
In the present work, as before [15], we consider FFV, available free volume (AFV) and size distribution, following the approach of Hofmann et al. [4]. In such an analysis, AFV is considered only a part of the free volume that can accommodate a probe of a certain size. We also used Delaunay tessellation to analyze the surface of two PEIs. This allowed us to estimate the total specific surface area in these polymers and find out which atoms form the FVE surface.

2. Modeling Details

In this paper, we used the same methodology for preparing the equilibrium amorphous structures of the models as in our previous works [15,27]. Therefore, it will be described here only briefly. Two pairs of polymers, polyetherimides and Si-substituted polytricyclonones, will be considered separately. In both cases, the density of the modeled polymer phases was not used as an input parameter, which was often done in previous studies [3,28], but was calculated for a number of samples with the same chemical structure. Thus, some change in the calculated density can be obtained. This somewhat increases the reliability of the comparison with the experimental density and, moreover, can explain the noticeable density variations of nanometric sample sizes in the models.
The procedure for preparation of representative amorphous structures of the polymers included the following 5 stages [15].
  • Preparation of a dense gas system from 500 monomers in a cubic computational cell with periodic boundary conditions.
  • Obtaining of dense melt at a high temperature (800 K). Affine compression of the cells was performed simultaneously along three directions with a rate of 0.1 Å/ps. So far, their density will be 1.2 g/cm3 for polyetherimides and 0.9 g/cm3 for Si-substituted polytricyclonones. This density value is close to the experimental data given in Table 2.
  • Random polymerization with the avoidance of cyclic formation and relaxation of the system within 1 ns. For this purpose, at each step of molecular dynamic calculation during this process, the end atoms of the monomer or already synthesized oligomer that were located closer than critical distance were connected via a harmonic potential and the forces arising at the same time begin to draw them together. One of the key parameters regulating the polymerization process is a critical distance which gradually increased from 4 Å at the beginning of polymerization process to 12 Å at the end. The polymerization process was considered successful if the degree of polymerization in the model exceeded the specified value (in this case it was more than 20). Upon completion of polymerization, new lists of valent communications for the synthesized polymeric systems were made. A high temperature (800 K) was chosen to increase the mobility of molecules and to increase the probability of approaching the unreacted ends of different molecules.
  • The systems prepared at 800 K were allowed to slowly cool to 300 K at constant volume with a rate 1 K/ps.
  • Then we used the NPT- simulation to relax the systems to a temperature of 300 K and atmospheric pressure, which was carried out for several hundred picoseconds until stationary parameters (density, contributions into the energy of the system valence bonds and valence and torsion angles, nonvalence Lennard–Jones (LJ) and Coulomb interactions) are achieved.
By this method, we prepared 32 independent models for each of the considered polymer systems.
The coordinates and velocities of atoms thus obtained were used as the initial ones for obtaining an equilibrium trajectory with a length of 3 ns. Every 20 ps, coordinates were recorded for further analysis.
Molecular dynamics simulations presented in this work have been performed with the use of the PUMA software package [29,30]. The PCFF force field [31] was employed in simulations, with potentials accounting for the diverse properties of the bonds within macromolecules, such as bond stretching, bending, and dihedral angle rotation around the equilibrium values. Nonbonded interactions were expressed via the LJ 9-6 potential. Moreover, electrostatic interactions arising from partial charges on Si atoms and methylene groups were also taken into account. The cutoff distance for non-bonded interactions was set to 1.05 nm.
For numerical integration of the equations of motion, the Verlet velocity algorithm [32] was used. The integration step was 1 fs. Temperature in the system was maintained by means of a collisional thermostat [33,34] with the parameters λ = 5.0 ps−1 and m0 = 1 a.u. As a result, viscosity of the system increased insignificantly (by ~10−2 cP). Pressure was set and maintained with the barostat described by Berendsen et al. [35].

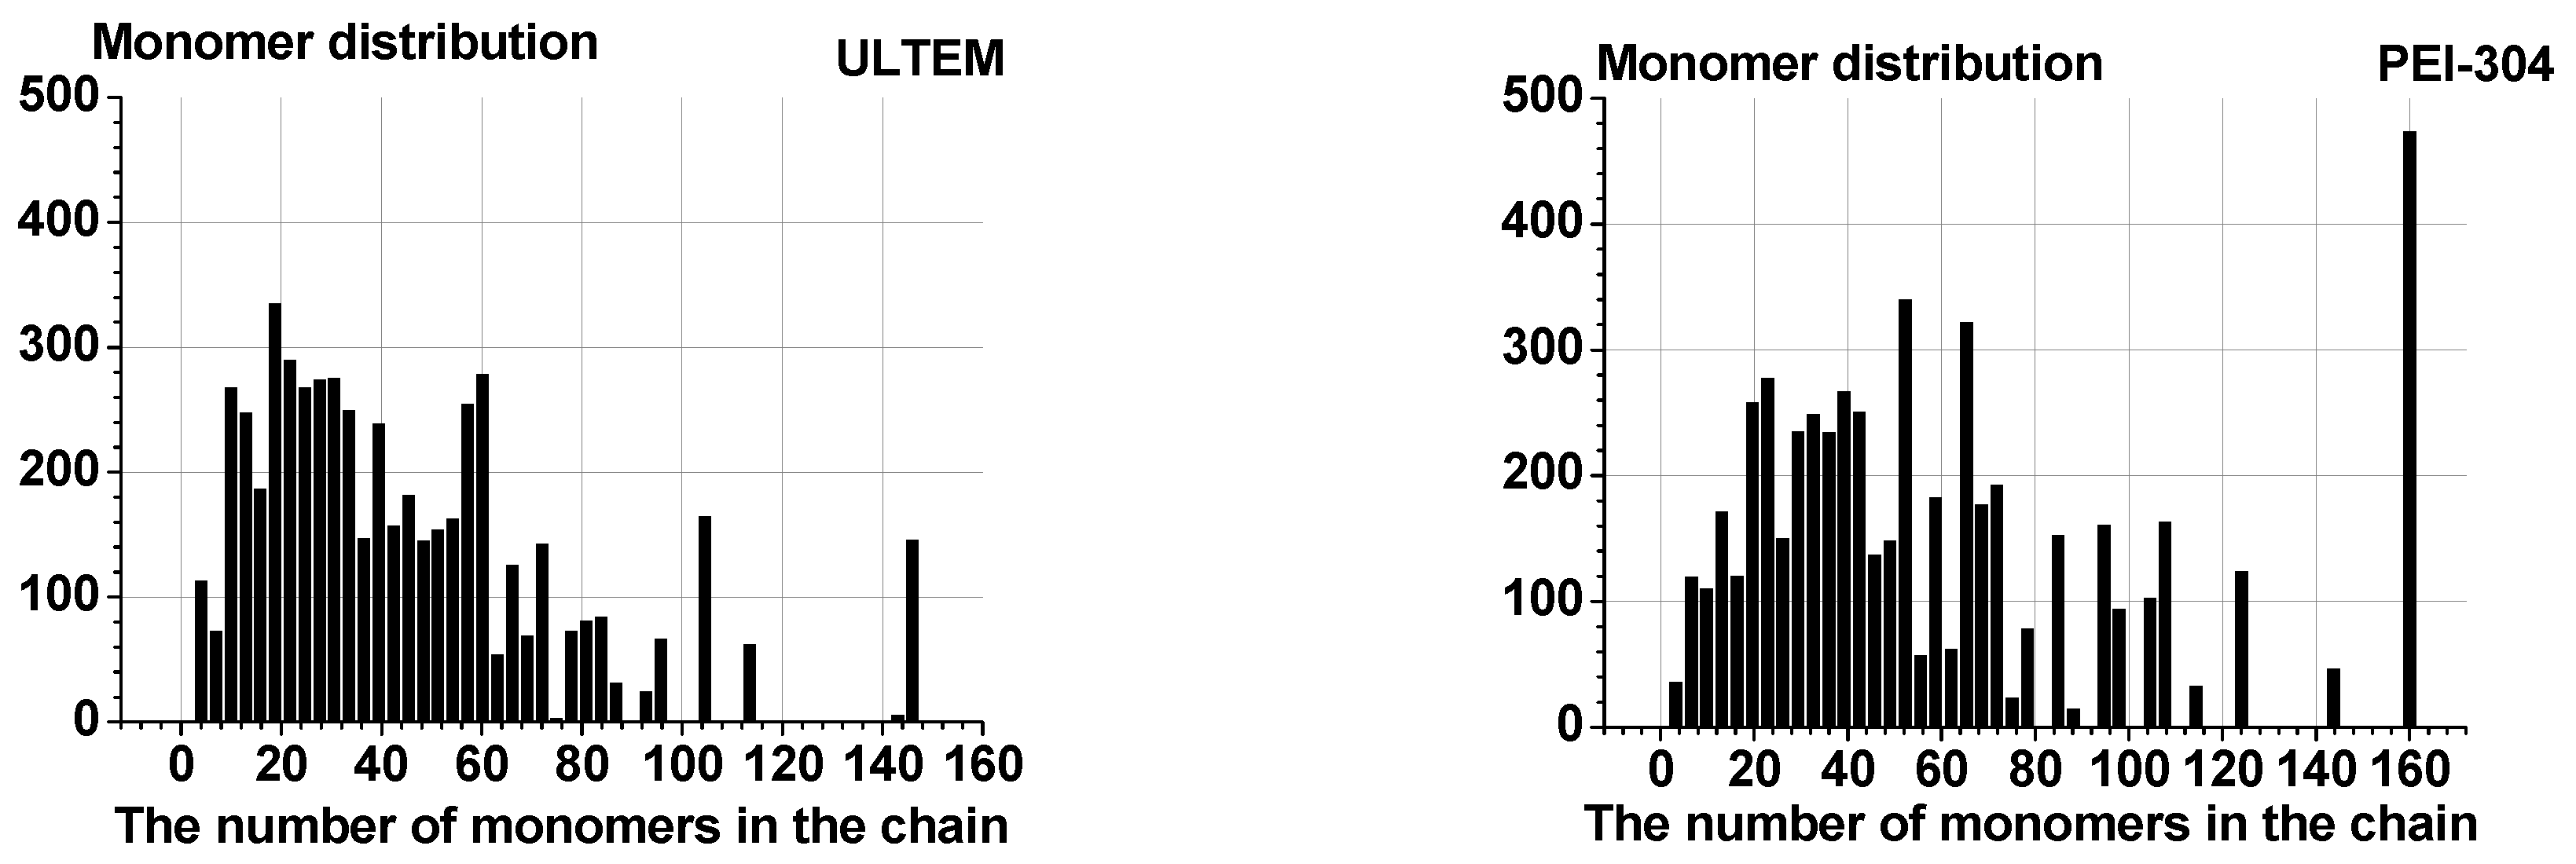
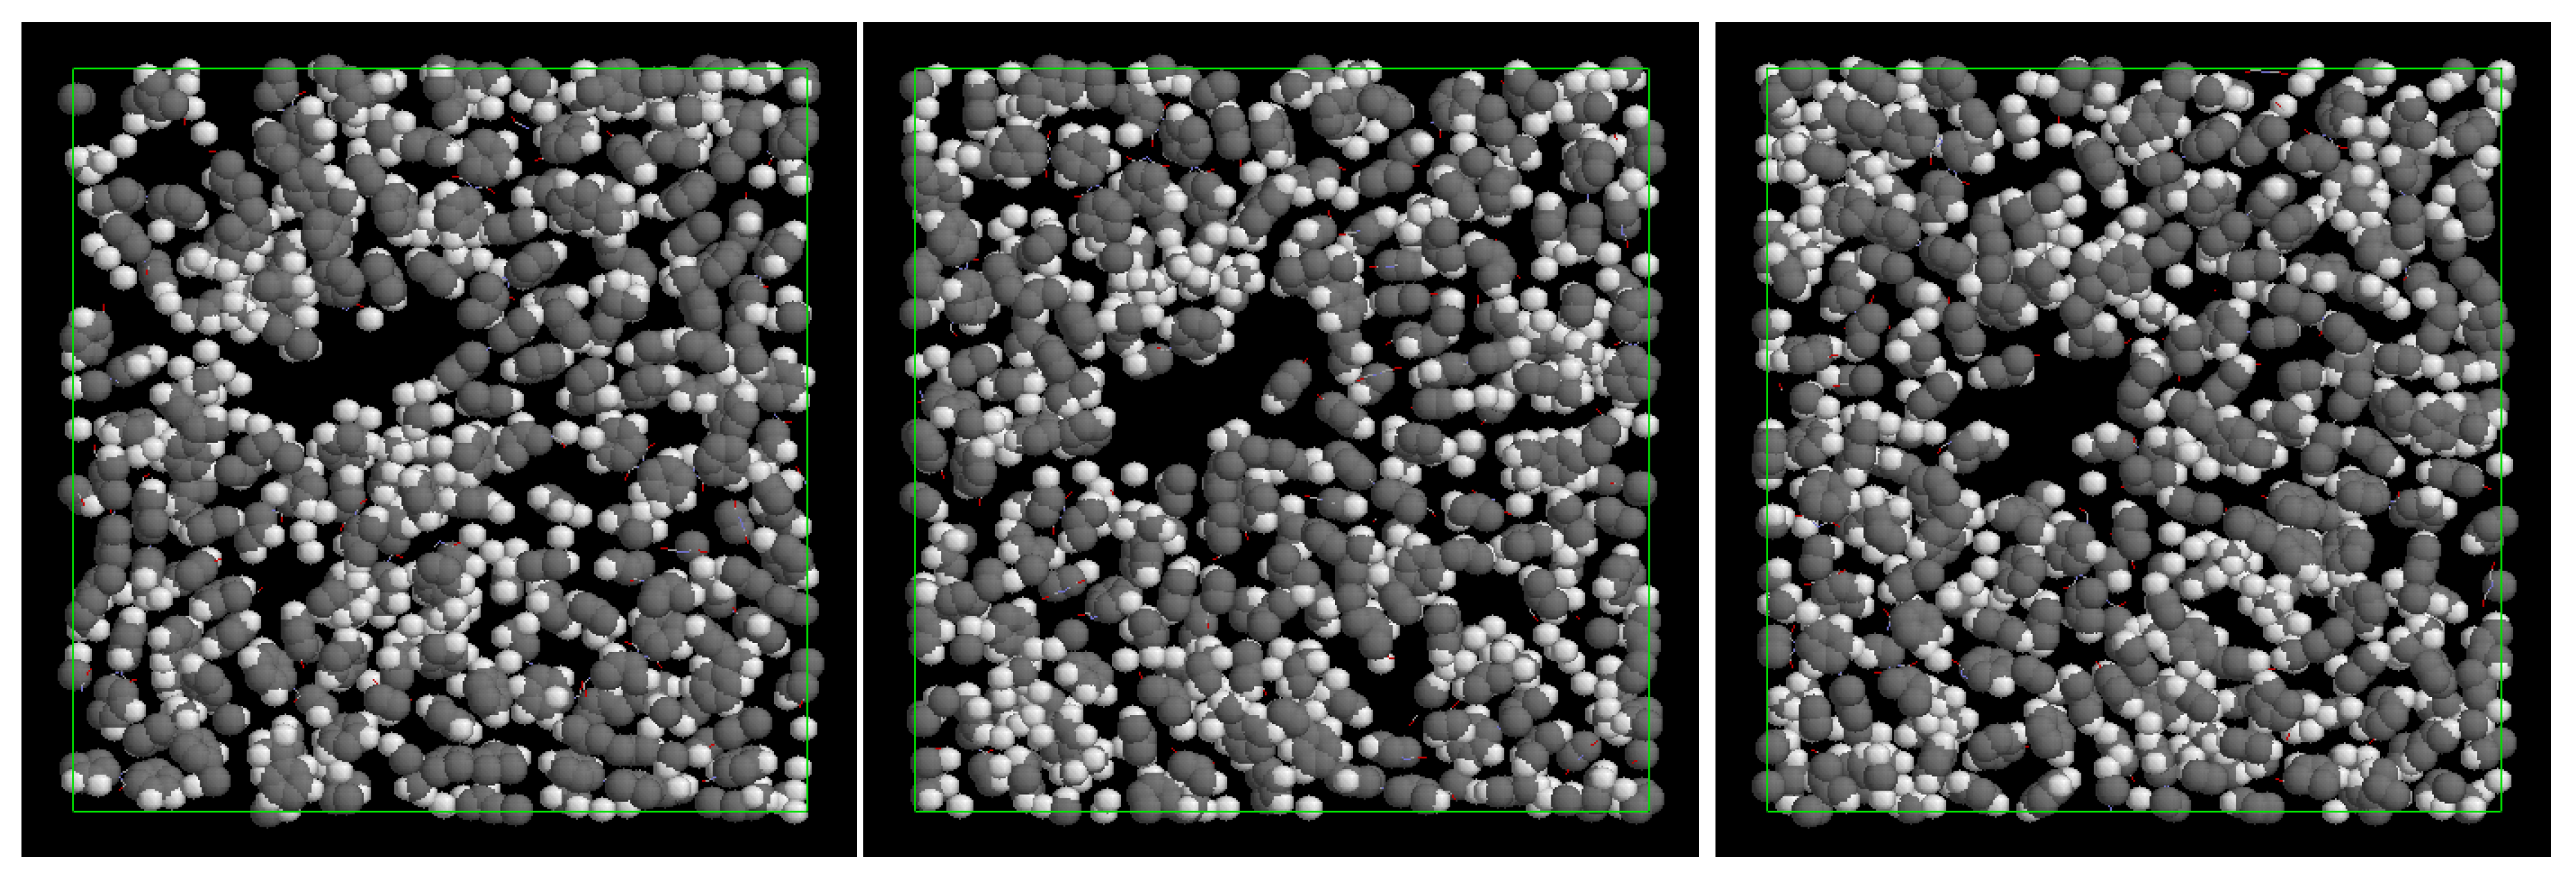
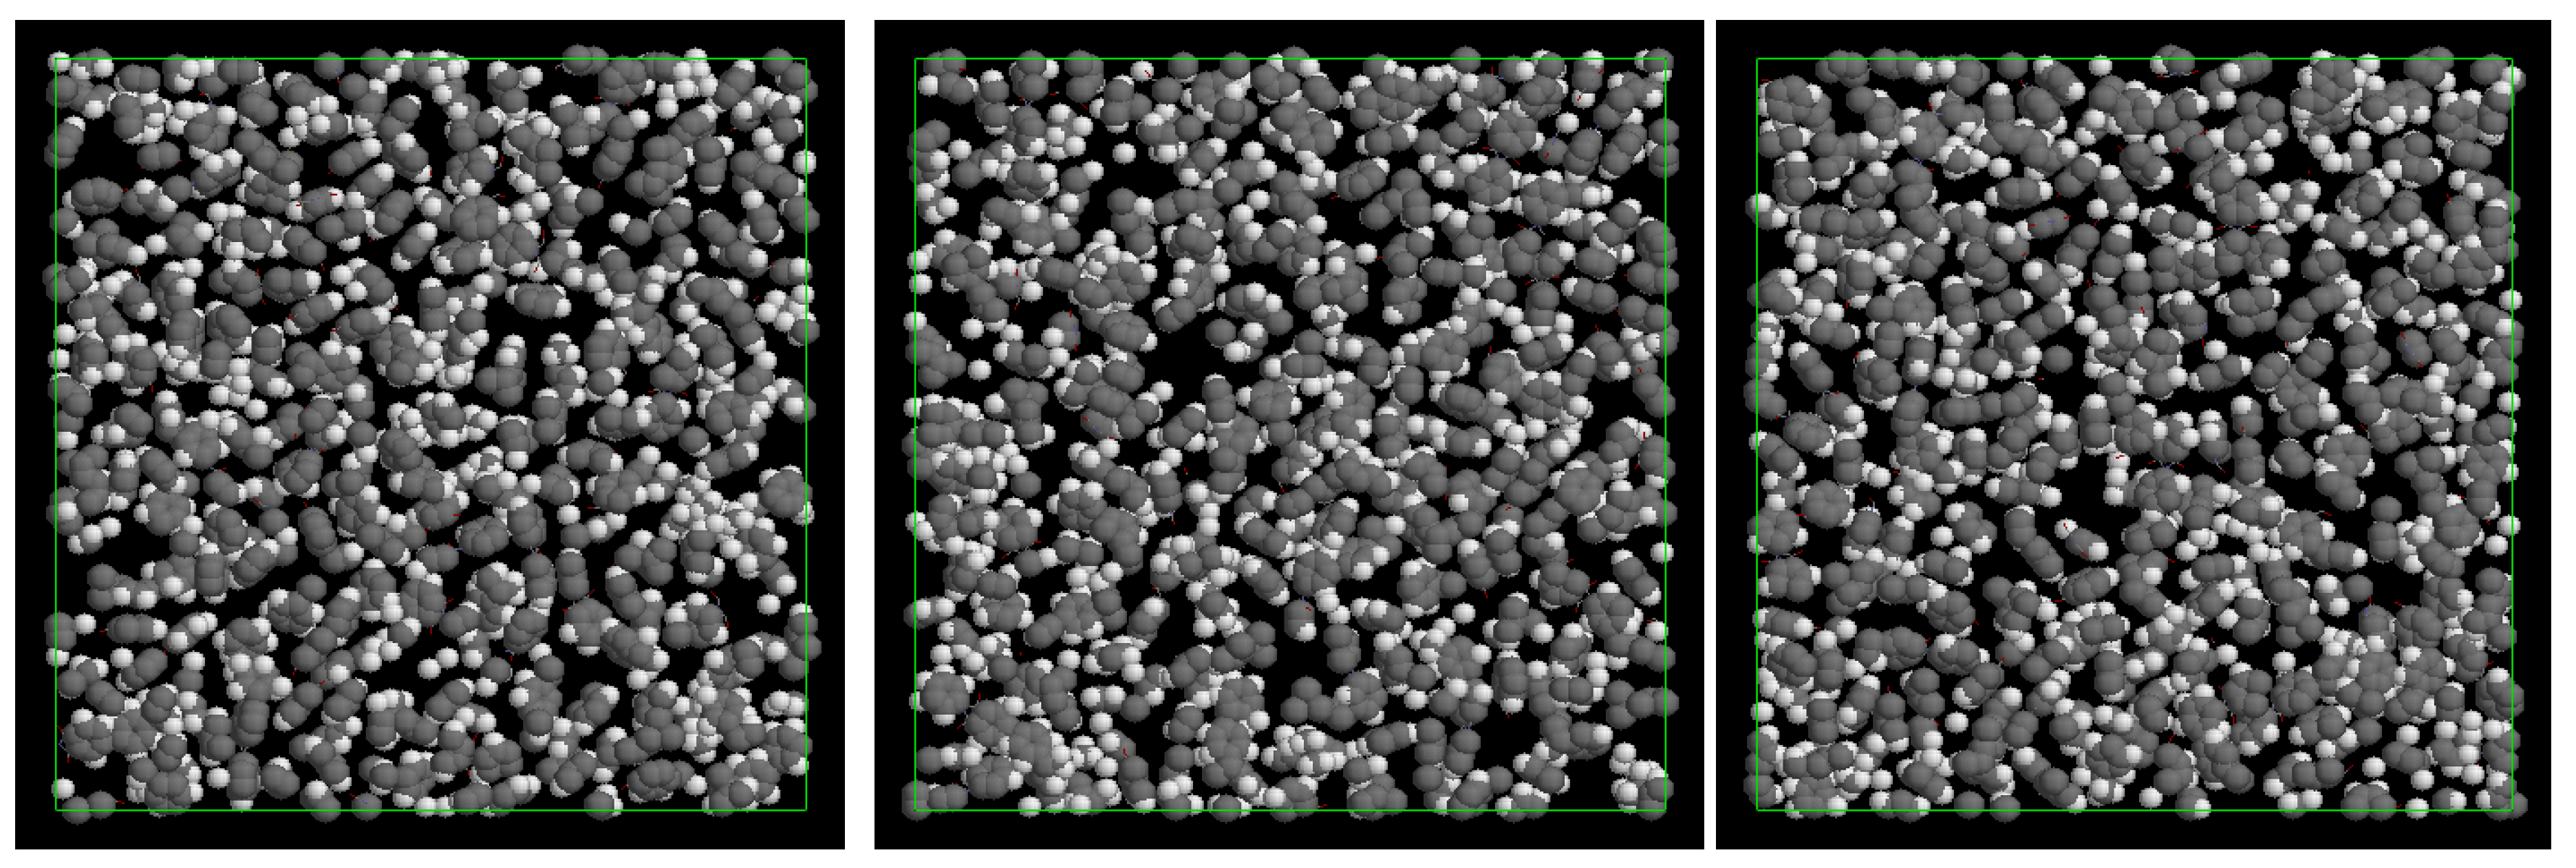
3. Description of Obtained Samples

For both polyethterimides, such calculations were conducted simultaneously for 32 independent samples. The average edge size of the resulting computational cells was 7.3 nm for Ultem and 8.5 nm for PEI-304. The details on molecular masses of the samples are given in Table 3.
The obtained molecular masses (Mn and Mw) are typical for polyimides. The distribution over the chain lengths obtained as a result of the polymerization carried out was quite wide. Most of the chains contained several dozen of the repeat units, but there were also those whose lengths reached hundreds of repeat units or even higher (Figure 1).
For different Ultem samples, the calculated density was in the range 1.275–1.295 g/cm3, with an average value of 1.284 g/cm3 (Figure 2, left). For PEI-304, the computed density varied in an even narrower range of 1.375–1.395 g/cm3, with an average density of 1.378 g/cm3 (Figure 2, right). This is in a good agreement with the experimental density presented in Table 2. Since the number of chains in the samples varied greatly, we checked whether the number of end groups affects the density of the samples. As shown in the Supporting Information section (Figure S1), unlike polytricyclononenes that we considered earlier [15], no such dependence was found.
A comparison with the results of the modeling of highly permeable Si-containing polymers [15] also shows that the length distribution of the chains of the two prepared polytricyclononenes is somewhat different from that obtained for PEIs. In size distributions of chains of Si-containing polymers, more sharp maxima are observed (at chain numbers of 20–30) and “tails” that extend up to the number of the chains close to 200. In contrast to this, in PEIs, a wide maximum is observed for the number of chains from about 20–60. In polytricyclononenes, the calculated density varies in somewhat wider ranges than in the case of PEIs. It is likely that we encountered stronger sensitivity of the amorphous phases of polymers of high free volume to the conditions of their formation. It was revealed that there was worse agreement between experimental and predicted densities, sensitivity of high free volume materials to treatments such as immersing into alcohols, and a wider variation of the experimental densities, as has been noted in Ref. [15].
The root-mean-square end-to-end distance was proportional to the power function of the number of repeat units, with indices γ = 0.45 ± 0.02 and 0.48 ± 0.02 for Ultem and PEI-304, respectively (Figure S2). This indicates an almost random conformation of the molecule in our model.

4. Comparison of Free Volume in Low Permeability and Highly Permeable Polymers

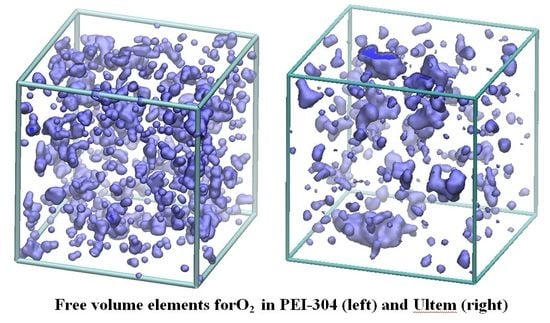
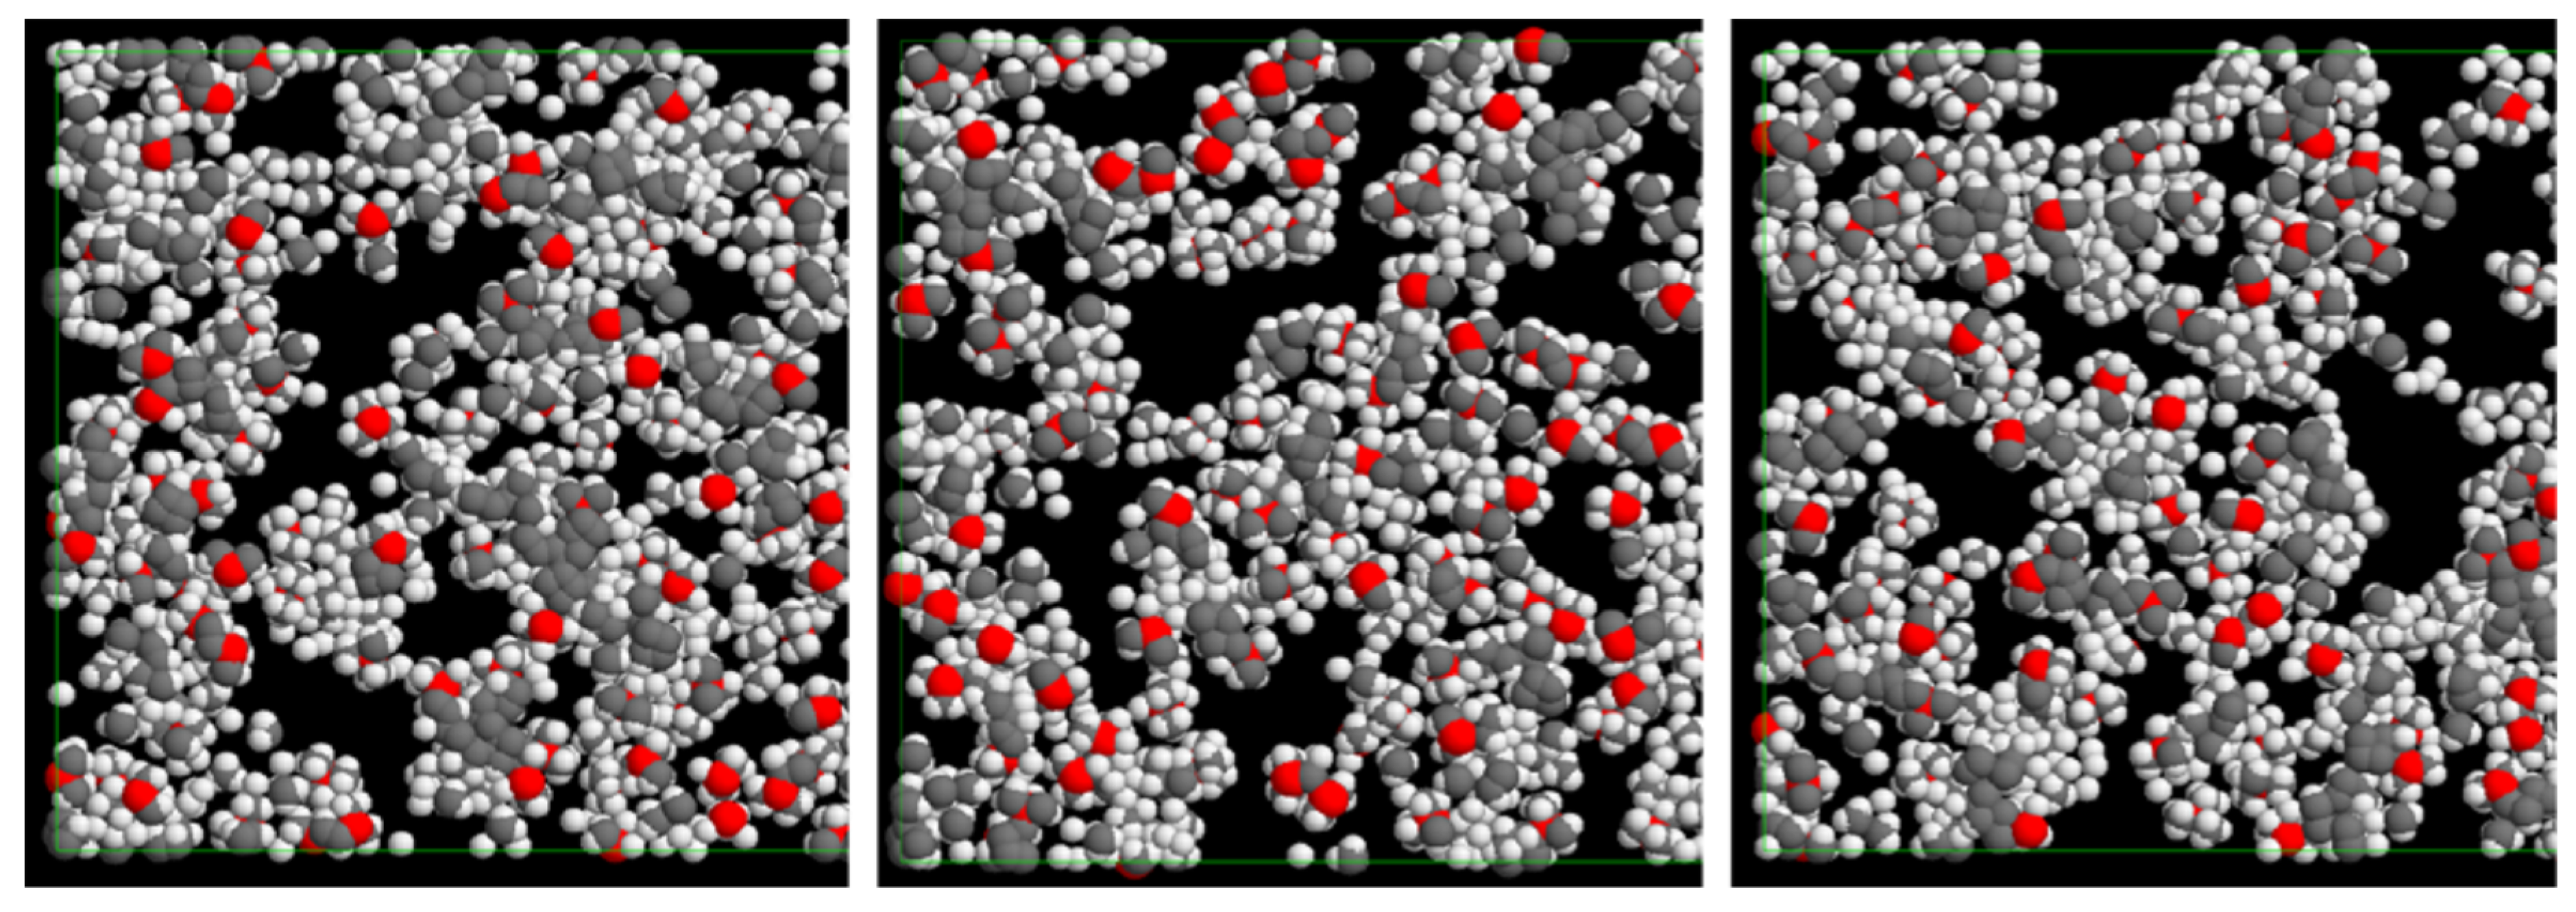
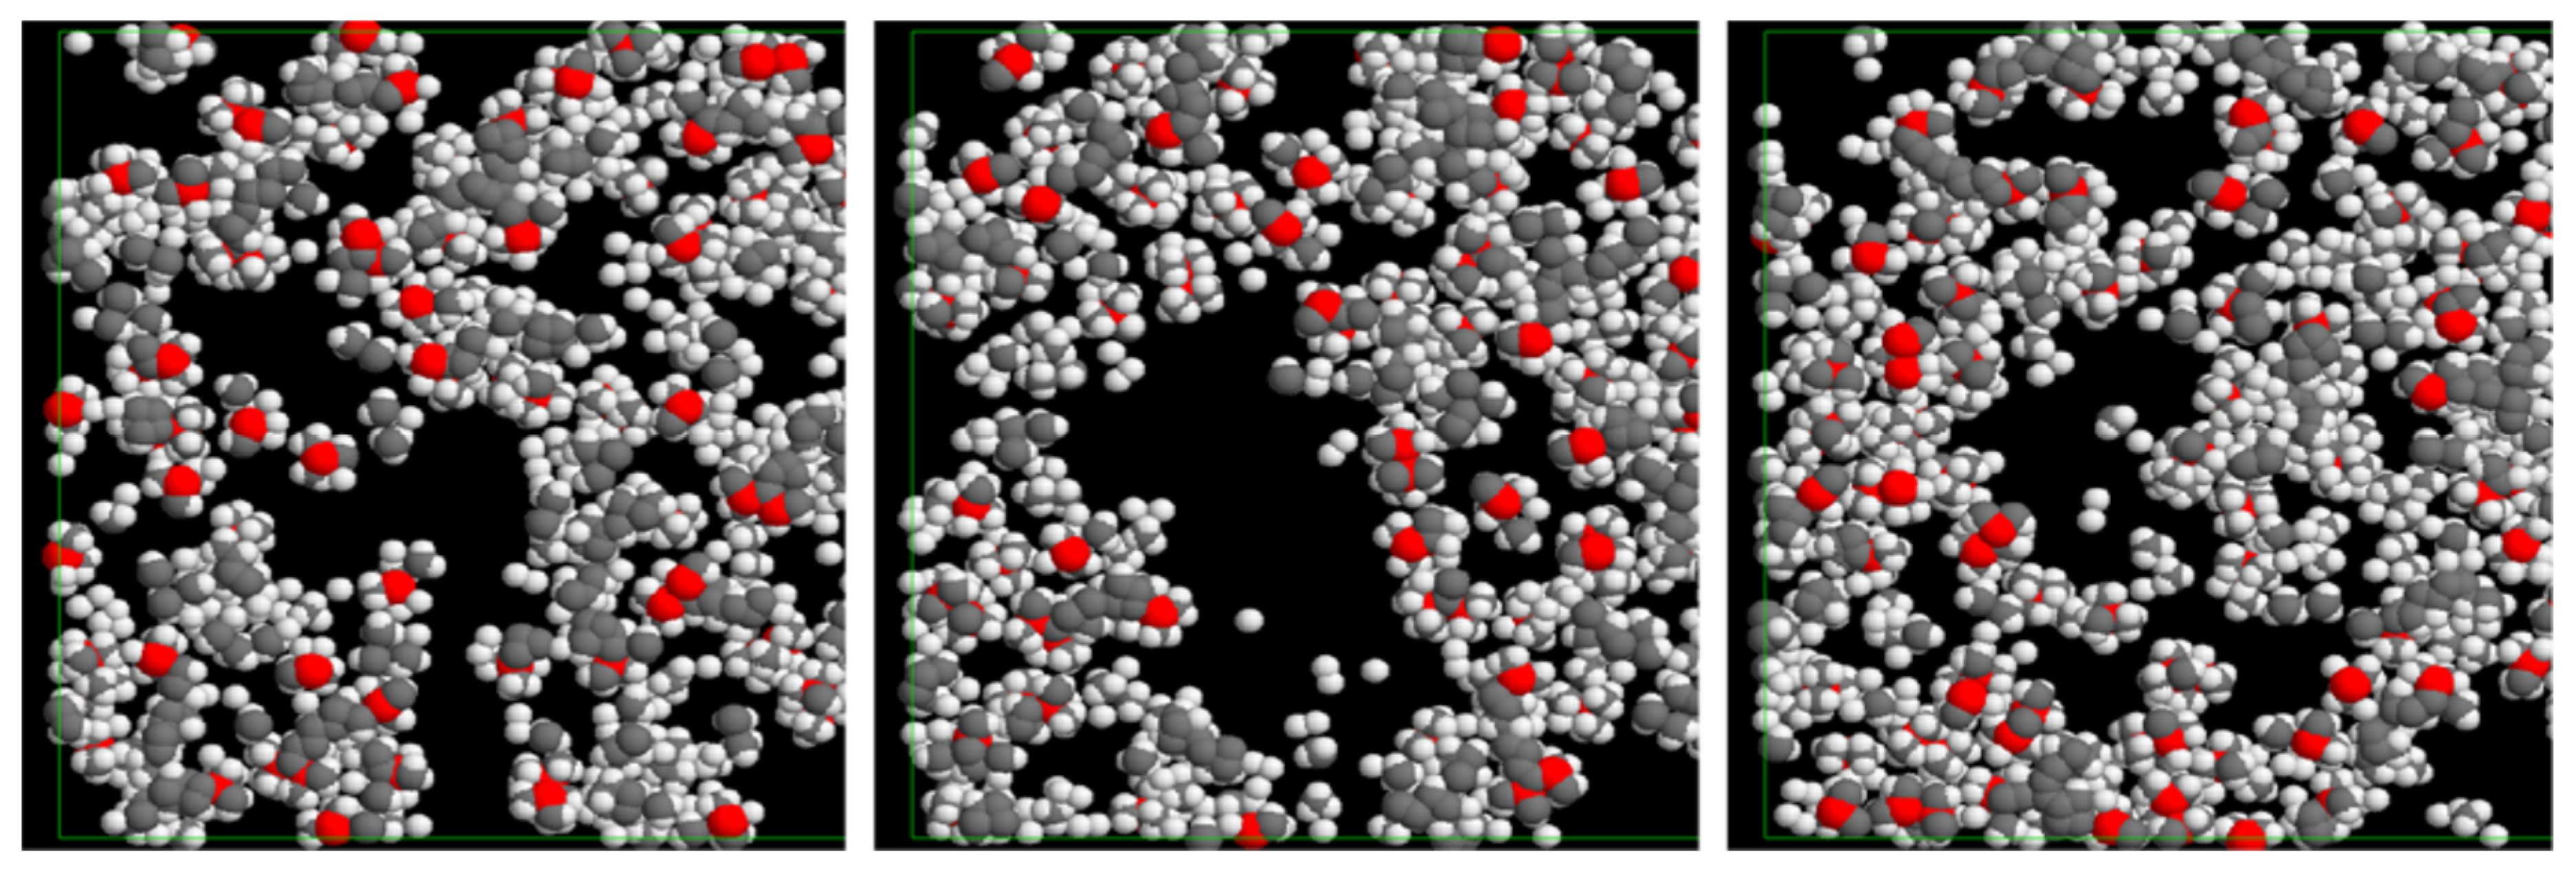
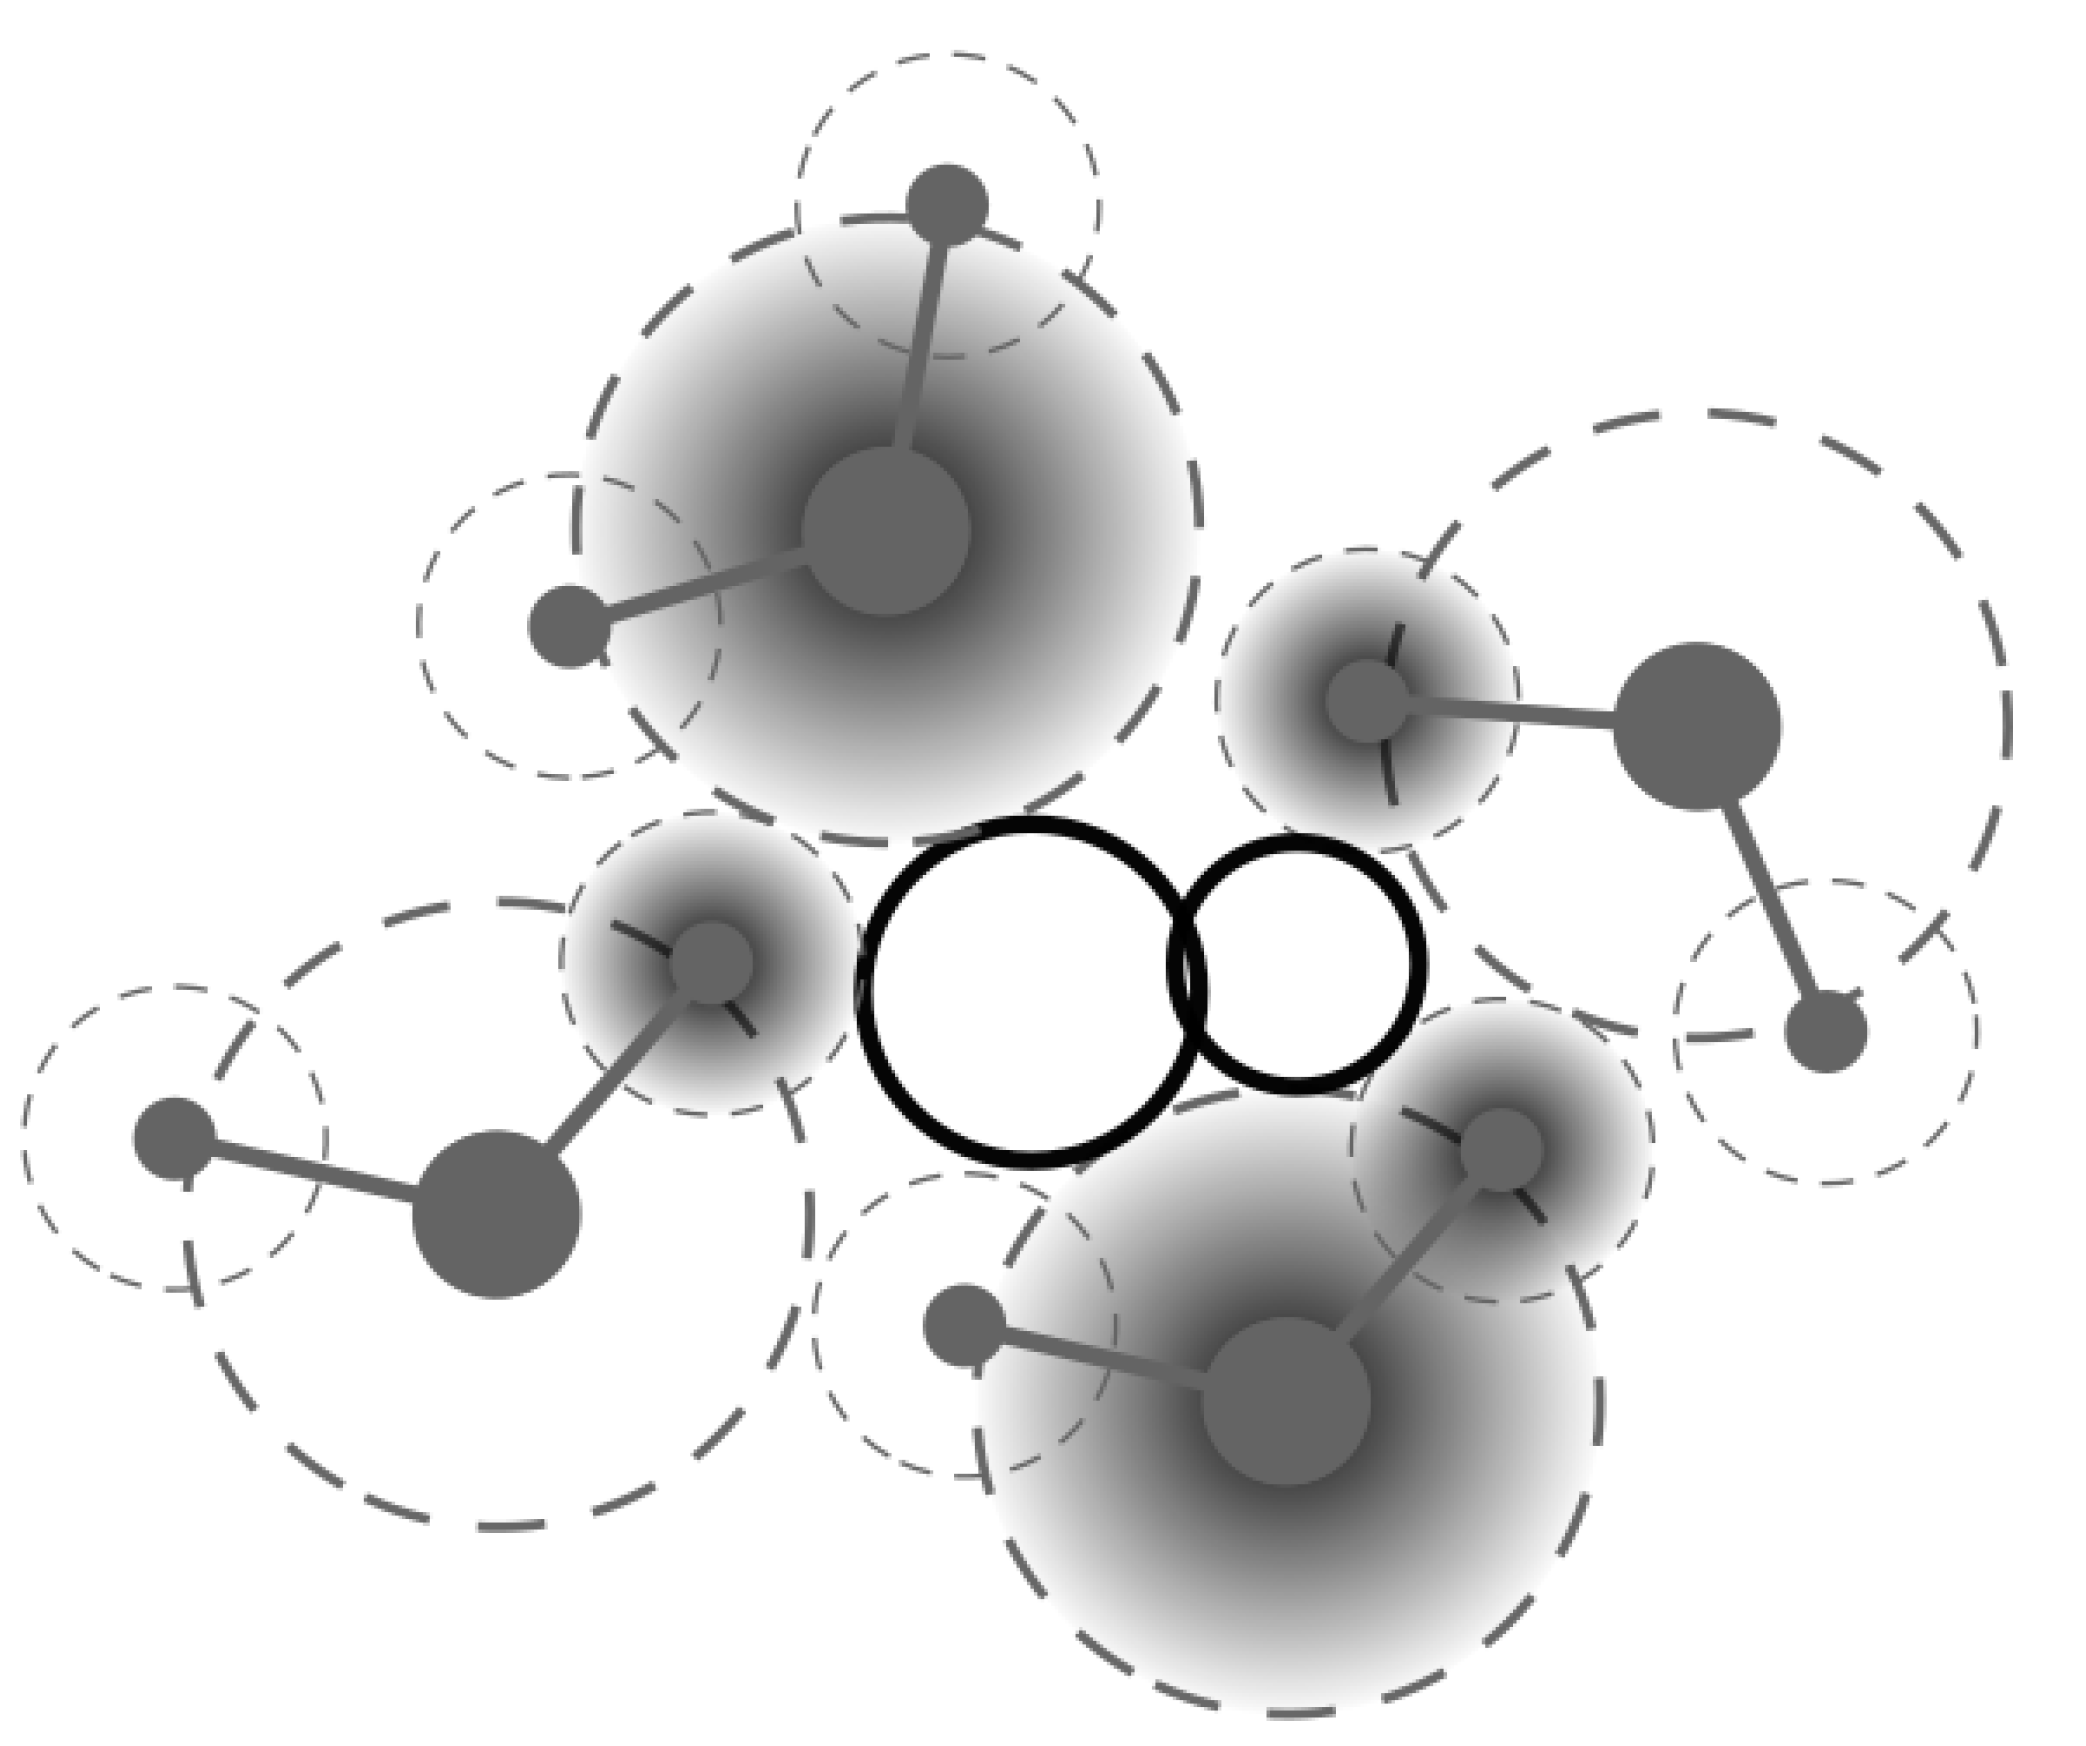
4.1. Visualization of Free Volume

A visualization of the free volume in the considered glassy polymers is shown in Figure 3 and Figure 4 for polyethetrimides (seen in more detail in Figures S3 and S4) and Figure 5 and Figure 6 for polytricyclononenes.
For both PEIs, the dense packing of the chains and small size of visible FVEs are characteristic. In their cases, if a larger FVE is seen at a slice, on the next one that is displaced from the former by 0.35 nm, it disappears. This means that the size of the FVE is smaller than the distance between considered slices used in cutting the cubic model cells. Such a tendency is typical for both PEIs. However, on some slices, one can discern larger FVEs, which are surrounded by a dense polymer matrix. This observation will be discussed in more length while considering the size distribution of the free volume of these polymers.
In contrast to this, both highly permeable Si-containing polymers exhibit much larger FVEs that sometimes form clusters whose size is comparable to the size of the cell. The same clusters are seen on several adjoining slices. This is especially evident for PTCNSi2g.

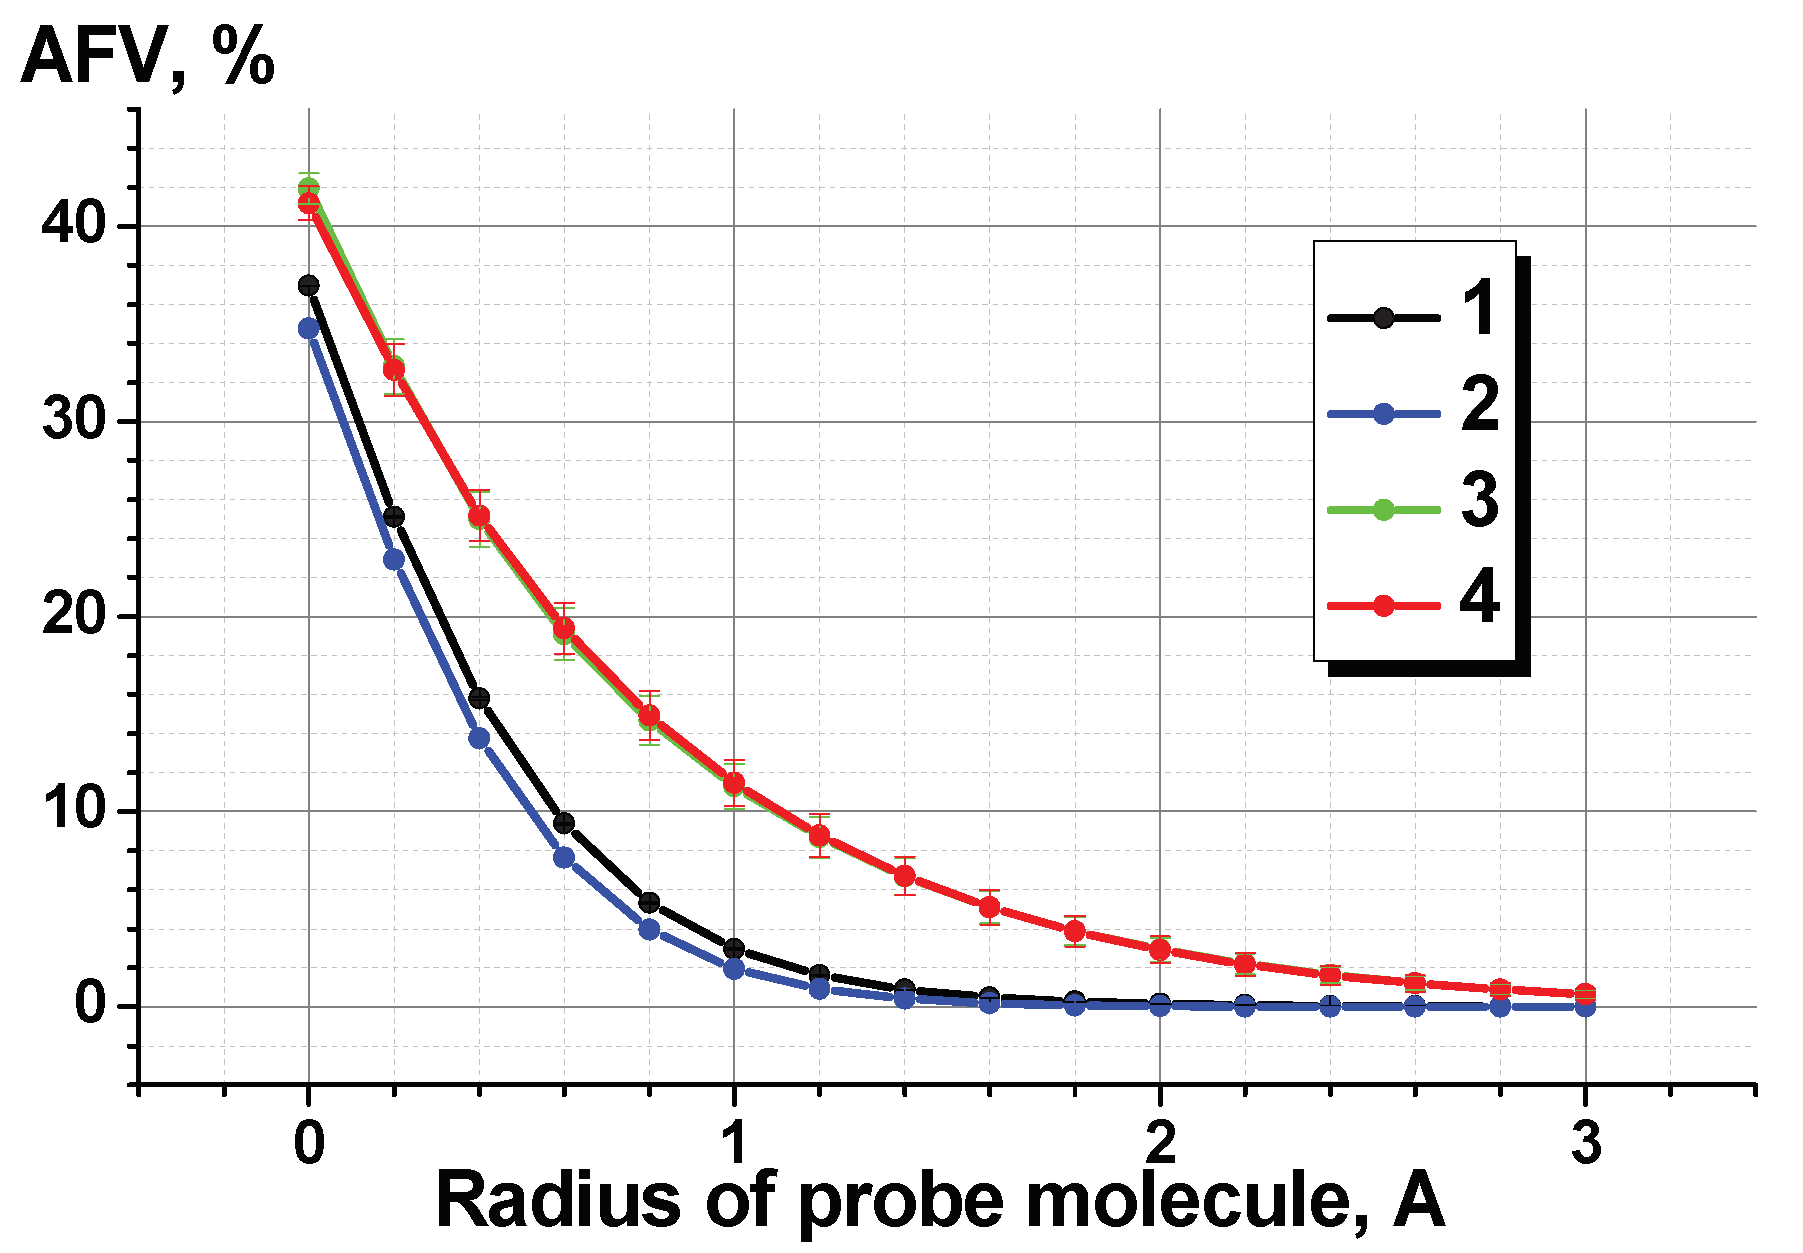
4.2. Accessible Free Volume as a Function of Probe Size

In preparation to investigate the size distribution of free volume and AFV, the so-called V connect approach [3] was used [15]. Atoms of polymer chains were considered as hard spheres with van der Waals radii. The computational cell was divided into 100 parts along each coordinate axis. Thus, we threw a three-dimensional grid onto the sample with the cell size δ equal to L/N, where L is the edge of the computational cell. For Ultem and PEI-304, the grid cell sizes were δ ≈ 0.73 Å and δ ≈ 0.85 Å, respectively. If the grid node did not fall on the polymer atom, this node was considered “free”. The number of such nodes, multiplied by the volume of the grid cell, determined the free volume. The same procedure was used to determine AFV, only in this case, the van der Waals atomic radii increased by the radius of the test particle. Preliminary calculations showed that a further decrease in the grid step δ did not practically affect the results of the calculations performed. In particular, when this was reduced by three times, the relative change in the value of the available volume did not exceed 0.05%, that is, it did not exceed the standard calculation error. The FFV and AFF values thus obtained were averaged over the time trajectories and over all 32 samples. Interesting information appears from this analysis that the accessible free volume could be “sensed” by using probes of different size (Figure 7). One can see that the two pairs of studied polymers form two groups of curves. The highly permeable Si-containing polymers are represented by the curves located above the ones characteristic for the two PEIs. Meanwhile, they cross the ordinate axis in the same area (35–41%). So, the differences in the accessible free volume of the two groups of polymers were especially significant for larger probes (radii of 1 ± 0.5 Å). The same behavior has been observed earlier for PIs [8], PTMSP [36], and in our previous work [15]. This observation is in agreement with the results of previous research by Greenfield and Theodorou [37], according to which a hypothetical diffusant of radius of ca. 0.9 Å or less can percolate through a polymer structure, that is, an infinite cluster was present there for such small probe. This critical size is close to the size of positronium (o-Ps), therefore, the similar size distribution of free volume for this probe in PEIs and highly permeable Si-containing polymers becomes understandable. The same is true for similar values of AFV on the ordinates for a zero probe size for the two groups of polymers. A sharper decline in the curves from the sample radius for PEIs explains the higher selectivity of this group of polymers compared to highly permeable Si-containing polymers (Table 2).

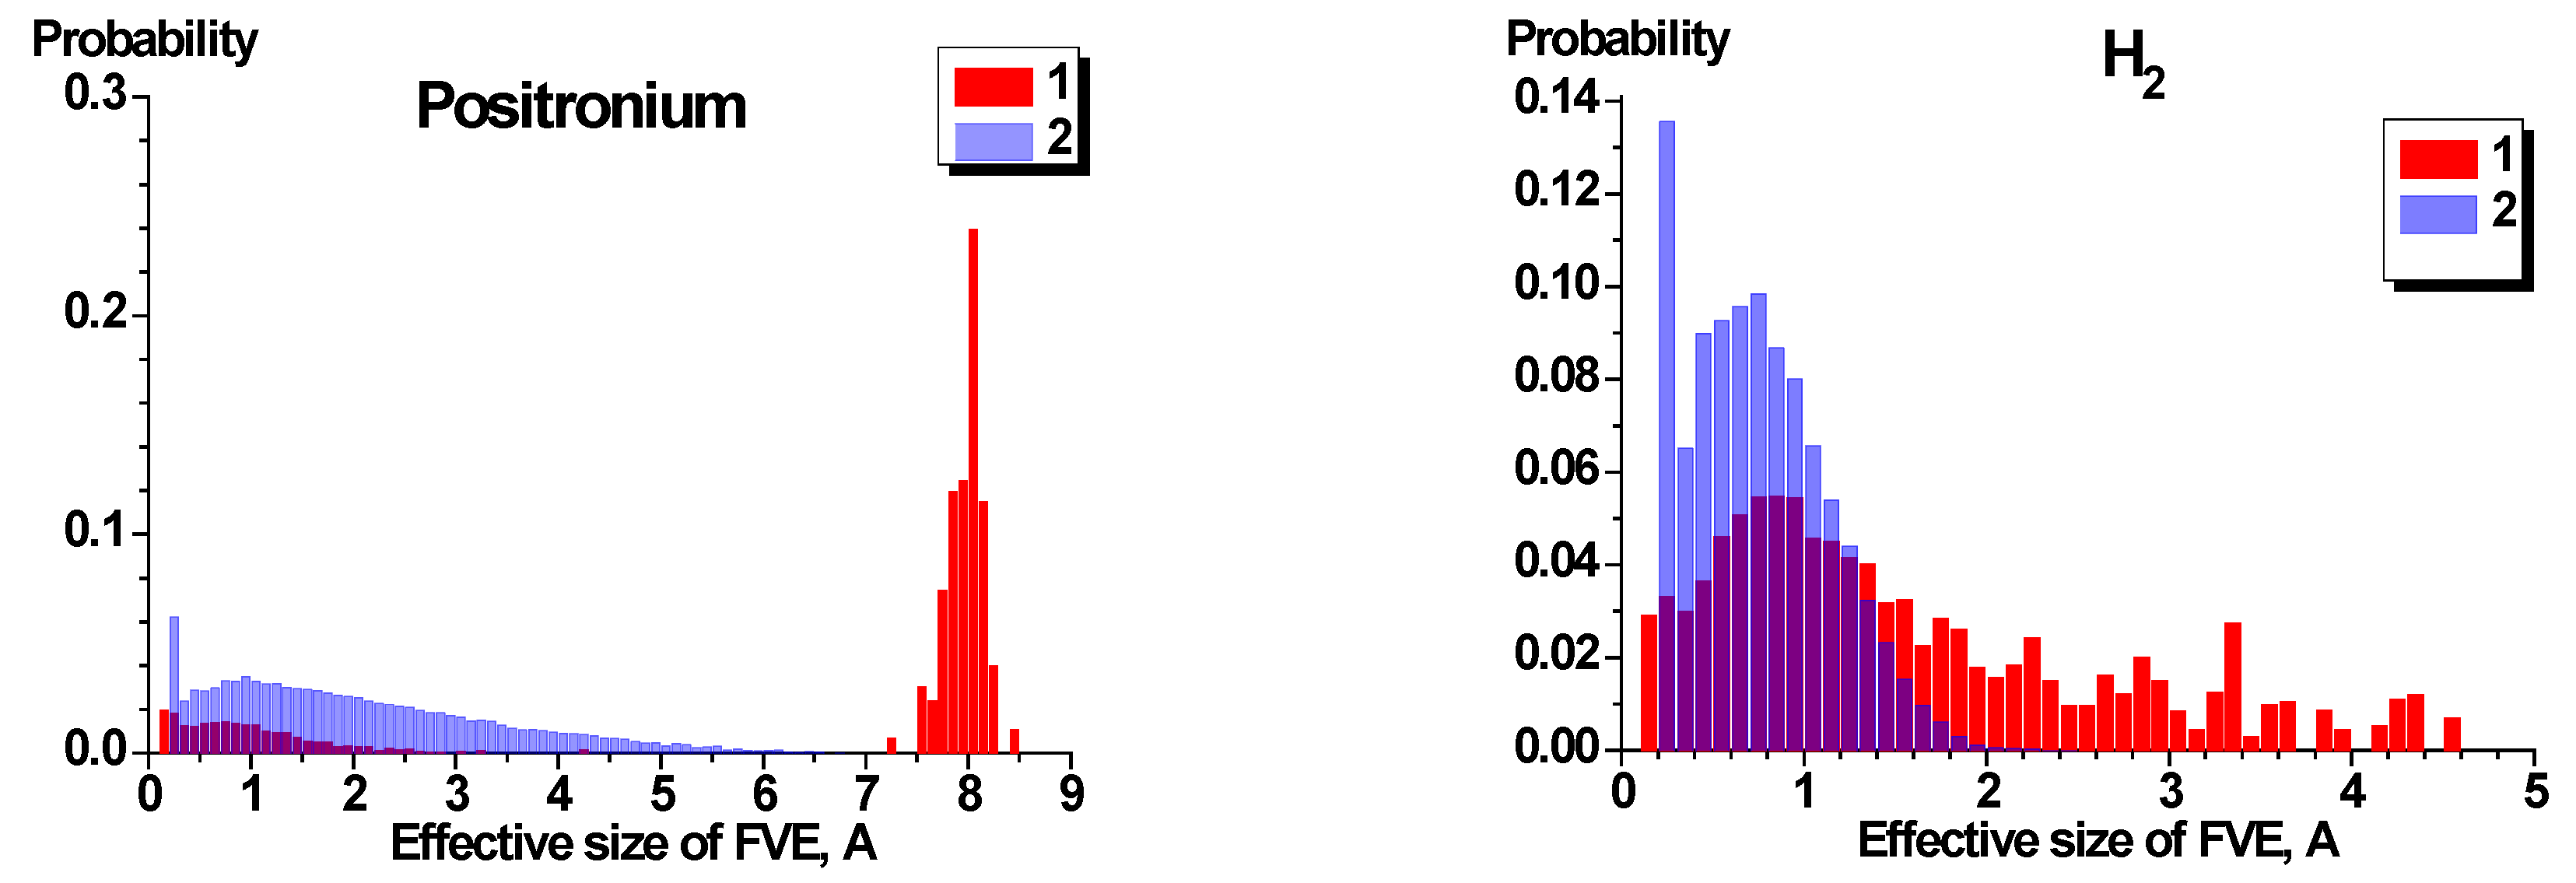
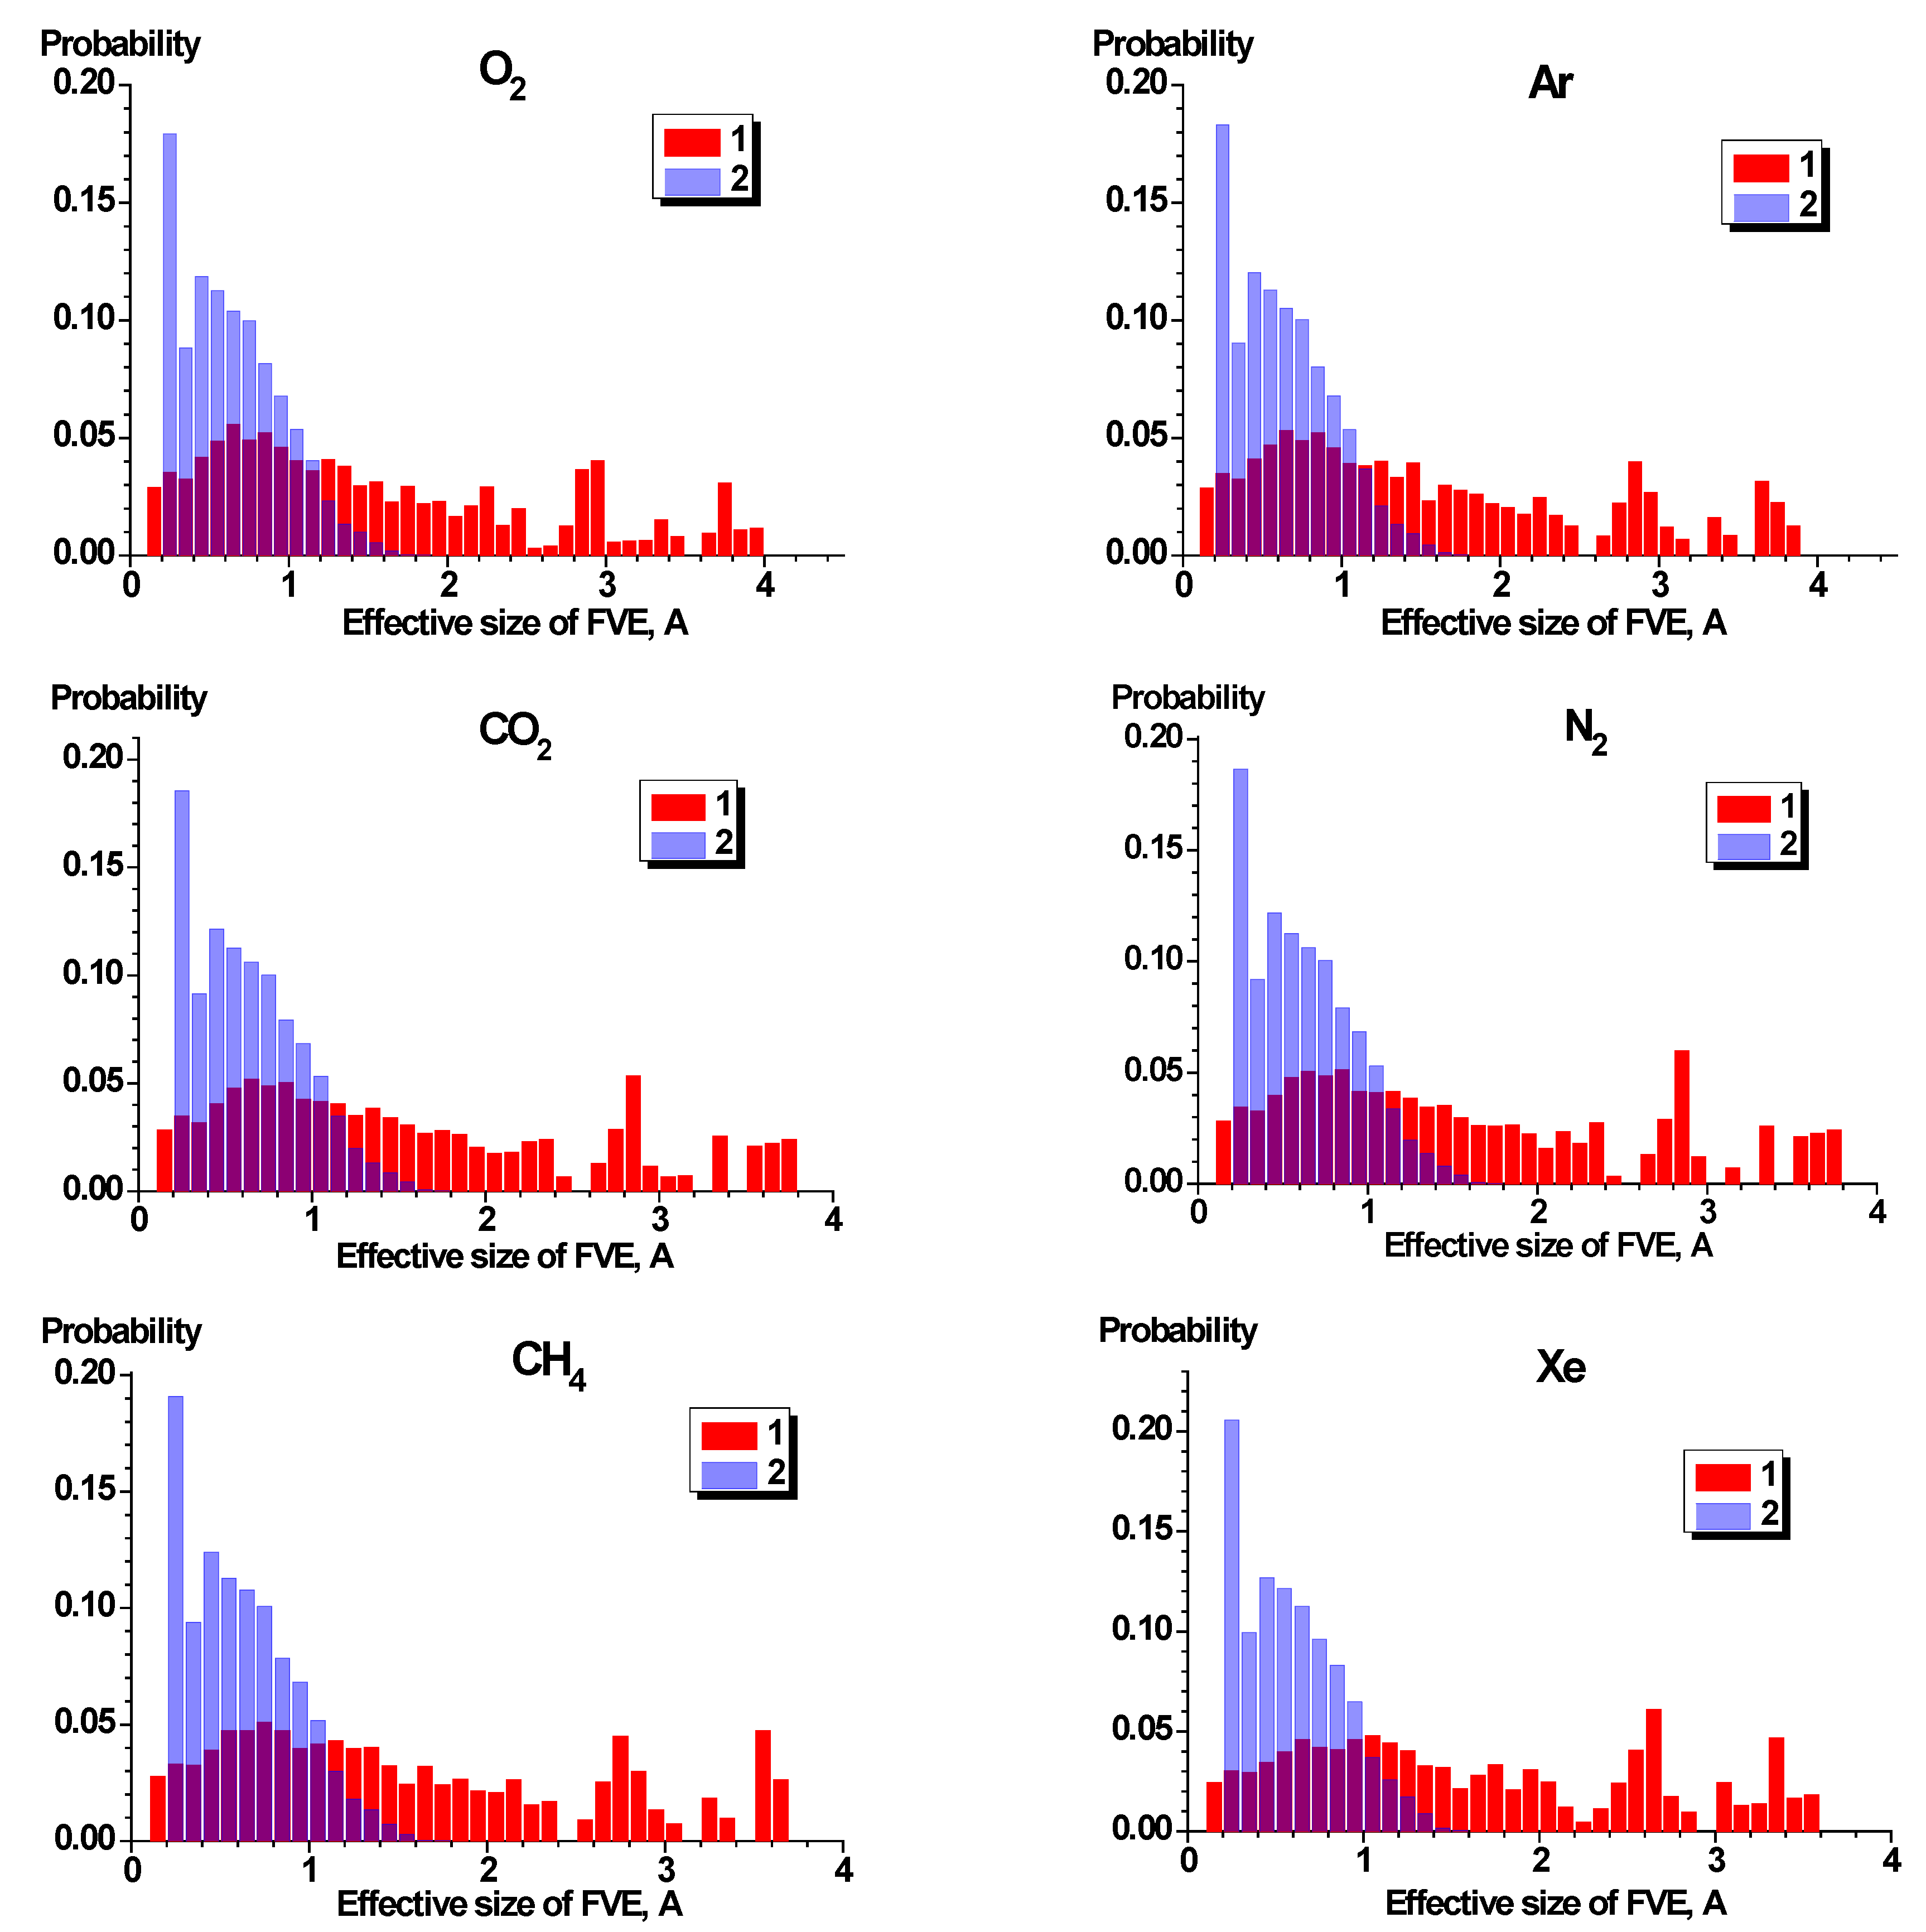
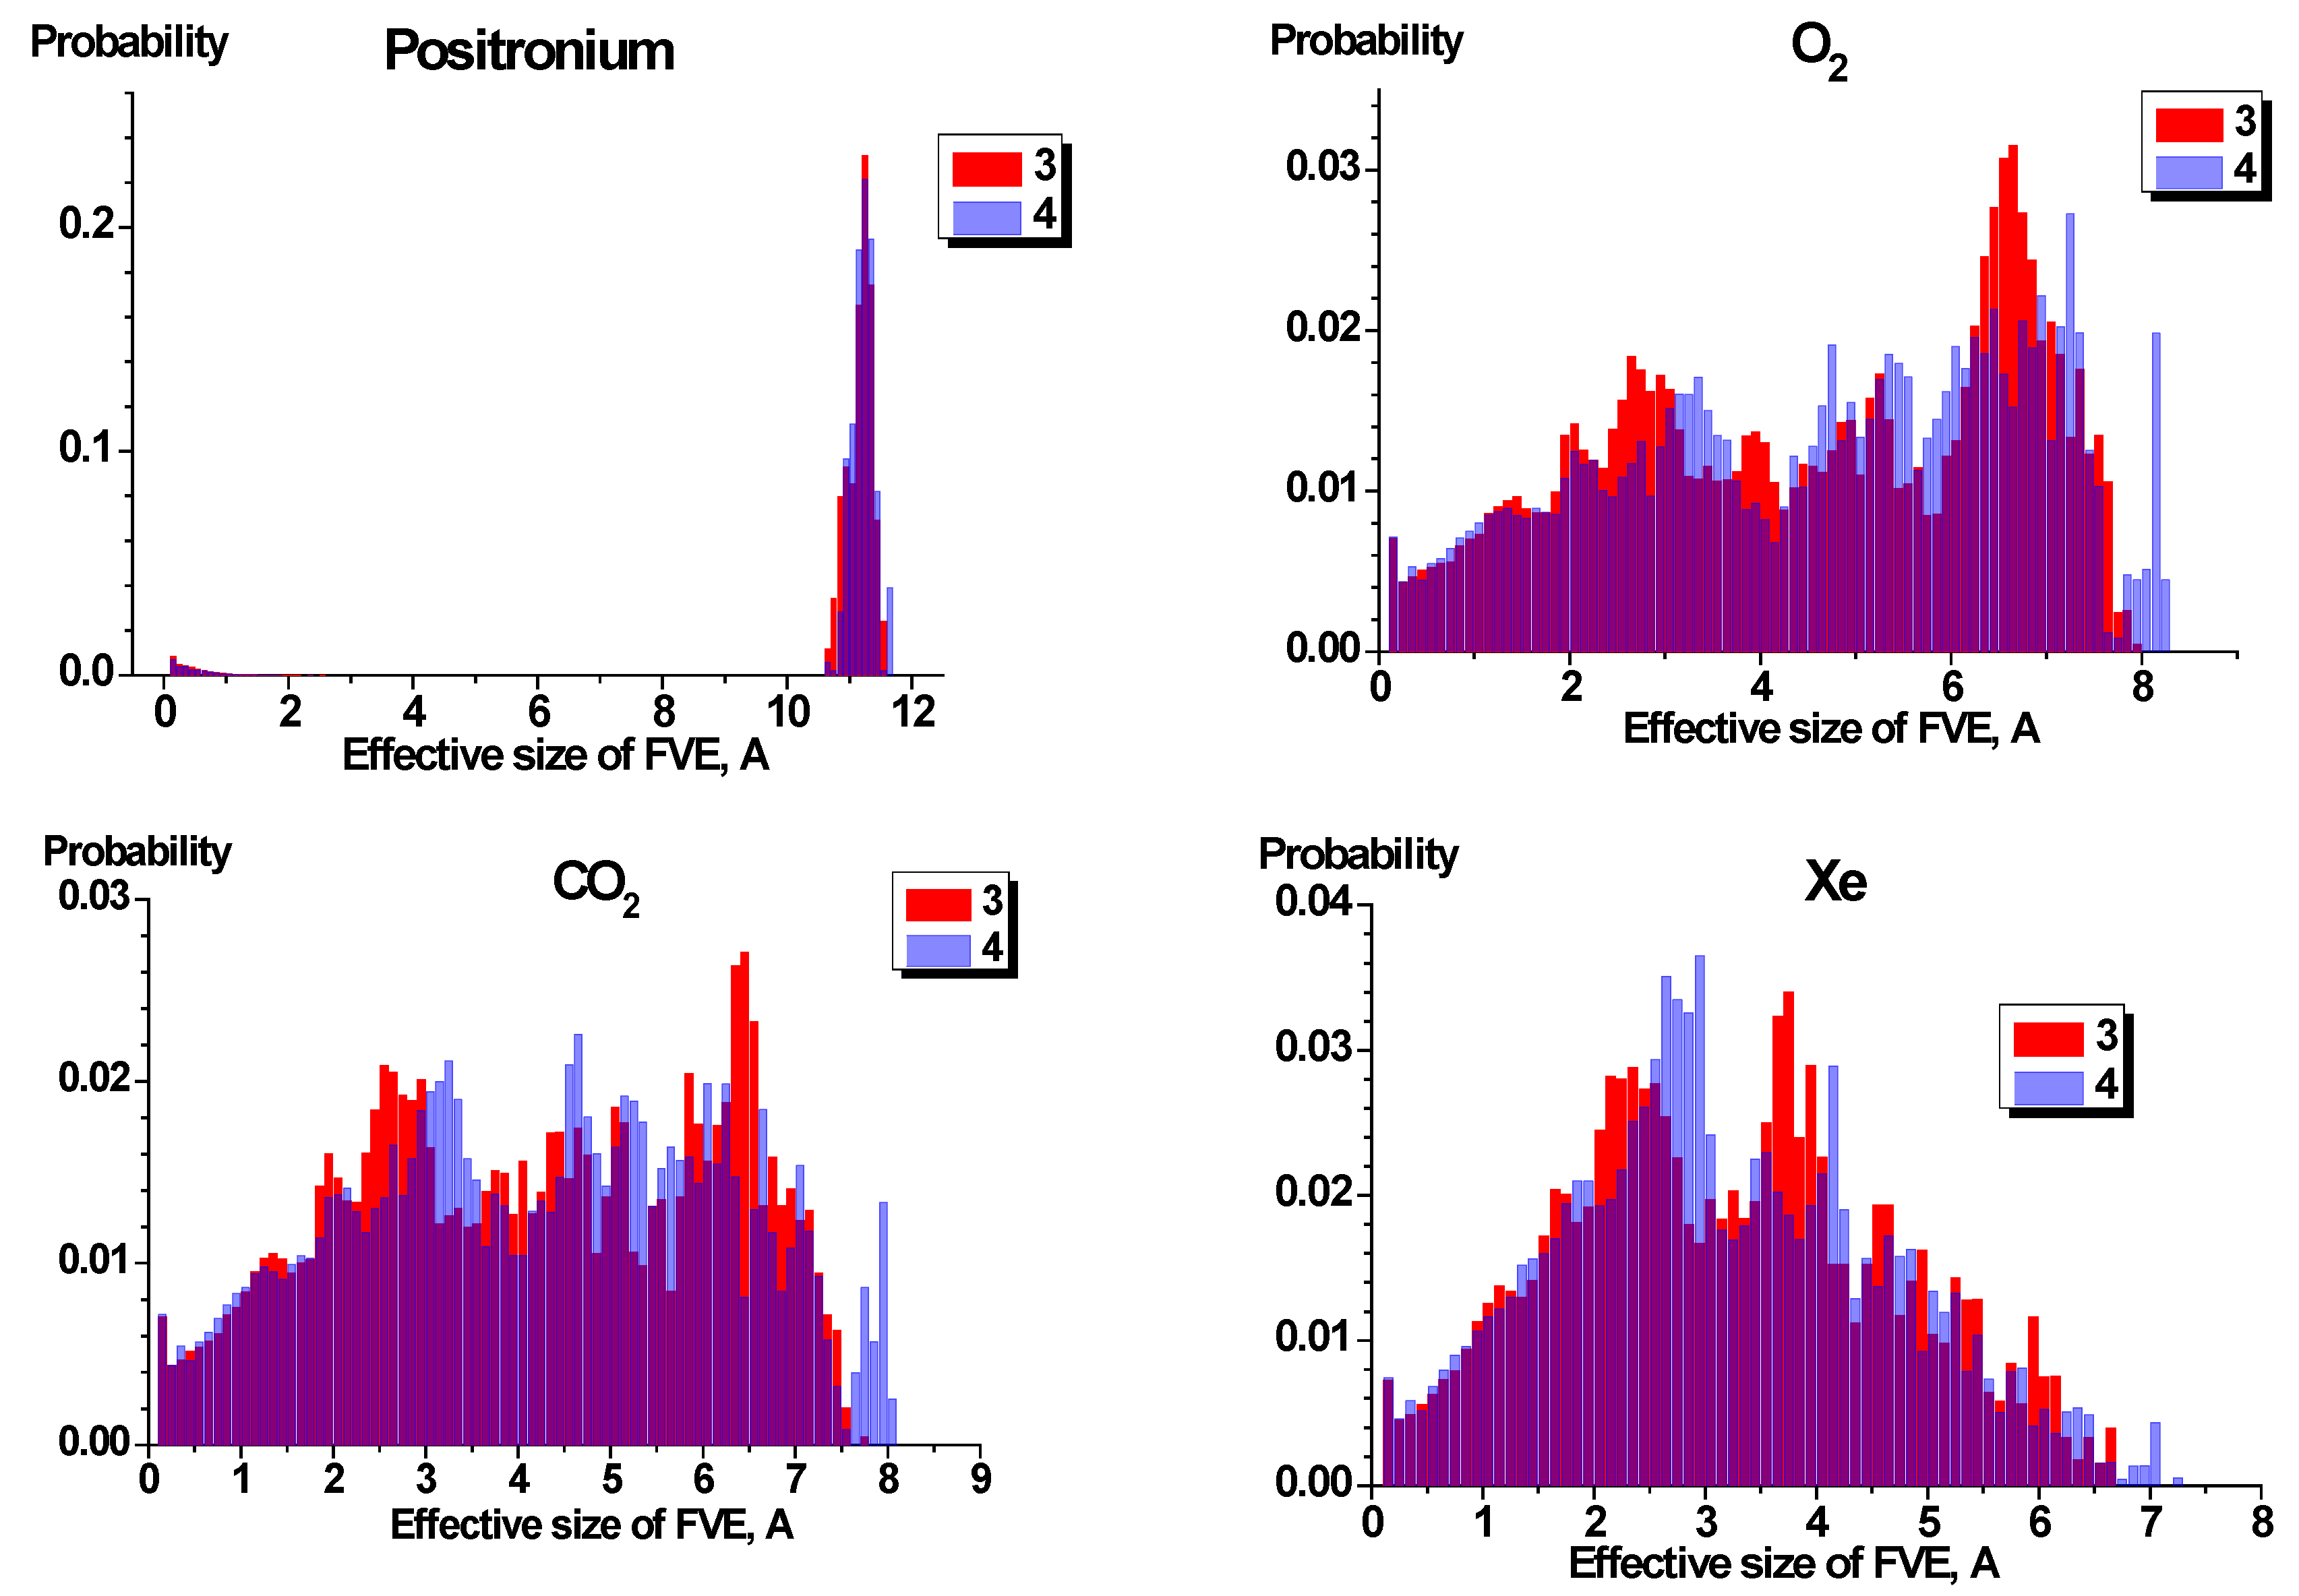
5. Size Distribution of Free Volume

Figure 8 shows the bar graph of the size distribution of FVE in two PEIs for test particles of different sizes. Size distributions of free volume were calculated for the following gaseous probes with the sizes (in Å) according to Teplyakov and Meares [38]: o-Ps (1.06), H2 (2.14), O2 (2.89), N2 (3.04), Ar (2.97), CO2 (3.02), CH4 (3.14), and Xe (3.52). For describing the size of FVE, we used the radius of the effective sphere, the volume of which is equal to the volume of FVE [3,4,5,6,7].
For all gaseous probes starting from H2, the same character of FVE size distribution of free volume can be observed: a relatively sharp peak for PEI-304 and a broader peak for Ultem. The maxima of all size distributions are located in the range of 0.5–1.0 Å. The more narrow distributions of FVE for PEI-304 compared to Ultem explain the larger selectivity of PEI-304 (Table 2). Another size distribution can be observed for the probe with minimum dimension, o-Ps. This is represented by a sharp peak in the vicinity of 8 Å and a wide asymmetric peak in the range of 1–2 Å.
It is interesting to compare the obtained size distributions of free volume with those obtained for highly permeable Si-containing polymers [15] and for other PIs [5]. Heuchel et al. [5] simulated a number of PIs with permeability coefficients P(O2) in the range of 124 ± 45 Barrer. Polyetherimides that are the subject of our work correspond to the least permeable PIs from the work by Heuchel et al. [5] (PMDA-ODA and 6FDA-DDS). They reported the size distribution of free volume for these polymers as rather similar to that shown in Figure 8, a broad peak in the range of 1.5–4 Å.
A big difference is obvious in the comparison of size distributions of PEIs (Figure 8) and highly permeable Si-substituted polytricyclononenes [15] (Figure 9).
The plots for O2, CO2, and Xe as probes reveal a very broad peak extended up to 7–8 Å (Figure 9). Similar dependences were observed earlier for other gases in the probes (H2, Ar, N2, CH4). Wide distributions of FVE for Si-containing polymers correspond to their low selectivity (Table 2). Qualitatively different size distribution can be observed for o-Ps as a probe. It is similar to that observed for both PEIs, however, in that the sharp peak is located at a larger size of the free volume (11–12 Å).

6. Analysis of the Surface of Free Volume Element

6.1. Procedures for Analysis of FVE

Delaunay simplexes and the program FreeSASA [39] were used for the analysis of an inner surface of FVEs. Delaunay simplexes (in three-dimensional space, they are tetrahedrons) characterize the interatomic space, since the spheres formed through the apexes of these tetrahedrons contain no particles. Delaunay simplexes were calculated using the algorithm for a system with periodic boundary conditions [40]. The computational cell was in the form of a rectangular parallelepiped.
To illustrate this approach on a two-dimensional model, Figure 10 shows several disks depicting the atoms of the polymer matrix that form the FVE. In order to take into account the size of the test particle, the radius of these disks was equal to the sum of the van der Waals radii of the atoms and the test particles. In the center of the picture, there are two disks (“Delaunay spheres”), each of which touches three atoms (their surface is partially darkened). Delaunay spheres that intersect or touch each other are combined into one FVE. Probe molecules with a center of mass inside this FVE will not overlap with the atoms of the polymer. The FreeSASA program [39], which is widely used in the analysis of internal cavities in biological systems [41,42,43], was used to analyze the surface of pores.

6.2. Results on FVE Surface Analysis

The approach used allowed an estimation of the specific surface area to be “sensed” by probes of different radii. The data are given in Table 4. Some of the results of this table seem quite unexpected. First, for the zero-size probe, all the found surface area values are very high, which is especially unexpected for PEIs. It implies that at this scale, the surface has very tortuous shape.
For the zero-size probe, the found surface area of PEIs and highly permeable polymers are comparable. However, when the size of the probes increases, the S/m values for PEIs decrease more dramatically and for the largest probe sizes, they reach quite modest values. The calculated values of the specific surface area can be compared with the results of the estimation of this parameter via the BET method. It should be taken into account, however, that this method is based on measuring sorption of nitrogen at 77 K. At low temperatures, the diffusion of nitrogen is very slow, so only part of the inner surface can be reached by N2 molecules. According to [44,45], the size (radius) of an N2 molecule is 1.8–1.9 Å. Therefore, a comparison is reasonable only for the largest probe size (the last line of Table 4). It can be seen that for this case the specific surface area reaches rather modest values. It can be compared with some BET-specific surface areas reported in the literature: 33–60 m2/g for BPDA polyimides [46] and 70 m2/g for 6FDA-HSBF polyimide [47].
For highly permeable Si-containing polymers, the BET-specific surface areas have already been reported [25,26]. For PTCNSi2v and PTCNSi2g, 650 and 790 m2/g have been obtained, respectively. It can be seen that this is close to the values shown in the last line of Table 4 for these polymers. Interestingly, PTCNSi2g reveals higher values of the specific surface area at all values of the probe size. For these polymers too, very high values of the specific surface area at the zero-size probe also imply a tortuous structure of the inner surface

6.3. Nature of the Groups Forming the Surface of FVEs

The approach used allowed us to estimate the number of different atomic groups forming the walls of FVEs in both PEIs. The results are presented in Table 5 and Table 6. The most common atom groups in the walls of FVEs in both PEI are CH groups of aromatic rings, 60–71%. This result seems to be expected, because both PEIs contain numerous aromatic rings. Despite the fact that carbon with sp3 hybridization and oxygen in carbonyl groups make up a small percentage of all atoms of the polymers under consideration, they are relatively common in the walls of the FVEs of both PEI. An interesting result was obtained for PEI-304. The FVE surface of this polymer is enriched with fluorine, the source of which is the –C(CF3)2– groups, which appear only once in a repeat unit. A decreased surface energy characteristic for the CF groups appears to imply that fluorine tends to strive to the surface of the FVE in this polymer. Further modeling of fluorinated polymers would likely provide additional information about this effect.

7. Conclusions

In this work, we compared the two pairs of glassy polymers: low permeability, but highly permselective polyetherimides (Ultem and PEI-304) and highly permeable polytricyclononenes substituted by SiMe3 groups. They differed strongly by gas permeability. Molecular dynamics confirmed that this difference in gas transport properties can be explained by the differences in size distributions of free volume in the two groups of polymers. PEIs are characterized by denser chain packing and peaks in size distribution of free volume exemplified by much smaller radii of FVEs. The two groups of polymers also differed by the AFV values at the intermediate-sized probes. For PEI they were markedly lower, however, this difference disappears when the size of the probe approaches a zero value.
The use of Delaunay tessellation allowed us to estimate the specific surface area of free volume elements as a function of the probe size in all the polymers studied. At the zero size, this surface was very tortuous and this manifested in very high specific surface area for both groups of polymers (4000–5000 m2/g). However, as the size of the probe increased, the specific surface area of PEIs became much smaller (50–120 m2/g), while for the highly permeable polymers it was 740–990 m2/g. The latter values were in agreement with the results of the experimental determination of the BET surface area in these materials. Atomistic analysis of the polymers also permitted an elucidation of the chemical nature of the groups that formed the surface of free volume elements. This surface is enriched by fluorine atoms in the case of PEI-304, whose repeat unit included the connecting group –C(CF3)2–.

Supplementary Materials

The following are available online at https://www.mdpi.com/2079-3197/7/2/27/s1, Figure S1: Dependence of density on the number of chain ends in samples; Figure S2: Dependence of the distance between the ends of chains L (Å) and the number of repeat units in them N; Figure S3: Visualization of free volume of Ultem model; Figure S4: Visualization of free volume of PEI-304 model; Table S1: Parameters of linear regression from Figure S2.

Author Contributions

Conceptualization, Y.Y. and A.A.; development of molecular models and carrying out MD calculations, N.B.; analysis of the results of MD simulation and development software for it, M.M., and I.S.; Writing-Original Draft Preparation, Y.Y., M.M., and I.S.; Writing-Review & Editing, Y.Y. and A.A.; Visualization, M.M.; Project Administration, Y.Y. and M.M.; Funding Acquisition, A.A.

Funding

This research was funded by grant of RFBR 17-08-00164.

Acknowledgments

This work was supported by a grant of RFBR 17-08-00164. The research was carried out using supercomputers at Joint Supercomputer Center of the Russian Academy of Sciences and at Keldysh Institute of Applied Mathematics RAS.

Conflicts of Interest

The authors declare no conflict of interest.

References

  1. Theodorou, D.N. Principles of Molecular Simulation of Gas Transport in Polymers. In Materials Science of Membranes for Gas and Vapor Separation; Yampolskii, Y., Pinnau, I., Freeman, B.D., Eds.; Wiley: Chichester, UK, 2006; pp. 49–94. [Google Scholar]
  2. Neyertz, S. Gas transport in dense polymeric membranes, molecular dynamics simulations. Encycl. Membr. Sci. Technol. 2013, 1, 171–191. [Google Scholar]
  3. Hofmann, D.; Entrialgo-Castano, M.; Lerbret, A.; Heuchel, M.; Yampolskii, Y. Molecular Modeling Investigation of Free Volume Distributions in Stiff Chain Polymers with Conventional and Ultrahigh Free Volume: Comparison between Molecular Modeling and Positron Lifetime Studies. Macromolecules 2003, 36, 8528–8538. [Google Scholar] [CrossRef]
  4. Heuchel, M.; Fritsch, D.; Budd, P.M.; McKeown, N.B.; Hofmann, D. Atomistic packing model and free volume distribution of a polymer with intrinsic microporosity (PIM-1). J. Membr. Sci. 2008, 318, 84–99. [Google Scholar] [CrossRef]
  5. Heuchel, M.; Hofmann, D.; Pullumbi, P. Molecular Modeling of Small-Molecule Permeation in Polyimides and Its Correlation to Free-Volume Distributions. Macromolecules 2004, 37, 201–214. [Google Scholar] [CrossRef]
  6. Bisoi, S.; Manda, A.K.; Padmanabhan, V.; Banerjee, S. Aromatic polyamides containing trityl substituted triphenylamine: Gas transport properties and molecular dynamics simulations. J. Membr. Sci. 2017, 522, 77–90. [Google Scholar] [CrossRef]
  7. Tocci, E.; De Lorenzo, L.; Bernardo, P.; Clarizia, G.; Bazzarelli, F.; Mckeown, N.B.; Carta, M.; Malpass-Evans, R.; Friess, K.; Pilnacek, K.; et al. Molecular Modeling and Gas Permeation Properties of a Polymer of Intrinsic Microporosity Composed of Ethanoanthracene and Troöger’s Base Units. Macromolecules 2014, 47, 7900–7916. [Google Scholar] [CrossRef]
  8. Pinel, E.; Brown, D.; Bas, C.; Mercier, R.; Alberola, N.D.; Neyertz, S. Chemical Influence of the Dianhydride and the Diamine Structure on a Series of Copolyimides Studied by Molecular Dynamics Simulations. Macromolecules 2002, 35, 10198–10209. [Google Scholar] [CrossRef]
  9. Neyertz, S.; Douanne, A.; Brown, D. Effect of Interfacial Structure on Permeation Properties of Glassy Polymers. Macromolecules 2005, 38, 10286–10298. [Google Scholar] [CrossRef]
  10. Pandiyan, S.; Brown, D.; Neyertz, S.; van der Vegt, N.F.A. Carbon Dioxide Solubility in Three Fluorinated Polyimides Studied by Molecular Dynamics Simulations. Macromolecules 2010, 43, 2605–2621. [Google Scholar] [CrossRef]
  11. Spyriouni, T.; Boulougouris, G.C.; Theodorou, D.N. Prediction of Sorption of CO2 in Glassy Atactic Polystyrene at Elevated Pressures Through a New Computational Scheme. Macromolecules 2009, 42, 1759–1769. [Google Scholar] [CrossRef]
  12. Neyertz, S.; Brown, D. Oxygen Sorption in Glassy Polymers Studied at the Molecular Level. Macromolecules 2009, 42, 8521–8533. [Google Scholar] [CrossRef]
  13. Nazarychev, V.M.; Dobrovskiy, A.Y.; Larin, S.V.; Lyulin, A.V.; Lyulin, S.V. Simulating local mobility and mechanical properties of thermostable polyimides with different dianhydride fragments. J. Polym. Sci. Part B: Polym. Phys. 2018, 56, 375–382. [Google Scholar] [CrossRef]
  14. Lyulin, S.V.; Larin, S.V.; Nazarychev, V.M.; Fal’kovich, S.G.; Kenny, J.M. Multiscale computer simulation of polymer nanocomposites based on thermoplastics. Polym. Sci. Ser. C 2016, 58, 2–15. [Google Scholar] [CrossRef]
  15. Mazo, M.; Balabaev, N.; Alentiev, A.; Yampolskii, Y. Molecular Dynamics Simulation of Nanostructure of High Free Volume Polymers with SiMe3 Side Groups. Macromolecules 2018, 51, 1398–1408. [Google Scholar] [CrossRef]
  16. Barbari, T.A.; Koros, W.J.; Paul, D.R. Polymeric membranes based on bisphenol-A for gas separation. J. Membr. Sci. 1989, 42, 69–86. [Google Scholar] [CrossRef]
  17. Alentiev, A.Y.; Yampolskii, Y.P.; Rusanov, A.L.; Likhachev, D.; Kazakova, G.V.; Komarova, L.G.; Prigozhina, M.P. Transport Properties of Poly(ether imides). Polym. Sci. A 2003, 45, 933–939. [Google Scholar]
  18. Chirkov, S.V.; Kechekyan, A.S.; Belov, N.A.; Antonov, S.V.; Alentiev, A.Y. The influence of uniform deformation of Ultem-1000 polyetherimide films on their mechanical and gas transport characteristics. Petrol. Chem. 2016, 56, 1074–1084. [Google Scholar] [CrossRef]
  19. Alentiev, A.Y.; Belov, N.A.; Chirkov, S.V.; Yampolskii, Y.P. Gas diffusion characteristics as criteria of nonequilibrium state of amorphous glassy polymers. J. Membr. Sci. 2018, 547, 99–109. [Google Scholar] [CrossRef]
  20. Alentiev, A.Y.; Yampolskii, Y.P. Free volume model and tradeoff relations of gas permeability and selectivity in glassy polymers. J. Membr. Sci. 2000, 165, 201–216. [Google Scholar] [CrossRef]
  21. Ronova, I.A.; Alentiev, A.Y.; Chisca, S.; Sava, I.; Bruma, M.; Nikolaev, A.Y.; Belov, N.A.; Buzin, M.I. Change of microstructure of polyimide thin films under the action of supercritical carbon dioxide and its influence on the transport properties. Struct. Chem. 2014, 25, 301–310. [Google Scholar] [CrossRef]
  22. Chirkov, S.; Kechekian, A.; Belov, N.; Antonov, S.; Alentiev, A. Mechanical and gas permeation properties of uniformerly deformed films of polyetherimides. J. Butlerov Commun. 2016, 48, 54–59. [Google Scholar]
  23. Aliev, A.; Chalykh, A.; Gerasimov, V.; Balashova, E.; Alentiev, A.Y.; Yampolskii, Y.P.; Stepanenko, V. The Kinetics of Desorption of a Residual Solvent from Poly(ether imide). Polym. Sci. A 2002, 44, 603–608. [Google Scholar]
  24. Yampolskii, Y.P.; Alentiev, A.Y.; Bondarenko, G.; Kostina, Y.; Heuchel, M. Intermolecular Interactions: New Way to Govern Transport Properties of Membrane Materials. Ind. Eng. Chem. Res. 2010, 49, 12031–12037. [Google Scholar] [CrossRef]
  25. Gringolts, M.; Bermeshev, M.; Yampolskii, Y.P.; Starannikova, L.; Shantarovich, V.; Finkelshtein, E. New High Permeable Addition Poly(tricyclononenes) with Si(CH3)3 Side Groups. Synthesis, Gas Permeation Parameters, and Free Volume. Macromolecules 2010, 43, 7165–7172. [Google Scholar] [CrossRef]
  26. Chapala, P.; Bermeshev, M.; Starannikova, L.; Belov, N.; Ryzhikh, V.; Shantarovich, V.; Lakhtin, V.; Gavrilova, N.; Yampolskii, Y.; Finkelshtein, E. A Novel, Highly Gas-Permeable Polymer Representing a New Class of Silicon-Containing Polynorbornens as Efficient Membrane Materials. Macromolecules 2015, 48, 8055–8061. [Google Scholar] [CrossRef]
  27. Balabaev, N.K.; Mazo, M.A.; Lyulin, A.V.; Oleinik, E.F. Plastic Deformation of Glassy Polymethylene: Computer Aided Molecular Dynamic Simulation. Polym. Sci. Ser. A 2010, 52, 633–644. [Google Scholar] [CrossRef]
  28. Fried, J.R. Molecular simulation of gas and vapor transport in highly permeable polymers. In Materials Science of Membranes for Gas and Vapor Separation; Yampolskii, Y., Pinnau, I., Freeman, B.D., Eds.; Wiley: Chichester, UK, 2006; pp. 95–136. [Google Scholar]
  29. Glyakina, A.V.; Balabaev, N.K.; Galzitskaya, O.V. Mechanical unfolding of proteins L and G with constant force: Similarities and differences. J. Chem. Phys. 2009, 131, 045102. [Google Scholar] [CrossRef]
  30. Lyulin, A.V.; Balabaev, N.K.; Michels, M.A.J. Correlated Segmental Dynamics in Amorphous Atactic Polystyrene: A Molecular Dynamics Simulation Study. Macromolecules 2002, 35, 9595–9604. [Google Scholar] [CrossRef]
  31. Hill, J.R.; Sauer, J. Molecular Mechanics Potential for Silica and Zeolite Catalysts Based on ab Initio Calculations. 2. Aluminosilicates. J. Phys. Chem. 1995, 99, 9536–9550. [Google Scholar] [CrossRef]
  32. Allen, M.P.; Tildesley, D.J. Computer Simulation of Liquids; Clarendon: Oxford, UK, 1987. [Google Scholar]
  33. Lemak, A.S.; Balabaev, N.K. Molecular dynamics simulation of polymer chain in solution by collisional dynamics method. J. Comput. Chem. 1996, 17, 1685–1695. [Google Scholar] [CrossRef]
  34. Lemak, A.S.; Balabaev, N.K. A comparison between collisional dynamics and Brownian dynamics. Mol. Simul. 1995, 15, 223–231. [Google Scholar] [CrossRef]
  35. Berendsen, H.J.C.; Postma, J.P.M.; van Gunsteren, W.F.; Di Nola, A.; Haak, J.R. Molecular dynamics with coupling to an external bath. J. Chem. Phys. 1984, 81, 3684–3690. [Google Scholar] [CrossRef] [Green Version]
  36. Shantarovich, V.; Kevdina, I.; Yampolskii, Y.P.; Alentiev, A.Y. Positron annihilation lifetime study of high and low free volume glassy polymers: Effects of free volume sizes on the permeability and permselectivity. Macromolecules 2000, 33, 7453–7466. [Google Scholar] [CrossRef]
  37. Greenfield, M.L.; Theodorou, D.N. Geometric analysis of diffusion pathways in glassy and melt atactic polypropylene. Macromolecules 1993, 26, 5461–5472. [Google Scholar] [CrossRef]
  38. Teplyakov, V.; Meares, P. Correlation aspects of the selective gas permeabilities of polymeric materials and membranes. Gas Sep. Purif. 1990, 4, 66–73. [Google Scholar] [CrossRef]
  39. Mitternacht, S. FreeSASA: An open source C library for solvent accessible surface area calculations. F1000Res. 2016, 5, 189. [Google Scholar] [CrossRef]
  40. Medvedev, N.N. Voronoi-Delaunay Method in Structural Studies of Noncrystalline Systems; Nauka: Novosibirsk, Russia, 2000. (In Russian) [Google Scholar]
  41. Shaytan, A.K.; Xiao, H.; Armeev, G.A.; Gaykalova, D.A.; Komarova, G.A.; Wu, C.; Studitsky, V.M.; Landsman, D.; Panchenko, A.R. Structural interpretation of DNA–protein hydroxyl-radical footprinting experiments with high resolution using HYDROID. Nat. Protoc. 2018, 13, 2535–2556. [Google Scholar] [CrossRef]
  42. Mitchell, L.S.; Colwell, L.J. Analysis of nanobody paratopes reveals greater diversity than classical antibodies. Protein Eng. Des. Sel. 2018, 31, 267–275. [Google Scholar] [CrossRef] [Green Version]
  43. Mapes, N.J., Jr.; Rodriguez, C.; Chowriappa, P.; Dua, S. Residue Adjacency Matrix Based Feature Engineering for Predicting Cysteine Reactivity in Proteins. Comput. Struct. Biotechnol. J. 2019, 17, 90–100. [Google Scholar] [CrossRef]
  44. Breck, D.W. Zeolite Molecular Sieves: Structure, Chemistry and Uses; Wiley: New York, NY, USA, 1974; pp. 593–724. [Google Scholar]
  45. Poling, B.E.; Prausnitz, J.M.; O’Connell, J.P. The Properties of Gases and Liquids, 5th ed.; McGraw-Hill: New York, NY, USA, 2000. [Google Scholar]
  46. Hemalatha, P.; Ganesh, M.; Pei, M.M.; Jong, E.M.; Palaniohany, M.; Jang, H. Polyimides: Synthesis, characterization, and application to carbon dioxide adsorption. Comput. Inf. Sci. 2012, 341, 229–236. [Google Scholar]
  47. Yang, S.-Y. Advanced Polyimide Materials. Synthesis, Characterization and Applications; Elsevier: Amsterdam, The Netherlands, 2018; p. 304. [Google Scholar]
Figure 1. The bar graph of the distribution of monomers in chains of different lengths in Ultem (left) and polyetherimide (PEI)-304 (right), averaging on all 32 samples.
Computation 07 00027 g001
Figure 2. Density of the prepared samples sorted according to their increasing density, Ultem (left), PEI-304 (right). The bars indicate the standard deviation along the equilibrium trajectories.
Computation 07 00027 g002
Figure 3. Visualization of free volume in Ultem, the density is 1.279 g/cm3. Successive slices in the range 0–10.5 Å.
Computation 07 00027 g003
Figure 4. Visualization of free volume in PEI-304, the density is 1.376 g/cm3. Successive slices in the range 0–10.5 Å.
Computation 07 00027 g004
Figure 5. Visualization of free volume in PTCNSi2v. The density is 0.8306 g/cm3 [15]. Successive slices in the range 0–10.5 Å.
Computation 07 00027 g005
Figure 6. Visualization of free volume in PTCNSi2g. The density is 0.8470 g/cm3 [15]. Successive slices in the range 0–10.5 Å.
Computation 07 00027 g006
Figure 7. Dependence of accessible free volume on the size of probe. 1: Ultem, 2: PEI-304, 3: PTCNSi2v, 4: PTCNSi2g. The bars indicate the standard deviation.
Computation 07 00027 g007
Figure 8. Bar graph distribution of free volume elements (FVEs) accessible for the different gaseous probes calculated from the Ultem (1) and PEI-304 (2) models. Bar graph bin is equal to 0.1 Å.
Computation 07 00027 g008aComputation 07 00027 g008b
Figure 9. Bar graph distribution of FVE accessible from PTCNSi2v (1) and PTCNSi2g (2) models [15]. Bar graph bin is equal to 0.1 Å.
Computation 07 00027 g009
Figure 10. Illustration on a two-dimensional model for constructing FVEs. Details see in the text.
Computation 07 00027 g010
Table 1. Structure of the polymers studied.
PolymerFormula of the Monomer
Ultem Computation 07 00027 i001
PEI-304 Computation 07 00027 i002
PTCNSi2v Computation 07 00027 i003
PTCNSi2g Computation 07 00027 i004
Table 2. Properties of glassy polymers.
ParameterUltem [16,17,18,19]PEI-304 [20,21,22,23,24]PTCNSi2v [25]PTCNSi2g [26]
Density, g/cm31.28–1.301.370.810.853
FFV, %10.8–12.19.2–10.034.929.7
Tg, °C215180>370>340
P(O2), Barrer0.40–0.880.68–0.8423804750
P(O2)/P(N2)6.4–7.68.4–11.71.91.8
Table 3. Molecular mass of polyetherimides averaged over all samples.
PolymerAve. Number of Repeat Units in One ChainMn (Da)Mw (Da)Polydispersity
Ultem25.6 ± 3.627,400 ± 680038,000 ± 12,0001.36 ± 0.12
PEI-30430.5 ± 5.230,600 ± 520050,160 ± 11,0001.65 ± 0.27
Table 4. Specific surface area S/m (m2/g).
Probe Radius ÅUltemPEI-304PTCNSi2vPTCNSi2g
04090383057105330
0.531600136527102900
1.0740725713301607
1.445144628161072
1.52129537741027
1.485121487491000
1.5111746740989
Table 5. Fraction of surface of FVEs (in %) occupied by various chemical species in Ultem as a function of the size of a probe. Hydrogen atoms, which are almost entirely within the van der Waals volume of carbon, were not considered here.
Atom or GroupNumber of Atoms in Repeat Unit% of Total AtomsFraction (%)
Probe Radius < 1 ÅProbe Radius 1 ÷ 1.6 ÅProbe Radius 1.76 Å
–C(CH3)236.78–1115–1921
Carbon in carbonyl group48.96–321.6
CH group in benzene ring3066.767–7162–6561
Nitrogen24.41–20.30.25
Oxygen in carbonyl group48.911–1412–1312
Oxygen as connection group24.43–444
Table 6. Fraction of surface of FVEs (in %) occupied by various chemical species in PEI-304 as a function of the size of a probe. Here also, as in Table 5, hydrogen atoms were not accounted for.
Atom or GroupNumber of Atoms in Repeat Unit% of Total AtomsFraction (%)
Probe Radius < 1 ÅProbe Radius 1 ÷ 1.6 ÅProbe Radius 1.76 Å
–C(CH3)268.16–8~99.6
Carbon in carbonyl group45.42–322
CH group in benzene ring4864.965–706060
Nitrogen22.70.7–0.40.30.26
Oxygen in carbonyl group45.47–98–98.4
Oxygen as connection group45.44–544
Fluorine68.18–1214–1616.3

