Article

Identification and Dynamics Understanding of Novel Inhibitors of Peptidase Domain of Collagenase G from Clostridium histolyticum

1
Department of Clinical Laboratory Sciences, College of Applied Medical Sciences, Taif University, P.O. Box 11099, Taif 21944, Saudi Arabia
2
Department of Pathology and Laboratory Medicine, Security Forces Hospital Program, P.O Box 3643, Riyadh 11481, Saudi Arabia
3
College of Medicine, Alfaisal University, P.O. Box 50927, Riyadh 11533, Saudi Arabia
4
Department of Family and Community Medicine, College of Medicine, King Saud University (KSU), Riyadh 11481, Saudi Arabia
5
University Family Medicine Center, King Saud University Medical City, King Saud University (KSU), Riyadh 11481, Saudi Arabia
6
Department of Oral and Maxillofacial Surgery and Diagnostic Sciences, Faculty of Dentistry, Taif University, P.O. Box 11099, Taif 21944, Saudi Arabia
7
Department of Basic Sciences for Nursing, Nursing College, Taif University, P.O. Box 11099, Taif 21944, Saudi Arabia
*
Author to whom correspondence should be addressed.
Computation 2024, 12(8), 153; https://doi.org/10.3390/computation12080153
Submission received: 27 June 2024 / Revised: 18 July 2024 / Accepted: 21 July 2024 / Published: 25 July 2024
(This article belongs to the Special Issue 10th Anniversary of Computation—Computational Biology)

Abstract

:
Clostridium histolyticum is a Gram-positive anaerobic bacterium belonging to the Clostridium genus. It produces collagenase, an enzyme involved in breaking down collagen which is a key component of connective tissues. However, antimicrobial resistance (AMR) poses a great challenge in combating infections caused by this bacteria. The lengthy nature of traditional drug development techniques has resulted in a shift to computer-aided drug design and other modern drug discovery approaches. The above method offers a cost-effective means for gathering comprehensive information about how ligands interact with their target proteins. The objective of this study is to create novel, explicit drugs that specifically inhibit the C. histolyticum collagenase enzyme. Through structure-based virtual screening, a library containing 1830 compounds was screened to identify potential drug candidates against collagenase enzymes. Following that, molecular dynamic (MD) simulation was performed in an aqueous solution to evaluate the behavior of protein and ligand in a dynamic environment while density functional theory (DFT) analysis was executed to predict the molecular properties and structure of lead compounds, and the WaterSwap technique was utilized to obtain insights into the drug–protein interaction with water molecules. Furthermore, principal component analysis (PCA) was performed to reveal conformational changes, salt bridges to express electrostatic interaction and protein stability, and absorption, distribution, metabolism, excretion, and toxicity (ADMET) to assess the pharmacokinetics profile of top compounds and control molecules. Three potent drug candidates were identified MSID000001, MSID000002, MSID000003, and the control with a binding score of −10.7 kcal/mol, −9.8 kcal/mol, −9.5 kcal/mol, and −8 kcal/mol, respectively. Furthermore, Molecular Mechanics Poisson–Boltzmann Surface Area (MMPBSA) analysis of the simulation trajectories revealed energy scores of −79.54 kcal/mol, −73.99 kcal/mol, −62.26 kcal/mol, and −70.66 kcal/mol, correspondingly. The pharmacokinetics properties exhibited were under the acceptable range. The compounds hold the potential to be novel drugs; therefore, further investigation needs to be conducted to find out their anti-collagenase action against C. histolyticum infections and antibiotic resistance.

1. Introduction

The upsurge in drug-resistant bacteria is a severe threat to public health and the worldwide economy, evidenced by the recent spike in bacterial fatalities [1]. Simultaneously, the slow pace by which new antibiotic discoveries occur worsens the problem and could ultimately render current minor disease fatalities [2]. To prevent this progression, prompt action must be taken, requiring the investigation of non-antibiotic alternative therapy approaches. Antivirulence drugs, commonly referred to as “pathoblockers”, stand out among them as a viable option. These drugs may effectively avoid or delay diseases by targeting and preventing the pathogenicity factors of bacteria [3].
The Gram-positive anaerobic bacterium Clostridium histolyticum belongs to the Clostridium genus, which comprises a broad category of bacteria characterized by having the ability to make an extensive number of toxins as well as enzymes [4]. C. histolyticum is a member of the class Clostridia and the phylum Firmicutes [5] Mainly, C. histolyticum has drawn much focus in biomedical research since it has robust enzymatic activity along with associations to various kinds of medical conditions and diseases in humans. It may survive in a broad range of environments, including water, soil, and the guts of both humans and animals, because of to its rod-shaped structure along with its ability to produce endospores amid challenging environmental conditions [6]. Peyronie’s disease and Du contracture are two types of diseases in which C. histolyticum collagenases have produced irregular collagen metabolism [7]. During these conditions, a high concentration of collagen deposits leads to tissue contractures and fibrosis, which limit function and cause pain [7].
Collagenases, hyaluronidases, proteases, and hemolysins represent a few of the virulence factors that C. histolyticum produces. These enzymes serve as vital in tissue invasion, host cell lysis, and pathogenesis [8]. C. histolyticum produces five distinct types of toxins. Of them, β-toxins are the primary cause of its pathogenesis whilst collagenases serve as crucial for clostridial infection by the virus [9]. Collagenases stand out among these virulence factors due to their unique ability to break down collagen, the key structural protein found in connective tissues [1]. Proteolytic enzymes called clostridial collagenases attack collagen molecules specifically. They induce the breakage of collagen fibers and the disruption of connective tissue by cutting peptide bonds inside the triple helical structure of collagen fibrils [10]. These enzymes exhibit a high degree of substrate specificity for numerous forms of protein collagen, which includes types I, II, III, and IV [11]. There are two types of collagenase enzymes, ColG and ColH [1]. Collagenase H (ColH) and Collagenase G (ColG) belong to the metalloprotease M9 family. Collagenases are considered to be key targets for the development of other antibiotic-resistance treatment approaches as they adversely affect the development of bacterial infections caused by C. histolyticum [9].
A study carried out by [12] utilized synthetic peptides and non-proteogenic amino acids aimed to find inhibitors against Clostridium histolyticum collagenases. The study aimed to find novel inhibitors against trypsin and collagenases. Through molecular docking, the interaction between non-proteinogenic amino acids and peptides with C. histolyticum collagenase and trypsin has been studied. Based on molecular docking analysis, N-tert-butoxycarbonylglycyl-(S)-2-amino-3-(4-((4-fluorophenyl)-ethynyl)-phenyl)-α-alanine exhibited promising interaction with collagenases. The result shows that dipeptide is a good inhibitor of collagenases.
Researchers have been able to develop novel drugs and vaccines that could decrease both the time and cost related to developing new drugs through advancements in bioinformatics and computational approaches [13]. Developing a completely novel drug via experimental approaches is a difficult task. The repurposing of drugs is an emerging practice that involves repurposing commonly used drugs that have previously been shown to be safe in human trials for treating different diseases. However considering the high cost as well as the lengthy time frame, the approach is not sustainable [14]. The rapid rise of bacterial resistance compels researchers to emphasize on developing novel, potent drugs [15]. Considering the many downsides associated with traditional drug discovery, computer-aided drug design might be a more useful alternative for research due to its lower price and consumption of few resources [16]. A popular computational technique uses a structural drug design tool to virtually screen multiple drug libraries against a specified target. This could speed the drug design process by saving time in developing new leads to target the specific enzyme or protein [17]. Given this, multiple cheminformatics and biophysics techniques were employed during this study to discover potential lead drugs against C. histolyticum collagenases.

2. Methodology

Figure 1 depicts a schematic overview of the complete research work.

2.1. Collagenase Enzyme Crystal Structure Retrieval and Preparation

The crystal structure of C. histolyticum collagenase was retrieved from the Protein Data Bank (PDB) https://www.rcsb.org/?ref=nav_home with PDB ID; 7ZBV. Subsequently, The structure was then loaded into UCSF Chimera v.1.17 for early visualization, missing residue detection, and structural error detection [18]. To complete the structure, hydrogen atoms and charges were added via Chimaera v1.17 by using the “Add charge” and “AddH” functions [19]. Following that, two algorithms were applied to minimize energy: the conjugate gradient algorithm, run for 5000 steps, and the steepest descent algorithm, which ran for 5000 cycles with a step size of 0.02 Å [20]. These cyclic procedures aim to minimize steric issues in the structure of an enzyme. After minimizing energy, the enzyme’s improved structure was saved in a pdb format.

2.2. Ligands Library Selection and Preparation

To identify novel and potent inhibitors against the collagenase enzyme, which contains 1830 compounds, using several natural sources. The Medicinal Fungi Secondary metabolites And Therapeutics MeFSAT library was downloaded in SDF format [21]. The Library was then imported to PyRx 0.8 software for the energy minimization process [22]. The MM2 force field was applied to initially minimize the compound’s energy [23]. The compounds were converted to pdbqt format for structure-based virtual screening [24].

2.3. Molecular Docking Studies

Structure-based virtual screening is an effective technique for screening drug libraries against any target biomolecule [25]. Using Auto Dock in PyRx 0.8, a virtual screening of compounds targeting a specific protein was carried out [26]. After loading the target protein and chemical library into PyRx for further energy minimization, all ligands were converted to Auto Dock format. Furthermore, Auto Dock made it considerably quicker for the top three ligands to dock. Based on the binding energies score, the molecules were arranged. Those with the lowest energy score were chosen for stable binding conformation and following that, three-dimensional (3D) structural alignment, analysis, and visualization were carried out via Discovery Studio 2.4 [27].

2.4. Density Functional Theory (DFT)

All the studied structures were optimized using the B3LYP functional with GD3 correction and a 6–311+G (d, p) basis set using the DFT calculations method [28]. Geometry optimization was further used to check the stable conformation of studied structures along with chemical descriptors and molecular reactivity parameters, such as energy gap, chemical and ionization potential, frontier molecular orbital (FMO), electron affinity, electronegativity chemical hardness, softness, and electrophilic index was also estimated to find the nucleophilic and electrophilic nature, chemical reactivity, and stability [29]. Gaussian16 suite (https://gaussian.com/gaussian16/) was used for all the calculations. The GaussView6 Molecular Visualization Tool was employed to visualize and generate contour maps and molecular electrostatic potential (MEP) maps [30]. These maps could aid in the identification of possible areas that are engaged in chemical reactions or are crucial for drug–receptor interactions [31].

2.5. ADME and Pharmacokinetics Profile

ADME and the pharmacological activity of selected leads play an important role in the drug development toolbox [32]. The adsorption, distribution, metabolism, and excretion analysis profile was determined by using SwissADME http://www.swissadme.ch/. For toxicity prediction analysis of the compounds, a database called pkCSM https://biosig.lab.uq.edu.au/ was utilized [33].

2.6. Molecular Dynamic Simulation

Since docking analysis can be inaccurate, it is necessary to perform additional validation, particularly through the MD simulation technique [34]. The initial stage in preparing protein and ligand complexes for MD simulation was docking analysis [35]. The binding site of a ligand into the protein’s active pocket under static conditions was determined through molecular docking studies [36]. It was enabled to predict the ligand binding position during tough physiological conditions by using MD simulations [37]. The complexes were initially processed using AMBER22’s Antechamber program. The receptor protein was created by the FF14Sb force field, whereas the compounds were made using the GAFF force field 5 [38]. The MD simulation was performed in three phases, which included the generation of the prtmtop file, the preprocessing stage, and the production step [39]. After adding counter ions, the specifically chosen docked complexes were initially immersed in the TIP3P water box. Following that, each complex went through a 200 ns production run upon being gradually heated to 310 K and allowed for stabilization [40]. To study the structure-based screening of complexes 57, the CPPTRAJ was used. The simulation graph 60 has been created using the XMGRACE v5.1 [41].

2.7. Hydrogen Bond Analysis

It is important to count the number of H-bonds formed between the compounds and the residues in the active site of the enzyme after the simulation since this indicates how firmly the compounds bind [42]. In this research, we studied the formation of hydrogen bonds between the compounds and the active site of the enzyme residues through molecular dynamics simulations. The AMBER22 program was used for system setup, equilibration, and trajectory development. Subsequently AMBER’s cpptraj module was applied to study H-bonds. In addition, an angle cutoff of 120° and a distance cutoff of 3.5 Å between hydrogen donor and acceptor atoms were employed to determine H-bonds [43]. Visualization of H-bonds was performed by using molecular visualization software as visual molecular dynamics (VMDs)v1.9.3 [44].

2.8. Calculating Binding Affinities

Getting insights about the binding free energy is vital for understanding how ligands and proteins interact [45]. The AMBER22 MM/PBSA techniques were used to calculate the binding free energies (G binding) of the complexes. Using the MMPBSA, the binding free energy between the compounds and the main collagenase enzyme was estimated [46]. The binding energies were calculated by using the following equation:
EMM = ΔEint + ΔEele + ΔEvdw
ΔGasol = ΔGp + ΔGnp
ΔGtotal = ΔEMM + ΔGsol
ΔGbind = ΔEMM + ΔGsol − T
where ΔEMM stands for a total change of molecular mechanics energy, ΔEint for a total change of internal interactions energy, ΔEele for a total change of electrostatic energy, ΔEvdw for a total change of van der Waals energy, ΔGsol for a total change of solvation energy, ΔGp shows the total change of polar solvation energy, and ΔGnp for a total change of non-polar solvation energy.

2.9. Entropy Energy Calculation

A normal mode estimation method in the AMBER software v22 was used to estimate the entropy energy of each complex [47]. To ensure representative conformational sampling, ten frames were chosen from the MD simulation trajectories. These frames then underwent normal mode analysis to independently calculate the entropy energy for each complex.

2.10. WaterSwap Absolute Energy Estimation

Using an advanced WaterSwap technique, the absolute binding free energy of complexes was calculated to validate the formation of strong intermolecular complexes [48]. This technique is more precise and effective than MMPB/GBSA as it shows the vital function that water molecules play in promoting the interaction between ligands and the active site residues in a specific enzyme [49].

2.11. Secondary Structure Analysis

Secondary structure analysis was performed for the targeted proteins to identify the differences in secondary structure patterns [50]. The VMD module of AMBER22 was used for secondary structure analysis of the targeted enzyme.

2.12. Principal Component Analysis (PCA)

PCA, often referred to as Essential Dynamics (EDs), is a technique that simplifies the data and explains the protein’s observable motional changes during the simulation period [51]. In the present study, PCA was attained by diagonalizing the covariance matrix constructed using the atoms Cα of enzyme recoded in the SMT using the following equation:
C = <(qi − <qi>)(qj − <qj>)T>
whereas <qi> and <qj> represent their mean positions over conformational groups derived from MIMD simulations, and qi and qj are the Cartesian coordinates of the ith and jth Cα atoms in targeted enzyme, respectively. Collectively, the eigenvalue and eigenvector resulting from diagonalization indicate the coordinated motion of the structural domain and their fluctuating amplitude on an eigenvector, respectively. The CPPTRAJ program in Amber was used to carry out the PCA [52].

2.13. Salt Bridges

The AMBER22 software program was used to perform a computational evaluation of salt bridges [53]. Performing salt bridge analysis is vital for various reasons in computational drug design. Protein structures were stabilized and molecular interactions were influenced by salt bridges, which form between oppositely charged amino acid residues in a protein [45]. By computational analysis of salt bridges, researchers may learn more about the dynamics and stability of protein–ligand complexes, which aids in the identification of important interactions needed for drug binding [54].

3. Results

3.1. Structure Retrieval and Initial Preparation

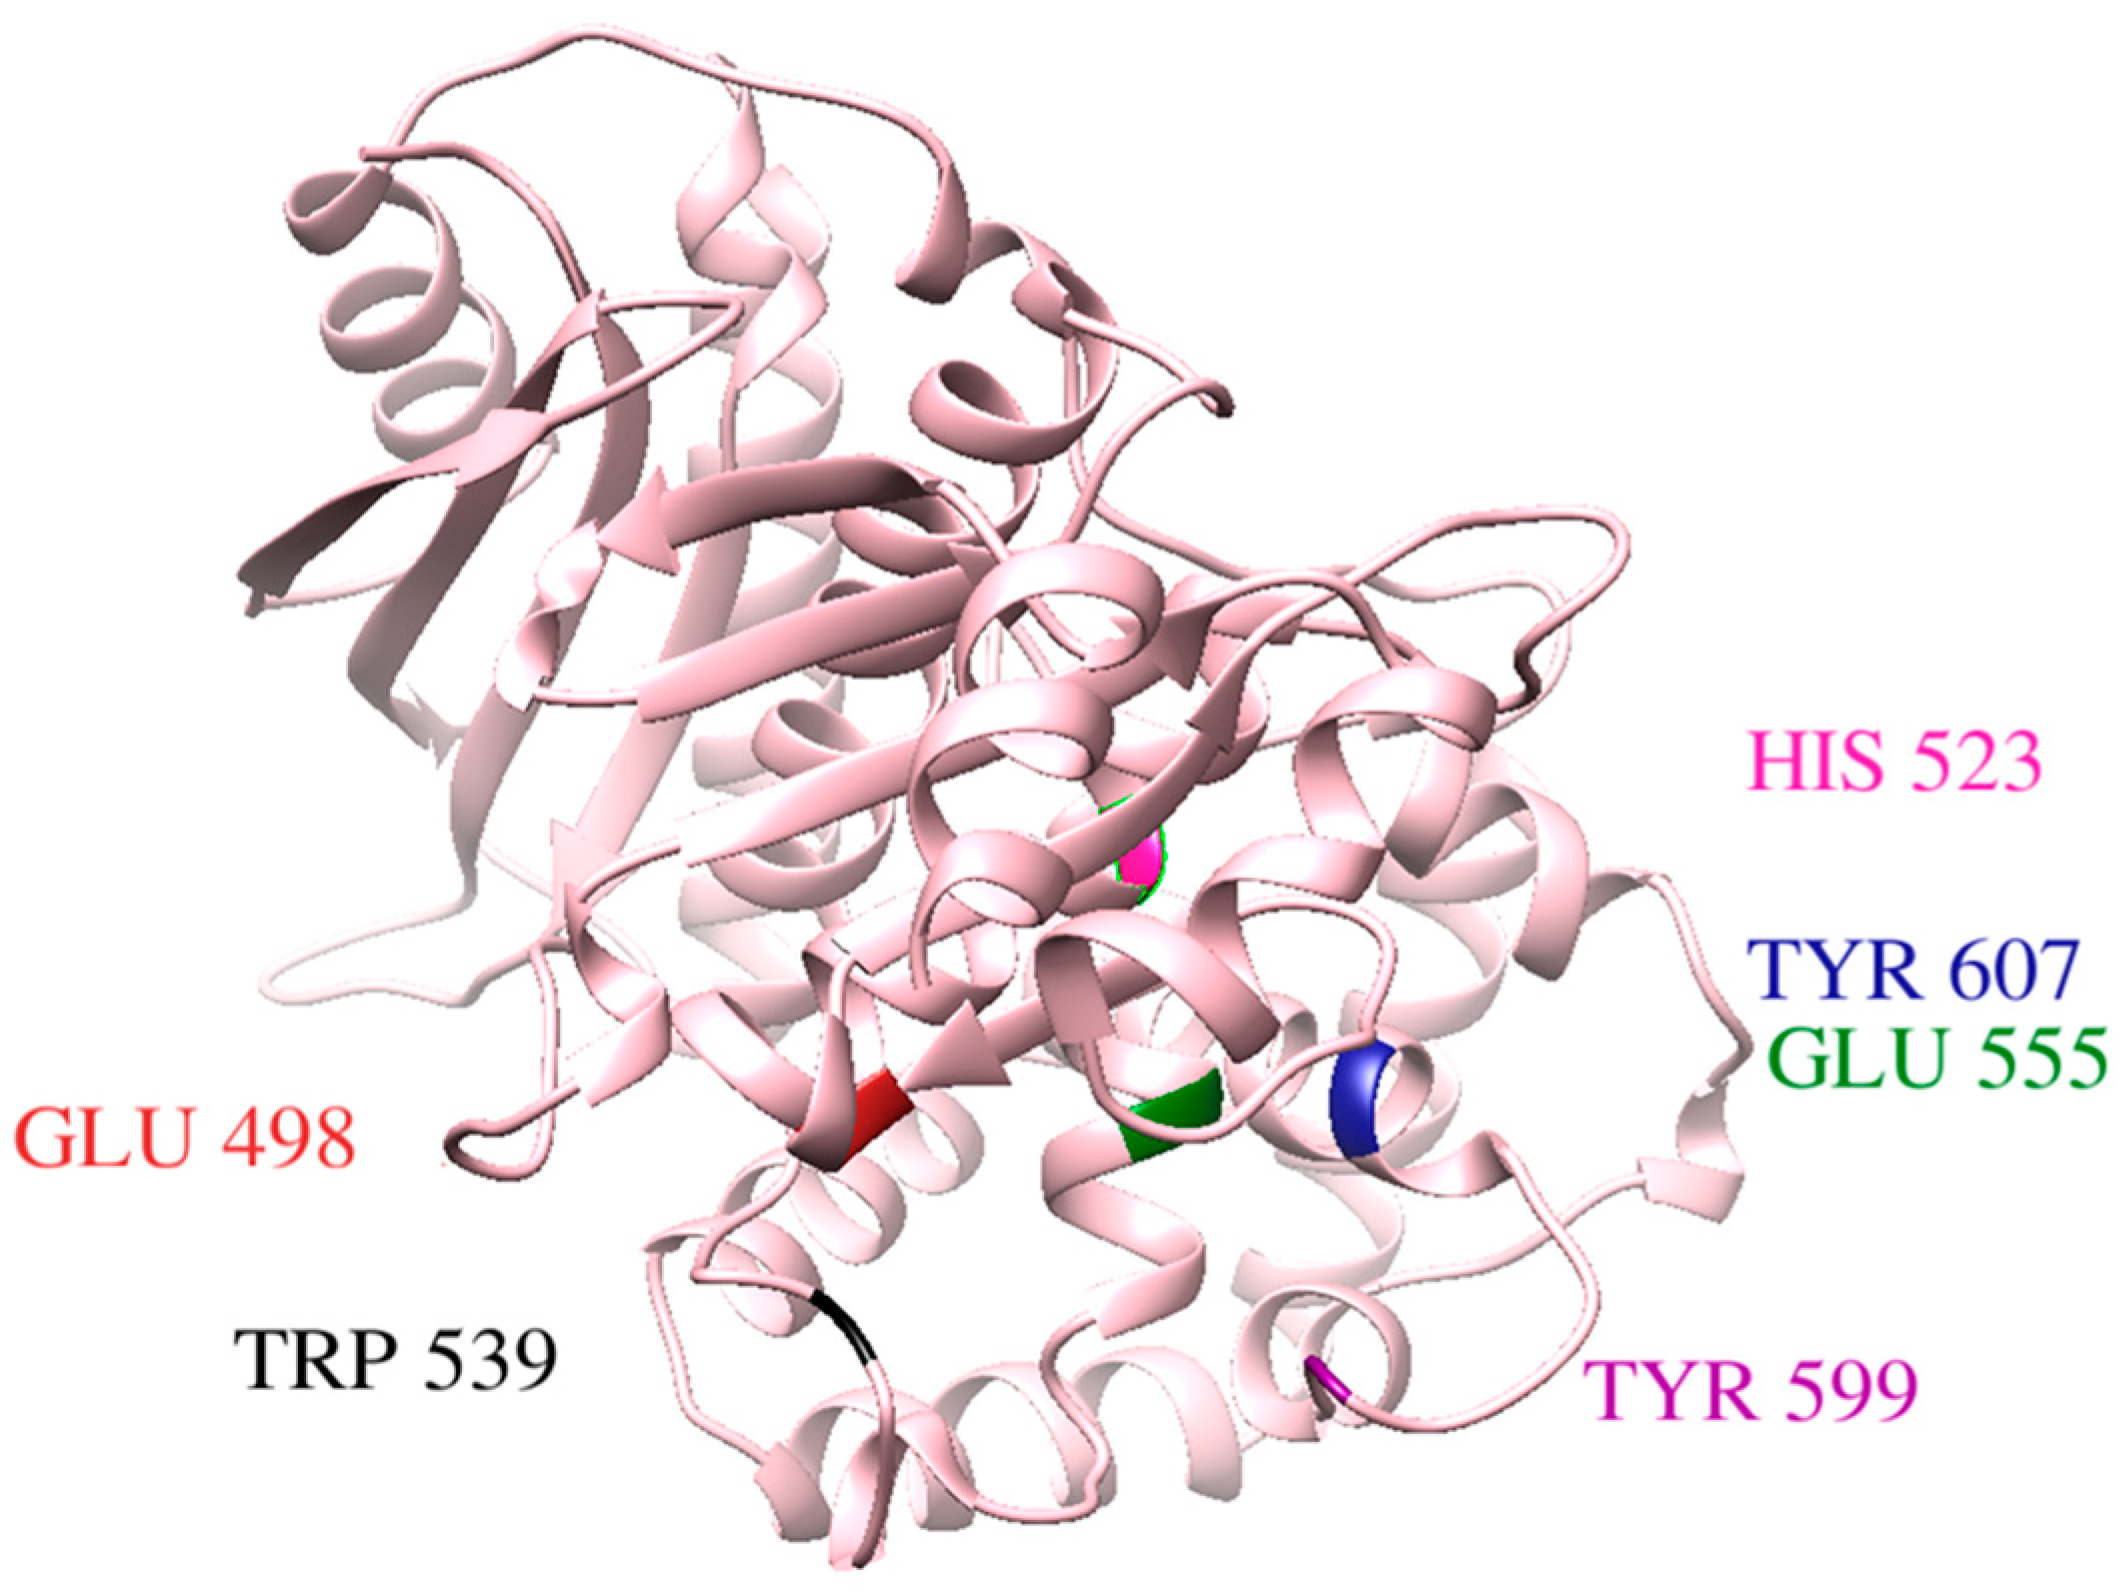
The recent study was conducted to identify potent inhibitors against Clostridium hsitolyticum with the main collagenase enzyme. The structure was retrieved from PDB by using the PDB ID; 7ZBV. Collagenases have global Symmetry: Asymmetric—C1 and Global Stoichiometry: Monomer—A1. The X-ray diffraction method was used to determine the enzyme structure which is accessible at a resolution of 1.95 Å. The crystal structure was visualized via UCSF Chimera v.1.17. Figure 2 shows the overall three-dimensional structure (3D) collagenase structure depicting the alpha helix, catalytic residues, and beta strands. Additionally, Figure 2 also depicts the close-up view of the active sites involved in ligand binding.

3.2. Molecular Docking and Binding Interaction/Poses Analysis

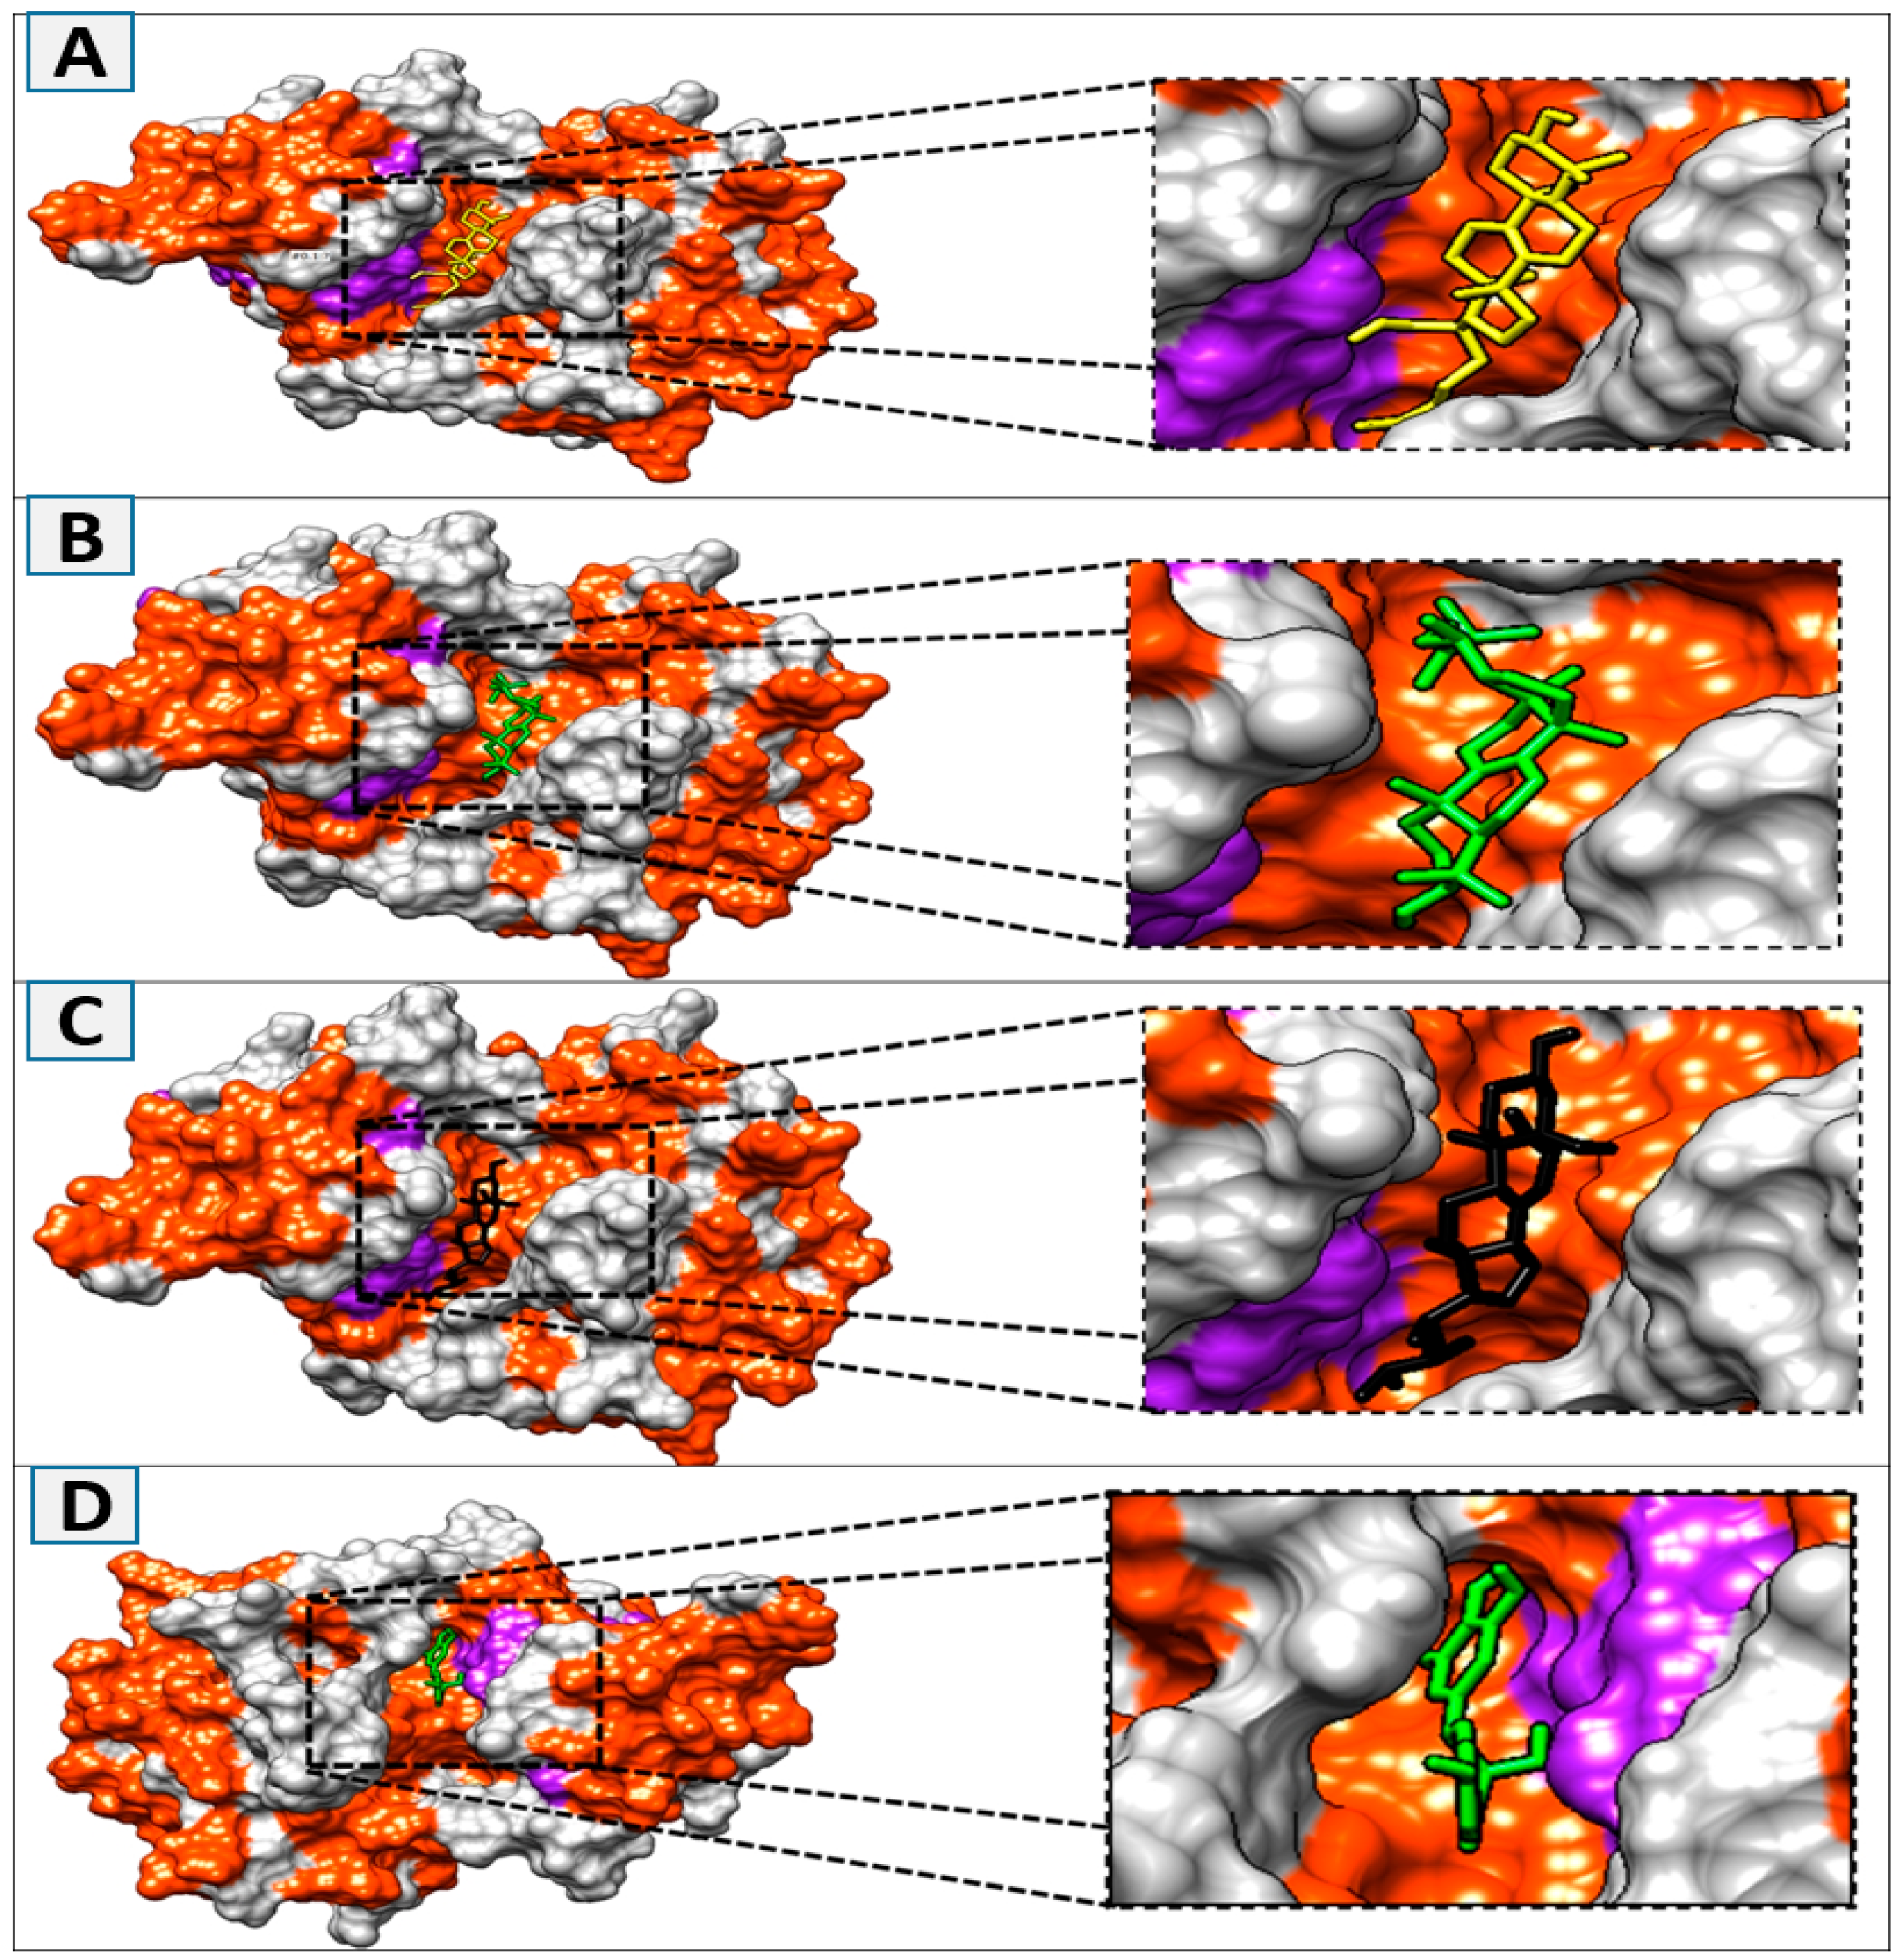
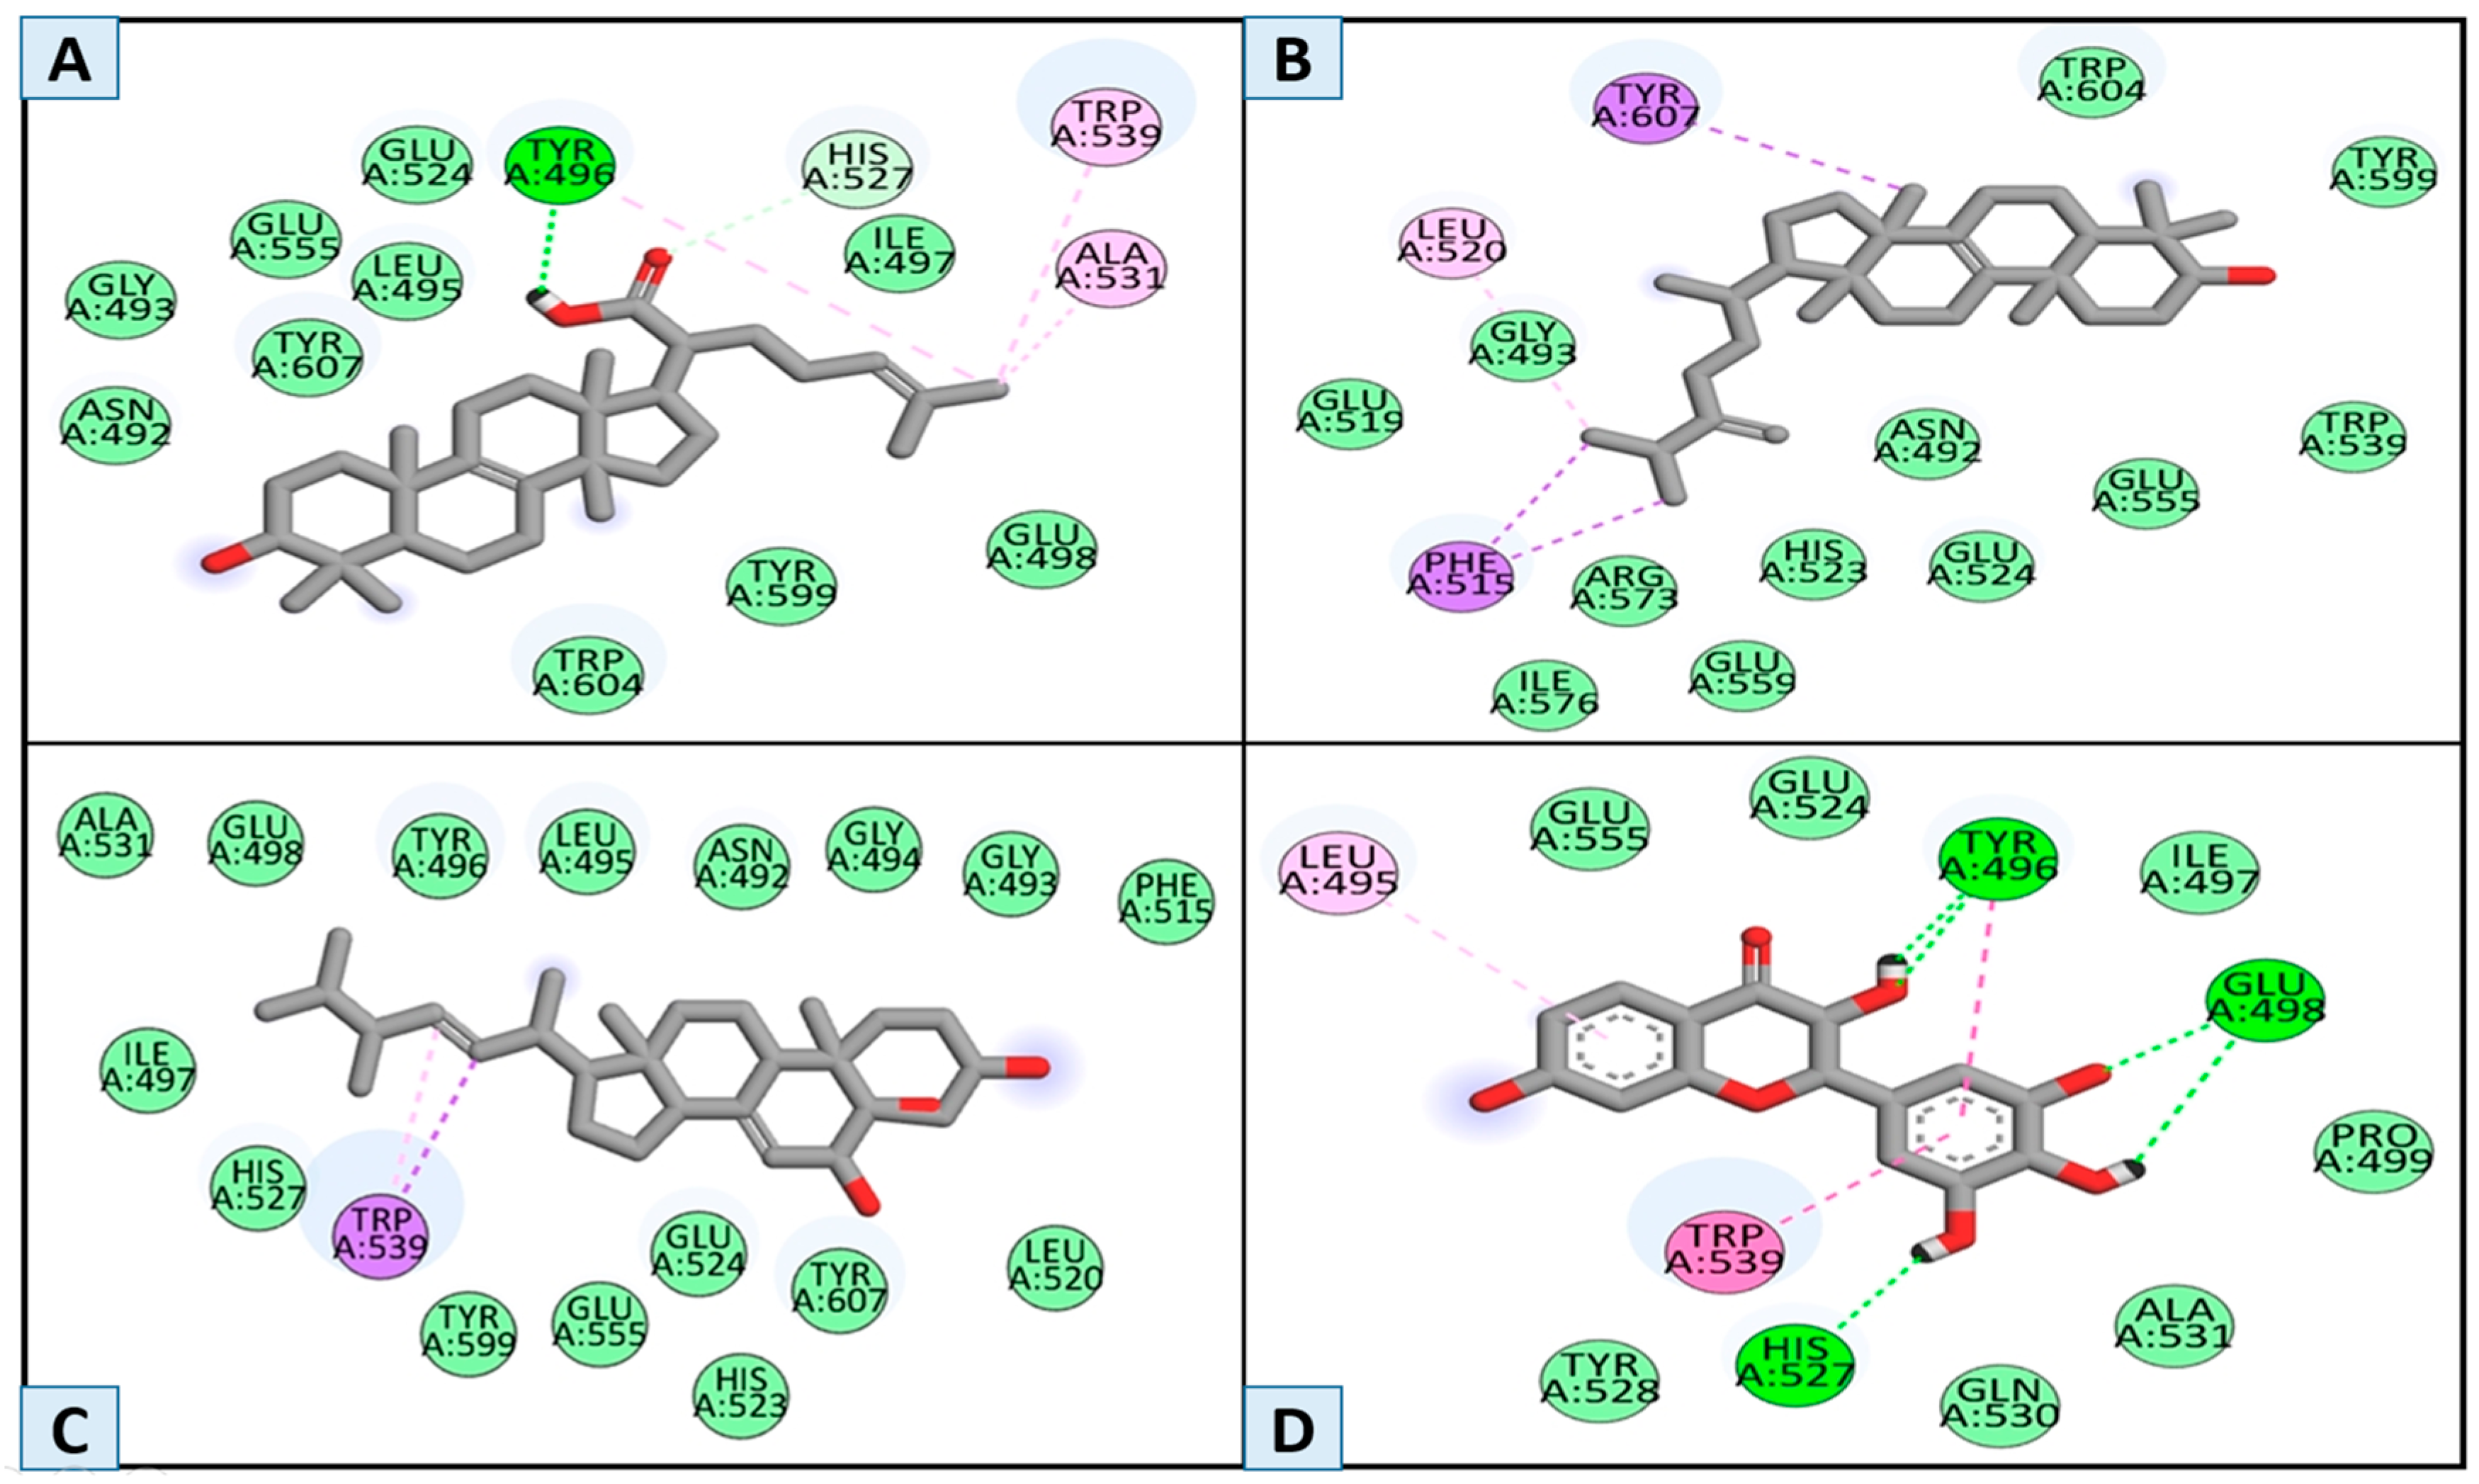
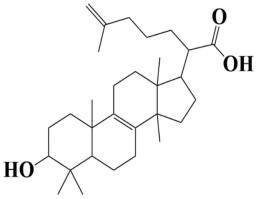
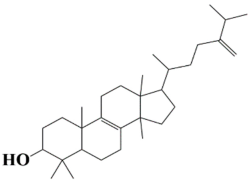
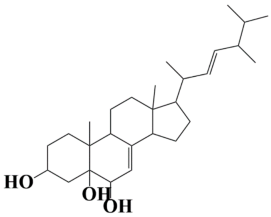
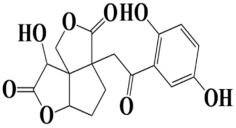
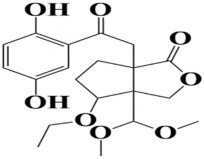
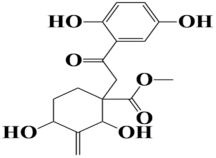
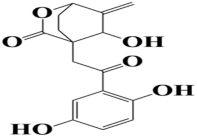
Molecular docking provides a better understanding of protein and ligand interaction in the drug development process [32]. In this study, a library was retrieved in structure data file (SDF) format. The Medicinal Fungi Secondary Metabolites and Therapeutics MeFSAT library having 1830 compounds was chosen to identify the potential inhibitors against the C. histolyticum collagenase enzyme. Structure-based virtual screening was performed for 1830 compounds against the targeted enzyme by using the PyRx 0.8 AutoDock Vina tool. Based on the binding scores, 10 compounds that displayed strong interaction with the collagenase enzyme were selected as hits. Their structure and chemical names along with their binding scores are given in Table 1. To validate the docking results and evaluate their potential as inhibitors of collagenase enzyme, 3/10 compounds were selected for further computational analysis, i.e. molecular dynamic simulation. The docking analysis revealed that the top three compounds (MSID1) 2-(3-hydroxy-4,4,10,13,14-pentamethyl2,3,4,5,6,7,10,11,12,13,14,15,16,17-tetradecahydro-1H-cyclopenta[a]phenanthren-17-yl)-6-methylhept-6-enoic acid,(MSID2) 4,4,10,13,14-pentamethyl-17-(6-methyl-5-methyleneheptan-2-yl)-2,3,4,5,6,7,10,11,12,13,14,15,16,17-tetradecahydro-1H-cyclopenta[a]phenanthren-3-ol, and (MSID3) (E)-17-(5,6-dimethylhept-3-en-2-yl)-10,13-dimethyl-2,3,4,5,6,9,10,11,12,13,14,15,16,17-tetradecahydro-1H-cyclopenta[a]phenanthrene-3,5,6-triol exhibited promising binding scores of −10.7 kcal/mol, −9.8 kcal/mol, and −9.5 kcal/mol, respectively, while the control showed a binding score of −8 with the target collagenase enzyme. The interaction and binding poses of the hits compounds are shown in Figure 3. Upon analysis of the binding poses and interaction, it was revealed that MSID1, with the highest binding score of −10.7, formed conventional hydrogen bonds with Tyr496, and made van der Waals interaction with Glu498, Tyr599, Trp604, Ile497, Glu524, Leu495, Glu555, Gly493, and Asn492. Carbon–hydrogen bond interaction was shown by HIS527 while Alkyl and Pi-Alkyl interaction was seen with Trp39 and Ala531, respectively (Figure 4). MSID2 with the second-highest binding score of −9.8 revealed van der Waals interaction with Ile576, Glu559, and Arg573. His523, Glu524, Asn 492, Glu555, Trp539, Tyr599, Trp604, Glu519, and Gly 493 while Tyr607 pair Alky and PHE515 Pi–sigma interaction respectively (Figure 4). MSID3, having the third highest binding score −9.5 formed van der Waals interaction with Leu520, Tyr607, Glu524, Tyr599, His527, Ile497, Ala531, Glu498, Tyr496, Leu495, Asn492, Gly494, Phe515, and Trp539 pair Pi–Sigma interaction with the receptor protein (Figure 4). However, the control molecule was also seen to form conventional hydrogen bonds with His527, Glu498, and Tyr496, while Pro499, Ala531, Tyr528, Glu555, and Ile497 showed van der Waals interaction. Furthermore, Leu495 and Trp539 pair Pi–Alkyl and Pi–Pi stacked interaction (Figure 4). The collagenase enzyme residues that were seen in interaction with the top 3 compounds are given in Table 2.

3.3. Density Functional Theory (DFT)

Table 3 provides a comprehensive analysis that includes various features such as optimization energies measured in atomic units, dipole moments measured in Debye, polarizability (α) measured in atomic units, and HOMO/LUMO energies and their relative energy gap, measured in electron volts (eV). These features are presented for the compounds under investigation. The range of Hartree optimization energies presented, ranging from a.u. −1105.73 (control) to—a.u.1398.26 (MSID000001), indicates the varying levels of stability among the structures being investigated. The compound with the most stable conformation is MSID000001, which has a high negative energy value of a.u. −1398.26. This is followed by MSID000003 with a value of a.u. −1320.80, then MSID000002 with a value of a.u. −1288.26. The control has the least stable conformation, with a value of a.u. −1105.73.
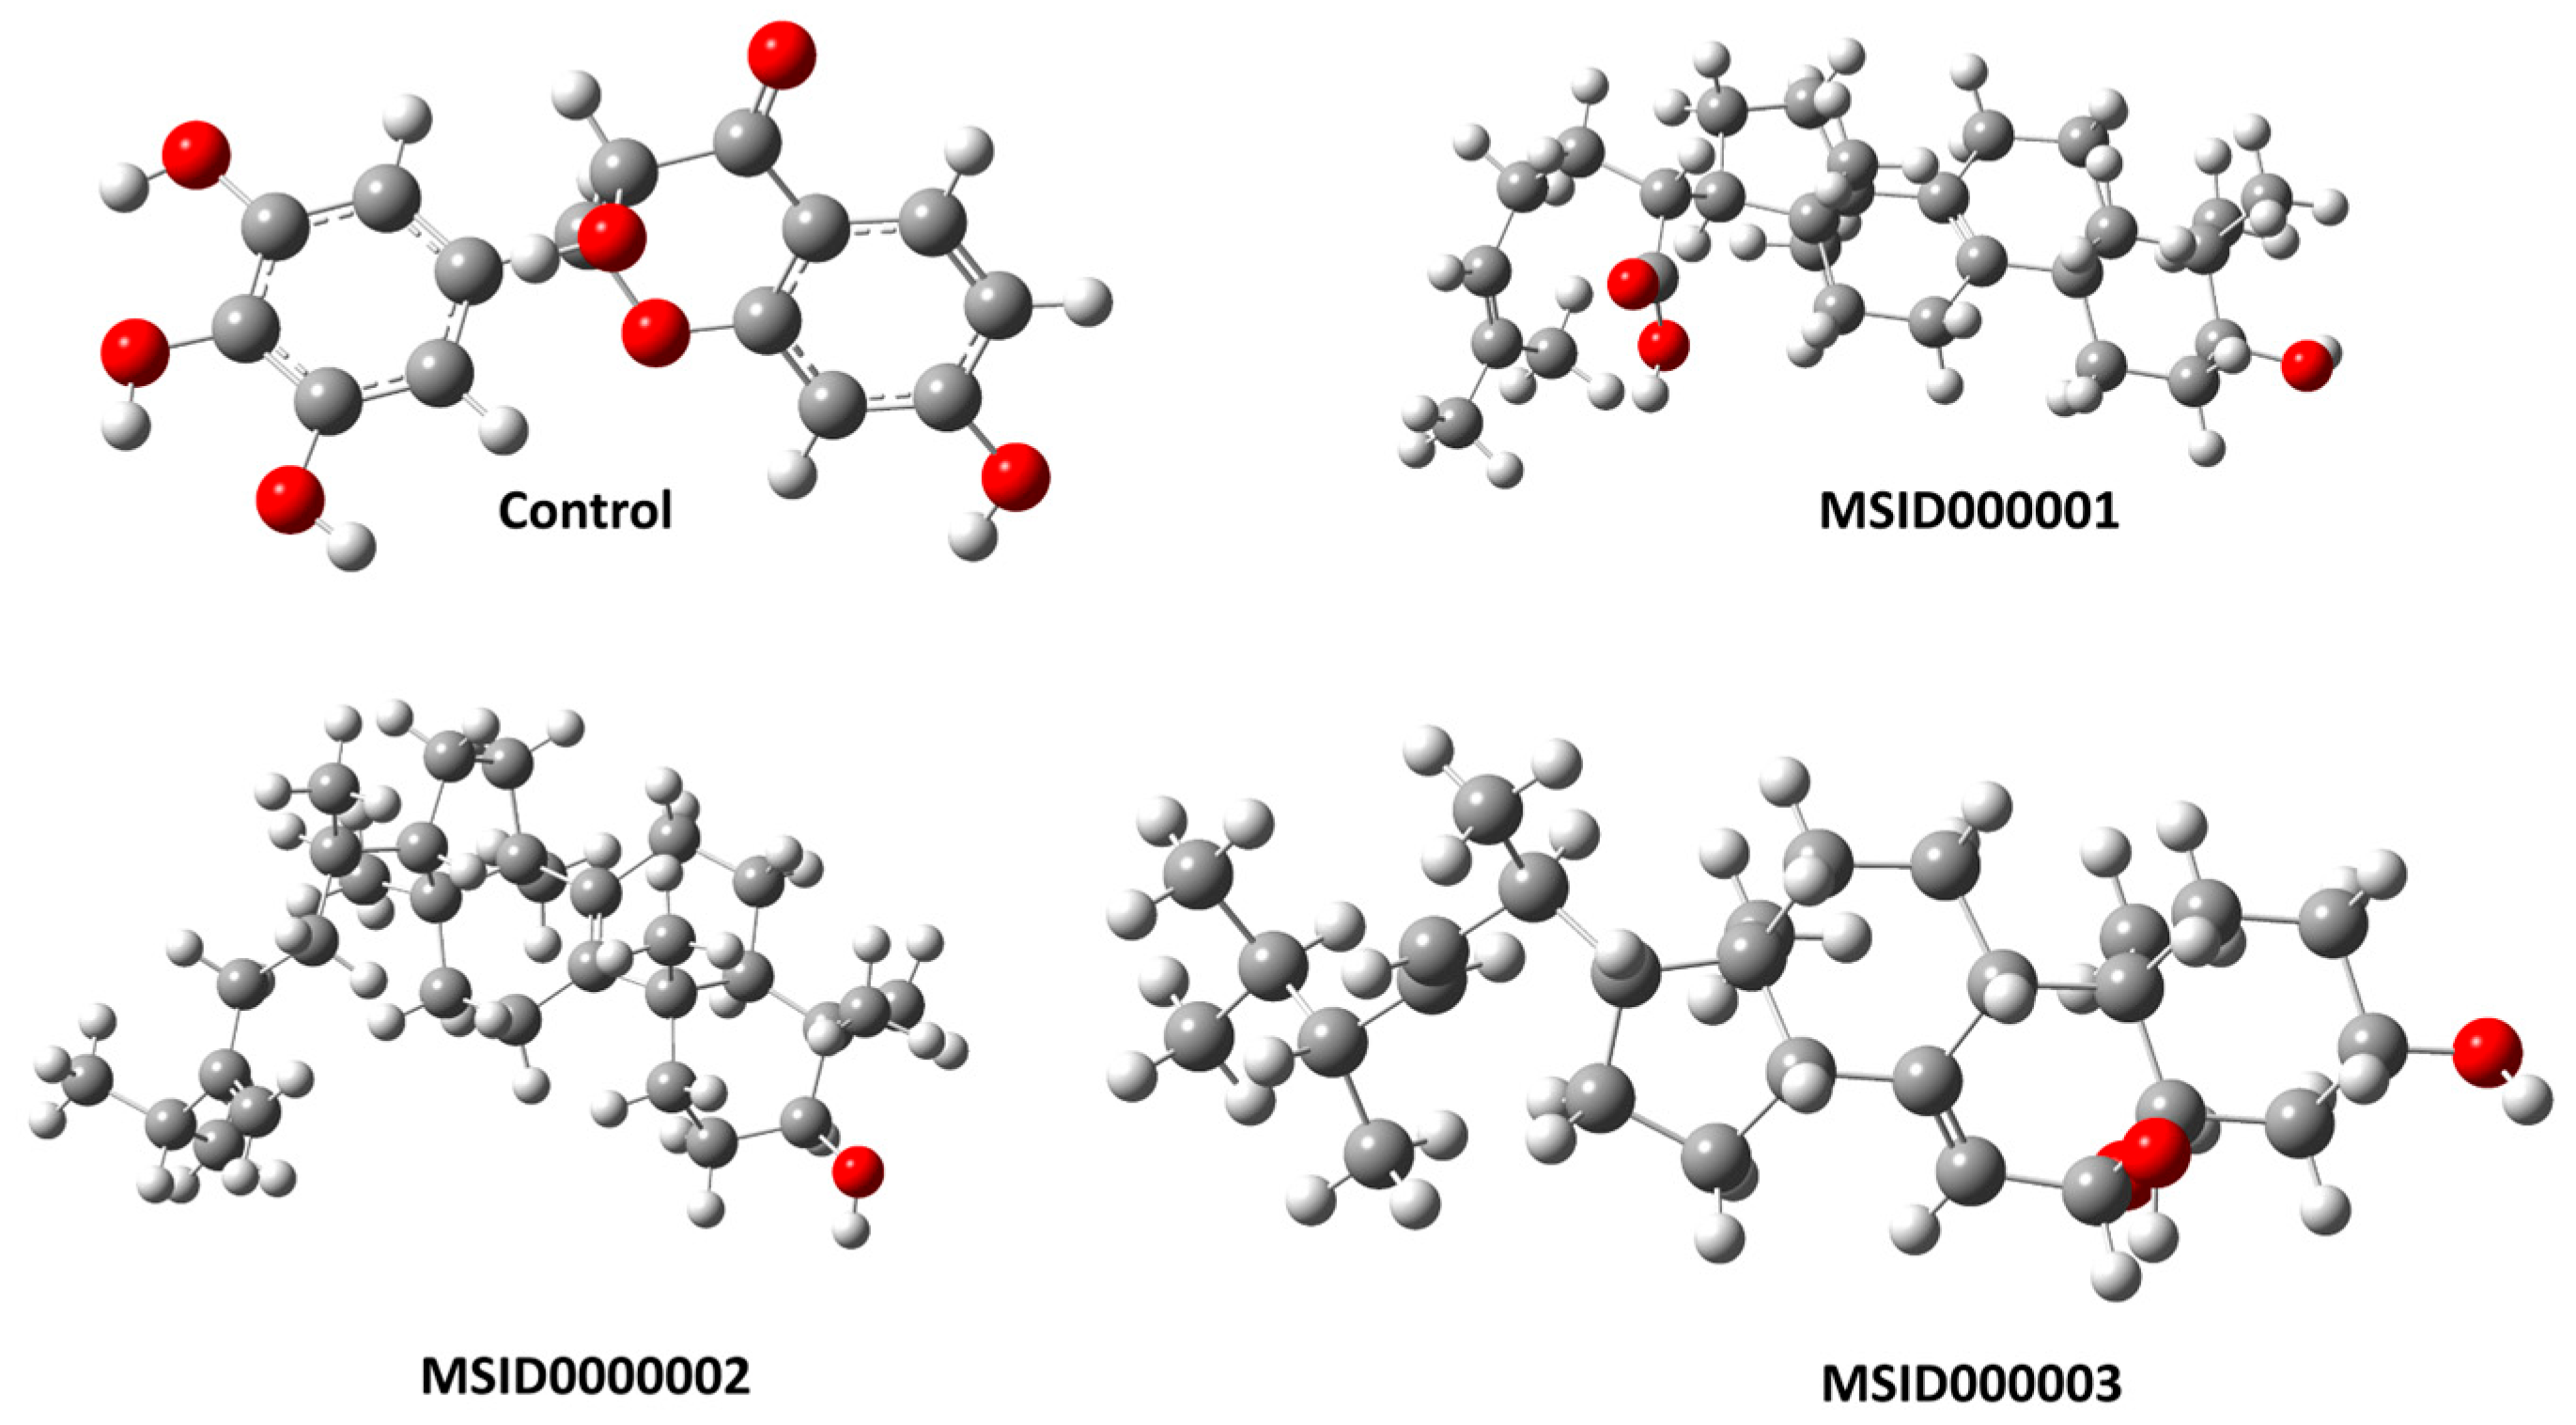
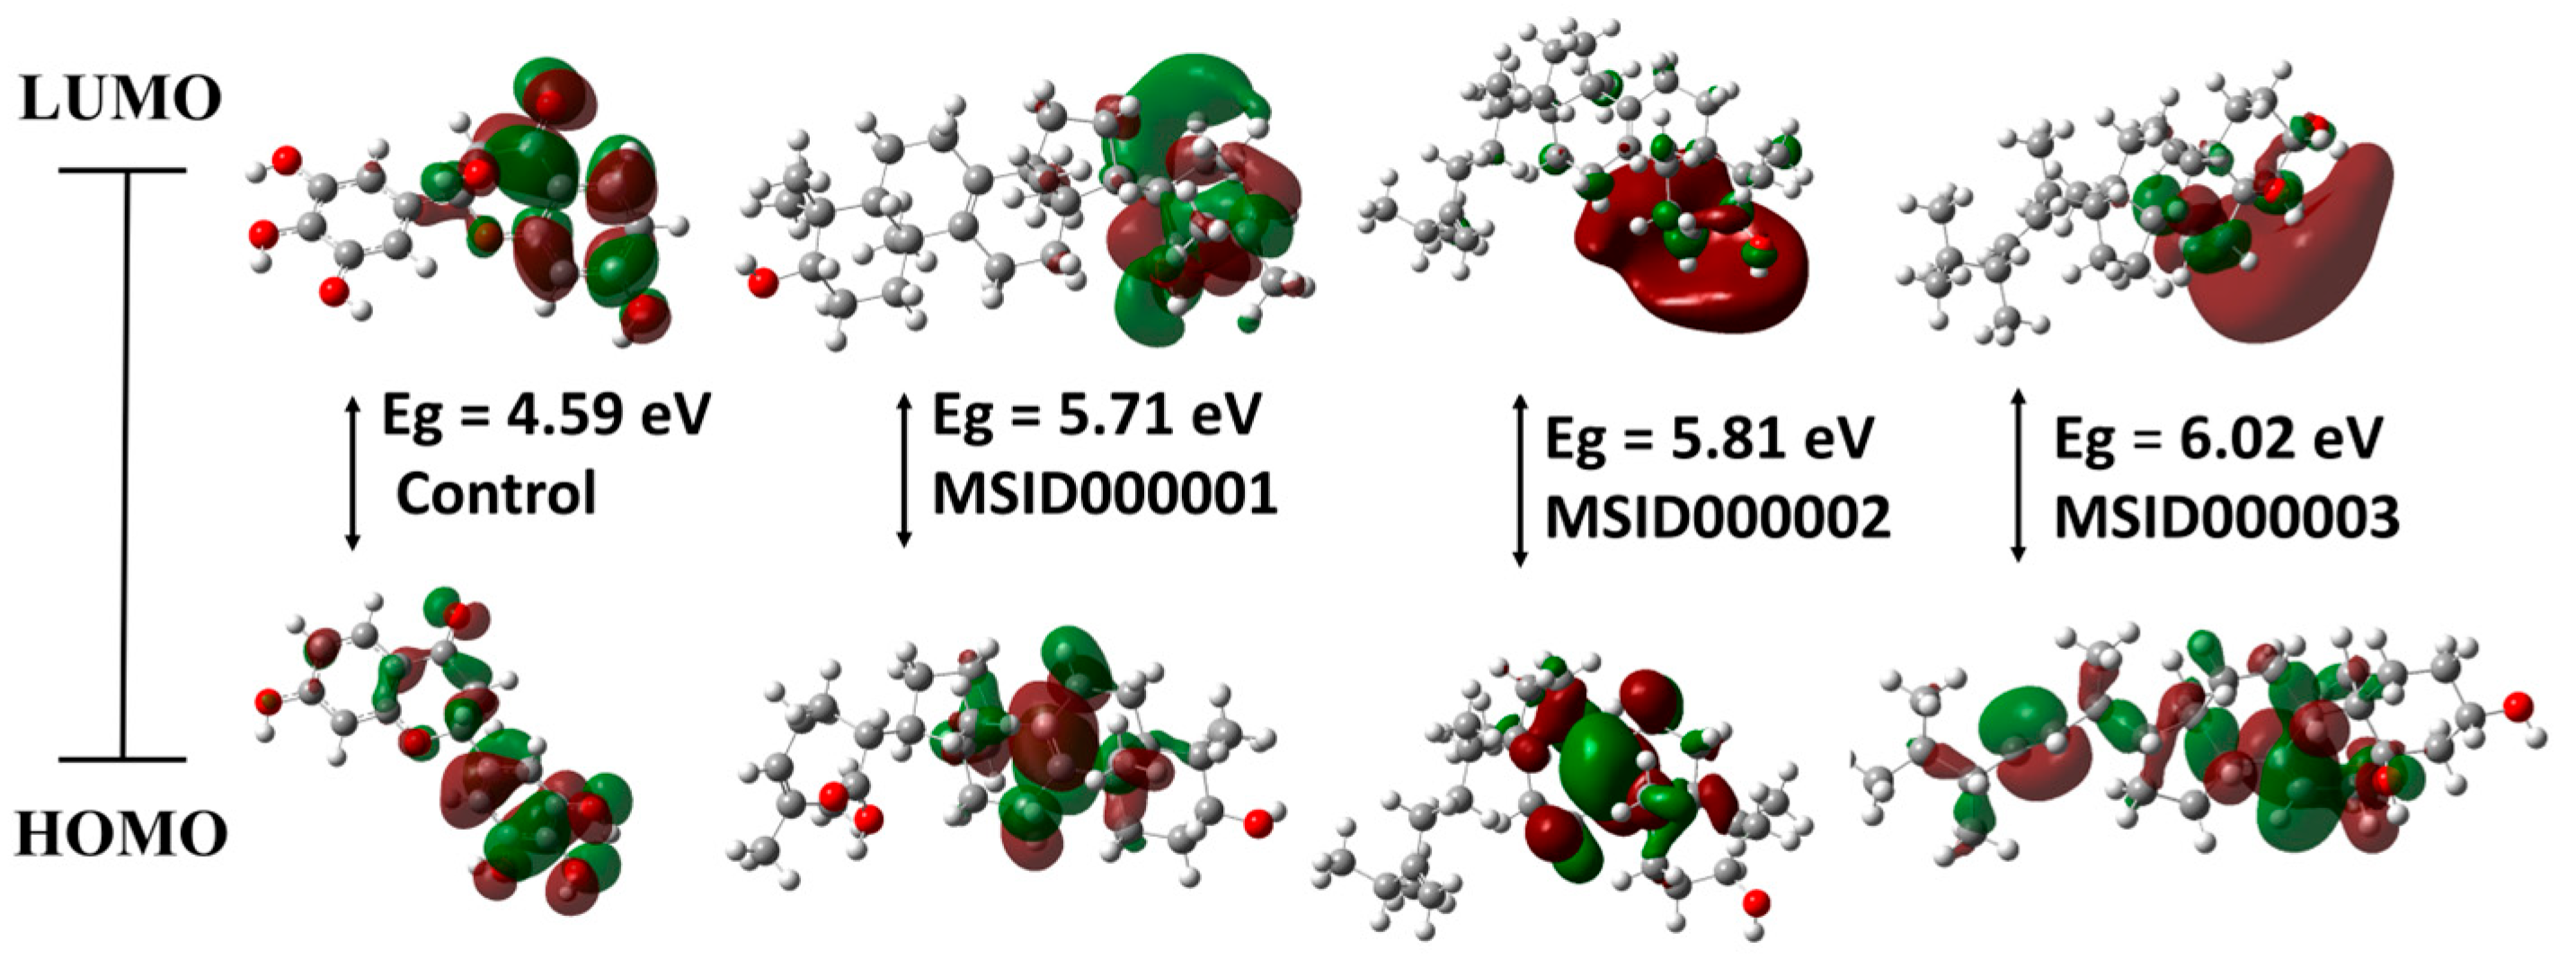
Figure 5 depicts the optimal structures of the compounds under investigation, providing a visual representation of their chemical topologies and spatial arrangements. All the compounds that were investigated exhibited stable conformation as real local minima, as evidenced by the measured positive imaginary frequencies. The MSID000001 exhibits a significant dipole moment, suggesting a strong electrostatic potential that may impact its binding affinity with the chosen target protein. The measured polarizability values ranged from 207.35 (control) to 347.85 (MSID000001), to 352.91 (MSID000002), to 338.32 (MSID000003) atomic units (a.u.). This suggests a spectrum of molecular reactivity among the chemicals tested. The nucleophilic and electrophilic properties are correlated with the energy values of the HOMO and the LUMO. The molecule MSID000002 has a significant electron-donating property due to its high HOMO energy value of e.V. −6.01. The LUMO density cloud is a vacant cloud that exhibits an electron-accepting property. The MSID000001 chemical exhibits a low energy gap of e.V. 5.71, which is higher than the control value of e.V. 4.59. This indicates that MSID000001 has a greater reactivity compared to the other compounds investigated.
Figure 6 displays the contour maps of HOMO-LUMO orbitals along with their corresponding energy gap values. The HOMO/LUMO energy values were utilized to create the global reactivity descriptors, which functioned as important instruments for comprehending medication properties and their potential interactions with biological targets. The compound MSID000003 exhibited a high ionization potential (I = 6.53), surpassing the control (6.45), MSID000001 (6.13), and MSID000002 (6.01) accordingly. This indicates that MSID000003 possesses a notable capacity to donate electrons in comparison to the other compounds under investigation.
Conversely, compound MSID000002 had a low electron affinity value (A = 0.21), indicating that it has the lowest capacity among the compounds to accept electrons. The hardness and softness values range from 1.37 to 2.80 and 0.68 to 1.40, respectively, and were calculated for the compounds under investigation. The molecule MSID000002 exhibits a high level of reactivity, as seen by its elevated softness value (S = 1.40). The electrophilicity value (ω) ranged from 11.76 (control) to 17.08 (MSID000003), indicating their ability to interact with nucleophilic scaffolds of biological targets. The reactivity descriptors of the substances under investigation are provided in Table 4.
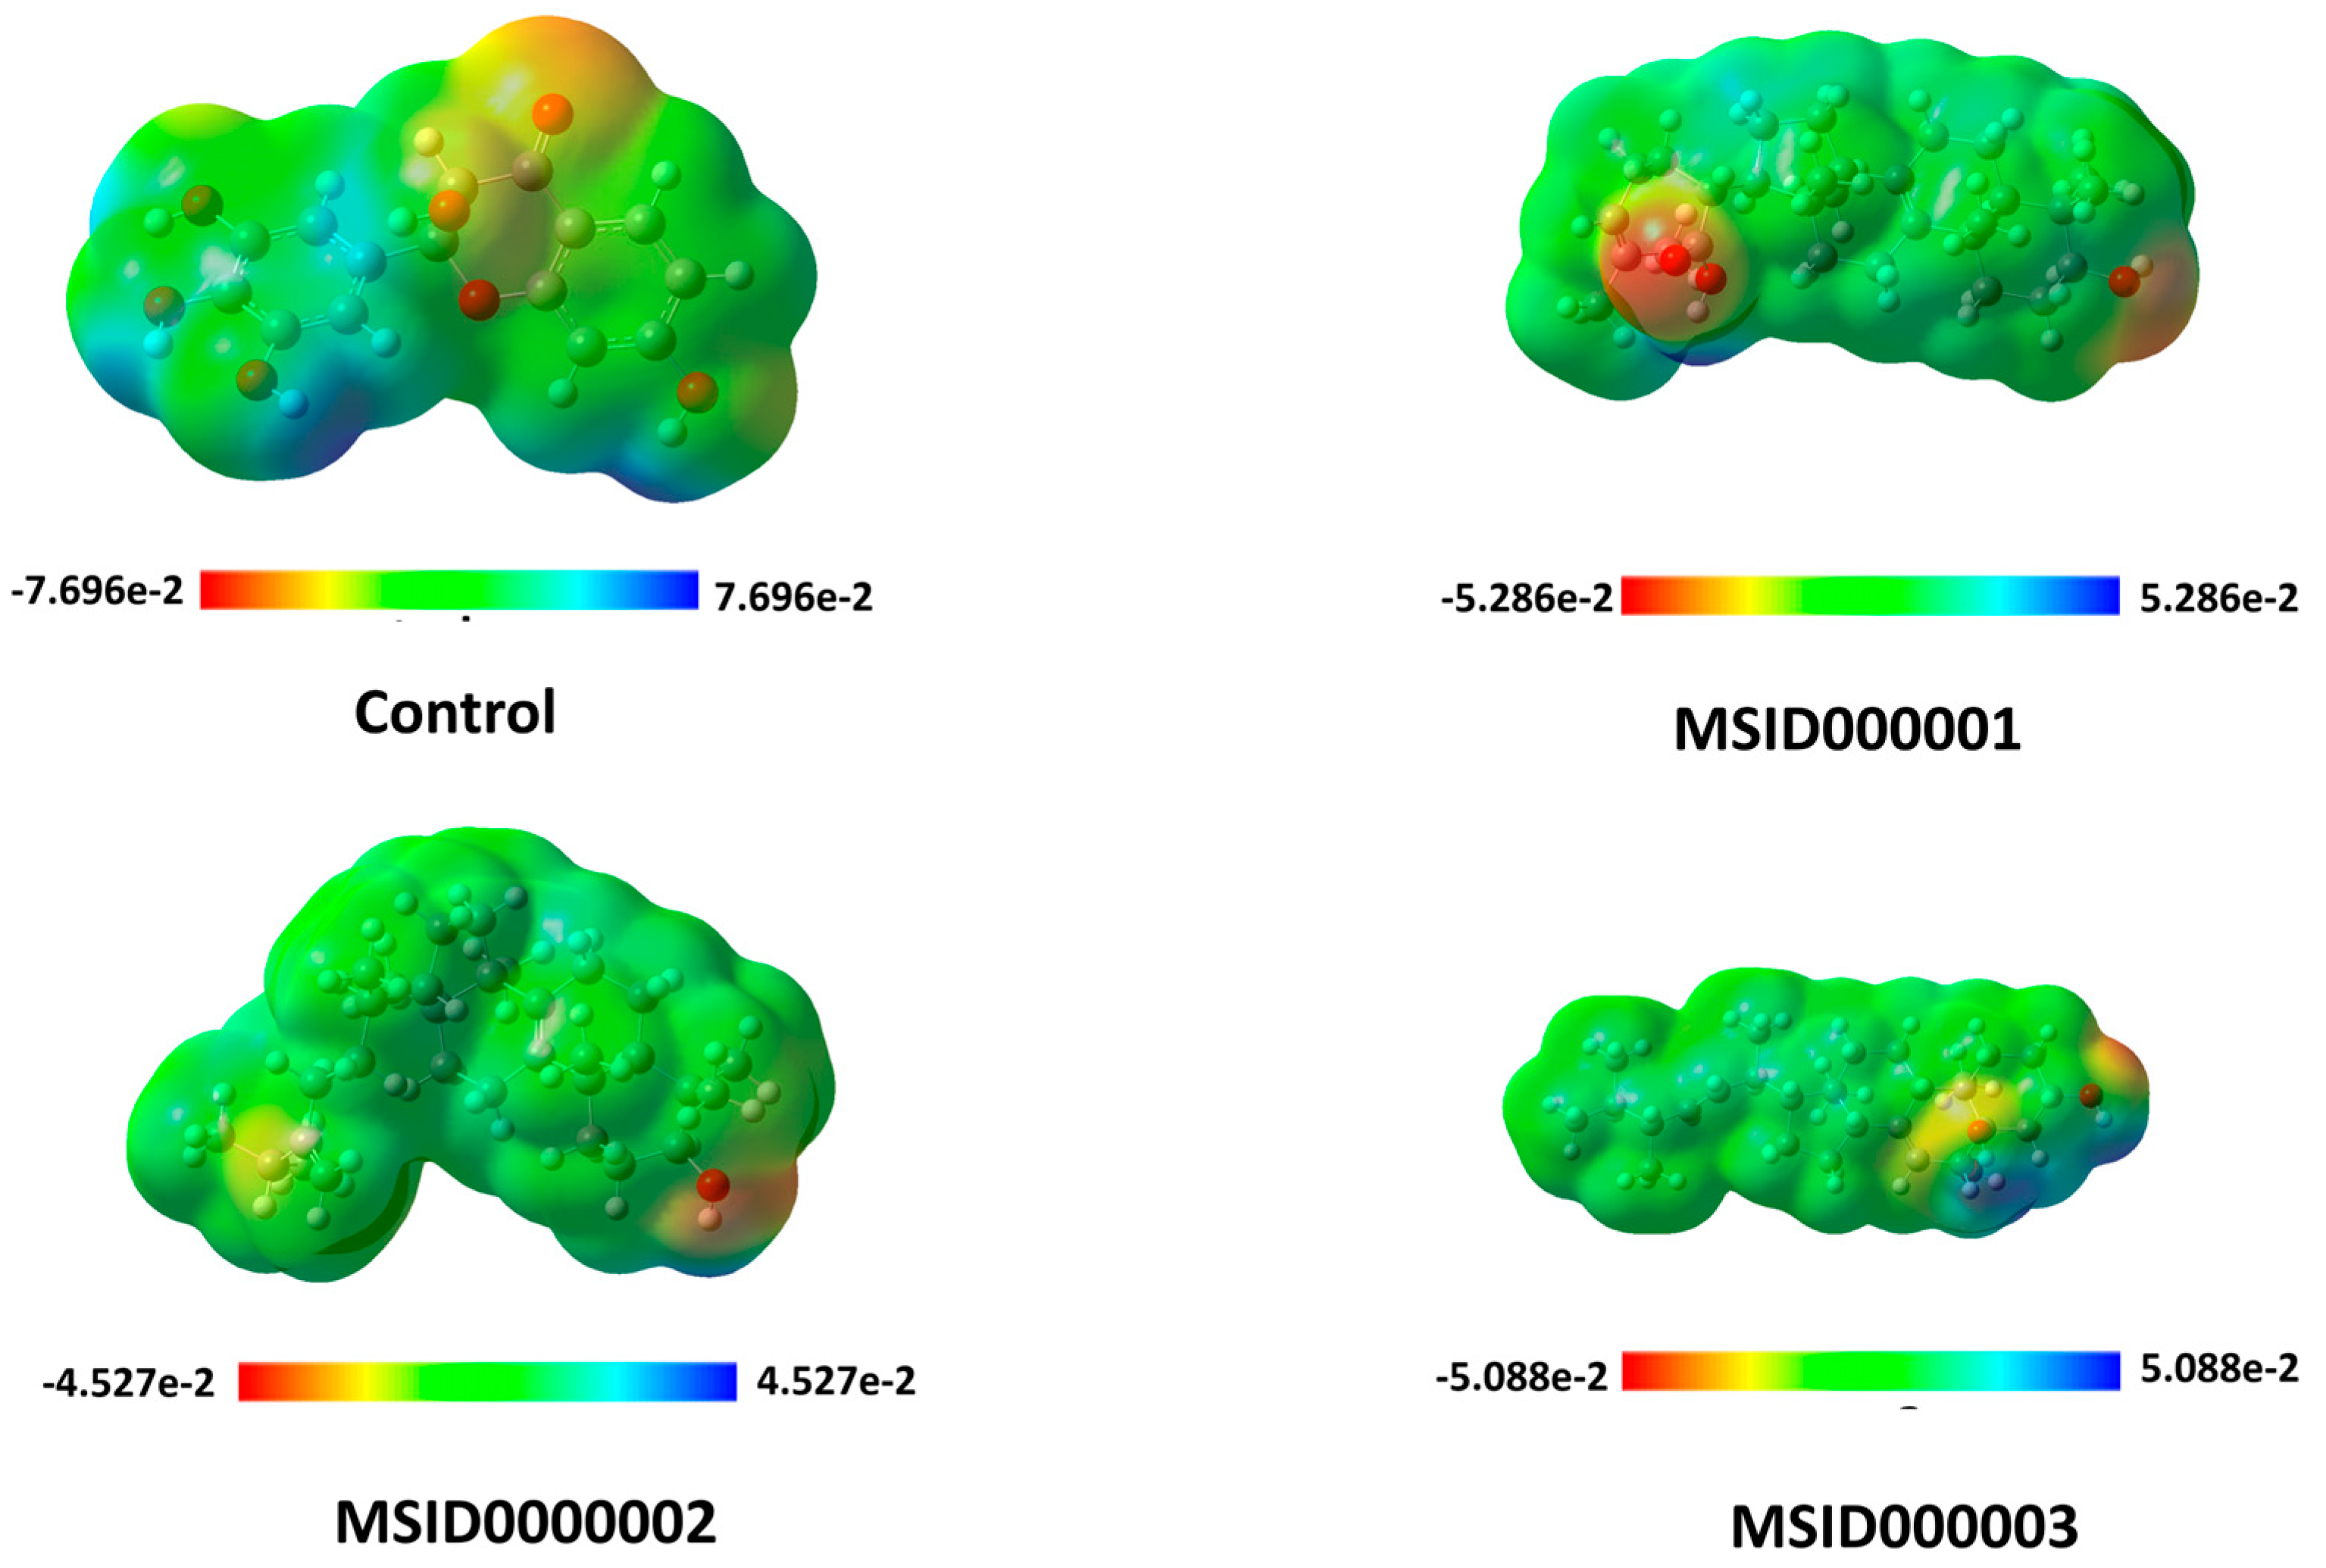
Molecular electrostatic potential maps are essential tools for visualizing the charge distribution pattern of the investigated molecules. In the context of MEP, as depicted in Figure 7, the red areas indicate locations that have a higher affinity for electron-rich centers. These regions are considered susceptible to electrophilic attacks. Conversely, the blue spots indicate regions where molecules have a higher affinity for electron-deficient centers, which facilitates nucleophilic assaults. The electrophilic and nucleophilic regions of a molecule play a crucial role in forming polar contacts with specific amino acid residues. The yellowish-green parts exhibited the neutral aspect of the examined chemicals, indicating their potential van der Waals interactions with the target protein.
Figure 7 illustrates the molecular electrostatic potential maps of the substances under investigation. The presence of negative charge potential, indicated by red patches on oxygen atoms in the analyzed structures, suggests that these locations are susceptible to electrophilic attacks. These locations can potentially operate as sites for polar interactions with important amino acid residues, as they are capable of accepting hydrogen bonds.

3.4. Absorption, Distribution, Metabolism, Excretion, and Toxicity (ADMET) Profiling

The selected compounds’ physiochemical characteristics were also evaluated. The compound’s chemical formula, molecular weight, number of aromatic heavy atoms, proportion Csp3, the physiochemical properties of refractivity, TPSA, and number of H-bond donors and acceptors were analyzed. Furthermore, pharmacokinetic, water solubility studies, and lipophilicity of the compounds were evaluated. The GI absorption, P-gp substrate, BBB permeant, medicinal chemistry features, and drug-likeness of the identified compounds were next studied in the pharmacokinetic profile analysis. Tables S1–S4 include all of this information. The compounds were identified as drug-like molecules since they have suitable physiochemical characteristics. It was also noted that the compounds had an acceptable range of pharmacokinetics, GI absorption oral bioavailability. The compounds have a high synthetic accessibility score, making them simple to synthesize. Similarly, the compounds had no PAINS assay and were therefore specific in their action.

3.5. Molecular Dynamic Simulation

With the “AMBER20 software”, the top-docked complexes and control molecule was subjected to a 500 ns MD simulation. The simulation trajectories generated data for (i) root mean square deviation (RMSD), (ii) root mean square fluctuation (RMSF), (iii) radius of gyration (RoG), (iv) beta factor analysis, and (v) solvent accessible surface area (SASA).
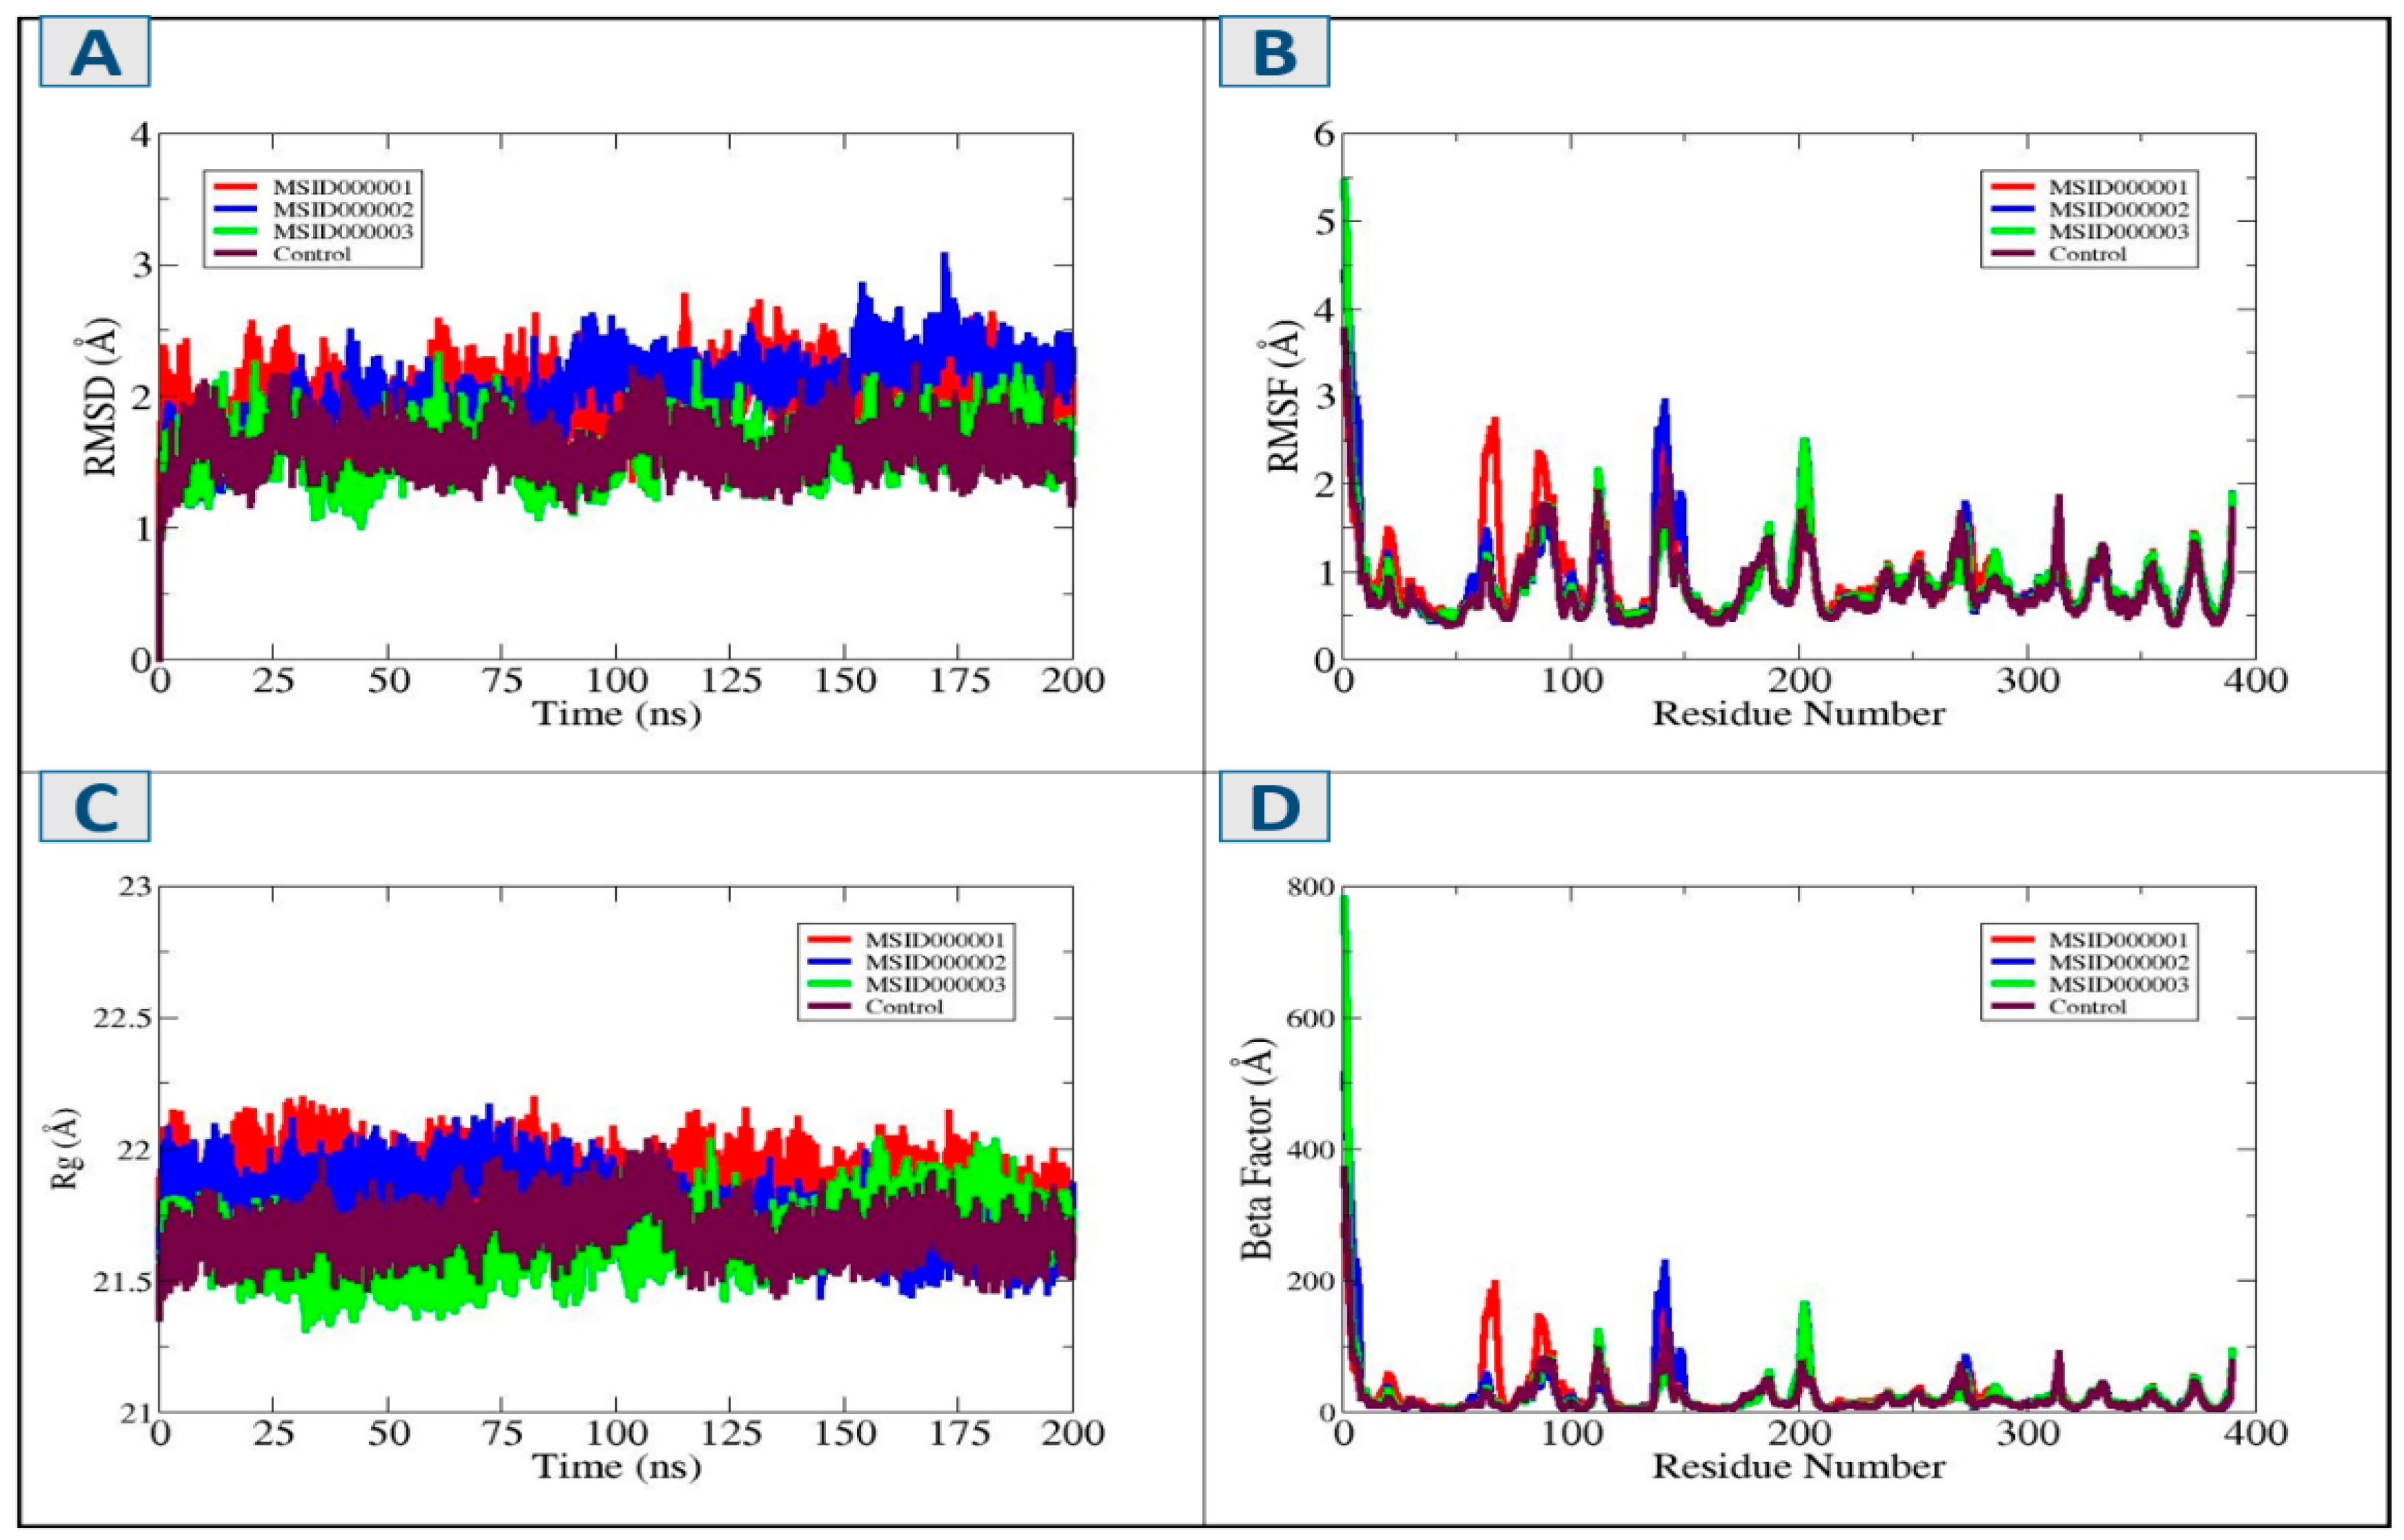
The protein–ligand complex’s stability during the simulation period can be observed by the RMSD figure. If the RMSD increases steadily, it indicates structural deviation; whereas if it plateaus, it represents equilibrium [55]. The three lead complexes MSID000001, MSID000002, and MSID000003 along with the control molecule showed stability throughout the simulation period with no major deviation and changes observed in the ligand binding poses with average RMSD of 1.96 Å, 2.01 Å, 1.59 Å, and 1.60 Å, whereas maximum values noted were 2.76 Å, 3.07 Å, 2.31 Å, and 2.27 Å, respectively (Figure 8A). The flexibility of the residues of amino acid in the complex of protein–ligand can be seen by RMSF analysis (Figure 8B). In the RMSF graphic, troughs denote rigid regions while peaks indicate regions with greater flexibility [56]. RMSF analysis showed notable fluctuation at the start of the simulation period; however, stabilization can occur after 200 ns. The RMSF minimum values showed were 0.95 Å, 0.88 Å, 0.87 Å, and 0.82 Å with maximum values being 3.28 Å, 4.41 Å, 5.44 Å, and 3.74 Å respectively. The lowest values for the top three complexes and control were 0.44 Å, 0.40 Å, 0.44 Å, and 0.38 Å sequentially for MSID000001, MSID000002, MSID000003, and Control. Over the simulation, the rigidity of the protein–ligand combination is evaluated through the radius of gyration analysis (RoG). Whenever RoG increases, it indicates unwinding or expansion; when it declines, it indicates compactness and rigidity [38]. In accordance with the formation of a stable protein–ligand complex, our simulation results indicate that each complex remained rigid and compact over the simulation periods, suggesting the complexes stabilization and compaction (Figure 8C). Their average values observed were 21.88 Å, 21.77 Å, 21.65 Å, and 21.68 Å MSID000001, MSID000002, MSID000003, while maximum values of 22.19 Å, 22.16 Å, 22.04 Å, and 22.03 Å and lowest of 21.45 Å, 21.43 Å, 21.31 Å, and 21.35 Å were observed. Low RoG values suggest a compact structure while an increase shows expansion and folding.
β-factors analysis obtains insights into the flexibility and mobility of individual atoms inside the protein–ligand complex [57]. Beta factor results indicate mean values for the top three complexes and control are 29.55 Å, 27.96 Å, 26. 06 Å, and 22.17 Å, respectively. Their maximum values obtained were 283.7 Å, 513.97 Å, 780.8 Å, and 370.05 Å in a similar manner. Moreover, their lowest values noted were 5.12 Å, 4.39 Å, 5.28 Å, and 3.92 Å for MSID000001, MSID000002, and MSID000003, correspondingly. Close the ligand binding position with values ranging from 22 to 29, reflecting better flexibility in residues involved in ligand binding and interaction (Figure 8D).

3.6. Solvent Accessible Surface Area (SASA)

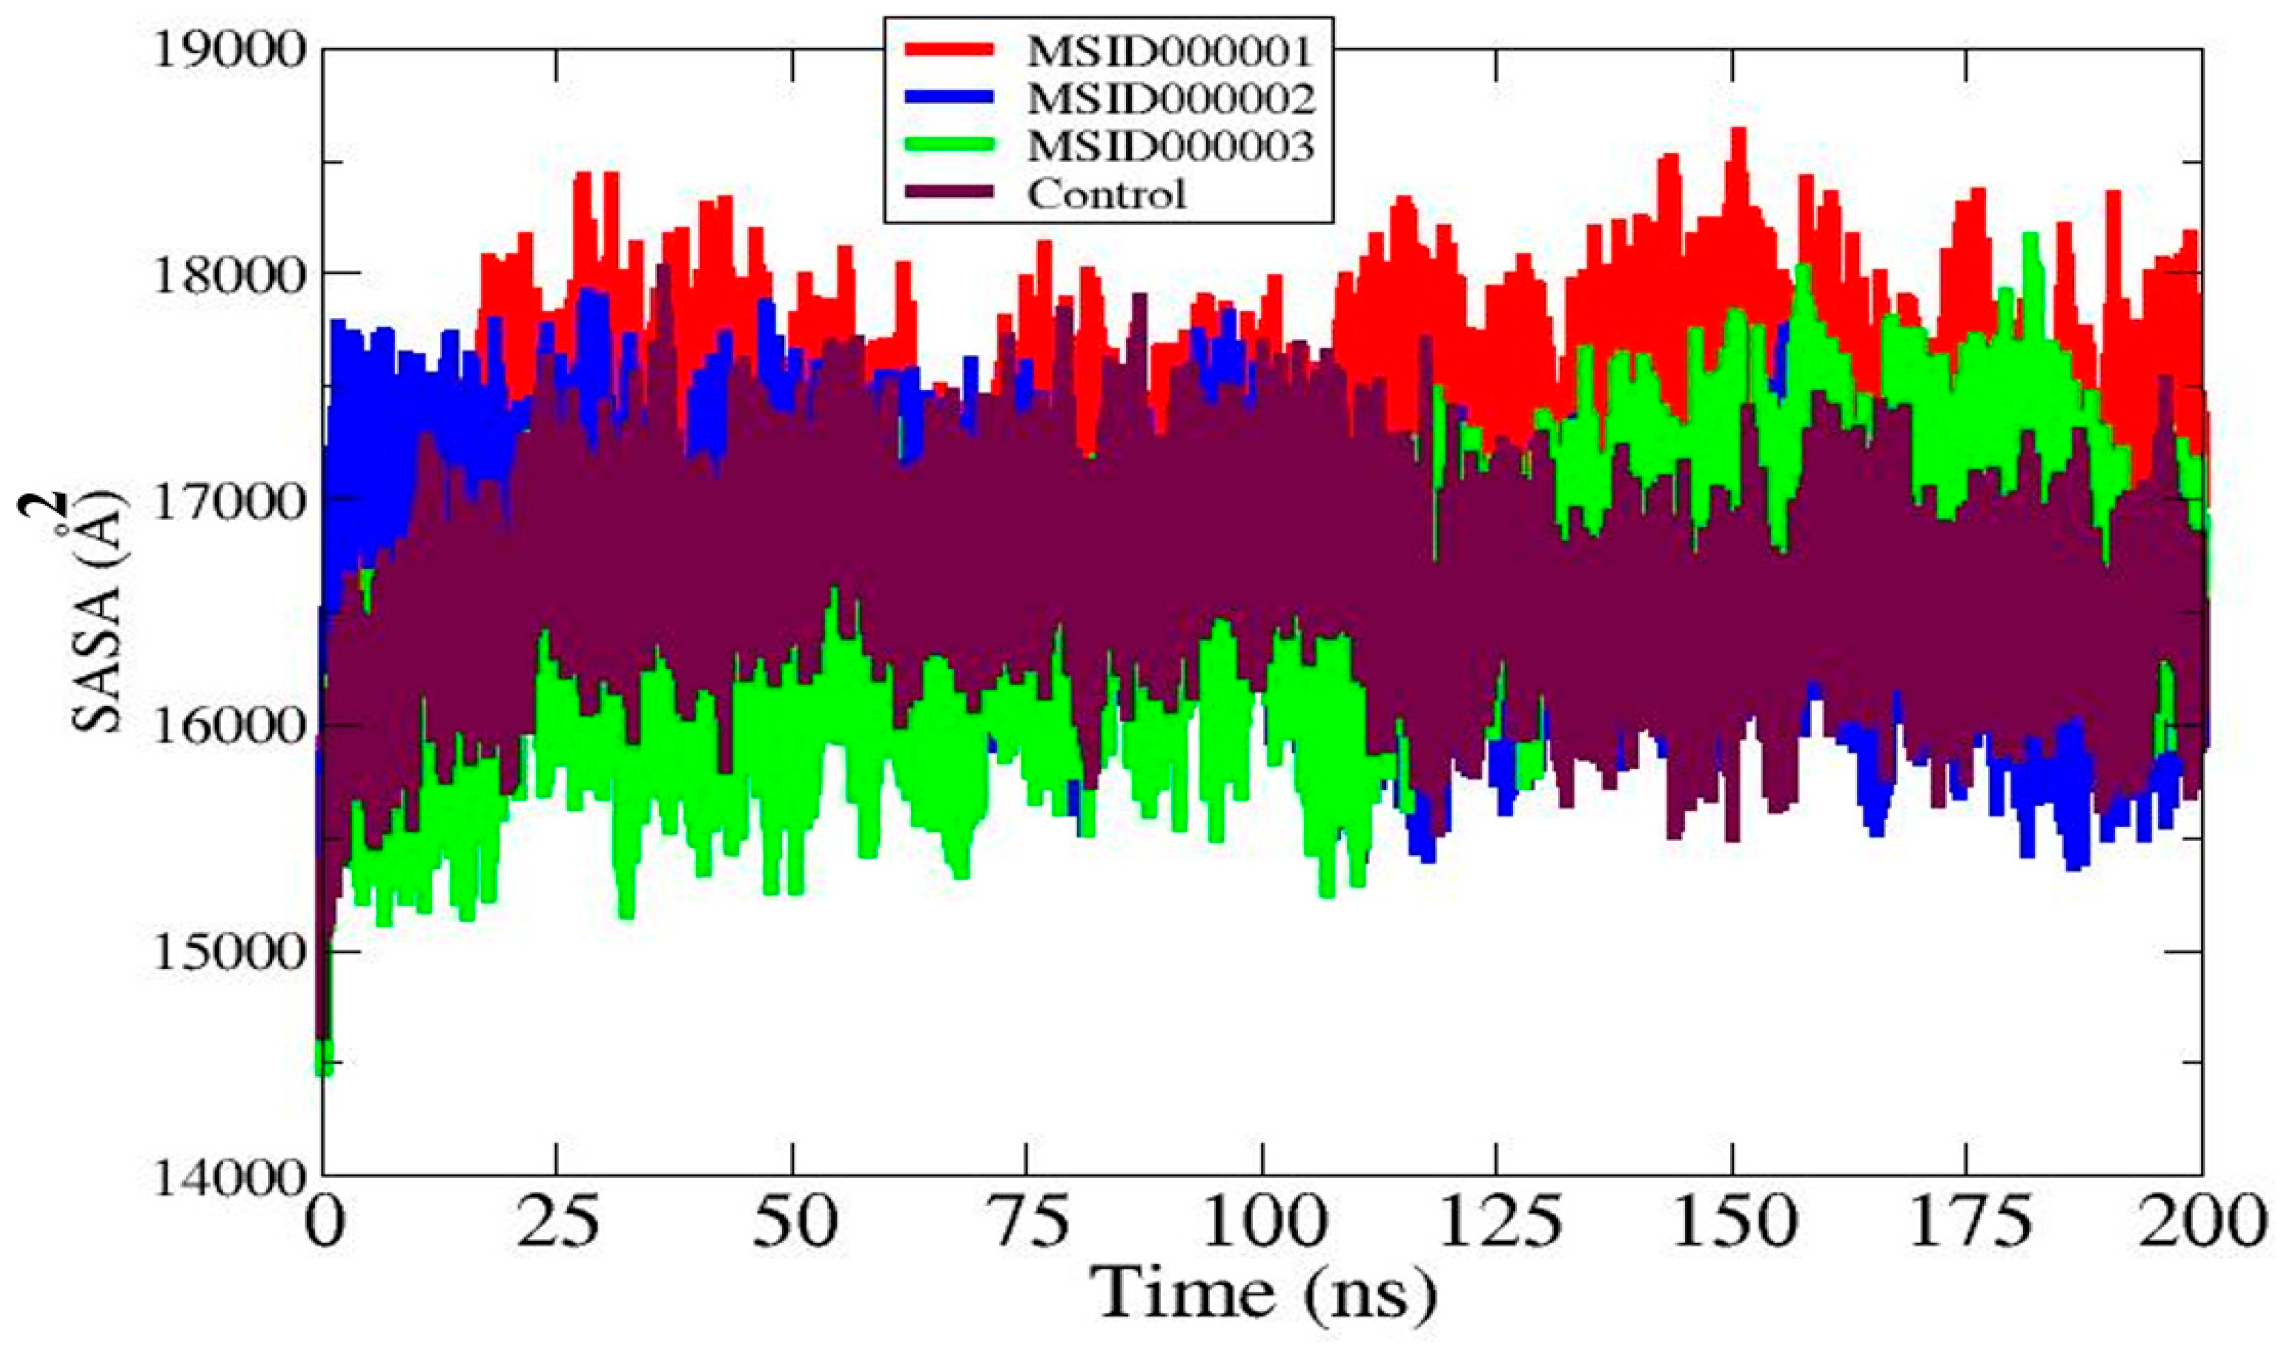
An analysis of solvent-accessible surface area (SASA) was conducted on the top complexes to find out the interaction between the solvent molecules on the surface of the target protein. The average values for MSID000001, (1722.1 nm2), MSID000002 (16,649.3 nm2), MSID000003 (16,502 nm2), and control (16,625 nm2) were obtained, while maximum values were revealed as (18,620.3 nm2), (17,906.5 nm2), (18,158.8 nm2), and the control was (18,013.1 nm2), respectively. Conversely, the lowest values observed were MSID000001 (14,723.8 nm2), MSID000002 (14,772.3 nm2), MSID000003 (1446.2 nm2), and the control (14,633.3 nm2). Plots illustrate that following ligand binding, no major deviations were noticed as shown in the following Figure 9.

3.7. H-Bonding Analysis

It was vital to emphasize the important role of hydrogen bonds in maintaining complexes between ligands and docked receptors. Identifying which of the enzyme residues formed hydrogen bonds with the compounds was particularly necessary. As demonstrated in Table 5, the hydrogen atom that forms the bond is referred to as the “Donor”, whereas the negatively charged atom that takes the bond is labeled as the “Acceptor”. The percentage of the simulation time where the hydrogen bond exists can be seen in the “Occupancy” column. The hydrogen bonds made by the receptor’s enzyme with the top three ligand molecules are given in the table.

3.8. Principal Component Analysis (PCA)

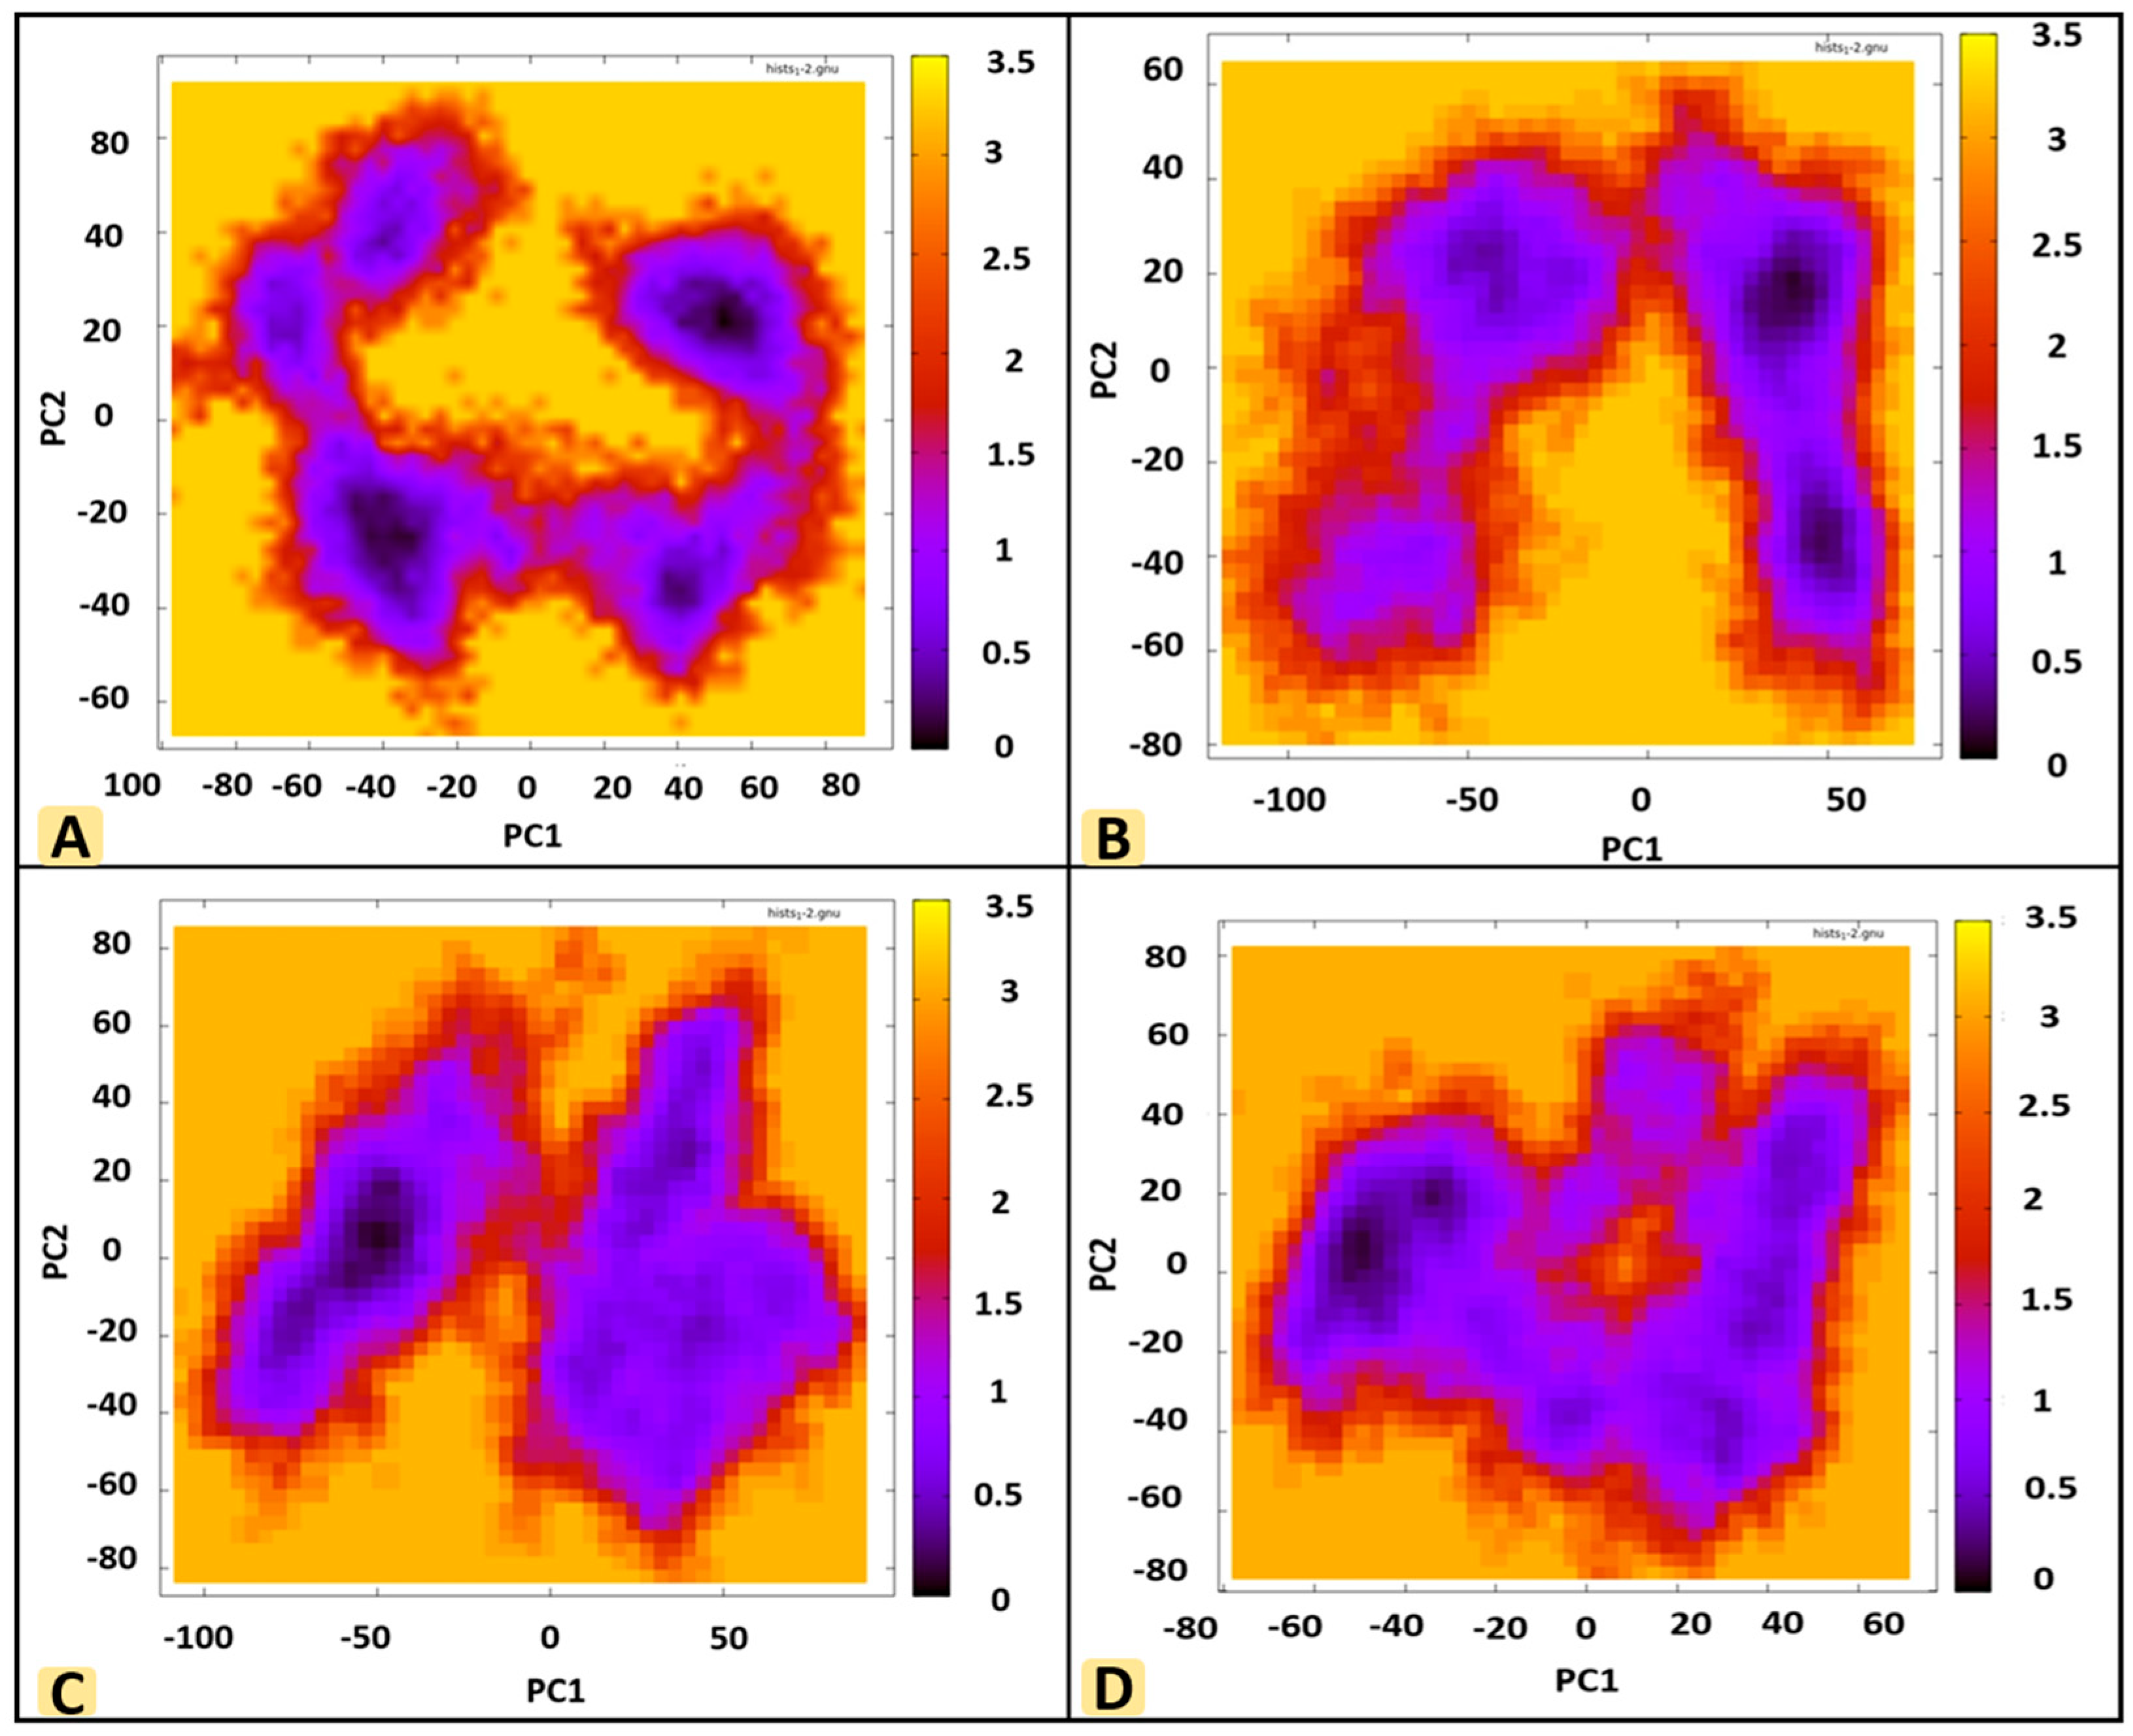
Multivariate statistical methods such as PCA are employed to better understand the vast dataset’s complexity. It transforms the measured variables into principal components (PCs), that represent unrelated variables [58]. Each PC is complementary, indicating they are orthogonal to each other. PC1 represents the dataset’s highest variability, subsequently followed by PCs (PC2, PC3, etc.) [59]. PCA was conducted and visualized to identify the most notable structural changes within the proposed protein–ligand complexes exhibited during binding to each other system [60]. Principal component analysis (PCA) was employed to obtain data on the conformation phases and layout of the target enzyme with the ligands and control molecule by using the 100 ns molecular dynamics (MD) simulation trajectories.
According to the study’s findings, the majority of the compounds under this research are physiologically active molecules that interact with nuclear receptor ligands and other enzymes to induce physiological activities by inhibiting collagenase enzyme. After analyzing these graphs, it is apparent that the eigenvalue distributions of the complexes shown in Figure 10 differ from one another. Specifically, the eigenvalues of the control (D) complex show a much wider dispersion followed by MSID000003 than those of MSID000001 (A) and the MSID000002 (B) complex. This suggests that there is more variability in the conformational states of the interactions involving the Clostridium histolyticum collagenase enzyme in Control (D). This variability implies that the structural dynamics and potentially the functional implications of the enzyme’s interactions vary significantly among these complexes.

3.9. Secondary Structure Analysis

The overall structure of the protein–enzyme complex during analysis is made up of secondary structural elements including alpha helices and beta sheets, which provide complex stability and contain the active sites required for enzymatic activity [61]. Secondary structure analysis was performed to understand and investigate the structural basis of C. histolyticum collagenase function. Tight turns and loops can be seen within the enzyme component, which aids in the binding of substrates and catalytic turnover. The number of β sheets and alpha helix formed over the simulation period was calculated and depicted in Figure S1 given. Upon analyzing, different secondary structure elements were shown such as T stands for turn and loops in the structure, E represents β-strands, B for isolated H-bonding β bridge between β strands, H shows α helix in SS motif where protein backbone facilitates a helical structure, G represents a type of helical Sec-Structure, Pi–Pi indicated a rare form helical structure, and C shows coils in the protein structure. As shown in Figure S1, where the secondary structure of MSID000001, MSID000002, MSID000003, and Control are depicted.

3.10. MMPBSA/GSA Calculations

Using AMBER22’s MM-GBSA and MM-PBSA modules, the binding free energies for the MSID000001, MSID000002, MSID000003, and Control docked complexes were estimated (Table 6). For the MSID000001 docked complex, the MM-GBSA calculated a total energy of −78.58 kcal/mol, for the MSID000002 complex, −70.44 kcal/mol, and for the MSID000003 docked complex, −59.32 kcal/mol. As shown in Table 3, the calculated net free energy for complexes in the MM-PBSA results was −79.54 kcal/mol, −73.99 kcal/mol, and −62.22 kcal/mol, correspondingly. It is anticipated that the complexes develop strong and stable intermolecular interactions based the low net binding energy scores.

3.11. WaterSwap Energy Estimation

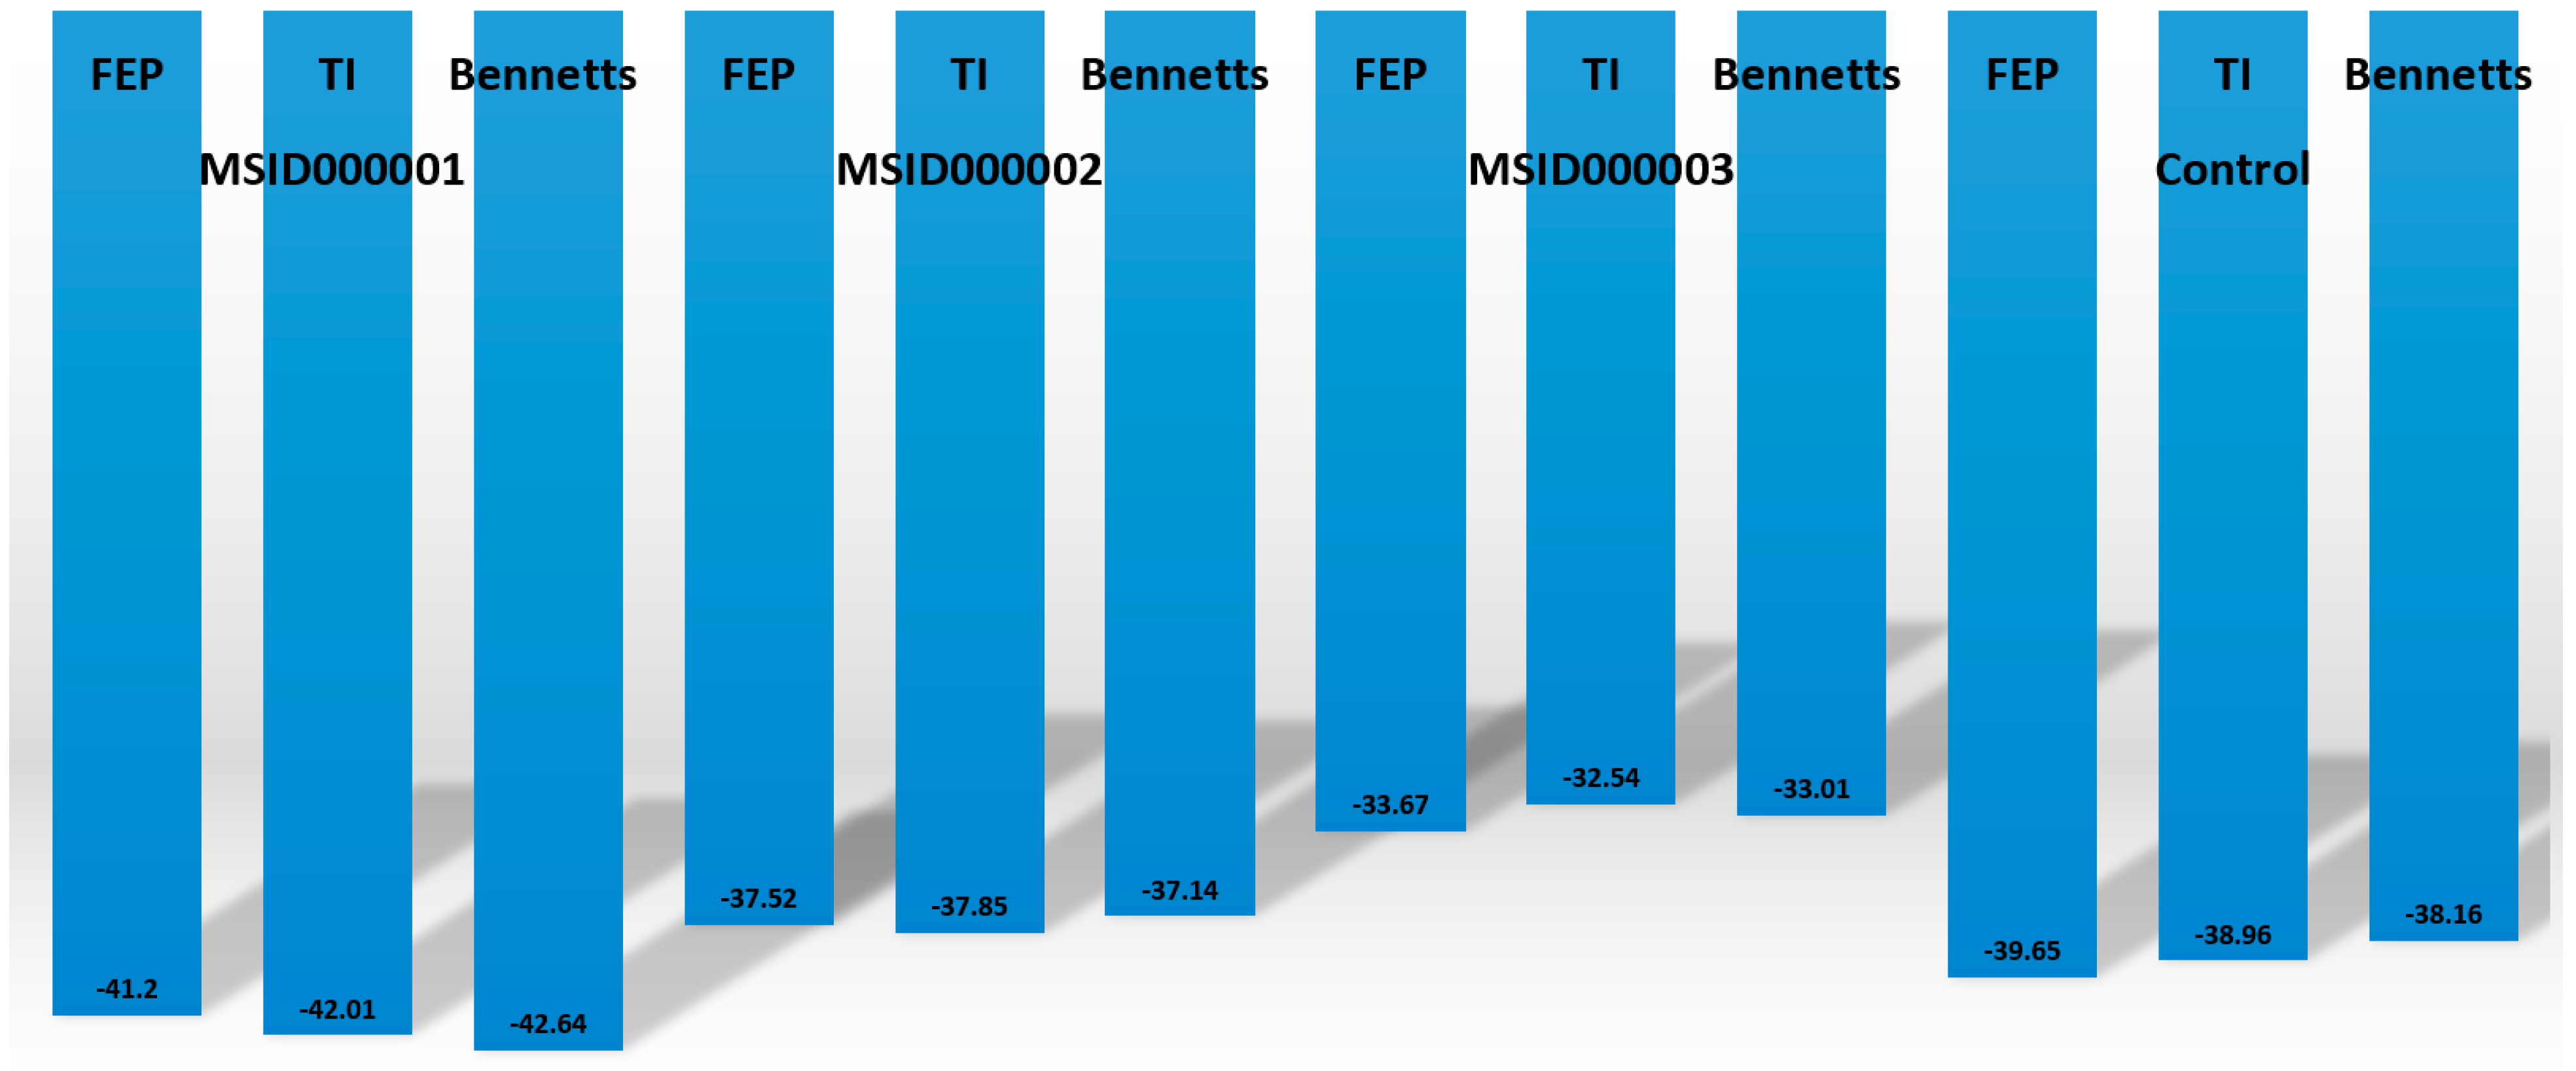
WaterSwap energy estimation in computer-aided drug design is carried out to obtain insights into the interaction of water molecules with target proteins and drugs [49]. By studying these interactions, we can make better drugs that bind more tightly and specifically to their targets, improving their effectiveness [62]. To revalidate the GBSA/MMPB estimations, the binding free energy for each docked complex has been calculated with the WaterSwap technique. Figure 11 illustrates the predicted WaterSwap binding energy from multiple steps. Three different approaches were used, particularly Bennetts, thermodynamic integration (TI), and free energy perturbation (FEP). The lead compounds MSID000001, MSID000002, and MSID000003, and the control are stable in binding energies and appear to be promising drug candidates. The Bennetts, TI, and FEP-binding free energy values for each complex are outlined in Figure 11 below.

3.12. Entropy Energy Estimation

Energy calculations are performed to assess ligand–target complexes’ stability and binding affinity in the development of drugs, offering details about the complex’s structural features, stability, and binding affinity [63]. To obtain insights into the net binding energy, entropy energy contribution was calculated using AMBER22. The entropy energy contribution of the top three complexes and control is outlined in the table (Table 7), showing values of −5.96 kcal/mol, −2.85 kcal/mol, −1.36 kcal/mol, and −2.60 kcal/mol for MSID000001, MSID000002, and MSID000003, and the control, respectively.

3.13. Salt Bridges Studies

The strongest non-covalent interaction found in nature is known as salt bridges, which are involved in molecular recognition, protein–protein interactions, and protein folding [64]. Two types of amino acid side chains are involved in salt bridges interaction, Glu or Glu if the ligand is positively charged, whereas negatively charged amino acid chains are Arg or Lys [65] (Table 8). In this technique, the electrostatic interaction between the oppositely charged ions was observed in the docking region of MSID000001, MSID000002, MSID000003, and Control. (See Figure S2).
There were significant differences in the distribution of charged residues involved upon comparing the salt bridges of the hit compounds compared to the control. When it came to creating salt bridges, the control displayed an increased number of positively charged residues, such as arginine (Arg) and lysine (Lys). On the contrary, aspartate (Asp) and glutamate (Glu), are examples of negatively charged residues that are primarily involved in salt bridge interactions in the hit compounds. The variation suggests that whereas the control mostly comprises positively charged residues, the hit compounds largely form salt bridges with negatively charged residues. The differences in residue involvement increase the possibility that the hit compounds’ binding affinities and specifics differ from those of the control, which might enhance the stability and total binding efficiency to the target protein.

4. Discussion

Experimental studies that seek to comprehend a disease’s molecular basis at the structural level usually demand a long time and a lot of effort. since the experimental techniques have many downsides and limitations, There exists a market for in silico approaches, which may identify potential inhibitors with greater efficiency and precision [38]. Multiple sequence-based and structure-based prediction approaches, which comprise several algorithms, combine to develop an effective tool that delivers precise and accurate predictions [66].
The main collagenase enzyme produced by Clostridium histolyticum draws a lot of attention as a promising target for drug interventions due to its key role in the breakdown of tissues and the healing process of wounds [67]. The protein that is most common in the extracellular matrix, or outer layer, of connective tissues, collagen, is broken down by the main collagenase enzyme produced by Clostridium histolyticum [10]. The underlying causes of particular disorders like Dupuytren’s contracture, Peyronie’s disease, as well as wound healing and tissue remodeling, all are significantly affected by the enzyme’s activity [68]. Targeting the main collagenase enzymes via specific inhibitors has considerable potential in regulating tissue breakdown, changing wound healing mechanisms, and possibly lowering symptoms related to conditions affecting collagen [69]. So, developing drugs that efficiently target the main collagenase enzyme of Clostridium histolyticum does not come with any obstacles. Selection against host enzymes must be maintained, and adverse reactions need to be kept to a minimum [70].
Using computational techniques, a comprehensive in silico study was conducted to identify potential inhibitors against Clostridium histolyticum with the main collagenase enzyme. By employing molecular docking modeling, we performed the screening of Medicinal Fungi Secondary Metabolites And Therapeutics MeFSAT library having 1800 compounds and identified three lead compounds. MSID000001, MSID000002, MSID000003 exhibited promising binding scores of −10.7 kcal/mol, −9.8 kcal/mol, and −9.5 kcal/mol, respectively, while the control showed a binding score of −8 kcal/mol to the enzyme’s active site. The binding mode and interactions were not changed in any apparent way during the simulated time. These compounds met the criteria needed to be considered drug-like and also exhibited good pharmacokinetic properties. Further, MD simulations were employed to show the dynamics and stability of the protein–ligand complexes during the simulation period. Trajectory data analysis was utilized to identify good binding conformations and structural modifications within the collagenase active site on ligand binding. Further, the dynamics of the enzyme–ligand systems were investigated by principal component analysis (PCA), which showed insight into the conformational changes caused by inhibitor binding. Moreover, the research highlighted the effect of inhibitor interaction on the collagenases’ secondary structural elements as well as the role of salt bridges in maintaining the stability of enzyme–ligand complexes. Understanding the mechanism of action and optimizing lead compound development for greater specificity and efficacy requires knowledge of the mentioned data. Considering their potential as novel drugs, these compounds offer further experimental research to determine how effectively they act against Clostridium histolyticum. Taking everything considered, these findings indicate that the protein remained structurally unaltered whereas the selected ligands are found, despite no obvious conformational shifts occurred.
Our findings align with previous studies investigating inhibitors against collagenases from Clostridium histolyticum. A study was reported by [71] to develop a virtual screening technique that integrated ligand-based and structure-based discovery of drug methods to identify potential inhibitors of bacterial collagenase A. Three FDA-approved drugs, benzthiazide, entacapone, and lodoxamide, were identified to be strong candidates for inhibiting bacterial collagenase. These drugs were selected based on their good simulated interactions with bacterial collagenase and their assessed potential for blocking the enzyme. The study emphasized the need for further investigations to verify the predicted biological function of these specific compounds as well as assess their efficacy in managing infections caused by bacterial collagenase.
Identifying possible inhibitors of Clostridium histolyticum collagenases could potentially be helpful to address diseases like fibrosis and chronic wounds which are connected to the degradation of collagen. The enzyme activity of collagenases is the target of these inhibitors, which could reduce tissue damage and promote tissue regeneration and wound healing. The lead compounds found by in silico analysis, according to our findings, should be subjected to extensive validation experiments to assess the effectiveness and safety features. Whereas in silico analysis has tremendous promise, this study includes certain limitations. Simulation variables and the quality of the protein’s structure are key factors in computational accuracy. Protein flexibility and effects of solvent might be missed by docking analysis, raising the likelihood of false positive results. The demand for multidisciplinary cooperation and validation to confirm inhibitory potency is highlighted by the limited experimental data.
The optimization of inhibitor features and experimental validation should be the primary fields of future study. Integrating experimental and computational data may advance the development of new drugs for conditions linked to collagen. In a nutshell, our findings facilitate the discovery of drugs by improving treatment options for disorders linked to collagen degradation, although further validation needs to be conducted to combat antimicrobial resistance.

5. Conclusions

This research aimed to identify C. histolyticum collagenase G inhibitors. By using computer modeling and an in silico approach, we were able to identify the top three compounds as MSID000001, MSID000002, and MSID000003 that showed potential in efficiently inhibiting the activity of the enzyme. These findings offered a step towards the development and characterization of novel inhibitors targeting the C. histolyticum Peptidase G domain. Further investigation needs to be conducted to efficiently inhibit the said enzyme. Moving forward, experimental investigation needs to be performed to validate the computational findings of this research.

Supplementary Materials

The following supporting information can be downloaded at: https://www.mdpi.com/article/10.3390/computation12080153/s1, Figure S1: The secondary structure of the top three complexes MSID000001 (A), MSID000002 (B), MSID000003 (C), and Control (D), respectively. Figure S2: The salt bridges interaction of top three complexes MSID000001, MSID000002, MSID000003 and Control, respectively are depicted in the figure given above. Table S1: Pharmacokinetics profile of the MSID000001, MSID000002, MSID000003 and Control. Table S2: Lipophilicity properties of the investigated compounds. Table S3: Physiochemical properties of the selected compounds. Table S4: Drug-likeness of the studied compounds.

Author Contributions

Conceptualization, F.A.; methodology, F.A., A.H., N.A.A. and F.A.A.; software, N.H.; validation, A.A.A.; formal analysis, A.A.A.; investigation, M.B.; resources, A.S.; data curation, N.A.A. and A.A.A.; writing—original draft preparation, H.J.B.; writing—review and editing, A.A.; visualization, M.I.N.; supervision, F.A.; project administration, F.A.; funding acquisition, F.A. All authors have read and agreed to the published version of the manuscript.

Funding

This research was funded by Taif University, Saudi Arabia, project number (TU-DSPP-2024-140).

Data Availability Statement

All the data generated in the current research is presented in the manuscript.

Acknowledgments

The authors extend their appreciation to Taif University, Saudi Arabia, for supporting this work through project number (TU-DSPP-2024-140).

Conflicts of Interest

The authors declare no conflicts of interest.

References

  1. Alhayek, A.; Abdelsamie, A.S.; Schönauer, E.; Camberlein, V.; Hutterer, E.; Posselt, G.; Serwanja, J.; Blöchl, C.; Huber, C.G.; Haupenthal, J.; et al. Discovery and Characterization of Synthesized and FDA-Approved Inhibitors of Clostridial and Bacillary Collagenases. J. Med. Chem. 2022, 65, 12933–12955. [Google Scholar] [CrossRef] [PubMed]
  2. Muteeb, G.; Rehman, M.T.; Shahwan, M.; Aatif, M. Origin of Antibiotics and Antibiotic Resistance, and Their Impacts on Drug Development: A Narrative Review. Pharmaceuticals 2023, 16, 1615. [Google Scholar] [CrossRef] [PubMed]
  3. Calvert, M.B.; Jumde, V.R.; Titz, A. Pathoblockers or Antivirulence Drugs as a New Option for the Treatment of Bacterial Infections. Beilstein J. Org. Chem. 2018, 14, 2607–2617. [Google Scholar] [CrossRef] [PubMed]
  4. Popoff, M.R.; Bouvet, P. Genetic Characteristics of Toxigenic Clostridia and Toxin Gene Evolution. Toxicon 2013, 75, 63–89. [Google Scholar] [CrossRef] [PubMed]
  5. Brown, R.L.; Larkinson, M.L.Y.; Clarke, T.B. Immunological Design of Commensal Communities to Treat Intestinal Infection and Inflammation. PLoS Pathog. 2021, 17, e1009191. [Google Scholar] [CrossRef] [PubMed]
  6. Palmer, J.S.; Hough, R.L.; West, H.M.; Avery, L.M. A Review of the Abundance, Behaviour and Detection of Clostridial Pathogens in Agricultural Soils. Eur. J. Soil Sci. 2019, 70, 911–929. [Google Scholar] [CrossRef]
  7. Gabrielson, A.T.; Spitz, J.T.; Hellstrom, W.J.G. Collagenase Clostridium Histolyticum in the Treatment of Urologic Disease: Current and Future Impact. Sex. Med. Rev. 2018, 6, 143–156. [Google Scholar] [CrossRef] [PubMed]
  8. Popoff, M.R. Overview of Bacterial Protein Toxins from Pathogenic Bacteria: Mode of Action and Insights into Evolution. Toxins 2024, 16, 182. [Google Scholar] [CrossRef] [PubMed]
  9. Kaya, C.; Hirsch, A.K.H. Targeting Extracellular Bacterial Proteases for the Development of Novel Antivirulence Agents. Chimia 2022, 76, 402–408. [Google Scholar] [CrossRef] [PubMed]
  10. Eckhard, U.; Huesgen, P.F.; Brandstetter, H.; Overall, C.M. Proteomic Protease Specificity Profiling of Clostridial Collagenases Reveals Their Intrinsic Nature as Dedicated Degraders of Collagen. J. Proteom. 2014, 100, 102–114. [Google Scholar] [CrossRef] [PubMed]
  11. Shekhter, A.B.; Balakireva, A.V.; Kuznetsova, N.V.; Vukolova, M.N.; Litvitsky, P.F.; Zamyatnin Jr, A.A. Collagenolytic Enzymes and Their Applications in Biomedicine. Curr. Med. Chem. 2019, 26, 487–505. [Google Scholar] [CrossRef] [PubMed]
  12. Sargsyan, A.; Hakobyan, H.; Mardiyan, Z.; Jamharyan, S.; Dadayan, A.; Sargsyan, T.; Hovhannisyan, N. Modeling, Synthesis and in Vitro Screening of Unusual Amino Acids and Peptides As Protease Inhibitors. J. Chem. Technol. Metall. 2023, 58, 615–620. [Google Scholar] [CrossRef]
  13. María, R.R.; Arturo, C.J.; Alicia, J.; Paulina, M.G.; Gerardo, A. The Impact of Bioinformatics on Vaccine Design and Development. Vaccines 2017, 2, 3–6. [Google Scholar]
  14. dos Santos Nascimento, I.J.; da Silva Rodrigues, É.E.; da Silva, M.F.; de Araújo-Júnior, J.X.; de Moura, R.O. Advances in Computational Methods to Discover New NS2B-NS3 Inhibitors Useful against Dengue and Zika Viruses. Curr. Top. Med. Chem. 2022, 22, 2435–2462. [Google Scholar] [CrossRef] [PubMed]
  15. Saha, M.; Sarkar, A. Review on Multiple Facets of Drug Resistance: A Rising Challenge in the 21st Century. J. Xenobiotics 2021, 11, 197–214. [Google Scholar] [CrossRef] [PubMed]
  16. Kore, P.P.; Mutha, M.M.; Antre, R.V.; Oswal, R.J.; Kshirsagar, S.S. Computer-Aided Drug Design: An Innovative Tool for Modeling. Open J. Med. Chem. 2012, 2, 26238. [Google Scholar] [CrossRef]
  17. Sarkar, S.; Gulati, K.; Kairamkonda, M.; Mishra, A.; Poluri, K.M. Elucidating Protein-Protein Interactions through Computational Approaches and Designing Small Molecule Inhibitors against Them for Various Diseases. Curr. Top. Med. Chem. 2018, 18, 1719–1736. [Google Scholar] [CrossRef]
  18. Palchevskyi, S.; Czarnocki-Cieciura, M.; Vistoli, G.; Gervasoni, S.; Nowak, E.; Beccari, A.R.; Nowotny, M.; Talarico, C. Structure of Human TRPM8 Channel. Commun. Biol. 2023, 6, 1065. [Google Scholar] [CrossRef]
  19. Kaliappan, S.; Bombay, I.I.T. UCSF Chimera—Overview. 2018. Available online: https://www.cgl.ucsf.edu/chimera/ (accessed on 20 July 2024).
  20. Pencheva, T.; Lagorce, D.; Pajeva, I.; Villoutreix, B.O.; Miteva, M.A. AMMOS: Automated Molecular Mechanics Optimization Tool for in Silico Screening. BMC Bioinform. 2008, 9, 438. [Google Scholar] [CrossRef] [PubMed]
  21. Bhowmick, S.; Saha, A.; Osman, S.M.; Alasmary, F.A.; Almutairi, T.M.; Islam, M.A. Structure-Based Identification of SARS-CoV-2 Main Protease Inhibitors from Anti-Viral Specific Chemical Libraries: An Exhaustive Computational Screening Approach. Mol. Divers. 2021, 25, 1979–1997. [Google Scholar] [CrossRef] [PubMed]
  22. Zothantluanga, J.; Aswin, S.K.; Rudrapal, M.; Chetia, D. Antimalarial Flavonoid-Glycoside from Acacia Pennata with Inhibitory Potential against PfDHFR-TS: An In-Silico Study. Biointerface Res. Appl. Chem 2021, 12, 4871–4887. [Google Scholar]
  23. Halgren, T.A. MMFF VII. Characterization of MMFF94, MMFF94s, and Other Widely Available Force Fields for Conformational Energies and for Intermolecular-interaction Energies and Geometries. J. Comput. Chem. 1999, 20, 730–748. [Google Scholar] [CrossRef]
  24. Olawale, F.; Iwaloye, O.; Elekofehinti, O.O. Virtual Screening of Natural Compounds as Selective Inhibitors of Polo-like Kinase-1 at C-Terminal Polo Box and N-Terminal Catalytic Domain. J. Biomol. Struct. Dyn. 2022, 40, 13606–13624. [Google Scholar] [CrossRef] [PubMed]
  25. Lavecchia, A.; Di Giovanni, C. Virtual Screening Strategies in Drug Discovery: A Critical Review. Curr. Med. Chem. 2013, 20, 2839–2860. [Google Scholar] [CrossRef] [PubMed]
  26. Dallakyan, S.; Olson, A.J. Small-Molecule Library Screening by Docking with PyRx. In Chemical Biology. Methods in Molecular Biology; Humana Press: New York, NY, USA, 2015; pp. 243–250. [Google Scholar]
  27. Kumar, S.P.; Girija, A.S.S.; Priyadharsini, J.V. Targeting NM23-H1-Mediated Inhibition of Tumour Metastasis in Viral Hepatitis with Bioactive Compounds from Ganoderma Lucidum: A Computational Study. Indian J. Pharm. Sci. 2020, 82, 300. [Google Scholar] [CrossRef]
  28. Bilal, M.S.; Ejaz, S.A.; Zargar, S.; Akhtar, N.; Wani, T.A.; Riaz, N.; Aborode, A.T.; Siddique, F.; Altwaijry, N.; Alkahtani, H.M.; et al. Computational Investigation of 1, 3, 4 Oxadiazole Derivatives as Lead Inhibitors of VEGFR 2 in Comparison with EGFR: Density Functional Theory, Molecular Docking and Molecular Dynamics Simulation Studies. Biomolecules 2022, 12, 1612. [Google Scholar] [CrossRef] [PubMed]
  29. Masnabadi, N.; Thalji, M.R.; Alhasan, H.S.; Mahmoodi, Z.; Soldatov, A.V.; Ali, G.A.M. Structural, Electronic, Reactivity, and Conformational Features of 2, 5, 5-Trimethyl-1, 3, 2-Diheterophosphinane-2-Sulfide, and Its Derivatives: DFT, MEP, and NBO Calculations. Molecules 2022, 27, 4011. [Google Scholar] [CrossRef] [PubMed]
  30. Hashem, H.E.; Ahmad, S.; Kumer, A.; Bakri, Y. El In Silico and in Vitro Prediction of New Synthesized N-Heterocyclic Compounds as Anti-SARS-CoV-2. Sci. Rep. 2024, 14, 1152. [Google Scholar] [CrossRef]
  31. Fatima, A.; Pooja, K.; Savita, S.; Singh, M.; Verma, I.; Siddiqui, N.; Javed, S. Quantum Chemical, Experimental Spectroscopic, Hirshfeld Surface and Molecular Docking Studies of the Anti-Microbial Drug Sulfathiazole. J. Mol. Struct. 2021, 1245, 131118. [Google Scholar] [CrossRef]
  32. Bruno, A.; Costantino, G.; Sartori, L.; Radi, M. The in Silico Drug Discovery Toolbox: Applications in Lead Discovery and Optimization. Curr. Med. Chem. 2019, 26, 3838–3873. [Google Scholar] [CrossRef] [PubMed]
  33. Lohohola, P.O.; Mbala, B.M.; Bambi, S.-M.N.; Mawete, D.T.; Matondo, A.; Mvondo, J.G.M. In Silico ADME/T Properties of Quinine Derivatives Using SwissADME and PkCSM Webservers. Int. J. Trop. Dis. Health 2021, 42, 1–12. [Google Scholar]
  34. Makeneni, S.; Thieker, D.F.; Woods, R.J. Applying Pose Clustering and MD Simulations to Eliminate False Positives in Molecular Docking. J. Chem. Inf. Model. 2018, 58, 605–614. [Google Scholar] [CrossRef] [PubMed]
  35. Shukla, R.; Tripathi, T. Molecular Dynamics Simulation of Protein and Protein–Ligand Complexes. In Computer-Aided Drug Design; Springer: Singapore, 2020; pp. 133–161. [Google Scholar]
  36. Pujadas, G.; Vaque, M.; Ardevol, A.; Blade, C.; Salvado, M.J.; Blay, M.; Fernandez-Larrea, J.; Arola, L. Protein-Ligand Docking: A Review of Recent Advances and Future Perspectives. Curr. Pharm. Anal. 2008, 4, 1–19. [Google Scholar] [CrossRef]
  37. Alamri, M.A.; Mirza, M.U.; Adeel, M.M.; Ashfaq, U.A.; Tahir Ul Qamar, M.; Shahid, F.; Ahmad, S.; Alatawi, E.A.; Albalawi, G.M.; Allemailem, K.S.; et al. Structural Elucidation of Rift Valley Fever Virus L Protein towards the Discovery of Its Potential Inhibitors. Pharmaceuticals 2022, 15, 659. [Google Scholar] [CrossRef] [PubMed]
  38. Miandad, K.; Ullah, A.; Bashir, K.; Khan, S.; Abideen, S.A.; Shaker, B.; Alharbi, M.; Alshammari, A.; Ali, M.; Haleem, A.; et al. Virtual Screening of Artemisia Annua Phytochemicals as Potential Inhibitors of SARS-CoV-2 Main Protease Enzyme. Molecules 2022, 27, 8103. [Google Scholar] [CrossRef] [PubMed]
  39. Rieder, S.R.; Ries, B.; Schaller, K.; Champion, C.; Barros, E.P.; Hünenberger, P.H.; Riniker, S. Replica-Exchange Enveloping Distribution Sampling Using Generalized AMBER Force-Field Topologies: Application to Relative Hydration Free-Energy Calculations for Large Sets of Molecules. J. Chem. Inf. Model. 2022, 62, 3043–3056. [Google Scholar] [CrossRef] [PubMed]
  40. Fratev, F.; Sirimulla, S. An Improved Free Energy Perturbation FEP+ Sampling Protocol for Flexible Ligand-Binding Domains. Sci. Rep. 2019, 9, 16829. [Google Scholar] [CrossRef] [PubMed]
  41. Tiwari, P.; Sharma, P.; Kumar, M.; Kapil, A.; Abdul Samath, E.; Kaur, P. Identification of Novel Natural MurD Ligase Inhibitors as Potential Antimicrobial Agents Targeting Acinetobacter Baumannii: In Silico Screening and Biological Evaluation. J. Biomol. Struct. Dyn. 2022, 40, 14051–14066. [Google Scholar] [CrossRef] [PubMed]
  42. Honarparvar, B.; Govender, T.; Maguire, G.E.M.; Soliman, M.E.S.; Kruger, H.G. Integrated Approach to Structure-Based Enzymatic Drug Design: Molecular Modeling, Spectroscopy, and Experimental Bioactivity. Chem. Rev. 2014, 114, 493–537. [Google Scholar] [CrossRef] [PubMed]
  43. Zschau, R.L.; Zacharias, M. Mechanism of Β-hairpin Formation in AzoChignolin and Chignolin. J. Comput. Chem. 2023, 44, 988–1001. [Google Scholar] [CrossRef] [PubMed]
  44. Justino, G.C.; Nascimento, C.P.; Justino, M.C. Molecular Dynamics Simulations and Analysis for Bioinformatics Undergraduate Students. Biochem. Mol. Biol. Educ. 2021, 49, 570–582. [Google Scholar] [CrossRef] [PubMed]
  45. Brandsdal, B.O.; Österberg, F.; Almlöf, M.; Feierberg, I.; Luzhkov, V.B.; Åqvist, J. Free Energy Calculations and Ligand Binding. Adv. Protein Chem. 2003, 66, 123–158. [Google Scholar] [PubMed]
  46. Gul, S.; Ozcan, O.; Asar, S.; Okyar, A.; Barıs, I.; Kavakli, I.H. In Silico Identification of Widely Used and Well-Tolerated Drugs as Potential SARS-CoV-2 3C-like Protease and Viral RNA-Dependent RNA Polymerase Inhibitors for Direct Use in Clinical Trials. J. Biomol. Struct. Dyn. 2021, 39, 6772–6791. [Google Scholar] [CrossRef] [PubMed]
  47. Miller III, B.R.; McGee Jr, T.D.; Swails, J.M.; Homeyer, N.; Gohlke, H.; Roitberg, A.E. MMPBSA. Py: An Efficient Program for End-State Free Energy Calculations. J. Chem. Theory Comput. 2012, 8, 3314–3321. [Google Scholar] [CrossRef] [PubMed]
  48. Woods, C.J.; Malaisree, M.; Michel, J.; Long, B.; McIntosh-Smith, S.; Mulholland, A.J. Rapid Decomposition and Visualisation of Protein–Ligand Binding Free Energies by Residue and by Water. Faraday Discuss. 2014, 169, 477–499. [Google Scholar] [CrossRef] [PubMed]
  49. Bergström, C.A.S.; Larsson, P. Computational Prediction of Drug Solubility in Water-Based Systems: Qualitative and Quantitative Approaches Used in the Current Drug Discovery and Development Setting. Int. J. Pharm. 2018, 540, 185–193. [Google Scholar] [CrossRef] [PubMed]
  50. Montgomerie, S.; Sundararaj, S.; Gallin, W.J.; Wishart, D.S. Improving the Accuracy of Protein Secondary Structure Prediction Using Structural Alignment. BMC Bioinform. 2006, 7, 301. [Google Scholar] [CrossRef] [PubMed]
  51. Tanwar, H.; Kumar, D.T.; Doss, C.G.P.; Zayed, H. Bioinformatics Classification of Mutations in Patients with Mucopolysaccharidosis IIIA. Metab. Brain Dis. 2019, 34, 1577–1594. [Google Scholar] [CrossRef] [PubMed]
  52. Wang, J.; Yang, W.; Zhao, L.; Wei, B.; Chen, J. Binding Mechanism of Inhibitors to BRD4 and BRD9 Decoded by Multiple Independent Molecular Dynamics Simulations and Deep Learning. Molecules 2024, 29, 1857. [Google Scholar] [CrossRef] [PubMed]
  53. Henderson, R.; Anasti, K.; Manne, K.; Stalls, V.; Saunders, C.; Bililign, Y.; Williams, A.; Bubphamala, P.; Montani, M.; Kachhap, S. Engineering Immunogens That Select for Specific Mutations in HIV Broadly Neutralizing Antibodies. bioRxiv 2023. [Google Scholar] [CrossRef]
  54. Mortier, J.; Rakers, C.; Bermudez, M.; Murgueitio, M.S.; Riniker, S.; Wolber, G. The Impact of Molecular Dynamics on Drug Design: Applications for the Characterization of Ligand–Macromolecule Complexes. Drug Discov. Today 2015, 20, 686–702. [Google Scholar] [CrossRef] [PubMed]
  55. Ahmed, S.A.; Ali, N.; Qureshi, U.; Khalil, R.; Qasmi, Z.-U.H. Molecular Dynamics Simulation of Human Pancreatic Lipase and Lipase-Colipase Complex: Insight into the Structural Fluctuations and Conformational Changes. Int. J. Comput. Theor. Chem. 2020, 8, 19. [Google Scholar] [CrossRef]
  56. Elmaaty, A.A.; Darwish, K.M.; Khattab, M.; Elhady, S.S.; Salah, M.; Hamed, M.I.A.; Al-Karmalawy, A.A.; Saleh, M.M. In a Search for Potential Drug Candidates for Combating COVID-19: Computational Study Revealed Salvianolic Acid B as a Potential Therapeutic Targeting 3CLpro and Spike Proteins. J. Biomol. Struct. Dyn. 2022, 40, 8866–8893. [Google Scholar] [CrossRef] [PubMed]
  57. Sun, Z.; Liu, Q.; Qu, G.; Feng, Y.; Reetz, M.T. Utility of B-Factors in Protein Science: Interpreting Rigidity, Flexibility, and Internal Motion and Engineering Thermostability. Chem. Rev. 2019, 119, 1626–1665. [Google Scholar] [CrossRef] [PubMed]
  58. Gewers, F.L.; Ferreira, G.R.; De Arruda, H.F.; Silva, F.N.; Comin, C.H.; Amancio, D.R.; Costa, L.d.F. Principal Component Analysis: A Natural Approach to Data Exploration. ACM Comput. Surv. 2021, 54, 1–34. [Google Scholar] [CrossRef]
  59. Yoo, C.; Shahlaei, M. The Applications of PCA in QSAR Studies: A Case Study on CCR5 Antagonists. Chem. Biol. Drug Des. 2018, 91, 137–152. [Google Scholar] [CrossRef]
  60. Karnati, K.R.; Wang, Y. Structural and Binding Insights into HIV-1 Protease and P2-Ligand Interactions through Molecular Dynamics Simulations, Binding Free Energy and Principal Component Analysis. J. Mol. Graph. Model. 2019, 92, 112–122. [Google Scholar] [CrossRef] [PubMed]
  61. Chaudhary, K.; Kumar, K.; Venkatesu, P.; Masram, D.T. Protein Immobilization on Graphene Oxide or Reduced Graphene Oxide Surface and Their Applications: Influence over Activity, Structural and Thermal Stability of Protein. Adv. Colloid Interface Sci. 2021, 289, 102367. [Google Scholar] [CrossRef] [PubMed]
  62. Jamal, S.B.; Ismail, S.; Yousaf, R.; Qazi, A.S.; Iftkhar, S.; Abbasi, S.W. Exploring Novel 1-Hydroxynaphthalene-2-Carboxanilides Based Inhibitors Against C-Jun N-Terminal Kinases Through Molecular Dynamic Simulation and WaterSwap Analysis. Appl. Biochem. Biotechnol. 2023, 196, 1803–1819. [Google Scholar] [CrossRef] [PubMed]
  63. Panday, S.K.; Ghosh, I. In Silico Structure-Based Prediction of Receptor–Ligand Binding Affinity: Current Progress and Challenges. In Structural Bioinformatics: Applications in Preclinical Drug Discovery Process. Challenges and Advances in Computational Chemistry and Physics; Springer: Cham, Switzerland, 2019; pp. 109–175. [Google Scholar]
  64. Kirby, J.P. The Amidinium-Carboxylate Salt Bridge and Electron Transfer Reactions; Michigan State University: East Lansing, MI, USA, 1997; ISBN 0591744015. [Google Scholar]
  65. Gupta, M.N.; Uversky, V.N. Biological Importance of Arginine: A Comprehensive Review of the Roles in Structure, Disorder, and Functionality of Peptides and Proteins. Int. J. Biol. Macromol. 2023, 257, 128646. [Google Scholar] [CrossRef] [PubMed]
  66. Pakhrin, S.C.; Shrestha, B.; Adhikari, B.; Kc, D.B. Deep Learning-Based Advances in Protein Structure Prediction. Int. J. Mol. Sci. 2021, 22, 5553. [Google Scholar] [CrossRef] [PubMed]
  67. Gomes, D.; Silvestre, S.; Duarte, A.P.; Venuti, A.; Soares, C.P.; Passarinha, L.; Sousa, Â. In Silico Approaches: A Way to Unveil Novel Therapeutic Drugs for Cervical Cancer Management. Pharmaceuticals 2021, 14, 741. [Google Scholar] [CrossRef] [PubMed]
  68. Al-Thakafi, S.; Al-Hathal, N. Peyronie’s Disease: A Literature Review on Epidemiology, Genetics, Pathophysiology, Diagnosis and Work-Up. Transl. Androl. Urol. 2016, 5, 280. [Google Scholar] [CrossRef] [PubMed]
  69. Alipour, H.; Raz, A.; Zakeri, S.; Djadid, N.D. Therapeutic Applications of Collagenase (Metalloproteases): A Review. Asian Pac. J. Trop. Biomed. 2016, 6, 975–981. [Google Scholar] [CrossRef]
  70. Supuran, C.T.; Scozzafava, A.; Mastrolorenzo, A. Bacterial Proteases: Current Therapeutic Use and Future Prospects for the Development of New Antibiotics. Expert Opin. Ther. Pat. 2001, 11, 221–259. [Google Scholar] [CrossRef]
  71. Nitulescu, G.; Nitulescu, G.M.; Zanfirescu, A.; Mihai, D.P.; Gradinaru, D. Candidates for Repurposing as Anti-Virulence Agents Based on the Structural Profile Analysis of Microbial Collagenase Inhibitors. Pharmaceutics 2021, 14, 62. [Google Scholar] [CrossRef] [PubMed]
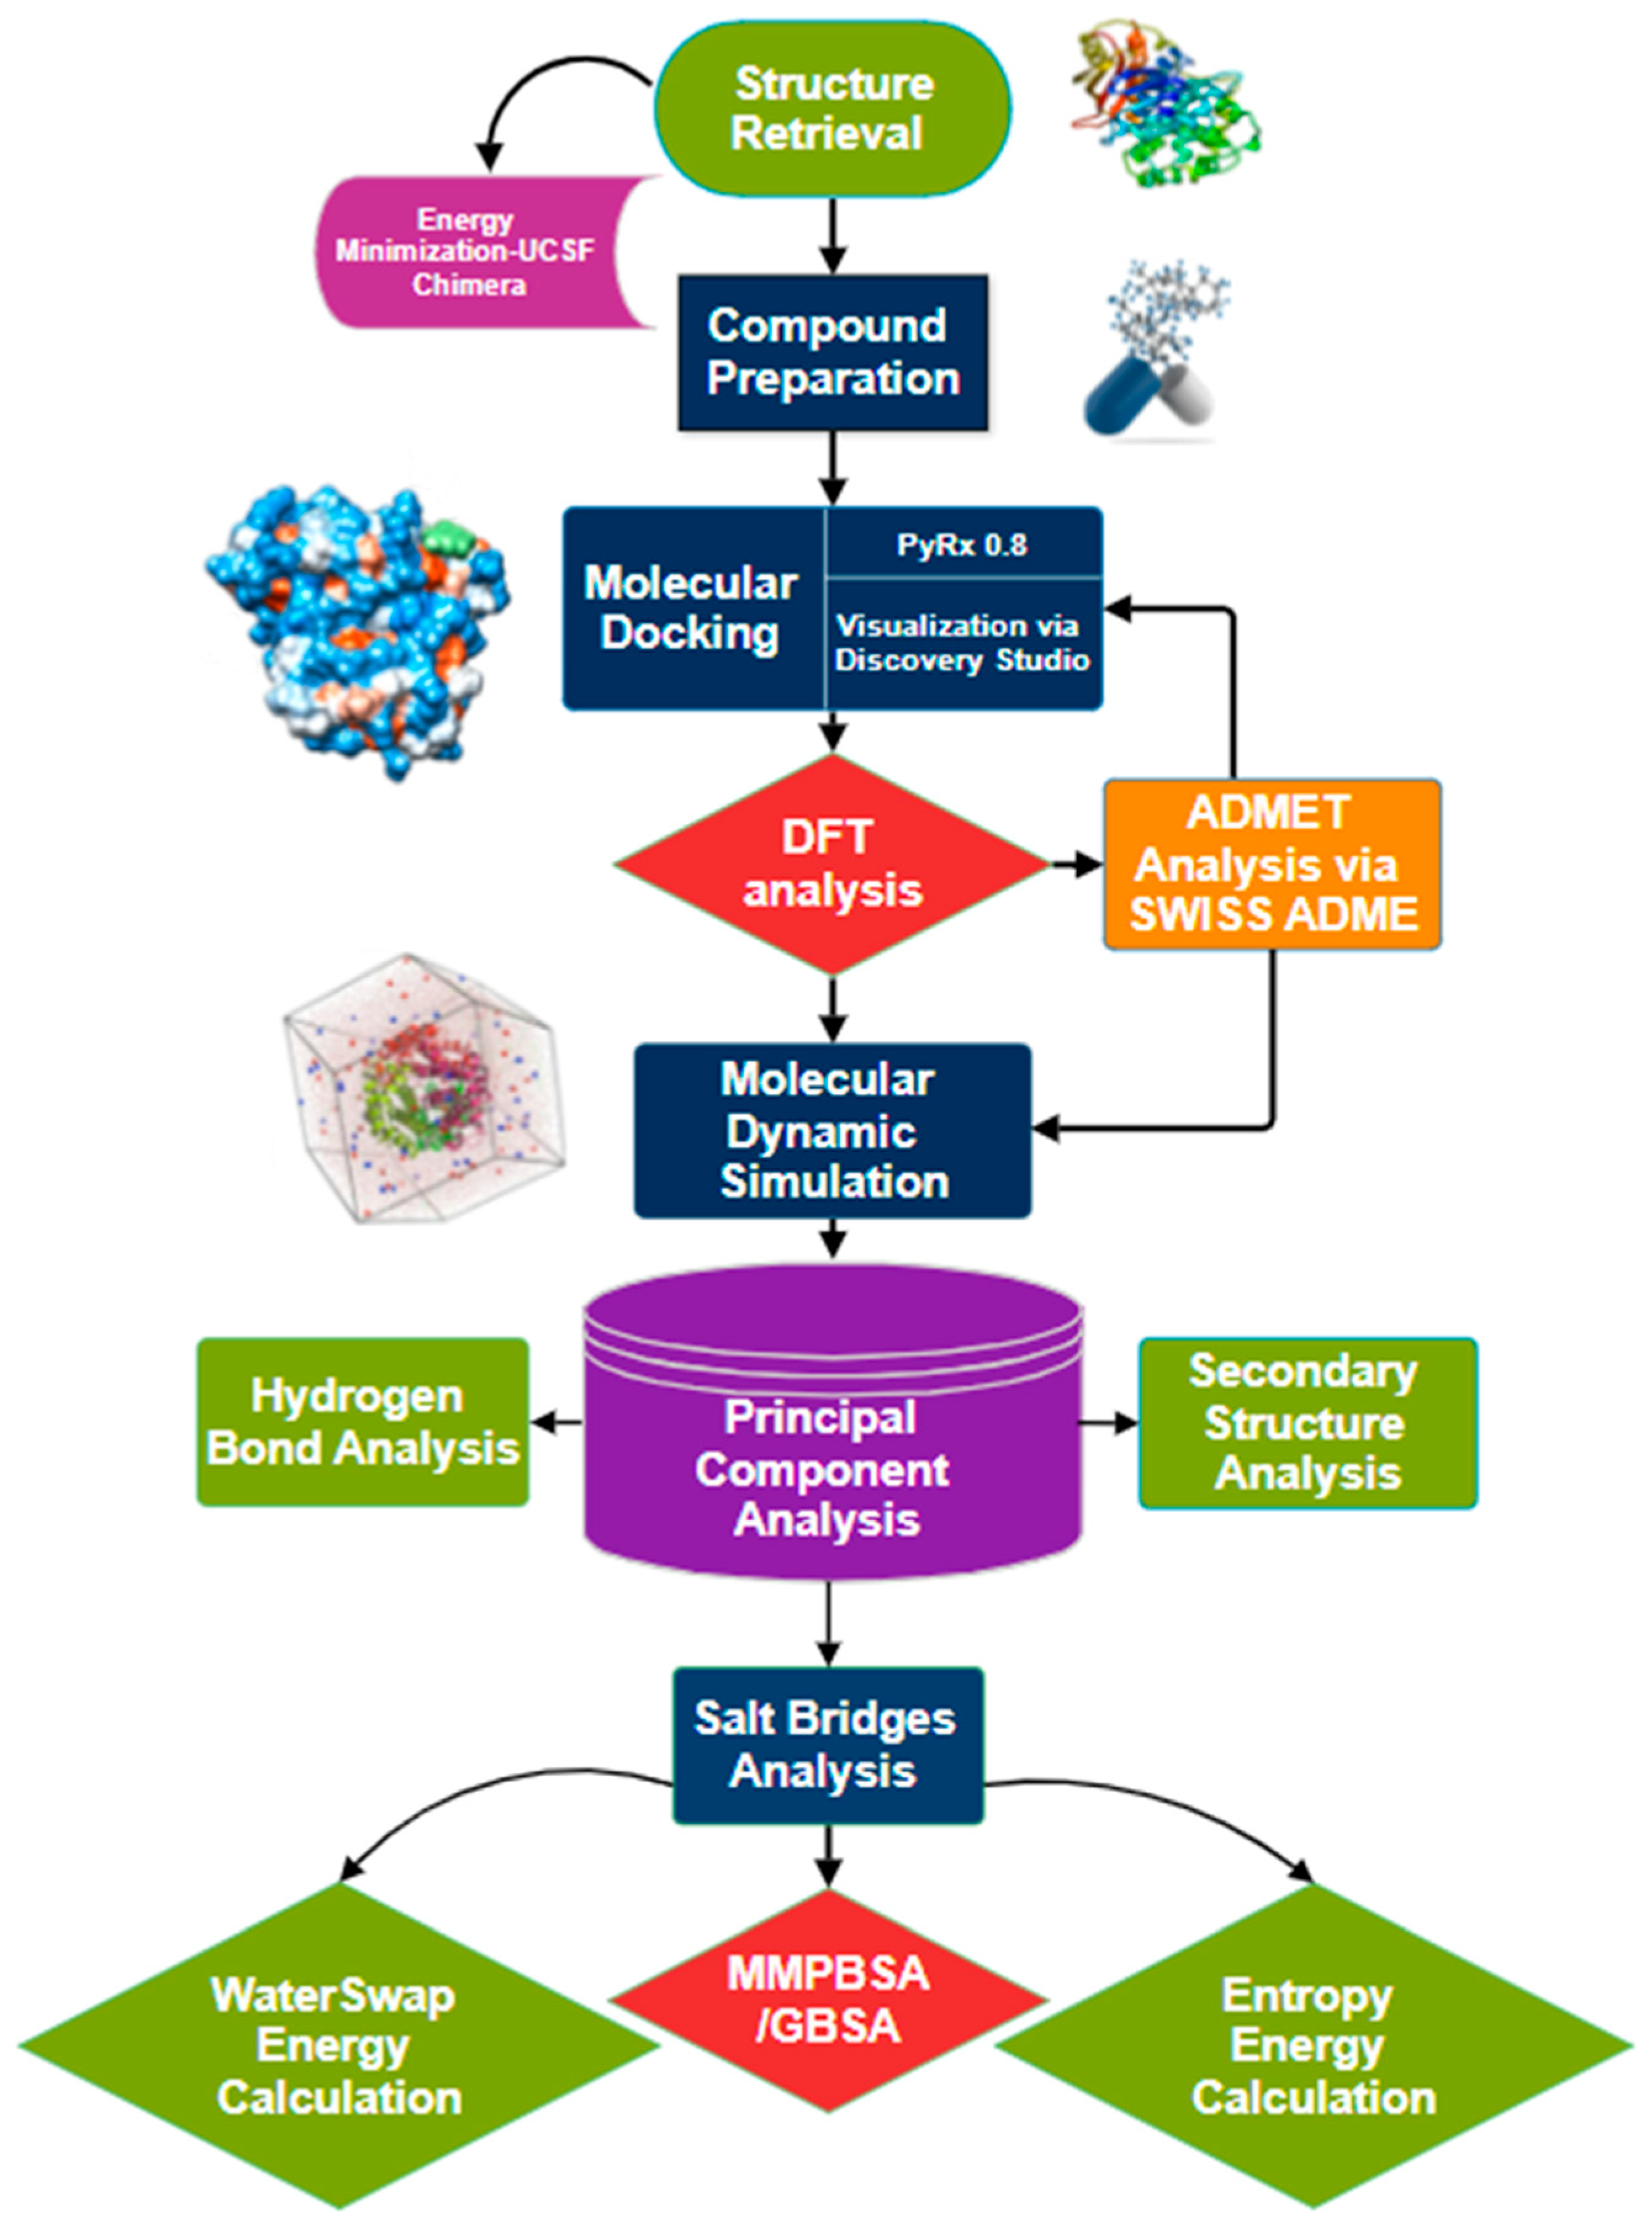
Figure 1. The integrated computational workflow begins with (i) structure retrieval and preparation followed by (ii) compound preparation and (iii) molecular docking. Next, DFT analysis to estimate electronic properties and structure (iv), ADMET to assess pharmacokinetics profile (v), and MD simulation, (vi) PCA analysis as well as (vii) secondary structure analysis, (viii) hydrogen bond analysis. (ix) Salt bridges, (x) MMPBSA, (xi) Entropy energy calculation, and finally (xii) water swap energy estimation.
Computation 12 00153 g001
Figure 2. Highlights the labeled active site residues GLU498, TRP539, HIS523, TYR607, GLU555, and TYR599 in the three-dimensional (3D) structure of the collagenase enzyme.
Computation 12 00153 g002
Figure 3. The three-dimensional (3D) docking interaction and binding poses of target enzyme with ligands as MSID000001 (A), MSID000002 (B), MSID000003 (C), and Control (D).
Computation 12 00153 g003
Figure 4. The two-dimensional (2D) interaction between the target enzyme collagenase and ligands MSID000001 (A), MSID000002 (B), MSID000003 (C), and Control (D).
Computation 12 00153 g004
Figure 5. Optimized structures of the studied compounds at the B3LYP/6–311+G(d, p) level of DFT analysis in the gas phase.
Computation 12 00153 g005
Figure 6. The contour plots of HOMOs and LUMOs of studied compounds.
Computation 12 00153 g006
Figure 7. Molecular Electrostatic Potential (MEP) maps for the studied compounds.
Computation 12 00153 g007
Figure 8. The MSID000001, MSID000002, and MSID000003 complexes and control molecule flexibility, compactness, and stability through (A) RMSD, (B) RMSF, (C) RoG, and (D) β-factors.
Computation 12 00153 g008
Figure 9. Insights into the top three complexes and control with target enzyme collagenase.
Computation 12 00153 g009
Figure 10. The principal component analysis of MSID000001 (A), MSID000002 (B), MSID000003 (C) and Control (D), respectively.
Computation 12 00153 g010
Figure 11. Predicted WaterSwap binding energy for MSID000001, MSID000002, and MSID000003, and Control.
Computation 12 00153 g011
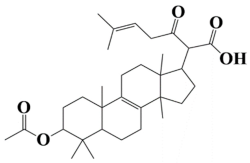
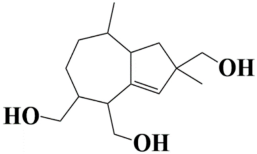
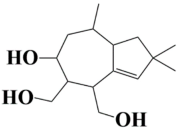
Table 1. Top 10 compounds with the highest binding affinities, chemical names coupled with their chemical structures.
S.NoCompoundsStructureBinding Affinity
1MSID000001
2-(3-hydroxy-4,4,10,13,14-pentamethyl2,3,4,5,6,7,10,11,12,13,14,15,16,17-tetradecahydro-1H-cyclopenta[a]phenanthren-17-yl)-6-methylhept-6-enoic acid
Computation 12 00153 i001−10.7 kcal/mol
2MSID000002
4,4,10,13,14-pentamethyl-17-(6-methyl-5-methyleneheptan-2-yl)-2,3,4,5,6,7,10,11,12,13,14,15,16,17-tetradecahydro-1H-cyclopenta[a]phenanthren-3-ol
Computation 12 00153 i002−9.8 kcal/mol
3MSID000003
(E)-17-(5,6-dimethylhept-3-en-2-yl)-10,13-dimethyl-2,3,4,5,6,9,10,11,12,13,14,15,16,17-tetradecahydro-1H-cyclopenta[a]phenanthrene-3,5,6-triol
Computation 12 00153 i003−9.5 kcal/mol
4MSID000004
2-(3-acetoxy-4,4,10,13,14-pentamethyl-2,3,4,5,6,7,10,11,12,13,14,15,16,17-tetradecahydro-1H-cyclopenta[a]phenanthren-17-yl)-6-methyl-3-oxohept-5-enoic acid
Computation 12 00153 i004−9.3 kcal/mol
5MSID000006
2,8-dimethyl-1,2,4,5,6,7,8,8a-octahydroazulene-2,4,5-triyl)trimethanol
Computation 12 00153 i005−9.2 kcal/mol
6MSID000009
(6-hydroxy-2,2,8-trimethyl-1,2,4,5,6,7,8,8a-octahydroazulene-4,5-diyl)dimethanol
Computation 12 00153 i006−9 kcal/mol
7MSID000010
3a-(2-(2,5-dihydroxyphenyl)-2-oxoethyl)-8-hydroxytetrahydrocyclopenta[1,2-b:2,3-c′]difuran-3,7(1H,8H)-dione
Computation 12 00153 i007−8.9 kcal/mol
8MSID000016
6a-(2-(2,5-dihydroxyphenyl)-2-oxoethyl)-3a-(dimethoxymethyl)-4-ethoxyhexahydro-1H-cyclopenta[c]furan-1-one
Computation 12 00153 i008−8.6 kcal/mol
9MSID000020
methyl 1-(2-(2,5-dihydroxyphenyl)-2-oxoethyl)-2,4-dihydroxy-3-methylenecyclohexanecarboxylate
Computation 12 00153 i009−8.5 kcal/mol
10MSID000022
4-(2-(2,5-dihydroxyphenyl)-2-oxoethyl)-5-hydroxy-6-methylene-2-oxabicyclo[2.2.2]octan-3-one
Computation 12 00153 i010−8.4 kcal/mol
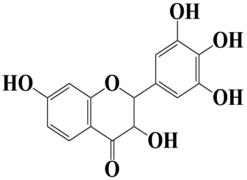
11Control
3,7-dihydroxy-2-(3,4,5-trihydroxyphenyl)chroman-4-one
Computation 12 00153 i011−8 kcal/mol
Table 2. The table displays the amino acid interaction profile of hit compounds and control molecules with the target enzyme.
CompoundsH-BondVan der WaalsPi–AlkylAlkylCarbon–Hydrogen BondPi-SigmaPi–Pi Stacked and Pi–Pi T-Shaped
MSID000001Tyr496Glu498, Tyr599, Trp604, Ile497, Glu524, Leu495, Glu555,Gly493, Asn492Trp530Ala531His527--
MSID000002-Ile576, Glu559, Arg573. His523, Glu524, Asn 492, Glu555, Trp539, Tyr599, Trp604, Glu519, Gly 493-Leu520-Phe515, Tyr607-
MSID000003-Leu520, Tyr607, Glu524, Tyr599, His527, Ile497, Ala531, Glu498, Tyr496, Leu495, Asn492, Gly494, Phe515---Trp539
ControlHis527, Glu498, Tyr496Pro499, Ala531, Gln530,Tyr528, Glu555, Ile497,Glu524Leu495---Trp539, Leu495
Table 3. Optimization energies, HOMO and LUMO energies, and their gap calculated in the gas phase at B3LYP/6–311+G(d, p) level of DFT calculations.
Ligand CodeOptimization
Energy (a.u.)
Dipole
Moment
(debye)
Polarizability
(α)
(a.u.)
EH
(eV)
EL
(eV)
Eg
(eV)
Control−1105.736.10207.35−6.45−1.864.59
MSID000001−1398.263.08347.85−6.13−0.435.71
MSID000002−1288.261.80352.91−6.01−0.215.81
MSID000003−1320.802.30338.32−6.53−0.516.02
Table 4. Global reactivity descriptors of the targeted compounds.
Ligand CodeChemical Potential
µ (eV)
Electronegativity
χ (eV)
Hardness
η (eV)
Softness
S (eV)
Electrophilicity
ω (eV)
Ionization Potential
(I)
Electron Affinity
(A)
Control4.15−4.151.370.6811.766.451.86
MSID0000013.28−3.282.641.3214.206.130.43
MSID0000023.11−3.112.801.4013.536.010.21
MSID0000033.52−3.522.751.3817.086.530.51
Table 5. The hydrogen bonds formed between ligands and the active site of Clostridium histolyticum collagenase.
MSID000001
DonorAcceptorOccupancy
HIE128-SideLIG391-Main0.30%
HIE128-SideLIG391-Main0.10%
LIG391-SideGLU156-Side0.10%
MSID000002
LIG391-MainASP184-Side29.80%
MSID000003
LIG391-MainTYR208-Side1–10%
LIG391-SideGLU156-Side5.40%
LIG391-MainTYR200-Side0.30%
LIG391-MainGLU156-Side0.10%
LIG391-SideTYR208-Side1.50%
TYR208-SideLIG391-Side0.10%
LIG391-SideTYR200-Side0.10%
Control
LIG391-SideGLU125-Side70.00%
LIG391-SideGLU99-Side2.90%
Table 6. MMGBSA and MMPBSA analysis of top three complexes along with control molecule.
Energy ParameterMSID000001MSID000002MSID000003Control
MMGBSA
van der Waals energy−65.14−61.23−55.91−60.99
Energy electrostatic−24.01−20.81−15.49−17.67
Total gas phase energy−89.15−82.04−71.4−78.66
Total salvation energy10.5711.6012.0810.46
Net energy−78.58−70.44−59.32−68.2
MMPBSA
Energy van der Waals−65.14−61.23−55.91−60.99
Energy electrostatics−24.01−20.81−15.49−17.67
Total gas phase energy−89.15−82.04−71.4−78.66
Total energy salvation9.618.059.148.00
Net energy−79.54−73.99−62.26−70.66
Table 7. The entropy energy calculations of the top three complexes as well as the control molecule.
ComplexTranslationalVibrationalRotationalΔS Total
MSID0000015.017.861147.09−5.96
MSID00000210.8512.661269.48−2.85
MSID00000315.9613.051566.12−1.36
Control10.5312.041428.64−2.60
Table 8. Salt bridge interaction between MSID000001, MSID000002, MSID000003, and Control with the target enzyme can be seen in the following table.
ComplexesSalt Bridges Interaction
MSID000001Glu34-Lys37, Glu147-Lys148, Glu220-Lys221, Asp1-Arg101, Asp279-Arg38, Asp222-Lys254, Glu120-Arg174, Glu61-Arg133, Asp338-Lys335, Asp345-Arg52, Asp67-Arg133, Asp187-Lus185, Glu8-Arg26, Glu45-Arg123, Asp6-Lys2, Glu33-Lys14, Glu292-Lys289, Asp345-Arg52, Asp204-Lys194, Asp280-Lys360, Glu339-Lys335, Asp6-Lys9, Glu33-Lys37, Glu78-Lys81, Asp19-Arg44, Glu264-Lys268, Asp92-Lys81, Glu339-Lys331, Glu-Arg44
MSID000002Glu349-Arg167, Asp6-Lys9, Glu328-Lys331, Asp380-Arg370, Asp222-Lys254, Glu34-Arg38, Asp187-Lys185, Glu108-Lys35, Glu339-Lys342, Asp5-Lys72, Glu8-Lys72, Glu8-Lys72, Glu34-Arg38, Glu45-Arg123, Asp66-Arg133, Glu220-Lys268, Glu160-Arg174, Glu33-Lys14, Glu292-Lys289, Glu160-Arg174,Glu119-Arg123, Glu264-Lys221, Asp338-Lys342, Asp5-Arg101, Asp184-Lys183, Asp19-Arg44, Asp57-Arg322, Asp242-Arg150, Asp184-Lys183, Asp280-Lys283, Glu108-Lys35, Glu339-Lys331, Asp220-Lys254
MSID000003Glu34-Lys37, Asp6-Lys9, Asp57-Lys58, Glu8-Arg26, Asp237-Lys239, Asp380-Arg370, Asp29-Lys30, Asp374-Lys376, Glu292-Lys299, Glu339-Lys342, Glu45-Arg123, Asp66-Arg133, Glu220-Lys268,Asp5-Lys9, Asp267-Lys268, Asp345-Arg52, Glu339-Lys343, Asp250-Lys264, Asp5-Lys9, Asp338-Lys342, Asp57-Arg322, Asp242-Arg150, Glu34-Lys37, Asp280-Lys283, Asp242-Arg150, Glu257-Lys254, Asp29-Lys30, Glu349-Arg167, Asp242-Arg150, Asp5-Lys2, Asp222-Lys254
ControlAsp6-Lys2, Glu264-Lys268, Glu34-Arg38, Glu328-Lys331, Glu243-Lys264, Asp279-Arg38, Glu333-Lys231, Asp187-Lus185, Glu33-Lys14, Glu311-Arg44, Glu45-Arg123, Asp242-Lys148, Asp338-Lys335, Asp279-Arg38, Asp66-Arg133, Glu34-Arg38, Glu333-Lys228, Glu243-Lys239, Glu292-Lys289, Asp250-Lys193, Glu119-Arg44, Asp338-Lys342, Asp250-Lys264, Asp242-Arg150, Asp57-Arg322, Asp57-Arg322, Glu339-Lys331, Glu257-Lys254, Asp336-Lys331, Glu108-Lys35, Glu243-Lys246, Glu311-Arg44
Disclaimer/Publisher’s Note: The statements, opinions and data contained in all publications are solely those of the individual author(s) and contributor(s) and not of MDPI and/or the editor(s). MDPI and/or the editor(s) disclaim responsibility for any injury to people or property resulting from any ideas, methods, instructions or products referred to in the content.