1. Introduction
The Internet of Things (IoT) is a network of connected computers, mechanical and digital devices, people and things with unique identifiers that enable the potential flow of data over a network without the need for a computer to computer or man-to-man communication. Physical devices can now be controlled remotely via Internet services and are no longer cut off from the virtual world. Smart phones, smart appliances, smart automobiles, smart homes and smart cities are not the only components of a smart world. Since in-vehicle communication and information technologies have the potential to revolutionize it, “smart” objects will play a crucial role in the future of IoT. With the expansion of WiFi and 4G-LTE wireless Internet access, it is clear that information and communication networks will eventually be everywhere. The fastest growing source of electricity will be renewable energy sources such as wind and solar photovoltaic, as they are both technologically advanced and reasonably priced. However, energy needs continue to rise globally. One of the most forward-thinking ways to reduce the impact on the environment is through the use of renewable energy technologies. One of these renewable energies is the concentrated photovoltaic.
Concentrated photovoltaics with multiple PV junctions have emerged as a viable alternative for increasing efficiency while maintaining cost effectiveness due to recent advances in photovoltaic (PV) manufacturing. Solar cells with many junctions and a sun tracking system as well as an optical focusing device are the main components of CPV systems. As the concentrating optical element reduces the size of the solar cell to reduce its cost, the multi-junction solar cell plays a vital role in increasing the efficiency of power conversion.
Different strategies have been used to increase these systems’ dependability while lowering their cost. For three junction cells at 925 suns, multi-junction cell research has certified an efficiency of about 43.5% [
1]. A further announcement was made by Azur Space [
2] that their five junction cells, which have a 44% efficiency, are expected to reach commercial production by 2021. With a 47.3% efficiency at 200×, a six-junction solar cell developed by NREL also broke the previous record [
3]. CPV has a power conversion efficiency of >35%, as opposed to the usual PV module efficiency of 15–20% [
4]. Commercial CPV systems, on the other hand, are approved for a conversion efficiency that is twice that of micro-CPV systems. The theory behind micro-CPV systems is the same as that of CPV modules; the only difference is in the size of the system (cells and optics). The multi-junction solar cell typically has a thickness of little more than one millimeter; the focusing optics are of the same order of magnitude as the module’s thinness, which is only a few millimeters thick, in contrast. This reduction in system size offers a number of advantages and broadens the range of applications for these systems to rooftops, automobile roofs, and confined areas [
5]. High-efficiency multijunction solar cells, concentrating both optical devices and a sun-tracking method, are the foundation of micro-concentration photovoltaic technology. The optical concentrating system’s job is to direct sunlight toward the solar cell, as its name suggests. The optical capabilities of a desirable concentrating optical system should also meet a variety of requirements, including excellent irradiance homogeneity, wide acceptance angles, and high optical efficiency. The number of the optical concentrators can range from one to three, and they can combine reflecting and refractive elements. According to Panasonic [
6], single-stage concentrators are often utilized for low concentrations (100×), with the solar cell being directly connected to the refractive optical components. Analogous to a conventional CPV with a POE and an SOE, double-stage concentrators operate on the same principle. Although the POE in MCPV can be complete lenses unlike the CPV, it has excellent optical efficiency, with draft angle losses from Fresnel lens losses excluded. Given this arrangement, the POE directs sunlight toward the SOE, homogenizing the distribution of irradiance across the cell surface and extending the system’s acceptance angle. In the literature, different SOE types—refractive, reflective, or total—are used [
7,
8,
9,
10]. Price et al. [
11] created a different type of concentrator called an RX concentrator, where R stands for the main refractive and X for the reflecting secondary optical element. In this design, the cell is positioned in the middle of the bulk of the optical system. Additionally, the solar cell area in micro-CPV systems is reduced to less than 1 mm
2. Lower temperatures over the cell as a result of the cell’s size decrease suggest easier thermal management without the installation of external systems. As a result, substitute inexpensive substrates such as PCB (printed circuit board) can be employed. Furthermore, because a low overall current per cell is achieved, more flexibility in series and parallel connections is offered. Additionally, the electrical performances are less sensitive to the non-uniformity of the flux distribution [
12]. Furthermore, for typical CPV systems, continual DNI monitoring is required to track the movements of the sun. In general, these trackers are expensive and heavy, which prevents the residential rooftop market, which could be important for the CPV business, from adopting them. MCPV offers integrated tracking as a cutting-edge solution to these issues. Since the modules in this technology are stationary, light can be focused using specialized optics at various angles of incidence. Therefore, the solar cell or the optics must be modified in order to retain focus when the sun moves. This technology makes it possible to access the rooftop market from a fixed, static mount, which would not otherwise be possible with regular CPV [
13].
What if it was possible to monitor electricity consumption and be notified by a mobile application when the electricity bill for a given month exceeds a certain threshold? A household’s electricity bill is measured by calculating the electricity consumed in a month. Here, a monitoring system is needed, which is a regular procedure that focuses on entry and exit while collecting data and tracking the progress of the monitored thing. When monitoring occurs continuously and is usually carried out for a specific reason, for example, to check the process of an object or to assess certain conditions, it will provide status and trend information for measurement and evaluation [
14,
15].
The energy generated can be monitored by a monitoring system which is anticipated to reduce energy use, resulting in cost savings, increased competitiveness, and improved environmental quality. An alternate option for improving energy efficiency is energy monitoring and auditing [
16,
17]. Because all devices are now connected to the Internet, monitoring can be carried out at any time and from anywhere, making the Internet of Things (IoT) a popular supporting technology for monitoring systems [
18,
19,
20,
21,
22,
23,
24,
25]. Smart devices, including smart homes, smart cities, and smart laboratories, can be created thanks to this technology. Sensors are a key element of the Internet of Things. The parameters that are tracked and analyzed may be seen in real-time because the sensor is connected to a controller [
16]. This indicates that the IoT makes it possible to interact with system components and use device data for monitoring and controlling [
18]. An IoT-based or IoT-enabled monitoring system that can track electricity use in conjunction with a system to control the use of electrical equipment is known as an energy-efficient monitoring system [
23]. The appropriate management of power use requires keeping an eye on how household electrical gadgets are being used [
22]. A web-based monitoring system that integrates power quality (PQ), employs virtual instruments, is open to all users, and makes use of IoT [
25]. Many researchers have conducted studies on IoT-based monitoring. Al-Ali et al. [
14], for example, utilized IoT for their smart home energy management system. Their findings showed that customers can utilize a mobile device to pay bills online and remotely monitor and operate the equipment. A digital power meter prototype based on IoT technology was created by Despa et al. [
19]. It was used to calculate the amount of energy consumed in laboratories. A monitoring system for voltage, current, active power, and overall power consumption was created by Chooruang and Meekul [
21] in the same year. In order to monitor and report on the quantity of electrical energy consumed and the cost associated with operating AC equipment, Ramschie et al. [
17] developed a monitoring system for air conditioning (AC) equipment. The system can be accessed via a smartphone or a web server. Pangestu et al. [
18] constructed a monitoring system using the Arduino NodeMCU ESP8266, which focuses on reading current and power against inductive loads and resistive loads. The obtained accuracy rate lies between 96% and 99%. Joshi and Kiran’s [
22] study on the monitoring system of electric power consumption focuses on measuring power parameters such as power factors, voltage, current, frequency, and active, reactive, and perceived power, and can also predict the power of the appliance and determine the kind of connected device.
In the literature, we cannot find a study that concerns monitoring the energy generated by a photovoltaic concentration system. Therefore, our study brings together two technologies; the first is the generation of electricity by an optical system which consists of a Fresnel lens associated with a plano-convex lens. The aim of the study is to provide a small module with high mechanical precision and high optical efficiency in order to reduce the cost of the receiver assembly and increase its long-term reliability. The second is the monitoring of the consumption of this energy. This study focused on the current use of IoT-based home appliances with equipment that can be seen, especially the light bulb, rice cooker, and dispenser. Both web and mobile devices are used for the monitoring procedure. The PZEM-004T current sensor was chosen as the sensor due to its high reading accuracy. Additionally, NodeMCU, an open-source Internet of Things platform with Arduino IDE, is also used. This development kit is based on the ESP8266 module, which combines GPIO and PWM (pulse width modulation). The data processor of this monitoring system is an ESP8266 NodeMCU. Users can more easily monitor the electrical power consumption of home appliances using this monitoring system.
After the introduction,
Section 2 describes the created prototypes and the methods used in simulations, and how equations from the literature are modified. The proposed IoT-based photovoltaic monitoring system is discussed in
Section 3.
Section 4 covers the experimental test of the proposed system, and the conclusions and discussion are presented in
Section 5.
2. Theoretical Background, Prototypes and Methods
This part begins with a review of the fundamental theoretical equations, before presenting the created prototypes and the methods used in simulations and tests to identify their key qualities.
2.1. Theoretical Background
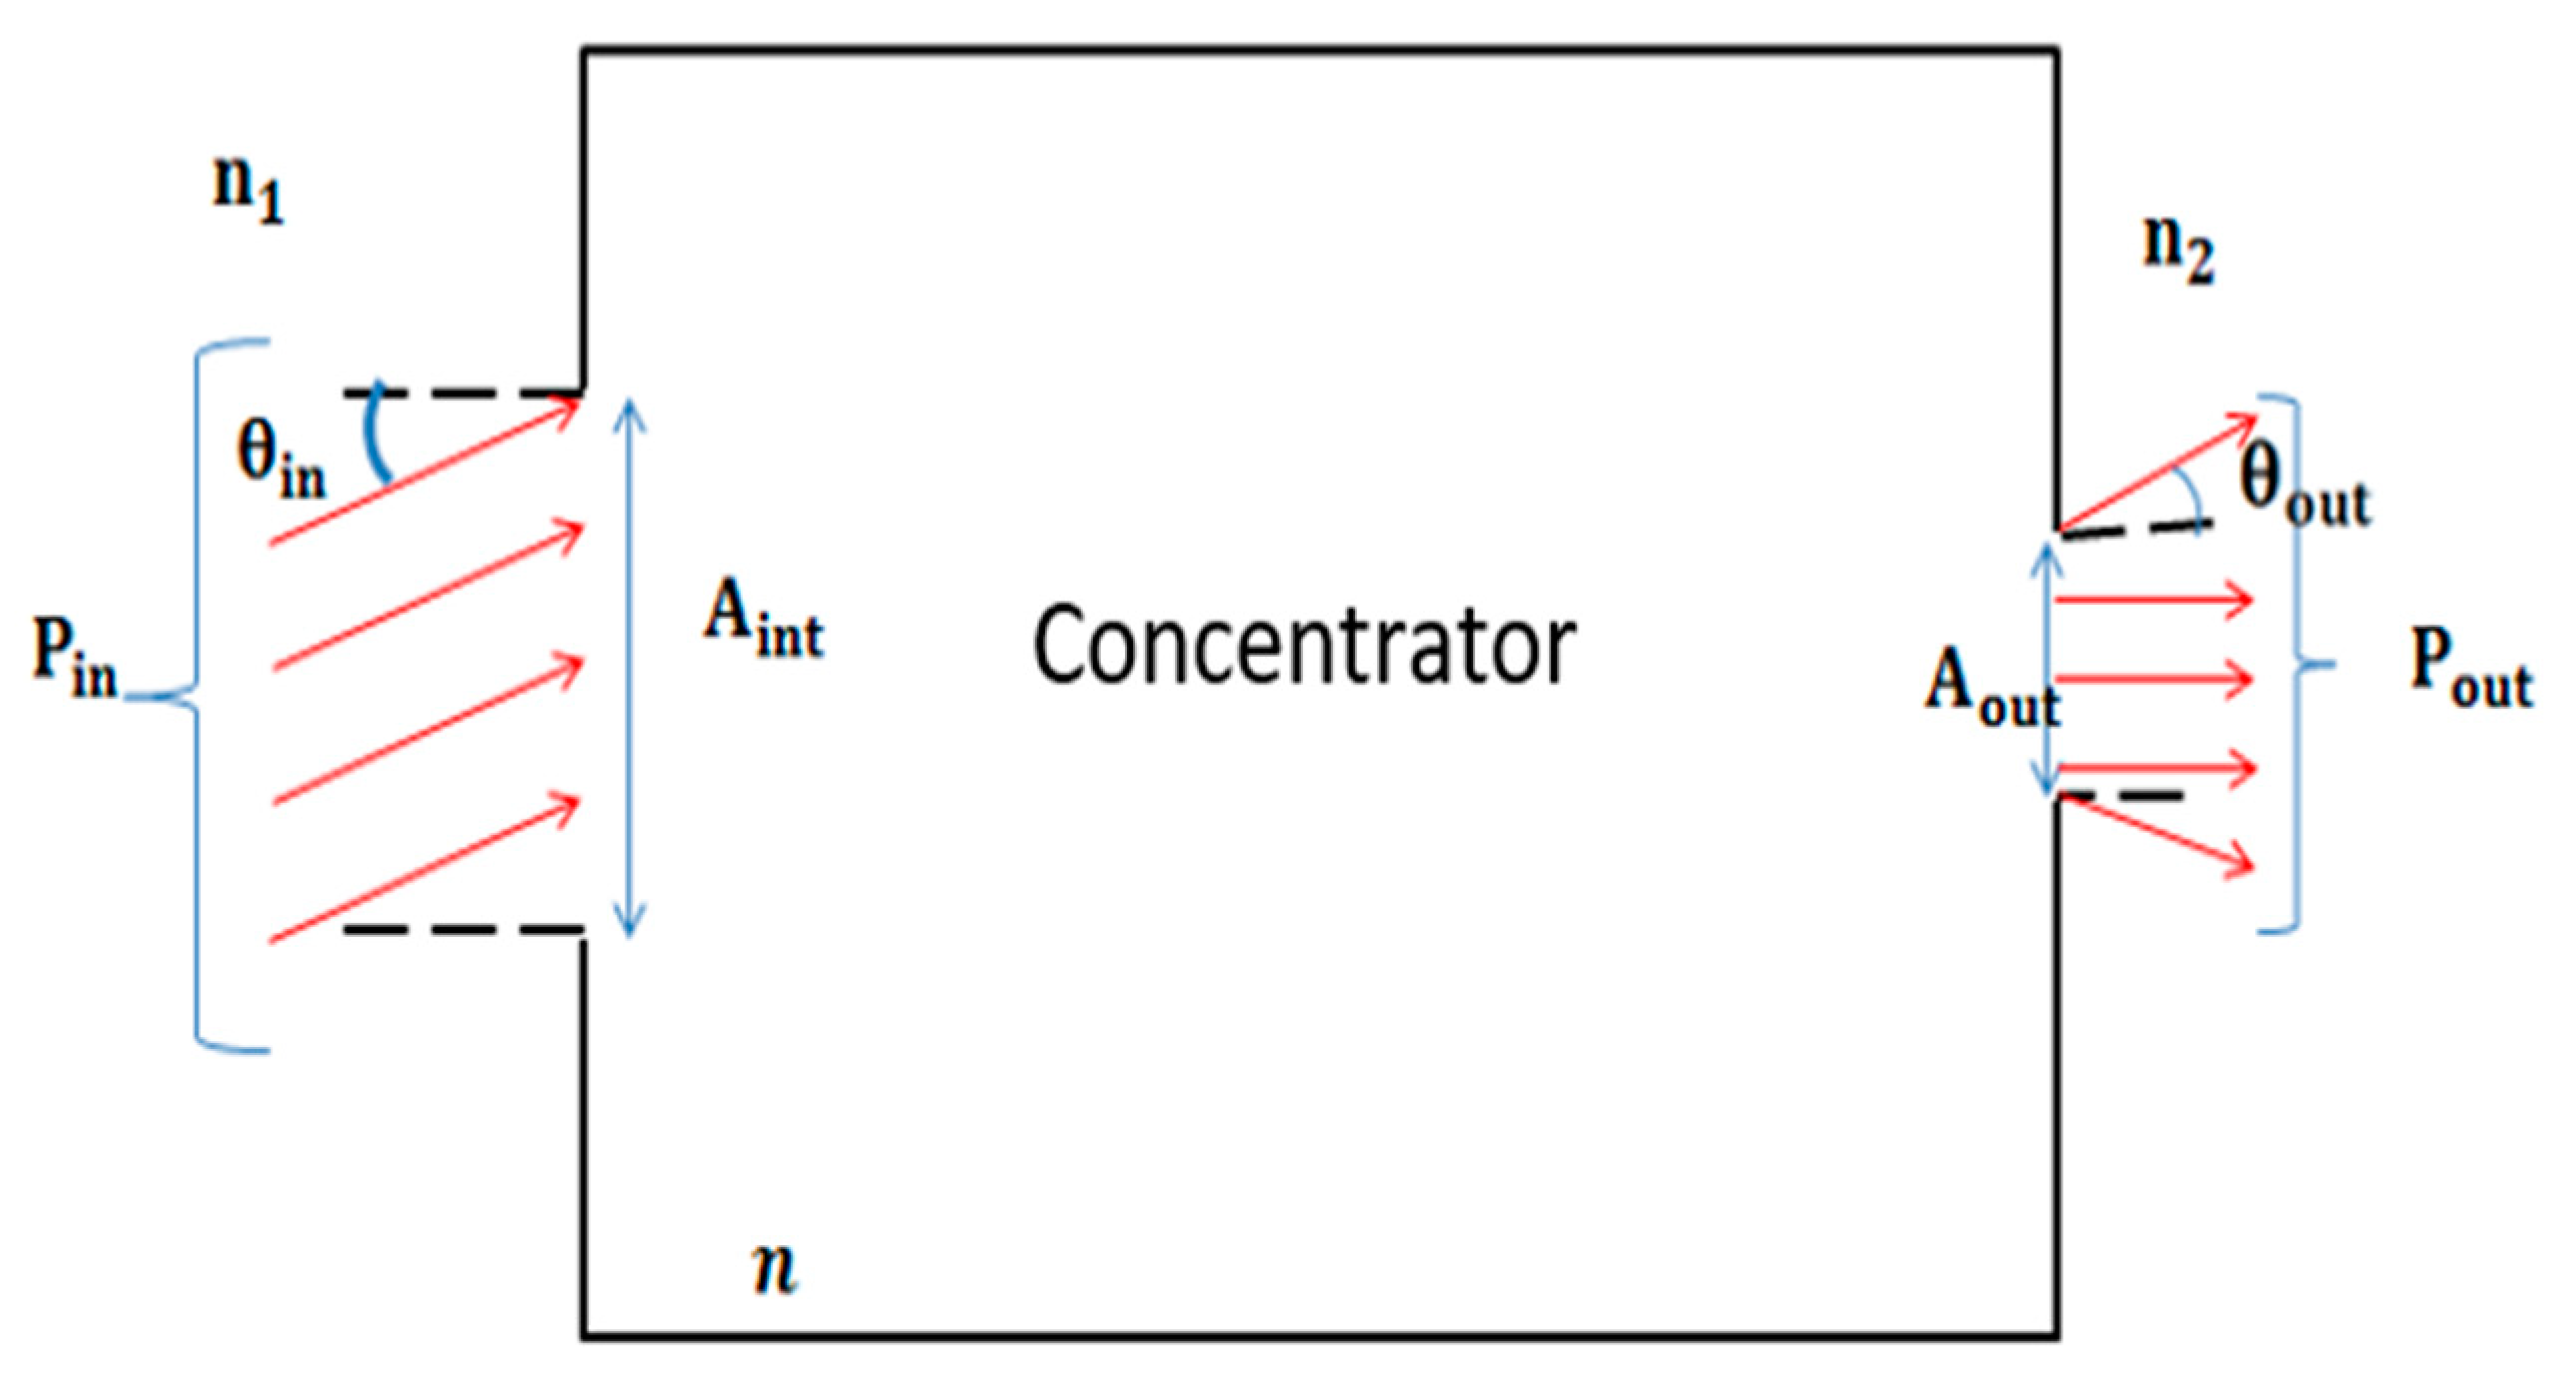
In
Figure 1, an optical system is depicted from a conventional perspective, with A
in and A
out acting as the entrance and exit surfaces, respectively. This device emits a power pin at the opposite end after accepting an optical power input pin. Light enters the system at an angle of incidence that is inward and exits at an angle that is outward. The whole concentration ratio is defined as the difference between the optical power density at the system entrance and the optical power density at the system exit:
with
being the system’s optical performance, and
the ratio of geometric concentration. The geometrical concentration ratio can be rewritten according to the optical étendue law [
13]:
This demonstrates a rigid relationship between an optical beam’s entrance and departure angles, placing some restrictions on how an optical system can be designed. Our optical system is composed of an SOE (ball lens) and a circular Fresnel lens (FL) with a focal distance of f and a diameter d. The FL is distinguished by its f_number, which is equal to
2.2. Design of a Micro-Concentrator
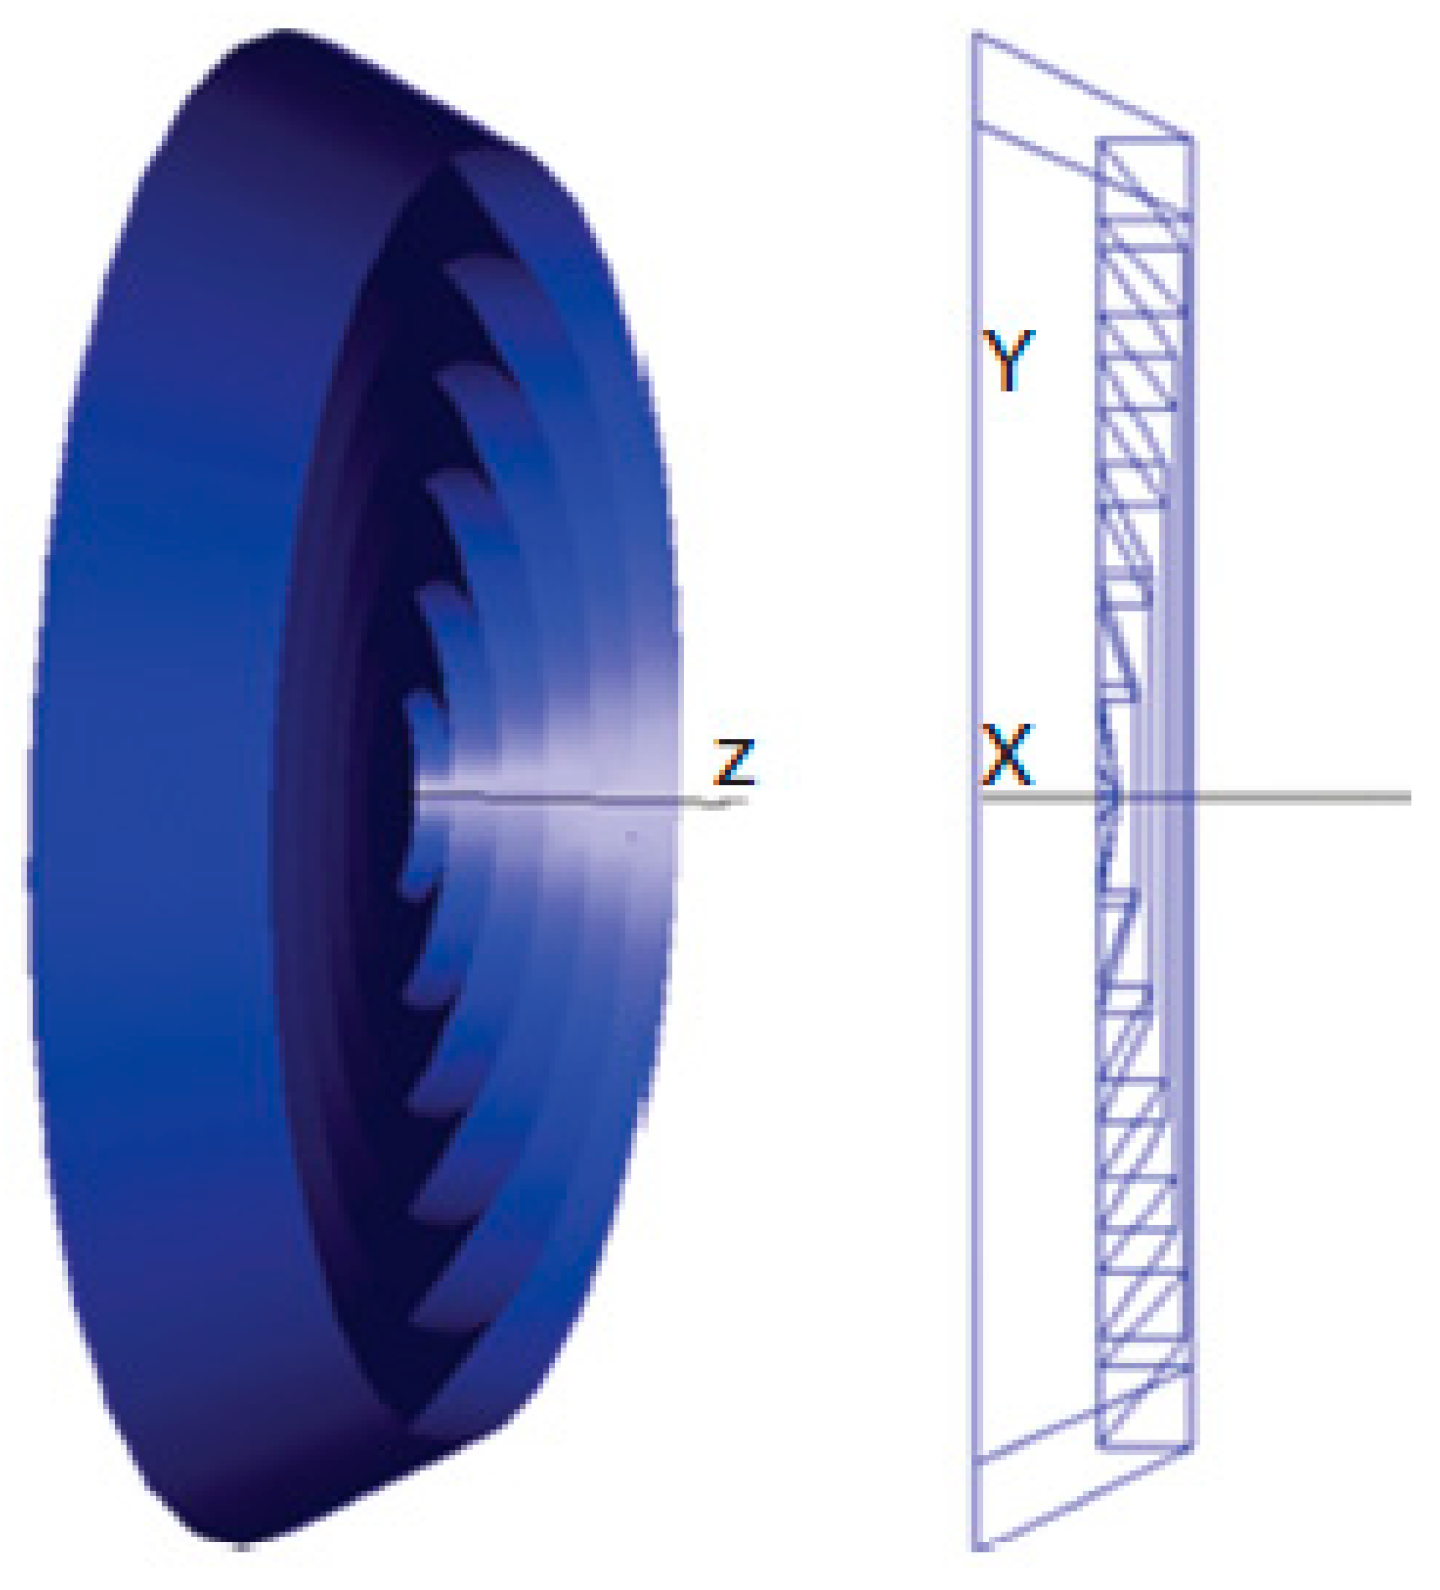
The two lenses that make up the MCPV module under research are the primary optical element (POE), which serves as a concentrator, and the secondary optical element (SOE), which is directly coupled to a triple-junction solar cell and functions as a homogenizer and increases the acceptance angle. Two unique phases make up the design process for the POE and SOE, and they are described here. Both optical systems are formed at 505 nm using Fermat’s concept, with the primary lens’s focal point located on the top surface of the ball lens. A polymethyl Fresnel is the POE.
The PNMA lens is composed of methacrylate. The material parameters and geometric concentration factor are utilized to construct the 2D and 3D profile (
Figure 2) of the POE.
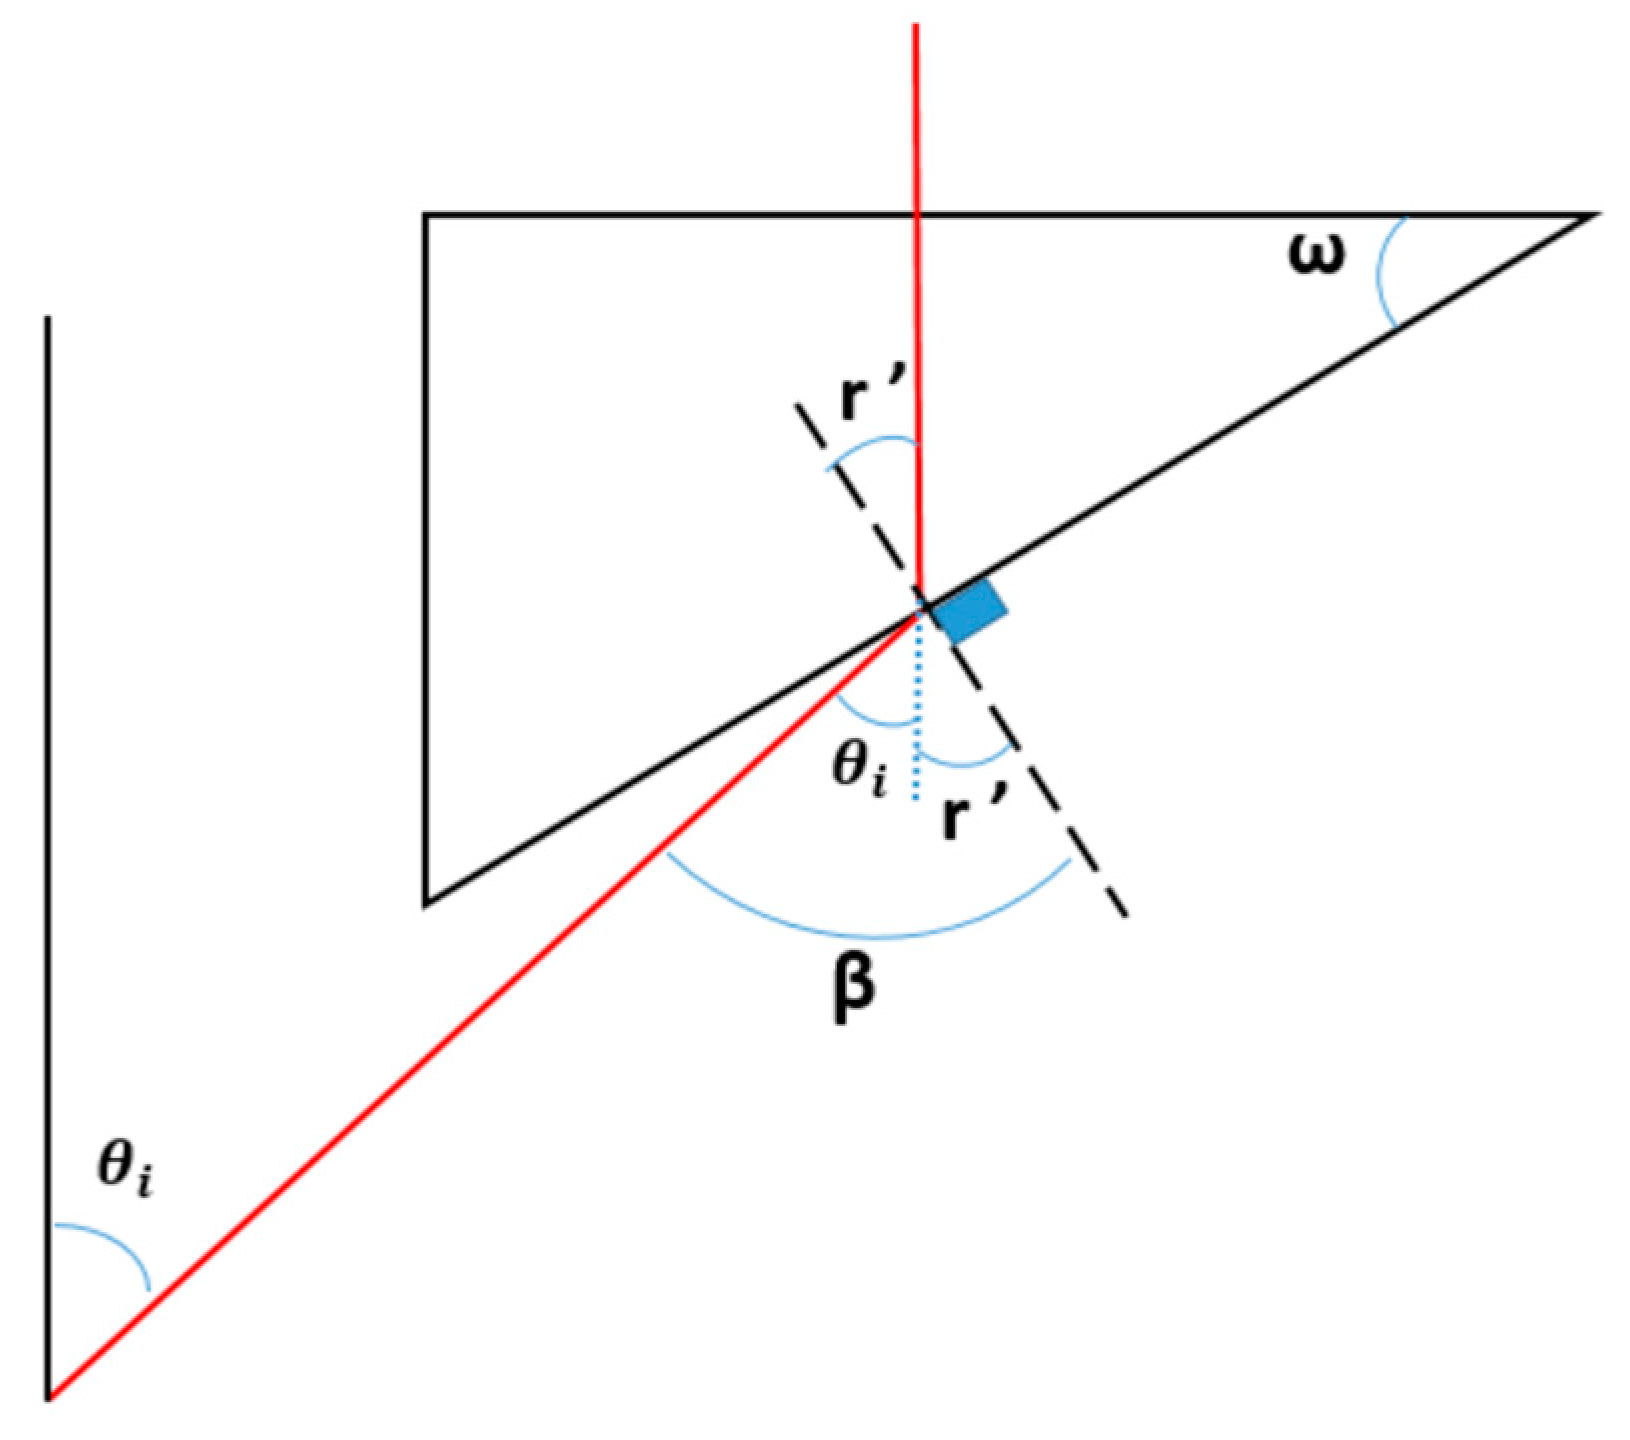
There are numerous small, concentric grooves that make up the Fresnel lens. In this section, we will look at the situation of a two-dimensional Fresnel lens with inward grooves. The following equations are based on
Figure 3 [
13]:
The exceedingly precise edge-ray tracing carried out using the SOE is shown in
Figure 2. The square aperture of the plano-convex lens has D side length, f focal length, s side length, and r radius of the ball lens. The incidence angle is the angle formed by the edge ray and the optical axis, and its matching refraction angle is given. This angle allows the parallel light beam to be directed onto the ball lens after striking the lens aperture. Equations (7)–(10), where n
1 and n
2 stand for the refractive indices of the air and the ball lens, respectively. These formulas can be used to calculate the height of the ball lens using an Equation (10).
2.3. Simulation Results
An optical system’s design requires some feedback data for performance analysis and optimization. Therefore, a variety of merit metrics are used: The optical system’s quality is gauged by its optical efficiency. An optical system’s design requires some feedback data for performance analysis and optimization. As a result, different metrics are employed, with optical efficiency serving as the key metric for the quality of optical systems. The homogeneity of the concentrators is another notable characteristic. A partial zone with excessive irradiation is introduced by non-uniform illumination, which causes a localized overload of current densities. The greater series resistance of this results in efficiency losses. It may also have an impact on cell dependability because of temperature problems or tunnel junction restrictions. The final measure of merit is the acceptance angle, which describes the system’s tolerance for the axis misalignment of the incident solar energy and its optical axis. When measuring optical efficiency at normal incidence, which is 0°, the output power is shown to decrease to 90% of its maximum value. The merit statistics described above will serve as the basis for evaluating the proposed system. Finding the ideal balance between greater acceptance angle, uniform flux distribution throughout the cell surface, and improved optical efficiency is the goal. Given that the majority of concentrators are made of optical components, it is critical to find the best design for them or change their characteristics in order to notice a performance gain. We have previously considered the best layout for the proposed system. Using Tracepro software, Monte-Carlo ray tracing was carried out to assess the optical capabilities of the concentrator. The following are the specifications of the suggested concentrator design: (1) A PMMA Fresnel lens with a 6 mm diameter, a 6 mm focal length, and a 1 mm thickness; (2) A triple-junction solar cell with a 0.6 mm side length; (3) An SOE with a PNMA ball lens of 8.94 mm diameter; (4) The solar spectrum AM1.5d ASTM G173 has a solar divergence angle of 0.265.
When the sun is exactly on-axis, the optical efficiency is calculated as the ratio of power on the cell to that on the lens aperture. As the number of prisms rises, optical efficiency does.
Table 1 shows that the FL with 30 prisms can achieve an optical efficiency of more than 83% and a 1.5° acceptance angle, while the FL with 3 prisms has the lowest optical efficiency (35%) and the smallest acceptance angle (1°). It should be noticed that the receiver’s center intensity is shown in this diagram. The more prisms there are, the better the optical efficiency. In fact, if the diameter of the lens remains constant, fewer prisms will result in a prism with a greater angle. As a result, the prism will be larger, which will produce geometrical losses (losses brought on by the divergence of the optical beam) for rays that correspond with the ends of the prisms as well as losses from complete internal reflection.
- b.
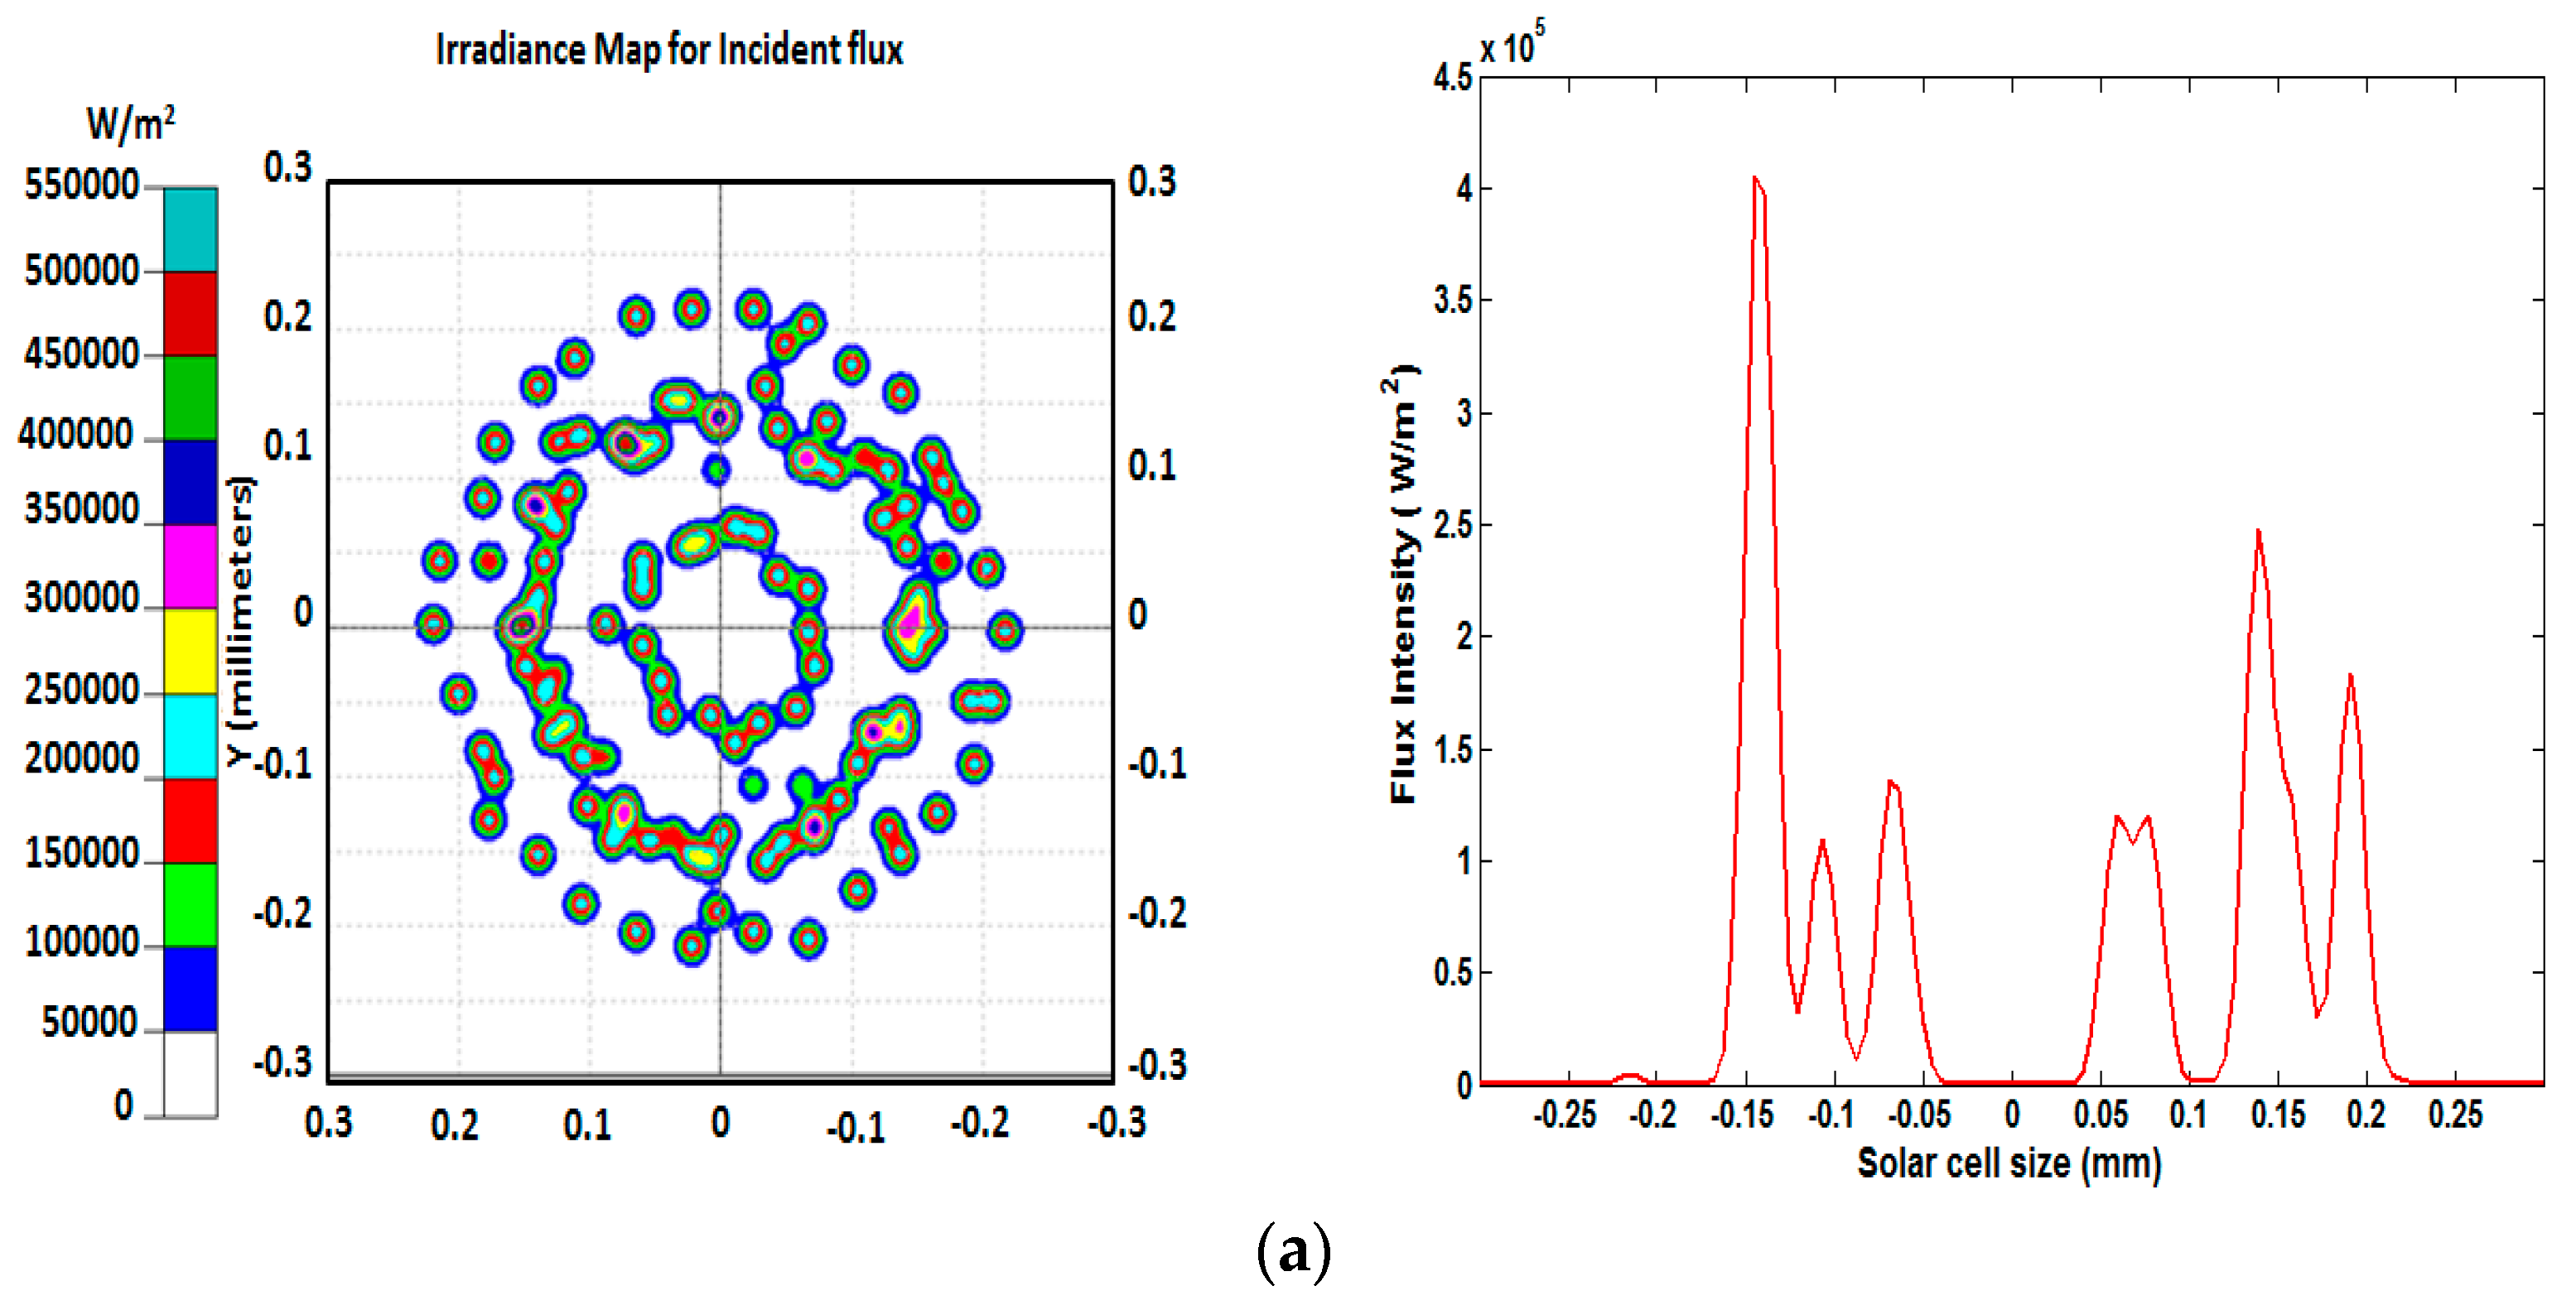
Irradiance Distribution Over the Cell Surface
Current density is not uniform due to the uniqueness of and lack of uniformity in the lighting intensity on the surface of the cell. As a result, lateral currents between highly illuminated and dimly lit areas occur. The fill factor FF decreases as a result of these lateral currents’ generation of ohmic losses in series resistances [
26].
Figure 4 displays the spectral irradiance distributions on the solar cell for incidence angles of 0°. The flux is clearly seen to be distributed evenly across virtually the entire exit of the system under typical light distribution, with a bright point at the receiver’s center for 30 prisms. However, when the number of prisms is reduced, the light power is gathered on the solar cell center. Therefore, by adding more prisms, the flux distribution becomes more uniform.
For the rest of the paper, we will continue our tests using the Fresnel lens of 30 prisms.
2.4. Micro-CPV Systems’ Loss Mechanism
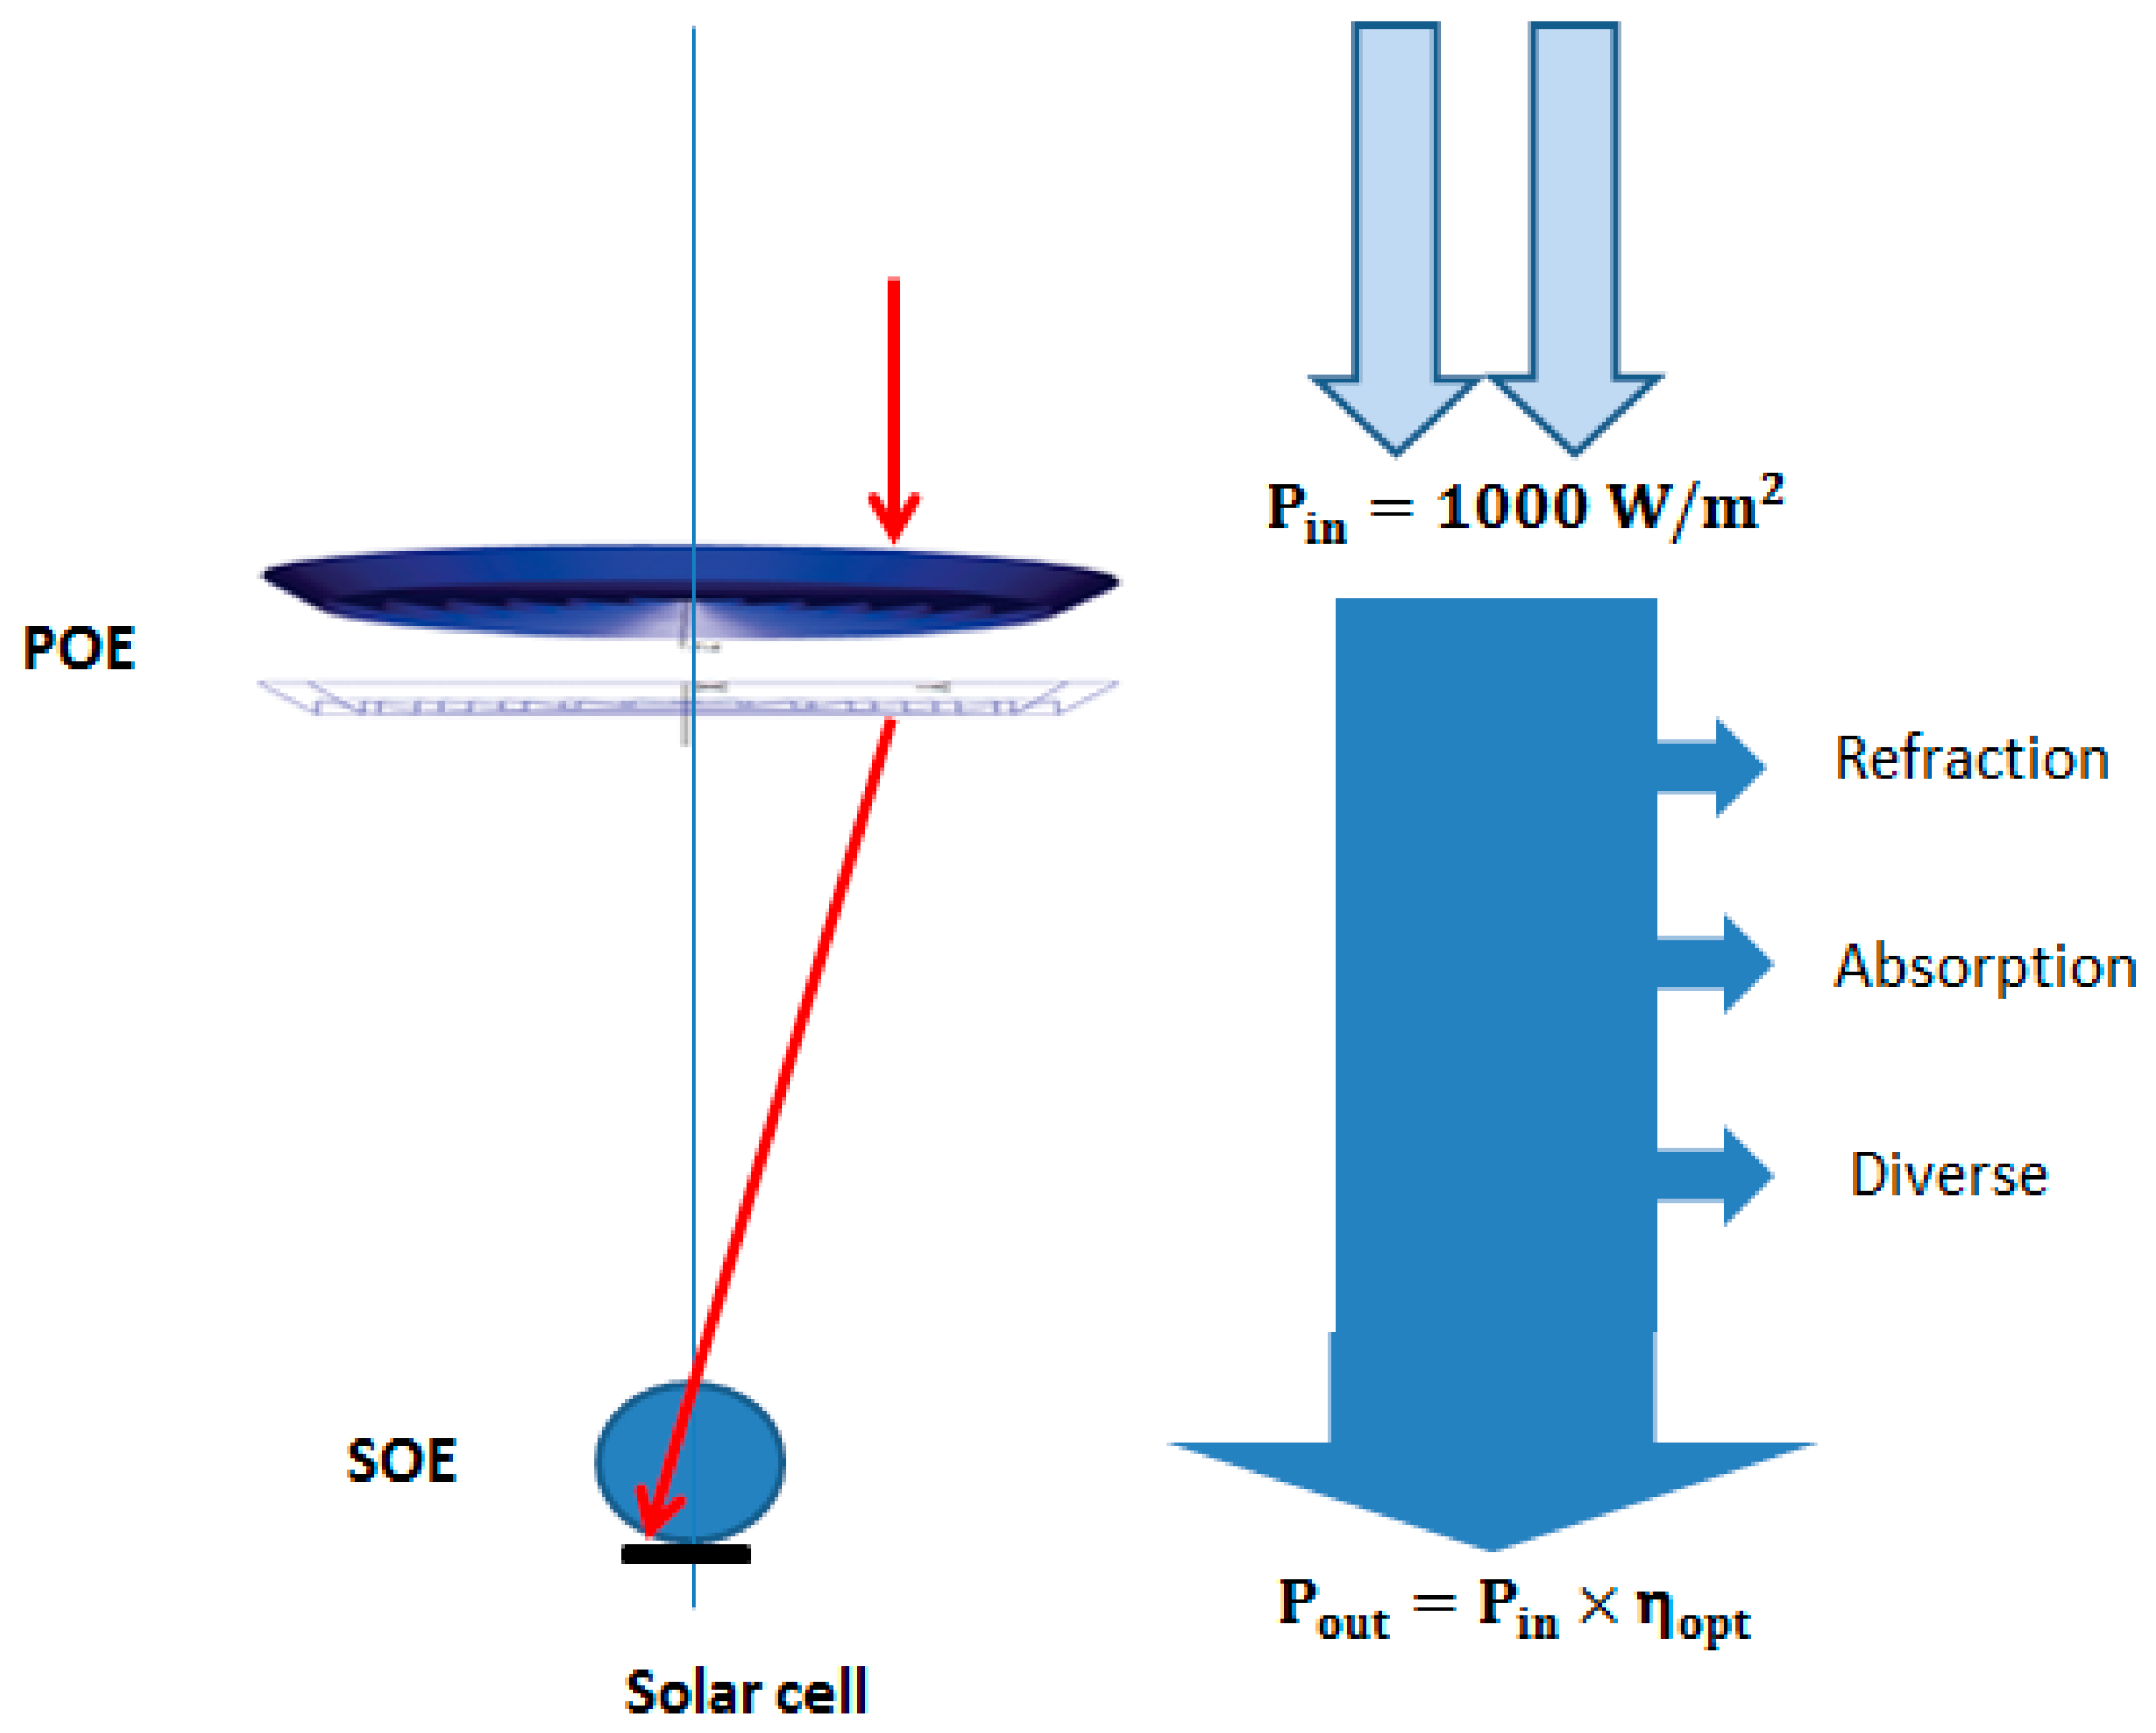
A micro-CPV concentrator’s power generation is impacted by a number of losses. Starting with the optical components and moving through electrical losses caused by the mechanical assembly that takes place in the CPV modules, these losses can be found at every level of the system. More information on these losses will be provided and covered in this section of the essay.
Optical losses prevent some of the solar radiation from entering the optical concentrator aperture at the receiver and from reaching the cell (
Figure 5). Losses that depend on optical surfaces and losses that depend on material qualities can be separated into two groups. The results show that a cell displacement of up to 1mm has no effect on the acceptance angle. When the shift is greater than 70 mm, the optical efficiency and acceptance angle, however, drop. To accommodate POE tolerance, the proposed system will build an area of about 35 mm surrounding the cell’s core. The statistics indicate that when the cell is moved up to 70 mm, the acceptance angle remains the same. When the shift is greater than 70 mm, the optical efficiency and acceptance angle, however, drop. When building the cell, the proposed method will allow for a tolerance of roughly 35 mm around its center.
When a medium changes from one with a certain refractive index n
i to another with a different one, a small amount of light is reflected at each surface of the lenses. This loss, which is sometimes referred to as Fresnel reflection loss, increases as a result of the mismatch between the indices and the incidence angle. The refracted fraction of the light is then calculated using Equation (11).
where n
i and n
t stand for the incident and transmission media’s respective refractive indices. In the proposed system, the reflection losses are computed for each surface between two materials. With 3.87% for both the surface air-plano surface and the convex surface-air, the overall loss in the SOE is 3.87%, whereas the total loss in the POE is 7.74%. The overall loss from reflections in the micro-concentrator system is 11.61%, hypothetically.
Either lenses (which are completely transparent) or mirrors make up optical systems. In both situations, a portion of the light is absorbed by the substance. In the case of lenses, the Beer–Lambert law is used to calculate the absorption losses.
The absorption coefficient and the ray path length inside the lens, or, to put it another way, the lens thickness, both increase absorption. The manufacturer provides the absorption coefficient, which is wavelength dependent. Then, using the PMMA absorption coefficients (=0.0097 mm−1), Beer–Lambert’s law is used to determine the absorption losses. The total of these losses in the 100× micro-concentrator is 1.56%. Therefore, the overall loss for the micro-concentrator is 13.17%.
In addition to optical losses, managing components precisely with placement in the micro range also becomes more crucial, especially in micro-contractor modules in which the dimensions are reduced. Although maintaining this positioning accuracy during operation is necessary because the location can change due to environmental factors such as thermal expansion, it is also important during assembly [
23]. The mechanical construction must put limits on this variation in the concentrator’s parts. This is a reference to the mechanical tolerance, which states that even if the module is distorted, the cell must still be able to absorb sunlight. This section will focus on calculating the mechanical tolerances that this method allows, using the system component manufacturer.
2.5. Simulation of Cell to SOE Tolerances
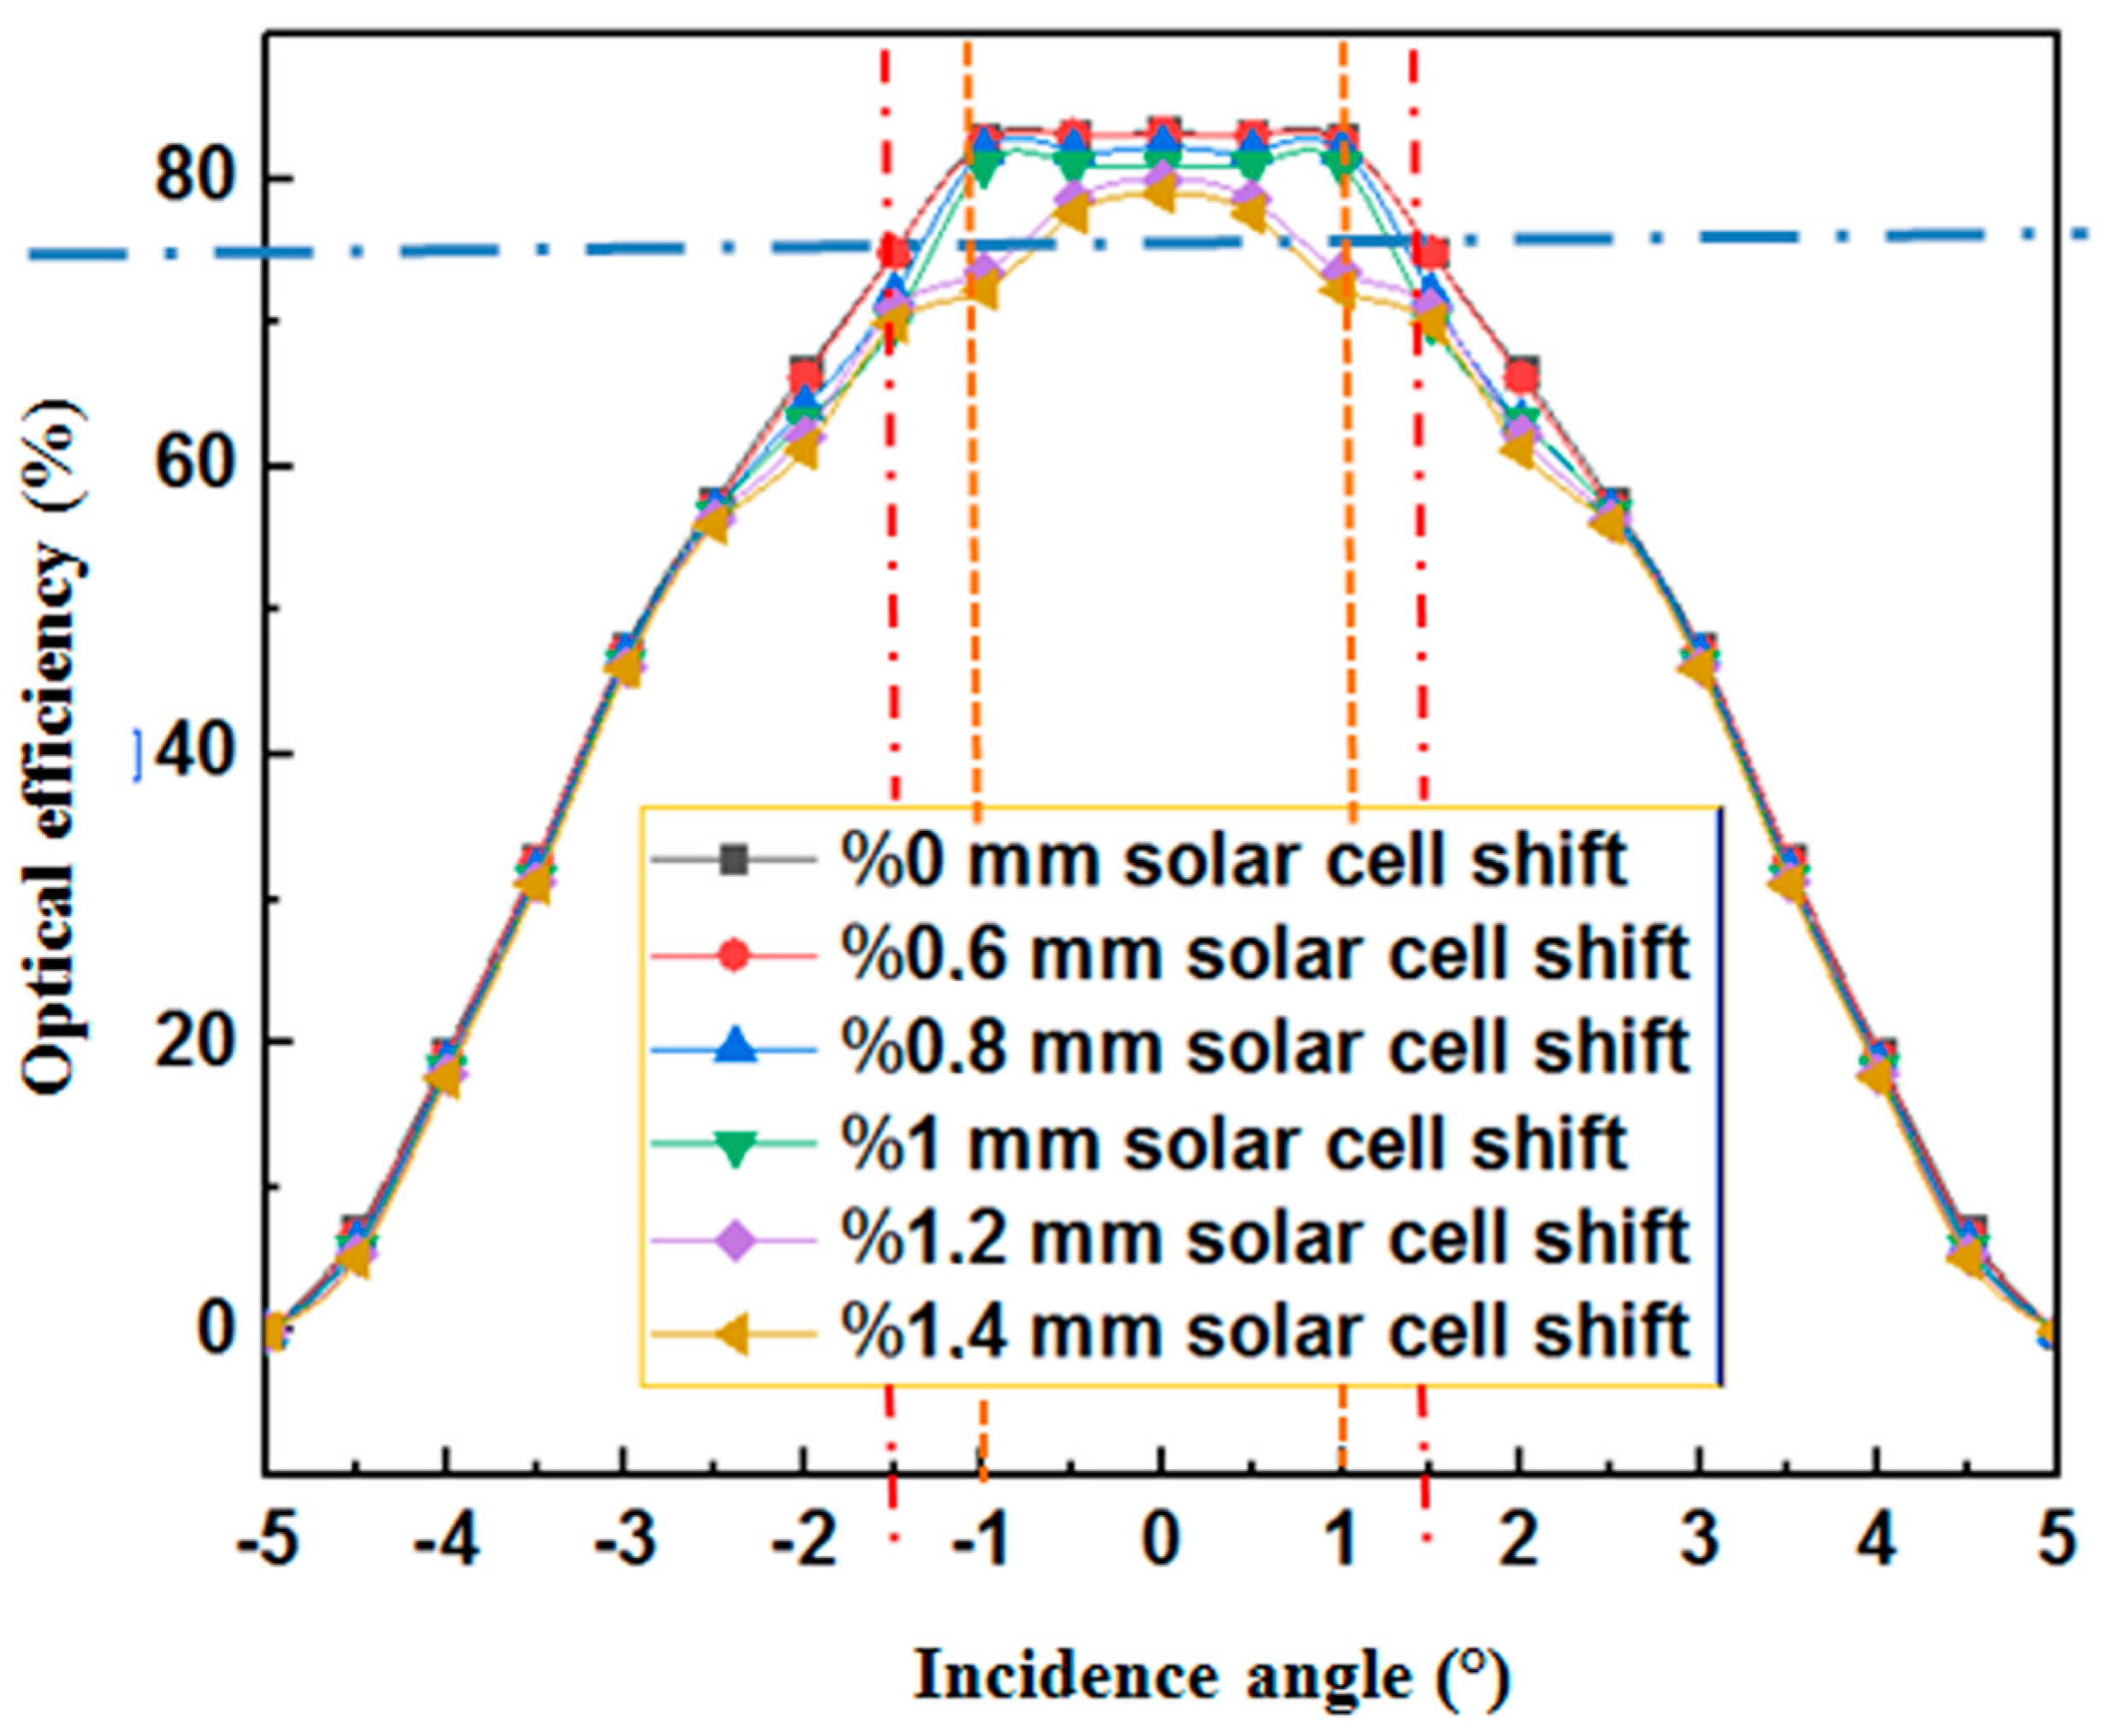
Ray-tracing simulations were run to determine how accurate the mechanical assembly of the concentrator components was. Through the analysis of the angular tilts and shifts of the POE, the mechanical tolerances were carried out for both the cell and SOE. In this initial simulation, the POE and SOE stayed fixed, while the cell position and incidence angle varied laterally.
Figure 6 shows the fluctuation of the flux received by the cell as it shifts in relation to the incident angle. The findings indicate that even when the cell is moved up to 0.8 mm, the acceptance angle stays the same. However, when the shift is greater than 0.8 mm, the optical efficiency and acceptance angle decline. When manufacturing the system, our technology will provide around 0.4 mm of tolerance around the cell’s center.
Using the system component manufacturer, sunlight was simulated at angles from 0 to 5 in steps of 0.5.
Figure 5 shows the correlation between optical efficiency and sun direction. As the sun rises in a different direction, the optical efficiency somewhat decreases. This is due to Fresnel reflection losses, which take place at the points when light crosses across regions with various refractive indices. As a result, the loss depends on both the difference in refractive index and the angle at which the light is incident. Fresnel losses occur in this arrangement on the surface of the solar cells, in the area between the concentrator and receiver, and on the reception surface. It is feasible to lower the Fresnel loss at the intersection of the concentrator and receiver to less than 0.1% by filling it with index-matched gel. The additional system loss caused by shading solar cells and the electrical connections between them is calculated to be roughly 3%.
Figure 6 shows how the system was able to achieve an optical efficiency of, on average, 80%.
2.6. Discussion
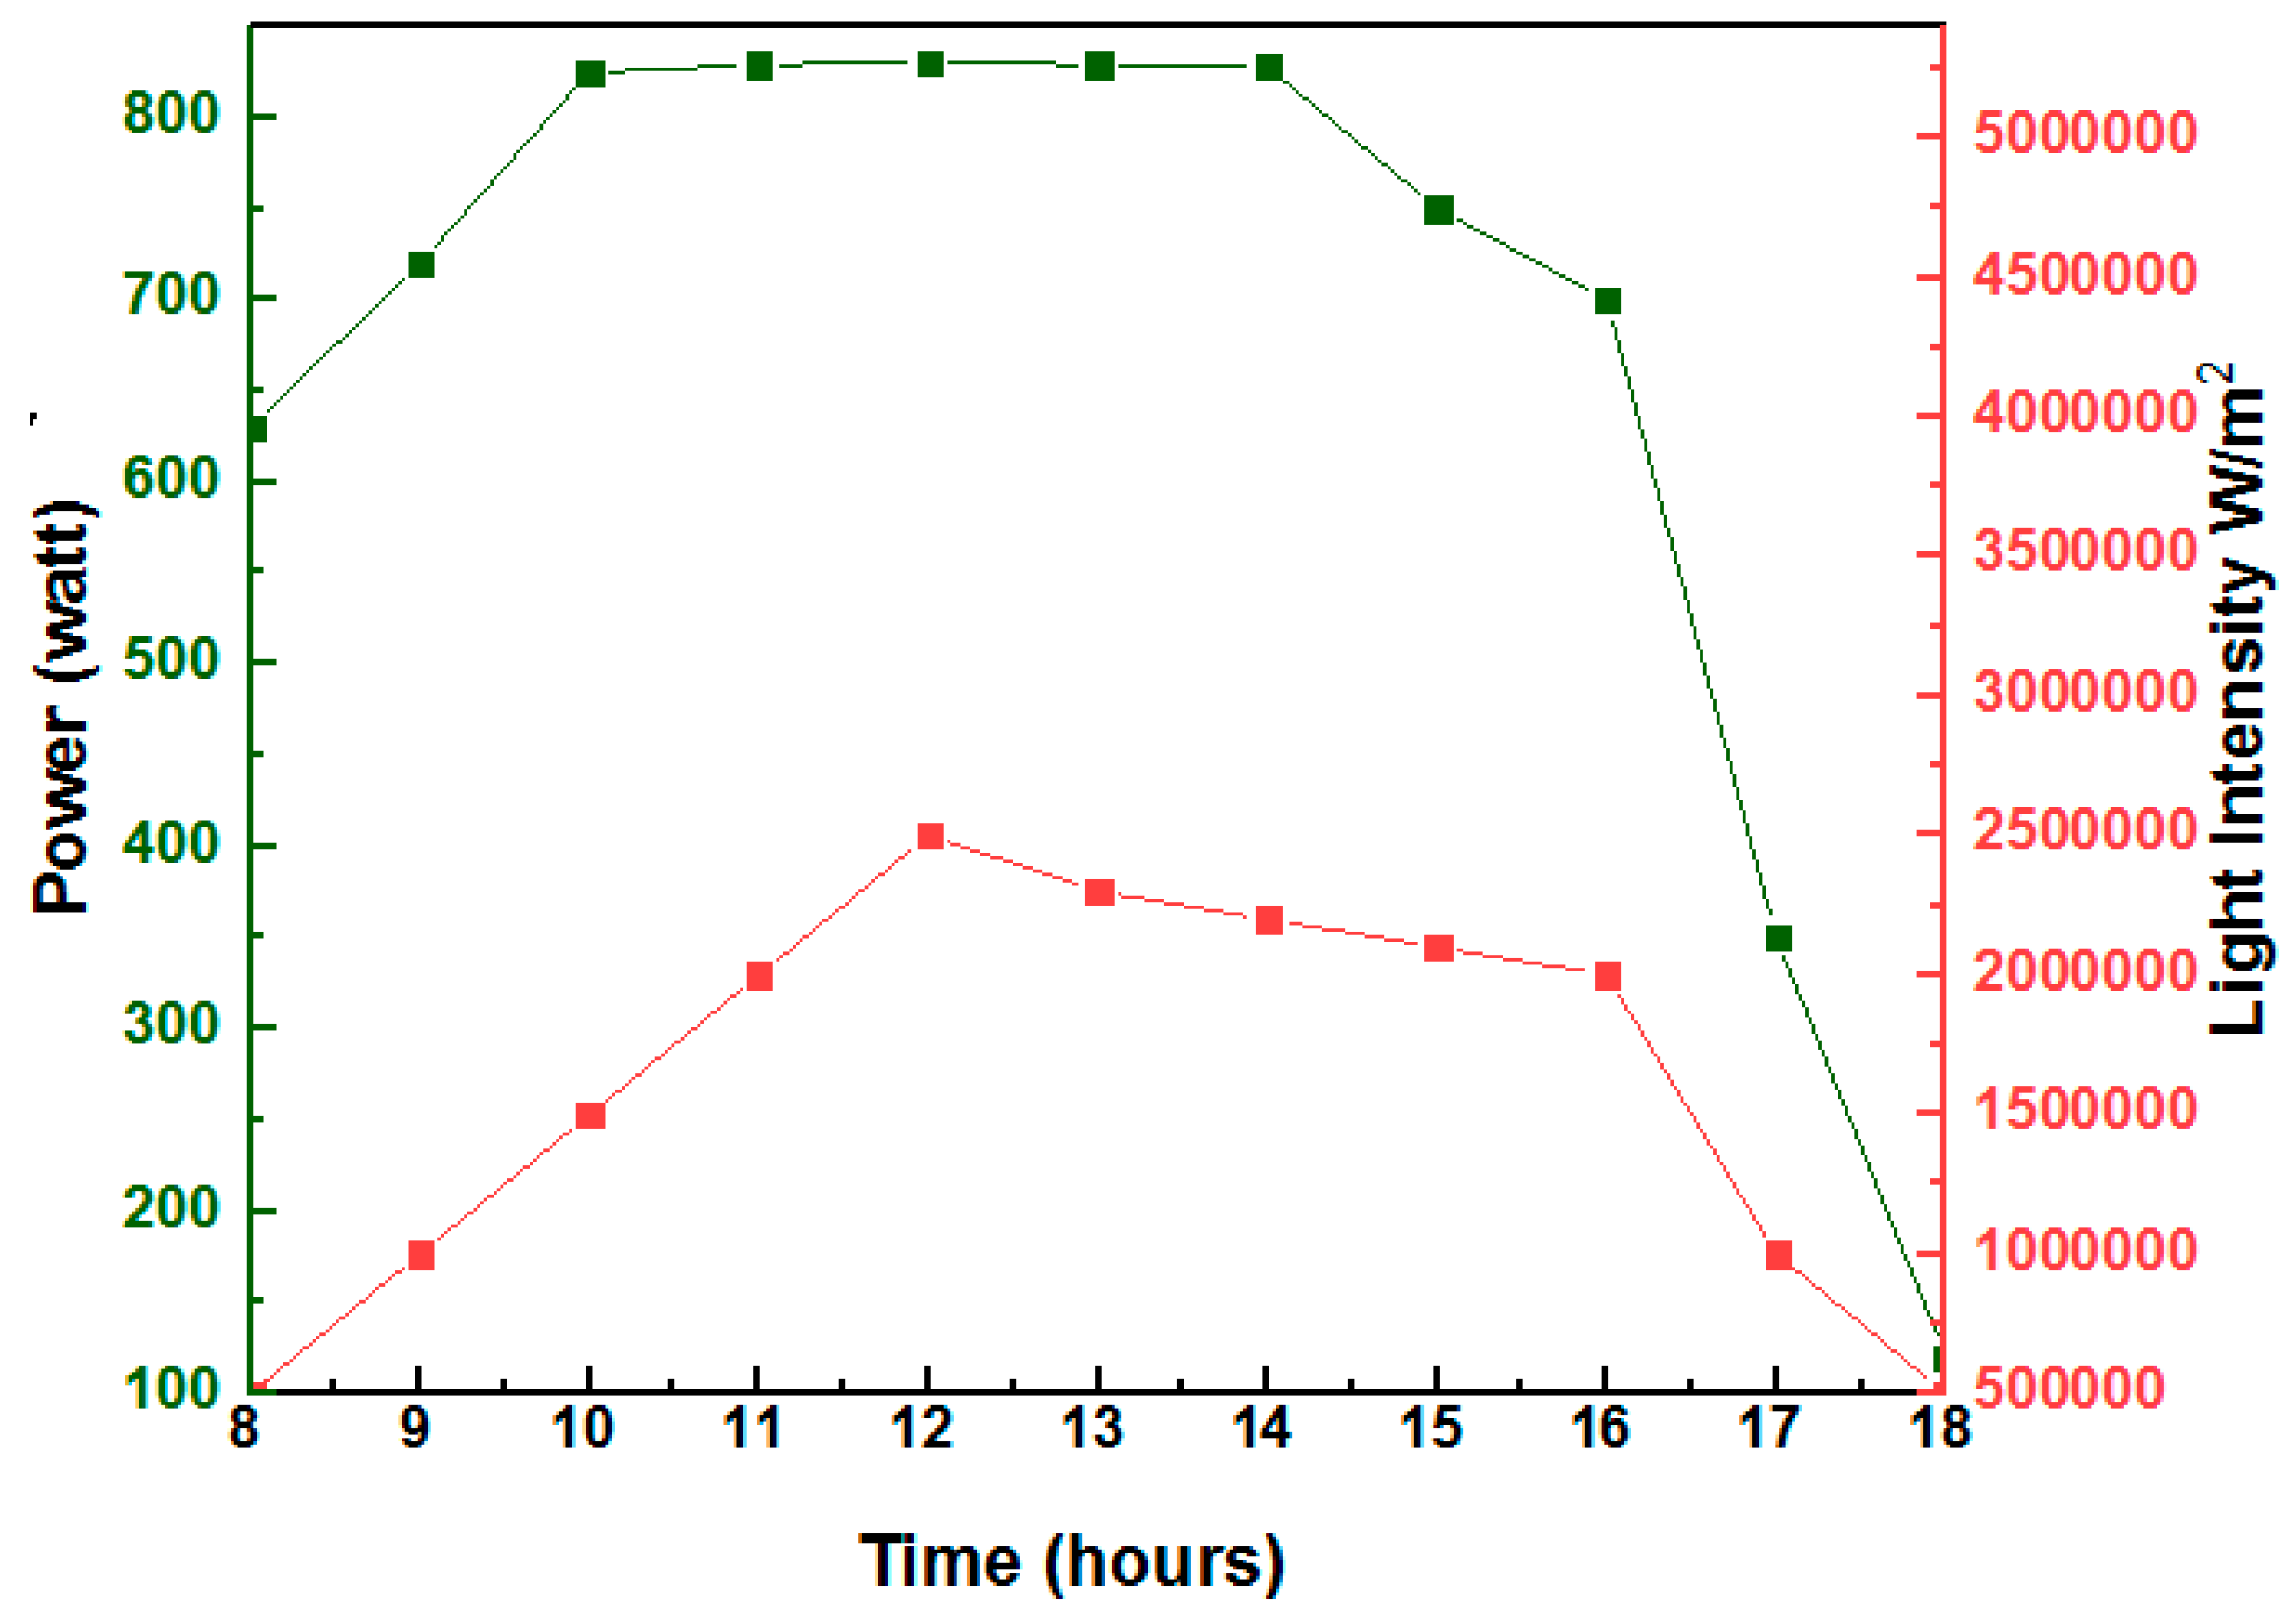
The evaluation of the solar system’s performance lasted three days, for 10 h, from 8 a.m. to 6 p.m. Both current and light intensity may be detected by the sensors. Using data on voltage and current, the Watt unit’s power is calculated using the formula P = VI. The temperature of the panel and the amount of light are also measured in order to determine the environment’s contribution to the overall amount of electricity produced.
Figure 7 display data for power vs. light intensity. The three-day average power was at its peak between 11:00 and 14:00, at 830 Watts. A gain in power may be caused by an increase in solar irradiation or the amount of sunlight power density attained in a given place (measured in W/m
2). It is possible to access the CPV panel monitoring system and the CPV monitor application described in this work. Both methods present the same information.
The main obstacle to CPVs being more widely adopted is the lack of a system that is both affordable and effective. A CPV system must be manufactured utilizing a low-cost technique, as was mentioned in the introduction, in order to be competitive. They must therefore be produced utilizing plastic materials. The lens array can be molded, since plastic can be used, making mass production affordable. Reduced production, supplier management, and recycling expenses will all result from reduced material use. In the proposed system’s design, MPPA is the only material used for both the concentrator and the receiver. When compared to standard Fresnel-based CPV systems, the system has a lower concentration ratio (C
geo = 100), which is between 300 and 1000. However, the lower unit cost of solar cell production ensures that the cost of the system remains acceptable despite this comparative cost increase for additional solar cells. On the other hand, conventional designs call for extremely high-quality optics and sun-tracking systems due to their high concentration ratio. Additionally, optical components must be very closely aligned with one another, and this alignment can be easily lost when operating outdoors [
26,
27]. In high-concentration systems, heat is another issue that requires additional money to sanitize. Conventional systems’ extremely condensed and irregular light profile at the focused area necessitates a complex and loss-heavy optical system for light redistribution, which reduces efficiency and raises costs. The proposed design has a lower concentration ratio, which reduces the severity of the heat issue. Rooftop installations are made simple by the proposed micro-CPV system’s simplicity in terms of design, weight, operating concept, and price. Micro-CPV’s adoption for rooftop installation will satisfy the ostensibly enormous market need [
28]. In order to design a micro-CPV system suitable for residential roofs, the goal of the current research is to make a brief comparison between the system and widely used solar panels. The majority of photovoltaic panels use multi-junction solar cells, which have an electrical conversion efficiency of 18–20%. The monocrystalline silicon solar cells in the proposed system have an efficiency of 34%; after accounting for optical losses of roughly 11%, the system efficiency is about 32%. The suggested micro-CPV system is significantly more affordable to create than regular or more traditional flat-panel systems, since each cell uses significantly less semiconductor material than typical solar cells. This also makes the system more ecologically friendly. Direct normal illuminance (DNI) and horizontal diffuse luminance are the two parts of sunlight (DHI). The suggested micro-CPV system is unable to collect diffuse irradiation, similar to most concentrating systems.
In residential locations, energy is mostly used and consumed for heating water, lights, air conditioning, refrigerators, and other appliances. In Morocco, it has been predicted that only a modest amount of energy is used during business hours, which are between 8:00 and 17:00. However, peak demand occurs primarily at night when everyone congregates for activities such as eating, watching television, and other activities. Yet, their power rating falls under the category of domestic appliances, with
Table 2 displaying the typical power rating of household items. Then, in our case, the consumption of a house needs a power of 11 KW daily (
Table 2). Each unit of the system produces 830 W; thus, we need 14 units. As a surface, then, the system occupies 5.88 cm
2.
The consumption of this obtained electricity needs an effective monitoring system. The Internet of Things opens a way to solve this problem by interconnecting hardware, software and the cloud. Therefore, we propose a power consumption monitoring system in the following part.
3. Photovoltaic Monitoring Proposed IoT Based System
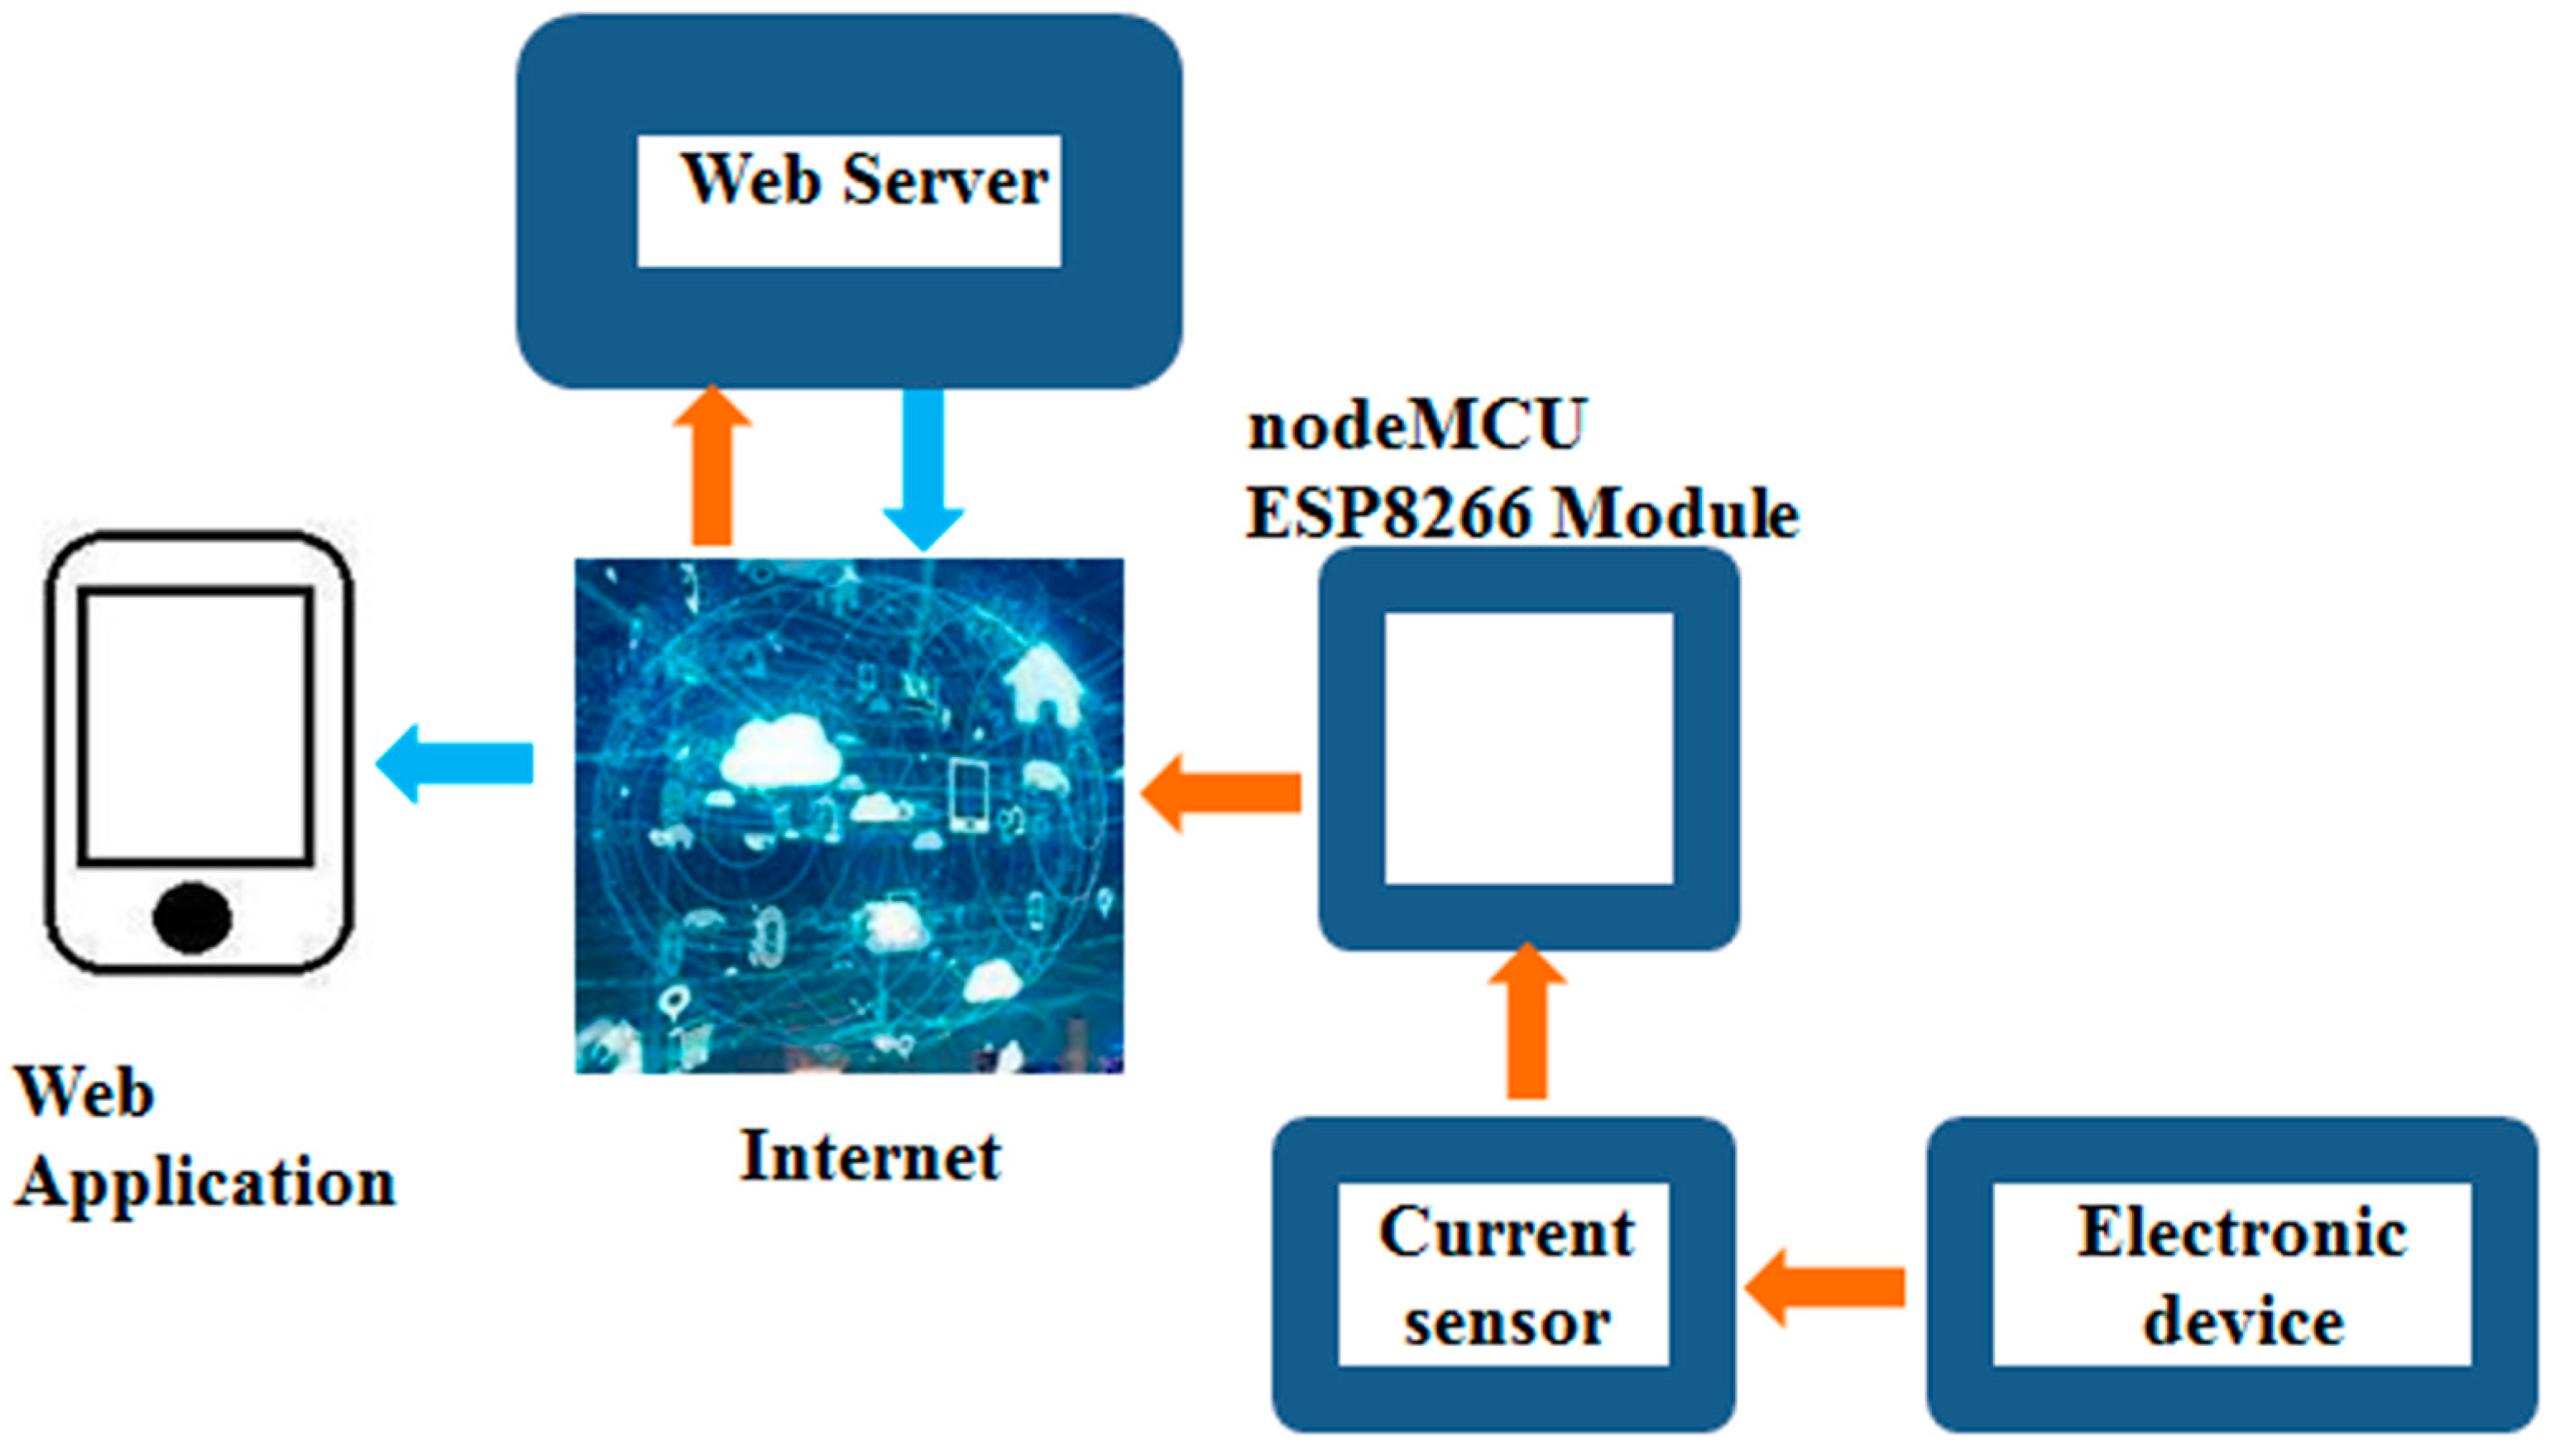
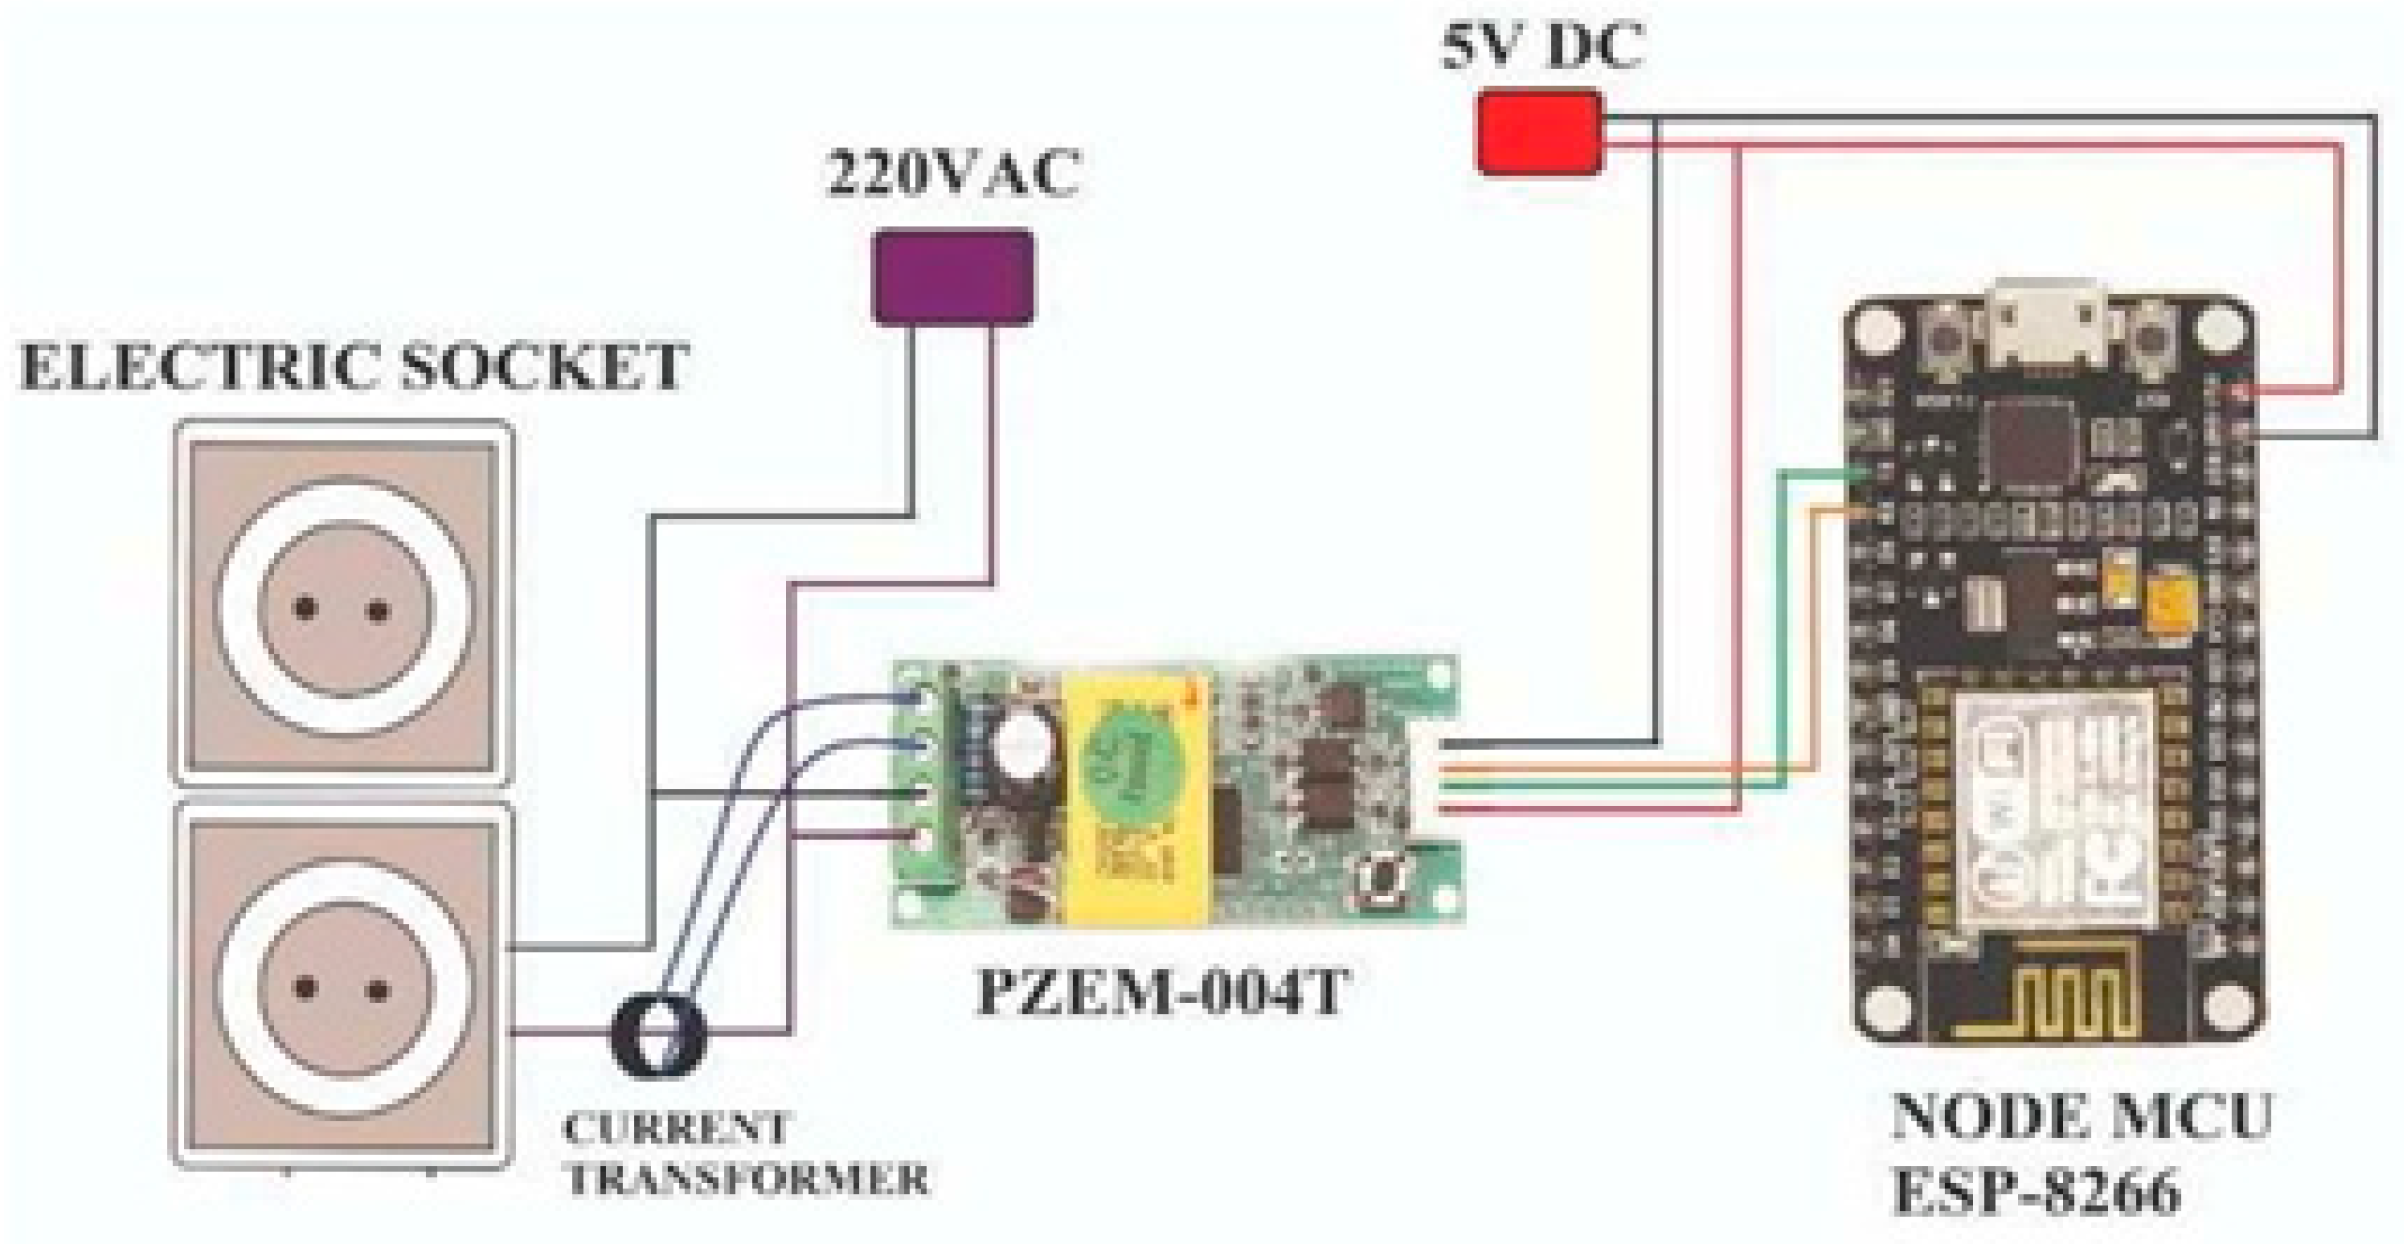
Figure 8 depicts a schematic diagram of the proposed energy consumption monitoring system created for a typical smart house. The NodeMCU microcontroller portion, the sensor PZEM-004T device, the web application running on a computer or smartphone, and many electronic appliances make up the system. The electrical appliances serve as the electrical loads that will be observed and actually measured to determine how much power they use over the course of a specific observation period. The sensor measures the load’s electrical power consumption, and the microcontroller receives the value it reads. The data are transmitted to the microcontroller, where they are processed before being sent via the internet to the webserver. Following receipt by the webserver, the data are kept in a database that can be accessed or checked by a web application unit.
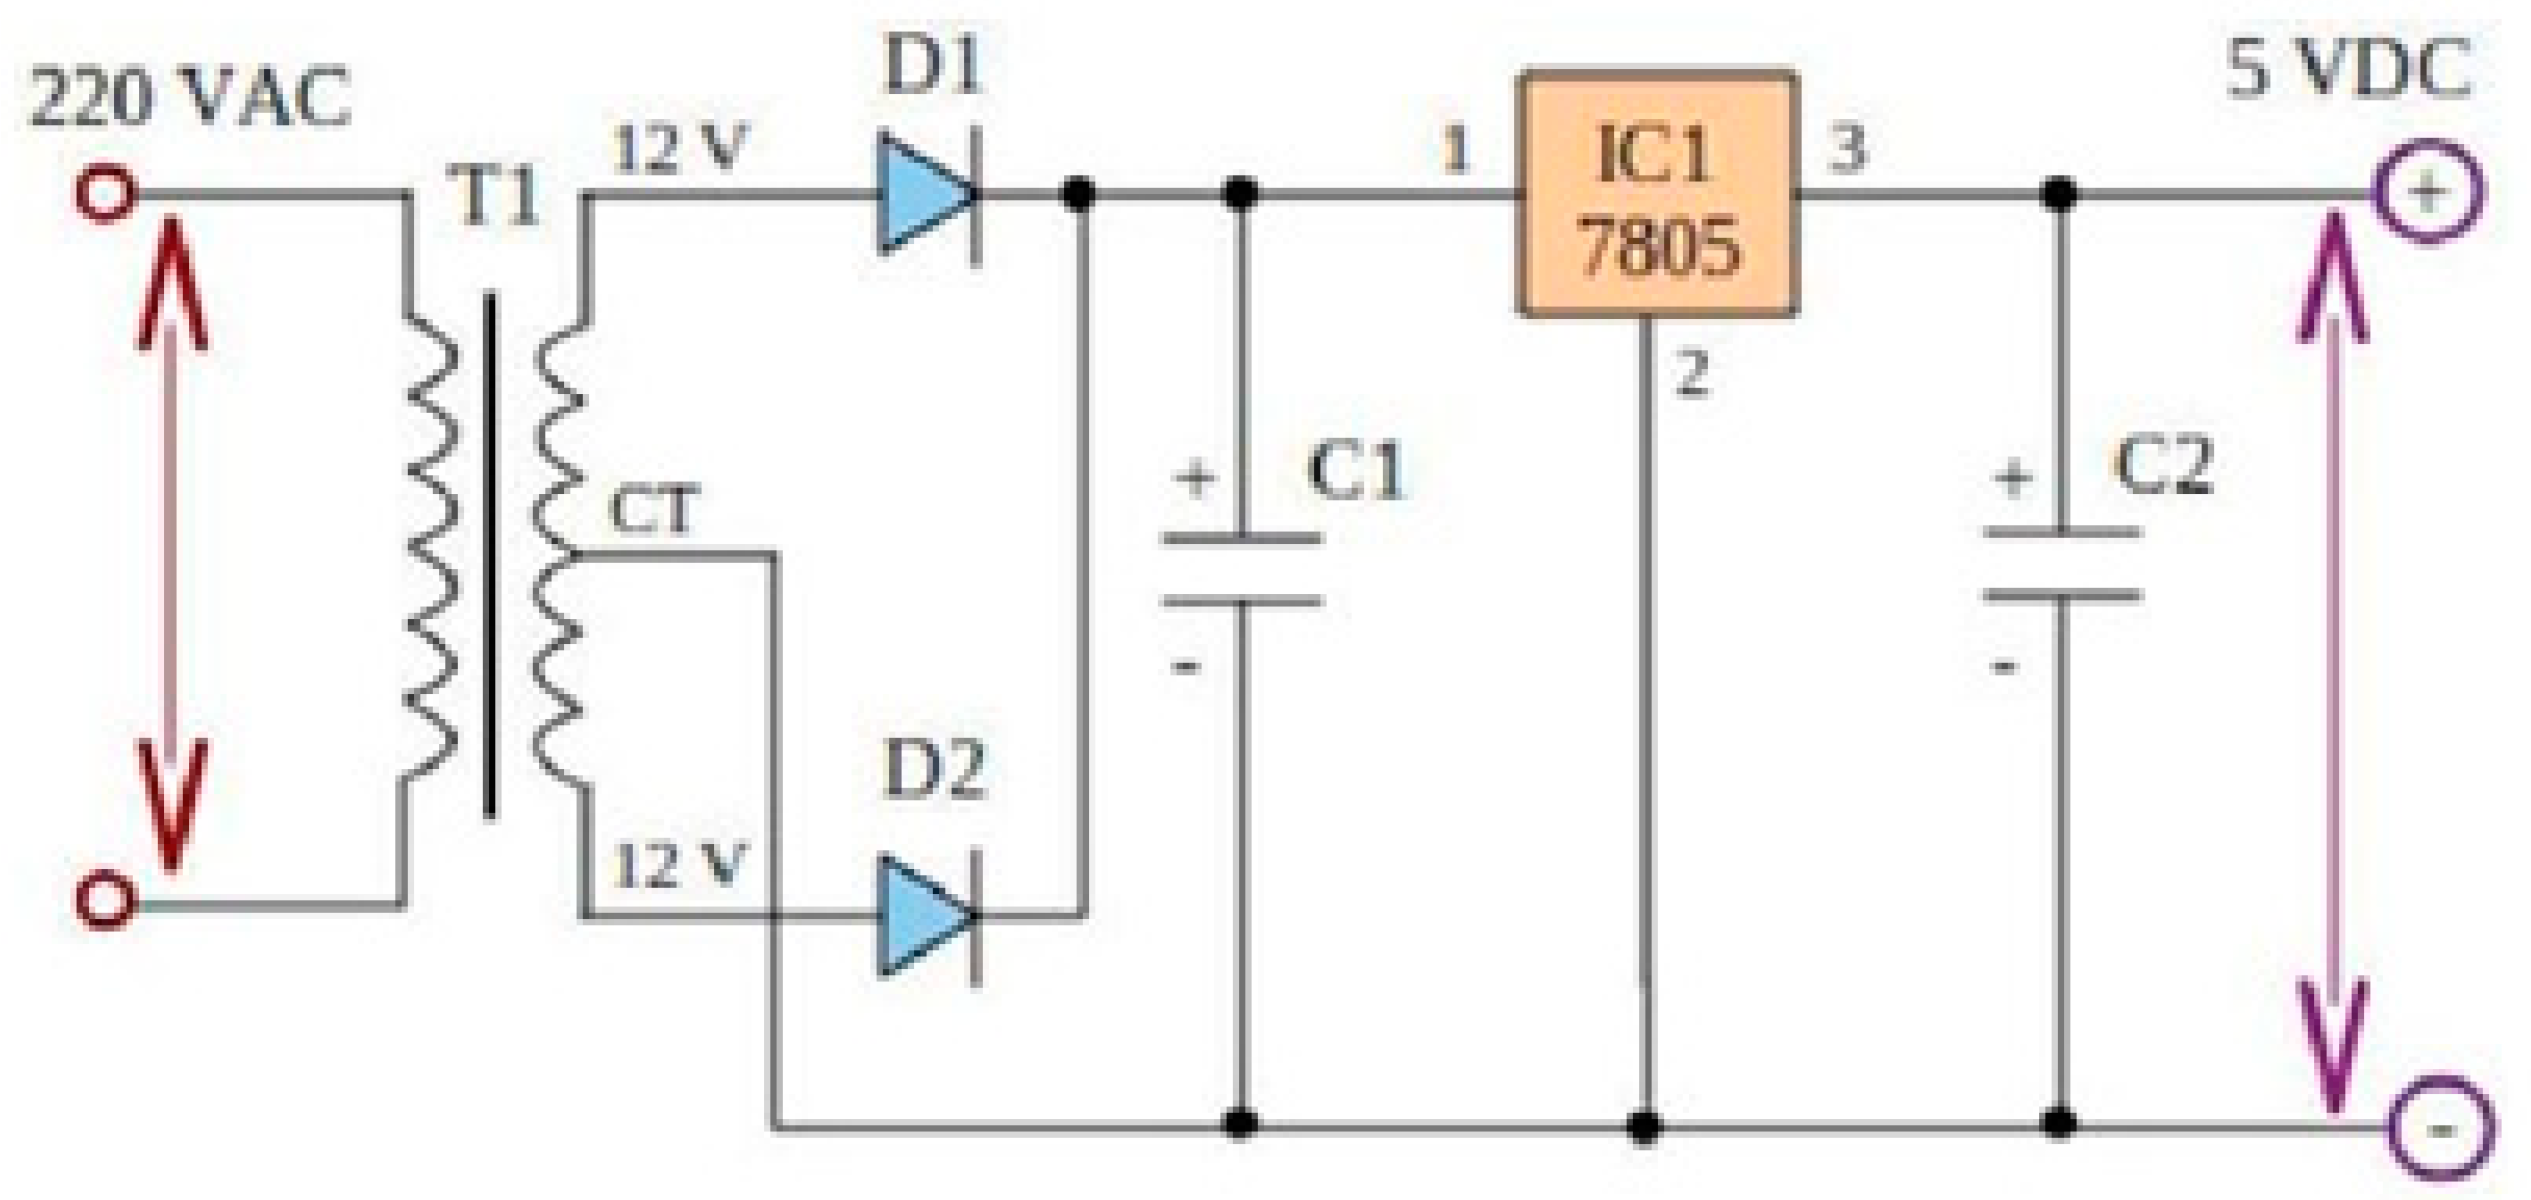
The ESP8266 module’s micro USB connector is directly attached to each component, which uses a 5V voltage supply produced by the adapter.
Figure 9 details the voltage supply circuit. It includes a transformer, a diode, an electrolyte capacitor, and an IC7805 component. While
Figure 10 shows the current consumption monitoring system’s circuit connection layout. The NodeMCU microcontroller’s sophisticated capabilities are utilized by the current flow monitoring component to establish a connection with the internet because the controller is WiFi-equipped. It is possible to establish an advanced connection to the selected web server component through the proper programming of the controller, which enables the correct setup and configuration. The PZEM-004T sensor is the type of sensor used to monitor current consumption.
The PZEM-004T module’s features include
The amount of electricity consumed;
A serial interface with a 9600 bps UART;
The 5 V supply voltage;
An LCD or LED screen may be connected.
The following are the PZEM-004T module parameters specifications taken from the datasheet:
80–260 VAC for working voltage;
80–260 VAC for testing;
Power rating: 100 A/2 2000 W;
An operating range of 45 to 65 Hz.;
An accuracy of measurement of 1.0
The software comprises a web server utilizing the PHP programming language, the sublime editor application, and the ESP 8266 NodeMCU module using the Arduino IDE application.
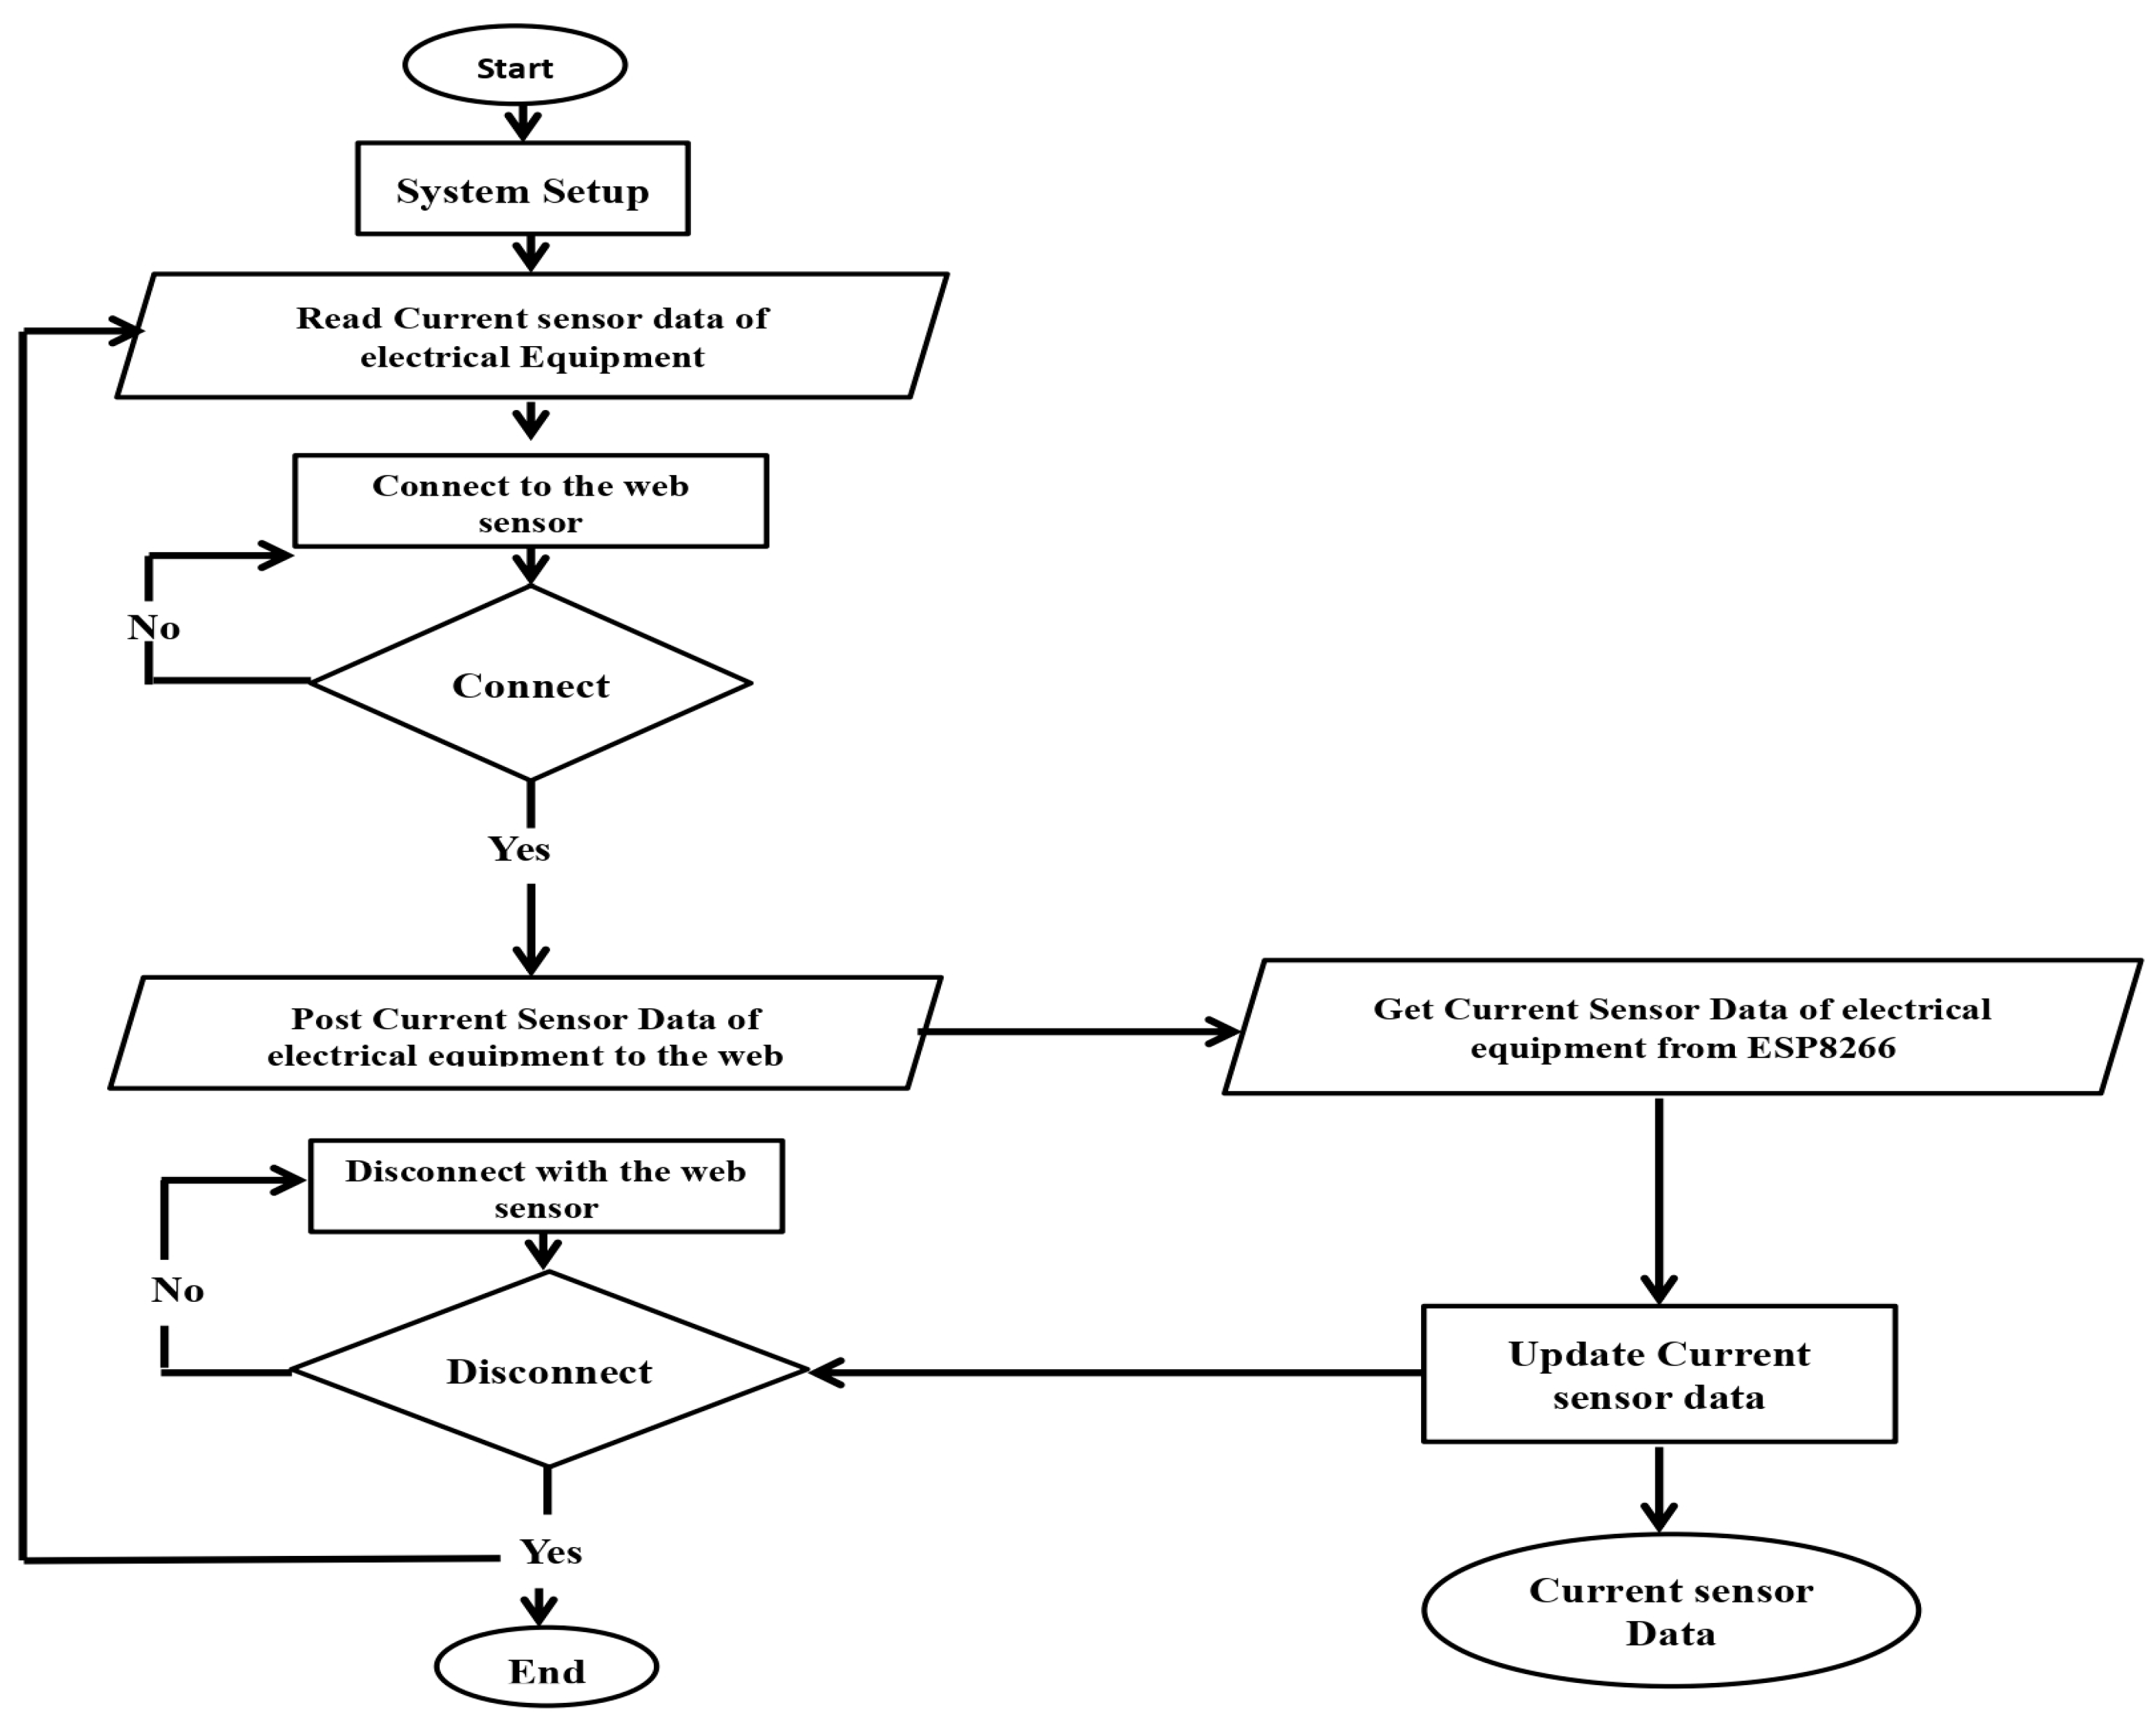
Figure 11 graphically illustrates the computational algorithms of the entire electrical power consumption monitoring system (as shown in
Figure 9) that are coded at both the sensor node terminal and the server part. The microcontroller will next establish connections to the web server and Wi-Fi that were configured during the system setup stage. The microcontroller will keep scanning until it ultimately connects to the web server if it is not yet connected to the web server. The microcontroller first establishes a connection with the web server, and after that, it sends the data to the web server, which then receives it and stores it in the database. Esp separates from the web server.
These PHP files are part of the Sublime Text design software: connection.php, index.php, reset.php, ACS712.cpp, and get10lastdata.php. The WebServer and NodeMCU ESP8266 hardware are connected through the connection.php layer. Any information retrieved from the PZEM- 004T current sensor will be shown graphically on the website. This layer in index.php is responsible for designing the website’s front and back ends. To calibrate the data displayed on the website, Reset.php serves as a reset button. The get10lastdata.php function on the website displays the most recent 10 data from the current sensor reading in graphical formats.
While a website is being developed, the XAMPP application program serves as a local server to manage various kinds of website data. In actual usage, the term “offline website” refers to a website that is not connected to the internet and uses XAMPP to test the functionality of features or show information. Similar to web hosting, XAMPP operates offline.
4. Experimental Tests
Three different scenarios were used in this study’s system testing, which involved documenting the current and power usage of the appropriate electronic items that were installed and used at home. The light bulb, rice cooker, and dispenser make up the load of electrical appliances. The following steps are described for whole system testing.
Placing each component in its proper place;
Connecting the ESP 8266 controller module to a 5 V DC power source;
Attaching a voltage source to the load;
Connecting the laptop to the internet network and the ESP 8266 module;
Launching a browser;
Clicking the button to upload the image to the website.
From
Figure 12,
Figure 13 and
Figure 14, the outcomes of the suggested electric current consumption monitoring system are displayed. With a reference voltage of 220 volts, the loads being used include a 40 watt light bulb, a 350 watt rice cooker, and a 395 watt dispenser.
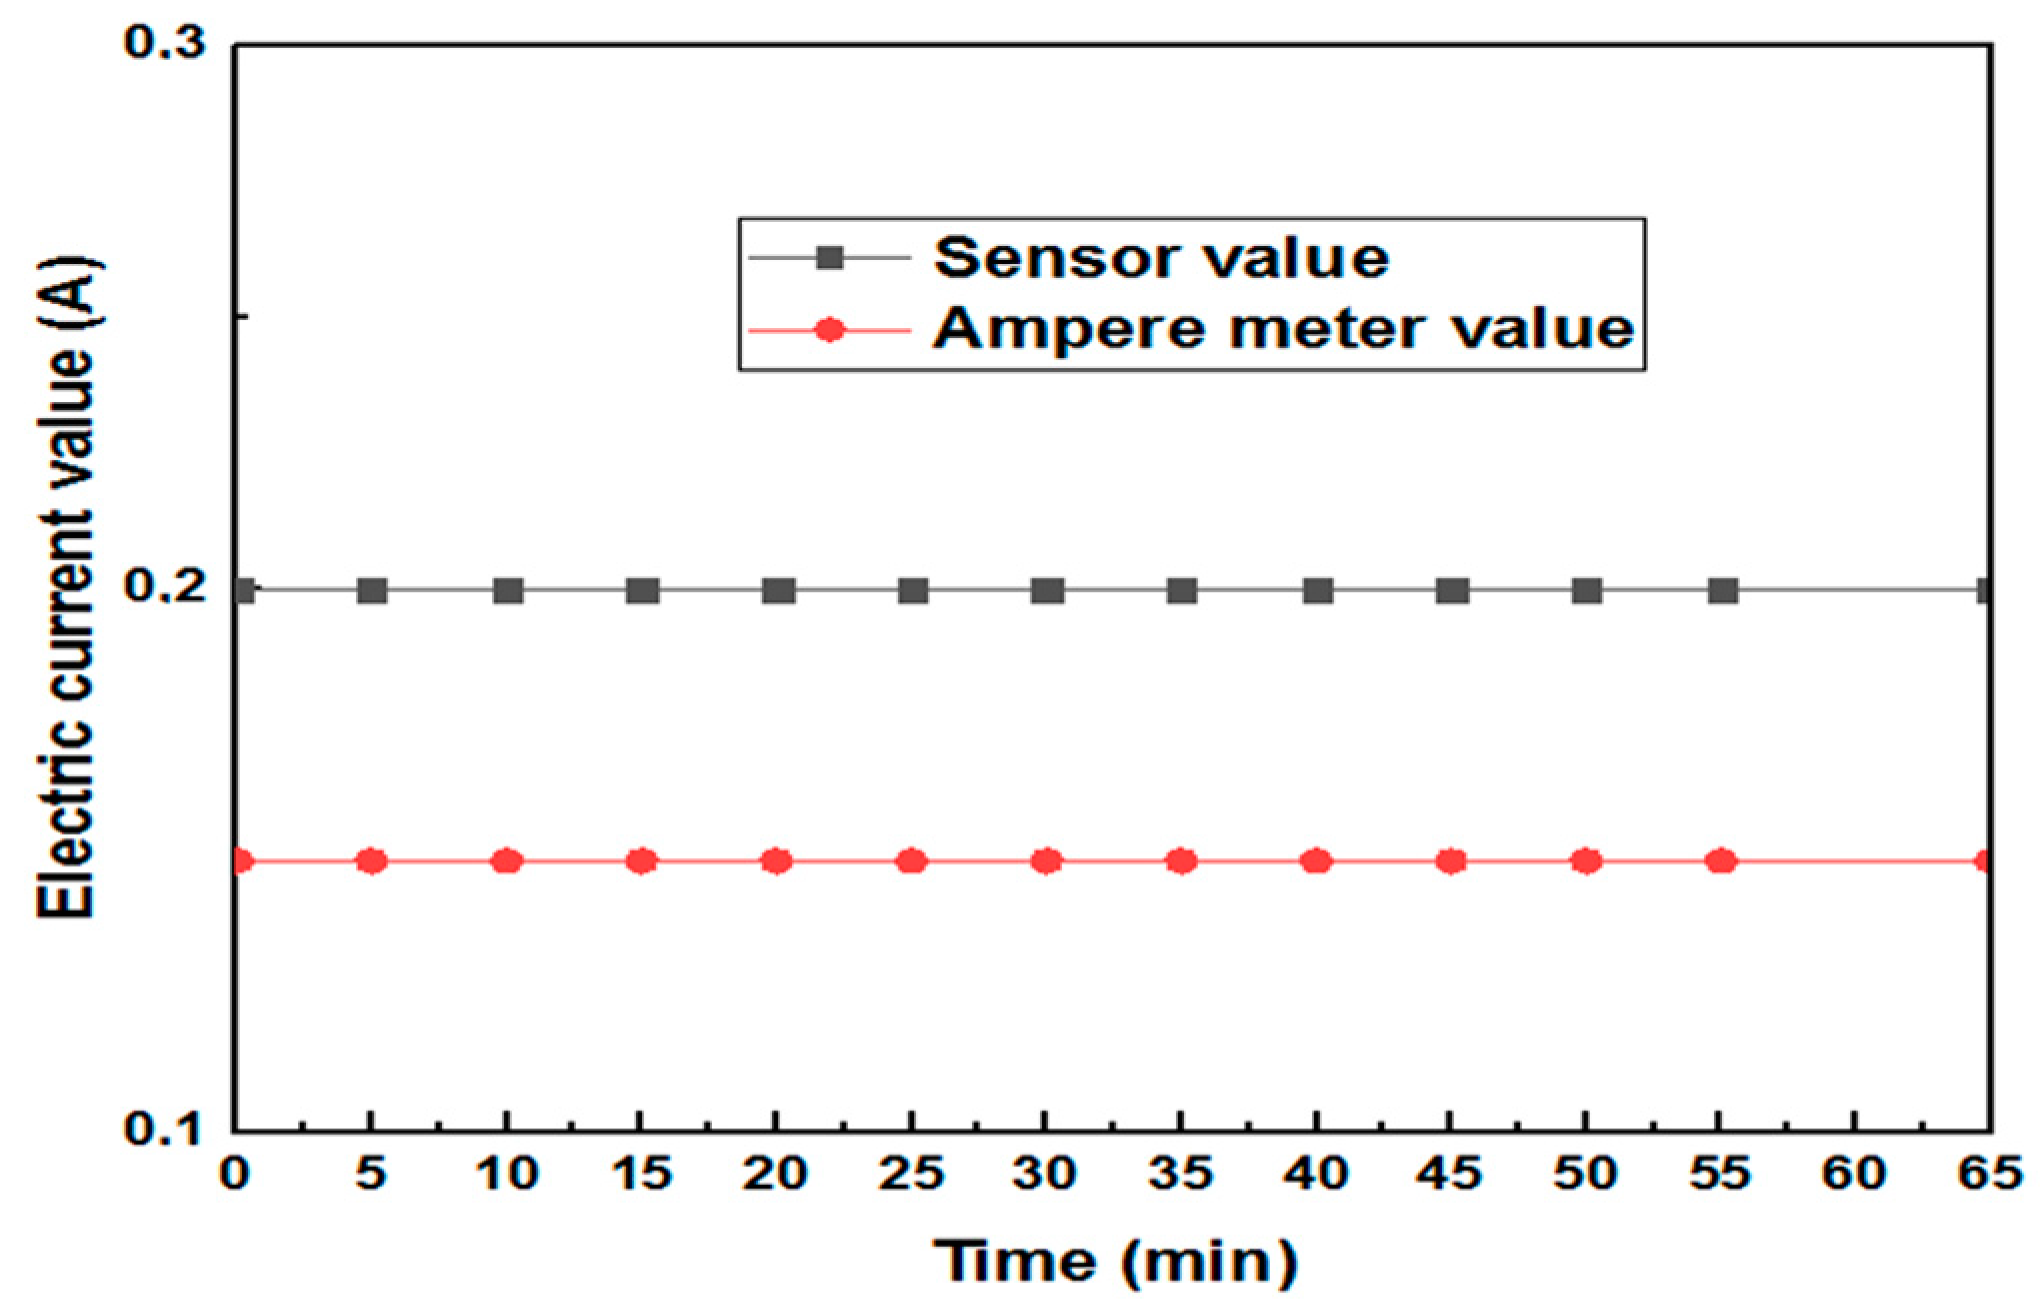
Figure 12 displays the findings from a 60 min measurement of the electric current consumption of a light bulb using an ampere meter and sensor. The average reading from the ampere meter is 0.16 amps, whereas the average reading from the sensor is 0.2 amps. The used light bulb’s theoretical electric current value is 0.18 A. The sensor is 0.5% and the ampere meter’s measuring inaccuracy is 22%.
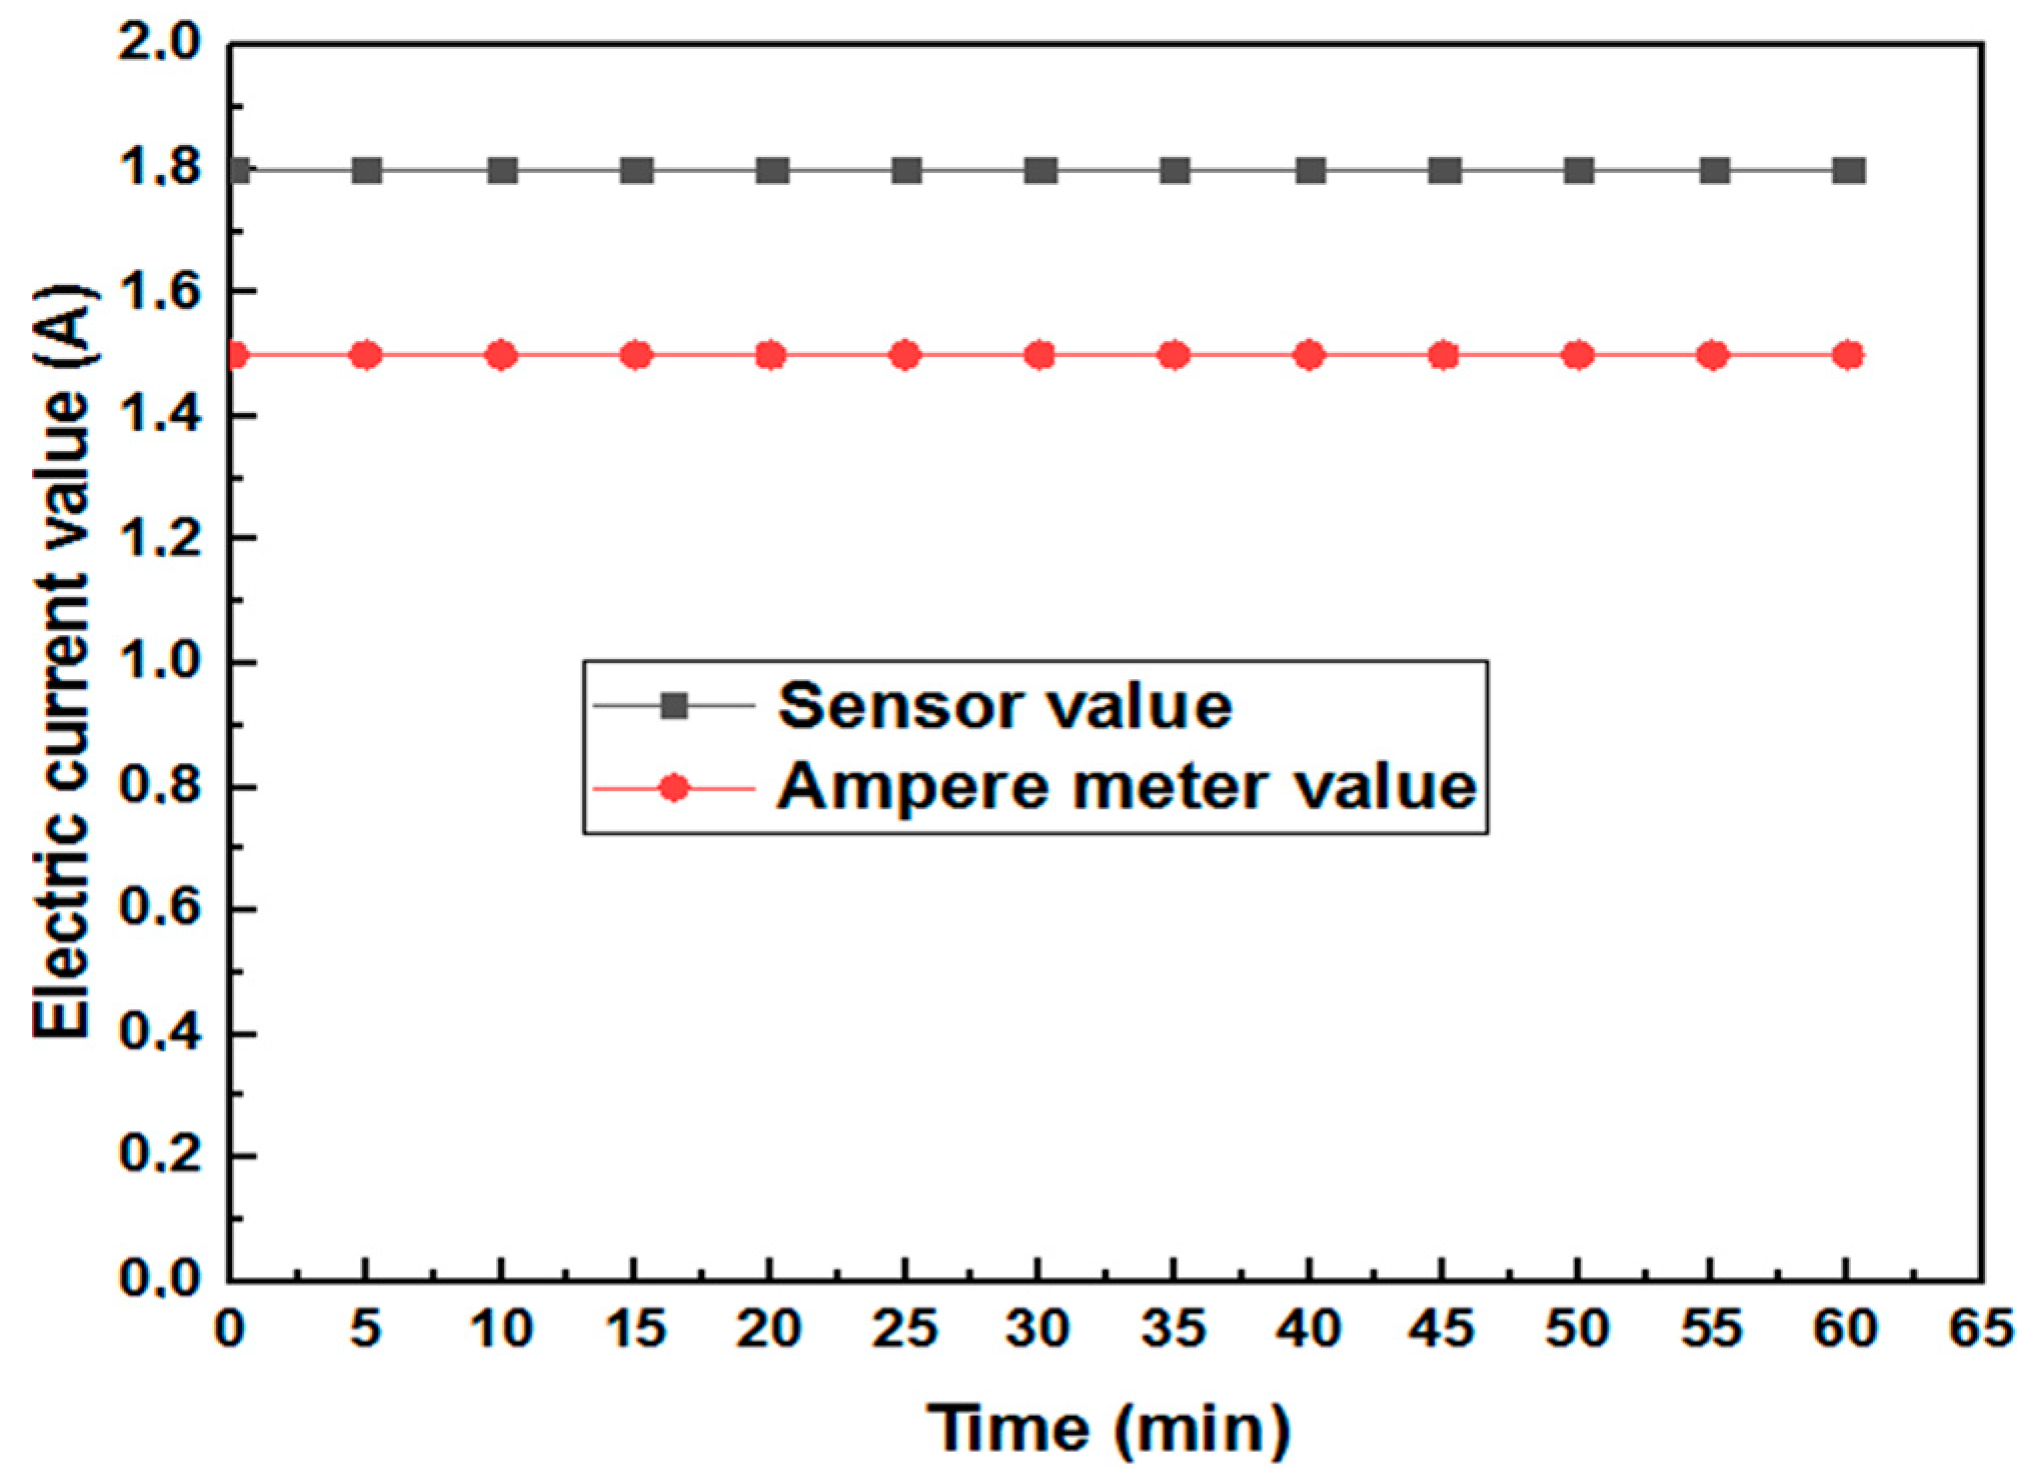
The ampere meter is 1.48 A, while the average reading from the sensor is 1.78 A. The used light bulb has a theoretical electric current value of 1.79 A. The sensor is 0 and the measuring inaccuracy of the ampere meter is 16%.
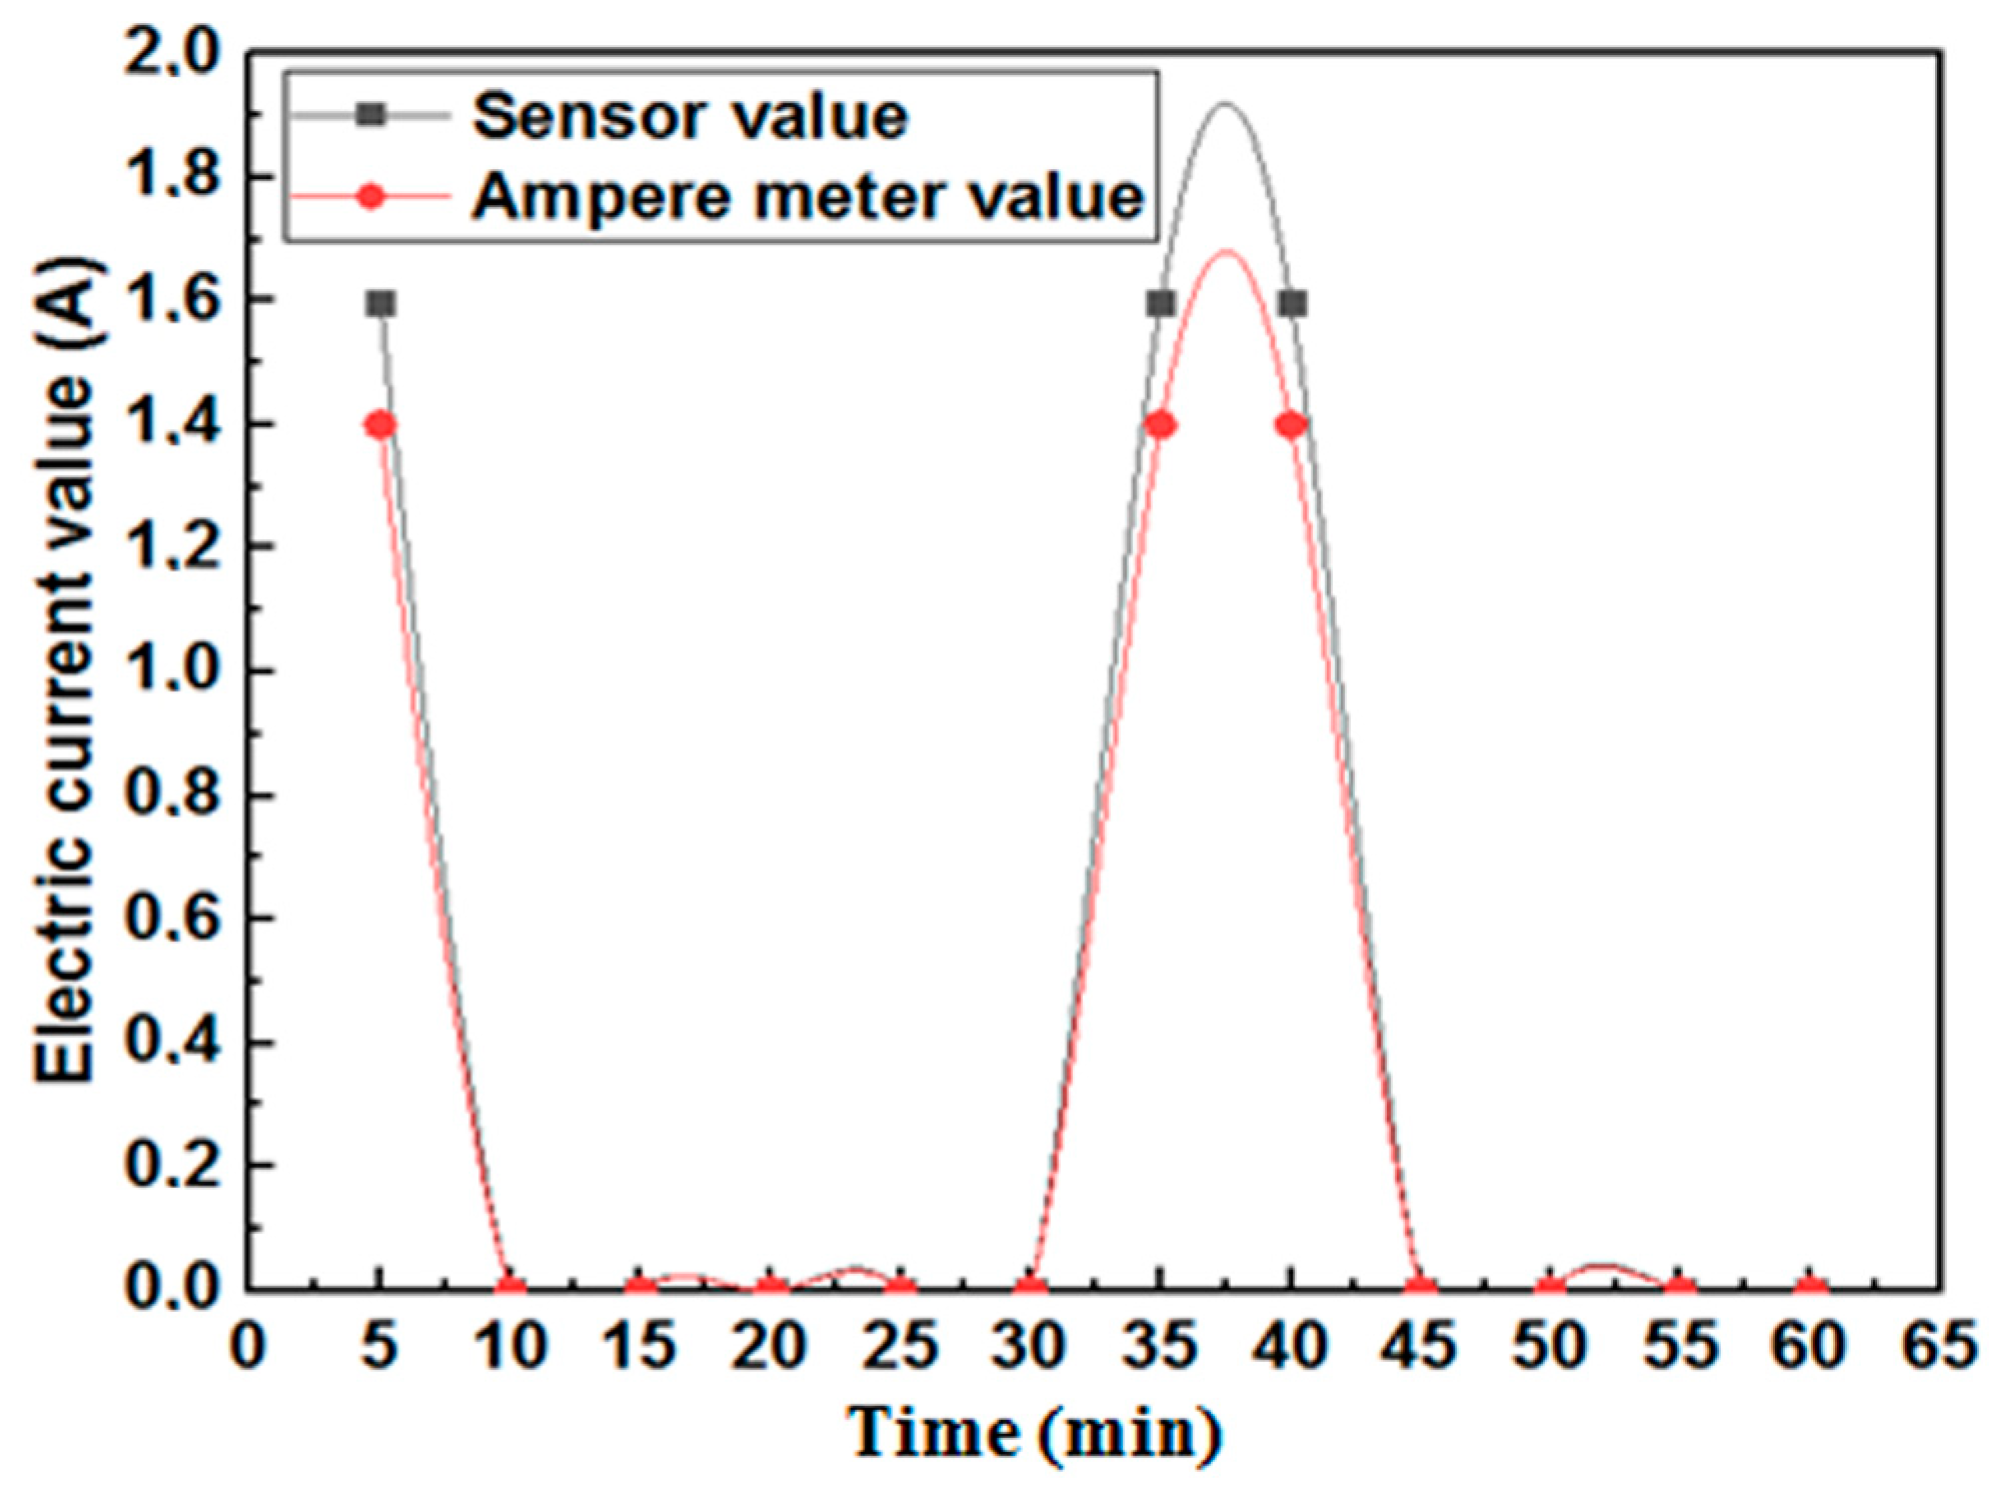
Figure 14 displays the findings of a 60 min measurement of the dispenser’s electric current usage using an ampere meter and sensor. The average reading from the ampere meter is 1.37 A, while the average reading from the sensor is 1.593 A. The sensor is 0.6% and the ampere meter measuring error is 13%.
Based on these findings, the PZEM-004T sensor’s ability to detect electric current consumption has an accuracy rate of more than 90%, making the results of monitoring energy consumption more comparable to those of measurements made using a power meter.
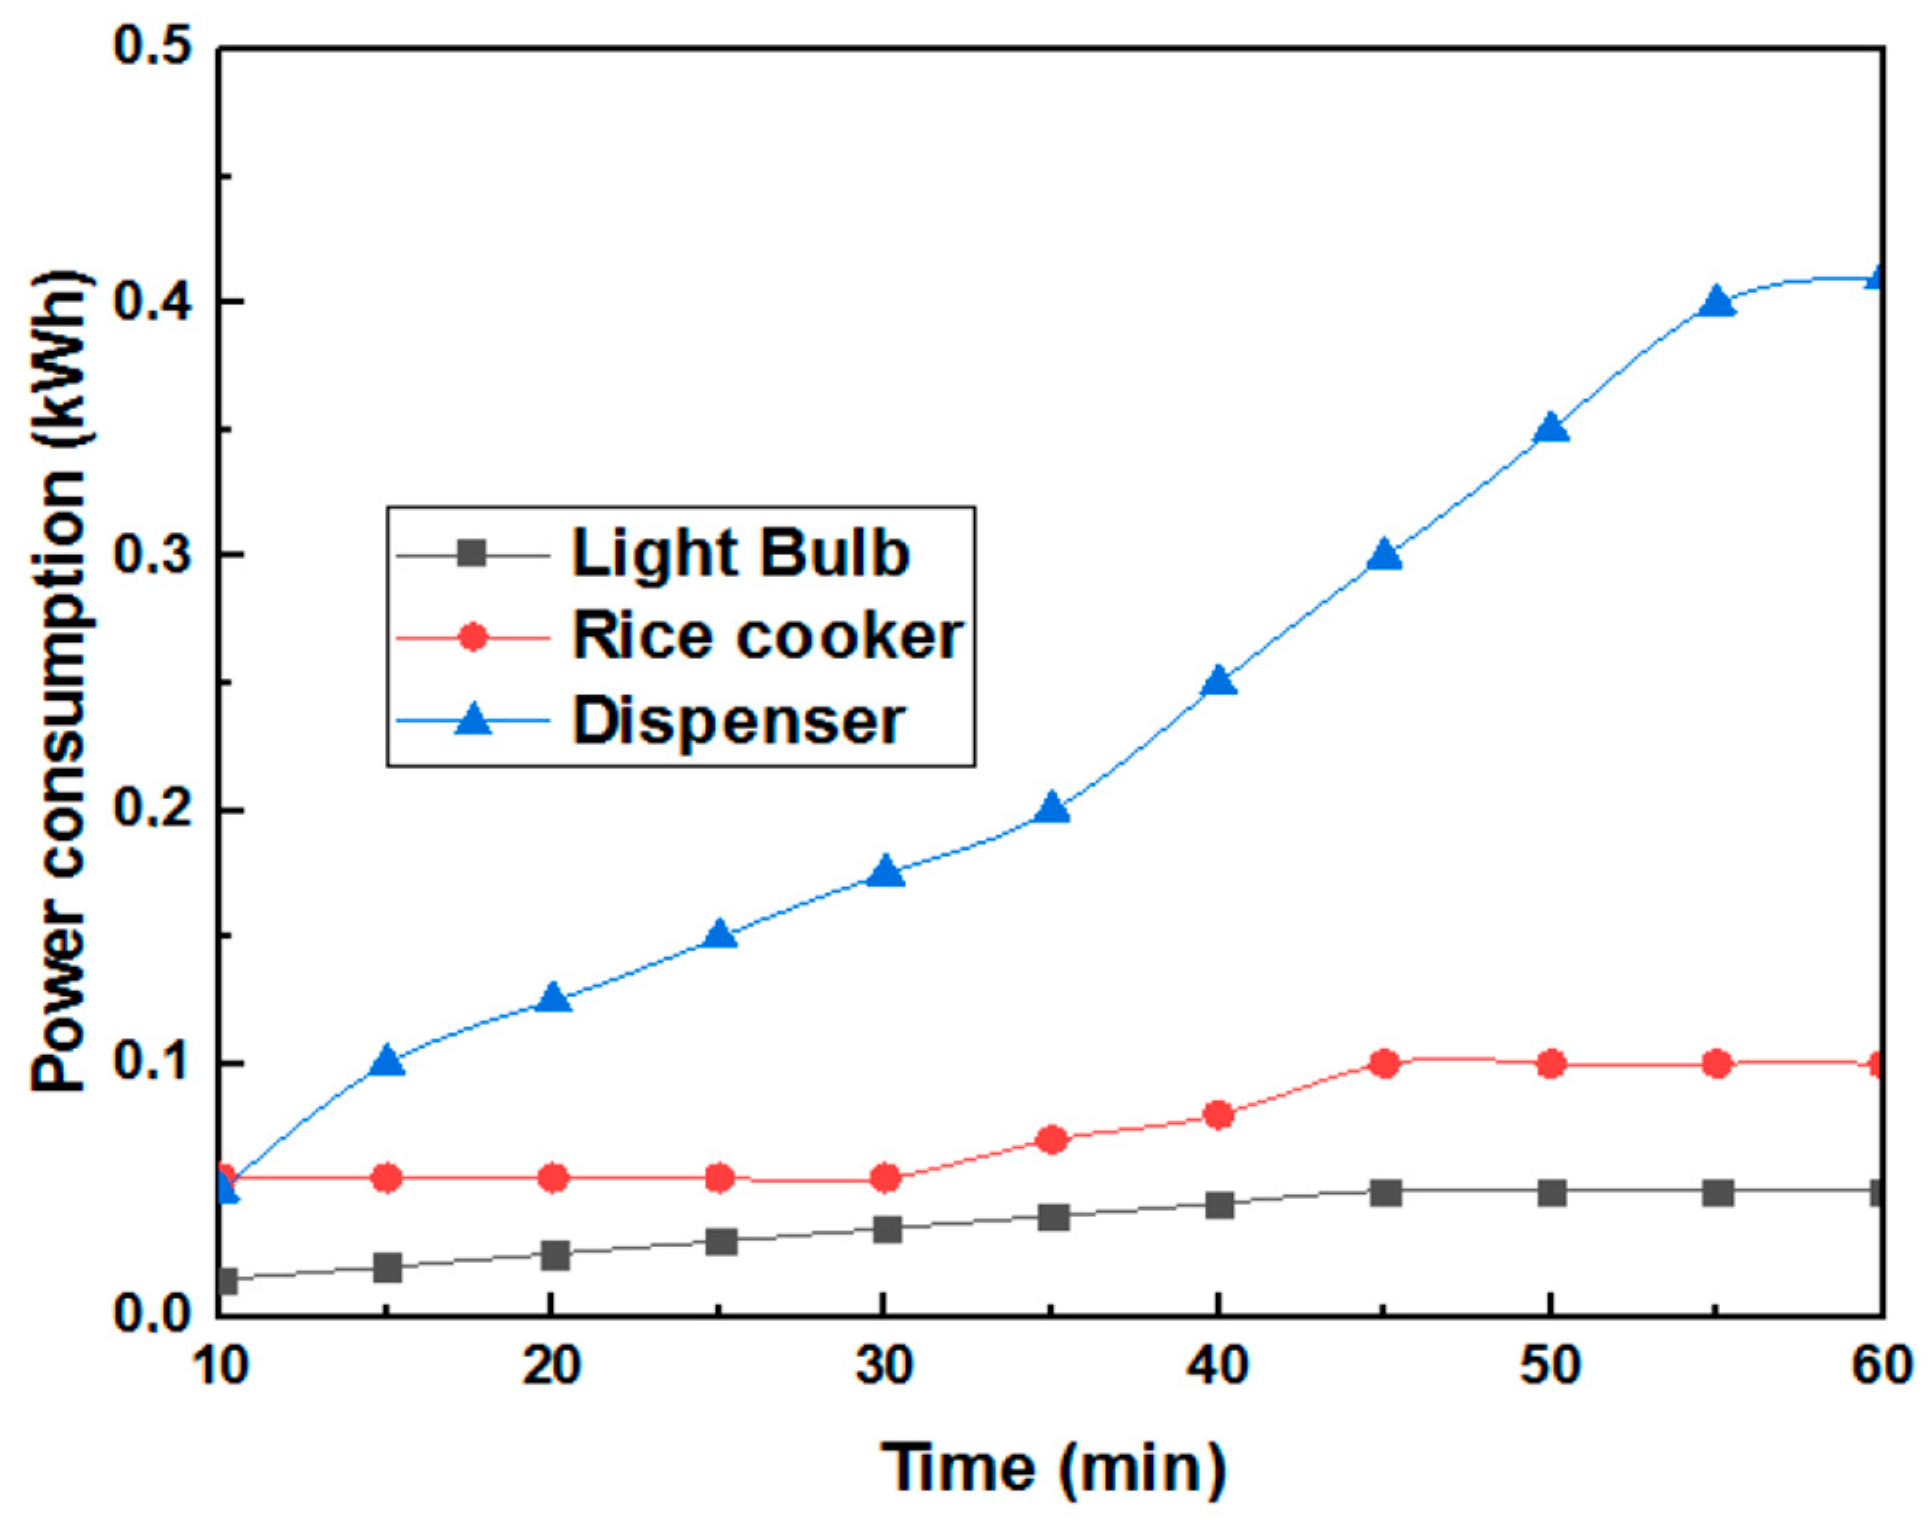
Lamps, rice cookers, and dispensers are just a few examples of the electrical equipment whose power usage is shown in
Figure 15. The findings of the test, which was run for 60 min, indicated that the energy consumption of a light bulb was close to 0.41 kWh. In the meantime, the energy usage of the dispenser is 0.779 kWh, while that of the rice cooker is 0.389 kWh.
Based on
Figure 12, the PZEM-004T sensor’s reading of the load represented by the light bulb yielded an average error percentage of 0.5%. By boiling water that is placed in the rice cooker’s container, the load of the rice cooker is measured. The rice cooker load’s measurement error for current is 0.7%. In contrast, it can be observed in
Figure 14 that the current value reads 0 A from the 10th to the 30th minute, and from the 45th to the 60th minute. This is because the dispenser stops heating at that precise moment, using no electrical load. This measurement has a 0.6% margin of error.
5. Conclusions
In order to lower the price of the receiver assembly and increase long-term durability, a micro-concentrator system based on a ball lens as a secondary optical element is introduced and examined in this technique. A concentrator with a geometrical concentration ratio of 100, a PMMA Fresnel lens as the primary optical element, and a ball lens as the secondary optical element was the subject of theoretical analysis and investigation. The module described in this work is small, optically efficient, and has a uniform flux distribution across the cell surface. Our device has a simulated acceptance angle of 1.5° and an optical efficiency of roughly 83%. The mechanical tolerances were also carried out in order to retain the ideal optical alignment between the solar cells and the optics due to the system dimensions and solar cell being reduced to sub-millimeters. The proposed system accepts about 6% of flux losses for a 0.6 degree angle error between the POE, SOE, and optical axis and a 0.1 mm lateral shift.
To control and monitor the electricity generated, this study created and presented an intelligent monitoring and control system for home appliances based on the Internet of Things. The approach and procedures were devised with the intention of offering an important and useful answer for a monitoring and control system. The proposed system was more effective in measuring and keeping track of current, voltage, and power usage. In fact, the PZEM-004T sensor’s proposed design took into account the hardware choices for the WiFi module, current sensors, and 5 V relays. Wherever the data are kept in the cloud database, they are also monitored in real time and over time. Customers may more easily observe real-time consumption rates thanks to the monitoring system. The control system for the PZEM-004T sensor can ensure safety, monitor home appliances individually or collectively, and raise awareness of electricity use.
Future research will monitor voltage and current on a bigger scale in the context of smart homes.


 ,
, 


