Abstract
The theory of the optimal formation of coherent and incoherent images is developed using the foundations of the statistical theory of optimization of radio engineering information-measuring systems. The main operations necessary for synthesizing optimal methods of spatio-temporal processing of functionally deterministic signals in on-board radio imaging radars with antenna arrays are shown. Models of radio engineering signals and noise have been developed. The statistical and correlation characteristics of spatio-temporal signals and noises in the area of their observation by antenna systems have been investigated. The technique for estimating the limiting errors of the measured characteristics of the studying media is presented. Using the developed theory, a new method for high-resolution radar imaging of the surface from a wide swath was obtained. This method has a new optimal observation mode combining the advantages of several terrain observation modes and fully complies with modern trends in the creation of cognitive radars with the possibility of restructuring the antenna pattern in space and adaptive receiving of reflected signals. The principles of construction and algorithmic support of high-precision airborne radars with an extended observation area are formulated. The effectiveness of the obtained results is investigated by simulation, taking into account the phenomenological approach to the description of electromagnetic fields and coherent images.
1. Introduction
One of the strategic ways of developing national economic complexes of many countries is space exploration of the Earth and near-Earth space, as well as the planets of the solar system. In particular, the primary method is the creation of aircraft and satellite radio engineering means of remote sensing.
Recently, more attention has been paid to the use of aerospace-based radio equipment for solving problems of monitoring the environment and its ecological protection, namely the development of means for monitoring the state of the Earth’s surface and its atmosphere and the degree of pollution, as well as estimates of parameters and statistical characteristics, and the development of means for collecting and transmitting information about the ecological state of the seas, oceans, agricultural lands, and ice cover of the Arctic and Antarctic.
In connection with the extreme importance of solving these problems at the present stage of the development of society, the principles of building such radio-technical means and their functioning are becoming increasingly common in practice and require new methods, devices, and systems for signal processing, especially spatio-temporal ones.
It should be noted that over the past two decades, the element base of radar devices has been significantly improved and new technical solutions have been developed for the construction of antenna arrays, optical sensors, amplifiers, high-speed digital processors, and FPGAs. This technical breakthrough has led to an increase in the spatial resolution and information content of coherent images. At the same time, analysis of existing aero-space synthetic aperture radars (SARs) shows that the existing systems have reached a certain limit in accuracy, spatial resolution, and the rate of the formation of global coherent images, which cannot be overcome. This is primarily due to the almost absent fundamental theoretical study of the operation of modern multichannel and multi-view airborne radars using the theory of end-to-end optimization of signal processing and structural synthesis of methods, devices, and systems. Such methods should be based on the existing achievements of the statistical theory of optimization of signal processing in measuring systems presented in the works of Falkovich S. E. [1,2,3,4], Tikhonov V. I. [5,6], Bakut P.A. [7], Amiantov I.M. [8], Kotelnikov V.A. [9], Gutkin L.S. [10], Levin B.R. [11], Van Tries G. [12], Middleton D. [13], Shirman Ya.D. [14], and others [15,16,17,18], as well as in the results of the statistical synthesis of coherent and incoherent images in SAR, specified in the works of Kondratenkov G.S. [19], Reutov A.P. [20], Karavaev V.V. [21], Sazonov V.V. [21], Antipov V.N. [22], Volosyuk V.K. [23], Moreira A. [24], Krieger G. [25], Reigber A. [26], and Charvat G.L. [27] et al.
The works and achievements of scientists in [1,2,3,4,5,6,7,8,9,10,11,12,13,14,15,16,17,18,19,20,21,22,23,24,25,26,27] cannot be directly applied to the processing of functionally deterministic signals in multichannel aerospace imaging radar systems. This is due to the following features: theoretical and implementation foundations of the spatio-temporal processing of signals by spatially distributed and multi-position systems, in particular, by antenna arrays, which are based on the theory of optimal statistical solutions and estimates of the parameters of probability distributions, are reflected in works [1,2,3,4,5,6,7,8,9,10,11,12,13,14]. To a greater extent, in these works, the results were obtained for stationary ground-based spatially distributed systems and antenna arrays; however, it is advisable to use the methodologies for their development and research in some aspects of their synthesis for the statistical synthesis of mobile airborne radars with aerospace-based antenna arrays in the state of their motion with extremely complex sets of Doppler frequency shifts that are absent in motionless systems when building images of motionless objects.
The works of Kraus J. D. [15], Tseitlin N.M. [16], Thompson A.R. [17], Van Schonveld K. [18] should also be noted because they consider the design of aperture synthesis radio astronomy systems in spatially distributed antenna systems and antenna arrays. However, the systems under consideration are also terrestrial and passive systems for receiving stochastic self-radiation signals of objects of study, the principles of aperture synthesis and imaging, in which they radically differ from the principles of imaging by active radars in aerospace-based antenna arrays.
In the basic works of [19,20,21,22,23,24,25,26,27], methods for synthesizing apertures in mobile airborne systems are considered to a greater extent in relation to the use of single longitudinal fuselage airborne antenna systems, which do not allow for optimizing processing in airborne phased antenna arrays and realizing multiview surface studies. The possibilities of using antenna arrays are considered mainly for solving specific problems of holographic studies of the atmosphere, subsurface sounding, and mapping of surface relief heights, not for improving the quality and information content of images. At the same time, the obtained results can be used to confirm the reliability of the synthesized methods, algorithms, and structures developed in this dissertation by analyzing special cases while simplifying the problem formulations.
Problem statement. From the analysis of the modern airborne radars and the existing separated theoretical foundations of statistical synthesis comes the following contradiction: on the one hand, technical breakthrough of radar components and units is enough for implementing a new method of rapid high resolution surface imaging. On the other hand, theoretical foundations of statistical synthesis of new methods of signals processing, taking into account multichannel, multi-view, and airborne or spaceborne reception, are absent. It is necessary to develop a new statistical theory of optimal processing of functionally deterministic signals, taking into account their multichannel reception while multi-view observation is made from the moving platforms.
2. Materials and Methods
The development of the statistical theory for the synthesis of new signal processing methods will be based on the maximum likelihood method. The peculiarity of the application of this method in this article is the construction of functionals rather than likelihood functions, which is due to the estimation of spatial functions in the form of coherent radar images of the surface, rather than unit parameters.
2.1. Models of Signals, Noises, and Observation Equation
For the development of the statistical theory of optimal functionally deterministic signals processing, it is necessary, firstly, to determine the models of the probing signal, the received signals by each element of the antenna array, the model of the relationship of the estimated parameters with the received signals, and the models of internal noise and observation equations, which are subject to optimal processing.
The probing signal has the following form:
where is the envelope of the probing signal, is the complex envelope, taking into account some initial phase, , is the central frequency of the spectrum of the probing signal, is the angular frequency, and is the time. characterizes a wide class of radio signals, both simple and complex, with internally pulsed modulation.
The probing signal propagates, reaches the observation area with coordinates , and is scattered on its inhomogeneities. Scattered signals in the registration area can be determined coherently, taking into account the fundamentals of the diffraction theory [28], Kirchhoff’s integral theorem, Kirchhoff–Helmholtz integral theorem [29], Rayleigh–Sommerfeld theory [30], and Stratton–Chu formulas [31,32]. From the analysis of these theories, it follows that these fundamentals are sophisticated and gives close results. It is reasonable to use a phenomenological description of the electromagnetic field. On the one hand, it will give a general and understandable description of electromagnetic field calculation, and on the other hand it has a clear mathematical description. Mathematically, the essence of the phenomenological approach can be explained by the form of the received spatio-temporal signal by the multichannel receiving area:
where is the general expression for the Kirchhoff–Helmholtz integral theorem:
The Rayleigh–Sommerfeld theory:
calculations of Rytov S. M., Kravtsov Yu. A. and Tatarskiy V. I. [33]:
is the electromagnetic field, is the outer normal to the surface, is the wavenumber, is the imaginary unit,
is the unit signal depending on time delay , amplitude-phase distribution of receiving area , and attenuation of electromagnetic waves , are the coordinates of the multichannel receiving area.
Function is the complex scattering coefficient of the surface element and is the specific complex scattering coefficient [23]. This coefficient takes into account the amplitude and phase structure of the field. we call a true coherent image of the medium. Such images are widely used in remote sensing problems [23,34,35].
The received signals are always observed against the background of the internal noise of the receiver , which is approximated by white Gaussian processes with a correlation function:
The spectral noise density in each element of the AR is usually the same, i.e., .
The observation equation is stated as an additive mixture of reflected useful signals and delta correlated noises:
Equation (8) will be processed optimally in the information-measuring systems.
2.2. Basic Principles of the Theory
The optimal spatio-temporal signal processing observed in multi-channel radars against the background of internal noise of the receivers will be performed using modern advances in theory, namely on the basis of the criterion of the maximum likelihood function. The essence of this criterion is to find a parameter that maximizes the likelihood functional , the conditional probability density functional of a random process at a fixed value of the parameter , which is a function of spatial coordinates . Instead of a functional , its logarithm is more often maximized. To find the optimal estimates of the parameter , it is necessary to solve a system of equations:
where is the symbol of the variational (functional) derivative, which is taken at the point of the true value of the parameter .
For the specified equation of observation (9), the likelihood functional has the following form:
where is the coefficient that does not depend on the parameter and is the observation time.
The marginal errors of the estimation of several parameters are obtained by calculating the trace of the operator inverse to the Fisher operator :
where is the matrix trace symbol.
We find the elements of the operator by calculating the second mixed variational derivatives of the logarithm of the likelihood functional:
where is the sign of statistical averaging.
In the case of estimating one parameter, expression (11) has the following form:
where is the symbol of the secondary variational derivative.
Investigation of the marginal errors in the estimation of the parameters of natural environments in remote sensing problems is of great importance for the optimal choice of the conditions for carrying out measurements and the corresponding experiments [36,37,38,39]. This concerns the choice of frequency ranges, directions of irradiation and directions of reception of scattered radiation from the investigated medium, the choice of polarization, etc. Analysis of these errors allows us to choose such conditions for measurements, in which the expected real measurement errors will be minimal.
3. Results
Using the developed theory, a new method for high-resolution radar imaging of the surface from an aerial vehicle is obtained.
3.1. Problem Geometry and Received Signal Model
The geometry of the surface sensing from the aircraft is shown in the Figure 1. The aircraft moves with a constant speed at a height parallel to the axis . The parameters and are known. The registration area is a rectangular planar antenna array with coordinates . It is supposed that the transmitting signal is radiated in a wide band of angles. To implement such a mode, it is possible to use a small area of antenna array (several elements) around the antenna phase center.

Figure 1.
Geometry of surface sensing.
For the stated problem, the unit signal has the following form:
where , is the speed of light and is the vector of direction cosines that change in time in proportion to the motion of the aircraft. Angles and are shown in Figure 1.
Distance can be described mathematically as follows:
where is the initial time of signal processing and is the initial distance from phase center of the antenna array to chosen surface point .
Revealing in the exponents in Expression (14), a number of practically justified approximations can be performed. Firstly, in the practice of radar measurements, it is almost impossible to determine the phase delay with an accuracy of wavelength when the signal passes a double distance . This is due to the roughness of the surface of the study, the height of which is several (and even hundreds) times greater than the wavelength, multiple reflections of signals in urban areas, random phase rotation of reflected signals from natural vegetation, and other reasons. Therefore, we include the exponent as an unknown quantity in the complex scattering coefficient in Formula (2). Secondly, it is possible to neglect the delay of the envelope signal relative to the phase center of the registration area, as it is much less time . At the same time, this delay cannot be neglected in the multiplier , as it is responsible for the alignment of the phases within the aperture of the receiving plane relative to the phase center during the formation of the directing antenna pattern. Expression (15) is eventually converted to the following form:
Expression (16) describes the reflected signal from each point at each point of the registration area with coordinates , while rectilinear motion of the aircraft has a constant speed .
3.2. Problem Statement
According to the reception of oscillations by each element of the antenna array, which are observed against the background of additive Gaussian noise , it is necessary to optimally estimate the specific complex scattering coefficient of the underlying surface.
3.3. Optimization Problem Solution
The likelihood functional (10) can be written in the following form:
As the desired parameter for estimation is the scattering coefficient , it is necessary to solve the following equation:
The result of the maximum likelihood functional determination is the following inequality:
where
is the complex ambiguity function of the measuring system, which characterizes the resolution of radar by spatial coordinates. It takes into account many factors that affect the quality of the formed coherent images: the type of probing signal, the size of the aperture of the receiving area, the complex distribution of the field in the area, and the time of accumulation of reflected signals.
The resulting form of Equation (19) is not simple. The left part of (19) is the optimal signal processing algorithm, and the right part is the optimal estimation of the coherent image smoothed by the ambiguity function.
Using the method of complex envelopes, the inequality (19) is written as follows:
where is the complex envelope of the observation equation.
If has a form of spatial delta function, it is possible to restore a true coherent image without distortions.
The left parts of Equations (19) and (21):
are called correlation integrals, which contain the basic necessary operations on the received signals. If it is assumed that the unit signals under the signs of the integrals are the impulse characteristics of the optimal filters, then operations (22) are called matched filtering operations.
Substituting (16) with (22), we obtain the optimal output effect in a mobile radar system with a planar registration area:
3.4. Physical Interpretation of the Optimal Method
The essence of processing the received field according to (23) is as follows: firstly, the antenna is focused on each point of the underlying surface . To do this, the signals received by each point of the coordinate region are delayed for a time and coherently summarize with amplitude-phase distribution . The selection of can adjust the shape of the antenna pattern. It should be noted that the delay in each channel at the time is based on the vector of angles . This leads to the formation of a multibeam antenna pattern with the possibility of further processing of the signals in each beam separately. During the movement of the aircraft, at each point in time , the delay time changes so that the maxima of each beam of antenna pattern is always directed to the selected points of the surface. This type of inspection allows us to increase the observation time and expand the range of viewing angles. The next stage of processing is coherent amplitude detection, which can be implemented in series or parallel circuits. The last multiplier reveals the essence of the classical method of antenna aperture synthesis, which consists of the coherent accumulation of reflected signals along the flight path of the aircraft.
The described processing combines two methods of forming a synthesized antenna aperture using a Spot-Light and Multibeam observation mode of the underlying surface. At the same time, it also realizes the benefits of each of them. The obtained method has the highest spatial resolution in azimuth (along the flight path) due to the constant focusing on the selected area of space and covers a significant area of the surface as a result of the formation of a significant number of partial antenna patterns. The principle of the formation of many rays of the antenna pattern, each of which focuses on the selected area of the underlying surface, is followed by coherent processing of the trajectory signal, as shown in Figure 2.
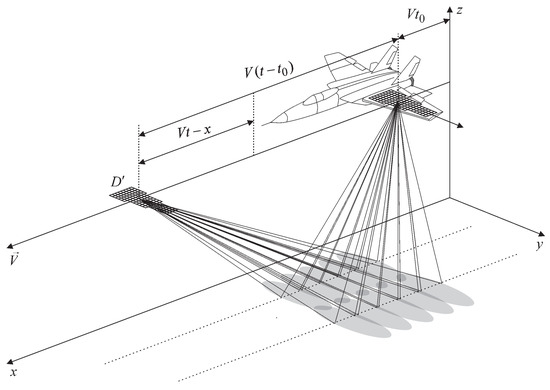
Figure 2.
New mode of high resolution and wide-swath surface sensing.
3.5. Heuristical Modification of the Optimal Method
3.5.1. Multibeam Inspection with a Fixed Fan of Rays
The obtained algorithm (23) assumes the rotation of the antenna pattern when focusing on the selected point of the surface. At the same time, it is possible to develop another algorithm, which consists in the formation of a fixed antenna pattern fan, the accumulation of sections of the trajectory signal in each beam, combining the obtained sections or serial connection of the outputs of the diagram-forming circuit to the receiver, and coordinated processing of the trajectory signal in the form of convolution with reference signal.
The effective width of each individual beam in the fan is determined by the linear dimensions of the antenna (, ) and amplitude-phase distribution . For example, for uniform amplitude distribution and zero phase distribution, the effective width of the antenna pattern at the first zeros along the flight path will be equal to . The step between the partial diagrams must also be equal so that the observation angles of the selected point of the surface “flow” are continuous from one beam to another during the movement of the aircraft.
To obtain the analytical form of the proposed modification of the optimal algorithm, the sampling of the entire observation time () was performed with a step in which the direction of each individual antenna pattern does not change.
The sampling step must be variable because the observation time is determined by the size of the antenna pattern on the surface:
where is the fixed direction of the -th maximum of the antenna pattern and is the width of the antenna pattern in the azimuthal plane.
Taking into account the obtained discrete dimensions of the observation area (24), we write the optimal output effect (23) as follows:
In Expression (25), the functions that are under the integral over the variable are multiplied by a discrete sequence of rectangular pulses of duration . The total number of pulses is equal to the number of the generated partial antenna pattern. These pulses are displaced relative to each other unequally with a variable step . Within the limits , it is assumed that the direction of the maximum of the antenna pattern does not change (i.e., the rotation of the antenna pattern is not performed), and the accumulation of the signal at different angles is due to the expansion of the antenna pattern by the value .
We can also assume that within , the distance . Function
is the voltage at one of the outputs of the diagram-forming circuit antenna array, function
included in the sign of the time integral are rapidly oscillating and cannot be represented by a constant value within the pulses .
3.5.2. Fixed Beam Fan with Coherent Processing at the Output of Each Channel and Coherent Inter-channel Addition
To analyze this modification of the algorithm, rewrite expression (23) as follows:
where
is the output effect in each beam of the antenna pattern.
The essence of algorithm (27) is as follows:
- (1)
- The registration of signals at the outputs of the diagram-forming circuit , coherent detection of amplitudes ;
- (2)
- Division of pulses into intervals that correspond to the observation of one area of the surface by different antenna pattern ;
- (3)
- Convolution of individual trajectory signals in different processing channels with the expected reference signal with duration corresponding to the full time of sequential observation of one area of the surface by all antenna pattern;
- (4)
- Adding the results of the agreed processing to form the final output effect .
The obtained results of spatio-temporal signal processing, according to Algorithms (25) and (27), must be identical.
The proposed modification of the algorithm also requires coherent assembly and accurate phase tracking to obtain the synthesized antenna pattern. At the same time, separate pre-processing of the signals from different outputs of the diagram-forming scheme does not have strict requirements for the overlapping and docking of the antenna pattern, and also allows insignificant shifts in time. That is, there is no need to form one continuous implementation with precise transitions at the joints of the diagrams.
3.5.3. Fixed Beam Fan with Coherent Processing at the Output of Each Channel and Incoherent Inter-channel Addition
If it is not possible to achieve synchronization between signals from individual antenna patterns, i.e., it is not possible from the entire flow of samples to coherently select the desired function , proceed to the algorithm of incoherent averaging of output effects from different channels. For this purpose, it is necessary to limit the intervals of integration in algorithm (27) and to fix a point in each separate beam
According to the obtained analytical expression (29), the convolution will be performed only within the selected area of the antenna pattern and subsequently participate in incoherent averaging with other rays with the index . This algorithm is already known and practically implemented [40,41] and has the same resolution as in single-beam observation, but is characterized by a reduced level of multiplicative interference (speckle noise) in the image due to incoherent averaging.
3.5.4. Fixed Beam Fan with Coherent Signal Processing at the Output of Each Channel, Doppler Frequency Offset Compensation, and Incoherent Inter-channel Addition
The above signal processing algorithms show the basic optimal operations on the received oscillations and do not specify the type of probing signal , the type of its modulation, coding, etc. At the same time, a significant part of the existing SAR use pulse mode have in their processing algorithms contradictions in the choice of pulse repetition frequency: increasing the frequency allows us to increase the resolution of the SAR azimuth, but leads to ambiguous distance measurement. In this case, the algorithm given in (29) on the extreme antenna patterns at significant angles of deviation from the nadir will be difficult to implement in practice. It is more expedient in each of the channels to perform Doppler frequency compensation due to the deviation of the -th antenna pattern by an angle and then perform coordinated processing with a reference signal at a lower frequency. As a result (29) should be presented as follows:
Compensation of the Doppler shift of the frequency of the trajectory signal to the coordinated processing allows each channel to use the same pulse repetition frequency and, in the general case, to reduce its value to achieve unambiguous measurements by range.
3.5.5. Single-Beam SAR
Further simplifications of Expression (30) may lead to known modes of forming coherent images in SAR. Assuming one beam and a set of range channels, we will receive the generalized for the front side, strictly lateral, and back side route mode of SAR
For a strictly lateral review, we obtain the most well-known in practice algorithm
3.6. Marginal Errors of Estimation
The marginal errors of coherent imaging of the surface can be found from the following expression:
Calculating the variational derivative of the second order:
the marginal errors have the following form:
where
is the normalized ambiguity function and is a signal-to-noise ratio.
Analysis of expression (35) in the partial case, when , shows that the marginal errors of measurement are inversely proportional to the value . For the nonstationary case, the marginal errors will be proportional to the value of the averaged inverse uncertainty function over the aperture synthesis interval in the point .
4. Discussion
To discuss the results and how they can be interpreted, a test model of the surface with anthropogenic objects was developed, taking into account the phenomenological approach to the description of the electromagnetic field and coherent images [42,43]. The model of the height profile of the entire observation area is shown in Figure 3a,b. This is a model of some part of the surface, such as an airfield. In this model, we wanted to combine natural surfaces, such as forest, mountains, and fields, and anthropogenic objects. In particular, it was proposed to place a building, a truck, an aircraft on the runway, a group of tanks, and anti-aircraft missile systems, one of which is located in the forest. Height models for anthropogenic objects are shown in Figure 3c–h.
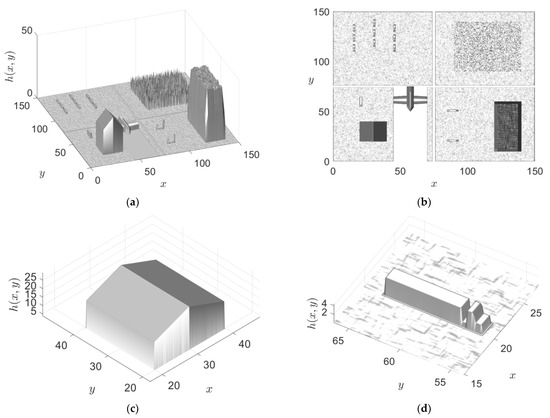
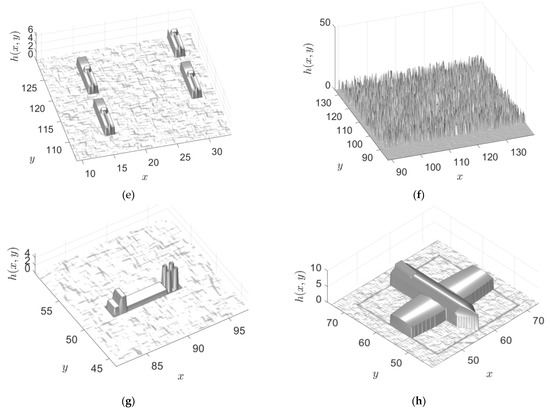
Figure 3.
Altitude profile of the simulation model: (a) the model of the entire observation area, (b) the top projection, (c) the model of the building, (d) the model of the tractor with trailer, (e) the model of tanks, (f) the model of the forest, (g) the model of anti-aircraft missile system, (h) the model aircraft.
The radar cross section of the whole area and the actual part of the complex scattering coefficient for each point of the observation area is shown in Figure 4. The amplitudes of the complex scattering coefficient were chosen from the analysis of existing electrodynamic surface models and the database of radar images of various satellites available on the Internet. The metal roof of the building is the most reflective. Furthermore, the metal fuselage of the aircraft has a large amplitude of reflections. The tractor and other mobile equipment is less noticeable.
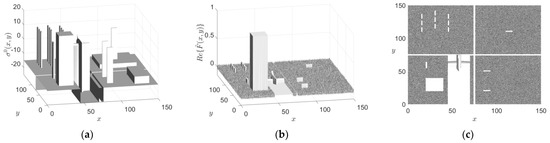
Figure 4.
Characteristics of the test surface: (a) the radar cross section, (b) the real part of the complex scattering coefficient, (c) the top projection of .
To test the simulation, the optimal output effect was first obtained in an aerospace radar system with a planar antenna array for a single beam with the following parameters: , , , , surface size , the size of the uncertainty function and . Radar images for these parameters are shown in Figure 5a–d.
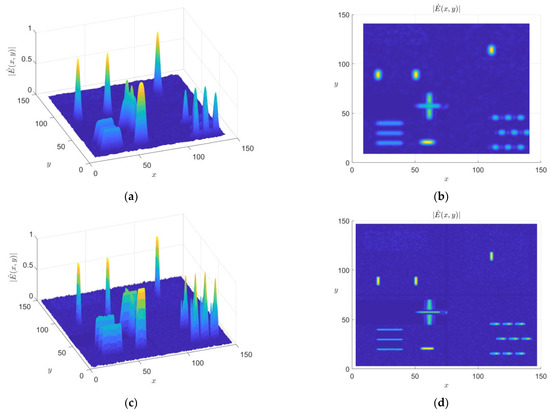
Figure 5.
The optimal output effect of the radar system : (a) for the uncertainty function with dimensions , (b) projection of the radar image, when the uncertainty function has dimensions , (c) for the uncertainty function with dimensions , (d) projection of the radar image, when the uncertainty function has dimensions .
It follows from the analysis of the radar images in Figure 5 that their detail depends on the width of the uncertainty function (36).
For more practical situations, radar images were simulated with the same parameters, but for single-beam observation (), incoherent addition of two beams (), incoherent addition of three beams (), and the optimal coherent sum of three beams scanning is in the Spot-light mode. All of the results of the radar images simulation are shown in Figure 6.

Figure 6.
Optimal output effects of the radar system : (a) true coherent image, (b) radar system with one beam, (c) incoherent addition of processing results from two beams, (d) incoherent addition of processing results from three beams, (d) optimal method of processing received space–time signals.
Radar images in Figure 6 increase information content with an increase in the number of observation beams. At the same time, at high resolution in Figure 6e, resonant scattering of waves is observed only at observation angles. Some surfaces scatter electromagnetic waves and are not visible for these viewing angles.
For the obtained radar images in Figure 6, their entropy, accuracy, and degree of difference from the test image were calculated according to the following quality metrics (completely referenced and without reference): root mean square error (MSE), peak signal-to-noise ratio (PSNR), structural similarity index (SSIM), blind/referenceless image spatial quality evaluator (BRISQUE), natural image quality evaluator (NIQE), and perception-based image quality evaluator (PIQE). All results are shown in Table 1.

Table 1.
The results of the accuracy evaluation of coherent imaging.
The MSE metric measures the average sum of the squared difference between the elements of the true image and the result of the formation of the radar image for all its points
Raising to the second power is performed so that negative values are not offset by positive ones. Also, due to the properties of this metric, the influence of errors statistically increases by quadrature from the original value. The smaller the MSE, the more accurate our prediction. The optimum is reached at point 0, that is, we predict perfectly.
The PSNR metric is presented in decibels and is equal to the ratio of the maximum possible image amplitude to the root mean square error
Statistically, the greater the similarity between the images, the lower the MSE value, and, therefore, the greater the PSNR. The PNSR is dimensionless because both the numerator and denominator are measured in pixel values. It is expedient to use the PSNR values in this case to compare the quality of different methods of radar imaging and to study the effect of different parameters on the performance of a particular algorithm.
SSIM (Structural Similarity Index) is one method to measure the similarity between two images. The SSIM index is a full matching method. In other words, it measures the quality based on the true image according to the following algorithm:
where is the mean of the image, is the mean of the image, is the covariance of the x and y images, is the variance of the image, is the variance of the image, and and are the constants that depend on the images’ dynamic range.
The SSIM index is an evolution of traditional methods such as PSNR and MSE, which have proven to be incompatible with the physiology of human perception.
For a more accurate statistical assessment of the quality of the obtained algorithm, the referenceless metrics BRISQUE, NIQE, and PIQE were also considered. These metrics are less often used in such tasks, but they should show the general statistics and confirm or refute the results.
According to the metrics (MSE, PSNR, SSIM) that use the reference image, the optimal output effect is not always the best because the dynamic range of the images was adjusted manually. In practice, to see the structure of the image in the presence of powerful reflectors, the dynamic range is also adjusted during the secondary processing of radar images. At the same time, metrics (BRISQUE, NIQE, and PIQE) that do not require information about the reference image show that the quality of radar images for optimal output is even better than the reference image. This is due to the fact that the modulus of the ideal complex scattering coefficient has a stochastic nature, and the reconstructed radar images are smoothed by the uncertainty function.
From the obtained results it follows that the proposed optimal method of image construction in an aerospace radar system with planar antenna array is more informative, allows us to form radar images without gaps, and has an improved spatial azimuth resolution of 35% compared to single-beam viewing mode, at 33% incoherent processing of signals from two beams of antenna pattern and by 31% in incoherent processing of signals from three beams.
The main idea of this article is the development of the statistical theory of the optimization of signal processing methods in airborne radars. The optimization of the theory should lead to specific practical results. This is exactly what happened in the example of signal processing methods optimization in the radar with a multi-channel two-dimensional antenna array, which was placed on platform moving at a constant speed. It is necessary to compare the obtained practical results with the existing ones.
The first method of radar imaging, which must be compared with the received one, is called Stripmap. This is the first imaging technique in SAR history that has medium detail and medium swath. It is being carefully studied now, particularly in [44,45]. The work [44] analyzes the capabilities of SAR at the Sentinel 1 satellite, which has 5 m by 5 m spatial resolution and acquires data with an 80 km swath. In [45], the TerraSAR-X satellite is considered, which can achieve a spatial resolution of up to 3 m for a standard scene size of 30 km x 50 m (width x length) in this mode. The method proposed in this article shows that such a mode in the antenna array is not enough, and this observation mode does not use the potential of the antenna array. It is necessary to form multiple rays in space to increase the swath width.
The designers of Sentinel 1 and TerraSAR-X also understand the need for the spatial distribution of beams. For this, as shown in [46,47], TerraSAR-X implements the ScanSAR (a swath width of 100 km, resolution of up to 18.5 m) and WideScanSAR (a swath width of up to 270 km, a spatial resolution of 40 m) methods). At the same time, these methods lose both the method proposed in the article and the StripMap method in terms of resolution due to the small interval of signal accumulation and spatial scanning. The optimal synthesized method says that it is necessary to form many beams, not just move one beam.
Observing the experiences of other developers and realizing the low accuracy of scanning methods, Sentinel 1 released new methods of viewing with many beams and fast movement in space, which are called Interferometric Wide swath and Extra Wide swath [48,49]. Interferometric Wide swath acquires data with a 250 km swath at 5 m by 20 m spatial resolution. Extra Wide swath acquires data over a 400 km swath at 20 m by 40 m spatial resolution. This method is very close to the one proposed by the authors of this article, but does not implement the beam focusing procedure.
Beam focusing is implemented by the SpotLight method [50,51], which now makes it possible to form radar images with a resolution of up to 0.25 m from a territory of 4 km × 4 km. It is clearly seen that the construction of high-precision images of large areas will require a lot of time. To overcome this contradiction, the method in this article implements MultiBeam SpotLight mode with the optimal displacement of the focus spot beam so that there are no gaps. To date, this method has not been implemented, but it can potentially be implemented in new satellites, since we have proposed combining the two observation methods [52].
5. Conclusions
The statistical theory of the synthesis of optimal methods of processing space–time signals in aerospace radars with antenna arrays with the restoration of a coherent image of the observation area was further developed. In contrast to the known simplified problem statements with a given space survey mode and field processing in the plane of the antenna array, the synthesized optimal methods allowed us to overcome the contradictions in aerospace radars between high spatial resolution and a wide field of view. Modifications of optimal methods for their technical implementation in aerospace-based radars are proposed and analytical expressions for the marginal errors of coherent image reconstruction are obtained.
Using the developed theory, the problem of synthesis and analysis of the method of coherent imaging of aerospace radars with a planar antenna array is solved. The peculiarity of the obtained results is the generalized statement of the problem of registration of scattered electromagnetic fields without concretization of spatial processing in antenna arrays, which allowed us to synthesize the optimal method of signal processing and the optimal mode of space survey. The proposed underlying surface scanning mode combines the advantages of two existing modes—multi-beam and Spot-light, which allowed us to obtain both the highest resolution and the widest field of view.
The obtained results allow us to make a significant contribution to the implementation of the concept of cognitive radars with adaptive antenna pattern formation depending on the tasks. It should be noted that the obtained methods and structures of aerospace radars are common and can be used for both pulsed and continuous operation.
Further development of the theory should be carried out in the direction of optimizing the processing of ultra-wideband functionally deterministic signals processing in multichannel aerospace imaging radar systems. Ultra-wideband creates prospects for another source of increasing the accuracy of radar imaging and will allow the creation of lightweight sparse antenna arrays for satellites and aircraft. Valery Volosyuk has already developed such a theory for passive multi-positional radiometric systems.
Author Contributions
Conceptualization, V.V. and methodology, S.Z. All authors have read and agreed to the published version of the manuscript.
Funding
The work was funded by the Ministry of Education and Science of Ukraine, the state registration numbers of the projects are 0120U102082, 0119U100968, 0121U109600, and 0121U109598.
Institutional Review Board Statement
Not applicable.
Informed Consent Statement
Not applicable.
Data Availability Statement
Not applicable.
Conflicts of Interest
The authors declare no conflict of interest.
References
- Falkovich, S.E.; Ponomarev, V.I.; Shkvarko, I.V. Optimal Reception of Space-Time Signals in Radio Channels with Scattering; Radio i Svyaz: Moscow, Russia, 1989. (In Russian) [Google Scholar]
- Falkovich, S.E.; Kostenko, P.Y. Fundamentals of the Statistical Theory of Radio Engineering Systems: A Tutorial; Kharkiv Aviation Institute: Kharkov, Russia, 2005. (In Russian) [Google Scholar]
- Falkovich, S.E. Signal Parameters Estimation; Sovetskoye Radio: Moscow, Russia, 1970. (In Russian) [Google Scholar]
- Falkovich, S.E.; Khomyakov, E.N. Statistical Theory of Radio Measuring Systems; Radio i Svyaz: Moscow, Russia, 1981. (In Russian) [Google Scholar]
- Tikhonov, V.I. Statistical Radio Engineering; Radio i Svyaz: Moscow, Russia, 1982. (In Russian) [Google Scholar]
- Tikhonov, V.I. Optimal Signal Reception; Radio i Svyaz: Moscow, Russia, 1983. (In Russian) [Google Scholar]
- Bakut, P.A.; Tartakovsky, G.P. Questions of the Statistical Theory of Radar; Sovetskoye Radio: Moscow, Russia, 1963. (In Russian) [Google Scholar]
- Amiantov, I.N. Selected Problems of the Statistical Communication Theory; Sovetskoye Radio: Moscow, Russia, 1971. (In Russian) [Google Scholar]
- Kotel’nikov, V.A. The Theory of Optimum Noise Immunity; McGraw-Hill Book, Co.: New York, NY, USA, 1959. [Google Scholar]
- Gutkin, L.S. Theory of Optimal Radio Reception Methods with Fluctuation Interference; Gosenergoizdat: Moscow, Russia, 1961. (In Russian) [Google Scholar]
- Levin, B.R. Theoretical Foundations of Statistical Radio Engineering; Sovetskoye Radio: Moscow, Russia, 1969. (In Russian) [Google Scholar]
- Van Tris, G. Theory of Detection, Estimation and Modulation; Sovetskoye Radio: Moscow, Russia, 1972–1977; Volumes 1–3. (In Russian) [Google Scholar]
- Middlton, D. Introduction to Statistical Communication Theory; Sovetskoye Radio: Moscow, Russia, 1961–1962; Volumes 1–2. (In Russian) [Google Scholar]
- Shirman, Y.D.; Manzhos, V.N. Theory and Technique of Processing Radar Information against the Background of Interference; Radio i Svyaz: Moscow, Russia, 1981. (In Russian) [Google Scholar]
- Kraus, J.D. Radio Astronomy, 2nd ed.; Cygnus-Quasar Books: Powell, OH, USA, 1986. [Google Scholar]
- Tseitlin, N.M. Aerial Equipment and Radio Astronomy; Soviet Radio: Moscow, Russia, 1976; 352p. [Google Scholar]
- Thompson, A.R.; Moran, J.M.; Swenson, G.W. Antennas and arrays. In Interferometry and Synthesis in Radio Astronomy; Springer International Publishing: Cham, Switzerland, 2017; pp. 153–206. [Google Scholar] [CrossRef]
- Van Schooneveld, C. Image Formation from Coherence Functions in Astronomy. In Proceedings of the IAU Colloquium No. 49 on the Formation of Images from Spatial Coherence Functions in Astronomy, Groningen, The Netherlands, 10–12 August 1978. [Google Scholar]
- Kondratenkov, G.S.; Potekhin, V.A.; Reutov, A.P.; Feoktistov, Y.A. Earth Survey Radars; Radio i Svyaz: Moscow, Russia, 1983. (In Russian) [Google Scholar]
- Reutov, A.P.; Mikhailov, V.A.; Kondratenkov, G.S.; Boyko, B.V. Side-Looking Radars; Sovetskoye Radio: Moscow, Russia, 1970. (In Russian) [Google Scholar]
- Karavayev, V.V.; Sazonov, V.V. Fundamentals of Synthesized Antenna Theory; Sovetskoye Radio: Moscow, Russia, 1974. (In Russian) [Google Scholar]
- Antipov, V.N.; Goryainov, V.T.; Kulin, A.V.; Mansurov, V.V.; Okhonskiy, A.G.; Sazonov, N.A.; Titov, M.P.; Tolstov, E.F.; Shapovalov, A.V. Digital Synthesized Aperture Radars; Radio i Svyaz: Moscow, Russia, 1988. (In Russian) [Google Scholar]
- Volosyuk, V.K.; Kravchenko, V.F. Statistical Theory of Radio Engineering Systems for Remote Sensing and Radar; Fizmatlit: Moscow, Russia, 1988. (In Russian) [Google Scholar]
- Moreira, A.; Prats-Iraola, P.; Younis, M.; Krieger, G.; Hajnsek, I.; Papathanassiou, K.P. A tutorial on synthetic aperture radar. IEEE Geosci. Remote Sens. Mag. 2013, 1, 6–43. [Google Scholar] [CrossRef]
- Krieger, G.; Moreira, A.; Fiedler, H.; Hajnsek, I.; Werner, M.; Younis, M.; Zink, M. TanDEM-X: A Satellite Formation for High-Resolution SAR Interferometry. IEEE Trans. Geosci. Remote Sens. 2007, 45, 3317–3341. [Google Scholar] [CrossRef]
- Reigber, A.; Moreira, A. First demonstration of airborne SAR tomography using multibaseline L-band data. IEEE Trans. Geosci. Remote. Sens. 2000, 38, 2142–2152. [Google Scholar] [CrossRef]
- Charvat, G.L.; Kempel, L.C.; Rothwell, E.J.; Coleman, C.M.; Mokole, E.L. A Through-Dielectric Radar Imaging System. IEEE Trans. Antennas Propag. 2010, 58, 2594–2603. [Google Scholar] [CrossRef]
- Goodman, J.W. Introduction to the Fourier Optics; Mir: Moscow, Russia, 1970. (In Russian) [Google Scholar]
- Born, M. Fundamentals of Optics; Nauka: Moscow, Russia, 1973. (In Russian) [Google Scholar]
- Zommerfel’d, A. Optics, Izdat; Inostrannoy Literatury: Moscow, Russia, 1953. (In Russian) [Google Scholar]
- Zubkovich, S.G. Statistical Characteristics of Radio Signals Reflected from the Earth’s Surface; Sovetskoye Radio: Moscow, Russia, 1968. (In Russian) [Google Scholar]
- Fradin, A.Z. Ultrahigh Frequency Antennas; Sovetskoye Radio: Moscow, Russia, 1957. (In Russian) [Google Scholar]
- Rytov, S.M.; Kravtsov, Y.A.; Tatarskiy, V.I. Introduction to Statistical Radiophysics; Nauka: Moscow, Russia, 1978. (In Russian) [Google Scholar]
- Kravchenko, V.F.; Kutuza, B.G.; Volosyuk, V.K.; Pavlikov, V.V.; Zhyla, S.S. Super-resolution SAR imaging: Optimal algorithm synthesis and simulation results. In Proceedings of the 2017 Progress in Electromagnetics Research Symposium—Spring (PIERS), St. Petersburg, Russia, 22–25 May 2017; pp. 419–425. [Google Scholar] [CrossRef]
- Pavlikov, V.V.; Zhyla, S.S.; Odokienko, O.V. Structural optimization of Dicke-type radiometer. In Proceedings of the 2016 II International Young Scientists Forum on Applied Physics and Engineering (YSF), Kharkiv, Ukraine, 10–14 October 2016; pp. 171–174. [Google Scholar] [CrossRef]
- Ostroumov, I.; Kuzmenko, N.; Sushchenko, O.; Pavlikov, V.; Zhyla, S.; Solomentsev, O.; Zaliskyi, M.; Averyanova, Y.; Tserne, E.; Popov, A.; et al. Modelling and Simulation of DME Navigation Global Service Volume. Adv. Space Res. 2021, 68, 3495–3507. [Google Scholar] [CrossRef]
- Volosyuk, V.K.; Pavlikov, V.V.; Zhyla, S.S. Algorithms Synthesis and Potentiality Analysis of Optimum Ultrawideband Signal Processing in the Radiometric System with Modulation. In Proceedings of the 2011 VIII International Conference on Antenna Theory and Techniques, Kyiv, Ukraine, 20–23 September 2011. [Google Scholar] [CrossRef]
- Pavlikov, V.V.; Volosyuk, V.K.; Zhyla, S.S.; Van Huu, N. Active Aperture Synthesis Radar for High Spatial Resolution Imaging. In Proceedings of the 2018 9th International Conference on Ultrawideband and Ultrashort Impulse Signals (UWBUSIS), Odessa, Ukraine, 4–7 September 2018. [Google Scholar] [CrossRef]
- Pavlikov, V.; Volosyuk, V.; Zhyla, S.; Van, H.N.; Van, K.N. A New Method of Multi-Frequency Active Aperture Synthesis for Imaging of SAR Blind Zone Under Aerospace Vehicle. In Proceedings of the 2017 14th International Conference The Experience of Designing and Application of CAD Systems in Microelectronics (CADSM), Lviv, Ukraine, 21–25 February 2017. [Google Scholar] [CrossRef]
- Gorovyi, I.; Bezvesilniy, O.; Vavriv, D.; Ievgen, G. Multi-look SAR processing with road location and moving target parameters estimation. In Proceedings of the 2015 16th International Radar Symposium (IRS), Dresden, Germany, 24–26 June 2015; pp. 581–586. [Google Scholar] [CrossRef]
- Bezvesilniy, O.O.; Kochetov, B.A.; Vavriv, D.M. Moving target detection with multi-look SAR. In Proceedings of the 2014 20th International Conference on Microwaves, Radar and Wireless Communications (MIKON), Gdansk, Poland, 16–18 June 2014; pp. 1–4. [Google Scholar] [CrossRef]
- Volosyuk, V.K.; Pavlikov, V.V.; Zhyla, S.S. Phenomenological Description of the Electromagnetic Field and Coherent Images in Radio Engineering and Optical Systems. In Proceedings of the 2018 IEEE 17th International Conference on Mathematical Methods in Electromagnetic Theory (MMET), Kiev, Ukraine, 2–5 July 2018; pp. 302–305. [Google Scholar]
- Volosyuk, V.K. Phenomenological description of coherent radar images based on the concepts of the measure of set and stochastic integral. In Telecommunication and Radio Engineering; Volosyuk, V.K., Zhyla, S.S., Kolesnikov, D.V., Eds.; Begell House: Danbury, CT, USA, 2019; Volume 78, pp. 19–30. [Google Scholar]
- Isar, A.; Nafornita, C. Sentinel 1 Stripmap GRDH image despeckling using two stages algorithms. In Proceedings of the 2016 12th IEEE International Symposium on Electronics and Telecommunications (ISETC), Timisoara, Romania, 27–28 October 2016; pp. 343–348. [Google Scholar] [CrossRef]
- Gisinger, C.; Schubert, A.; Breit, H.; Garthwaite, M.; Balss, U.; Willberg, M.; Small, D.; Eineder, M.; Miranda, N. In-Depth Verification of Sentinel-1 and TerraSAR-X Geolocation Accuracy Using the Australian Corner Reflector Array. IEEE Trans. Geosci. Remote. Sens. 2020, 59, 1154–1181. [Google Scholar] [CrossRef]
- Zhang, L.; Liu, H.; Gu, X.; Guo, H.; Chen, J.; Liu, G. Sea Ice Classification Using TerraSAR-X ScanSAR Data With Removal of Scalloping and Interscan Banding. IEEE J. Sel. Top. Appl. Earth Obs. Remote Sens. 2019, 12, 589–598. [Google Scholar] [CrossRef]
- Steinbrecher, U.; Kraus, T.; Castellanos Alfonzo, G.; Grigorov, C.; Schulze, D.; Braeutigam, B. TerraSAR-X: Design of the new operational WideScanSAR mode. In Proceedings of the EUSAR 2014 10th European Conference on Synthetic Aperture Radar, Berlin, Germany, 3–5 June 2014; pp. 1–4. [Google Scholar]
- Korosov, A.; Demchev, D.; Miranda, N.; Franceschi, N.; Park, J.-W. Thermal Denoising of Cross-Polarized Sentinel-1 Data in Interferometric and Extra Wide Swath Modes. IEEE Trans. Geosci. Remote Sens. 2021, 60, 5218411. [Google Scholar] [CrossRef]
- Wegmuller, U.; Werner, C.; Wiesmann, A.; Strozzi, T.; Kourkouli, P.; Frey, O. Time-series analysis of Sentinel-1 interferometric wide swath data: Techniques and challenges. In Proceedings of the 2016 IEEE International Geoscience and Remote Sensing Symposium (IGARSS), Beijing, China, 10–15 July 2016; pp. 3898–3901. [Google Scholar] [CrossRef]
- Ignatenko, V.; Nottingham, M.; Radius, A.; Lamentowski, L.; Muff, D. ICEYE Microsatellite SAR Constellation Status Update: Long Dwell Spotlight and Wide Swath Imaging Modes. In Proceedings of the 2021 IEEE International Geoscience and Remote Sensing Symposium IGARSS, Brussels, Belgium, 11–16 July 2021; pp. 1493–1496. [Google Scholar] [CrossRef]
- Ignatenko, V.; Dogan, O.; Muff, D.; Lamentowski, L.; Radius, A.; Nottingham, M.; Leprovost, P.; Seilonen, T. ICEYE Microsatellite SAR Constellation Status Update: Spotlight Extended Area Mode, Daily Coherent Ground Tracks and Waveform Diversity. In Proceedings of the IGARSS 2022—2022 IEEE International Geoscience and Remote Sensing Symposium, Lumpur, Malaysia, 17–22 July 2022; pp. 4145–4148. [Google Scholar] [CrossRef]
- Kraus, T.; Ribeiro, J.P.T.; Bachmann, M.; Steinbrecher, U.; Grigorov, C. Concurrent Imaging for TerraSAR-X: Wide-Area Imaging Paired With High-Resolution Capabilities. IEEE Trans. Geosci. Remote Sens. 2022, 60, 5220314. [Google Scholar] [CrossRef]
Publisher’s Note: MDPI stays neutral with regard to jurisdictional claims in published maps and institutional affiliations. |
© 2022 by the authors. Licensee MDPI, Basel, Switzerland. This article is an open access article distributed under the terms and conditions of the Creative Commons Attribution (CC BY) license (https://creativecommons.org/licenses/by/4.0/).