Article

A Comparison between Task Distribution Strategies for Load Balancing Using a Multiagent System

by
Dumitru-Daniel Vecliuc
1,
Florin Leon
1,* and
Doina Logofătu
2
1
Faculty of Automatic Control and Computer Engineering, “Gheorghe Asachi” Technical University of Iasi, Bd. Mangeron 27, 700050 Iasi, Romania
2
Faculty of Computer Science and Engineering, Frankfurt University of Applied Sciences, Nibelungenplatz 1, 60318 Frankfurt am Main, Germany
*
Author to whom correspondence should be addressed.
Computation 2022, 10(12), 223; https://doi.org/10.3390/computation10120223
Submission received: 22 November 2022 / Revised: 11 December 2022 / Accepted: 14 December 2022 / Published: 17 December 2022

Abstract

:
This work presents a comparison between several task distribution methods for load balancing with the help of an original implementation of a solution based on a multi-agent system. Among the original contributions, one can mention the design and implementation of the agent-based solution and the proposal of various scenarios, strategies and metrics that are further analyzed in the experimental case studies. The best strategy depends on the context. When the objective is to use the processors at their highest processing potential, the agents preferences strategy produces the best usage of the processing resources with an aggregated load per turn for all PAs up to four times higher than the rest of the strategies. When one needs to have a balance between the loads of the processing elements, the maximum availability strategy is better than the rest of the examined strategies, producing the lowest imbalance rate between PAs out of all the strategies in most scenarios. The random distribution strategy produces the lowest average load especially for tasks with higher required processing time, and thus, it should generally be avoided.

1. Introduction

Task distribution represents a well-known process that consists in the allocation of tasks, taking into account a set of constraints and factors designed to enhance the capability of the system to handle future tasks. Task distribution has applications in various areas [1], such as cloud computing [2,3], project management [4,5,6,7], edge cloud computing [8,9,10,11,12], etc. A task can take different forms, e.g., a software request, a web request, or an operation in a production process. In order to determine the optimal strategy that maximizes the desired metrics with a minimal impact to the system and its components, one of the solutions is to simulate the process in an isolated environment.
We tackle the task distribution problem as a simulation in the context of a distributed software system modeled using a multi-agent system (MAS), where the processing units are represented by software agents that mimic real processing instances with a specific capability to handle the incoming tasks. Our approach is focused on the evaluation of different task distribution strategies.
With this work, our aim is to study different task distribution strategies and to find possible patterns and correlations between the requirements of the tasks (in terms of needed resources, such as time and processing power) and an optimal method to distribute them. In this way, based on the initial information about the typology of the tasks, the distributor can choose the strategy that has the largest probability to produce the best distribution of the tasks among the processors.
Our main contributions are the following:
  • We implemented the software solution that supports the execution of the proposed experiments, with full support for metric definition, task generation, and configuration of processing agents;
  • Based on the conducted research, we proposed and implemented a series of distribution strategies in order to have a broader perspective on the relationship between the context, task particularities and the strategy that is suitable in a given scenario;
  • We proposed, implemented and evaluated the experiments that are going to be detailed below.
The rest of the paper is organized as follows. In Section 2, we present an overview of the relevant literature, Section 3 details our methodology, in Section 4, we present the results and observations of the proposed experiments, and in Section 5, we include the conclusions and summarize the main findings.

2. Related Work

Task distribution represents a topic given increased attention both in the academic area and in the tech industry, where it is a popular concept from cloud computing known as load balancing (LB) [13,14,15]. Load balancing represents an optimization technique with the goal to find an efficient distribution of the incoming network traffic to a group of servers/processors. Load balancing can be viewed as a particular scenario of task distribution, meaning that beside the general task allocation concept, we analyze the studies and existing approaches focused on this topic, too. We also analyze some of the existing works that focus on comparisons between task distribution methods. We summarize some of these related works and organize them in two sub-sections based on the problem type, i.e., task distribution and load balancing.
In [16,17], the authors survey multiple task scheduling algorithms and compare a large number of scheduling methods. The goals of the two works are similar, but the approaches have some small differences. Both works split the algorithms into multiple categories, but the number and the type of categories differ. Another difference between the two works consists in the criteria that are analyzed during the comparisons and in the algorithms that are compared. Neither of these two studies focuses on the analysis of the tasks used in the experiments and on the impact that a specific method of task distribution can have over the performance of the algorithm, as our work does. In [18], the authors propose a more practical approach, using an existing framework, CloudSim [19], in order to compare six popular, classic task scheduling algorithms [18]. The focus is on analyzing the performance of the algorithms and on inspecting metrics such as: the average waiting time, the turnaround time, load balancing, throughput, and makespan. This study does not explore either the potential impact that the distribution of tasks can have over an algorithm.

2.1. Task Distribution

The authors of [20] tackle the problem of task distribution in a human–machine manufacturing system. To overcome the challenges caused by the stochastic characteristic of the manufacturing systems and the variability and subjectivity of the human operators (which may prefer some tasks over the others, some may work at different paces, etc.), the study proposes a deep reinforcement learning (DRL) approach for this scenario. The proposed system has three types of entities (job, human, and M/C representing the machine) that are described using different specific attributes for each entity. The problem is solved by reinforcement learning (RL) using a partially observable Markov decision process (POMDP) [21] to describe this scenario. In order to enhance the approximation of the Q-value, the authors use a long short-term memory (LSTM) network. They evaluate the proposed strategy with two opposite distribution strategies: first-in first-out (FIFO) that assigns an incoming task to an idle human, without taking into account its level of competence, and the shortest processing time (SPT) that assigns a task to the human with the highest level of competence in solving that task. The proposed solution achieves better results in terms of flow time minimization; a reason stated for the results is that the distribution process is more balanced among operators. The limitations may be caused in scenarios with frequent changes of the operators and machines.
In [22], the authors present an architecture of an MAS solution for scheduling in cloud manufacturing. The approach is based on an extended version of the contract net protocol that encapsulates many-to-many negotiation. The solution takes into account the dynamic arrival of the tasks. The architecture contains ten different types of agents, each with a well-defined role in the system. Only one case study is presented with a particular scenario that is evaluated using the proposed solution. The authors conclude that the case study is sufficient to demonstrate the feasibility of the proposed MAS solution. One may conclude that a single experiment is not enough to demonstrate the effectiveness of the solution, but it is worth taking into account.

2.2. Load Balancing

In the work presented in [14], the authors propose a load-balancing algorithm to solve the task distribution problem in the context of mobile devices in edge cloud computing environments. The proposed method combines the graph-coloring algorithm [23,24] with a genetic algorithm [25,26] that reduces the complexity of the former. The performance of the algorithm is improved compared with the other candidate methods (Cloud First, Round Robin and Priority). In terms of network traffic generation, the proposed algorithm produces the least volume of network traffic, which leads to a lower probability of the network failures to occur. The task waiting time dependency on the number of devices is monitored, showing that better results are obtained for a smaller number of devices, and that, as the number of devices increases, the task waiting time increases, too. The proposed method has better results in terms of average CPU usage of virtual machines (VMs), meaning that it utilizes the edge servers better than other methods. Other optimization algorithms may be tried as well [27,28].
A solution based on ant colony optimization algorithm (ACO) [29,30] enhanced with a nearest-neighbor (NN) distance optimization strategy, is proposed in [31]. This approach is based on three main sequential steps: the preapproval procedure, the NN step, and the ACO step. The preapproval step is executed every time when a new task arrives in order to determine if the task can be processed or not. It consists of verifying whether the node with the maximum available resources is able to handle the incoming task. This step reduces the size of the ACO solutions by rejecting the dissatisfied requests before scheduling. The NN step represents a local search method with the mission to construct the problem graph that will be used by the ants in the ACO step. The nearest neighbor is determined using the Euclidean distance in order to determine which is the nearest node that was not already visited. The objective of the ACO step is to improve the two main factors that influence the decision to choose a processor over the other: the pheromone value for the transition between two nodes and the function that represents the desirability to move from one node to another. The desirability to move between nodes is expressed mathematically using the node resources: CPU, memory and disk utilization. Based on the experiments and comparisons proposed, the authors conclude that the proposed approach outperforms the algorithms that are compared within the majority of scenarios. There is not a clear statement regarding the tasks rejected in the preapproval state, if and how they influence the final metrics and comparisons.
Multi-agent reinforcement learning (MARL) is the method experimented in [32], which tries to distribute the network load in data centers. The authors try to overcome the time bounded distribution decision that should be handled at microseconds level, given the fact that the load balancer (LB) operates at the network level. Their approach consists of transposing the network load-balancing problem into a cooperative game in order to combine the advantages offered by the reinforcement learning (RL) algorithms: capacity to learn in an environment with partial observations and the ability to make decisions in a timely manner for the problem. The framework used to formulate the problem is a decentralized partially observable Markov decision process (Dec-POMDP) [21]. In order to solve the problem, the authors compare three different RL methods: centralized training and decentralized execution (QMIX algorithm [33]), centralized training and centralized execution (SAC algorithm [34], which is a single agent game) and independent agents (I-SAC method) comparing them to the state-of-the-art LB heuristic methods, such as: ECMP [35], WCMP [36], AWCMP [37], LSQ [38] and SED [39]. The benchmarks show that in moderate-scale systems, the QMIX algorithm is superior in the majority of the scenarios, while in large-scale systems, QMIX and I-SAC have a performance closer to the best heuristic methods. Although the results are promising, the authors underline the potential improvements that can be made such as: reducing the cost of communication between the agents during training, unexplored scoring mechanisms and the limitations of the QMIX algorithm.
In general, dynamic environments where task allocation is a requirement can benefit from multi-agent modeling, where the solution can be found in a cooperative manner. A recent review [40] studies the effectiveness of such cooperative control strategies in various application domains focusing on the trade-off between exploration and exploitation. In order to create flexible, effective solutions, the correct balance between these two kinds of behaviors needs to be reached during the operation of the system. For such an objective, reinforcement learning or multi-agent reinforcement learning (MARL) algorithms can be beneficial. Such techniques have proven to be valuable for applications related, e.g., to Internet of Things blockchain-enabled networks [8].

3. Methodology

Inspired by the work completed so far in this area, we decided to perform an in-depth study of task distribution and load balancing. Motivated by the desire to experiment and discover correlations between the specifications of the tasks and the distribution strategy, we propose a system that emulates all the needed actors in the context of the problem under consideration.

3.1. Problem Description

Our objective is to compare and analyze the performance of different task distribution methods in the context of different distributions of tasks in terms of required resources. Before going into more details regarding the system and the distribution strategies, a description of the problem is presented. The problem consists of distributing a known list of tasks to a certain number of processors. The participants, as well as the system, work based on a set of assumptions:
  • All the processors are available to receive tasks from time zero of the simulation;
  • Each processor has an available processing power that is 100% at the beginning of the simulation;
  • Each processor is able to process multiple tasks at the same time;
  • The time needed to process a task does not change based on the load of the processor;
  • Each processor is able to spawn a certain number of helper processors;
  • Each helper processor has a reduced processing power compared to the main processors;
  • The list of tasks is available from time zero of the simulation;
  • Each task from the list has two requirements: the processing power needed and the time needed for the task to be processed;
  • The tasks do not have priorities;
  • The tasks are distributed sequentially in the order in which they are placed in the distribution queue.

3.2. System Description

This section contains an in-depth description of the entities that are part of the system together with the communication protocol used and the states of the task distribution process.

3.2.1. System Structure

We implemented the system as a turn-based environment with the communication between the agents handled using the ActressMas framework [41]. The entities of the system, shown in Figure 1, are presented below:
  • Environment represents the place where simulations run. This component is responsible for generating the rest of the agents based on the specified configurations;
  • Manager Agent generates the tasks to be distributed and communicates with the dispatcher agent to stop the simulation after the distribution of the tasks;
  • Dispatcher Agent is the component that handles the communication with the processor agents in order to apply the distribution strategy and to distribute the tasks in the queue;
  • Processor Agent (PA) or worker agent is responsible for receiving tasks and processing them, possibly assisted by the helper agents;
  • Helper Agents (HAs) are occasionally spawned when a processor agent needs to be assisted in processing a task for which it does not have sufficient resources. Each processor agent is able to spawn a predefined number (the same for all the processor agents) of helper agents that will be alive until the task that they were spawned for is finished.

3.2.2. Task Distribution Process

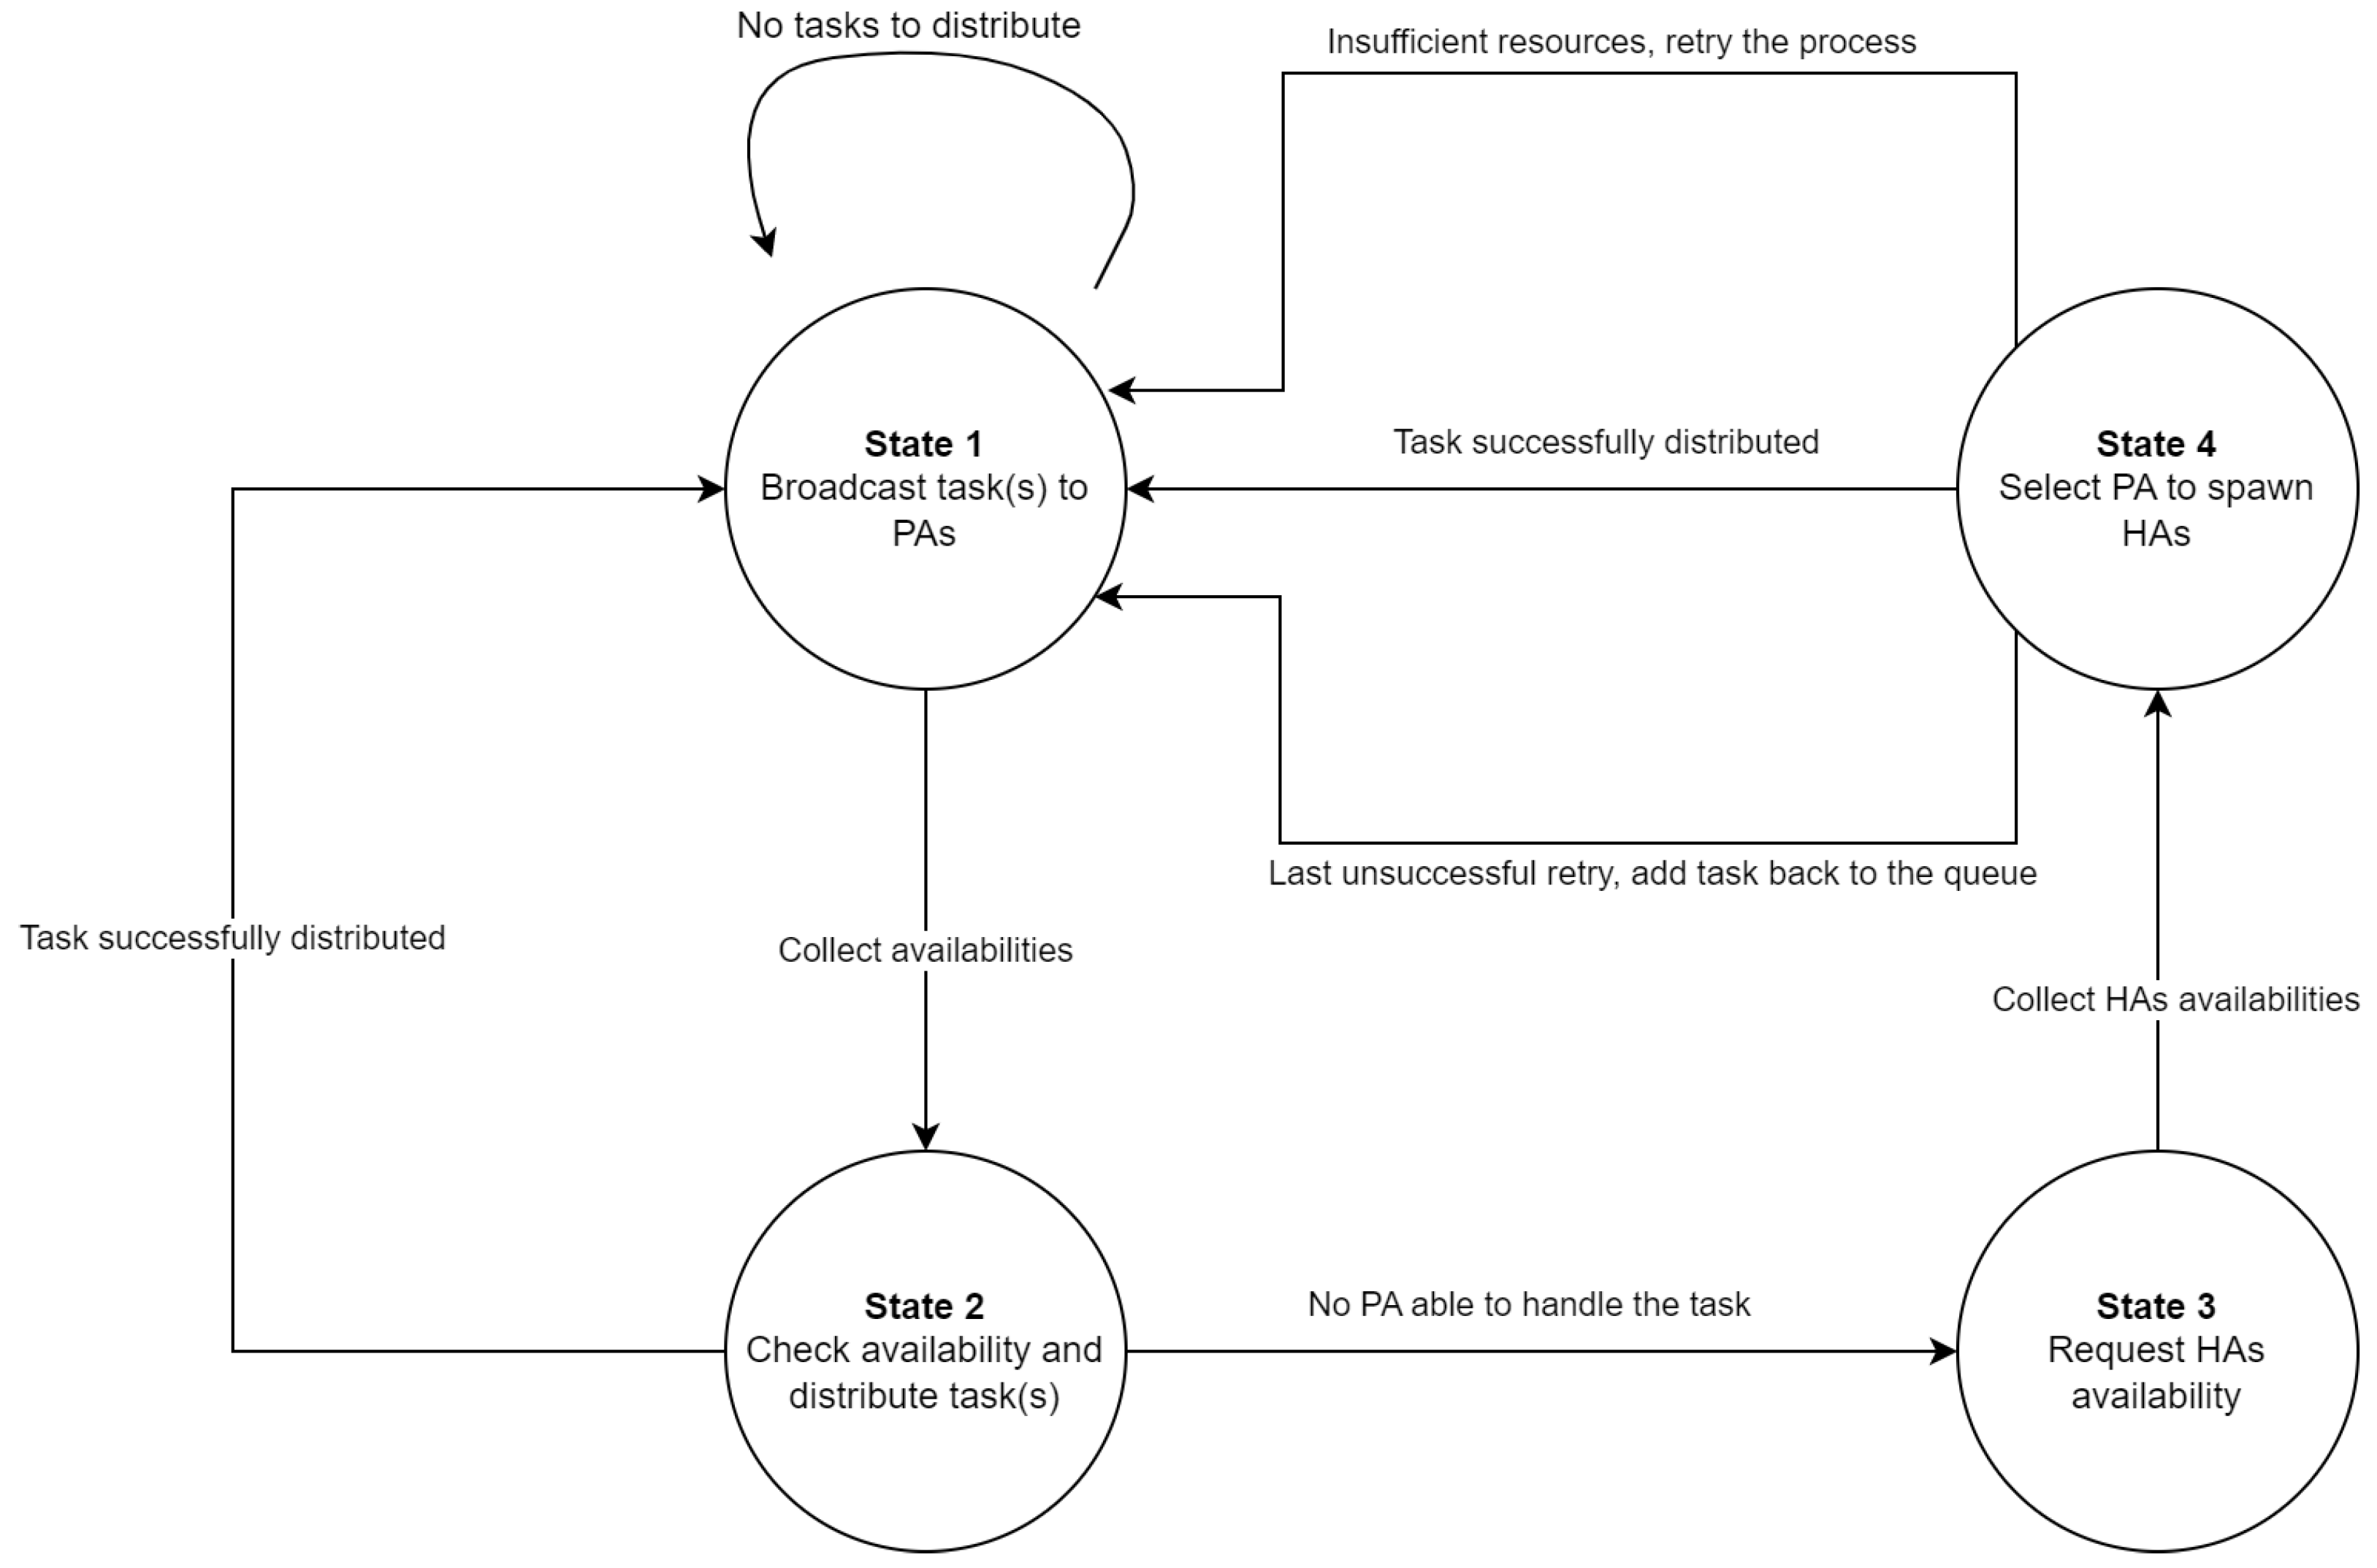
The decision process of the dispatcher agent can be modeled as a state diagram illustrated in Figure 2. A brief description of each state and of the transitions between them is further detailed:
  • State 1: If the task queue contains some tasks, the distributor agent selects the first task (or more tasks, depending on the distribution strategy) and broadcasts it to all the PAs. If no task is available, the dispatcher remains in the current state, waiting for a task to appear in the queue;
  • State 2: After collecting the responses from the PAs, the dispatcher agent distributes the task(s) to the PA selected based on the distribution strategy and returns to the first state. If there is no PA available to handle the task(s), the dispatcher goes to next state;
  • State 3: In this state, the dispatcher broadcasts a message to all the PAs, requesting the HAs availability;
  • State 4: If the dispatcher reaches this state, the best scenario happens if the task can be processed by a PA with the help of its corresponding HAs. After the successful distribution, the dispatcher is ready to go to the first state in order to try the distribution of another task. If there is no PA able to handle the current task even with the help from HAs, then the distributor goes back to the first state, retrying the whole process with the current task. The number of retries is empirically chosen to be 3. If the task reaches the maximum number of retries, it is added to the end of the queue and the dispatcher goes to the first state.

3.2.3. Communication Protocol

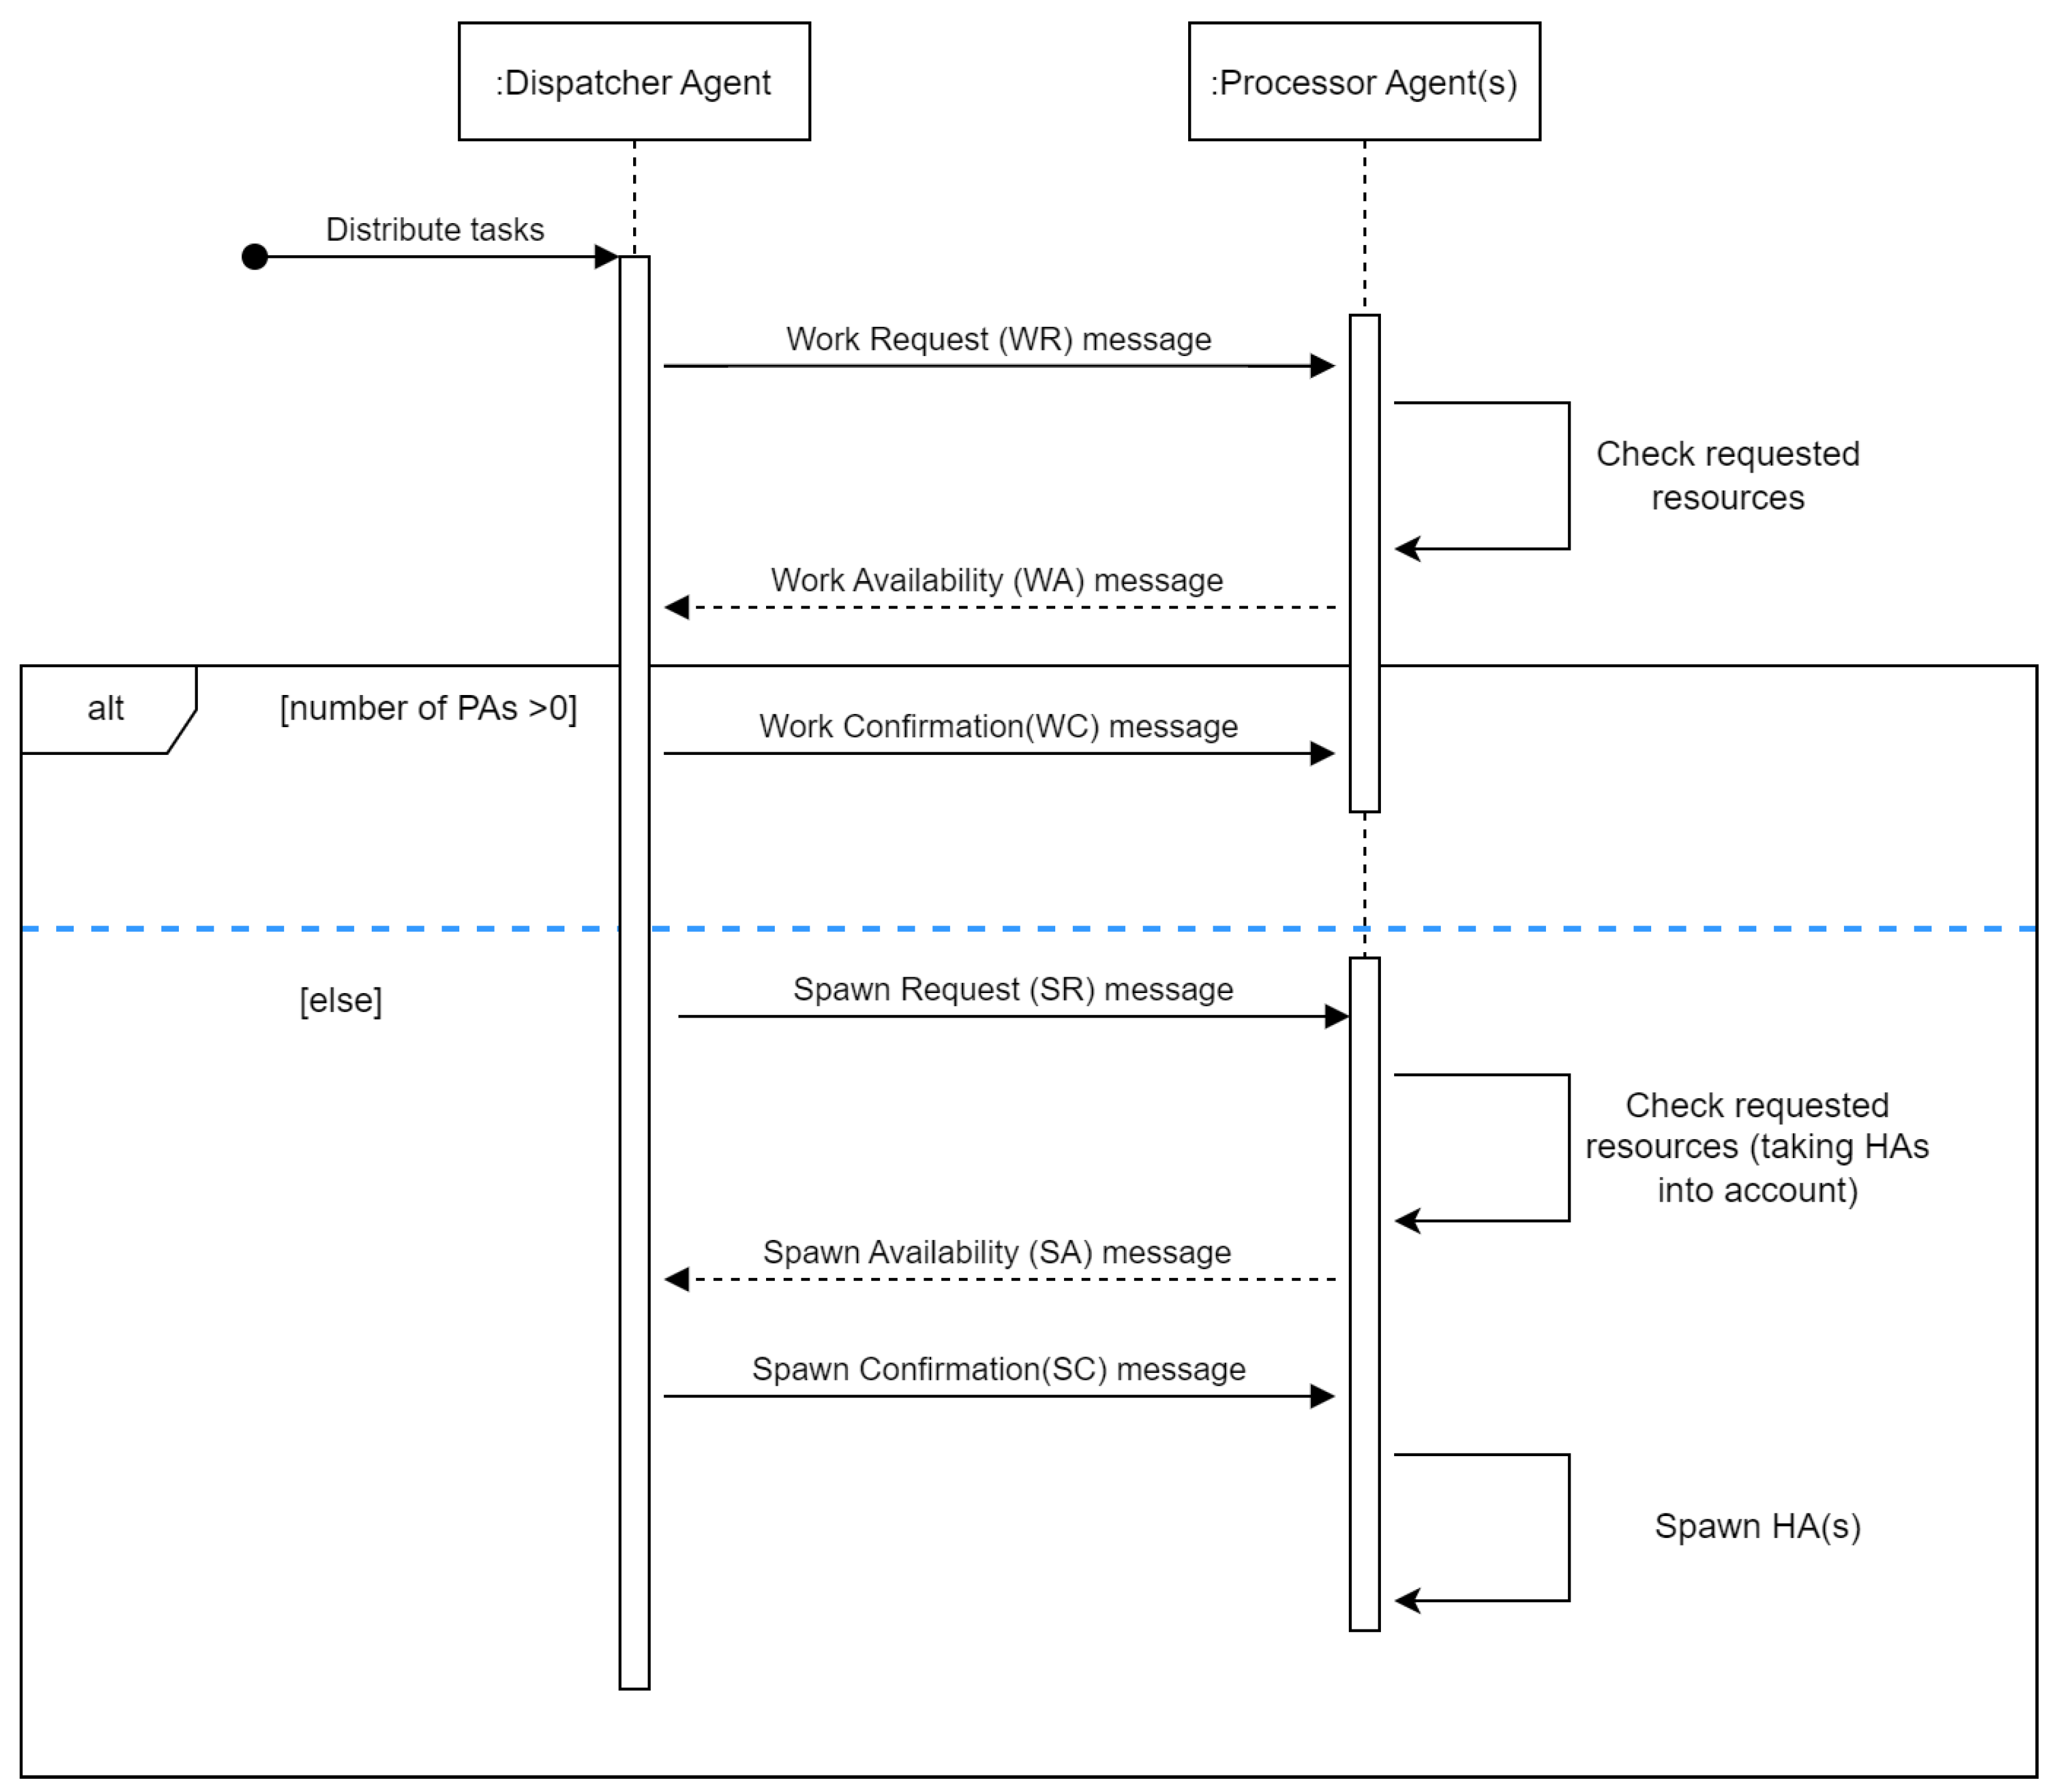
The communication protocol that enables the task sharing between the dispatcher agent and the processor agents is an adaptation of the contract net protocol (CNP) [42]. The flow of the messages is presented in Figure 3 and shows what type of messages the agents exchange and the order of those messages in the system.
The information exchanged through the messages and the type of the messages is detailed as follows:
  • Work Request (WR) represents the message broadcast by the dispatcher to PAs with details regarding the current task(s) that need(s) to be processed;
  • Work Availability (WA) is the response sent by each PA agent and contains information about the available processing power that a PA agent has;
  • Work Confirmation (WC) is the message sent by the dispatcher after applying the distribution strategy in order to determine the PA designated to process a given task. The message only contains the ID of the task, and it is sent only to the PA selected to handle the task. The other participant PAs do not receive any rejection message;
  • Spawn Request (SR) is the message sent by the dispatcher if there are no available PAs to handle the current task. It is similar to the WR message and requests the availability of the PAs but this time taking into account the availability of the HAs too;
  • Spawn Availability (SA) is sent by PAs and offers information about the availability but taking into account also the potential of the HAs;
  • Spawn Confirmation (SC) is the message sent by the dispatcher to a PA after the distribution strategy is applied, and the PA selected to handle the task with the help of its HAs is determined.
Compared to the CNP, the communication protocol that we use presents some similarities:
  • The presence of the two main classes of participants in the communication process: one that initiates the dialogue and calls for proposals, and the other one that receives the message, analyzes the requirement and responds to the proposal;
  • The flow of the messages is similar, following the main pattern of the CNP with “request–response” messages.
However, our implementation has some particularities when compared to the standard CNP:
  • The PAs do not send a reject message if the requirements from the Dispatcher cannot be fulfilled. The PAs send only a single type of message that is not specifically a reject or a proposal, but it is an informative message with the current availability of the agent;
  • The Dispatcher does not send a specific reject message to the PAs that were not selected to process the request;
  • The PA that was selected to process the request does not send a confirmation or a cancel message to the Dispatcher;
  • The protocol supports a different round of messages exchanged between the agents in some scenarios.
An important mention related to the system is that we consider it “ideal”, meaning that the communication between the agents happens without data loss, and an agent cannot become unresponsive. Taking into account this property of the environment, the specific confirmation and rejection messages are not mandatory in order to certainly know the state of the agent that sent a message.
Since the term “task” is often used, a description of its main attributes is presented below:
  • UniqueId or task name represents a unique identifier used for each task;
  • Required Load is a numeric value that represents the number of resources required for a PA in order to process a task;
  • Required Time represents the value that measures how long a PA will process the current task.

3.3. Distribution Strategies

Our work evaluates different distribution strategies in different scenarios. The description of the scenarios and the results will be detailed in Section 4. In this section, the focus is on presenting each strategy that is used during the proposed experiments.

3.3.1. Round Robin

The Round Robin strategy is one of the most used strategies in task distribution and load-balancing problems, which was widely used both in academic studies [43,44] and in the cloud industry by the cloud solutions providers [45,46].
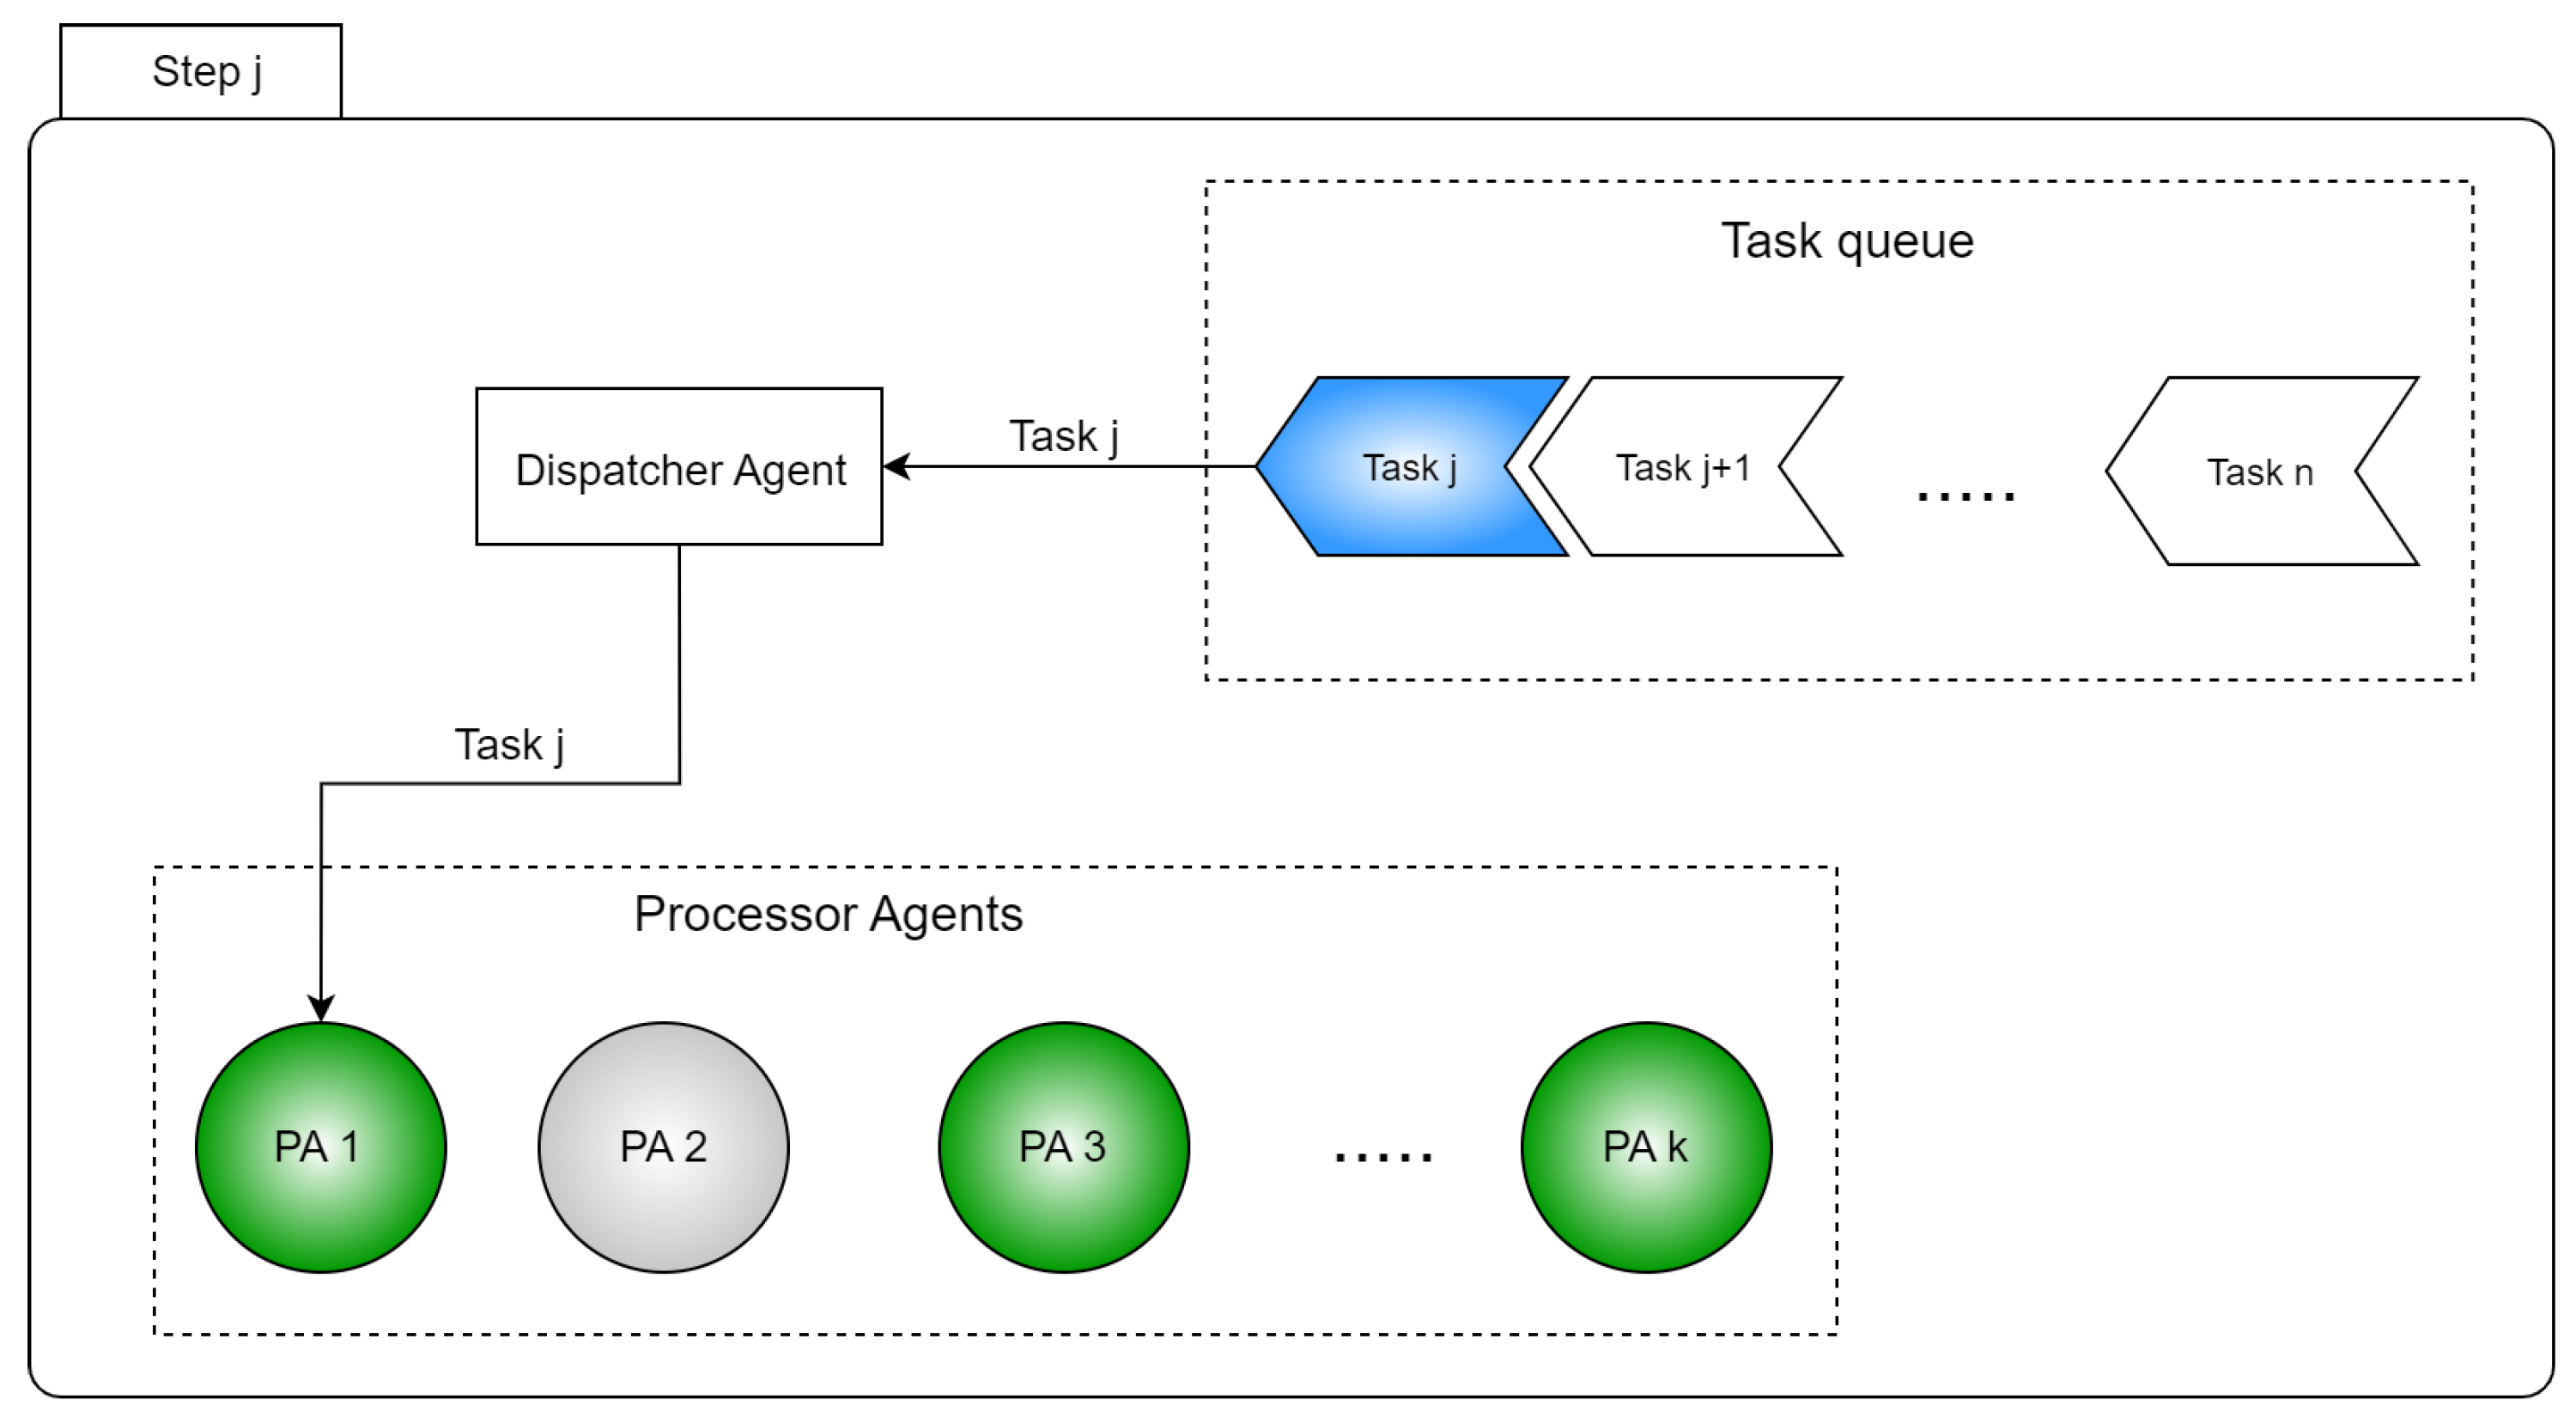
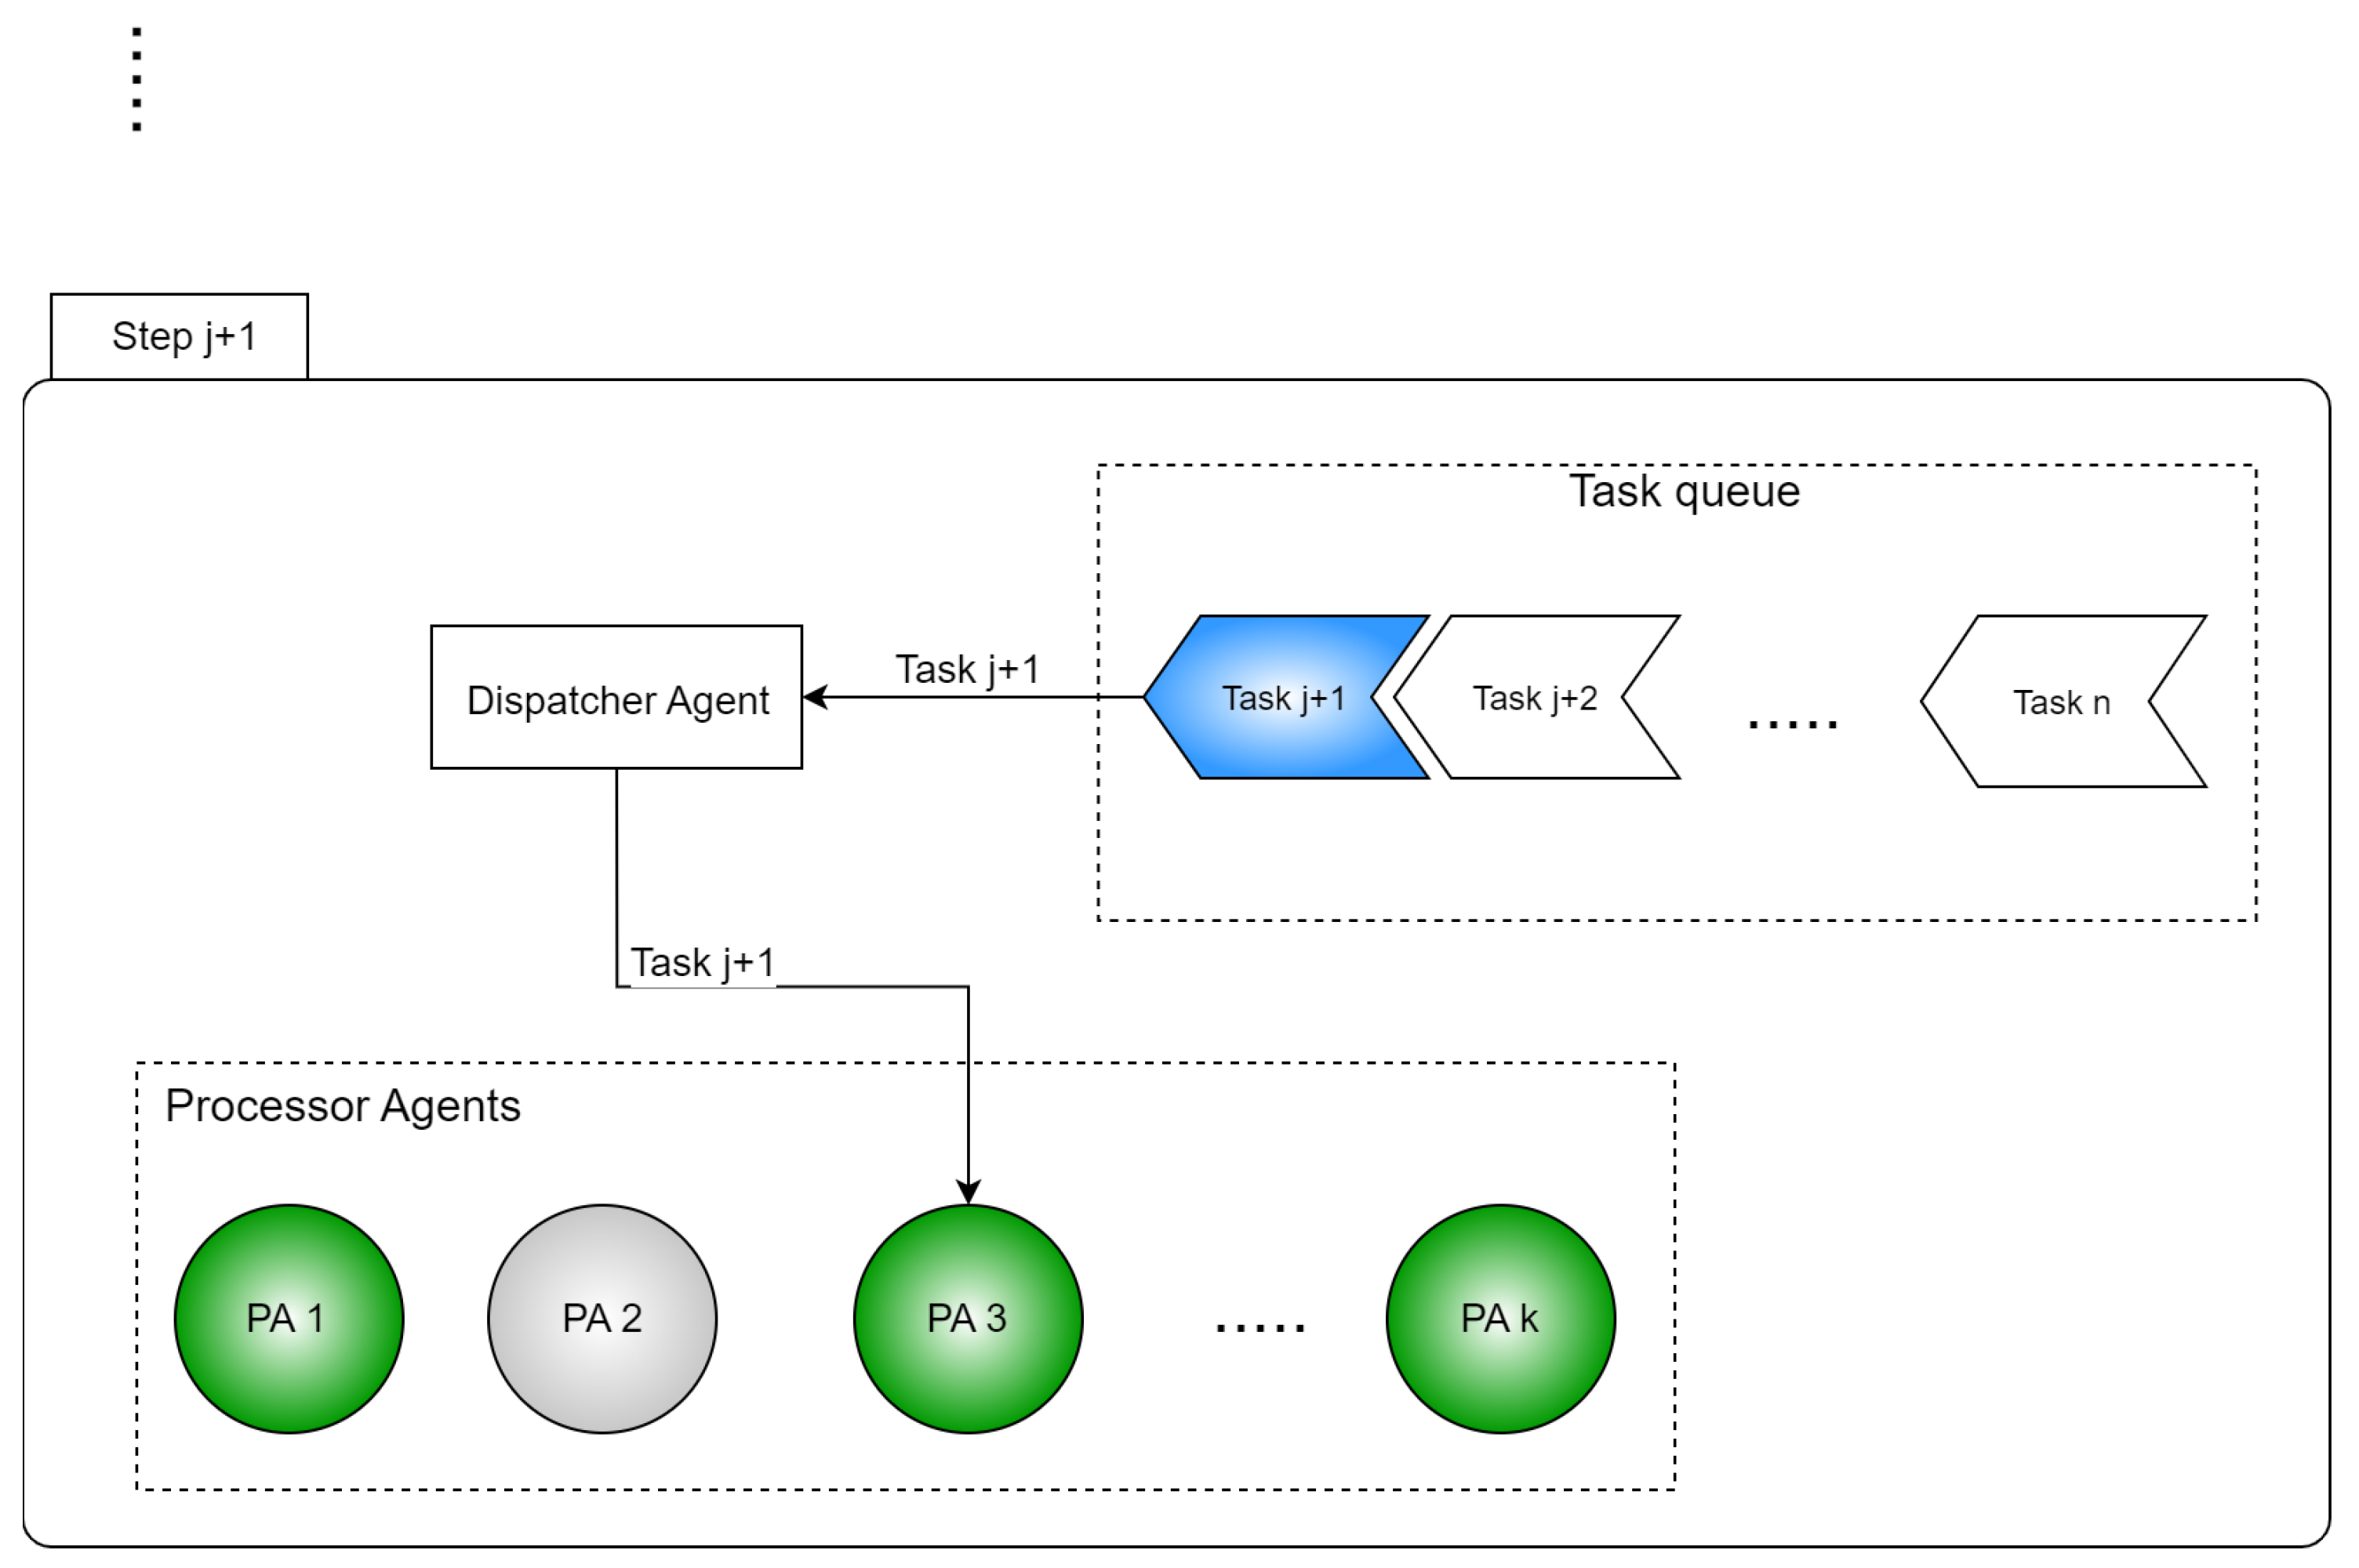
Our implementation of the algorithm is based on some initial assumptions, such as: each PA has a unique identification attribute (i.e., name, in our case); the unique identification attribute is used in order to keep the PAs list ordered by that attribute. An illustration of the distribution process is presented in Figure 4 and illustrates the distribution process at two random moments in time. For this example, the names of the PAs are considered to be: PA 1, PA 2, PA 3, and so on. The green PAs are the ones with available resources to handle the current task, and the gray PAs are the ones that do not have sufficient processing capacity to handle the task. At step j, it can be observed that the current task is distributed to the first agent that has sufficient processing power to handle the task, which in this case is PA 1. At the step j + 1, the task is distributed to the next available PA from the list, in ascending order of names. The Round Robin strategy does not take into account any optimization.

3.3.2. Max-Utility

The Max-utility strategy is used to distribute the tasks in order to maximize the utility of an individual PA. The assumption regarding the utility of a PA is that the utility produced by a task is higher if the resources needed to process the task are higher. In other words, the task that produces the greatest resource consumption for a PA is assigned to that PA.
The process of distributing tasks using this strategy consists of broadcasting a task to all the PAs and gathering information regarding their available resources. Based on the list received from the PAs with the available processing resources, the dispatcher agent assigns the task to the processor with the highest utility produced by the current task. If there are many PAs with the same utility produced by the task, then the processor is randomly selected.

3.3.3. Max-Availability

This distribution strategy focuses on the PA with the highest percentage of available resources when distributing a task. The strategy does not take into account the utility produced or any other potential optimizations, even if this means that a task with a lower amount of required resources will be distributed to the PA with the highest availability and the next task to be distributed could remain unassigned because of the counterproductive distributions from before. As in the max-utility strategy, if there are multiple PAs with the same availability, the PA is randomly selected.

3.3.4. Random

In this distribution strategy, the dispatcher agent tries to arbitrarily assign one task to one of the available agents. By available agents, we refer to the group with at least one PA with the available processing power higher than 0. If the randomly selected PA does not have enough resources to process the incoming task, then the distributor agent asks the PA to check for the availability of its HAs. If the PA is able to handle the task assisted by its HAs, then the task is marked as assigned and the next task is picked up to be distributed. If the PA can’t handle the task even with assistance from its HAs, a new random PA is selected and the process is retried.

3.3.5. Agents Preferences

This strategy is inspired by the ranked preference matching algorithms [47,48] without being an exact implementation of a specific algorithm. The main idea of this strategy is focused on matching the PAs with the tasks that produce the greatest utility for them but correlated with the other PAs’ preferences.
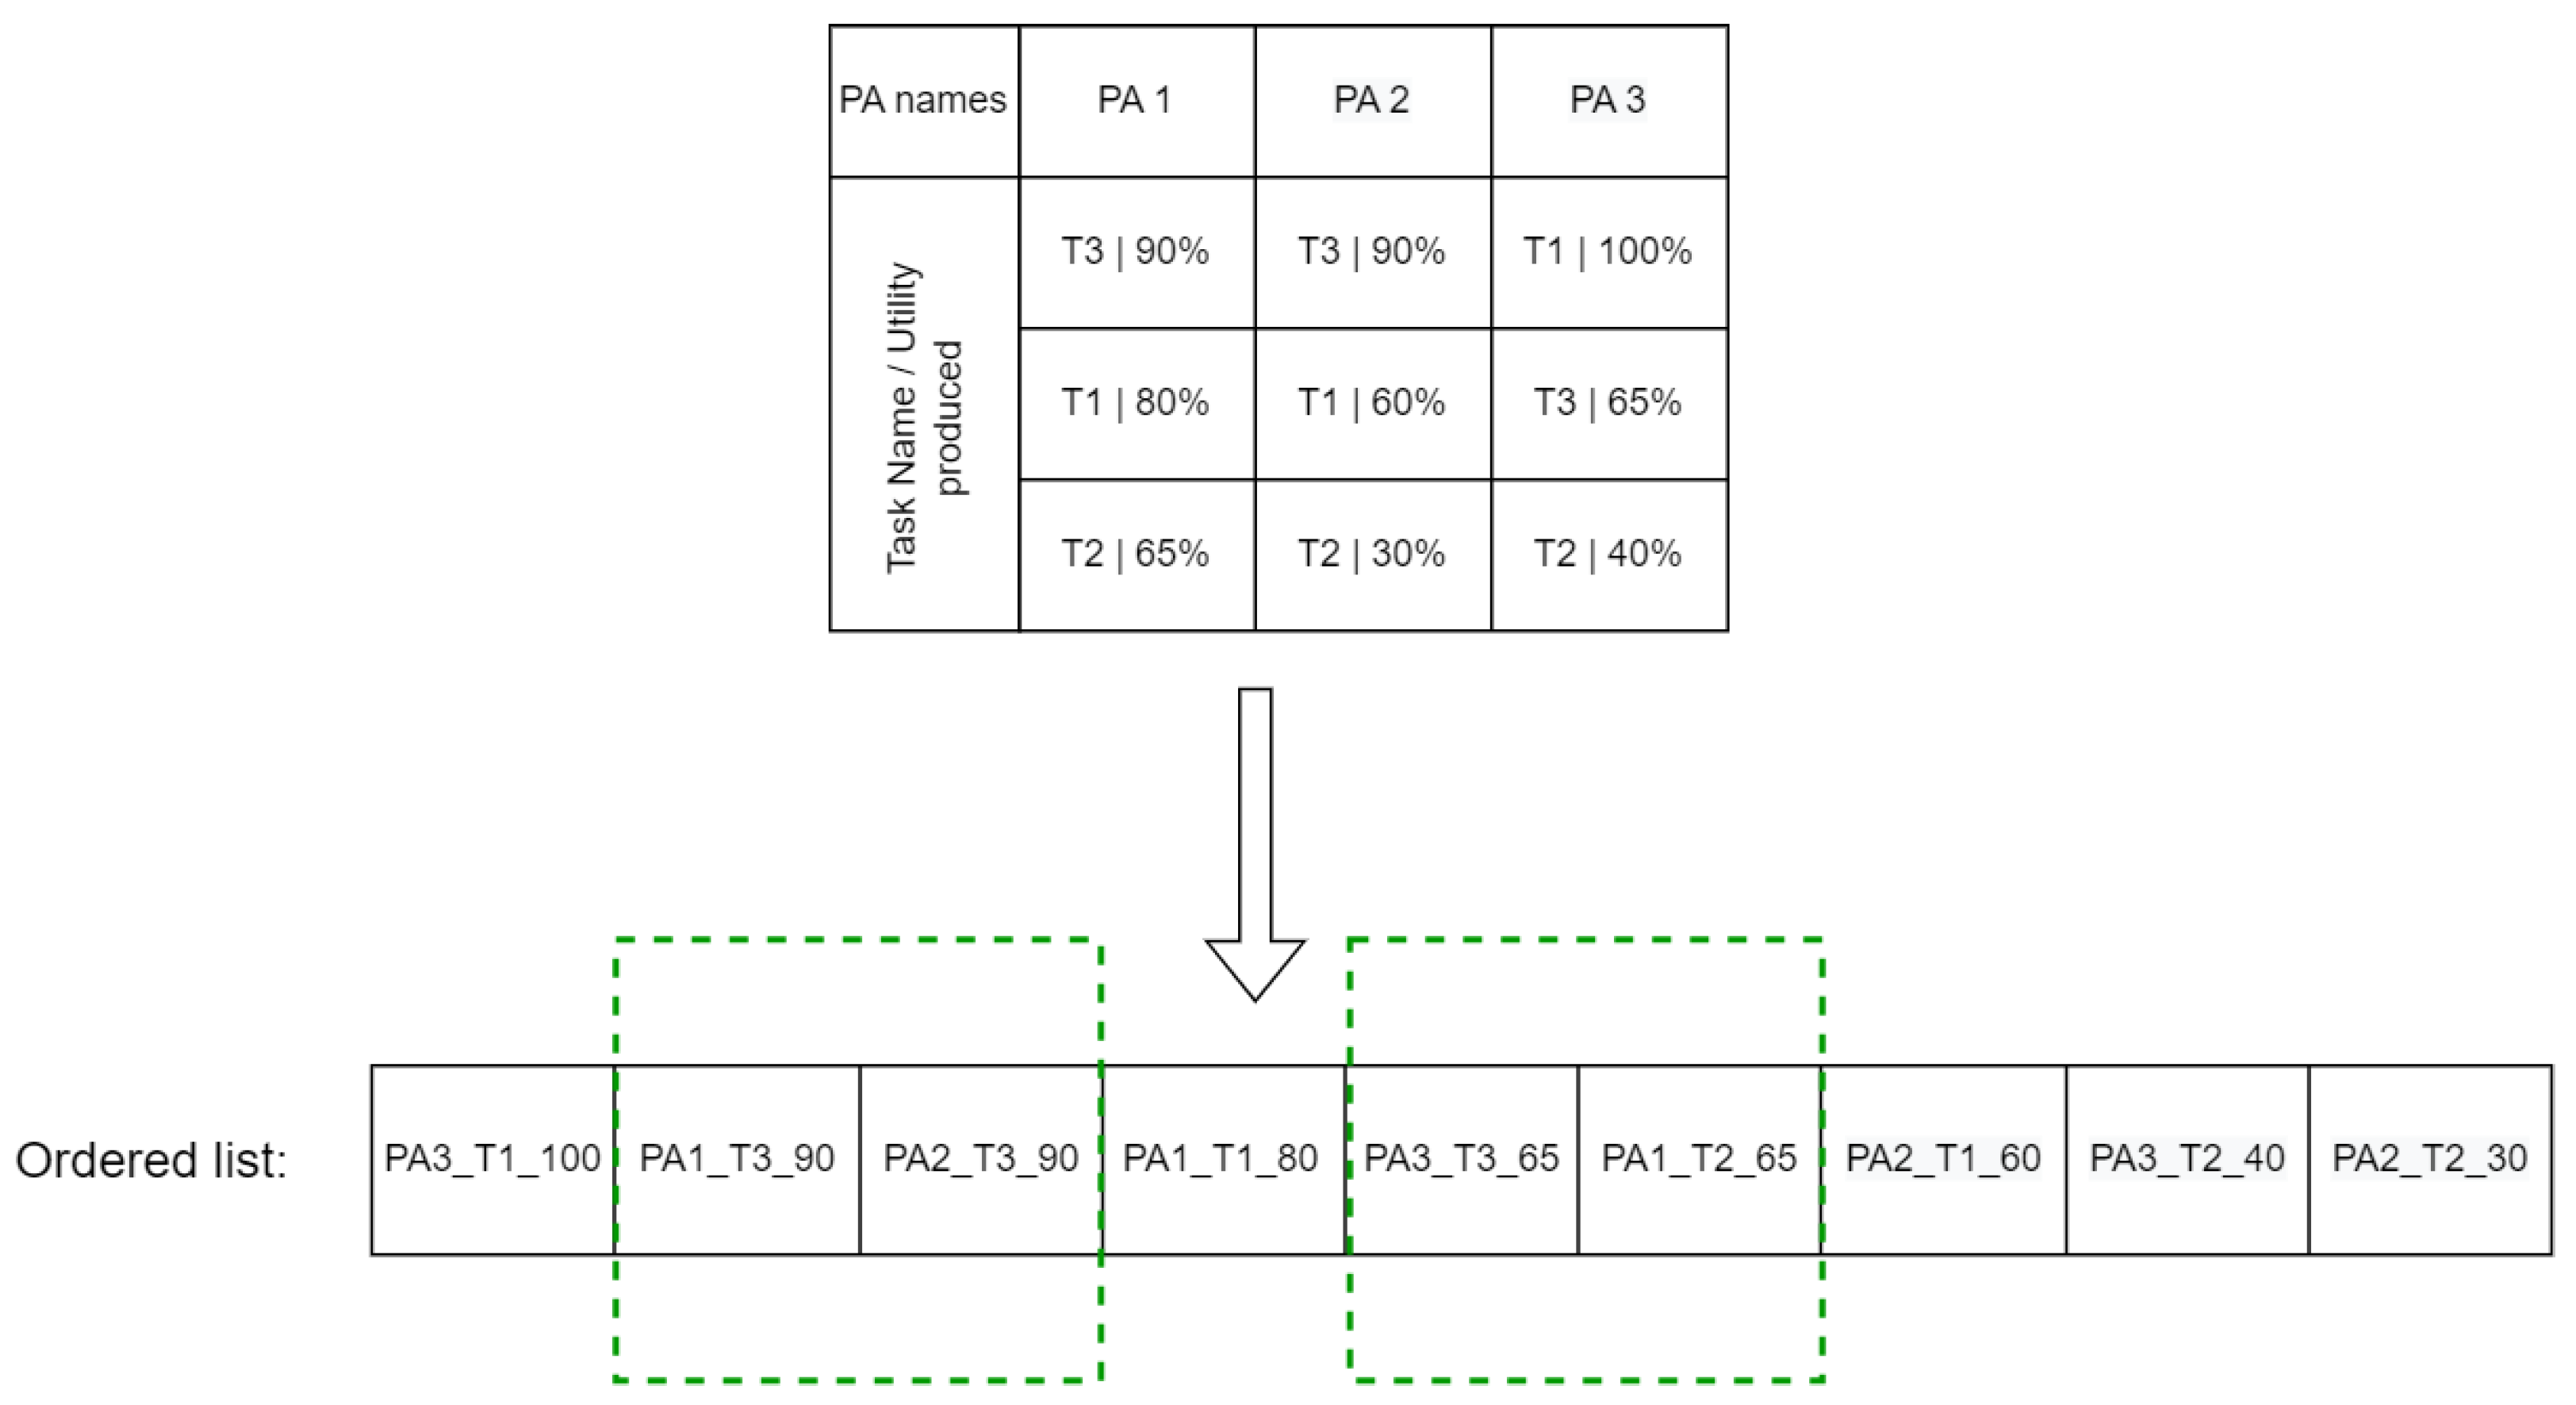
One particularity of this method is that there is not only a single task to be distributed but a list of tasks that is broadcast to the PAs. The number of tasks to be distributed is equal to the total number of PAs, or it is lower if the task queue does not contain a number of tasks equal to the total number of PAs. After the PAs receive the list of proposed tasks and analyze the utility that those tasks produce, each PA sends the list of preferences back to the dispatcher, which is sorted in descending order by the utility produced by the tasks. The dispatcher agent gathers the lists of preferences from each PA and merges them in a single list sorted in descending order of the utility produced by each task. This step of the algorithm is presented in Figure 5. An important mention is that when the same task produces the same utility for different agents, the agent–task–utility tuples are placed randomly in the list, not ordered by a specific criterion (such as agent name or task name), as it is highlighted with green in the aforementioned figure.
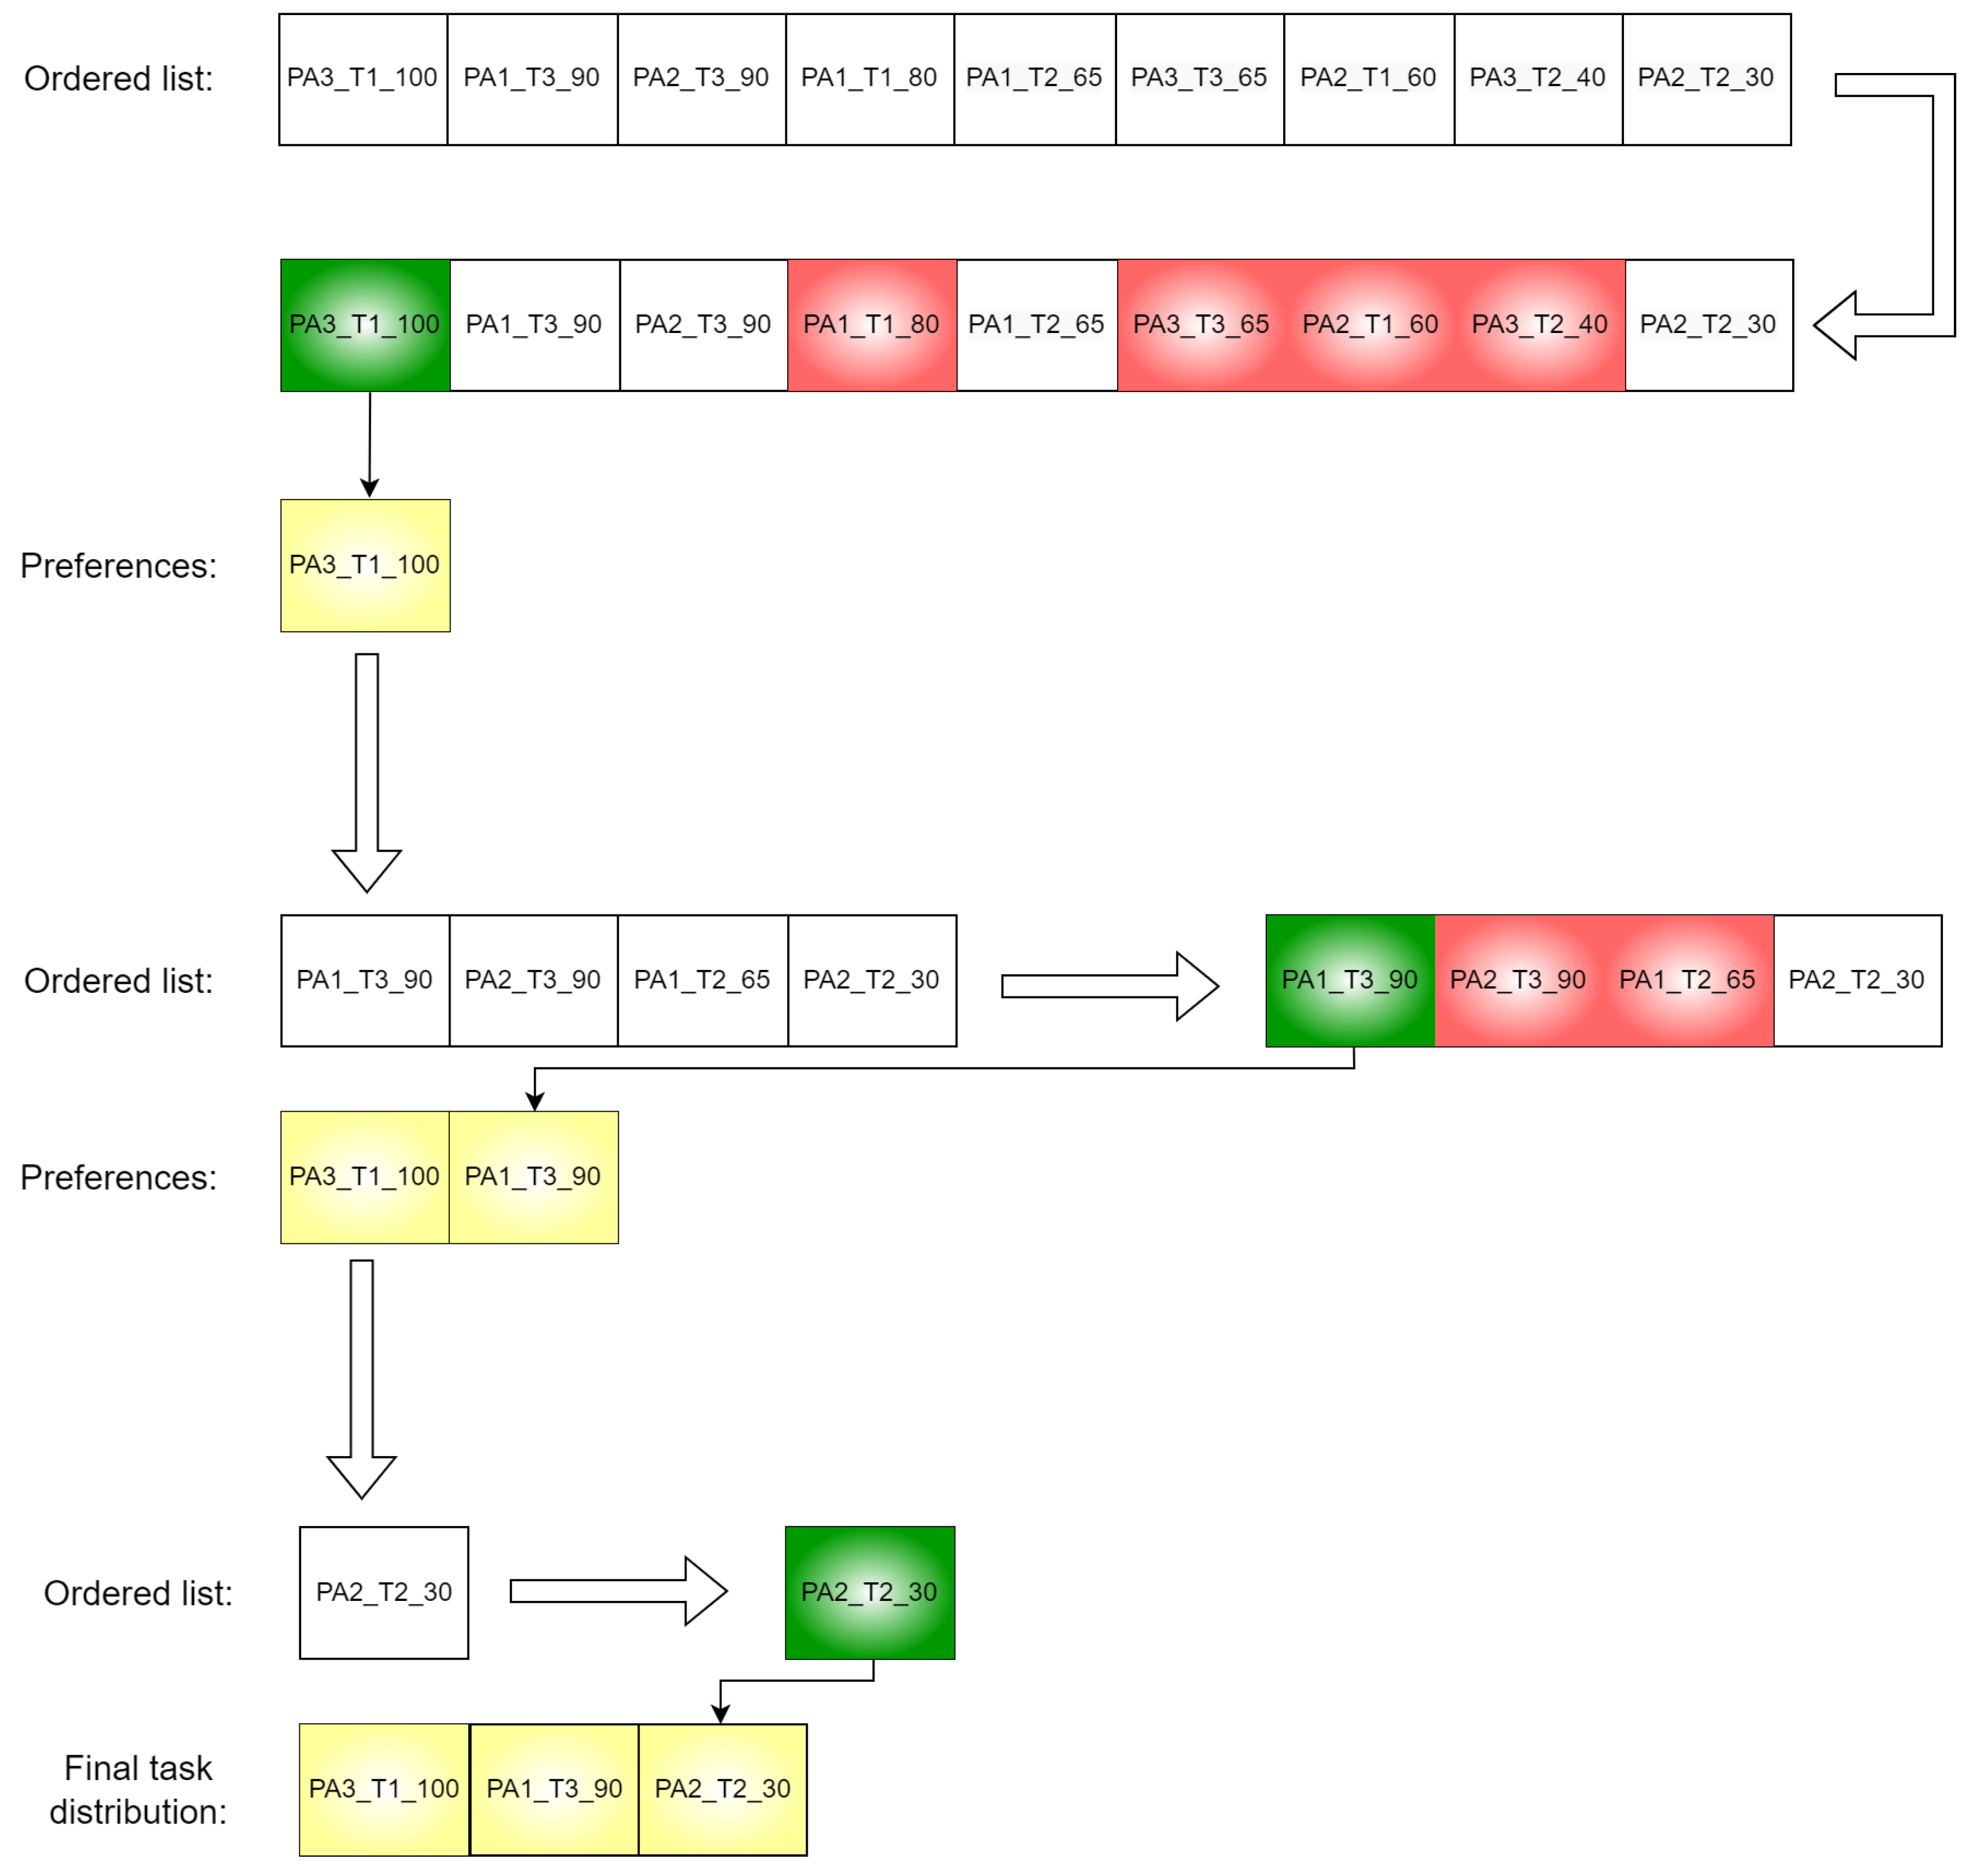
After the preparation step, once the list of task preferences is created, the next step is an iterative process that is presented in Figure 6. At each iteration, the first tuple from the list is selected (illustrated by the green tuple in the figure) and moved to a helper list; then, all the tuples that contain either the name of the PA from the selected tuple or the name of the task are removed (illustrated with red in the figure). This process is repeated until the task preferences list is empty, meaning that all the PAs have a task ready to be assigned to them.

3.4. Metrics Description

In the next section, the results of the conducted experiments will be presented and detailed. For a better understanding of what the results represent and how those values are obtained, in this subsection, the variables used and the metrics computed are introduced and described. An important mention is that in order to produce statistically valid results, each experiment is executed multiple times, and the generated metrics are scaled based on the number of executions. Another important mention in order to avoid confusions is that the term “turn” should be perceived as a time unit and it is different from the term “simulation step”, which represents one complete execution of the experiment. The notations are described in Table 1 and Table 2.
The metrics used in the experimental studies appear to be relevant for the assessment of the results. However, an empirical approach can open the possibility of optimizing the wrong metric. This is in a way similar to using an inappropriate reward function in multi-agent reinforcement learning, which can lead to agents learning incorrect strategies. For example, in some games, improper reward functions can cause the agents to behave in ways that can be exploited by opponents. Therefore, such reward functions can also be learned from observed behavior in a supervised fashion using, e.g., inverse reinforcement learning. In our case, it must be mentioned that the implemented system allows the addition of other metrics in a straightforward manner. This can alleviate the risk one faces when trying to optimize an imperfect metric. If several different metrics show consistent performance, this increases the chances that the results are indeed valid.

4. Experimental Results and Discussion

This section includes descriptions of the conducted experiments and discussions regarding the obtained results.
The tasks used during the simulations do not have priorities and are randomly generated, varying the attributes of the tasks; the most important are the required resources, i.e., the processing power and time. The limits of the intervals that determine the needed resources were empirically chosen and varied in such a way that numerous scenarios are covered.
When the distribution strategies are compared, in order to have the same conditions and to provide an accurate comparison of the strategies, the same list of tasks is used for all distribution methods in a certain configuration of required resources. In this way, the potential questions and doubts regarding the fairness of the comparison between the distribution strategies are eliminated.
All the experiments are executed with various configurations; however, some parameters remain unchanged throughout the experiments. A summary of the parameters and their values are listed below:
  • The number of tasks that are used in the experiments is 500;
  • The number of simulation steps is 50;
  • The number of PAs is always 5. The processing power of a PA is 100 (this can be regarded as 100% available processing power);
  • The maximum number of HAs per PA is 3. The capacity of one HA is 5. In other words, one HA is able to handle 5% of the total available processing power of a PA;
  • The minimum and maximum task times (the time is expressed as the number of turns) are varied to produce 3 intervals: [1; 5] (small processing time required), [3; 15] (broad processing time required), and [10; 15] (large processing time required);
  • The minimum and maximum task resources required represent the numbers that show how much the availability of a PA will decrease after the task will be accepted. As for the time required, these are varied to produce 3 intervals: [1; 20] (small number of resources required), [1; 40] (broad processing power required), and [20; 40] (high processing capacity required).
The results that will be further presented represent an average of 50 runs, which represent the number of simulation steps.
In order to keep the tables with results more compact, the metrics will be referred to as defined in Table 2, and some abbreviations will be used for the distribution strategies, namely:
  • Agents preferences (AP);
  • Max-utility (Mu);
  • Max-availability (Ma);
  • Random (Rnd);
  • Round Robin (RR).

4.1. Description of Results

In this section, the results obtained during the simulations are centralized and presented in Table 3, Table 4, Table 5, Table 6 and Table 7, which contain the following metrics: the average load per turn aggregated on all PAs ( l p ), the average number of turns with at least one HA per turn ( t 1 ), the average number of HAs per turn aggregated on all PAs ( t a ), and the maximum difference between PAs average load per turn ( δ p ) in all combinations of task loads and times. Table 6 and Table 7 describe the average values of the required processing power ( θ p ) and time (turns, θ t ) for the lists of tasks used in the experiments. The cells where the values are missing (“-”) are present in the sections related to the number of HAs and show that for that specific scenario, no HA was spawned.

4.2. Analysis and Interpretation of Results

Analyzing the average load per turn in Table 3, Table 4 and Table 5 and the average processing power required per task in Table 6, we observed the following correlations between the mentioned metrics. For the agents preferences strategy, in all combinations of required times and loads, the average load per turn for a PA is at least 2.5 times higher than the average processing power required by the tasks, e.g.,:
  • The average required processing power per task of 9.78 produces an average load per turn equal to ≈24.2, meaning that the average load per turn is ≈2.49 times higher than the average processing power required per task;
  • The average required processing power per task of 19.6 generates an average load per PA equal to ≈48.7, which means that the average load per PA is ≈2.48 times higher than the average required processing per task;
  • The average required processing power per task of 29.52 results in an average load per PA equal to ≈67.4, resulting in an average load per PA ≈2.28 times higher than the average processing power required by a task.
For the rest of the strategies from Section 3.3.1, Section 3.3.2, Section 3.3.3 and Section 3.3.4, the analysis revealed that the average load per turn for a PA is ≈2 times lower than the average processing power required by a task (applicable only for the scenarios with tasks with a low required processing time), e.g.,:
  • The average required processing power per task of 9.78 produces an average load per turn equal to ≈4.93, resulting in an average load per turn ≈1.98 times lower than the average required processing power per task;
  • The average required processing power per task of 19.6 generates an average load per PA equal to ≈10.12, resulting in an ≈1.93 times difference between the two;
  • The average required processing power per task of 29.52 results in an average load per PA equal to ≈14.7, generating an ≈2 times difference between them.
To support our statement related to the relationship between the average load per turn for a PA and the average processing power required by a task, we extracted related data from Table 3, Table 4, Table 5, Table 6 and Table 7 and generated a visual representation of the correlation between the average processing power per task and the time increase based on the distribution strategy.
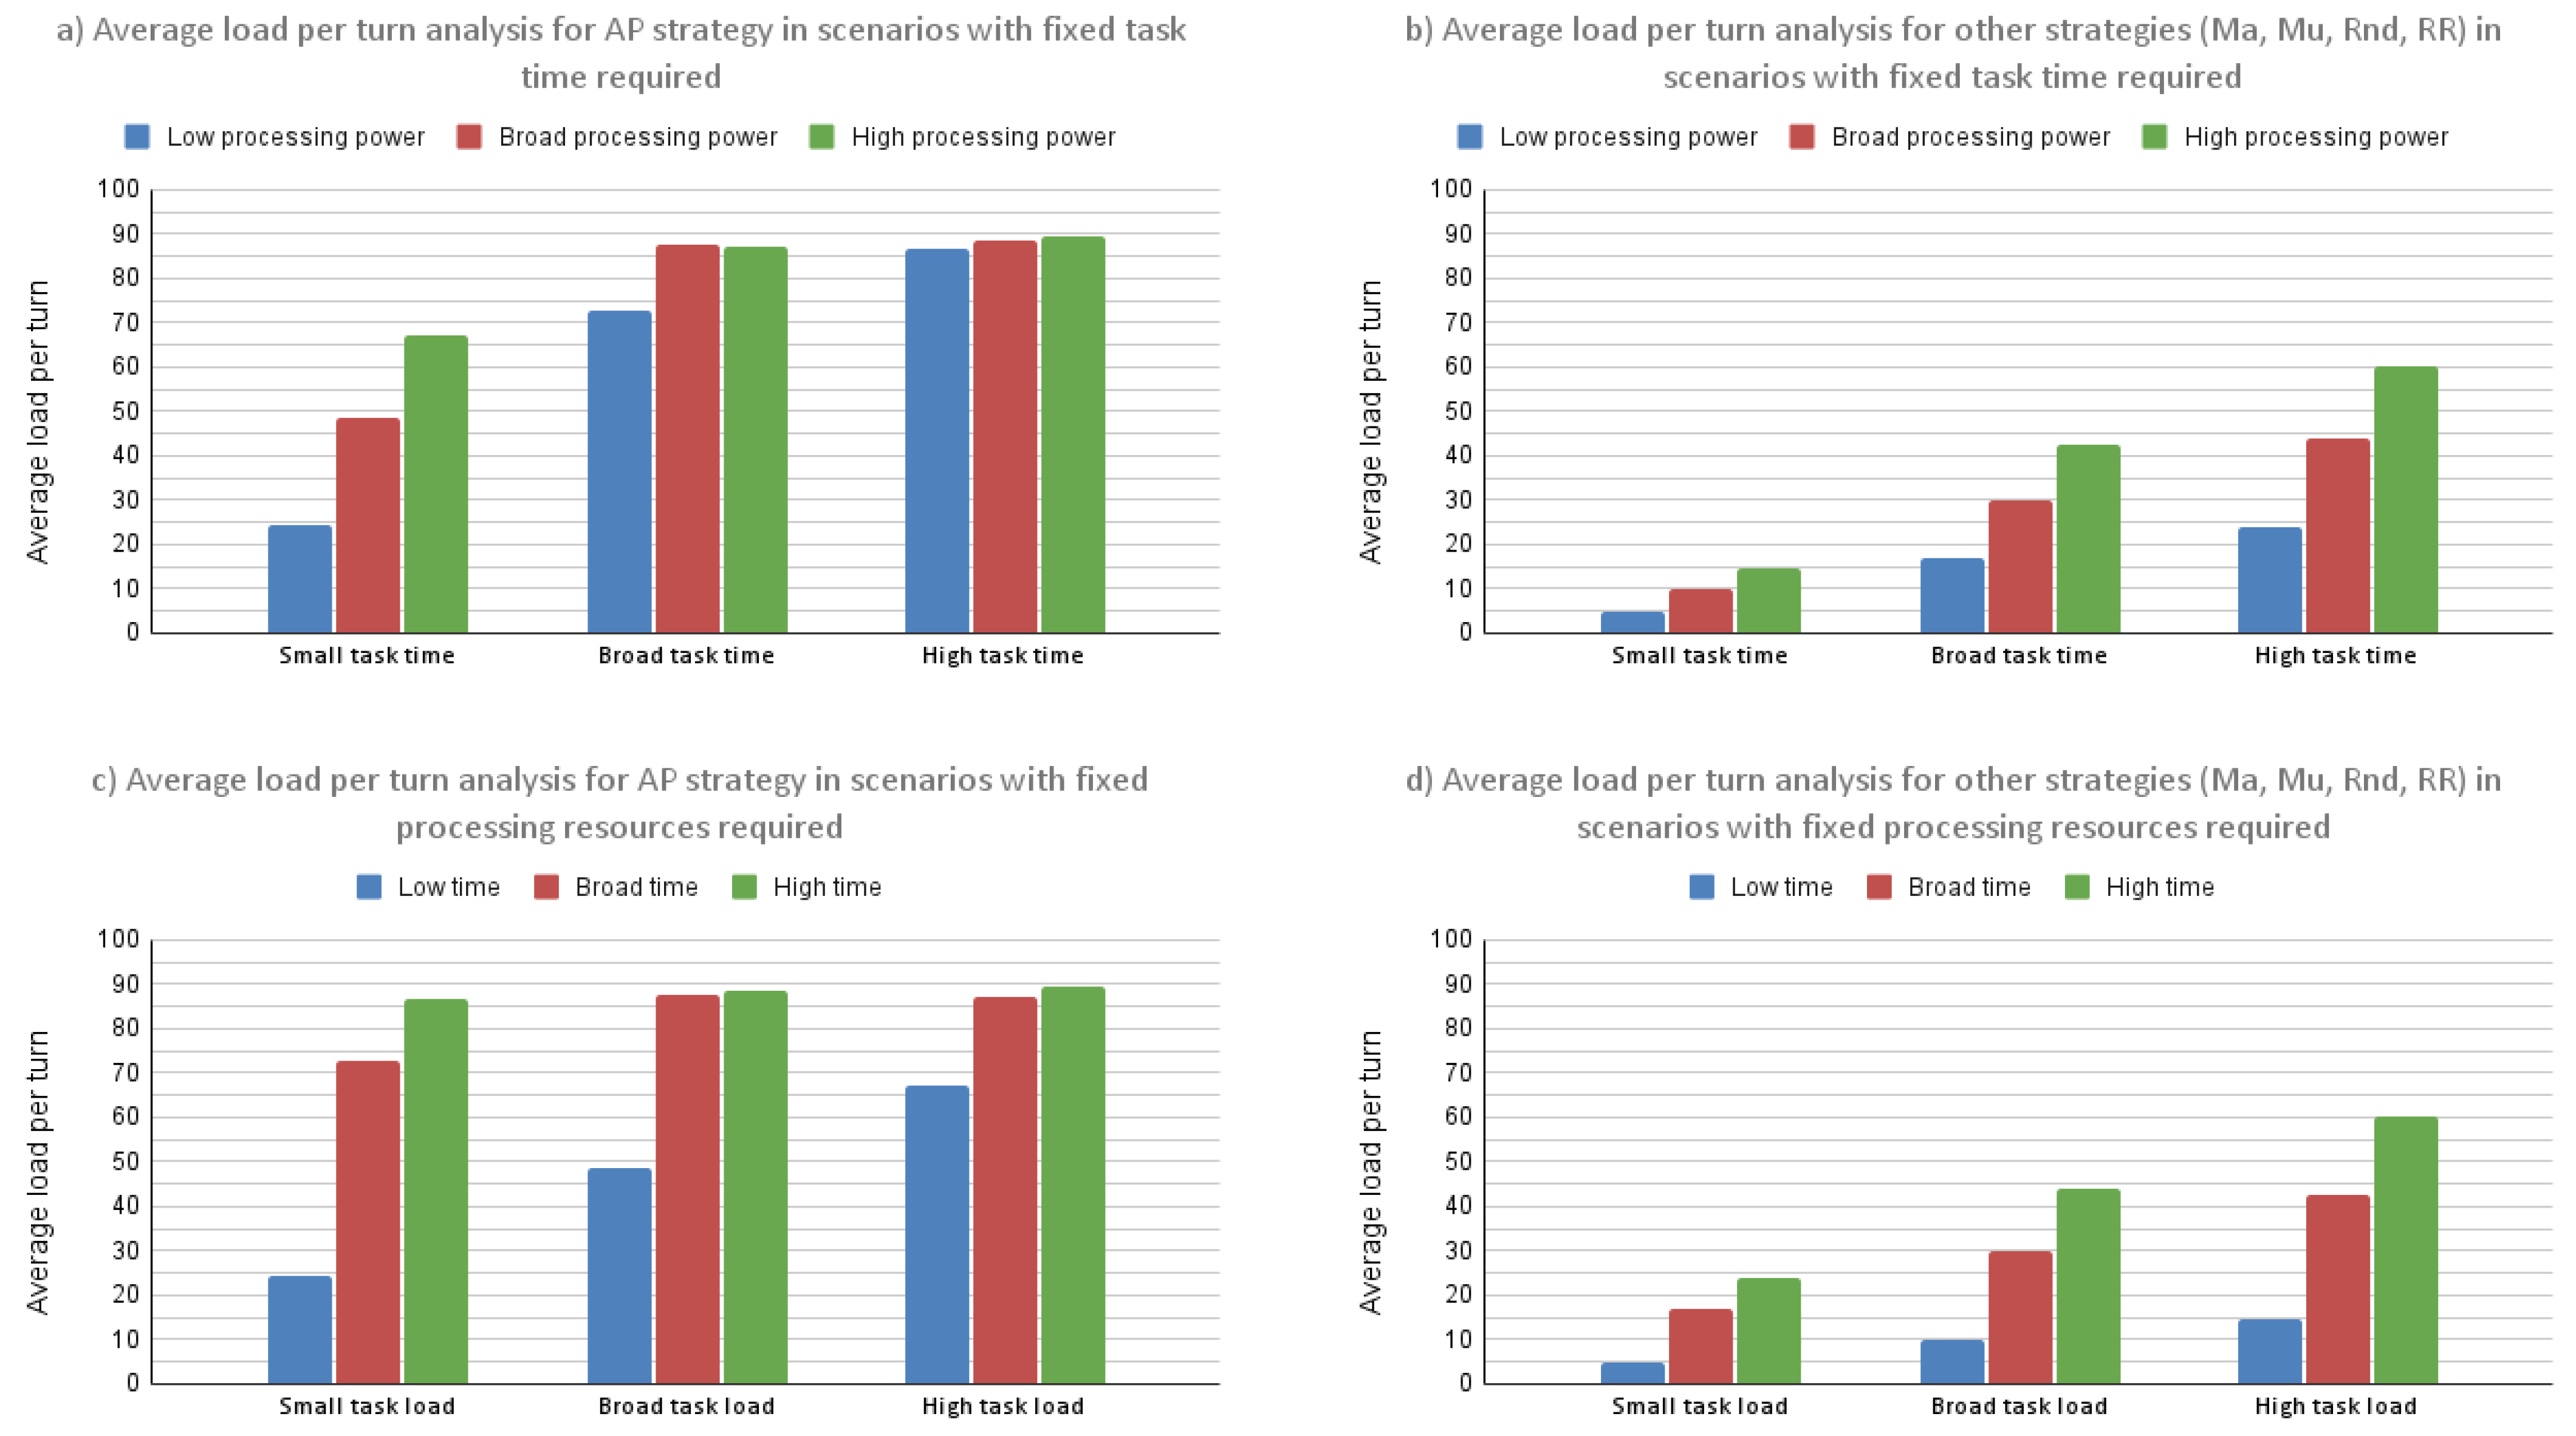
In Figure 7, we present a visual interpretation of how the average load per turn behaves in scenarios with increases of the required processing power per task and required processing time per task for the already mentioned distribution strategies. As the average loads per turn for all the strategies except agents preferences are similar (with some differences for the Random strategy, which is reduced by the presence of HA), we grouped Max-utility, Max-availability, Random and Round Robin in the same category, which is referred to in Figure 7 as “other strategies”. The analysis of the figure highlights the difference in how the average load per turn evolves in the aforementioned strategies.
For the agents preferences strategy, the gap between the values of the average load per turn for different configurations of the tasks required resources is decreasing as the tasks requirements are increasing. For the other compared strategies, the differences between the average load per turn remain constant with the increase of the tasks required resources. This behavior is explainable by the distribution logic of the discussed strategies. The agents preferences strategy is focused on maximizing the utilities of each PA, so as one of the two required resources (time and processing power) is increasing, this will produce an increase in the average load per turn. For the rest of the strategies, taking into account that the distribution process is not directly focused on the utility improvement and that the approaches have similarities from the perspective of the presence of a random factor, the differences in the average load per turn remain constant as one of the required resources increases and the increase of the average load per turn is proportional with the increase factor of the required resource.
Analyzing the data from Table 3, Table 4 and Table 5 with the focus on the maximum difference between PAs average load per turn ( δ p ), we present our main findings in the following paragraphs.
The Max-availability strategy is the one that obtained the best results in terms of minimizing the difference between the PAs in all scenarios except for one (tasks with small processing time required and broad required processing power). Based on our experiments and comparisons, the Max-availability strategy is the most suitable (compared with the presented strategies) for scenarios where the load difference between the PAs has to be minimized.
Another finding is related to the impact of the increase in the resources required by the tasks, i.e., processing time and processing power. Analyzing the aforementioned tables, we observed that the increase of the required processing time tends to produce a higher difference between the PAs’ average load than the increase of the required processing power. This can be explained as follows: a higher processing time in combination with one of the proposed strategies may lead to scenarios with fewer tasks to process for a PA or new tasks received after a long period of time (proportional with the task processing time), leading to a decrease in the average processing time and causing bigger gaps to appear between the PAs.
The analysis of the metrics related to the presence of the HAs in the simulations leads to the following findings.
The Round Robin strategy is the only one that does not need to spawn any HA during the simulations. This can be explained because the way in which the method works, as described in Section 3.3.1, combined with the parameters used for the tasks duration and required processing power drastically reduces the probability to have a scenario where HAs would be needed.
Another important aspect is the behavior in case of using the Random distribution strategy. As the task requirements start to increase (both time and processing power required), the usage of the HAs increases, too. The average load per turn remains lower compared to the rest of the strategies, but the increased presence of the HAs compensates. Taking into account the fact that the average number of HAs per turn is lower than the same metric in the context of the agents preferences strategy, the relatively high presence of the HAs can be explained by the arbitrary character of the distribution.
The statistics related to the HAs produced by the agents preferences strategy indicates that the HAs are used up to the maximum potential, taking into account not only the high number of turns with at least one HA active but also the rate of HAs per turn for the turns with active HAs. This happens due to the focus of the PAs to maximize its own utility.
For the agents preferences method, maximizing the utility of the PAs means that the resources are used in a more efficient way and the energy consumed by the PAs is utilized in a more efficient way. Instead of having machines (PAs) with only a small percentage of the available resources used while consuming the same amount of energy (Max-availability, Max-utility, Random and Round Robin), the agents preferences strategy improves the utility of the PAs, which come with the overall benefit of optimizing the energy consumption.
Some findings related to the dependency between the strategy used and the system behavior are presented. Agents preferences is the most suitable strategy if the request is to maximize the usage of the system’s processing resources, while the other strategies need tasks with increased requirements in order to use more processing resources of the system. In terms of obtaining a balance between all the processors of the system, the strategy that minimizes the differences between the processors, based on the results obtained in our simulation, is the Max-availability strategy. In addition to the impact of the strategies over the system, it is worth mentioning the impact that the distribution of the tasks can have over the results of a distribution strategy and hence over the system. For example, the tasks with an increased processing time required produce a higher imbalance between the system’s processors than an increase in the required processing power.

4.3. Brief Summary of Results

In scenarios when the objective is to use the processors at their highest processing potential (higher load rate for the processors), the agents preferences strategy described in Section 3.3.5 should be the chosen one, as it produces the best usage of the processors resources.
Based only on the analysis of the results related to the PAs, the Random distribution strategy seems to produce the lowest average load per turn among the PAs in all the conducted experiments. Analyzing the statistics related to the HAs for the Random strategy, one may observe that the lower load per turn for the PAs masks a higher load of the HAs, which is a scenario that is easier to observe for tasks with higher required processing time. Thus, the random distribution should be avoided when possible, taking into account its arbitrary behavior.
Based on the results obtained in the conducted experiments, the Maximum Availability strategy described in Section 3.3.3 produced the lowest degree of unbalance between the processors during the simulation. If the requirement is to have a balance between the load of the PAs, the Maximum Availability strategy is better than the rest of the compared strategies.
One of the findings that results from the analysis of the maximum difference between the PAs across different configurations and strategies reveals that the strategy that minimizes the difference between the PAs in 94.4% of the scenarios that we simulate is the Max-availability strategy.

5. Conclusions

In this work, our focus was divided into two parts. First, there is the implementation part where we designed and created the entire system with all the entities, behaviors and metrics described in Section 3, such that we are enabled to proceed with the experimental part. The second part, the experimental one, consists in preparing the simulations, executing the experimental scenarios, recording the results, and analyzing the results with an emphasis on the relation between the characteristics of the tasks and the behavior of the processor agents.
Analyzing the maximum difference between the PAs’ load per turn, the results show that an increase in the time required by the tasks produces a higher imbalance than an increase in the processing power required by tasks.
Moving forward to the analysis of the results related to the HA, one conclusion is that the Round Robin strategy does not need any HAs during the simulations. This happens because of the distribution logic of the method and because the simulation attributes that we proposed lead to a very reduced chance for a PA to need help from a HA, particularly for the Round Robin strategy. Analyzing the strategies with the highest number of HAs spawned, the conclusion is that the Random strategy has a high statistic for the HAs due to the arbitrary character of the method compared to the agents preference where the HAs are spawned by intention by the PAs, maximizing their utility.
The study offers recommendations on which distribution strategy to choose based on the type of the tasks to be distributed and on the expectations from the system (higher load for the processors, minimization of the imbalance between the PAs, etc.). In addition, the study may serve as a starting point to a more in-depth analysis of the task particularities and how these impact the performance of the task distribution process.
The experiments and strategies that we propose address only a small part of the general problem of task distribution. As future work, we intend to add more distribution strategies to be part of the experiments and also to extend the experiments with more varied scenarios of resource type and allocation in order to have a broader view of a variety of scenarios. One limitation is represented by the ideal character of the system, which does not emulate possible faulty scenarios with failing or unresponsive PAs, failover mechanisms to recover from the faulty states, or network disturbances and delays in communication. An analysis of the algorithms in more dynamic scenarios is the next step in our future work. Another limitation is related to the centralized architecture of the system, which does not support a more dynamic environment. In our future investigations, we plan to analyze both fully decentralized and hybrid architectures, i.e., architectures with combined centralized and decentralized features.

Author Contributions

Conceptualization, D.-D.V. and F.L.; methodology, D.-D.V.; software, D.-D.V.; validation, F.L. and D.L.; investigation, D.-D.V.; writing—original draft preparation, D.-D.V., F.L. and D.L.; writing—review and editing, D.-D.V. and F.L. All authors have read and agreed to the published version of the manuscript.

Funding

This research received no external funding.

Data Availability Statement

Data sharing not applicable.

Conflicts of Interest

The authors declare no conflict of interest.

References

  1. Pinedo, M. Scheduling. Theory, Algorithms, and Systems, 4th ed.; Springer: Berlin/Heidelberg, Germany, 2012. [Google Scholar]
  2. Zhang, A.-N.; Shu-Chuan, C.; Song, P.; Wang, H.; Pan, J. Task Scheduling in Cloud Computing Environment Using Advanced Phasmatodea Population Evolution Algorithms. Electronics 2022, 11, 1451. [Google Scholar] [CrossRef]
  3. Gawali; Bhatu, M.; Shinde, S.K. Task Scheduling and Resource Allocation in Cloud Computing Using a Heuristic Approach. J. Cloud Comput. 2018, 7, 1–16. [Google Scholar] [CrossRef]
  4. Filho, S.; Pinheiro, M.; Albuquerque, P.; Rodrigues, J. Task Allocation in Distributed Software Development: A Systematic Literature Review. Complexity 2018, 2018, 1–13. [Google Scholar] [CrossRef] [Green Version]
  5. Filho, S.; Pinheiro, M.; Albuquerque, P.; Simão, A.; Azevedo, E.; Sales Neto, R.; Nunes, L. A Multicriteria Approach to Support Task Allocation in Projects of Distributed Software Development. Complexity 2019, 2019, 1–22. [Google Scholar] [CrossRef]
  6. Gu, M.; Zheng, J.; Hou, P.; Dai, Z. Task Allocation for Product Development Projects Based on the Knowledge Interest. In Proceedings of the 6h International Conference on Information Science and Control Engineering (ICISCE), Shanghai, China, 20–22 December 2019; pp. 600–604. [Google Scholar] [CrossRef]
  7. William, P.; Pardeep Kumar, G.S.; Vengatesan, C.K. Task Allocation in Distributed Agile Software Development Using Machine Learning Approach. In Proceedings of the International Conference on Disruptive Technologies for Multi-Disciplinary Research and Applications (CENTCON), Online, 22–24 December 2021; pp. 168–172. [Google Scholar] [CrossRef]
  8. Heidari, A.; Jabraeil Jamali, M.A.; Jafari Navimipour, N.; Akbarpour, S. Deep Q-Learning Technique for Offloading Offline/Online Computation in Blockchain-Enabled Green IoT-Edge Scenarios. Appl. Sci. 2022, 12, 8232. [Google Scholar] [CrossRef]
  9. Nguyen, T.A.; Fe, I.; Brito, C.; Kaliappan, V.K.; Choi, E.; Min, D.; Lee, J.W.; Silva, F.A. Performability Evaluation of Load Balancing and Fail-over Strategies for Medical Information Systems with Edge/Fog Computing Using Stochastic Reward Nets. Sensors 2021, 21, 6253. [Google Scholar] [CrossRef]
  10. Leon, F. Self-organization of Roles Based on Multilateral Negotiation for Task Allocation. In Proceedings of the Ninth German Conference on Multi-Agent System Technologies (MATES 2011), Berlin, Germany, 4–7 October 2011; Lecture Notes in Artificial Intelligence, LNAI 6973. Springer: Berlin/Heidelberg, Germany, 2011; pp. 173–180. [Google Scholar] [CrossRef]
  11. Heidari, A.; Jabraeil Jamali, M.A. Internet of Things intrusion detection systems: A comprehensive review and future directions. Cluster Comput. 2022. [Google Scholar] [CrossRef]
  12. Yan, S.-R.; Pirooznia, S.; Heidari, A.; Navimipour, N.J.; Unal, M. Implementation of a Product-Recommender System in an IoT-Based Smart Shopping Using Fuzzy Logic and Apriori Algorithm. IEEE Trans. Eng. Manag. 2022. [Google Scholar] [CrossRef]
  13. Yichuan, J. A Survey of Task Allocation and Load Balancing in Distributed Systems. IEEE Trans. Parallel Distrib. Syst. 2016, 27, 585–599. [Google Scholar] [CrossRef]
  14. Lim, J.; Lee, D. A Load Balancing Algorithm for Mobile Devices in Edge Cloud Computing Environments. Electronics 2020, 9, 686. [Google Scholar] [CrossRef] [Green Version]
  15. Shahbaz, A.; Kavitha, G. Load balancing in cloud computing -A hierarchical taxonomical classification. J. Cloud Comput. 2019, 8. [Google Scholar] [CrossRef] [Green Version]
  16. Keivani, A.; Tapamo, J.R. Task scheduling in cloud computing: A review. In Proceedings of the 2019 International Conference on Advances in Big Data, Computing and Data Communication Systems (icABCD), Lesotho, South Africa, 5–6 August 2019; pp. 1–6. [Google Scholar] [CrossRef]
  17. Kumar, M.; Sharma, S.C.; Goel, A.; Singh, S.P. A comprehensive survey for scheduling techniques in cloud computing. J. Netw. Comput. Appl. 2019, 143, 1–33. [Google Scholar] [CrossRef]
  18. Alam Siddique, M.T.; Sharmin, S.; Ahammad, T. Performance Analysis and Comparison Among Different Task Scheduling Algorithms in Cloud Computing. In Proceedings of the 2020 2nd International Conference on Sustainable Technologies for Industry 4.0 (STI), Dhaka, Bangladesh, 19–20 December 2020; pp. 1–6. [Google Scholar] [CrossRef]
  19. Rodrigo, N.; Calheiros, R.R.; Beloglazov, A.; De Rose, C.A.F.; Buyya, R. CloudSim: A toolkit for modeling and simulation of cloud computing environments and evaluation of resource provisioning algorithms. Softw. Pract. Expert 2011, 41, 23–50. [Google Scholar] [CrossRef]
  20. Joo, T.; Jun, H.; Shin, D. Task Allocation in Human–Machine Manufacturing Systems Using Deep Reinforcement Learning. Sustainability 2022, 14, 2245. [Google Scholar] [CrossRef]
  21. Oliehoek, F.A.; Amato, C. A Concise Introduction to Decentralized POMDPs. In SpringerBriefs in Intelligent Systems; Springer: Berlin/Heidelberg, Germany, 2016. [Google Scholar]
  22. Liu, Y.; Wang, L.; Wang, Y.; Wang, X.; Zhang, L. Multi-agent-based scheduling in cloud manufacturing with dynamic task arrivals. Procedia CIRP 2018, 72. [Google Scholar] [CrossRef]
  23. Jensen, T.R.; Bjarne, T. Graph Coloring Problems; Wiley-Interscience: Hoboken, NJ, USA, 1995. [Google Scholar]
  24. Mostafaie, T.; Modarres, K.; Farzin, N.N. A systematic study on meta-heuristic approaches for solving the graph coloring problem. Comput. Oper. Res. 2019, 120, 104850. [Google Scholar] [CrossRef]
  25. Katoch, S.; Chauhan, S.S.; Kumar, V. A review on genetic algorithm: Past, present, and future. Multimed. Tools Appl. 2021, 80, 8091–8126. [Google Scholar] [CrossRef]
  26. Mirjalili, S. Evolutionary Algorithms and Neural Networks: Theory and Applications; Springer: Cham, Switzerland, 2019. [Google Scholar] [CrossRef] [Green Version]
  27. Wang, C.-N.; Yang, F.-C.; Nguyen, V.T.T.; Vo, N.T.M. CFD Analysis and Optimum Design for a Centrifugal Pump Using an Effectively Artificial Intelligent Algorithm. Micromachines 2022, 13, 1208. [Google Scholar] [CrossRef]
  28. Nguyen, T.; Huynh, T.; Vu, N.; Chien, K.V.; Huang, S.-C. Optimizing compliant gripper mechanism design by employing an effective bi-algorithm: Fuzzy logic and ANFIS. Microsyst. Technol. 2021, 27, 1–24. [Google Scholar] [CrossRef]
  29. Dorigo, M.; Birattari, M.; Stutzle, T. Ant Colony Optimization. IEEE Comput. Intell. Mag. 2006, 1, 28–39. [Google Scholar] [CrossRef]
  30. Deng, W.; Xu, J.; Zhao, H. An Improved Ant Colony Optimization Algorithm Based on Hybrid Strategies for Scheduling Problem. IEEE Access 2019, 7, 20281–20292. [Google Scholar] [CrossRef]
  31. Mbarek, F.; Volodymyr, M. Hybrid Nearest-Neighbor Ant Colony Optimization Algorithm for Enhancing Load Balancing Task Management. Appl. Sci. 2021, 11, 10807. [Google Scholar] [CrossRef]
  32. Zhiyuan, Y.; Zihan, D.; Clausen, T. Multi-Agent Reinforcement Learning for Network Load Balancing in Data Center. In Proceedings of the 31st ACM International Conference on Information & Knowledge Management (CIKM’22); Association for Computing Machinery: New York, NY, USA, 2022; pp. 3594–3603. [Google Scholar] [CrossRef]
  33. Rashid, T.; Samvelyan, M.; Witt, C.S.D.; Farquhar, G.; Jakob, N.; Shimon, F.W. QMIX: Monotonic Value Function Factorisation for Deep Multi-Agent Reinforcement Learning. arXiv 2018, arXiv:abs/1803.11485. [Google Scholar]
  34. Haarnoja, T.; Zhou, A.; Abbeel, P.; Levine, S. Soft Actor-Critic: Off-Policy Maximum Entropy Deep Reinforcement Learning with a Stochastic Actor. In Proceedings of the 36th International Conference on Machine Learning, Stockolm, Sweden, 10–15 July 2018. [Google Scholar]
  35. Miao, R.; Zeng, H.; Kim, C.; Lee, J.; Yu, M. SilkRoad: Making Stateful Layer-4 Load Balancing Fast and Cheap Using Switching ASICs. In Proceedings of the Conference of the ACM Special Interest Group on Data Communication (SIGCOMM’17); Association for Computing Machinery: New York, NY, USA, 2017; pp. 15–28. [Google Scholar] [CrossRef]
  36. Eisenbud, D.E.; Cheng, Y.; Contavalli, C.; Smith, C.; Kononov, R.; Mann-Hielscher, E.; Cilingiroglu, A.; Cheyney, B.; Shang, W.; Hosein, J.D. Maglev: A Fast and Reliable Software Network Load Balancer; NSDI: New York, NY, USA, 2016. [Google Scholar]
  37. Aghdai, A.; Chu, C.-Y.; Xu, Y.; Dai, D.H.; Xu, J.; Chao, H.J. Spotlight: Scalable Transport Layer Load Balancing for Data Center Networks. IEEE Trans. Cloud Comput. 2022, 10, 2131–2145. [Google Scholar] [CrossRef]
  38. Goren, G.; Shay, V.; Yoram, M. Distributed Dispatching in the Parallel Server Model. arXiv 2020, arXiv:abs/2008.00793. [Google Scholar] [CrossRef]
  39. Linux Virtual Server. Job Scheduling Algorithms in Linux Virtual Server. 2011. Available online: http://www.linuxvirtualserver.org/docs/scheduling.html (accessed on 6 October 2022).
  40. Kwa, H.L.; Leong, K.J.; Bouffanais, R. Balancing Collective Exploration and Exploitation in Multi-Agent and Multi-Robot Systems: A Review. Front. Robot. AI 2022, 8, 771520. [Google Scholar] [CrossRef] [PubMed]
  41. Leon, F. ActressMAS, a .NET Multi-Agent Framework Inspired by the Actor Model. Mathematics 2022, 10, 382. [Google Scholar] [CrossRef]
  42. Smith, S. The Contract Net Protocol: High-Level Communication and Control in a Distributed Problem Solver. IEEE Trans. Comput. 1980, C-29, 1104–1113. [Google Scholar] [CrossRef]
  43. Mostafa, S.M.; Hirofumi, A. Dynamic Round Robin CPU Scheduling Algorithm Based on K-Means Clustering Technique. Appl. Sci. 2020, 10, 5134. [Google Scholar] [CrossRef]
  44. Alhaidari, F.; Balharith, T.Z. Enhanced Round-Robin Algorithm in the Cloud Computing Environment for Optimal Task Scheduling. Computers 2021, 10, 63. [Google Scholar] [CrossRef]
  45. Kemptechnologies.com. Round Robin Load Balancing. Available online: https://kemptechnologies.com/load-balancer/round-robin-load-balancing (accessed on 30 July 2022).
  46. Nginx.com. HTTP Load Balancing. Available online: https://docs.nginx.com/nginx/admin-guide/load-balancer/http-load-balancer/ (accessed on 30 July 2022).
  47. Haas, C.; Hall, M.; Vlasnik, S.L. Finding Optimal Mentor-Mentee Matches: A Case Study in Applied Two-Sided Matching. Heliyon 2018, 4, e00634. [Google Scholar] [CrossRef]
  48. Ren, J.; Feng, X.; Chen, X.; Liu, J.; Hou, M.; Shehzad, A.; Sultanova, N.; Kong, X. Matching Algorithms: Fundamentals, Applications and Challenges. IEEE Trans. Emerg. Top. Comput. Intell. 2021, 5, 332–350. [Google Scholar] [CrossRef]
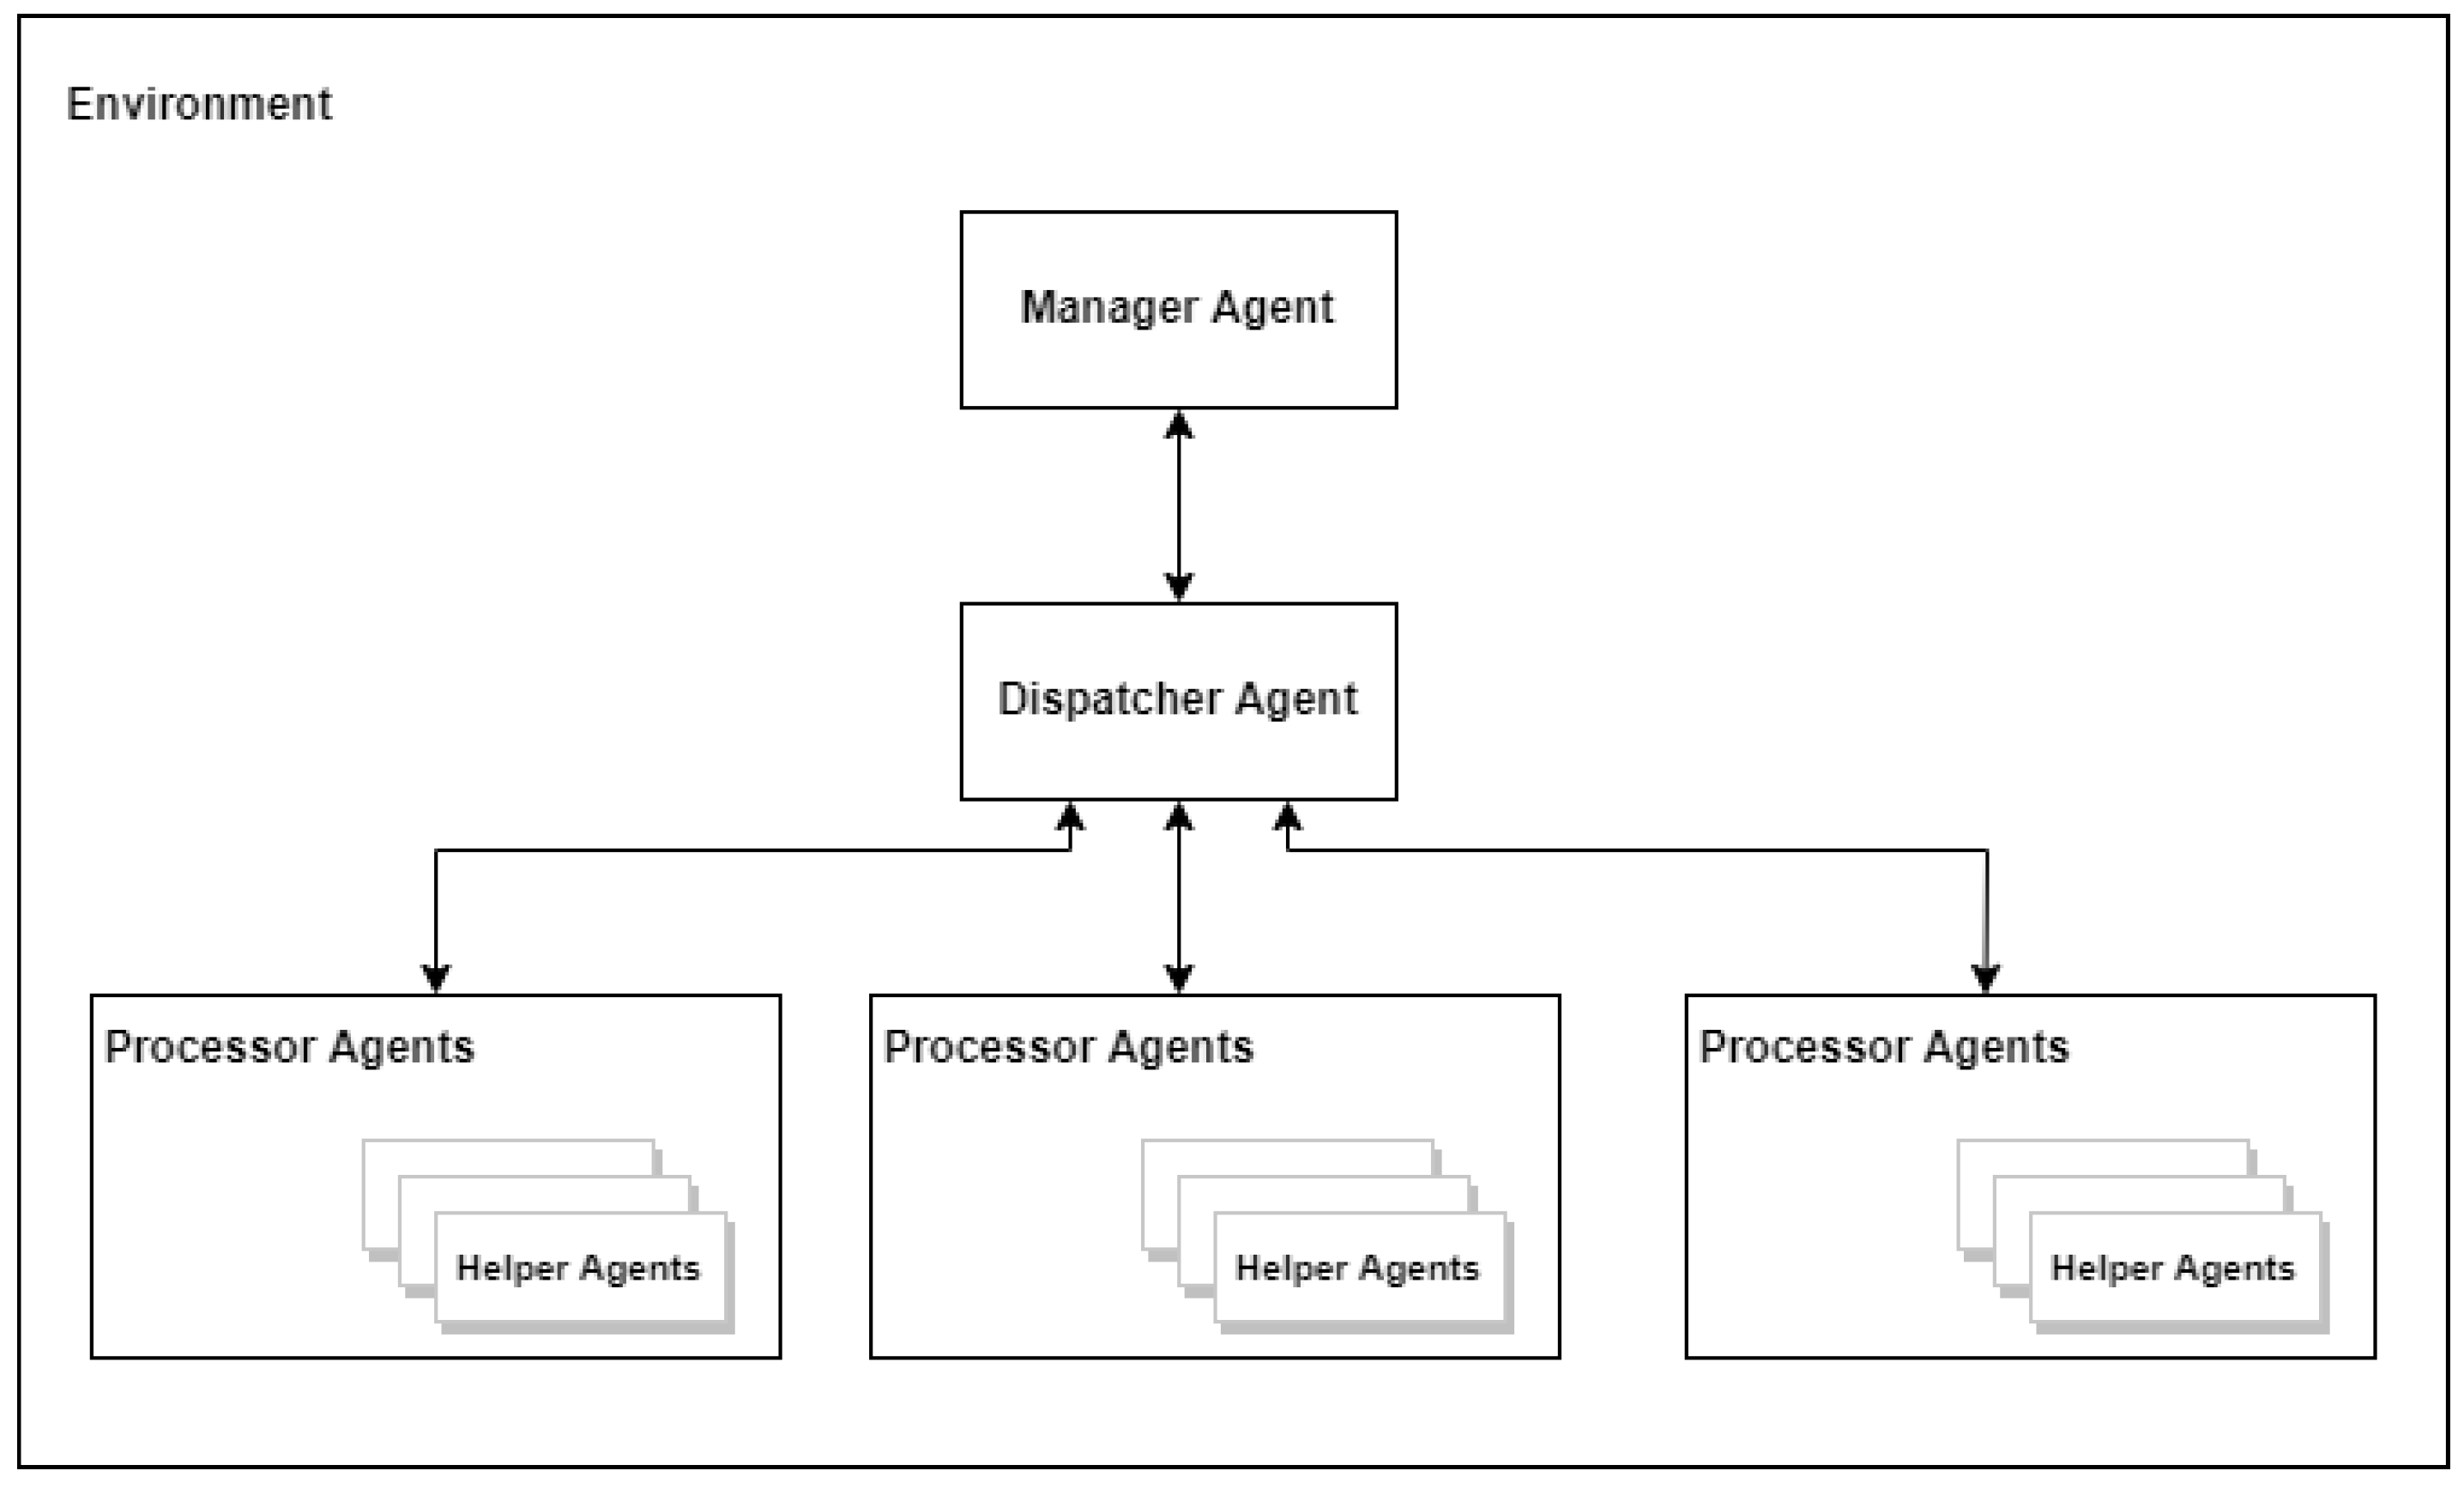
Figure 1. The main agents of the system.
Computation 10 00223 g001
Figure 2. The states of the dispatcher agent.
Computation 10 00223 g002
Figure 3. Communication diagram of dispatcher and processor agents.
Computation 10 00223 g003
Figure 4. Applied Round Robin example.
Computation 10 00223 g004aComputation 10 00223 g004b
Figure 5. The first step of the agents preferences distribution strategy.
Computation 10 00223 g005
Figure 6. The second step of the agents preferences distribution strategy.
Computation 10 00223 g006
Figure 7. Average load per turn analysis based on average resources required, average task required processing time and distribution strategy.
Computation 10 00223 g007
Table 1. The parameters used in the calculation of the metrics.
The Number of Simulation Steps n s
The number of processor agents n p
The maximum number of helper agents n h
The list of all processor agentsA
The list of all tasksT
The list of loads per simulation step j for a given PA, A i L i j , i = 1 , n p ¯ , j = 1 , n s ¯
The list with number of HAs per simulation step j for a given PA, A i H i j , i = 1 , n p ¯ , j = 1 , n s ¯
The required processing power for a given task T i T p i , i = 1 , | T | ¯
The required time (turns) for a given task T i T t i , i = 1 , | T | ¯
Table 2. Computed metrics: parameters and their meaning.
The Average Load per Turn for One PA, A i (%) l 1 i = 1 n s   j = 1 n s   L i j , i = 1 , n s ¯
The average load per turn aggregated on all PAs (%) l p = 1 n p   i = 1 n p   l 1 i
The maximum difference between PAs average load per turn δ p = max( l 1 i ) − min( l 1 i ), i = 1 , n s ¯
The number of turns with at least one HA per turn for a PA, A i t 1 i = 1 n s count( H i j ), i = 1 , n p ¯ , j = 1 , n s ¯
The average number of turns with at least one HA per turn t 1 = 1 n p i = 1 n p t 1 i
The average number of HAs per turn for a PA, A i t a i = 1 n s 1 | H i | j = 1 n s H i j , i = 1 , n p ¯ ,
The average number of HAs per turn aggregated on all PAs t a = 1 n p i = 1 n p t a i
The average required processing power per task θ p = 1 n s i = 1 | T | T p i
The average required time (turns) per task θ t = 1 n s i = 1 | T | T t i
Table 3. Statistics for tasks with a low amount of required processing power and various required times.
MetricsTask TimesTask Loads = [1; 20]
Distribution Strategy
APMaMuRndRR
δ p [1; 5]1.760.210.660.211.14
[3; 15]6.450.259.470.604.04
[10; 15]3.910.369.070.814.36
l p [1; 5]24.194.934.934.934.93
[3; 15]72.9516.8516.8316.8416.90
[10; 15]86.7323.7923.6723.6323.76
t 1 [1; 5]-----
[3; 15]---0.06-
[10; 15]0.34--0.55-
t a [1; 5]-----
[3; 15]---0.20-
[10; 15]1.40--1.67-
Table 4. Statistics for tasks with a variable amount of required processing power and various required times.
MetricsTask TimesTask Loads = [1; 40]
Distribution Strategy
APMaMuRndRR
δ p [1; 5]1.190.361.110.182.05
[3; 15]3.300.514.591.355.02
[10; 15]4.800.690.753.4410.41
l p [1; 5]48.6910.1210.119.7910.12
[3; 15]87.5331.6931.5725.5330.38
[10; 15]88.4348.4048.3532.5246.34
t 1 [1; 5]---0.35-
[3; 15]8.86--14.72-
[10; 15]51.61--44.43-
t a [1; 5]---1.51-
[3; 15]2.52--1.78-
[10; 15]2.66--1.90-
Table 5. Statistics for tasks with a high amount of required processing power and various required times.
MetricsTask TimesTask Loads = [20; 40]
Distribution Strategy
APMaMuRndRR
δ p [1; 5]1.280.212.310.782.29
[3; 15]3.180.721.132.728.72
[10; 15]3.430.582.542.806.05
l p [1; 5]67.3714.7714.7714.0314.77
[3; 15]87.0848.9148.8329.2243.62
[10; 15]89.4469.0470.1837.2864.85
t 1 [1; 5]---0.70-
[3; 15]29.14--38.01-
[10; 15]80.4411.881.4489.20-
t a [1; 5]---1.54-
[3; 15]2.76--1.93-
[10; 15]2.671.022.321.93-
Table 6. Average required processing power per task for a given dataset configuration.
Task TimesTask Loads
[1; 20][1; 40][20; 40]
[ 1 ; 5 ] 9.7819.629.52
[ 3 ; 15 ] 10.1619.7829.51
[ 10 ; 15 ] 10.1420.4929.68
Table 7. Average required time (turns) per task for a given dataset configuration.
Task TimesTask Loads
[1; 20][1; 40][20; 40]
[ 1 ; 5 ] 2.552.552.52
[ 3 ; 15 ] 8.398.278.50
[ 10 ; 15 ] 11.9011.9812.10
Publisher’s Note: MDPI stays neutral with regard to jurisdictional claims in published maps and institutional affiliations.