Article

From Global to Context-Specific Process Views: A Configurable Process Mining Framework for Hospital Billing Analysis

1
Mathematics, Computer Science and Application Laboratory, Faculty of Sciences and Techniques of Mohammedia, Hassan II University of Casablanca, Mohammedia 28806, Morocco
2
Laboratory of Analytics, Modeling, and Intelligent Governance for Engineering Performance, Moroccan School of Engineering Sciences, Marrakech 40000, Morocco
*
Author to whom correspondence should be addressed.
Information 2026, 17(9), 915; https://doi.org/10.3390/info17090915 (registering DOI)
Submission received: 18 August 2026 / Revised: 9 September 2026 / Accepted: 14 September 2026 / Published: 18 September 2026
(This article belongs to the Special Issue Machine Learning and Data Analytics for Business Process Improvement)

Abstract

Hospital billing event logs combine shared administrative routines with context-specific behavior, making a single global process model difficult to interpret. This study proposes a configurable process mining framework that complements a hospital-wide model with context-specific views derived from Hospital Billing data. Seventeen medical specialties (97,753 cases; 437,444 events) were retained and split temporally into 70% Train and 30% Test cases. Train data were used for behavioral representation, similarity analysis, hierarchical clustering, process discovery, merging, and configuration. The selected two-cluster solution (mean silhouette = 0.8960) separated specialty K from the remaining 16 specialties. Global Train analysis showed a tie among IMf thresholds 0.40, 0.50, and 0.60; 0.60 was retained as the common configuration threshold because it reduced configuration points from 25 to 20. Cluster-specific Process Trees were merged into a configurable model with 41 unique nodes and 20 configurable relations, and Genetic search produced Derived Process Trees. On held-out Test data, the Derived K model achieved fitness/balanced precision of 0.9992/0.6690, while the Derived Others model achieved 0.8598/0.9305. Both remained competitive with independently mined local baselines while preserving shared and context-dependent behavior within one process family.

1. Introduction

Across specialties, the administrative route followed by a billing case is not always the same. The same set of actions—coding, review, correction, and closure—may appear in a different order or recur with different frequencies. Some of these deviations form recurring local routines rather than random noise. For process mining, this matters because the view obtained from the log depends on both the chosen partition and the way variability is represented [1,2].
A heterogeneous log can therefore be read at more than one level. The full log gives a single hospital-wide reference, but this aggregation may blur routines that are specific to a subset of cases. At the other extreme, mining every specialty independently preserves detail while creating a collection of models whose common structure is difficult to see directly [3,4,5,6,7,8,9].
This study addresses that tension through a layered analytical design. The first layer retains a hospital-wide representation of the billing process. The second layer represents specialty-specific logs through activity inventories and weighted directly follows relations, measures their behavioral similarity, and aggregates related specialties into a smaller number of process families. A configurable Process Tree is then used to connect these families within one formal structure while allowing a context-specific process view to be derived for each family [9,10].
In this setting, configurability is used as a mechanism for linking shared and family-specific behavior. Elements that are common to the clustered models remain part of the reference structure, whereas divergent branches become configuration points. Applying a configuration to the merged tree produces a model whose behavior is tailored to the corresponding cluster log. The configurable model is therefore not treated as a replacement for the global model, but as an additional representation for questions that require behavioral differentiation [8,9,10].
Unlike controlled demonstrations based on predefined process variants, the present study addresses an empirical and methodological problem using a real Hospital Billing event log. The process families are not fixed in advance; they are inferred by comparing behavioral representations of 17 specialty-specific logs. The study further evaluates noise-threshold sensitivity, structural complexity, and log-guided configuration search, thereby extending the analysis beyond a simple feasibility demonstration [1].
The experiment began with specialty-based sub-logs. After the specialty filter, retained cases were split globally and temporally at case level into 70% Train and 30% Test partitions. Specialty activity presence and weighted directly follows information, pairwise similarity, hierarchical grouping, process discovery, merging, configuration search, and Genetic run selection were all computed from Train data. Test data were reserved for final conformance evaluation. The global Train model, the directly mined cluster-specific Train models, and the Genetic-derived Process Trees were then compared on identical held-out cluster Test logs. For each retained Genetic result, the configuration plugin directly returned the corresponding Derived Process Tree; no separate instantiation plugin was used. Petri-net conversion was used only for the conformance calculations.
Several design choices distinguish the experiment. The data are taken from the public Hospital Billing log rather than from predefined synthetic variants. Specialty is only the starting context: the groups entering the configurable stage are formed from observed activity and routing similarity. The global model is kept alongside the two cluster instances, which allows the interpretation to change with the scale of analysis. The ProM parameters and PTML processing steps are also recorded so that the experimental chain can be reconstructed. The aim is consequently not to select one representation for every task, but to compare what is gained or lost when moving between a global and a context-restricted view.

2. Related Work

Related work falls into three connected areas. One set of studies uses the Hospital Billing event log itself; another deals with clustering and separation of process behavior; a third addresses configurable process models. The distinction between them is important here because they do not group the same objects and they do not end with the same type of representation. As a result, process variability may remain split across several models or be expressed inside one shared model family.

2.1. Studies Using the Hospital Billing Event Log

The Hospital Billing Event Log has been used to study several process-mining problems, including infrequent behavior, incomplete traces, log preprocessing, and the discovery of latent process scenarios [1,11,12,13,14]. Its repeated corrections, low-frequency administrative actions, and descriptive attributes make it suitable for these questions. The studies reviewed below, however, do not begin with specialty-based sub-logs, test them for behavioral similarity, and then use the resulting families to construct a configurable process model.
Mannhardt et al. [11] proposed the Data-aware Heuristic Miner, which uses event attributes to determine whether an infrequent dependency can be explained by data conditions rather than treated as noise. On the Hospital Billing log, the method produces a C-Net supplemented with classification rules. Its contribution is therefore a data-aware global representation; it does not organize specialty-specific behavior into process families.
Xu and Liu [12] addressed a different issue, namely incomplete traces. Their method clusters cases by profile, predicts missing activities, and discovers process models after repair. In that setting, clustering supports data-quality improvement. It is not used to identify operational process families or to derive configurations from several related sub-logs.
Wang et al. [13] proposed a preprocessing strategy that scores directly follows relations and ranks trace variants so that representative behavior can be retained before discovery. Their Hospital Billing experiments report model-quality and runtime measures for several discovery algorithms. The method reduces log volume and controls the influence of infrequent variants, but it does not use organizational context to build related sub-logs or derive configurable instances.
Zhang et al. [14] addressed heterogeneity by encoding traces with activity and timing information and then discovering process scenarios without assuming a fixed number of groups. Their evaluation on Hospital Billing compares candidate clusterings through weighted fitness, weighted precision, and F1-score. This work is closest to the present study in recognizing multiple behavioral regimes; however, its unit of clustering is the individual trace, and the scenario models remain separate rather than being expressed as configurations of one model family.
Taken together, these studies confirm that the Hospital Billing log contains heterogeneous behavior and demonstrate that preprocessing, repair, and clustering decisions can materially affect the discovered models. What remains open for the present work is a different problem: starting from an organizational partition, determining which specialty views are behaviorally redundant, consolidating them when appropriate, and retaining both a global reference and family-specific process views [11,12,13,14]. Table 1 summarizes the selected studies using the Hospital Billing Event Log and highlights their relationship to the present study.

2.2. Trace Clustering and Process-Variant Analysis

Trace clustering is commonly used when a log contains several behavioral patterns that obscure process discovery. Song et al. [3] represented traces through log profiles and used these representations to obtain more homogeneous groups. Bose and van der Aalst [4] incorporated contextual attributes into the similarity analysis so that clustering was not limited to activity sequences. In both cases, clustering naturally leads to separate models for the resulting groups. This can improve local readability, but the common structure across those models is not represented explicitly.
De Weerdt et al. [5] used process-discovery quality to guide clustering decisions. Zandkarimi et al. [6], in contrast, organized trace clustering as a sequence of representation, distance computation, grouping, and evaluation steps. Both start from individual cases. The present experiment compares complete specialty logs instead. Each specialty is summarized by its activity set and normalized weighted DFG, and grouping is performed on those summaries. A specialty distinction is thus carried into the configurable stage only when it is supported by an observable behavioral difference.
Taymouri et al. [7] treat variant identification as a task that is distinct from later comparison, classification, or explanation. That distinction is useful in the present setting. Here, clustering is not intended to produce a catalogue of trace variants; it is used to decide whether an entire specialty view should remain separate or be absorbed into a broader behavioral family.

2.3. Configurable Process Models

A configurable model approaches variability from a different direction. Instead of keeping one reference model for every variant, it stores stable behavior once and marks the parts that may change. Rosemann and van der Aalst [8] formalized this idea for configurable Event-driven Process Chains, where selected functions and connectors are resolved according to the target setting.
In process mining, Buijs et al. [9] extended the Evolutionary Tree Miner to work with collections of event logs. Their approach allows independently discovered Process Trees to be merged, or a configurable tree and its configurations to be optimized together. The method therefore offers a formal way to represent a process family once the input logs have already been identified as meaningful variants.
Arriagada-Benítez et al. [10] considered the next step: starting from a configurable Process Tree and a target log, they search for settings that resolve the configurable elements. Sikal et al. [15] instead focused on extracting variability information from event logs for configurable process mining. These studies motivate the merge and model-derivation stages adopted here, while the present framework adds an earlier behavioral-grouping step to decide which specialty logs should enter the same family. Table 2 compares the main trace-clustering and configurable process-mining approaches discussed above and positions the present study with respect to these methods.

2.4. Research Gap and Positioning

Work on the Hospital Billing log has addressed infrequent behavior, data quality, preprocessing, and latent process scenarios [11,12,13,14]. A separate literature uses trace clustering to isolate heterogeneous executions [3,4,5,6,7], while configurable process mining concentrates on integrating or instantiating variants after those variants have been identified [8,9,10,15]. The connection between these steps is less developed: an organizational partition may contain behaviorally redundant sub-logs, yet this redundancy is rarely tested before those views are incorporated into a configurable family. This study examines that link while retaining a global model as a baseline.
The proposed framework closes this gap by moving from specialty context to log-level behavioral comparison, from behavioral comparison to family formation, and from family formation to log-guided configuration. The final outputs are deliberately plural: one global model supports hospital-wide analysis, one configurable tree records the relationship among families, and derived models support restricted analysis on the corresponding cluster logs.
The research gap is therefore not merely the availability of configurable process representations, but the lack of an empirical workflow that links context discovery from operational event data, configurable model construction, and comparative macro- and micro-level evaluation. The present study addresses this gap by deriving behavioral families from healthcare data, evaluating several discovery thresholds, comparing configuration-search strategies, and quantifying structural complexity alongside conformance quality.

3. Materials and Methods

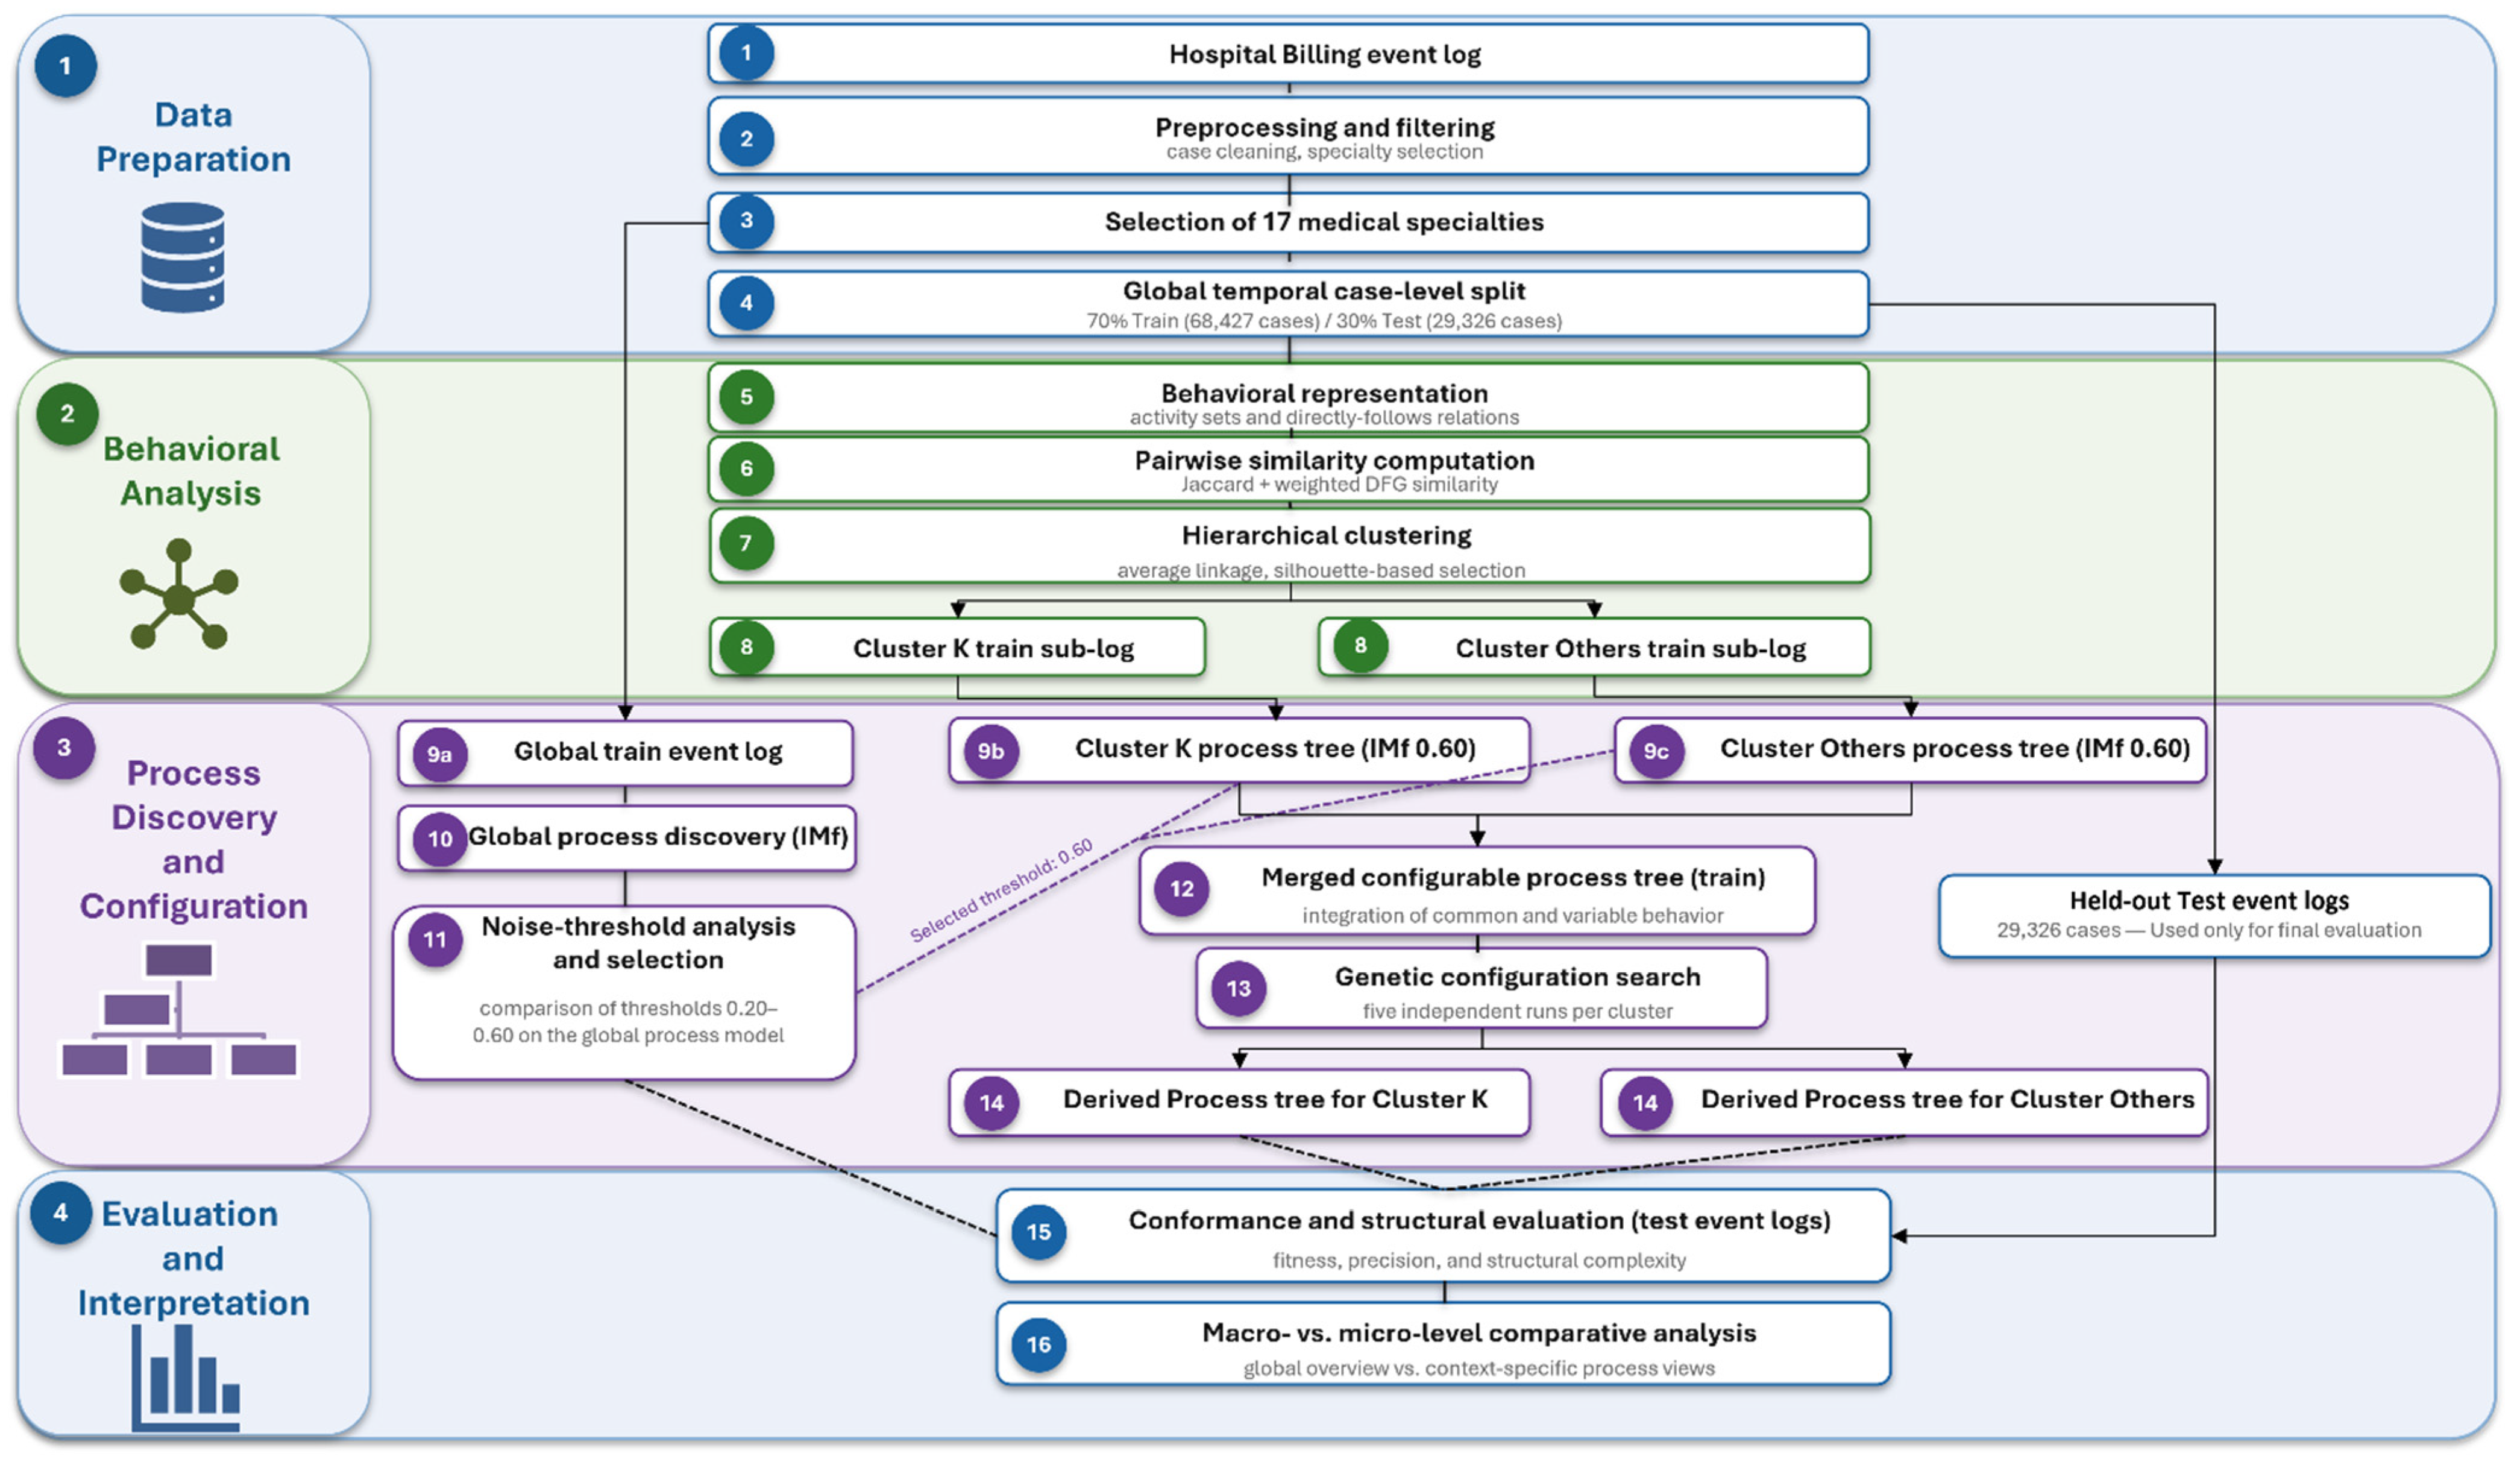
Figure 1 summarizes the experimental workflow adopted in this study, from event-log preprocessing and specialty-level behavioral analysis to configurable model construction, configuration-driven Process Tree derivation, and comparative evaluation.

3.1. Experimental Design

Medical specialty was used as the initial contextual attribute. After the temporal split, the 17 retained specialty Train partitions were compared using activity and routing similarities before cluster-level models were constructed. Cluster membership was therefore determined from observed Train behavior rather than from the specialty label alone or from information in the held-out Test subset.
The experimental workflow comprised six stages: event-log preparation and partitioning by specialty; construction of activity-set and normalized directly follows representations; pairwise similarity computation and hierarchical clustering; aggregation of specialty logs at cluster level; Process Tree discovery and configurable-model construction; and log-guided configuration. Greedy and Genetic searches were initially tested, and the Genetic strategy was retained to produce the final cluster-specific Derived Process Trees. For the quantitative comparison, three model types were considered on each cluster Test log: the global Process Tree learned from Train data, the Process Tree mined directly from the corresponding cluster Train log, and the Derived Process Tree returned by Genetic configuration.
After the specialty filter, complete cases were preserved without within-trace modification. Retained cases were ordered globally by case start time and separated by a temporal 70/30 split at case level, with earlier cases assigned to Train and later cases to Test; the split was not stratified by specialty. Train data were used for behavioral representation, similarity-matrix construction, hierarchical clustering and cluster assignment, process discovery, configurable-model construction, configuration optimization, and run selection. The Train-derived specialty-to-cluster mapping was then applied to the corresponding Test cases solely for final evaluation. This protocol ensured that no held-out Test case contributed to cluster selection or model construction and that the direct local and configurable-derived models were compared on the same unseen case population.

3.2. Data Source and Experimental Population

The study used the Hospital Billing Event Log, Version 1, available through 4TU.ResearchData [1]. The log was extracted from the financial module of the enterprise resource planning system of a regional hospital. Each case represents the administrative sequence associated with billing a package of medical services rather than the corresponding clinical treatment. The original XES file contains 100,000 cases, 451,359 events, and 18 activity labels recorded over approximately three years. Identifiers and attribute values were anonymized. Timestamps were shifted by the data provider while preserving within-case elapsed times [1].
The 1000-case threshold was introduced as a minimum-support criterion for specialty-level behavioral representation and subsequent local Process Tree discovery. Six specialties fell below this threshold: S (743 cases; 5346 events), T (525; 2837), U (409; 2214), R (400; 2407), V (166; 1105), and W (4; 6). Together, these excluded specialties account for 2247 cases and 13,915 events. The complete specialty-level descriptive statistics are included in the supplementary reproducibility package.
To assess the influence of this minimum-support criterion, the complete preprocessing and Train-only clustering procedure was repeated from the original XES log using minimum specialty sizes of 500, 750, 1000, and 1500 cases. For each cutoff, eligible specialties were identified from the full population, the corresponding cases were subjected to a new global temporal 70/30 split, and specialty activity-set and normalized weighted-DFG representations were recomputed from Train data only. Separate configurable merges and Genetic optimizations were not repeated for each cutoff; the sensitivity analysis was designed to assess robustness of the behavioral families entering the configurable-model stage.
The case identifier, activity label, and timestamp were obtained from case:concept:name, concept:name, and time:timestamp, respectively. Event Name was used as the classifier in all ProM experiments. The source attribute speciality is recorded at the event level in the original log [1]. Events were ordered chronologically within each case, and the first non-missing speciality value was assigned as the case-level context. Cases without a valid value were excluded. Cases containing more than one speciality value were flagged during data-quality control, and the first chronological non-missing value was retained.
The prepared log contained 23 speciality values. Specialities represented by at least 1000 cases were retained to limit instability in local process discovery. Seventeen anonymized groups, labelled A to Q, satisfied this criterion. The resulting population comprised 97,753 cases and 437,444 events. The filtered global log was defined as the union of the retained cases, and the 17 specialty sub-logs formed a mutually exclusive partition of this population.
Table 3 summarizes the fixed data and algorithm settings used throughout the experimental workflow. The retained population was divided into 68,427 Train cases and 29,326 Test cases (approximately 70/30 overall). The Train-only model-construction and held-out Test-evaluation protocol defined in Section 3.1 was applied throughout; cluster-specific Train/Test counts are reported in Table 4.

3.3. Behavioral Representation of Specialty Logs

Clustering was performed on Train event-log characteristics to avoid dependence on a specific process-discovery threshold and to prevent information from the final Test subset from entering the grouping stage. Each specialty Train log was represented by its observed activity set and a normalized weighted Directly Follows Graph (DFG). DFGs represent activities as nodes and directly follows relations as edges, and are a standard abstraction for process discovery [2]. The activity set captured the presence of administrative steps, whereas the weighted DFG represented directly follows relations and their relative frequencies.
Let Ai and Aj denote the activity sets associated with specialty Train logs i and j, respectively. Their activity-set similarity was measured using the Jaccard coefficient [16]:
J(i,j) = |AiAj|/|AiAj|
For the routing component, each directly follows count was normalized by the total number of directly follows occurrences in the corresponding specialty log. Let vi and vj denote the resulting normalized relation-frequency vectors over the union of relations observed in the pair. Their cosine similarity was calculated as [17]:
C(i,j) = (viT vj)/(‖vi2vj2)
The two complementary similarities were combined using the following study-specific weighting, which was defined for the present experiment rather than adopted from an existing metric:
S(i,j) = 0.30 J(i,j) + 0.70 C(i,j)
The corresponding clustering distance was defined as:
D(i,j) = 1 − S(i,j)
The weighting 0.30/0.70 was specified before cluster selection as a study-design choice rather than selected to maximize the silhouette coefficient. Greater weight was assigned to the routing component because the activity-set representation captures only whether activities are present, whereas the normalized weighted DFG additionally captures differences in directly follows structure and relative routing frequencies. To assess whether the clustering result depended on this design choice, the weighting sensitivity analysis was recomputed from the Train-derived representations by varying the Jaccard weight from 0.10 to 0.90 in increments of 0.10, with the complementary weight assigned to the weighted-DFG cosine similarity. The same Train-only clustering procedure and candidate range k = 2–6 were applied under each weighting scheme.

3.4. Hierarchical Clustering and Cluster-Log Construction

Agglomerative hierarchical clustering with average linkage was applied to the Train-only 17 × 17 distance matrix. Under average linkage, the distance between two clusters is the arithmetic mean of the pairwise distances between their members [18]. A dendrogram was generated for visualization, whereas partition selection was based on the silhouette criterion.
Candidate partitions from k = 2 to k = 6 were evaluated with the mean silhouette coefficient [19]. For a specialty i, a(i) is its average distance to the other members of its assigned cluster, while b(i) is the smallest average distance to any alternative cluster. The individual silhouette coefficient is:
s(i) = [b(i) − a(i)]/max{a(i), b(i)}
The partition with the highest mean silhouette coefficient was retained. Cluster composition and silhouette values are reported in the Results section. The specialty-to-cluster assignment was learned exclusively from Train data. Complete traces assigned to specialties within the same cluster were then concatenated separately within Train and Test to form mutually exclusive cluster logs; Test traces did not participate in determining cluster membership. The union of the cluster logs was verified against the corresponding filtered global partition at case and event levels. No medoid specialty or representative trace was used.
Silhouette values were computed from the precomputed Train specialty-distance matrix using the scikit-learn implementation. For a singleton cluster, this implementation assigns the corresponding sample a silhouette coefficient of 0.0 because within-cluster cohesion cannot be estimated from a single member. Accordingly, specialty K received a silhouette value of 0.0 in the selected Train-only two-cluster partition.
To assess sensitivity to the hierarchical linkage rule, the clustering procedure was additionally repeated on the same Train-only distance matrix using complete and single linkage, in addition to the primary average-linkage setting For each linkage method, candidate partitions for k = 2–6 were evaluated using the same silhouette-based selection procedure.

3.5. Process Discovery and Noise-Threshold Selection

Process discovery was carried out in ProM with Inductive Miner-infrequent (IMf), which returns a sound, block-structured Process Tree [20]. The classifier was Event Name. All models entering the final holdout comparison were learned from Train data. The Global Train log was mined at noise thresholds 0.20, 0.30, 0.40, 0.50, and 0.60 to examine the effect of infrequent-behavior filtering; the same selected threshold was then applied to the Cluster K Train and Cluster Others Train logs. All other settings remained unchanged.
For every threshold, the Process Tree was reduced in ProM and exported in Process Tree Markup Language (PTML), an XML-based serialization format used to store Process Tree models. The exported Process Tree was then converted to its corresponding Petri-net representation solely to support the alignment-based conformance procedures described in Section 3.8 and was evaluated against the same Global Train log. Thresholds 0.40, 0.50, and 0.60 tied on the reported Global Train conformance measures and aggregate structural complexity (39 nodes, depth = 11, adapted CFC = 19). Because the global scan did not identify a unique threshold, the lower and upper bounds of this tied interval, 0.40 and 0.60, were carried through Train-derived configurable-model construction using one common threshold for both cluster logs. The primary threshold was fixed before held-out evaluation using structural parsimony: 0.60 was retained because its Train-derived merged representation contained 20 configuration points, compared with 25 at 0.40. The 0.40 pipeline was subsequently retained only as a held-out sensitivity comparator; its Test results were not used to select the primary threshold. The corresponding results are reported in Section 4.2.
Structural measures were obtained directly from the exported PTML rather than from the plotted diagrams. The parser counted visible activities, tau leaves, SEQ, XOR, AND, and LOOP operators, together with total nodes and maximum depth.

3.6. Configurable Process Tree Construction

A Process Tree was discovered independently from each cluster Train log using IMf 0.60. These two trees served two roles: they were the source models supplied to the configurable merge, and they provided the direct cluster-specific baselines requested for the final comparison. Following the configurable Process Tree approach of Buijs et al. [9], the two source trees were merged in ProM with the PTMerge package using the Extended Map option. Unlike the Activity Map option, which maps tasks only, Extended Map first creates a Semantic Map between equally labelled tasks and then extends this correspondence to a Structural Map. In the PTMerge implementation, the Structural Map is computed through an Integer Linear Programming (ILP) formulation that searches for a maximal valid mapping while respecting Process Tree structural constraints. Mapped nodes and relations are consolidated as common behavior, whereas unmapped outgoing relations of mapped nodes receive configuration options and therefore represent structural variability between the source trees [21].
The configurable elements support three states following the configurable Process Tree semantics used by [10]. Enabled (E) preserves the normal behavior of the corresponding configurable element. Hidden (H) makes the element unobservable by replacing it with a silent tau node, whereas blocked (B) makes the leading path to that element unreachable. These states are later selected from event data by the configuration-search procedure described in Section 3.7.
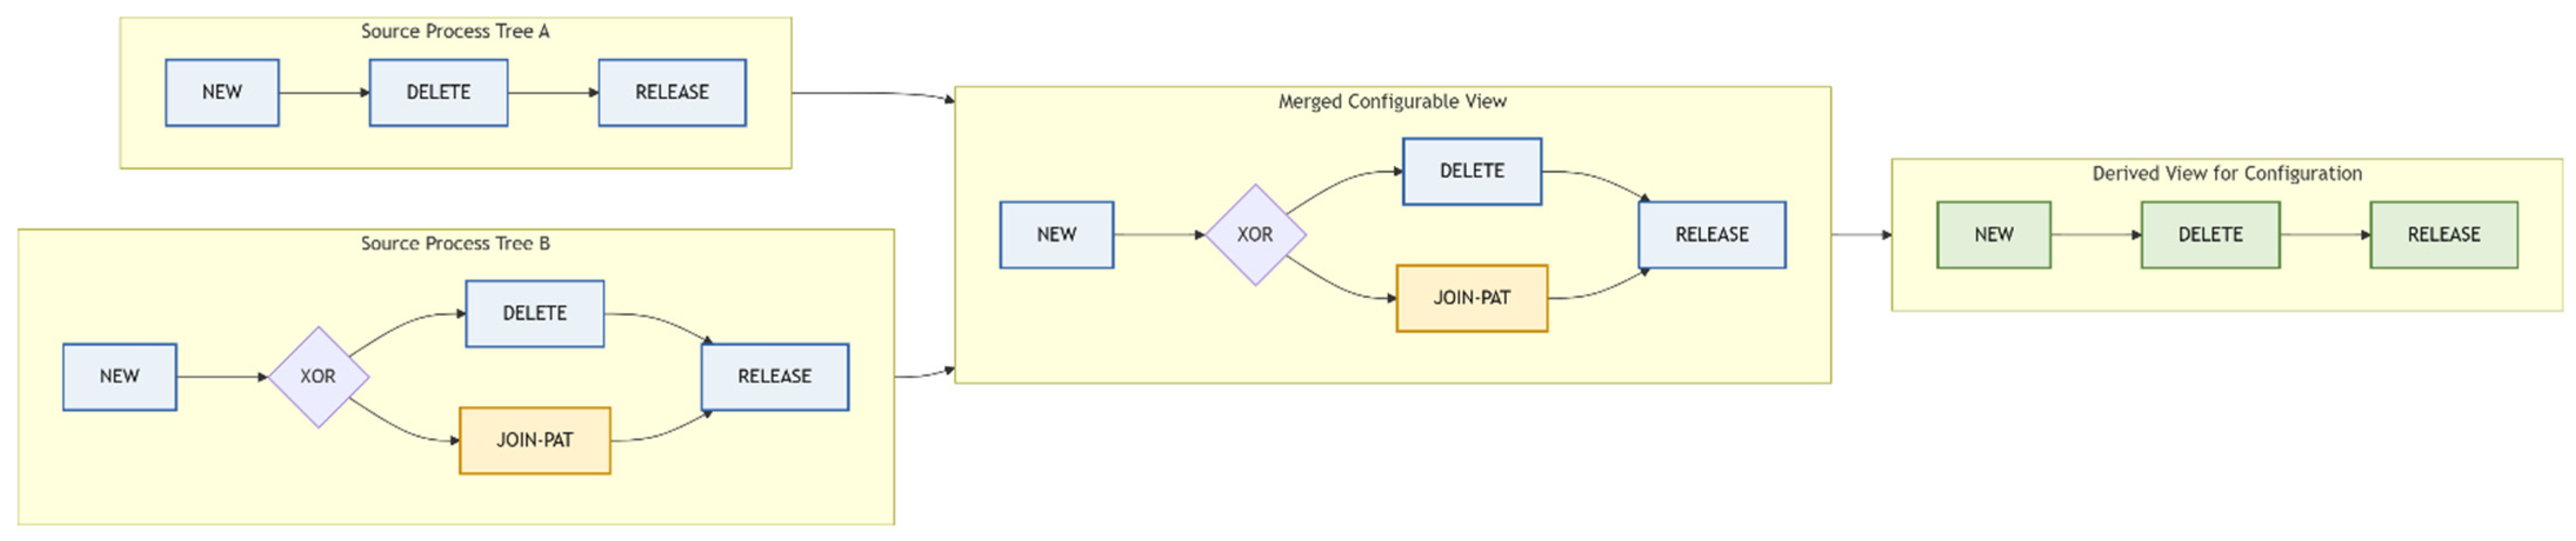
As a simple illustrative example, consider two source Process Trees containing the activities NEW, DELETE, JOIN-PAT, and RELEASE. Suppose Source Tree A represents NEW–DELETE–RELEASE, whereas Source Tree B contains an XOR alternative between DELETE and JOIN-PAT before RELEASE. The equally labelled NEW, DELETE, and RELEASE nodes can be mapped as shared behavior, while the unmatched JOIN-PAT branch is retained as configurable variation. Enabling this variation preserves the alternative branch; blocking it removes the corresponding path, while hiding it replaces the configurable behavior with a silent tau element. Figure 2 illustrates this merge-and-configuration principle only and is independent of the empirical Hospital Billing models.
The merged tree and the two cluster-specific Train trees were exported in PTML format. A Google Colab notebook (Google Colaboratory, Python 3.13.15 runtime) was used to extract structural measures and generate Process Tree, Petri-net, and DFG visualizations. Configuration inference used only the merged configurable tree and the corresponding cluster Train log. The directly mined cluster tree was not used as an additional optimization target during Genetic or Greedy configuration; it was retained independently as a held-out comparison baseline.

3.7. Configuration Search and Derived Process Trees

Configuration search was performed separately for each cluster Train log. Greedy and Genetic Configurable Process Tree configurations were tested in ProM using the same merged configurable Process Tree and the corresponding cluster Train log as inputs. Following [10], Greedy was treated as a local heuristic that resolves configurable elements sequentially, whereas Genetic searches globally over complete candidate configurations. For the downstream evaluation, a configuration-search output was considered eligible only if all 20 configuration points were resolved and the plugin returned a non-configurable Derived Process Tree with no unresolved or null configuration state. This completeness criterion and the selection among the five Genetic runs were applied before the corresponding Test log was evaluated. Independently discovered cluster trees were not used to optimize either configuration strategy [10].
Greedy and Genetic outputs were screened against this completeness criterion before any held-out Test evaluation. Only complete, ordinary Derived Process Trees were eligible for the final comparison; the observed Greedy and Genetic completeness results are reported in Section 4.5.
For each cluster, the Genetic search assigned enabled (E), hidden (H), or blocked (B) states to the configurable elements. Structural inspection of the merged PTML identified 20 configurable relations, comprising 11 blockable and 9 hideable relations. The ProM configuration summary displayed fewer rows because a displayed entry may represent an individual activity or operator, or an entire configurable subtree containing several configurable relations. The Genetic Configurable Process Tree Configuration plugin directly returned the Derived Process Tree associated with the selected configuration; no separate Instantiate Process Tree with a Configuration plugin was used. The returned Derived Process Tree was exported in PTML format and converted to its corresponding Petri-net representation solely for the common conformance-evaluation procedure described in Section 3.8. Fitness and precision values displayed within the configuration-search summary were treated only as internal optimization outputs and were not used in the final model comparison. Final conformance was recalculated from the Petri nets derived from these Process Trees using the same settings applied to the global model in Section 3.8 [10].
The Genetic strategy follows the event-data-guided configuration principle described by Arriagada-Benítez et al. [10]. A candidate Genetic solution is encoded as a chromosome:
c = (c1, c2, …, cm)
where m is the number of configurable elements, and each gene c takes one admissible configuration state:
c ∈ {E, H, B}, = 1, …, m
Applying a candidate configuration c to the merged configurable Process Tree Qα produces an ordinary non-configurable Derived Process Tree Qc, formally.
Qc = derive (Qα, c) [10]. In the ProM workflow used here, the Genetic Configurable Process Tree Configuration plugin performs this derivation directly and returns the Derived Process Tree; no separate instantiation plugin is invoked.
For a candidate configuration c, the ProM configuration objective was computed as a weighted combination of the four quality measures:
Q(c) = 0.90 F(c) + 0.10 P(c) + 0.00 G(c) + 0.00 S(c)
where F, P, G, and S denote replay fitness, precision, generalization, and simplicity, respectively. In the present experiments, this corresponds to weights 90/10/0/0; simplicity therefore did not contribute to the optimization objective and was assessed separately through structural measures. Population size was 10, and the generation limit was 20, which served as the user-controlled stopping criterion. The interface used in the experiments did not expose a user-selectable chromosome-initialization method, random seed, crossover rate, or mutation rate; these aspects were therefore left to the plugin implementation and were not manually set.
Stochastic robustness was assessed through five independent Genetic runs for each cluster under identical exposed settings. Because the underlying random seed was unavailable, these are interpreted as independent stochastic repetitions rather than seed-controlled replications. Runs were ranked by the configuration objective reported by ProM; precision was used as a secondary criterion when objective values were tied, and the earliest run was retained when both values were equal. Run-level outcomes and the retained runs are reported in Section 4.5.

3.8. Conformance and Structural Evaluation

Petri-net conversion was used exclusively as an intermediate representation for conformance checking in the adopted ProM workflow. The Process Trees remained the primary models for discovery, merging, configuration, structural interpretation, and reporting. Before conformance evaluation, each Process Tree was converted to its corresponding Petri-net representation because the selected alignment-based replay and precision procedures operate on this representation in ProM. No separate Petri-net model discovery was performed, and the converted nets were not used for additional formal verification such as liveness, reachability, or model-checking analysis. Accordingly, Petri-net conversion should be interpreted as a technical step enabling a common conformance-evaluation procedure.
Final conformance evaluation used only the held-out Test partitions. For each cluster Test log, three models were evaluated on exactly the same cases: (i) the Global Train Process Tree, (ii) the Process Tree mined directly from the corresponding cluster Train log, and (iii) the Genetic-derived Process Tree obtained from the merged configurable representation using that cluster’s Train log. Thus, the direct local model provides a classical cluster-specific baseline, while the global and configurable-derived models quantify the effect of retaining a shared process-family representation. No Test cases were used to select the retained Genetic run or to tune its E/H/B configuration.
Replay fitness was calculated by measuring fitness using the ILP-based replayer with a maximum of 32,767 tokens. Penalize improper completion was set to Yes. The use of cost-based alignments for model-log fitness follows the alignment-based conformance framework described by Adriansyah et al. [22] and van der Aalst et al. [23]. Trace Fitness was used as the primary fitness measure, while Move-Log Fitness, Move-Model Fitness, and raw alignment cost were retained as diagnostic outputs.
Align-ETConformance was run with the ORDERED representation and the ALIGN_1 algorithm [24]. The outputs retained were forward precision, backward precision, and balanced precision. Balanced precision was the value used when comparing the IMf thresholds.
Conformance results were complemented by structural and computational measures. Process Tree measures comprised visible and silent leaves, operator counts, total nodes, maximum depth, and the number of configurable edges. Petri-net measures comprised places, visible transitions, invisible transitions, and arcs. These measures complement the standard simplicity dimension of process-model quality [25]. For the adapted control-flow complexity (CFC) reported in this study, each XOR contributes its number of outgoing child branches, while each AND and LOOP contributes one unit; contributions are summed over the Process Tree. This is a Process Tree adaptation of the split-based control-flow-complexity rationale introduced by Cardoso [26]. Computational runtime was reported when directly available from the corresponding ProM procedure. Exact configuration-search runtimes were retained from the Greedy and Genetic outputs. Comparable discovery runtimes for the directly mined Process Trees were not exposed by the IMf interface used in the experiments and were not independently instrumented; they are therefore not reported.

3.9. Software and Reproducibility

ProM 6.14 supported Process Tree discovery, model merging, Genetic/Greedy configuration search with direct generation of Derived Process Trees, Petri-net conversion, and conformance checking [27]. Python 3.13.15 workflows executed in Google Colab were used for XES preparation, specialty statistics, weighted-DFG construction, similarity-matrix calculation, hierarchical clustering, silhouette analysis, PTML parsing, and figure generation. PM4Py, a Python process-mining library, supported event-log manipulation and additional DFG and Petri-net visualization [28].
The accompanying reproducibility package contains the preprocessing and clustering Python scripts; complete specialty-level descriptive statistics; Train-only Jaccard, weighted-DFG cosine, combined-similarity, and distance matrices; cluster assignments, silhouette outputs, and weighting/linkage/minimum-case sensitivity results; the Global Train and cluster Train/Test event logs; exported PTML models for the global threshold scan, direct cluster models, merged configurable model, and retained Derived Process Trees; ProM 6.14 parameter settings; and the five Genetic-run results for both clusters. The ProM Genetic interface did not expose a user-defined random seed, so no seed value is reported or inferred. The original source event log remains publicly available through 4TU.ResearchData [1].

4. Results

The results are reported in the order of the experimental workflow. The first subsection summarizes the specialty-level grouping. The second evaluates the effect of the IMf noise threshold on the global model. The remaining subsections report the merged configurable model, the retained Genetic configurations, and the comparison between the global and context-specific models.

4.1. Specialty-Level Behavioral Grouping

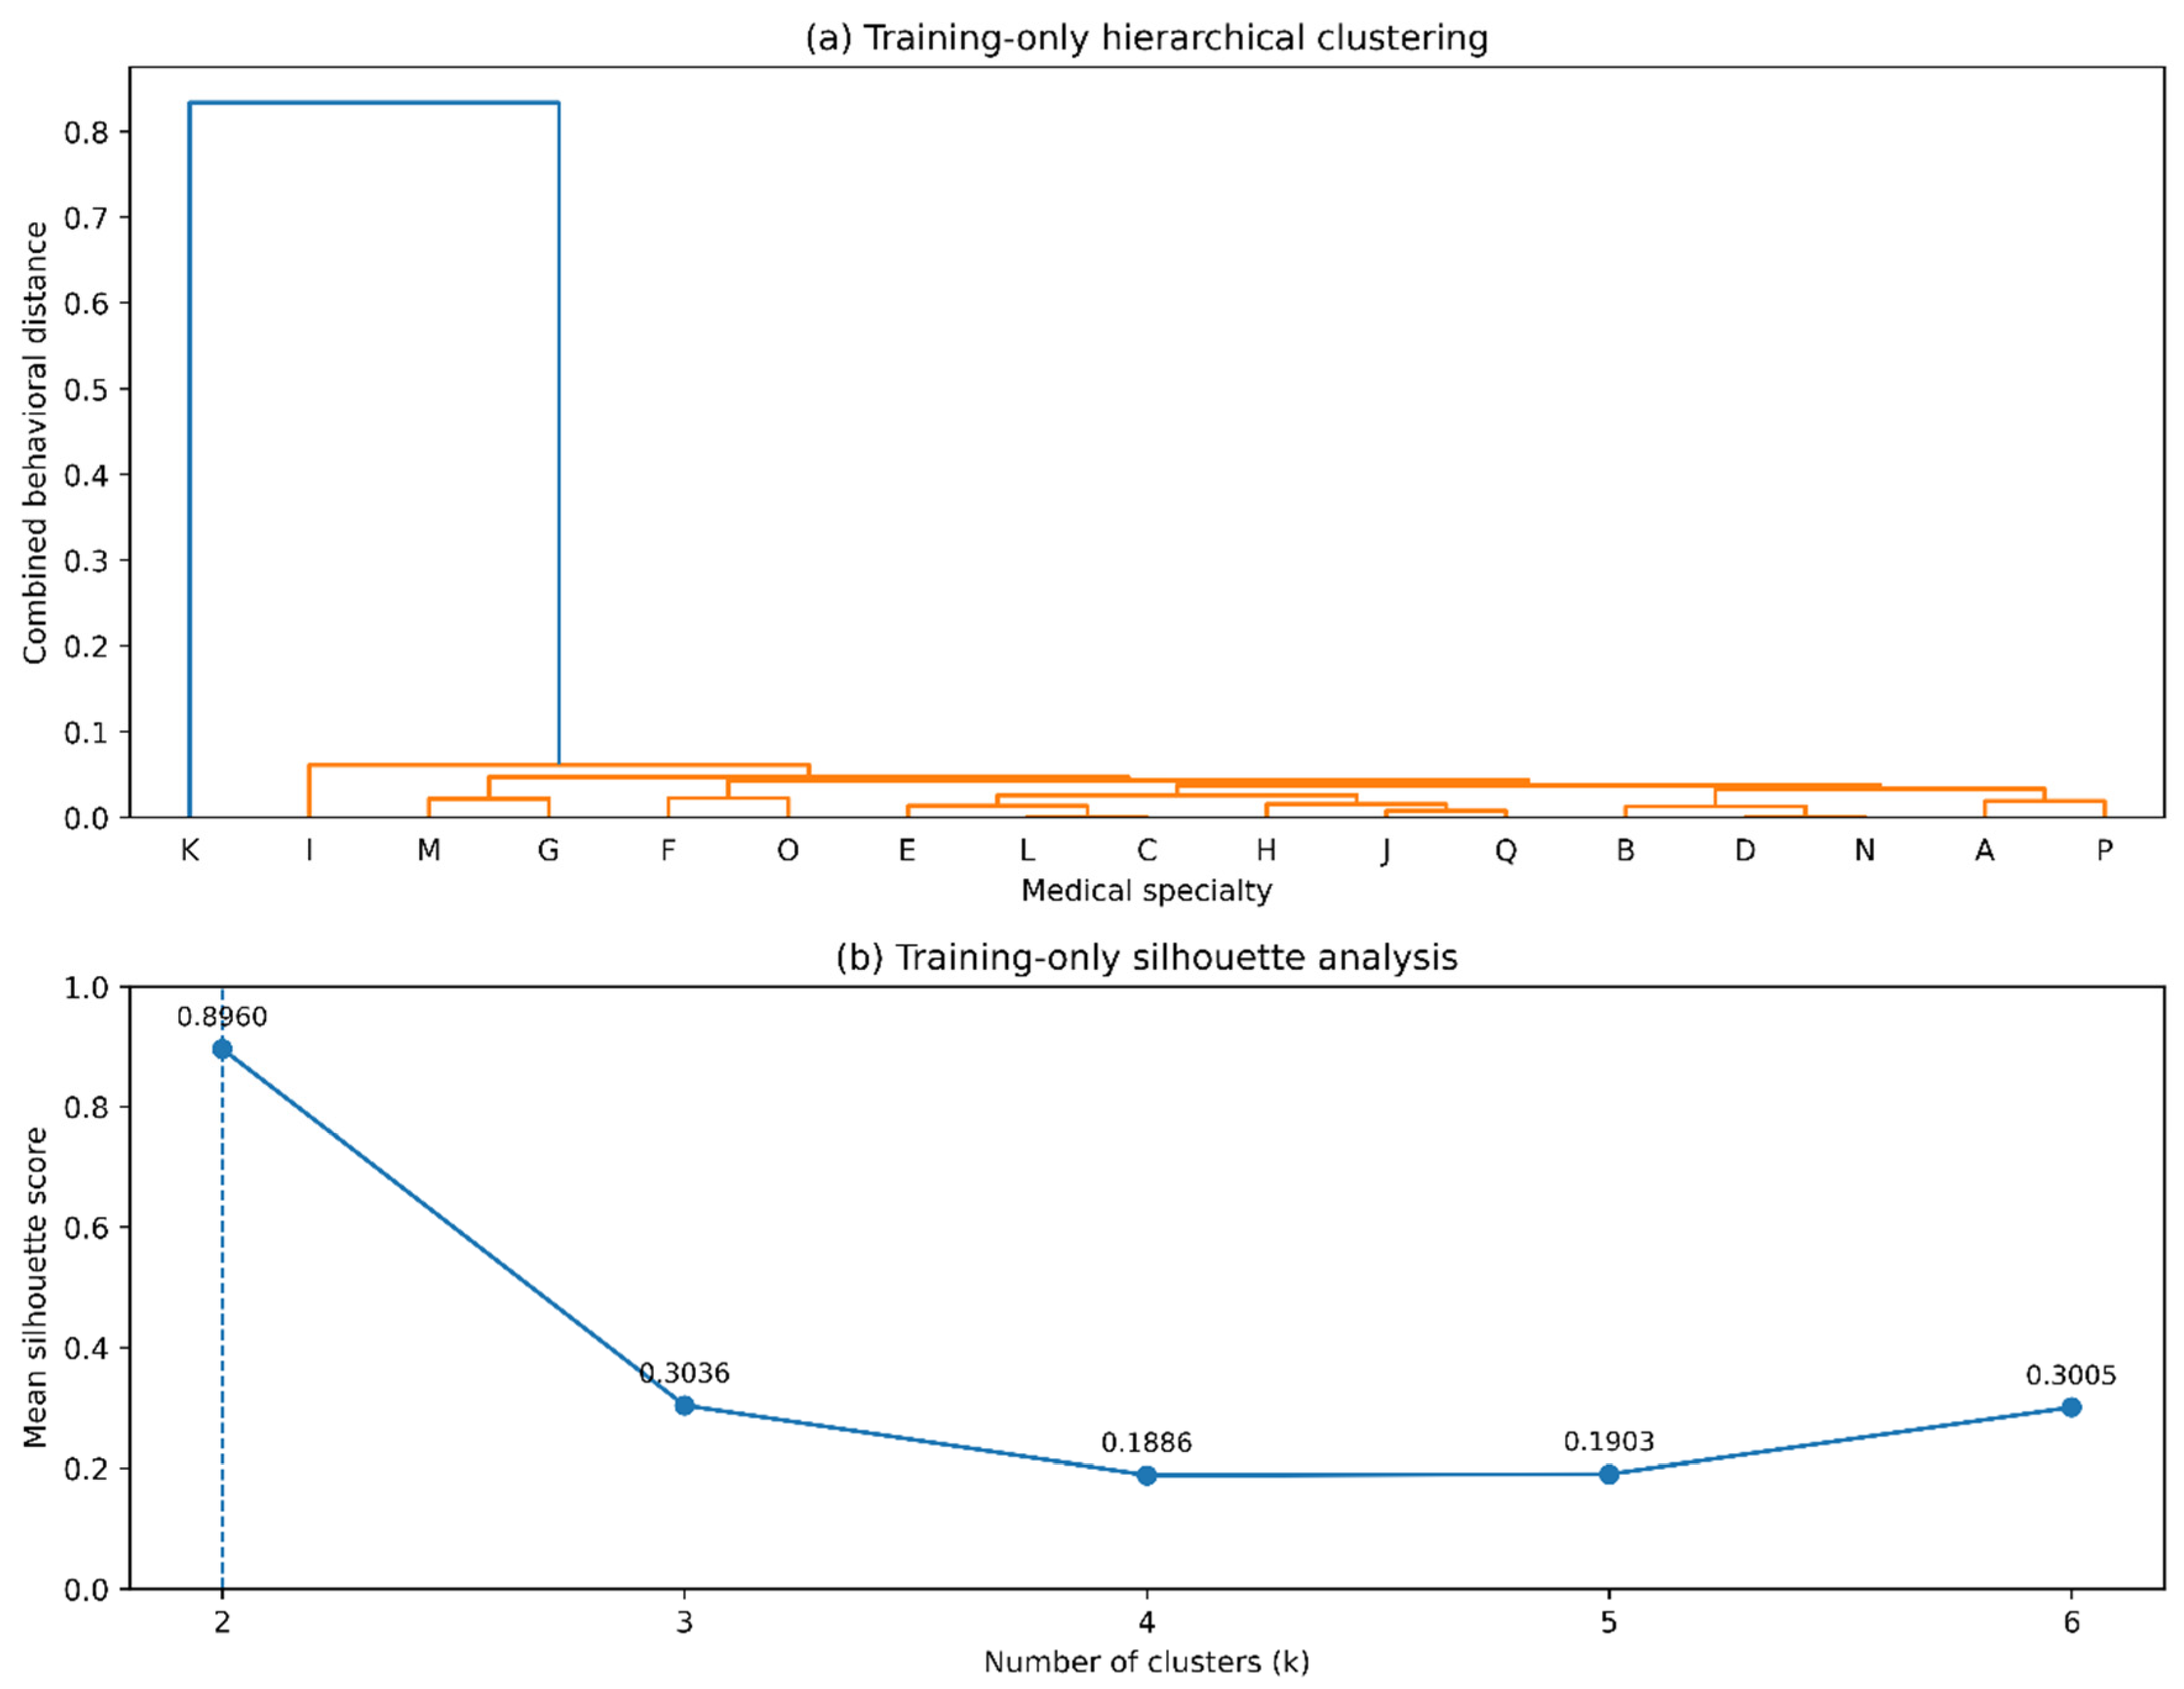
Using only the Train partitions, the 17 retained medical specialties were represented through their activity sets and normalized weighted directly follows relations. Hierarchical clustering was applied to the resulting Train-only distance matrix. The selected partition separated one behavioral family, denoted Cluster K, from the remaining specialties, denoted Cluster Others. The two-cluster solution was retained because it achieved the highest mean silhouette coefficient among the candidate partitions.
The selected k = 2 behavioral-family structure was also stable with respect to the minimum specialty-size criterion. Thresholds of 500, 750, 1000, and 1500 cases retained 19, 17, 17, and 15 specialties, respectively. In every setting, k = 2 remained the silhouette-optimal partition and specialty K remained the singleton cluster. The corresponding best mean silhouette coefficients were 0.893843, 0.896026, 0.896026, and 0.891257, respectively. Thus, changing the minimum-support threshold altered specialty eligibility but did not materially change the K-versus-Others behavioral partition supplying the configurable-model stage.
Because separate configurable models were not reconstructed and re-optimized for every cutoff, this sensitivity analysis supports robustness of the cluster structure supplying the configurable stage but does not establish invariance of the resulting PTML structure or E/H/B configuration across thresholds.
The Train-only weighting sensitivity analysis showed that the clustering result was not narrowly dependent on the primary 0.30/0.70 setting. Across Jaccard weights from 0.10 to 0.90, with complementary weighted-DFG cosine weights, k = 2 remained the best partition and specialty K remained a singleton in every tested setting. The corresponding mean silhouette ranged from 0.7927 to 0.9167, while the predefined 0.30/0.70 weighting produced 0.8960. Thus, the selected K-versus-Others structure was stable across a broad range of activity-versus-routing weights rather than being an artifact of the primary weighting choice.
For the primary 0.30/0.70 Train-only analysis, the exact mean silhouette coefficients were 0.896026 for k = 2, 0.303634 for k = 3, 0.188577 for k = 4, 0.190257 for k = 5, and 0.300480 for k = 6. In the selected k = 2 solution, specialty K formed a singleton and was assigned s(K) = 0.0 under the implementation convention, whereas the remaining 16 specialties had individual silhouette values between 0.9282 and 0.9654. Thus, the high mean silhouette of the two-cluster solution was not driven by an inflated singleton score.
Figure 3 presents the Train-only hierarchical clustering structure of the 17 retained medical specialties together with the corresponding silhouette scores for candidate partitions from two to six clusters.
Table 4 summarizes the Train-derived cluster composition and reports the corresponding Train, held-out Test, and total case counts. Because the 70/30 split was global and temporal rather than stratified by specialty, the cluster-specific Train/Test proportions need not individually equal 70/30. The Test cases shown in the table did not contribute to similarity computation or cluster selection; they were assigned using the specialty-to-cluster mapping learned from Train.
Importantly, Cluster K is a singleton only at the specialty level, not at the case level. It represents 13,736 Train cases and 22,609 cases overall, so its separation is not driven by a small number of observations. Its distinct position is also consistent with the narrower activity inventory and routing structure reported in Section 4.3. The singleton should therefore be interpreted as one specialty forming a distinct behavioral family under the selected representation, rather than as a small or unstable residual cluster.
The selected partition was also robust to the hierarchical linkage rule. Average, complete, and single linkage were applied to the same Train-only distance matrix. All three methods selected k = 2 as the best partition, with the same mean silhouette coefficient of 0.896026, and the specialty K remained the singleton cluster in every case. The alternative linkage rules produced different silhouette values for k > 2, but none yielded a partition superior to the K-versus-Others two-cluster solution. Thus, the primary clustering result was stable with respect to both the activity-routing weighting and the linkage method.

4.2. Noise-Threshold Analysis of the Global Process Model

The Global Train log was discovered with IMf noise thresholds from 0.20 to 0.60. Table 5 reports alignment-based fitness, the three precision indicators returned by Align-ETConformance, and structural complexity measures for the resulting Train-derived Process Trees. For each threshold, conformance was calculated by replaying Global Train on the Petri-net representation of the corresponding Train-discovered Process Tree; Test data were not used in this threshold analysis.
The Train-only threshold scan showed three distinct regimes. The 0.20 model was the largest structure (58 nodes; depth = 14; adapted CFC = 31) and obtained fitness 0.7967 with balanced precision 0.6748. At 0.30, fitness increased slightly to 0.8060, but balanced precision fell to 0.4504. In contrast, thresholds 0.40, 0.50, and 0.60 produced identical reported conformance values (fitness = 0.8450; forward precision = 0.9931; backward precision = 0.9994; balanced precision = 0.9963) and identical aggregate structural metrics (39 nodes; depth = 11; adapted CFC = 19). The global Train analysis therefore did not distinguish among these three thresholds.
After 0.60 had been fixed from Train-derived evidence, the 0.40 endpoint was also evaluated on the held-out Test logs as a sensitivity check. For Cluster K, both thresholds achieved trace fitness of 0.9992, while balanced precision increased from 0.6070 at 0.40 to 0.6690 at 0.60. For Cluster Others, 0.40 produced only a marginally higher fitness (0.8611 versus 0.8598), whereas balanced precision increased from 0.8217 to 0.9305 at 0.60. Independently of these Test results, the Train-derived configurable representation contained 25 configuration points at 0.40 and 20 at 0.60.
The held-out endpoint comparison therefore supports the robustness of the preselected 0.60 setting: it preserved replay fitness while yielding higher balanced precision in both clusters. Importantly, these Test values were not used to choose the threshold. The primary 0.60 setting had already been fixed from the Global Train tie together with the lower number of configuration points in the Train-derived merged representation.
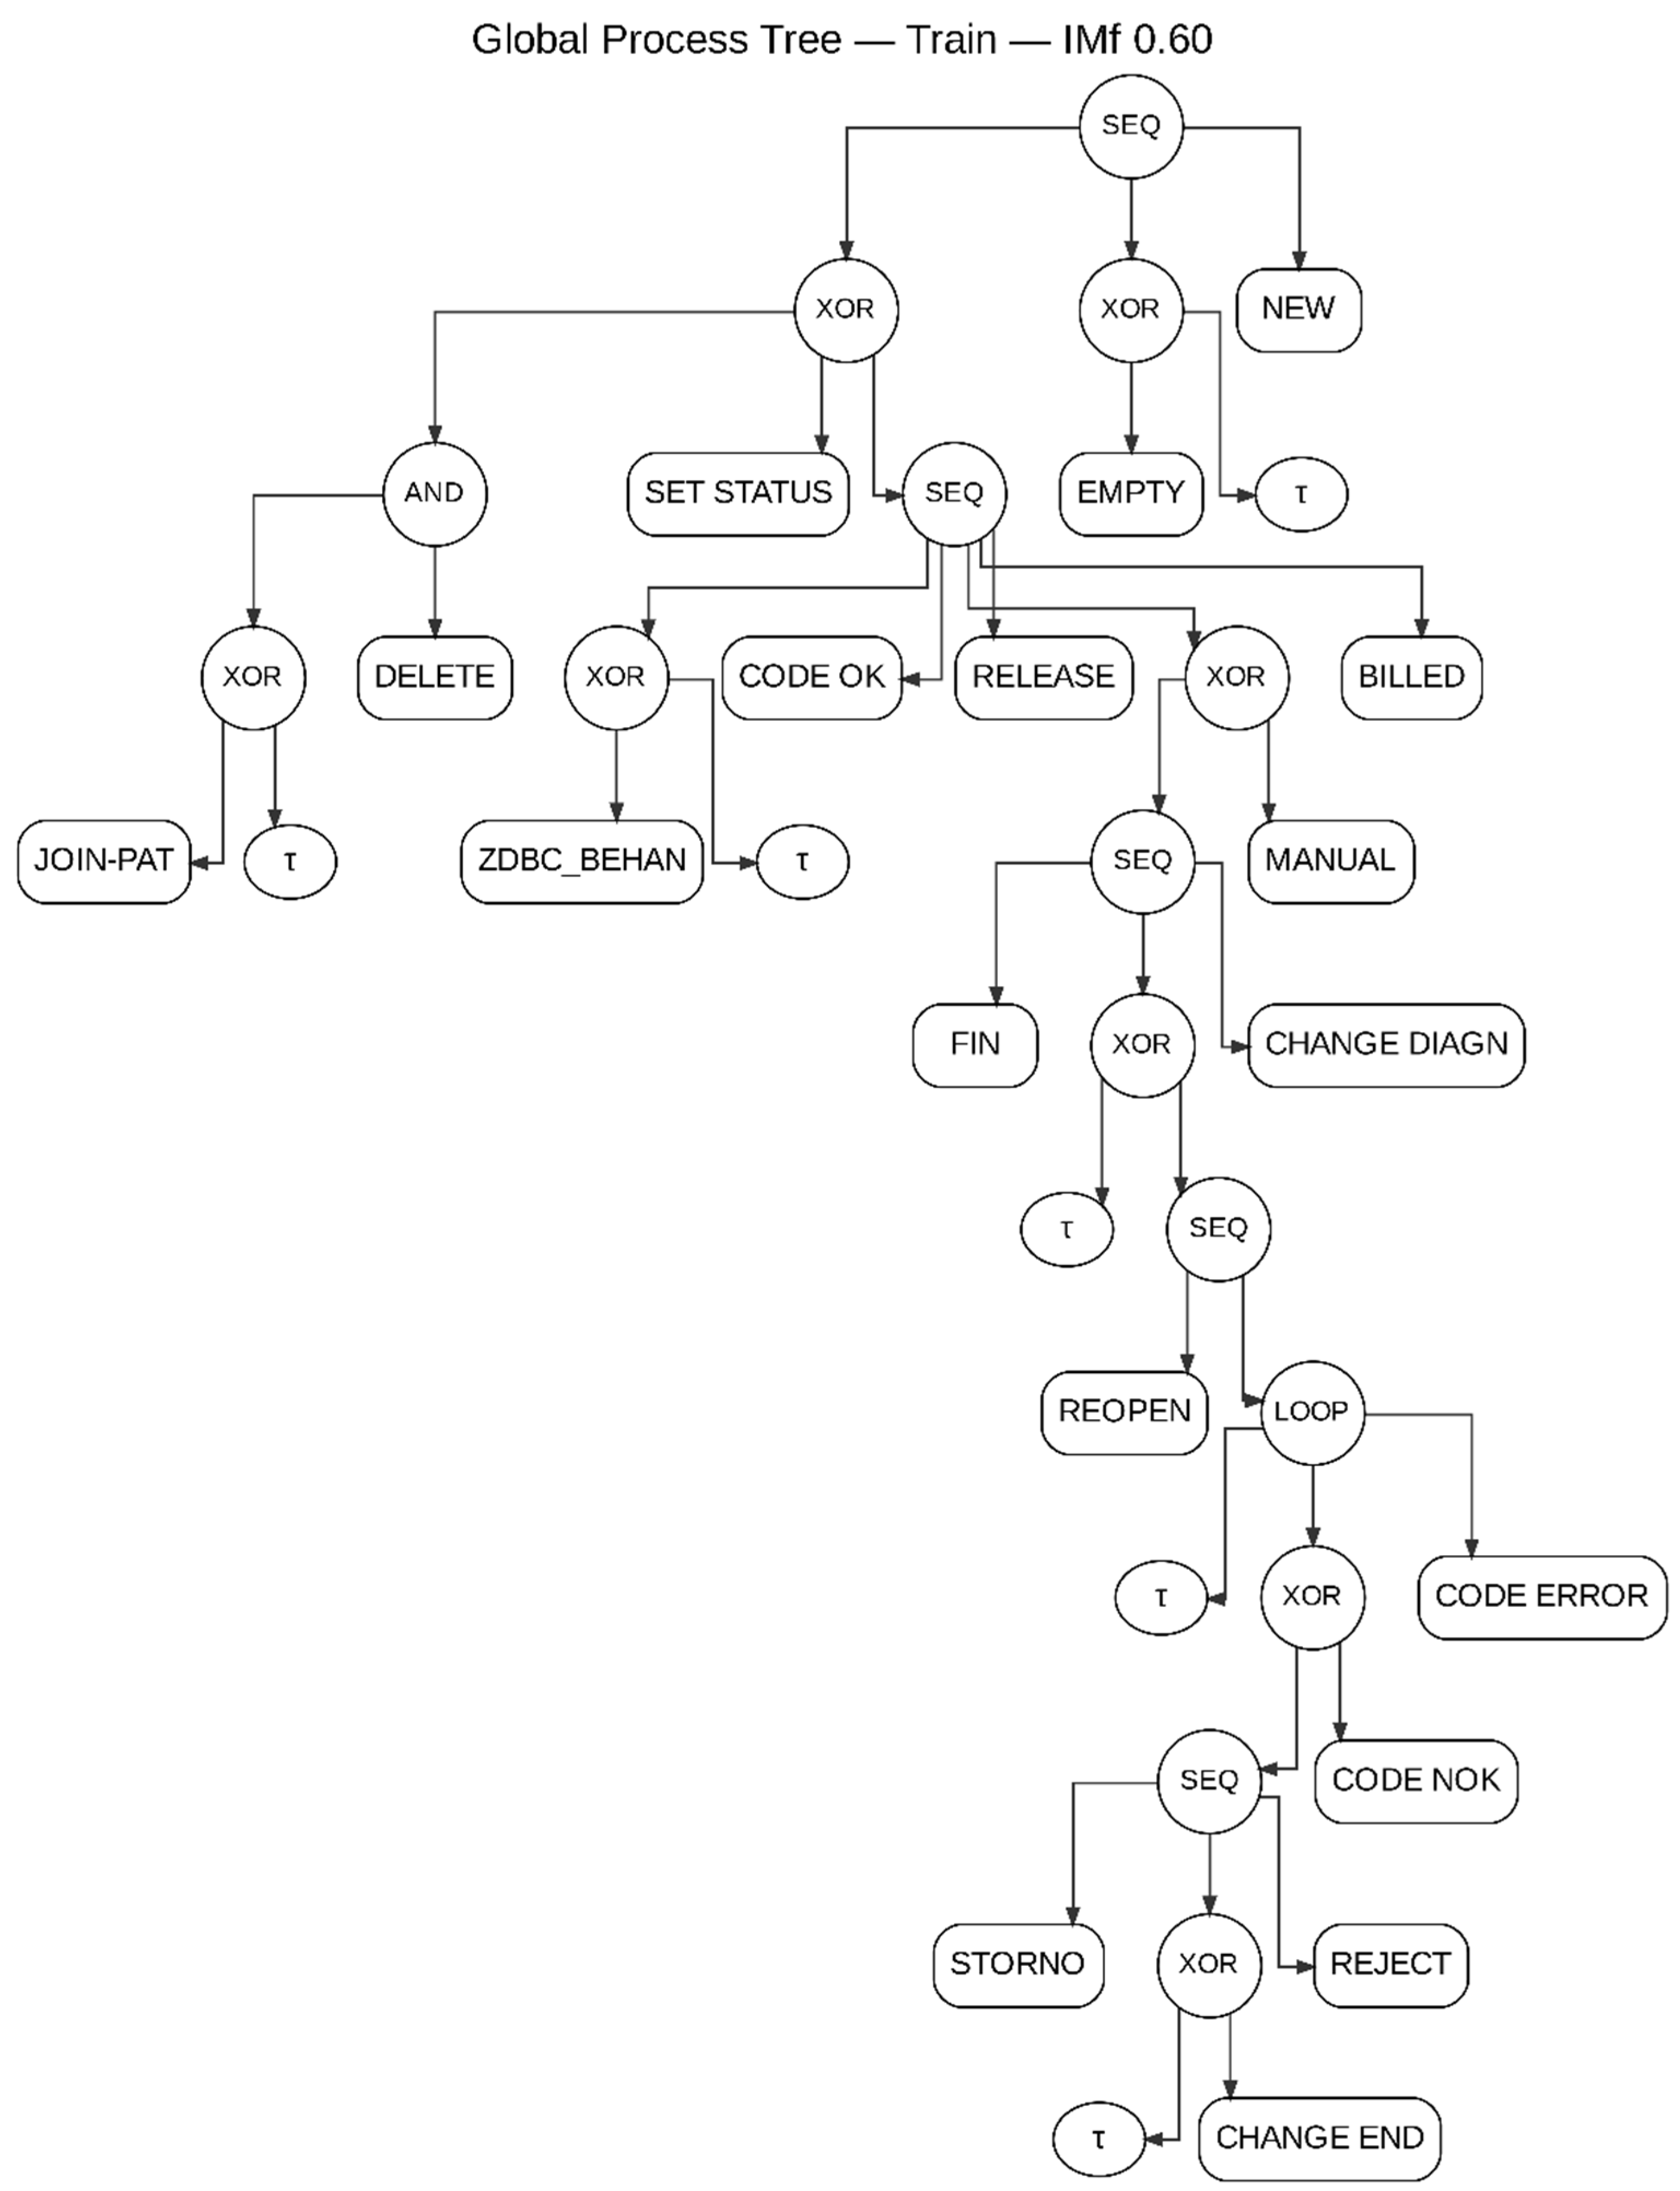
Figure 4 presents the Global Train Process Tree obtained at IMf 0.60, the threshold retained for the primary configurable-model pipeline. The quantitative comparison among all candidate thresholds is provided in Table 5.
The 0.60 Global Train Process Tree therefore serves as the hospital-wide reference model for the subsequent cluster-specific and held-out comparisons.

4.3. Cluster-Specific Process Models

Before merging, a Process Tree was mined separately from each cluster Train log with IMf 0.60. In addition to serving as source models for the configurable construction, these independently mined trees were retained as direct local baselines for held-out evaluation. The K Train tree contained 23 nodes, including eight visible activities, whereas the Others Train tree contained 39 nodes and 18 visible activities.
The overlap between the source trees consisted of eight visible activities: BILLED, DELETE, JOIN-PAT, MANUAL, NEW, REJECT, SET STATUS, and STORNO. EMPTY, CHANGE DIAGN, CHANGE END, CODE ERROR, CODE NOK, CODE OK, FIN, RELEASE, REOPEN, and ZDBC_BEHAN occurred only in the Others Train tree. This activity-level difference suggests a more restricted recorded pathway for K and a broader administrative repertoire for Others. The source trees are therefore meaningful local models in their own right, which motivates their use as a quantitative baseline rather than only as merge inputs.
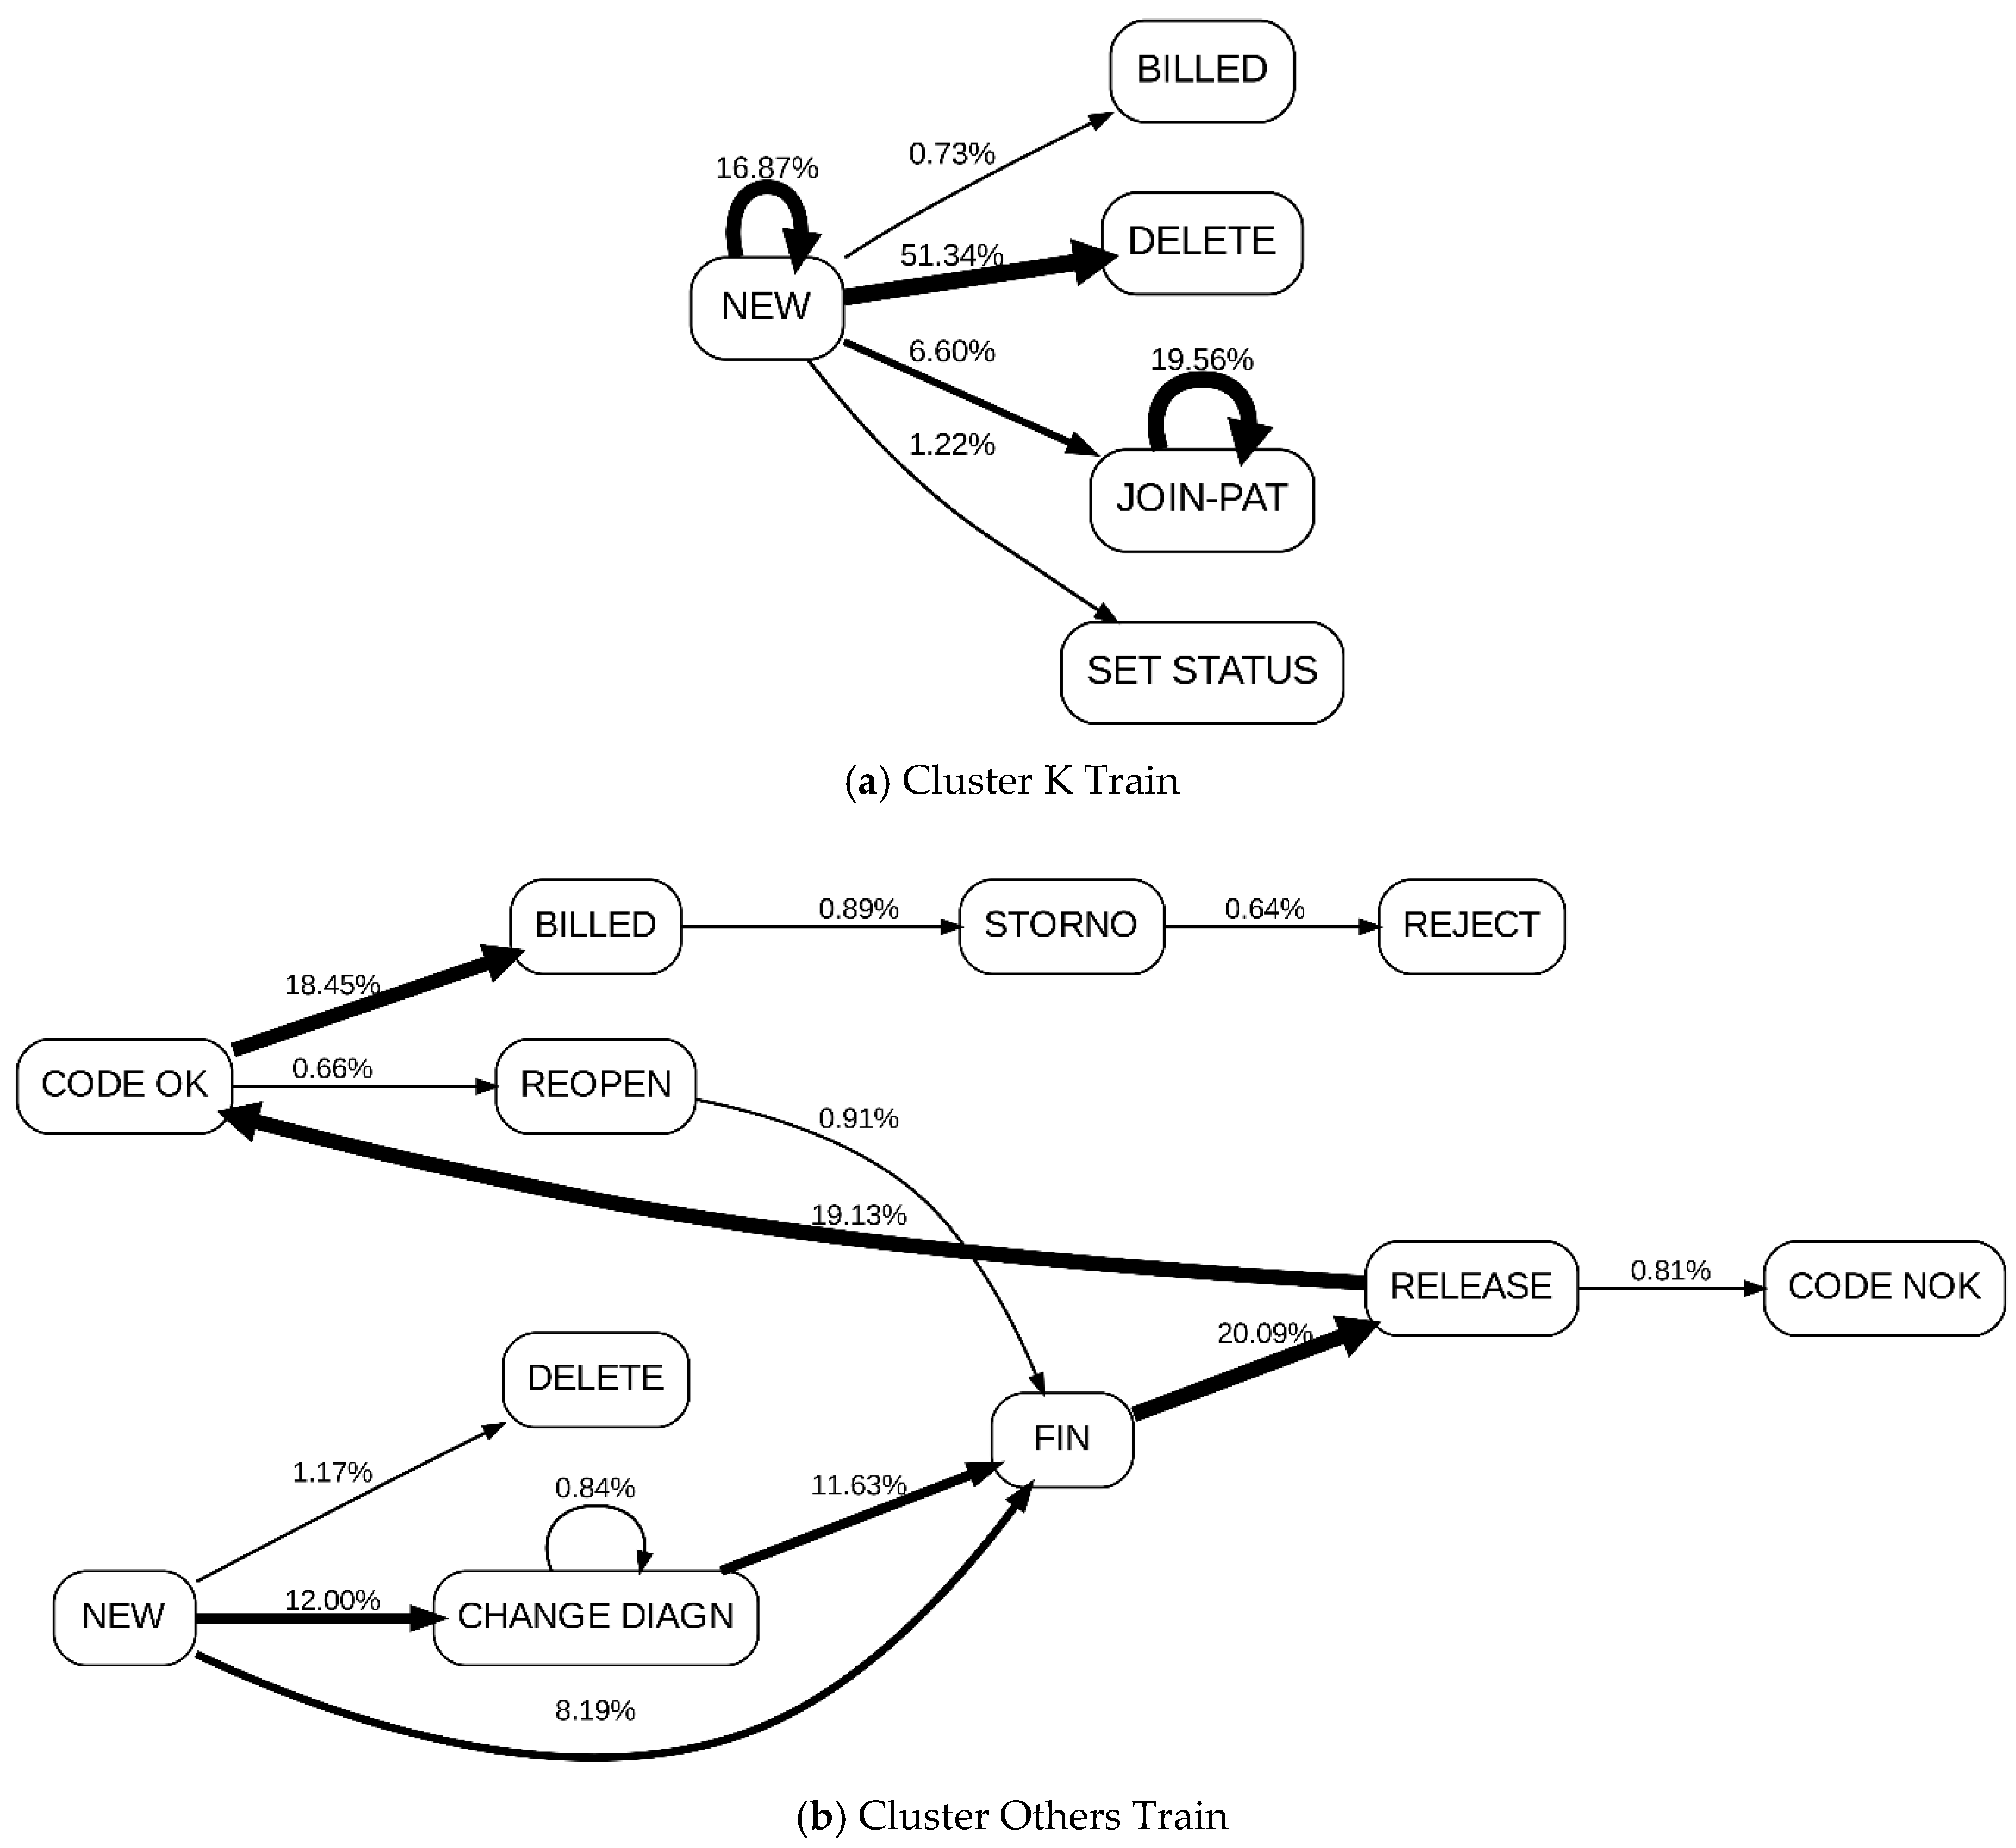
To complement the structural Process Tree comparison with a directly observable log-level view, Figure 5 presents normalized weighted DFGs constructed from the Cluster K Train and Cluster Others Train logs. For readability, the visualization displays only directly follows relations representing at least 0.5% of all directly follows occurrences within the corresponding Train log; the same visualization threshold was applied to both clusters. This filtering was applied only to the graphical display. The DFGs are used for behavioral interpretation and do not replace the Process Trees used for merging, configuration, or conformance evaluation.
The DFG comparison reinforces the structural distinction identified by clustering and process discovery. Cluster K exhibits a narrower routing repertoire, whereas the filtered visualization for Cluster Others shows prominent additional correction, reopening, release, coding, and status-handling relations. These descriptive differences are consistent with the larger activity inventory and Process Tree structure reported for Cluster Others. Table 6 summarizes the structural characteristics of the cluster-specific Process Trees and the merged configurable representation at IMf 0.60.

4.4. Merged Configurable Process Tree

Merging the two source trees produced one configurable Process Tree. Fragments common to both clusters were retained once, while differences between the source trees became configuration points. The resulting structure therefore expresses the two cluster behaviors as related variants of the same process family.
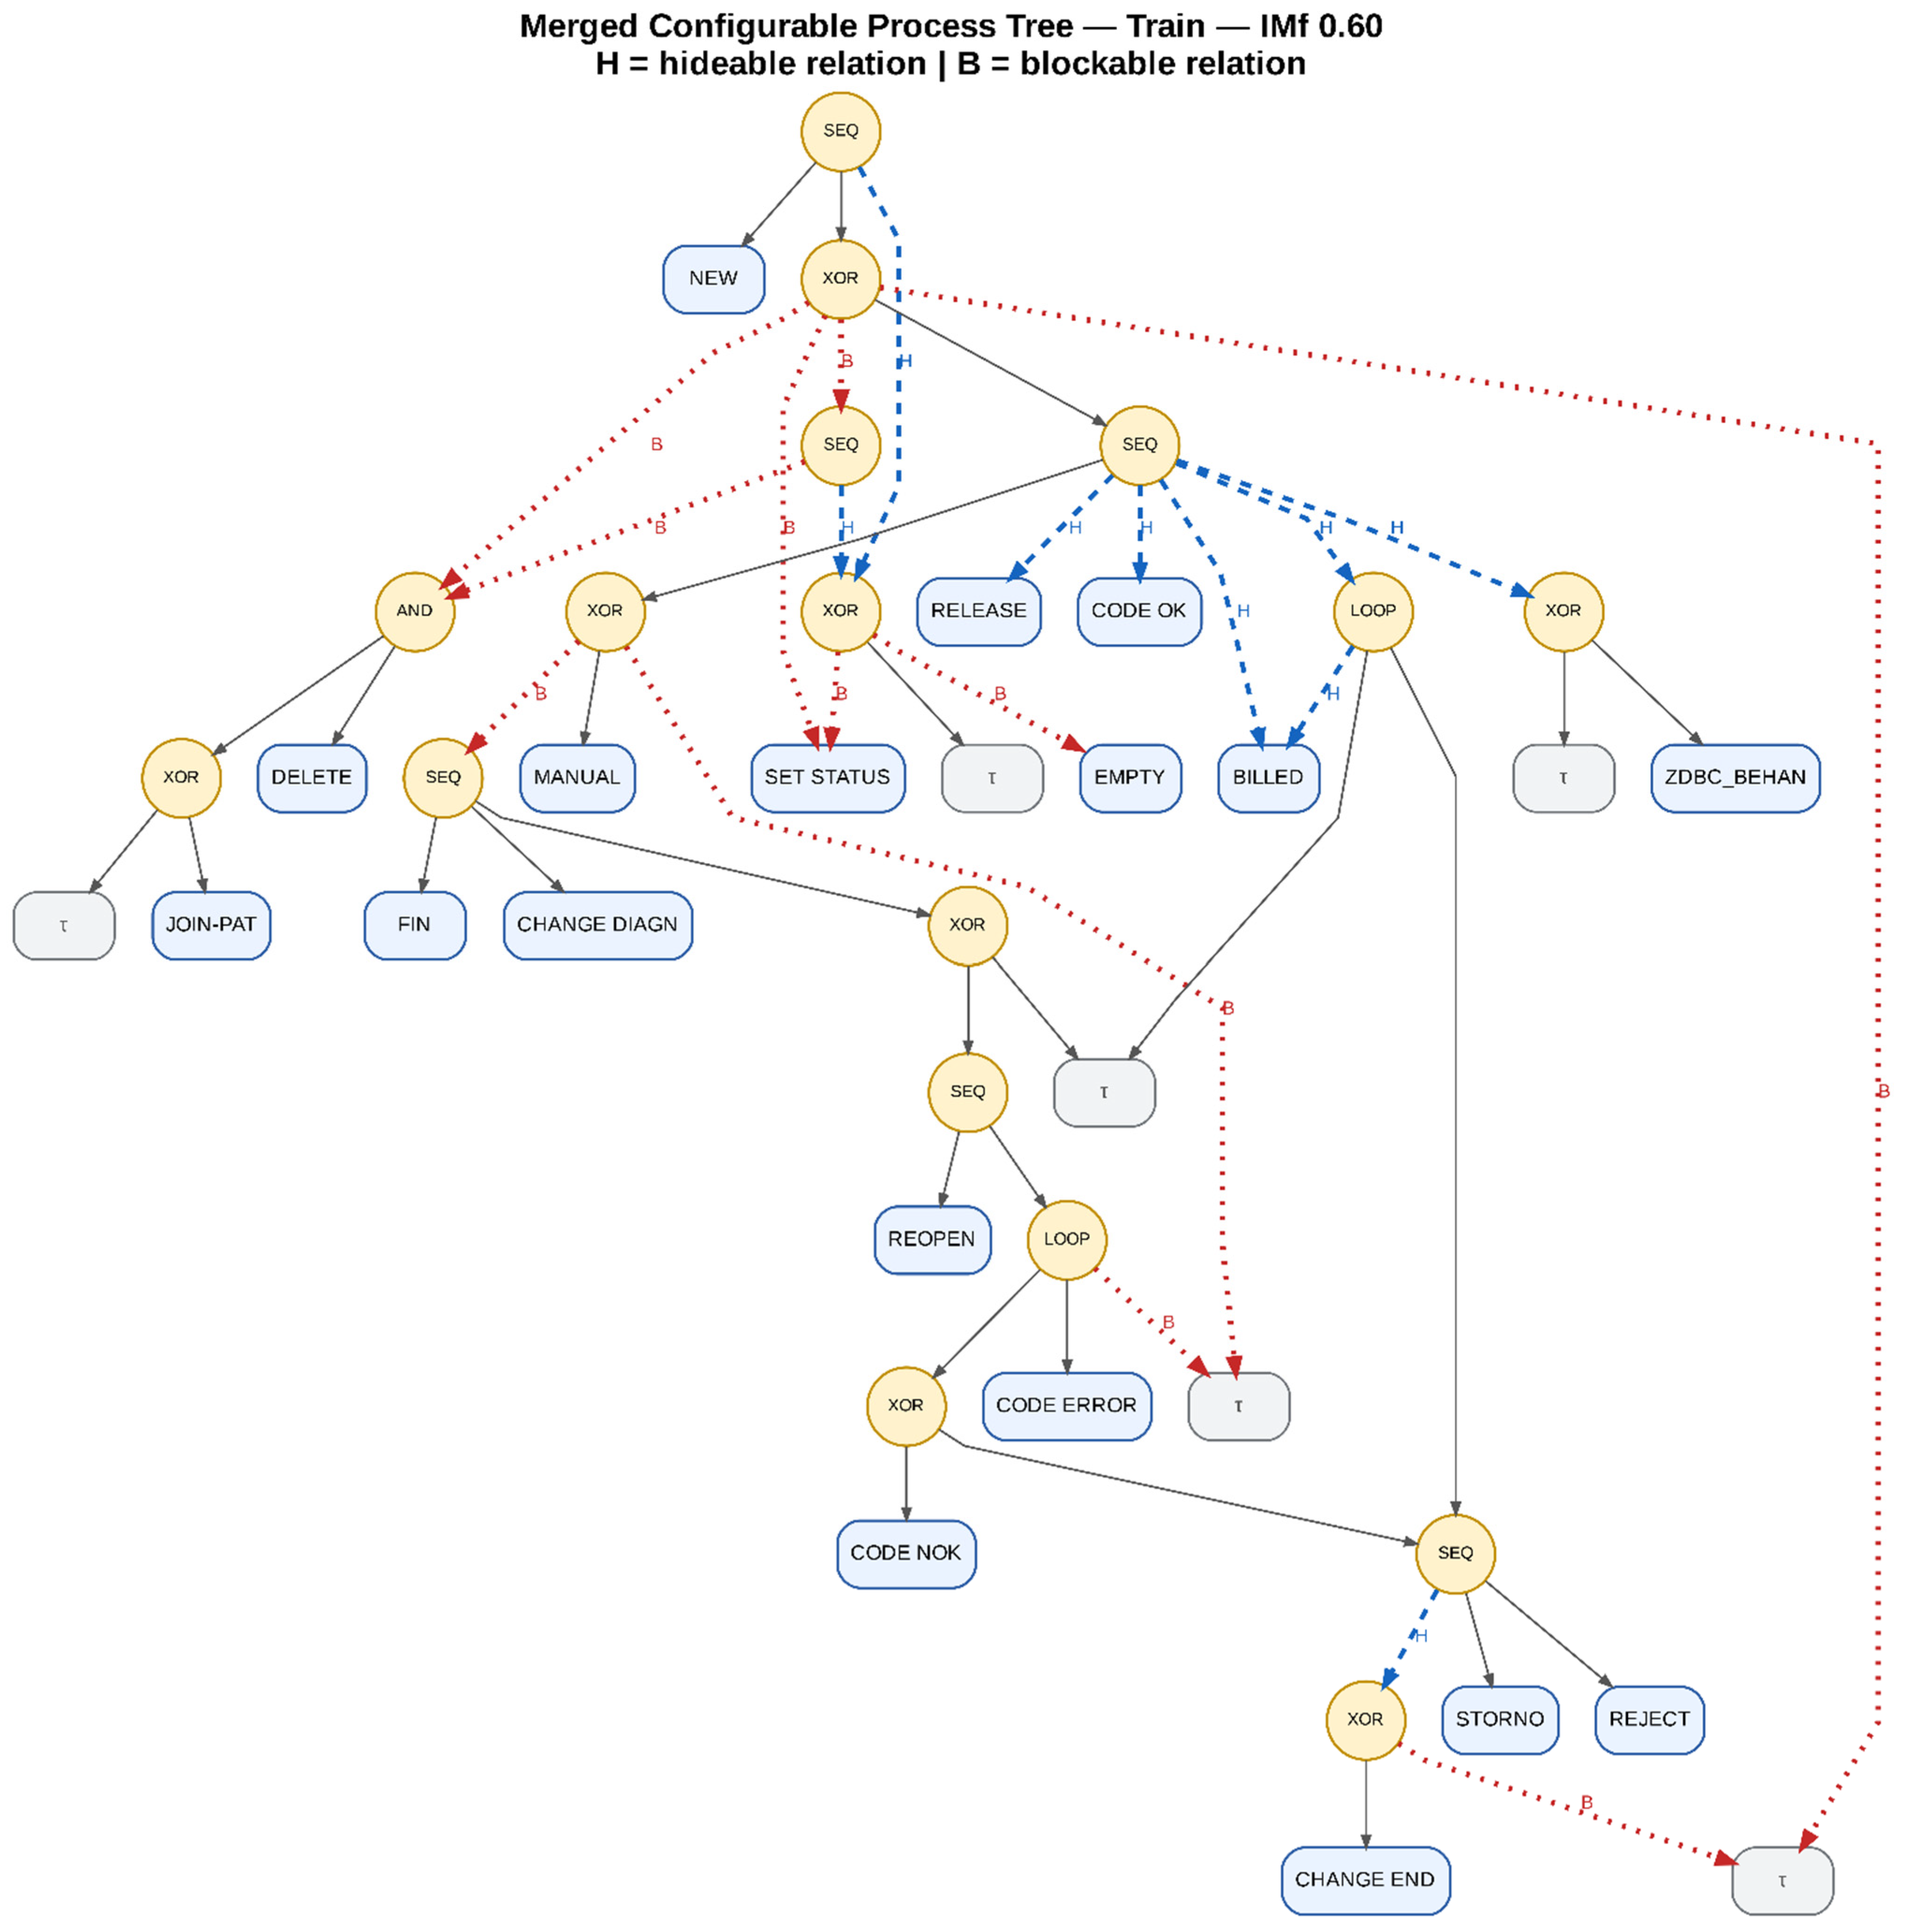
At 0.60, the merged configurable representation comprised 41 unique Process Tree nodes and 48 node-to-node structural relations. The exported PTML additionally contains one auxiliary placeholder/root relation used by the serialization structure; this auxiliary relation is omitted from the structural count and from the cleaned visualization because it is not a semantic Process Tree relation. Structural inspection identified 20 configurable relations: 9 hideable and 11 blockable. The corresponding 0.40 configuration experiment exposed 25 configuration points. Thus, increasing the threshold from 0.40 to 0.60 reduced the number of configuration points from 25 to 20, while the targeted sensitivity analysis showed that this reduction did not materially reduce replay fitness. In Figure 6, hideable relations are shown in blue and blockable relations in red.
The node count of the merged representation refers to unique nodes in the exported configurable PTML. Because PTMerge consolidates mapped fragments shared by the source trees, this unique-node count is not directly comparable one-to-one with the explicit-node count of an ordinary Derived Process Tree returned after configuration; structural occurrences that are consolidated in the configurable representation may appear separately in the derived tree. To ensure consistency, all reported Process Tree node counts were recomputed from the exported PTML files using the same parser and counting rules: 41 unique nodes for the merged configurable representation, 27 nodes for Derived K, and 51 nodes for Derived Others. The larger Derived Others count therefore reflects the representation stage rather than a different counting procedure.

4.5. Greedy and Genetic Configuration Search

The merged configurable Process Tree was configured separately against the Cluster K and Cluster Others training logs. Both Greedy and Genetic searches operated on the same merged representation containing 20 configurable relations. The two strategies were first assessed at the configuration-output level, before the selected Genetic-derived models were evaluated on the held-out Test logs.
Greedy completed successfully as a computation, requiring 1.222 s for Cluster K and 20.701 s for Cluster Others; its exclusion was therefore not caused by a runtime error or crash. For K, the plugin reported an objective of 0.792, fitness of 0.778, and precision of 0.915. For Others, the corresponding values were 0.854, 0.848, and 0.912. However, both Greedy outputs resolved only 14 of the 20 configuration points; the returned tree structures still retained configurable elements, and the K output included one explicit null configuration value. The Greedy results were therefore excluded on the basis of a predefined configuration-completeness criterion, not because of runtime, lower downstream Test performance, or a software crash. They were incomplete configuration outputs rather than fully derived ordinary Process Trees suitable for the common downstream evaluation protocol.
Genetic resolved all 20 configuration points for both clusters. The selected K Run 2 reported a training objective of 0.985, fitness of 0.992, and precision of 0.922, while the selected Others Run 1 reported 0.912, 0.906, and 0.962, respectively. Genetic was retained because it satisfied the predefined output-completeness requirement, not because its final Test-set results were inspected in advance. Reporting the Greedy outputs alongside this criterion makes the strategy selection explicit and limits methodological selection bias.
For the Genetic strategy, five independent runs were executed for each cluster with identical parameters (fitness/precision/generalization/simplicity weights = 90/10/0/0, population size = 10, generations = 20). The configuration plugin directly returned a Derived Process Tree for each run; the fitness and precision values displayed during search were treated as optimization outputs rather than final conformance results.
For Cluster K, the five runs produced configuration-objective values from 0.978 to 0.985, fitness remained 0.992 in all runs, and precision ranged from 0.857 to 0.922. Runs 2–5 converged to the same displayed objective (0.985), fitness (0.992), and precision (0.922); Run 2 was retained according to the predefined tie-breaking rule. Runtime ranged from 8.289 s to 25.426 s. For Cluster Others, configuration-objective values ranged from 0.902 to 0.912, fitness from 0.893 to 0.906, and precision from 0.961 to 0.991. Runs 1, 2, 3, and 5 reached the same best displayed objective (0.912); Run 1 was retained because it had the highest precision among the best-objective runs (0.962, tied with Run 5) and was the earliest such run. Runtime ranged from 5 min 17.620 s to 7 min 02.847 s.
The repeated runs indicate good stability at the level of the optimized quality objective: four of five runs reached the best displayed objective for each cluster. Exact E/H/B assignments were not identical across all numerically tied solutions, indicating that more than one configuration can yield equivalent or near-equivalent objective values. Stability is therefore interpreted here in terms of convergence of configuration quality rather than exact chromosome identity. The retained configurations are reported in Table 7, and final conformance was recalculated after Petri-net conversion using the procedure in Section 3.8.

4.6. Derived Models and Conformance Comparison

For each cluster, the retained Genetic run directly returned a Derived Process Tree corresponding to the selected E/H/B configuration learned from Train data. The two Derived Process Trees were exported and converted to Petri nets. Final conformance was then measured on the corresponding held-out Test log. The same Test cases were replayed on the Global Train model and on the independently mined cluster-specific Train model, producing a three-way comparison under one common evaluation protocol. No additional instantiation plugin was used.
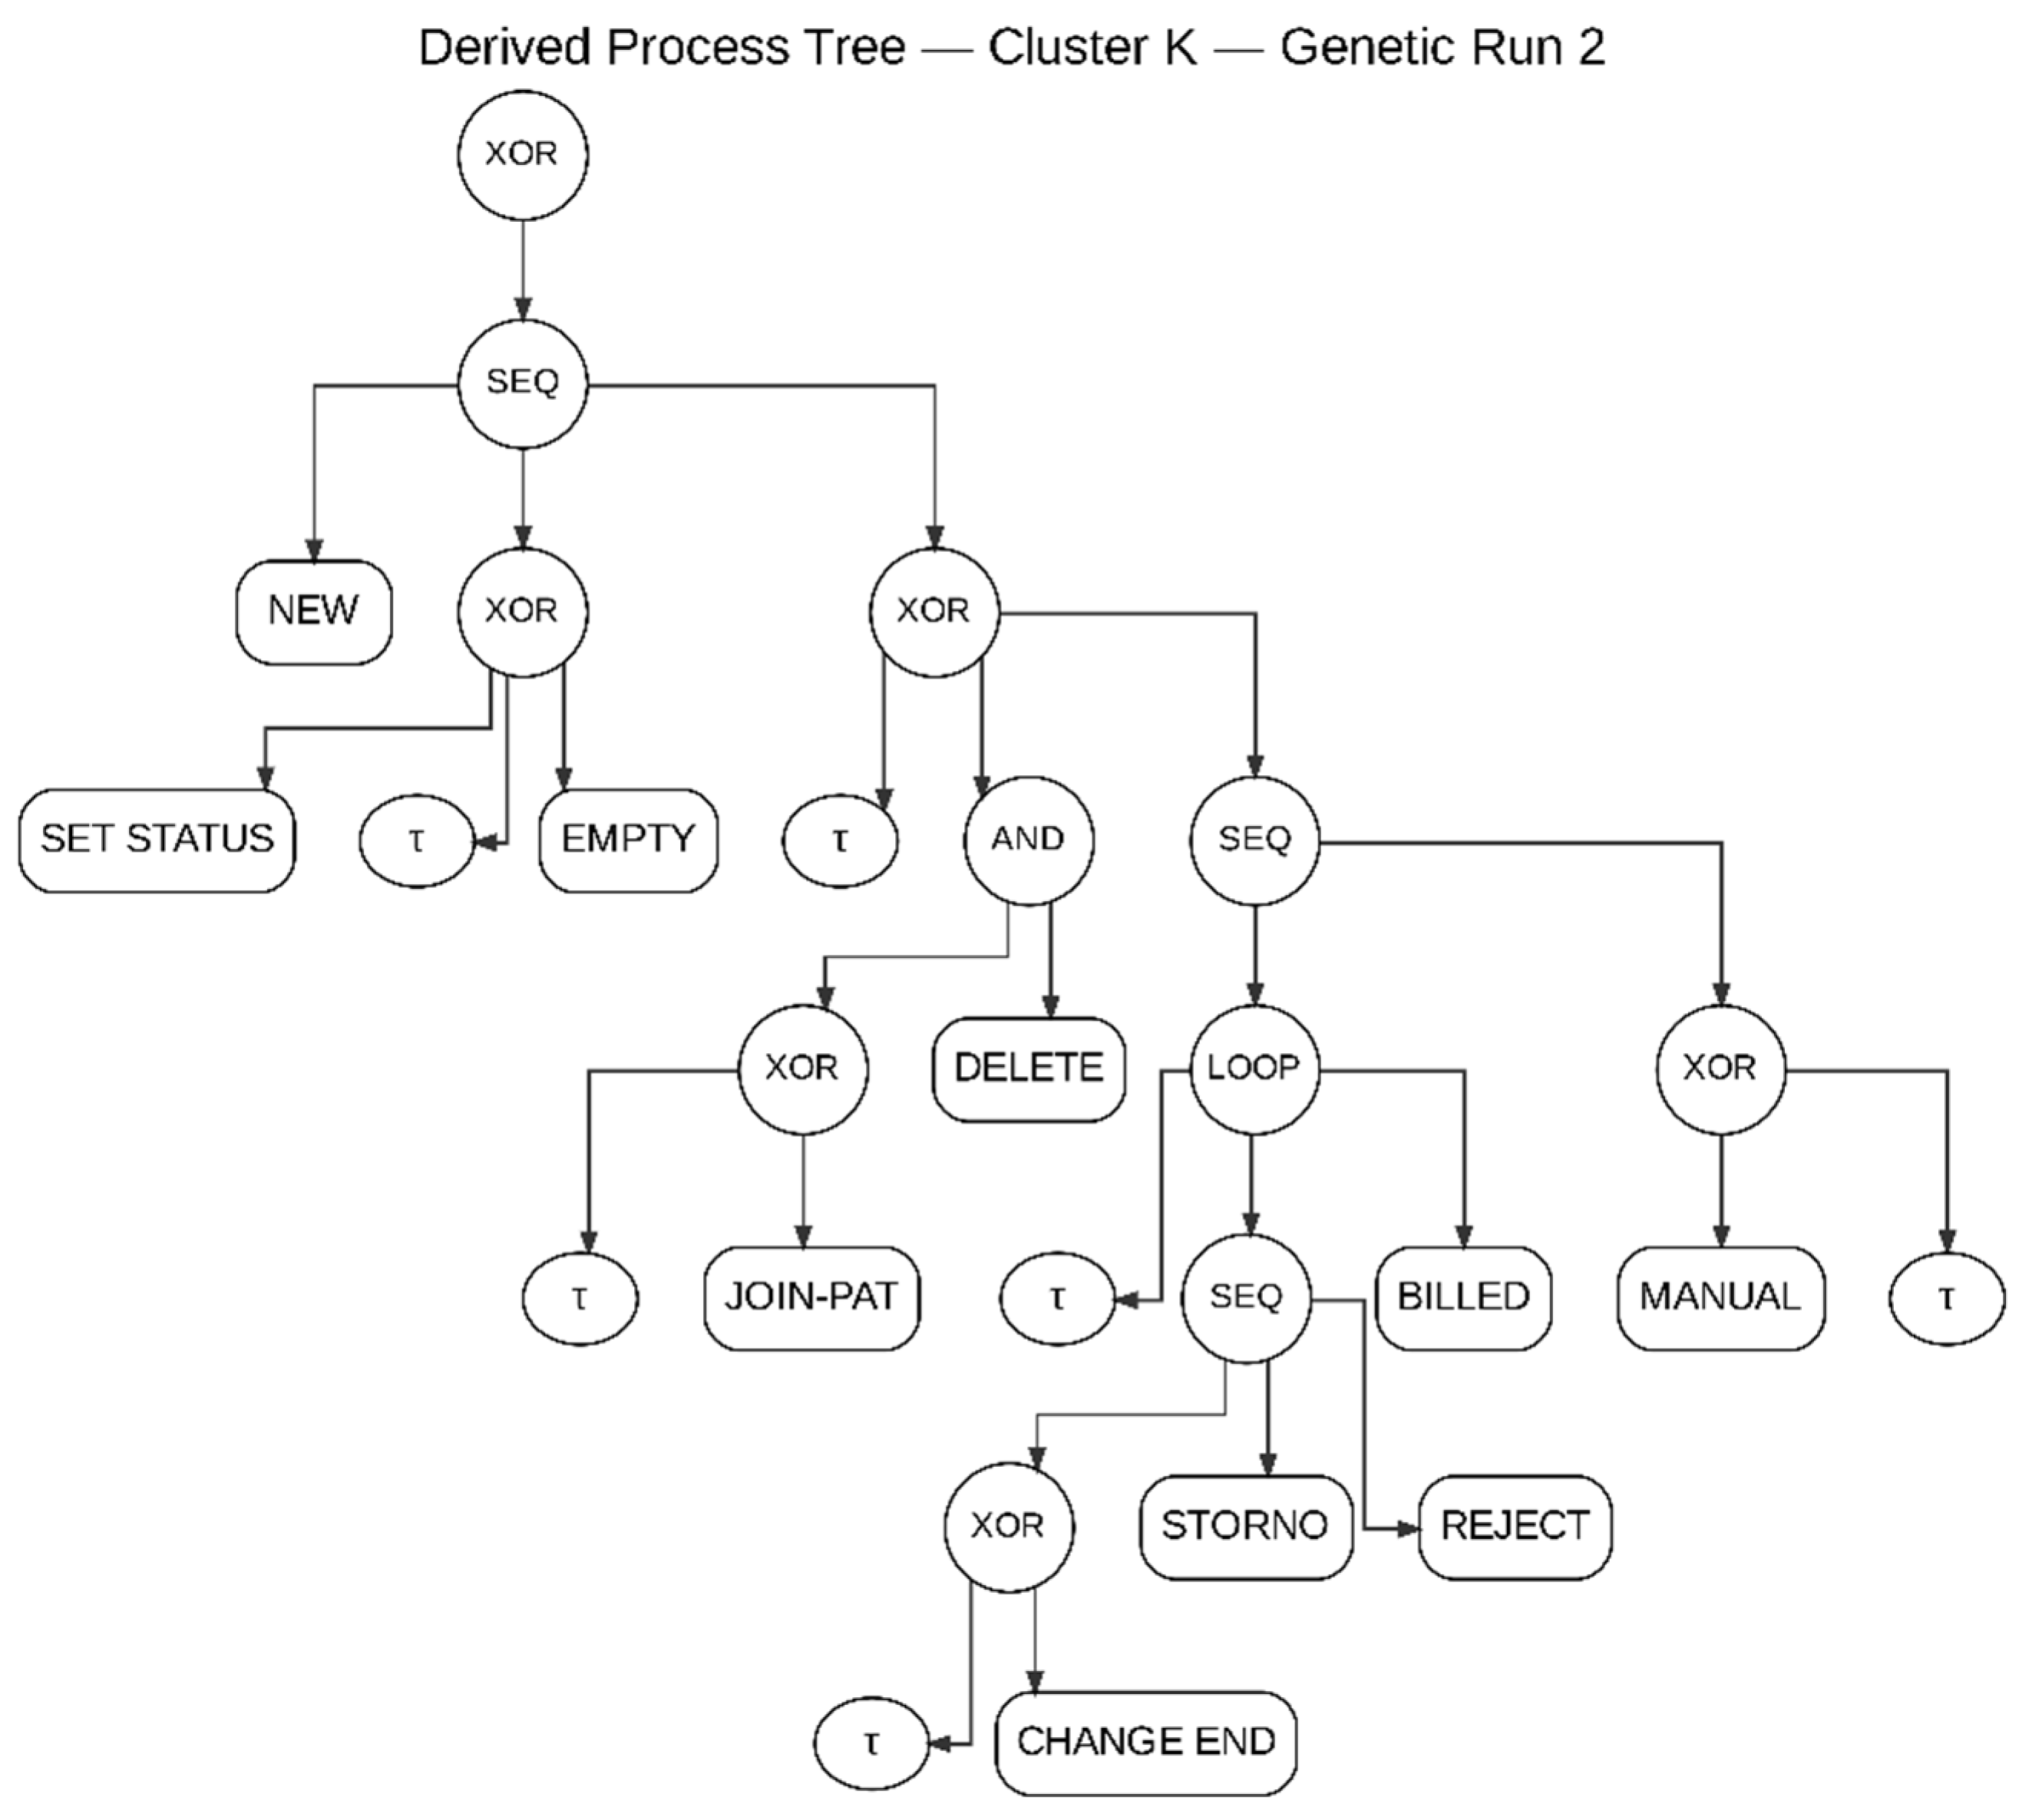
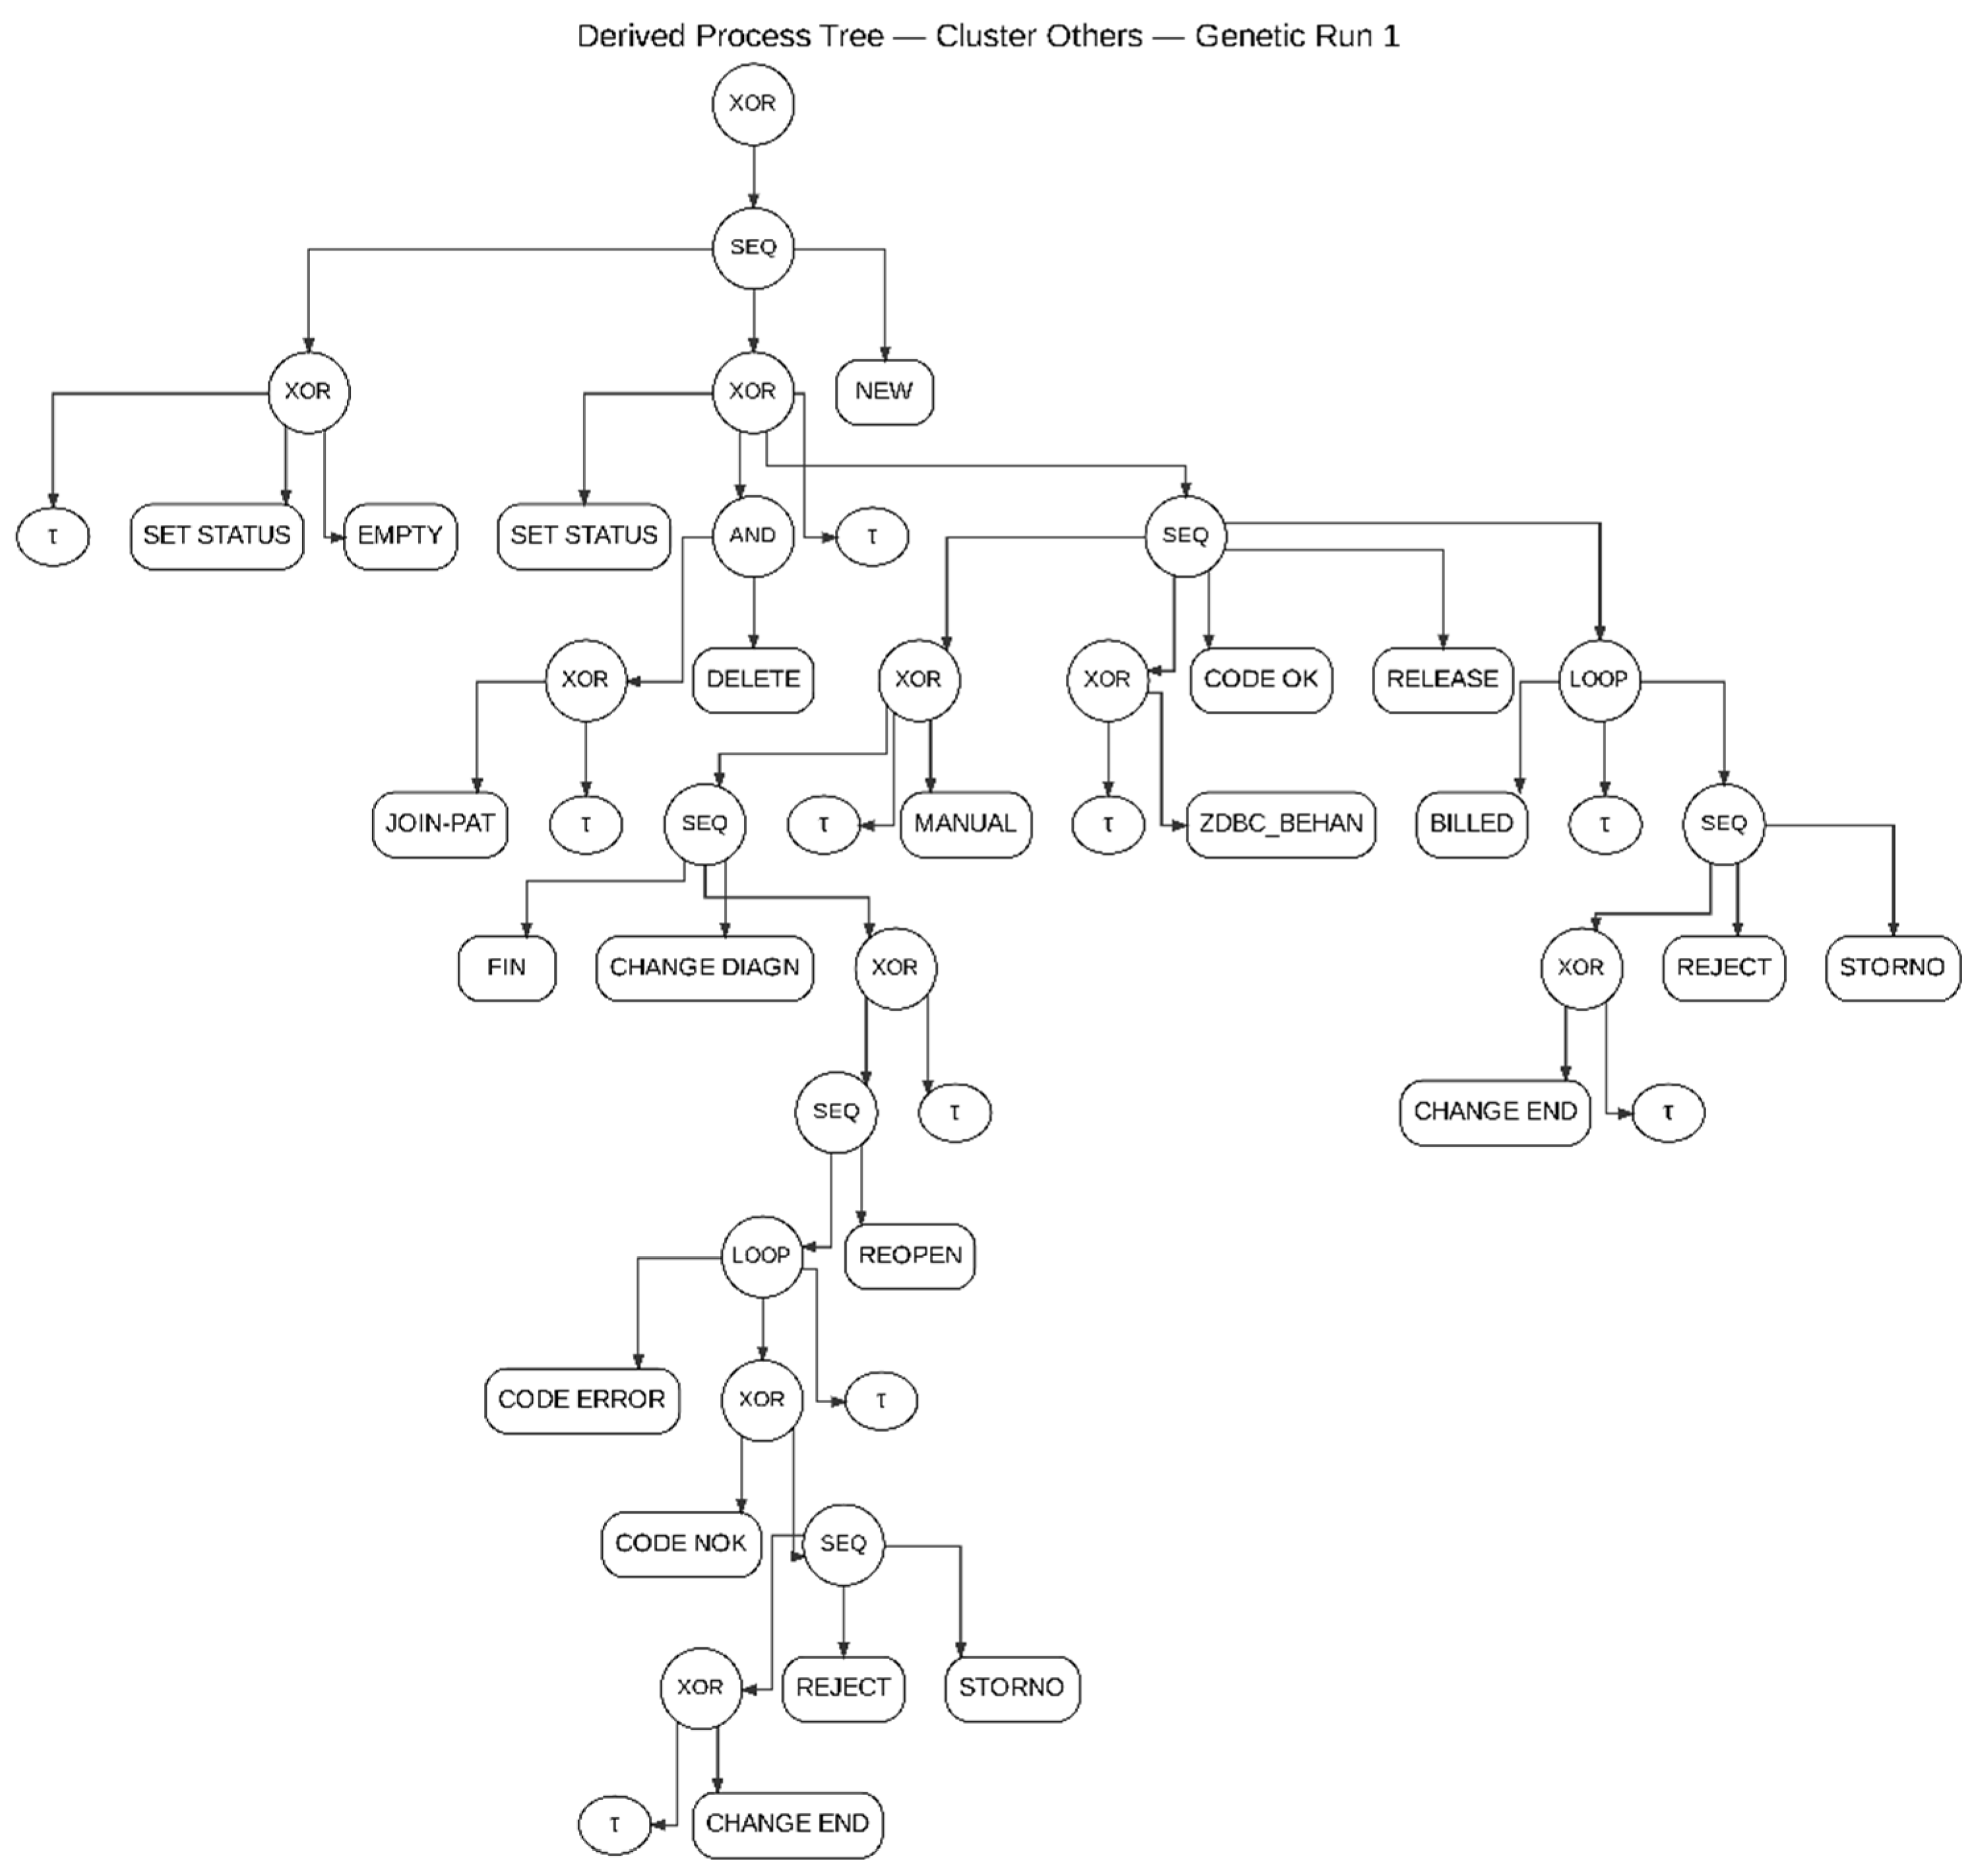
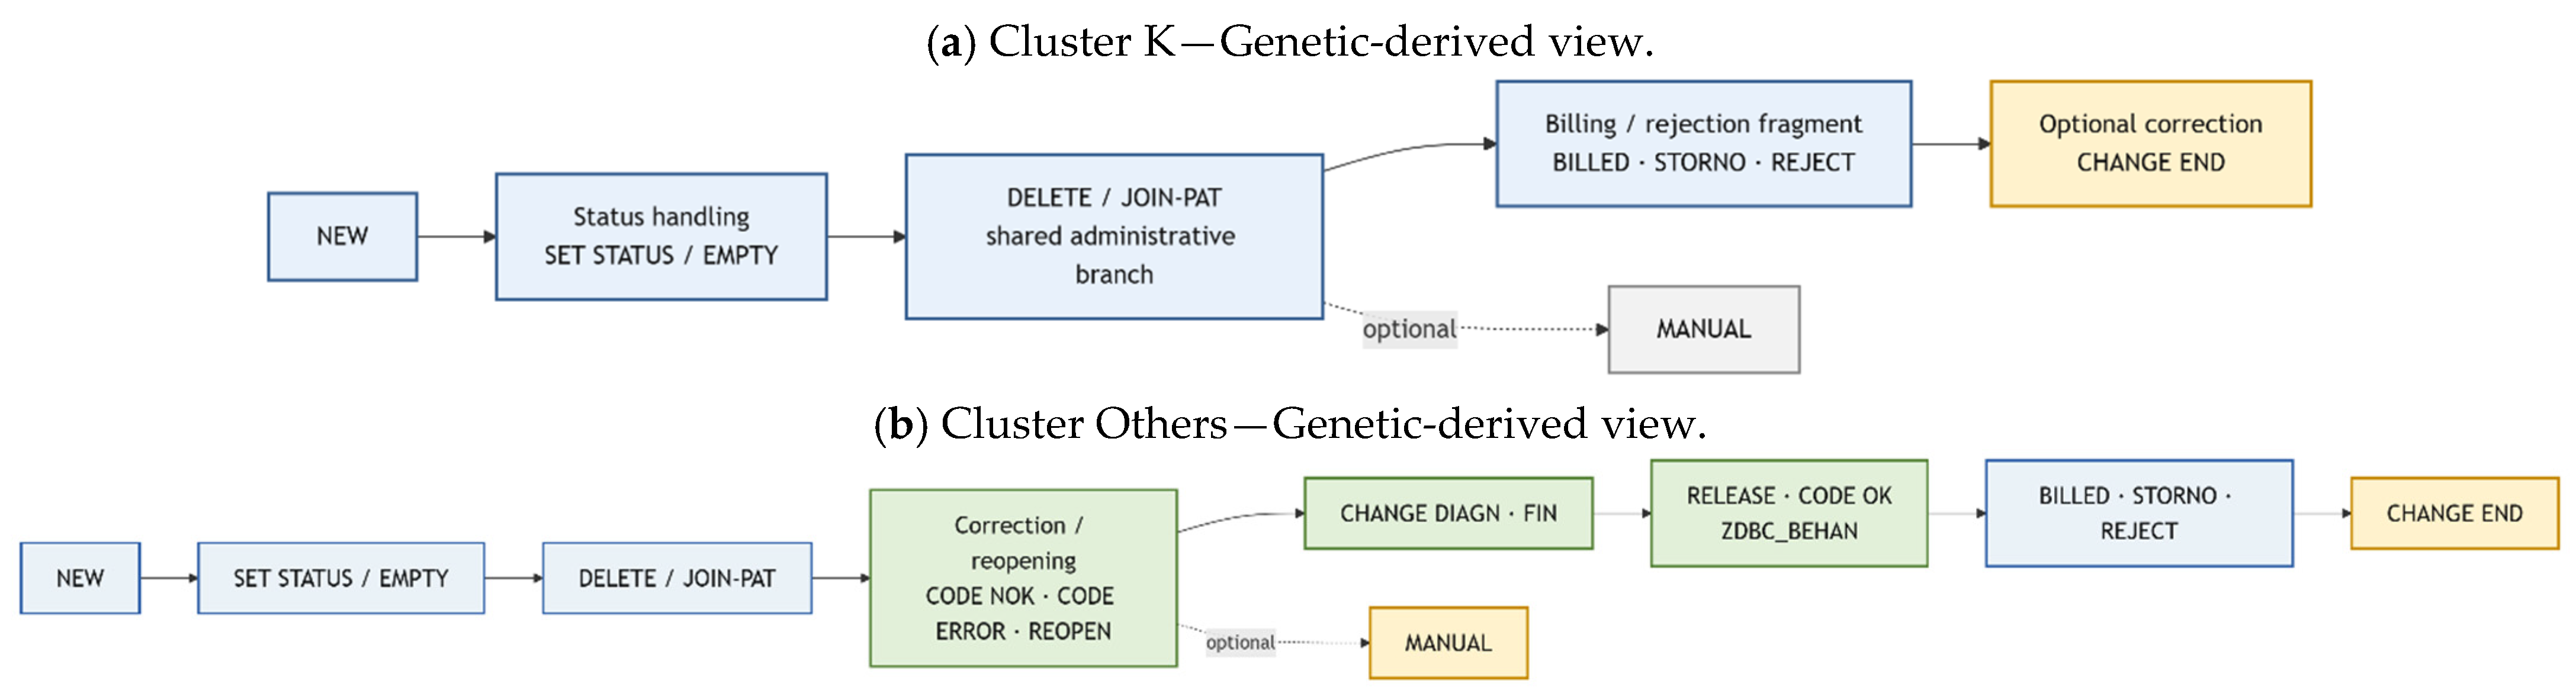
Figure 7 presents simplified horizontal summaries of the two context-specific process views returned by the retained Genetic configurations. The diagrams emphasize the main visible behavioral fragments and principal divergence points, while silent transitions and low-level routing constructs are omitted for readability. The complete Derived Process Trees returned by the retained Genetic configurations are provided in Appendix A: Figure A1 presents the Derived Process Tree for Cluster K (Run 2), and Figure A2 presents the Derived Process Tree for Cluster Others (Run 1). The independently mined cluster-specific Process Trees used as comparison baselines are the Train models described in Section 4.3.
The simplification is purely visual: the formal Derived Process Trees, including their XOR, AND, LOOP, and silent-transition structures, were not altered for conformance evaluation. The simplified diagrams omit low-level routing constructs only to facilitate interpretation. Table 8 presents the held-out conformance comparison of the Global Train, directly mined local Train, and Genetic-derived models on the two cluster Test logs.
On the Cluster K Test, the global Train model obtained fitness 0.6678 and balanced precision 0.5839. Direct local discovery increased these values to 0.9991 and 0.6245, respectively. The Genetic-derived K model achieved fitness 0.9992 and balanced precision 0.6690. Thus, the derived model slightly exceeded the directly mined K baseline on both measures while remaining far more faithful to K than the global model. Structurally, the direct K tree contained 23 nodes and the derived K tree 27 nodes, compared with 39 nodes for the global Train model.
On Cluster Others Test, the global Train model achieved fitness 0.8563 and balanced precision 0.8556. The directly mined Others model obtained fitness 0.8473 and balanced precision 0.9312, whereas the Genetic-derived Others model reached fitness 0.8598 and balanced precision 0.9305. The derived model therefore provided the highest replay fitness while preserving essentially the same balanced precision as the direct local baseline (difference = 0.0007). The direct Others tree contained 39 nodes and the derived tree 51 nodes.

4.7. Macro- and Micro-Level Analytical Views

The three-way held-out comparison distinguishes model scope from model quality. The Global Train model provides one hospital-wide reference, direct cluster-specific Process Trees provide autonomous local models, and the configurable-derived models retain an explicit link to a shared process family. On K, the derived model slightly exceeded direct local discovery in both held-out fitness and balanced precision; on Others, it achieved higher fitness with virtually unchanged balanced precision.
There is therefore no single preferred representation for every analysis. Direct cluster-specific Process Trees remain appropriate when only an isolated local view is required. The configurable approach adds a different capability: common and variable fragments remain explicit in one reference representation while the derived models retain competitive local conformance on unseen data. The macro/micro distinction therefore concerns analytical scope and model management as well as conformance quality.

5. Discussion

5.1. Behavioral Grouping and Threshold Choice

The Train-only clustering results show that specialty-related variability is concentrated rather than uniformly distributed. Specialty K formed a distinct family, whereas the remaining 16 specialties were grouped together; the two-cluster solution achieved the highest mean silhouette score (0.8960). The weighting sensitivity analysis further retained k = 2 and specialty K as a singleton across all tested 0.10–0.90 Jaccard weights. This supports using specialty as an initial context while allowing observed Train activity and routing behavior to determine the final process families [3,4,5,6,7].
Threshold selection was objective-dependent. In the Train-only scan, 0.40, 0.50, and 0.60 produced identical reported conformance values (fitness = 0.8450; balanced precision = 0.9963) and identical aggregate structural metrics (39 nodes, depth = 11, adapted CFC = 19). The endpoint structural comparison was then fixed at 0.60 before held-out evaluation because the Train-derived merged representation contained 20 configuration points rather than 25 at 0.40. The subsequent held-out sensitivity check showed the same K fitness (0.9992) with balanced precision increasing from 0.6070 to 0.6690, and only a 0.0013 fitness decrease for Others (0.8611 to 0.8598) while balanced precision increased from 0.8217 to 0.9305. These Test results support the robustness of the preselected common threshold but were not used to tune it.

5.2. Conformance and Role of the Configurable Model

The held-out comparison shows that the configurable-derived models remain competitive with direct local discovery rather than uniformly dominating it. On Cluster K Test, the Derived Process Tree achieved fitness/balanced precision of 0.9992/0.6690 versus 0.9991/0.6245 for the direct K model. On the Cluster Others Test, the corresponding values were 0.8598/0.9305 versus 0.8473/0.9312. The contribution is therefore not superior conformance in every metric, but the ability to preserve local model quality while keeping shared and context-dependent behavior explicit within one process family.
The retained configurations were also consistent with the broader structural differences between the two clusters. CODE OK, RELEASE, and ZDBC_BEHAN were hidden for Cluster K but enabled for Cluster Others, while the extended correction/reopening behavior appeared as an enabled summary entry for Others but was not displayed as a separate enabled entry for K. Because the independently mined source trees were not used to determine these configuration states, this agreement provides a post hoc consistency check rather than an optimization criterion.

5.3. Operational Interpretation

The configurable model provides a practical map of process variation. Behavior retained in both configurations forms a shared administrative backbone, while hidden or blocked fragments identify context-dependent areas. Cluster K follows a narrower recorded billing pathway, whereas Cluster Others retains more correction, reopening, release, and status-handling alternatives.
For process owners, these differences indicate where procedures may be reviewed jointly and where targeted investigation is more appropriate. The compact K pathway may reflect stronger standardization or simply fewer correction paths, while the richer Others structure points to areas where rework or procedural variation should be examined. These are operational hypotheses rather than performance claims: the log describes administrative billing, the specialties are anonymized, and no cycle-time, cost, resource, or clinical-outcome measures are available [1].
From a BPM perspective, the configurable representation can serve as an intermediate analytical artifact between process mining and process redesign. The shared backbone of the configurable Process Tree identifies behavior that could be represented as a common reference process, whereas configurable branches identify context-dependent fragments that require separate treatment. A process owner could use these divergence points to decide whether a local variant should be standardized, retained as an authorized exception, or investigated as potential rework. For implementation purposes, the shared and cluster-specific fragments could subsequently be translated into BPMN constructs such as common subprocesses, gateways, and variant-specific branches. Such a BPMN transformation was not performed in the present study and is therefore proposed as an operationalization step rather than as an evaluated contribution.
The same distinction can support compliance and workflow-management scenarios. Once a normative target process or an authorized set of variants is defined, the Derived Process Trees can provide context-specific reference behavior against which future executions may be compared. Hidden or blocked fragments can indicate where a behavior is not expected for a given context, while enabled fragments identify permitted local behavior. In a workflow-management setting, these distinctions could inform routing rules or variant-specific process configurations. The present study does not implement such workflow automation or normative compliance monitoring; it provides the process-variation structure on which these BPM activities could be based.

5.4. Limitations and Future Work

The study is limited to one public healthcare log with anonymized specialty labels. The 1000-case cutoff and the 0.30/0.70 activity-routing weighting are experiment-specific choices. Greedy was executed for both clusters but produced incomplete configuration outputs (14/20 resolved points in each case, with an explicit null entry for K), so only complete Genetic-derived Process Trees entered the common holdout evaluation. Five independent Genetic runs per cluster were used to assess stochastic robustness, but the ProM interface did not expose a user-defined random seed; consequently, exact seed-controlled replication of a particular chromosome was not possible within the plugin configuration used here. The revised evaluation includes directly mined cluster-specific Process Trees as held-out baselines; future work should extend this comparison to additional datasets, contextual attributes, and process-discovery algorithms.
The conformance analysis is quantitative rather than diagnostic. Although alignment-based fitness and precision were evaluated on held-out data, the study does not classify individual deviation patterns, identify the organizational causes of non-conformance, or associate deviations with performance outcomes. Such an analysis would require event-level inspection of alignment moves and, ideally, additional contextual attributes such as resources, costs, or operational outcomes. Future work should therefore extend the framework from model-quality evaluation to deviation-oriented conformance analysis, including the identification of recurrent log/model moves and their business interpretation.

6. Conclusions

This study developed a configurable process mining framework that connects a hospital-wide process view with context-specific instances derived from behavioral families. Starting from 17 retained medical specialties, Train-only activity-set and weighted-DFG similarity identified two behavioral groups: specialty K and Cluster Others, with the selected k = 2 partition reaching a mean silhouette of 0.8960. In the Global Train IMf sensitivity analysis, thresholds 0.40, 0.50, and 0.60 tied on the reported conformance values (fitness = 0.8450; balanced precision = 0.9963) and aggregate structural metrics (39 nodes, depth = 11, adapted CFC = 19). An endpoint comparison of Train-derived configurable structures then fixed 0.60 as the common primary threshold because it reduced the number of configuration points from 25 to 20. A subsequent held-out 0.40/0.60 sensitivity check supported this choice without being used for threshold selection. At 0.60, the merged configurable representation contained 41 unique nodes and 20 configurable relations.
Genetic configuration search derived separate enabled, hidden, and blocked states from Train data and directly returned the corresponding Derived Process Trees. On held-out Cluster K Test cases, the Derived Process Tree achieved fitness/balanced precision of 0.9992/0.6690, compared with 0.9991/0.6245 for the directly mined K Train model and 0.6678/0.5839 for the Global Train model. On Cluster Others Test, the derived model achieved 0.8598/0.9305, compared with 0.8473/0.9312 for direct local discovery and 0.8563/0.8556 for the global model. The configurable-derived models therefore remained competitive with independently mined local models on unseen data rather than merely improving over the global reference.
The results support a complementary interpretation of classical and configurable process mining. Direct cluster-specific discovery remains a strong baseline for isolated local exploration. The configurable representation addresses an additional requirement by preserving a shared reference that makes common and variable behavior explicit and from which related cluster-specific views can be derived systematically. The contribution is therefore not to replace independent process discovery, but to connect local views to a common formal model while preserving competitive local conformance.
The operational contribution is not captured by the conformance values alone. The configurable tree separates a shared billing backbone from points at which the recorded administrative flow changes. K follows the more restricted route, while Others retains additional branches for correction, reopening, release, and status handling. For process owners, this distinction can guide where procedures are reviewed jointly and where a cluster-specific investigation is more appropriate. The anonymized labels and the administrative nature of the event log prevent a clinical explanation of these differences; the result is instead a map of divergence points that can later be combined with performance, resource, or organizational data.
The evidence is limited to one healthcare log and one configuration-search strategy retained for the final analysis. Future experiments should test other contextual attributes and datasets, vary the similarity weighting, use seed-controlled implementations where available, and extend the direct-versus-configurable baseline comparison to additional process-discovery algorithms and domains.


Supplementary Materials

The following supporting information can be downloaded at: https://www.mdpi.com/article/10.3390/info17090915/s1. File S1: Reproducibility package containing the preprocessing and clustering Python scripts, specialty-level descriptive statistics, Train-only similarity and distance matrices, cluster assignments and sensitivity-analysis outputs, event-log partitions, exported PTML models, ProM 6.14 parameter settings, and five-run Genetic results for both clusters.

Author Contributions

Conceptualization, I.E.A. and H.S.; Methodology, I.E.A. and H.S.; Software, I.E.A.; Validation, H.S. and S.E.M.; Formal analysis, I.E.A.; Investigation, I.E.A.; Resources, I.E.A.; Writing—original draft, I.E.A.; Visualization, I.E.A.; Supervision, H.S. and S.E.M.; Project administration, I.E.A. All authors have read and agreed to the published version of the manuscript.

Funding

This research received no external funding.

Institutional Review Board Statement

Not applicable.

Informed Consent Statement

Not applicable.

Data Availability Statement

The Hospital Billing Event Log analyzed in this study is publicly available through 4TU.Research data are available at https://doi.org/10.4121/uuid:76c46b83-c930-4798-a1c9-4be94dfeb741 [1]. The accompanying reproducibility package described in Section 3.9 is provided as Supplementary Material.

Acknowledgments

During the preparation of this manuscript, the authors used ChatGPT (OpenAI, GPT-5.6 Sol; accessed September 2026) for English-language editing and linguistic refinement, as well as for support in developing and debugging Python code used in the experimental workflow. All outputs were reviewed, verified, and, where necessary, modified by the authors, who take full responsibility for the final content of the manuscript.

Conflicts of Interest

The authors declare no conflicts of interest.

Abbreviations

The following abbreviations are used in this manuscript:
CFCControl-Flow Complexity
DFGDirectly Follows Graph
ERPEnterprise Resource Planning
ILPInteger Linear Programming
IMfInductive Miner–infrequent
PTMLProcess Tree Markup Language
XESeXtensible Event Stream

Appendix A. Complete Derived Process Tree

Figure A1. Complete Derived Process Tree returned by the retained Genetic configuration for Cluster K (Run 2).
Information 17 00915 g0a1
Figure A2. Complete Derived Process Tree returned by the retained Genetic configuration for Cluster Others (Run 1).
Information 17 00915 g0a2

References

  1. Mannhardt, F. Hospital Billing—Event Log; Eindhoven University of Technology: Eindhoven, The Netherlands, 2017. [Google Scholar]
  2. van der Aalst, W.M.P. Foundations of Process Discovery. In Process Mining Handbook; van der Aalst, W.M.P., Carmona, J., Eds.; Springer: Cham, Switzerland, 2022; Volume 448, pp. 37–75. [Google Scholar]
  3. Song, M.; Günther, C.W.; van der Aalst, W.M.P. Trace Clustering in Process Mining. In Business Process Management Workshops; Springer: Berlin/Heidelberg, Germany, 2009; Volume 17, pp. 109–120. [Google Scholar]
  4. Bose, R.P.J.C.; van der Aalst, W.M.P. Context Aware Trace Clustering: Towards Improving Process Mining Results; Society for Industrial and Applied Mathematics: Philadelphia, PA, USA, 2009; pp. 401–412. [Google Scholar]
  5. De Weerdt, J.; vanden Broucke, S.; Vanthienen, J.; Baesens, B. Active Trace Clustering for Improved Process Discovery. IEEE Trans. Knowl. Data Eng. 2013, 25, 2708–2720. [Google Scholar] [CrossRef] [Scilit]
  6. Zandkarimi, F.; Rehse, J.-R.; Soudmand, P.; Hoehle, H. A Generic Framework for Trace Clustering in Process Mining; IEEE: Padua, Italy, 2020; pp. 177–184. [Google Scholar]
  7. Taymouri, F.; La Rosa, M.; Dumas, M.; Maggi, F.M. Business Process Variant Analysis: Survey and Classification. Knowl.-Based Syst. 2021, 211, 106557. [Google Scholar] [CrossRef] [Scilit]
  8. Rosemann, M.; van der Aalst, W.M.P. A Configurable Reference Modelling Language. Inf. Syst. 2007, 32, 1–23. [Google Scholar] [CrossRef] [Scilit]
  9. Buijs, J.C.A.M.; van Dongen, B.F.; van der Aalst, W.M.P. Mining Configurable Process Models from Collections of Event Logs. In Business Process Management; Springer: Berlin/Heidelberg, Germany, 2013; Volume 8094, pp. 33–48. [Google Scholar]
  10. Arriagada-Benítez, M.; Sepúlveda, M.; Muñoz-Gama, J.; Buijs, J.C.A.M. Strategies to Automatically Derive a Process Model from a Configurable Process Model Based on Event Data. Appl. Sci. 2017, 7, 1023. [Google Scholar] [CrossRef] [Scilit]
  11. Mannhardt, F.; de Leoni, M.; Reijers, H.A.; van der Aalst, W.M.P. Data-Driven Process Discovery—Revealing Conditional Infrequent Behavior from Event Logs. In Advanced Information Systems Engineering; Springer: Cham, Switzerland, 2017; pp. 545–560. [Google Scholar]
  12. Xu, J.; Liu, J. A Profile Clustering Based Event Logs Repairing Approach for Process Mining. IEEE Access 2019, 7, 17872–17881. [Google Scholar] [CrossRef] [Scilit]
  13. Wang, M.; He, X.; Zhao, P. Process Model Enhancement Through Capturing Important Behaviors and Rating Trace Variants. IEEE Access 2021, 9, 143634–143660. [Google Scholar] [CrossRef] [Scilit]
  14. Zhang, Z.; Johnson, C.; Venkatasubramanian, N.; Ren, S. Process Scenario Discovery from Event Logs Based on Activity and Timing Information. J. Syst. Archit. 2022, 125, 102435. [Google Scholar] [CrossRef] [Scilit]
  15. Sikal, R.; Sbai, H.; Kjiri, L. Configurable Process Mining: Variability Discovery Approach; IEEE: Marrakech, Morocco, 2018; pp. 137–142. [Google Scholar]
  16. Jaccard, P. Étude Comparative de La Distribution Florale Dans Une Portion Des Alpes et Du Jura. Bull. DE LA Société Vaudoise Des Sci. Nat. 1901, 37, 547–579. [Google Scholar] [CrossRef] [Scilit]
  17. Salton, G.; Wong, A.; Yang, C.S. A Vector Space Model for Automatic Indexing. Commun. ACM 1975, 18, 613–620. [Google Scholar] [CrossRef] [Scilit]
  18. Sokal, R.R.; Michener, C.D. A Statistical Method for Evaluating Systematic Relationships. Univ. Kans. Sci. Bull. 1958, 38, 1409–1438. [Google Scholar]
  19. Rousseeuw, P.J. Silhouettes: A Graphical Aid to the Interpretation and Validation of Cluster Analysis. J. Comput. Appl. Math. 1987, 20, 53–65. [Google Scholar] [CrossRef] [Scilit]
  20. Leemans, S.J.J.; Fahland, D.; van der Aalst, W.M.P. Discovering Block-Structured Process Models from Event Logs Containing Infrequent Behaviour. In Business Process Management Workshops; Lohmann, N., Song, M., Wohed, P., Eds.; Springer: Cham, Switzerland, 2014; Volume 171, pp. 66–78. [Google Scholar]
  21. Schunselaar, D.M.M. Configurable Process Trees: Elicitation, Analysis, and Enactment. Ph.D. Thesis, Technische Universiteit Eindhoven, Eindhoven, The Netherlands, 2016. [Google Scholar]
  22. Adriansyah, A.; van Dongen, B.F.; van der Aalst, W.M.P. Conformance Checking Using Cost-Based Fitness Analysis; IEEE: Helsinki, Finland, 2011; pp. 55–64. [Google Scholar]
  23. van der Aalst, W.M.P.; Adriansyah, A.; van Dongen, B.F. Replaying History on Process Models for Conformance Checking and Performance Analysis. WIREs Data Min. Knowl. Discov. 2012, 2, 182–192. [Google Scholar] [CrossRef] [Scilit]
  24. Adriansyah, A.; Muñoz-Gama, J.; Carmona, J.; van Dongen, B.F.; van der Aalst, W.M.P. Alignment Based Precision Checking. In Business Process Management Workshops; Springer: Berlin/Heidelberg, Germany, 2013; Volume 132, pp. 137–149. [Google Scholar]
  25. Buijs, J.C.A.M.; van Dongen, B.F.; van der Aalst, W.M.P. Quality Dimensions in Process Discovery: The Importance of Fitness, Precision, Generalization and Simplicity. Int. J. Coop. Inf. Syst. 2014, 23, 1440001. [Google Scholar] [CrossRef] [Scilit]
  26. Cardoso, J. Process Control-Flow Complexity Metric: An Empirical Validation; IEEE: Chicago, IL, USA, 2006; pp. 167–173. [Google Scholar]
  27. van Dongen, B.F.; de Medeiros, A.K.A.; Verbeek, H.M.W.; Weijters, A.J.M.M.; van der Aalst, W.M.P. The ProM Framework: A New Era in Process Mining Tool Support. In Applications and Theory of Petri Nets 2005; Ciardo, G., Darondeau, P., Eds.; Springer: Berlin/Heidelberg, Germany, 2005; Volume 3536, pp. 444–454. [Google Scholar]
  28. Berti, A.; van Zelst, S.; Schuster, D. PM4Py: A Process Mining Library for Python. Softw. Impacts 2023, 17, 100556. [Google Scholar] [CrossRef] [Scilit]
Figure 1. Overview of the proposed configurable process mining framework.
Information 17 00915 g001
Figure 2. Illustrative example of Process Tree merging and configuration. Common activities are mapped and consolidated, whereas the unmatched JOIN-PAT branch becomes configurable. The example is schematic and independent of the empirical Hospital Billing models.
Information 17 00915 g002
Figure 3. Training-only hierarchical clustering and silhouette analysis of the 17 retained medical specialties. Specialty activity sets and normalized weighted directly-follows graphs were computed exclusively from the training subset. In panel (a), the blue branch represents the high-level separation of specialty K from the remaining specialties, while the orange branches show the hierarchical structure within the remaining specialty group. In panel (b), the blue curve reports the mean silhouette coefficient for each candidate number of clusters, and the vertical dashed line marks the selected solution at k = 2. The two-cluster solution achieved a mean silhouette coefficient of 0.8960, separating specialty K from the remaining 16 specialties.
Information 17 00915 g003
Figure 4. Global Train Process Tree obtained at IMf noise threshold 0.60.
Information 17 00915 g004
Figure 5. Normalized weighted directly follows graphs for (a) Cluster K Train and (b) Cluster Others Train. Edge labels indicate the proportion of all directly follows occurrences represented by each relation. For readability, only relations with a normalized frequency of at least 0.5% are displayed, using the same visualization threshold for both clusters. The graphs provide a complementary view of the routing differences underlying the behavioral clustering.
Information 17 00915 g005
Figure 6. Merged configurable Process Tree at IMf 0.60. Blue relations denote hideable (H) configuration points and red relations denote blockable (B) configuration points. The auxiliary PTML placeholder/root relation is omitted from the visualization for readability and is not included in the 48 node-to-node structural relations.
Information 17 00915 g006
Figure 7. Simplified horizontal summaries of the retained Genetic-derived process views for (a) Cluster K and (b) Cluster Others. Blue blocks indicate behavioral fragments shared across the two derived views, green blocks highlight behavior retained more prominently in Cluster Others, and yellow/gray blocks indicate optional or secondary behavior. Silent transitions and low-level routing constructs are omitted for readability. The complete Derived Process Trees are provided in Appendix A.
Information 17 00915 g007
Table 1. Selected studies using the Hospital Billing Event Log and their relation to the present work.
StudyObjective and MethodOutput/EvaluationGap Relative to This Study
Mannhardt et al. [11]Data-aware Heuristic Miner; uses event attributes to distinguish meaningful infrequent behavior from noise.One data-aware C-Net with conditional dependencies.No specialty decomposition, log-level behavioral clustering, or configurable model.
Xu and Liu [12]Profile clustering and missing-activity prediction for incomplete-log repair.Repaired sub-logs and discovered sub-process models.Clustering supports repair rather than contextual variability management.
Wang et al. [13]Ranks directly follows relations and trace variants to reduce log volume and filter infrequent behavior.Fitness, precision, generalization, simplicity, F-score, and runtime.No organizational decomposition or configurable integration.
Zhang et al. [14]Activity- and timing-based vectors for trace-level process-scenario discovery.Scenario models; weighted fitness, precision, and F1-score.Scenarios are not grounded first in specialty and remain separate.
Present studyCompares specialty logs through activity-set and weighted-DFG representations, forms behavioral families, merges cluster Process Trees, and derives configurations from sub-logs.Global, configurable, and derived Process Trees; conformance and complexity.Links organizational context, behavioral clustering, configuration, and macro/micro analysis.
Table 2. Comparison of trace-clustering and configurable process-mining approaches.
StudyUnit and MethodFinal RepresentationDifference from the Present Study
Song et al. [3]Individual traces; log-profile clustering.Separate model per cluster.No explicit organizational context or configurable integration.
Bose and van der Aalst [4]Individual traces; context-aware trace clustering.Separate cluster-specific models.Context enriches clustering, but the models remain independent.
De Weerdt et al. [5]Individual traces; discovery-quality-guided active clustering.Collection of local models.Improves clustering quality but does not consolidate variability.
Zandkarimi et al. [6]Individual traces; generic trace-clustering framework.Methodological framework.Trace-centric; no contextual model grouping or configuration stage.
Buijs et al. [9]Collection of event logs; Configurable Evolutionary Tree Miner.One configurable Process Tree.Assumes the input logs already represent meaningful variants.
Arriagada-Benítez et al. [10]Configurable tree and target log; automatic configuration search.Instantiated process model.Derives configurations but does not discover contextual families.
Sikal et al. [15]Event-log variants; configurable variability discovery.Common and variable behavior.No behavioral-redundancy test among context-defined variants.
Present studySpecialty and cluster logs; log-level behavioral similarity, clustering, Process Tree merge, and log-guided configuration.Global model plus configurable and derived models.Unifies complementary macro- and micro-level analysis.
Table 3. Fixed data and algorithm settings used in the experimental workflow.
SettingValue
Filtered population97,753 cases; 437,444 events
Context definitionspeciality; minimum 1000 cases; 17 retained groups
SimilarityTrain-only primary similarity: 0.30 Jaccard + 0.70 cosine weighted-DFG similarity; Train-only sensitivity: Jaccard weight 0.10–0.90 in 0.10 increments, with complementary DFG weight.
ClusteringTrain-only agglomerative hierarchical clustering; average linkage; k = 2–6; silhouette selection
IMf thresholds tested0.20, 0.30, 0.40, 0.50, and 0.60 evaluated on Global Train; 0.40, 0.50, and 0.60 tied on Train conformance and aggregate structural metrics; Train-derived endpoint comparison at 0.40/0.60 fixed 0.60 using fewer configuration points; held-out 0.40/0.60 sensitivity reported separately.
Event classifierEvent Name
Fitness replayMeasuring fitness; ILP-based replayer; 32,767-token limit; improper completion penalized
PrecisionAlign-ETConformance; ORDERED representation; ALIGN_1
Configuration searchesGreedy and Genetic initially tested; Genetic retained for final analysis; Genetic settings: fitness/precision/generalization/simplicity weights = 90/10/0/0, population size = 10, generations = 20, five independent runs per cluster; no user-defined random seed exposed by the plugin
Data splitGlobal temporal 70/30 case-level split: 68,427 Train and 29,326 Test cases; behavioral representation, similarity, clustering, discovery, merging, and configuration on Train only
Final evaluationHeld-out cluster Test logs; Global Train vs. Direct local Train vs. Genetic-derived Process Tree
Table 4. Composition of the Train-derived behavioral clusters and corresponding Train/Test case counts for the 17 retained medical specialties.
ClusterMedical Specialties (n)Train CasesTest CasesTotal Cases (% Retained)
Cluster KK (1)13,736887322,609 (23.13%)
Cluster OthersA, B, C, D, E, F, G, H, I, J, L, M, N, O, P, Q (16)54,69120,45375,144 (76.87%)
Total17 retained specialties68,42729,32697,753 (100%)
Table 5. Training-set sensitivity of the Global Process Tree to the IMf noise threshold. Each model was discovered from Global Train, and its Petri-net representation was evaluated against Global Train; held-out Test data were reserved for final evaluation.
ThresholdTrace FitnessForward PrecisionBackward PrecisionBalanced PrecisionNodesDepthAdapted CFC
0.200.79670.84170.50780.6748581431
0.300.80600.60670.29410.4504511029
0.400.84500.99310.99940.9963391119
0.500.84500.99310.99940.9963391119
0.600.84500.99310.99940.9963391119
Table 6. Structural characteristics of the cluster-specific Process Trees and merged configurable representation at IMf 0.60. Operator counts are reported in the order SEQ/XOR/AND/LOOP; configurable counts refer to PTML relations.
ModelVisible ActivitiesTau LeavesOperators
(SEQ/XOR/AND/LOOP)
Total NodesHideable RelationsBlockable RelationsConfigurable Relations
Cluster K854/4/1/123000
Cluster Others1865/8/1/139000
Merged configurable model1866/8/2/24191120
Table 7. Configuration-summary entries reported by ProM for the retained Genetic runs of Cluster K (Run 2) and Cluster Others (Run 1).
IDConfigurable Element/FragmentCluster K—Run 2Cluster Others—Run 1
C1CODE OKHE
C2And(DELETE, Xor(tau, JOIN-PAT))EE
C3tauBE
C4RELEASEHE
C5Xor(tau, ZDBC_BEHAN)HE
C6Extended correction/reopening subtreeE
C7BILLEDHH
C8XorLoop(BILLED, Seq(Xor(tau, CHANGE END), STORNO, REJECT), tau)EE
C9ANDB
C10SET STATUSBE
C11EMPTYEE
C12Xor(tau, EMPTY, SET STATUS)HE
C13SEQBB
C14Xor(tau, CHANGE END)EE
E: enabled; H: hidden; B: blocked. The merged configurable PTML contains 20 underlying configurable relations (11 blockable and 9 hideable). ProM displays 13 Configuration Summary entries for each retained run because a displayed entry may correspond to an individual activity, an operator, or an entire configurable subtree and may therefore aggregate several underlying configurable relations. Consequently, the displayed rows should not be interpreted as a one-to-one enumeration of the 20 configuration points. A dash indicates that the corresponding fragment was not displayed as a separate summary entry for that run. The extended correction/reopening subtree corresponds to Seq(Xor(tau, Seq(XorLoop(Xor(CODE NOK, Seq(Xor(tau, CHANGE END), STORNO, REJECT)), CODE ERROR, tau), REOPEN)), CHANGE DIAGN, FIN) in the ProM summary.
Table 8. Held-out conformance comparison of the Global Train, directly mined local Train, and Genetic-derived models on the two cluster Test logs.
Evaluation LogModel Trained/Derived from TrainFitnessForward PrecisionBackward PrecisionBalanced PrecisionNodes
Cluster K TestGlobal Train model (0.60)0.66780.50060.66720.583939
Cluster K TestDirect K Train model0.99910.50040.74860.624523
Cluster K TestDerived K model (Genetic Run 2)0.99920.62400.71390.669027
Cluster Others TestGlobal Train model (0.60)0.85630.86020.85110.855639
Cluster Others TestDirect Others Train model0.84730.92910.93340.931239
Cluster Others TestDerived Others model (Genetic Run 1)0.85980.91600.94500.930551
Disclaimer/Publisher’s Note: The statements, opinions and data contained in all publications are solely those of the individual author(s) and contributor(s) and not of MDPI and/or the editor(s). MDPI and/or the editor(s) disclaim responsibility for any injury to people or property resulting from any ideas, methods, instructions or products referred to in the content.