Article

Human Behaviour as a Predictor of Insider Threat: A PRISMA Systematic Literature Review and a Novel Ensemble-Based Detection Model

Department of Computer Science, School of Science and Engineering, Glasgow Caledonian University, Glasgow G4 0BA, UK
*
Authors to whom correspondence should be addressed.
Information 2026, 17(7), 627; https://doi.org/10.3390/info17070627
Submission received: 6 May 2026 / Revised: 18 June 2026 / Accepted: 19 June 2026 / Published: 25 June 2026
(This article belongs to the Section Information Security and Privacy)

Abstract

Cybersecurity insider threats remain a significant challenge for modern organisations due to their potential to cause substantial financial and reputational damage. This paper presents a systematic review of insider-threat research (2019–2026) using the PRISMA methodology and introduces an empirically validated ensemble framework for insider-threat detection. The proposed approach combines User-Based Sequences (UBS), a self-supervised Transformer trained on next-token prediction and time-gap modelling, and an unsupervised anomaly detection ensemble operating on model-derived behavioural features. An answers directory is incorporated to provide grounded truth for insider entities and episodes within the CERT r6.2 dataset, enabling direct validation of detection outcomes. The framework integrates behavioural theory with machine-learning techniques to improve understanding of insider-threat precursors. Evaluation was performed using a seven-stage Isolation Forest ensemble incorporating multimodal behavioural and technical data streams. The approach successfully identified all insider users, achieving 100% recall and an AUROC of 0.93. Comparative analysis against a previously reported model showed comparable AUROC and perfect recall despite differences in evaluation methodology. While precision remained low (0.004) due to the extreme class imbalance in the full CERT r6.2 population (5 insiders among 4000 users), the results highlight the operational challenges of insider-threat detection in realistic enterprise environments. This research contributes a novel, reproducible framework that combines behavioural theory and advanced machine learning to support the detection and analysis of insider threats.

1. Introduction

Cybersecurity insider threats remain one of the most persistent and challenging risks faced by modern organisations. Unlike external attackers, insiders operate with legitimate access to systems and data, making their actions difficult to distinguish from normal behaviour [1,2,3]. The financial impact of insider incidents varies considerably across studies, reflecting differences in sector, organisational size, incident severity, and reporting methodology and is very much context dependent [2]. IBM estimated in 2020 that the average cost of an insider-related incident ranged between $300,000 and $1 million per case [3]. However, Green and Dozier [1] found that the cost associated with malicious insider behaviour in enterprise-level organisations was substantially higher, averaging $15.38 million per incident. Similarly, Moneva and Leukfeldt [4], citing data from the United States Department of Justice, reported an average impact of $2.4 million per incident. Although the absolute figures differ, the evidence collectively suggests that insider incidents can impose severe financial, operational, and reputational costs on affected organisations.
The prevalence of data further reinforces the significance of the problem. IBM reported that more than 60% of surveyed organisations experienced over 20 insider incidents annually [3], suggesting that insider risk is not limited to isolated or exceptional events. Moneva and Leukfeldt likewise found that 21% of businesses had been victims of cybercrime, with a substantial proportion involving insider participation. Williams et al. [5] concluded that 4.1% of organisations had experienced at least one insider attacker. While estimates vary depending on the dataset and definitional scope, the broader trend remains clear: insider threats represent a persistent and growing cybersecurity challenge. As organisations continue to digitise critical processes and expand privileged access across distributed workforces, the strategic importance of mitigating insider risk is likely to increase further.
As a result, traditional security mechanisms such as intrusion detection systems, SIEM platforms, and rule-based monitoring are structurally limited in detecting malicious activity that occurs within authorised boundaries [4].
Recent research has increasingly recognised insider threat as a socio-technical problem that requires the integration of behavioural, organisational, and technical perspectives. Behavioural studies highlight the importance of psychological, emotional, and contextual factors in shaping insider activity, while machine learning approaches focus on identifying anomalous patterns in system logs and user activity [6,7,8,9,10,11,12]. However, these two strands of research remain largely disconnected. Behavioural insights are often not operationalised within detection systems, and technical approaches frequently lack the contextual understanding required to interpret intent.
A further challenge lies in the extreme class imbalance inherent in insider-threat datasets. In realistic enterprise environments, malicious insiders represent a very small fraction of users, often below 0.1% of the population [13]. Under such conditions, models that achieve high recall may still produce many false positives, imposing significant operational burdens on security teams [14,15]. Prior work often mitigates this issue through balanced subsampling, which can inflate performance metrics and obscure deployment challenges [16].
In this paper, we address these limitations by combining a PRISMA-based systematic literature review with an empirically evaluated anomaly detection framework. The review synthesises recent research (2019–2026) across behavioural, technical, and organisational dimensions, identifying key gaps in the integration of human factors and detection methodologies. Building on these findings, we develop a multi-stage detection pipeline that models per-user behavioural sequences using a self-supervised Transformer and applies an ensemble of anomaly detectors to model-derived error features.
Crucially, we evaluate the framework on the full CERT r6.2 dataset [8,9] (4000 users), rather than on balanced subsamples. This allows us to assess performance under realistic class imbalance and to explicitly quantify the trade-off between detection capability and operational feasibility. While the model achieves strong ranking performance (AUROC 0.93) and complete detection of known insiders (100% recall), the results reveal a substantial precision deficit, highlighting the inherent difficulty of insider-threat detection in real-world conditions.
This paper makes the following contributions to the field of Cybersecurity Insider Threat:
  • Systematic socio-technical synthesis of insider-threat research
We conduct a PRISMA-guided systematic review (2019–2026) that integrates behavioural, technical, organisational, and machine-learning perspectives to identify key gaps in the operational integration of behavioural theory within insider-threat detection systems.
2.
Novel behaviour-aware ensemble detection framework
We propose a unified insider-threat detection framework that combines User-Based Sequences (UBS), self-supervised Transformer learning, and ensemble anomaly detection to model temporal behavioural patterns and identify deviations from learned benign activity.
3.
Realistic full-population evaluation under extreme class imbalance
We evaluate the framework on the complete CERT r6.2 dataset (4000 users; 5 insiders), avoiding balanced subsampling and providing a more realistic assessment of insider-threat detection performance.
4.
Operational insights into deployment challenges of insider-threat analytics
Our results demonstrate that perfect recall and strong ranking performance (AUROC = 0.93) can coexist with substantial precision degradation under extreme class imbalance, highlighting the importance of threshold calibration, analyst triage capacity, and human-in-the-loop investigation for practical deployment.
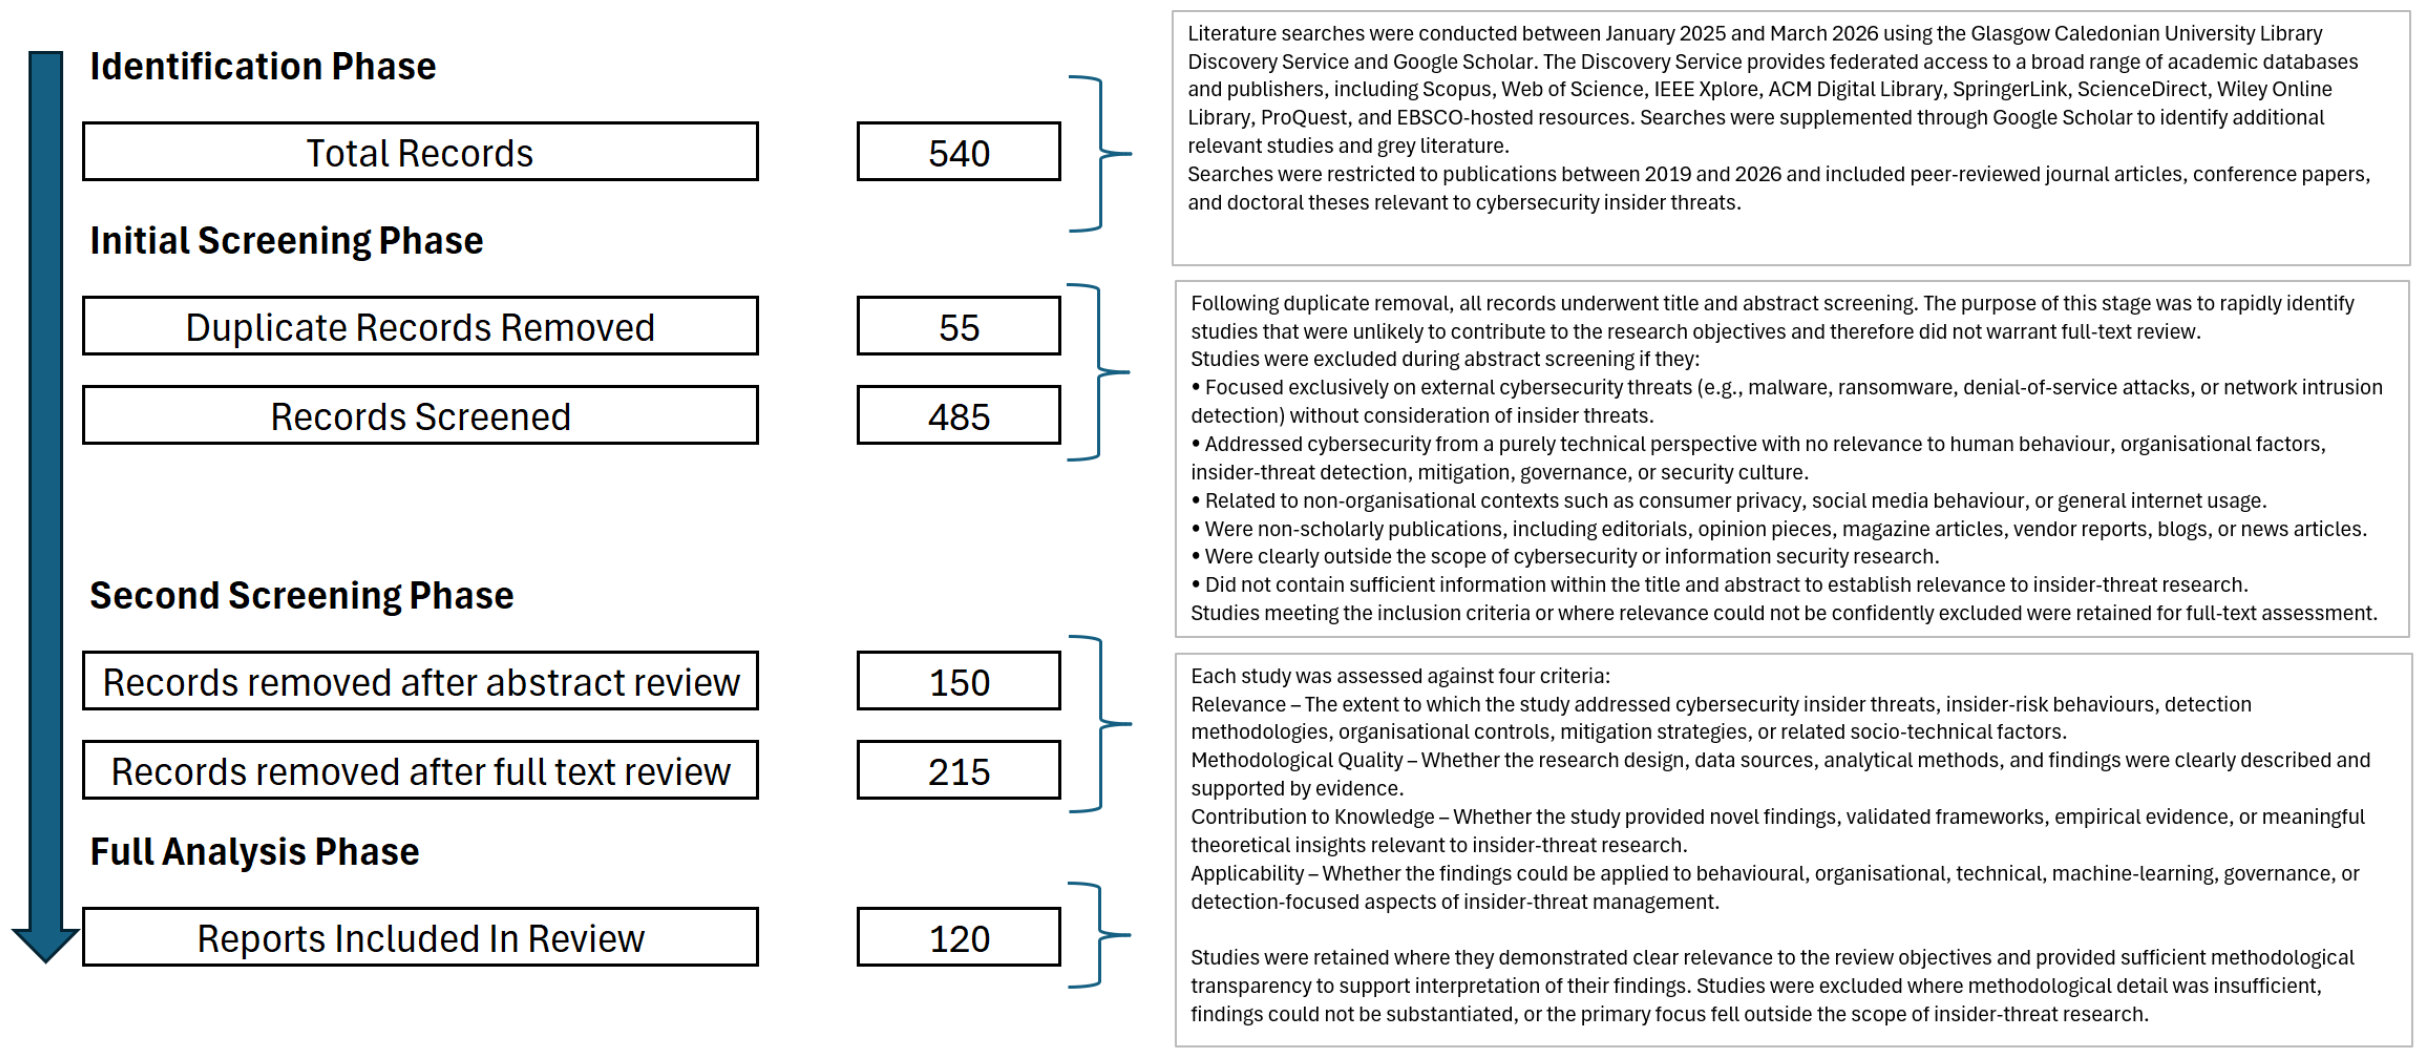
To examine this evolving field systematically, this review utilised the PRISMA methodology (Table 1) to identify, screen, and synthesise contemporary research published between 2019 and 2026. From an initial pool of 540 sources, 120 studies met the inclusion criteria following screening for relevance, methodological quality, and direct applicability to insider-threat research. The retained literature comprised peer-reviewed journal articles, conference papers, and doctoral theses. Studies were then categorised across key thematic domains, including behavioural factors, technical controls, organisational culture, machine learning, mitigation frameworks, education, and zero-trust security models. This structured approach enables a comprehensive assessment of how current scholarship conceptualises, detects, and mitigates insider risk.
As part of the PRISMA approach, a defined list of search terms was used to identify the research. The search terms that were used are listed in Table 2. Table 3 breaks down the type of research that was found and categorised, and a PRISMA process flow is detailed in Figure 1.
The split of the remaining documents is in Table 4 below.
The articles and papers were reviewed, assessed and categorised into the following themes:
  • Behavioural: Behavioural and human aspects of cybersecurity insider threats.
  • Technical: Technical methods to control cybersecurity insider threats.
  • Framework: Taxonomy and mitigation frameworks for cybersecurity insider threats.
  • Communication: The impact that communication had on insider threats.
  • Culture: The impact that culture has on insider threats.
  • Education: The impact that proactive cybersecurity awareness training had on insider threats.
  • Machine Learning: The impact that machine learning has had on identifying insider threats.
  • Pen Testing: The impact that penetration testing had on identifying insider threats.
  • Process: The impact that changing operational processes could have on insider threats.
  • Zero Trust: The impact that adopting a zero-trust cybersecurity policy could have on insider threats.
The assessment phase categorised the research papers into the following categories, detailed in Table 5 and Table 6.
The largest grouping was behavioural, which is the main focus of our literature review, although we will also cover technical aspects and frameworks.

2. Literature Review

Insider threats are complex and persistent challenges that originate from within an organisation [6]. Unlike external attacks, insider incidents frequently exploit trusted access, privileged permissions, and knowledge of internal controls, making detection and prevention substantially harder [7]. Insider attacks can arise from both malicious intent and non-malicious behaviours such as negligence, policy circumvention, or human error [7,8]. As a result, insider threat is increasingly recognised not solely as a technical security problem, but as a socio-technical phenomenon shaped by human behaviour, organisational context, and system vulnerabilities [6,9,10].

2.1. Technical Methods

Technical controls such as Intrusion Detection Systems (IDS), Security Information and Event Management (SIEM), User and Entity Behaviour Analytics (UEBA), Data Loss Prevention (DLP), machine learning detection systems, and encryption operate primarily on observable system activity [11,12,13,17]. They analyse logs, telemetry, network traffic, and file operations to identify deviations from defined baselines or policy parameters.
Intrusion detection systems (IDS) are the process of proactively monitoring networks and systems and analysing data for indicators of compromise (IOC). When an intrusion or deviation from a parameter that is mapped to a policy, or a database of attack signatures, is detected, an alert is sent to a Security Operations Centre (SOC) within a company. Thakkar and Lohiya [11] found that IDS was useful for detecting nonconforming patterns of network activity and highlighting deviations from the norm. Due to its scalable nature and speed of analysis, IDS can be used in organisations of varying sizes [11]. Moreover, their work is supported by Ring et al. [13] who note that IDS can be useful for highlighting anomalies, but it does require detailed configuration and strong signature databases of prior activity. Endpoint privilege management (EPM) is an example of an IDS that can be deployed to endpoints on a network and can limit access to employees depending on their business needs. It proactively monitors what happens on a network and employee devices and limits activity based on policies [7]. Woland et al. [12] highlight the importance of having a human to interpret what an IDS is finding in order to control for the volume of false positives that an IDS can present. Thakkar and Lohiya [11] go on to highlight further limitations with IDS, in that it cannot block an attack it may have identified unless it is integrated with other security tools and intrusion prevention systems (IPS). Srinivas et al. [17] discuss the benefits of using a hybrid IDS approach combining genetic algorithms with logistic regression to improve the accuracy of the IDS. They did, however, note that IDS requires further research on signature databases to improve the identification of zero-day attacks.
Liu et al. [14] discuss the complexity of detecting an insider attack as they reside behind the enterprise-level IDS and may have privileged access. Moreover, they highlight that the most common insider attack is data exfiltration, followed by the manipulation of data integrity and availability. IDS did have benefits, limiting the installation of unapproved or dangerous software, but was less able at identifying an authorised human user accessing files that their profile had legitimate access to. It could not interpret intent [14]. They go on to discuss, though, that creating parameters for an IDS that looked for unusual file access, especially sensitive data or operations coupled with data transfer, could help to highlight when an individual was attempting to access data outside their normal activities. In itself, the IDS could only highlight potential activity and would need further steps to ratify intent. This means that stopping a potential inside attack was not instant and would take time [11,14].
A security information and event management (SIEM) tool is a centralised tool that ingests large amounts of data and security and infrastructure logs from across a network. It would take data in from servers, firewalls, routers, network devices, hardware management consoles, security devices, IDS, software applications such as compliance tools and anti-virus, as well as workstation logs. The SIEM tool would be configured based on a company’s security policies and would then provide summary information on noncompliance against security policies, potential areas for investigation, as well as breaches and intrusions. Large companies have vast amounts of data, which is why it is vital that a SIEM tool is used to scan, analyse and make sense of the growing amount of information [7]. SIEM enables data mining, forensic analysis, and investigations after an incident has occurred. It is a vital tool for organisations to use to help make sense of the vast number of alerts and data that can come from a network. However, it also has limitations in that it can produce a high rate of false positives [15,16].
Khaliq et al. [18] state that current cybersecurity tools, like a SIEM, are not capable of detecting sophisticated and carefully planned insider threats and attacks. They found that SIEM, like an IDS, was beneficial when focused on gathering large amounts of data aimed primarily at protecting a company’s external boundaries. It performed well in detecting and preventing attacks such as malware and ransomware. Not all SIEM solutions are equal, though, and when used in isolation, they cannot protect against an internal threat [18,19]. Moreover, Khaliq et al. [18] found that combining SIEM with a User Entity Behaviour Analytics (UEBA) solution was vital to make sense of the vast amounts of data that a SIEM solution was ingesting as SIEM is only as good as the parameters it has been told to look for and needs help to interpret it.
A UEBA solution focuses on using data from SIEM or similar data-gathering systems to perform behavioural analytics. The tool will compare and evaluate current actions of activity across a network or device against pre-defined baselines [19]. A UEBA tool can enhance security response and help to decrease the time to respond to incidents, as well as help with the early identification of threat activity, such as someone accessing data that they do not normally access [19]. Moreover, if the integration of SIEM with UEBA is coupled with robust baselines, it can help to reduce false positives and allow security analysts to focus on real incidents. Yousef and Jazzar [19] go on to highlight that UEBA can have limitations in that it performs less well with slow, low-impact attacks that are carried out over longer periods of time. Where an insider is aware of security controls, it becomes even harder to detect activity, as small deviations in behaviour can be normal. They go on to mention that further research is needed to understand to what extent metadata, public and cloud-based information can be used when considering ethical, privacy and legal aspects. Enhancing the detail within baselines is required to improve the accuracy of UEBA [19].
Data loss prevention (DLP) tools can range from restrictions on USB ports to prevent external devices from being connected and data exfiltrated to applications that monitor email and network traffic and scan and block data going externally from the company’s network. DLP tools would be configured against a company’s security policies and can be useful to stop the exfiltration of data [20].
DLP tools cannot prevent an insider with privileges from sending data unless there is a further policy in place to check what is being sent for users who have elevated privileges [20]. Additional checks, however, will slow down business workflow and some tools cannot read the full contents of files, only titles, which can be obfuscated to mask what is being sent [21]. The most commonly used DLP techniques analysed by Montano et al. [21] were encryption and machine learning. They found that the DLP tools that had the greatest success controlled the opening, reading, and writing of confidential information. Their research highlighted gaps in the control of DLP using the Internet of Things (IoT) as a possible attack vector, given the growing number of devices and the vast amount of data being produced [21].
Machine Learning approaches to mitigate DLP can be classified into data-driven and behavioural approaches [22]. Sabir et al. [22] found gaps in the use of either approach in isolation and propose that a combination of technical data classification and non-technical behavioural factors should be explored as a method of mitigating against data loss and an insider attack. Moreover, they postulate that engineered automation should be integrated with human expertise and insight to detect exfiltration [22,23]. Data encryption is a common technique to counter data loss, coupled with security policies and IDS [23]. It can be effective when set up correctly, but it can require the sender and receiver to be aligned with the encryption approach so that the data can be encrypted in transit and decrypted correctly when received. Encryption will not work against insiders who have approved access to view the data, but it may help with exfiltration across a network. A key consideration to mitigate exfiltration using a combined socio-technical approach is that a human element needs to be present to ensure that the system is run safely and ethically [23].
As we have discussed, technical controls have limited success in protecting against an insider threat with authorised access. We will examine non-technical controls to understand if they can help mitigate an insider threat.
Documenting a company’s security policies and guidelines will allow for clarity around what employees should and should not do [24]. Trang and Brendel [25] argue that although having policies documented can help to bring a common understanding and clarity, it is rather the enforcement of the policies that is the key concern. Articulating explicit sanctions if rules are broken can have a positive impact on changing employee behaviour, but they found that the efficacy of the approach had mixed results. Moreover, they found that repeated communication and education were key for the deterrent to have an impact.
Employees are often seen as a company’s weakest and strongest assets [7,8,26]. Ensuring that employees have a broad understanding of cybersecurity and what to look out for, be aware of, and what action to take if they see something suspicious or an incident happens is vital [8]. Kweon et al. [27] found a positive relationship between cybersecurity education and a reduction in security incidents. Periodically reinforcing security concepts and rules, and specifically the ramifications for transgression, can act as a deterrent for some potential inside attackers [8]. Trang and Brendel [25] argued that deterrence theory had a cultural aspect and worked better in cultures with a high degree of what they classified as power distance and had a smaller impact on people’s behaviours within Western cultures. Moreover, they found that the greater the sanctions and the swifter they came, the greater the impact on mediating an employee’s behaviour. Education, however, will not deter a determined attacker, but could stop inadvertent threats and those that are borderline in their actions; it could make them think twice [28].
For information security education to work effectively and have a positive impact on employee behaviour, it is vital that the techniques and responses that have been taught are transferred to an employee’s daily work routine [28]. Using gamification techniques has proven to be successful by making education fun and countering some of the weaknesses found in other types of training, such as levels of interaction, motivation, and engagement [28,29]. Moreover, from the review of the literature, it is evident that ensuring comprehensive and tailored assessments is necessary to ensure the efficacy of the training [29]. There is evidence that managerial participation strengthens the links between organisational security, security awareness and security in practice [29]. Rice and Searle [30] argue that insider threats are an organisational crisis that requires top-down sponsorship from leadership to tackle. Moreover, they found that clear and regular communication with employees was beneficial to ensure that people know what the organisation’s policies are, how to raise any concerns and the potential consequences for non-compliance.
The ‘wildcard’ that needs to be better understood is the human component; after all, it is the human employee who would execute an attack.
Elbasheer and Akinfaderin [31] propose a user-centric, temporally aware approach to insider threat detection. Their framework combines User-Based Sequencing (UBS), which restructures raw organisational activity logs into per-user temporal sequences, with a self-supervised transformer encoder that learns behavioural baselines without requiring explicit insider labels. Their architecture is significant for two reasons. First, it explicitly models behaviour over time rather than treating events in isolation, and second, it fuses technical telemetry with behavioural signals.
The literature demonstrates several structural limitations of technical controls. First, they struggle with authorised misuse. An insider with legitimate access to sensitive systems may operate entirely within assigned privileges while still conducting malicious activity.
Second, systems such as IDS and SIEM are dependent on configuration quality. They are only as effective as their predefined parameters, signatures, and baselines. Zero-day behaviour and novel attack patterns may evade detection.
Third, technical systems cannot interpret motive. A data transfer may be legitimate or malicious; the telemetry alone does not reveal intent.
Finally, sophisticated insiders may deliberately operate below detection thresholds, conducting slow, low-impact actions over extended periods. UEBA systems may struggle to distinguish such activity from legitimate behavioural variation.

2.2. Behavioural Aspects

In contrast to technical controls, behavioural controls focus on the human dimension of insider threat. These include security policy enforcement, awareness training, managerial oversight, organisational culture, personality indicators, motivational stressors, demographic considerations, and behavioural sequencing models. Rather than analysing system logs alone, behavioural controls attempt to understand intent, predisposition, and the socio-psychological drivers of insider activity.
Understanding what drives employees to commit an insider attack is complex and has many dimensions [1,7,24,31]. It is vital, though, to consider the human aspect, as technical and non-technical controls cannot stop or mitigate against someone who has authorised access (they have been given the keys to the kingdom) on their own [24]. User behavioural sequencing (UBS) can address the challenge of identifying malicious insider activities within enterprise systems, where behavioural signals are subtle and temporally dispersed, coupled with overlap with legitimate user actions [32]. Leveraging the CERT r6.2 dataset, Tian et al. [32] used a transformer-based model coupled with a deep learning architecture. Moreover, they integrated data points such as logon records, email exchanges, web access logs, and file operations. Their approach utilised attention techniques to dynamically weight the significance of behavioural events, enabling interpretable insights into which patterns most strongly indicate insider risk.
The framework was interesting in that it had feature-level mechanisms that helped to reduce the high false-positive rates typically observed in unimodal or purely statistical approaches. Tian et al. [32] found increased accuracy using a fusion approach in their research.

2.3. Motivation

The motivation for someone to commit an insider attack can differ depending on whether it is accidental or malicious [7]. CERT found that one of the top stressors for an employee to commit an inside attack was being terminated from their contract [8]. Disgruntled employees can be someone, normally with a technical background, who has privileged access and wants to cause harm or have a negative impact on the organisation or company [7]. CERT noted additional stressors like resigning from your job, leading to uncertainty, moving internally within the company, structural organisational changes such as a merger or acquisition and financial difficulties. Of their sample, [CERT] found that 66% of incidents were categorised as fraud [8]. This was followed by theft of intellectual property at 19% and sabotage at 15%.
Jones [6] noted that a person’s behaviour can be shaped by their intent and motivation. An activist or zealot is someone who holds strong beliefs that the organisation or person they are attacking is not on the side of right. They believe that they are “just” in their actions to further their cause [7]. At the extreme end of this category would be terrorists who attack not only to further their cause but to inflict harm, distress and hurt their perceived enemy. Identifying employees with strong views that may want to harm their company can be complex, in that they will likely hide their ideology so as not to draw attention [33]. Looking for anomalies in behaviour could help to identify potential threats, but it is unlikely to identify a careful attacker [33]. Moreover, a strong belief or ideology does not always mean that someone will commit an attack [8,33].
People willing to commit espionage can be driven by ideology, financial and personal gain or may have been coerced into committing the attack [8]. Luckey et al. [33] argue that people found to have committed espionage demonstrated behavioural traits beforehand, in some cases for many years, that could have been identified. Moreover, they found that organisations could have conducted better risk assessments of roles and positions with privileged access to sensitive information. They go on to identify social behaviours that could have been picked up, such as statements made to colleagues over the years that, in hindsight, appear to reflect the attacker’s feelings [28].

2.4. Personality

Georgiadou et al. [34] argue that identifying personality traits that could identify potential insider threats is complex. They found that certain serious mental health disorders and an individual’s perception of self and others could lead to a predisposition to commit an attack. They discuss the multi-layered nature of personality, though that may be linked to security behaviours such as social skills, decision-making abilities, whether someone is an introvert or an extravert, their level of openness and conscientiousness. Georgiadou et al. [34] did note that ‘concerning behaviours’ and violations preceded the majority of insider attacks. This position was supported by the work of Green and Dozier [1], Greitzer et al. [24] CERT [28] and Homoliak et al. [7]. Greitzer et al. [35] classifies behavioural indicators into 8 classifications detailed in Table 7 below.
The challenge that the literature identifies is trying to identify the behaviours and indicators in sufficient time prior to an attack, instead of after. Behavioural testing as a countermeasure may help to identify individuals with a predisposition to commit an attack, but it needs further investigation to understand how it could work.

2.5. Gender

Many behavioural studies have looked at gender to understand if it plays a part in cybersecurity insider threats. Jeong et al. [36] found that women were more at risk of being involved in cyber-related incidents, such as clicking on phishing links. This finding is supported by Anwar et al. [37] who also found that women were more likely to fall victim to phishing attacks. Moreover, they found that women self-reported lower cybersecurity capabilities in their study. This gender position does not necessarily translate to mean that women are more likely to pose a higher insider threat, though. Elmrabit et al. [38] found that 82% of males committed insider attacks and 18% by women. The work of Anwar et al. [37] supports that of Emrabit et al. in that they argued that men self-reported higher cybersecurity understanding and capability, coupled with riskier behaviour. Moreover, they argued that although women appeared more susceptible to committing attacks such as phishing, this was not malicious. They also note that women were more likely to adhere to policies and procedures, meaning that their behaviour was less risky. The gender differences appeared to become more pronounced with age [37]. This assertion was supported by Green and Dozier [1], but they highlight that older people were more likely to commit inadvertent non-malicious attacks than malicious ones. The literature highlights that gender may help identify potential insider threats, but it is only one dimension.

2.6. Age

Green and Dozier [1] found that older employees are more likely to commit non-malicious and inadvertent attacks within a company. Moreover, the likelihood is more pronounced when the employees work in a non-technical role. This assertion, however, is not fully supported in that Williams et al. [5] found that insider attacks and threats were evenly distributed over age. The work by Whitty [39], taking into account a broad range of research, concluded that men between the ages of 20 and 40 were at the highest risk of being a threat. Moreover, when a female did commit an attack, they tended to be between the ages of 31 and 45. Age again is another dimension that can be considered but not in isolation.

2.7. Tenure and Seniority

Whitty [39] concluded that 60% of inside attacks were performed by employees with a tenure of less than 5 years, with 41% having been at the company for less than 6 months. Moreover, 49% of attacks were committed by non-managerial roles, and 58% by university graduates. This position is not supported by Kim et al. [40], who conclude that there is a relationship between tenure and organisational commitment, but that the longer someone’s tenure at a company, the more disgruntled they may become and the higher the likelihood they will commit an attack. They do, however, note that tenure is one dynamic and that other demographics need to be considered.

2.8. Organisational and Societal Culture

Uchendu et al. [41] found that the support and leadership of top management were among the most important factors in maintaining a positive security culture within an organisation. Moreover, they note that the culture will be stronger when management not only demonstrates the importance of cybersecurity to their employees but also shows their commitment to security, works to cultivate and evolve it, and instils trust at all levels. Kim et al. [40] reinforce this finding, citing that organisational culture can have a positive influence on employees but also a negative one, depending on the company ethos. Moreover, they found that an organisation’s culture and approach are nested in and can mirror that of a nation’s culture, and that this can differ geographically. A positive security culture that is embraced by senior leadership will permeate throughout an organisation [40].
Findings of the literature show that trying to prevent insider threats and attacks by focusing just on technical or non-technical aspects does not work. It has some success, but it is limited. Moreover, one cannot ignore human behavioural aspects when considering how to identify and protect against insider threats. The literature has highlighted that dimensions such as personality, gender, age, tenure and seniority, motivation, and culture can serve as indicators for identifying potential threats. It has also highlighted that no one parameter in isolation can be used and that more research is needed to reinforce the efficacy of using them.
Behavioural controls, similar to technical controls, present significant limitations. Personality traits, demographic factors such as gender, age, or tenure, and indicators such as disgruntlement are correlational rather than predictive. The presence of risk factors does not imply malicious action.
Furthermore, behavioural indicators are often recognised retrospectively. Many warning signs are identified only after an incident has occurred, limiting their preventive value.
Cultural and organisational dynamics further complicate implementation. Deterrence theory may vary in effectiveness depending on national or organisational culture, and enforcement consistency is critical. A determined insider motivated by ideology, financial gain, or coercion is unlikely to be deterred by policy education alone.
The systematic review was conducted not only to provide background context but also to identify recurring limitations in contemporary insider-threat detection research and to derive design requirements for the proposed framework. Four principal findings from the review directly influenced the architecture of the detection pipeline.
First, the review found that many existing approaches relied predominantly on technical indicators and provided limited integration of behavioural and contextual information. To address this gap, the proposed framework adopts behaviour-aware User-Based Sequences (UBS) that incorporate behavioural event types, temporal context, and external-access indicators into a unified user representation.
Second, several studies highlighted the importance of temporal behavioural evolution but relied on static feature representations or aggregate statistics. This finding motivated the use of a self-supervised Transformer architecture capable of learning sequential behavioural dependencies and detecting deviations from established behavioural patterns.
Third, the review revealed that many insider-threat detection systems relied on a single anomaly detection technique, making them sensitive to model-specific assumptions and increasing the risk of unstable detection performance. Moreover, the proposed framework employs an ensemble comprising Isolation Forest, Local Outlier Factor, and One-Class Support Vector Machine, thereby combining complementary anomaly detection mechanisms.
Finally, the review identified a widespread reliance on balanced or partially balanced datasets that do not accurately reflect operational insider-threat environments. This observation directly motivated the full-population evaluation strategy adopted in this study, together with the use of risk-ranked investigation workflows and operational performance measures.
These review-derived design requirements establish a direct connection between the systematic review and the proposed detection framework, ensuring that the model architecture addresses limitations identified within the contemporary insider-threat detection literature.


3. Materials and Methods

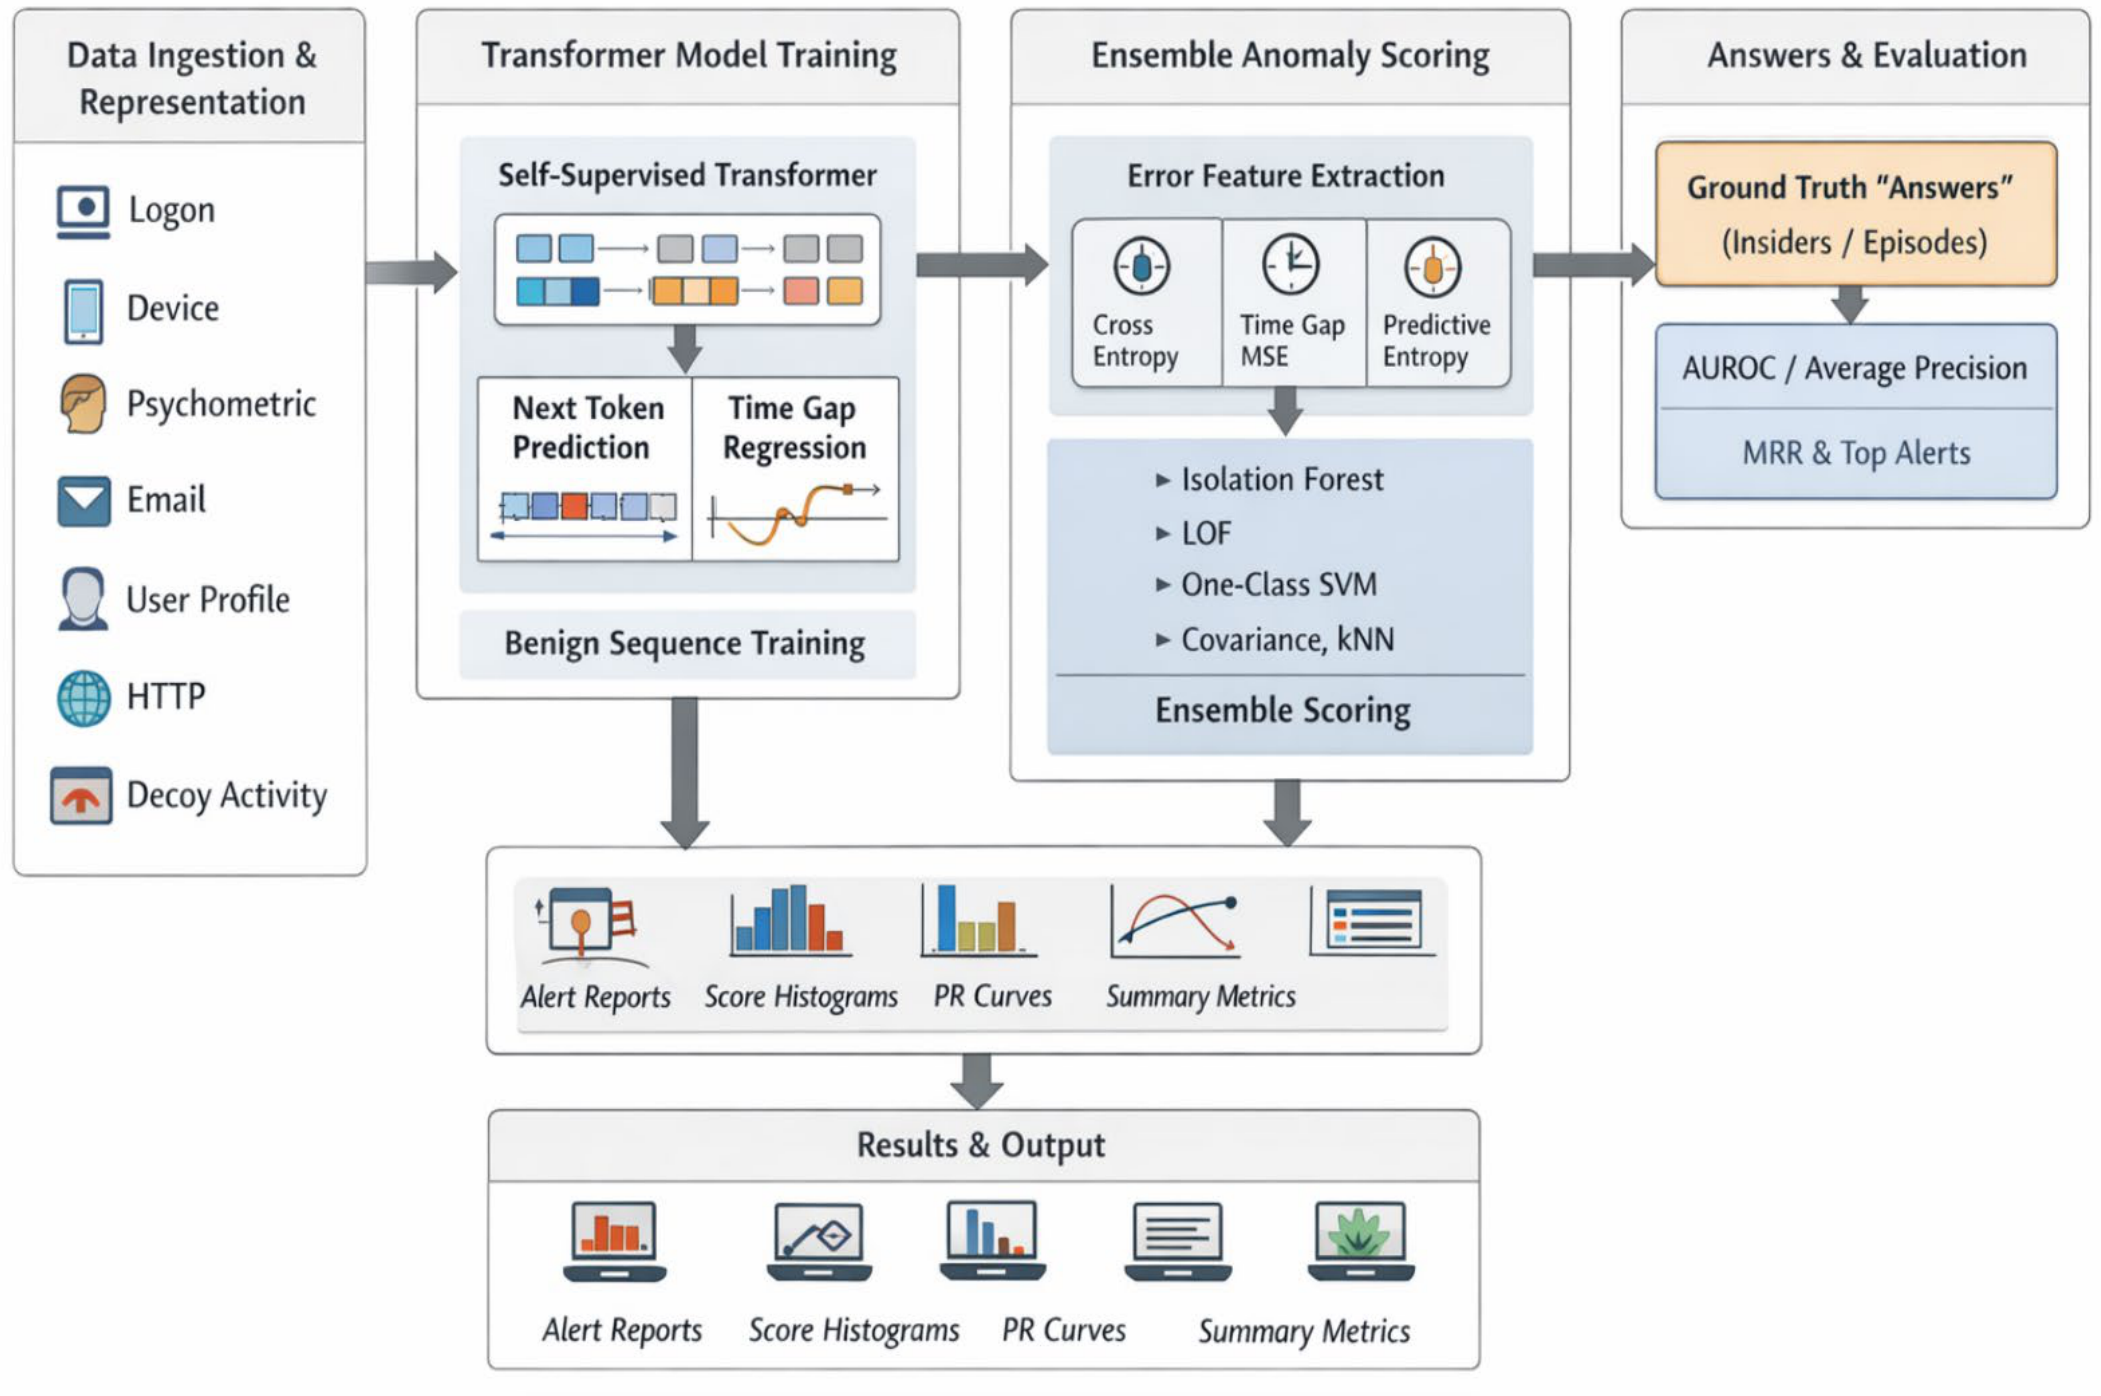
We present an analytic pipeline for insider-threat detection using the CERT r6.2 dataset. Our novel approach is detailed below and in the architectural overview (Figure 2).
Our novel approach uses:
  • Combining per-user User-Based Sequences (UBS).
  • A self-supervised Transformer with next-token and time-gap objectives.
  • An unsupervised ensemble over model-error features (trained on benign error patterns).
  • We extend this framework with an ‘answers’ (target day rule) directory that provides grounded-truth insiders and episodes, enabling direct validation of detections.
Data and Representation
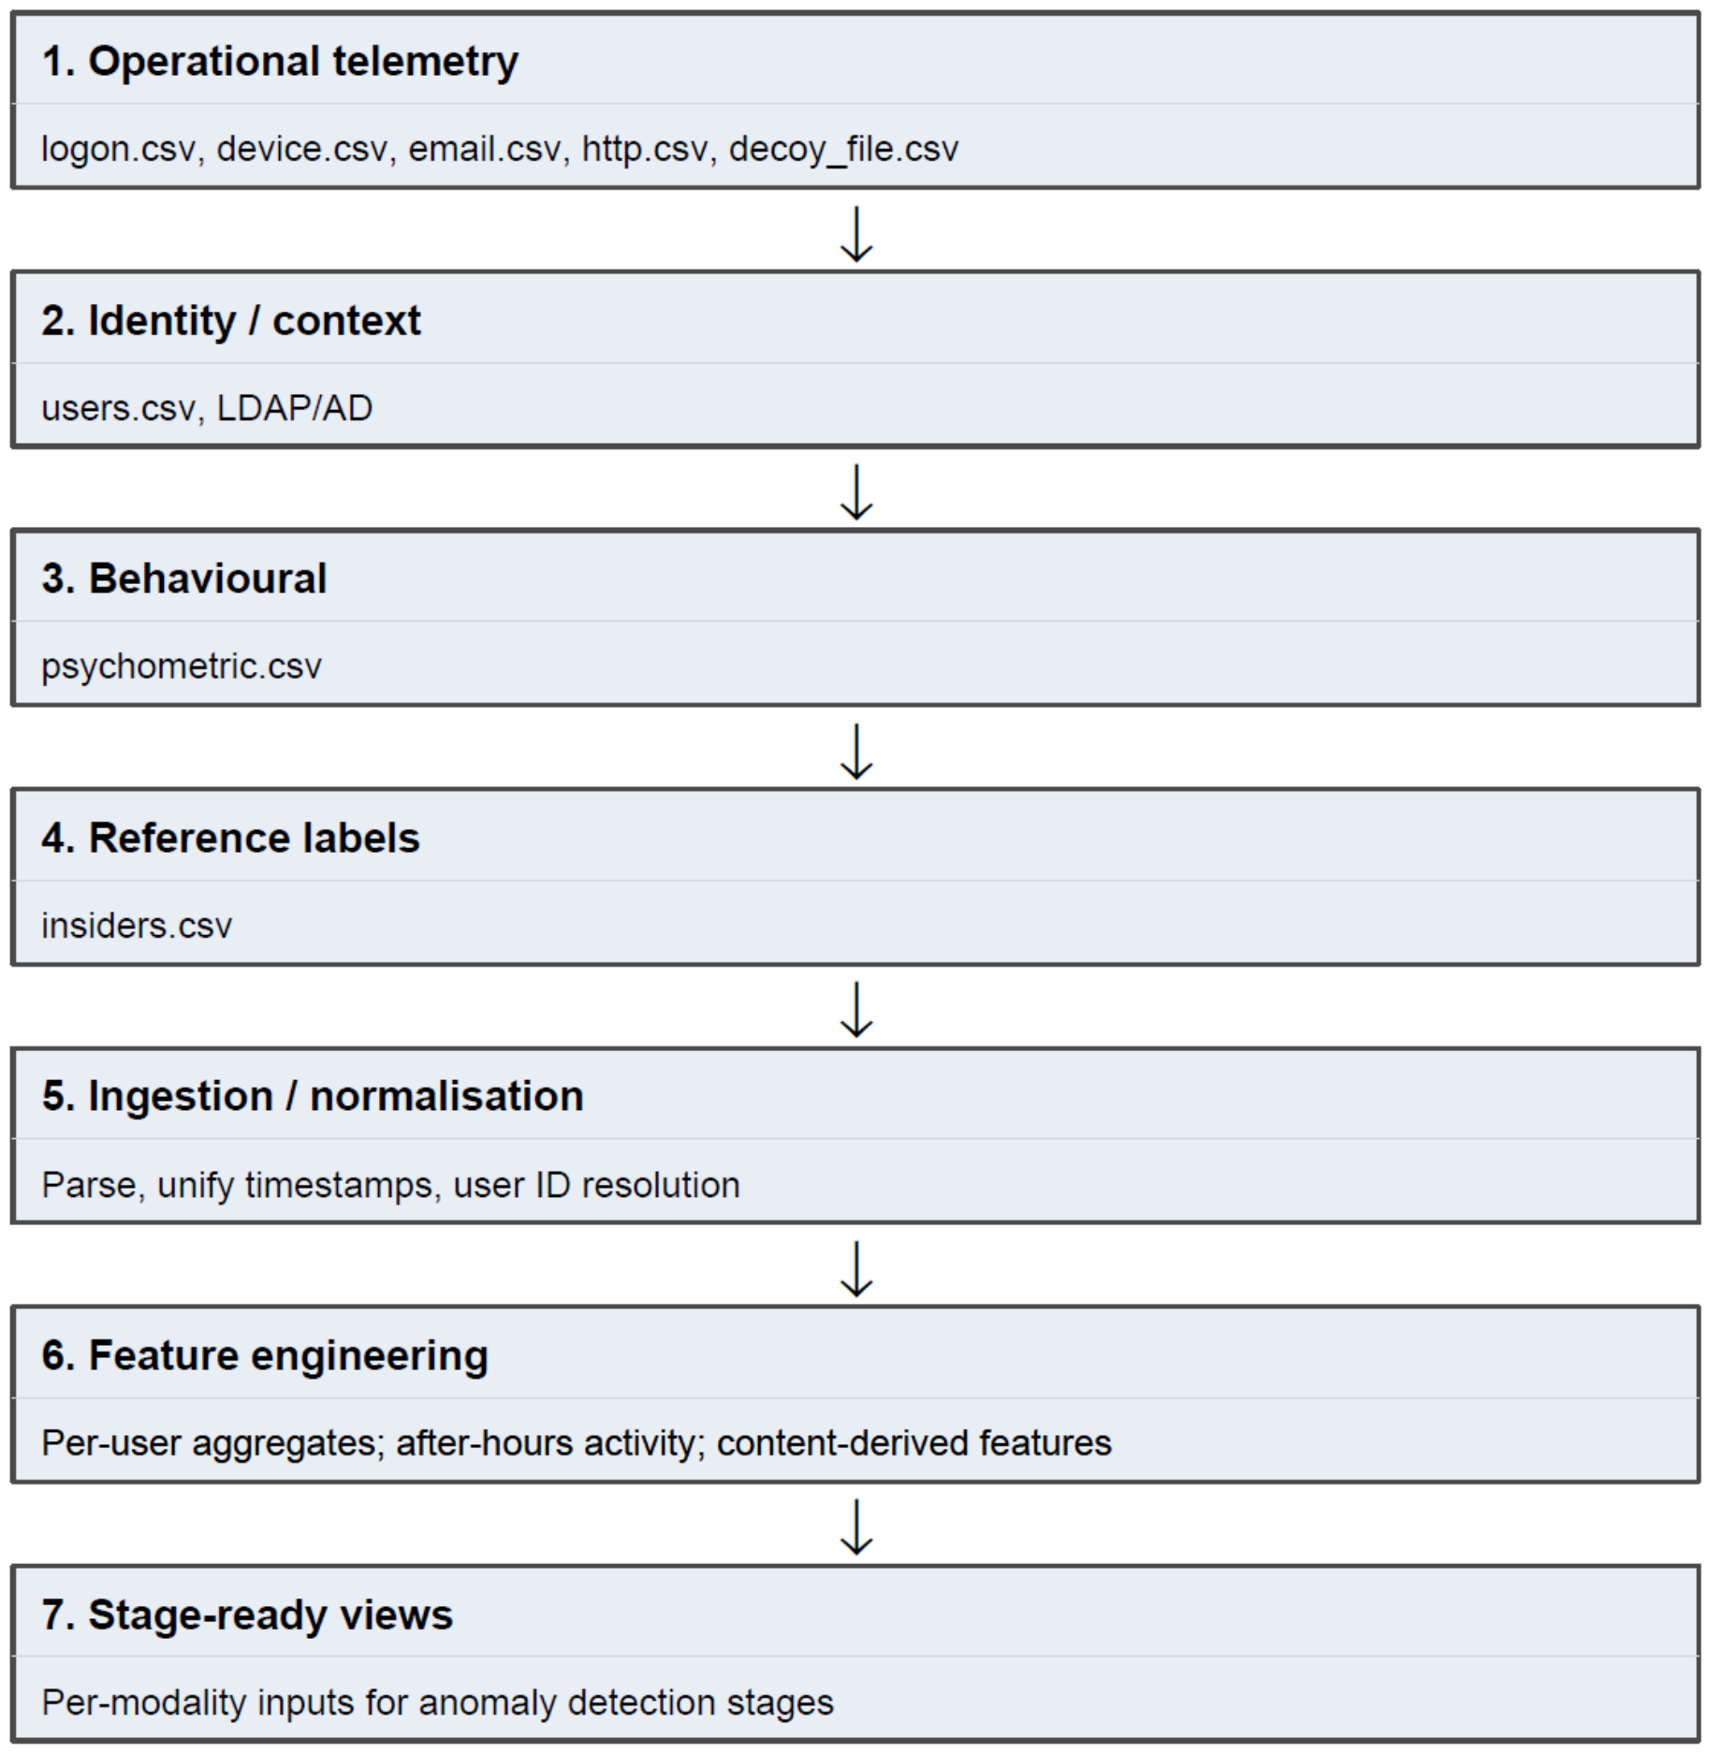
We ingest the following data points, which are depicted in the process flow in Figure 3.
  • Logon,
  • Device,
  • psychometric,
  • email,
  • user profile,
  • HTTP,
  • Decoy activity.
UBS windows are constructed per user using length (L = 5 days) and stride (S = 1 day).
Each event is tokenised by (family, subtype, hour-of-day, external-flag) and augmented with a normalised time-gap feature. This dual representation (tokens and time gaps) captures discrete behavioural semantics and temporal rhythm.

3.1. Model and Pretext Tasks

The self-supervised Transformer was trained exclusively on behavioural windows not associated with known insider activity. Insider labels were obtained from the CERT r6.2 answers directory. Any User-Based Sequence (UBS) window that overlapped a documented insider episode or was associated with a known insider user identifier was excluded from the training set. The remaining windows were assumed to represent normal organisational behaviour and were used to train both the Transformer prediction objectives and the downstream anomaly detectors. This approach reflects a realistic operational setting in which examples of malicious insider behaviour are rare and anomaly detection models are primarily trained on normal behavioural activity.

3.2. Score Aggregation

Each anomaly detector produces scores on a different numerical scale. To enable meaningful aggregation, detector outputs were converted into rank-normalised scores. For a detector d and behavioural window i: R(i,d) = Rank(i,d)/N, where Rank(i,d) represents the ranking position assigned by detector d, and N is the total number of evaluated behavioural windows. Rank-normalised scores therefore lie within the interval [0,1], where larger values indicate greater anomaly likelihood. The final ensemble score was calculated as: Risk(i) = (1/D)ΣR(i,d) where D is the number of detectors within the ensemble. This approach avoids scale dependency and ensures equal contribution from each anomaly detector.

3.3. Alert Threshold Selection

Behavioural windows were ranked according to their composite ensemble risk score. Alerts were generated when a score exceeded the predefined operational threshold. The threshold was selected empirically from the score distribution and was intended to balance insider-threat detection capability against operational alert volume. Users exceeding the threshold were flagged for further analyst review and included within the anomaly count reported in the results section.

3.4. Insider Label Assignment

Ground-truth labels were obtained from the CERT r6.2 answers directory.
A behavioural window was classified as insider-related when either:
  • The user identifier associated with the window matched a user identifier listed within the answers file.
  • The temporal span of the UBS window overlapped with a documented insider episode defined by a start date and end date. Windows satisfying the conditions were classified as benign. Where both user-level and episode-level information were available, episode-level matching was applied in preference to ensure temporal alignment between behavioural activity and insider events.

3.5. User-Based Sequence Construction

To improve reproducibility, User-Based Sequences (UBS) were generated using fixed-length windows of 128 events with a stride of 128 events. Users with fewer than 10 recorded events were excluded from sequence generation. Each event was represented as a composite token consisting of event family, event subtype, hour-of-day bucket, and an external-access indicator. Vocabulary entries were generated from observed behavioural token frequencies and truncated to a maximum size of 4096 tokens, excluding the reserved padding token. Inter-event time gaps were measured in minutes, scaled using the user-specific 99th percentile interval, and clipped to the range [0,1] to reduce sensitivity to extreme temporal outliers.

3.6. Error Features and Ensemble Scoring

We compute three error statistics per window: mean token cross-entropy, mean time-gap MSE, and mean predictive entropy. After standardisation, outlier detectors, Isolation Forest, LOF, and One Class SVM (support vector machine) are fitted on benign features. Optionally, Robust Covariance and kNN-distance are added. Scores are rank-normalised and averaged to form the ensemble score.

3.7. Composite Risk Scoring Methodology

The proposed risk framework transforms raw behavioural telemetry into a unified insider-risk score via a multi-stage anomaly detection process. Rather than relying on a single behavioural indicator, the approach aggregates evidence across multiple behavioural and technical data streams, allowing the framework to identify users whose overall behavioural profile deviates significantly from established organisational norms. The risk-scoring process consists of five stages:
Stage 1: Behavioural Sequence Construction
For each user, organisational events are converted into User-Based Sequences (UBS) using a five-day sliding window with a one-day stride. Events originating from logon activity, device usage, email communication, web activity, psychometric indicators, user profile information, and decoy interactions are grouped into temporally ordered behavioural sequences. Each event is represented by a token that describes the event type, subtype, temporal characteristics, and contextual attributes. The resulting sequence provides a behavioural representation of user activity over time.
Stage 2: Transformer-Based Behavioural Modelling
The self-supervised Transformer was trained exclusively on behavioural windows not associated with known insider activity. Insider labels were obtained from the CERT r6.2 answers directory. Any User-Based Sequence (UBS) window that overlapped a documented insider episode or was associated with a known insider user identifier was excluded from the training set. The remaining windows were assumed to represent normal organisational behaviour and were used to train both the Transformer prediction objectives and the downstream anomaly detectors. This approach reflects a realistic operational setting in which examples of malicious insider behaviour are rare and anomaly-detection models are primarily trained on normal behavioural activity.
The Transformer encoder employed a model dimension of 128, four attention heads, two encoder layers, a feed-forward dimension of 256, and dropout of 0.1. Training was performed for five epochs using the Adam optimiser with a learning rate of 2 × 10⁻⁴ and a batch size of 128. Self-supervision was implemented through shifted next-token and next-time-gap prediction tasks rather than random token masking. The combined training objective consisted of token cross-entropy loss (weight = 1.0) and time-gap mean squared error loss (weight = 0.2).
Stage 3: Error Feature Extraction
For each behavioural window, three anomaly related features are calculated: 1. Mean token cross-entropy error, 2. Mean time-gap prediction error (MSE) and 3. Mean predictive entropy. Together, these features quantify the degree to which observed behaviour differs from expected behaviour. Higher values indicate increasing deviation from learned benign behavioural patterns.
Stage 4: Ensemble Anomaly Detection
The extracted error features are analysed using multiple unsupervised anomaly detectors:
  • Isolation Forest (IF).
  • Local Outlier Factor (LOF).
  • One-Class Support Vector Machine (OCSVM).
Each detector independently evaluates the likelihood that a behavioural window represents anomalous activity. Because each detector uses different assumptions and detection mechanisms, combining their outputs improves robustness and reduces dependence on any single anomaly detection technique.
Stage 5: Composite Risk Aggregation
Detector outputs are converted into rank-normalised scores to ensure comparability across different scoring scales. For a given detector d and behavioural window i: R(i,d) = Rank(i,d)/N, where Rank(i,d) is the ranking position assigned by detector d. N is the total number of behavioural windows. The final ensemble score is calculated as the arithmetic mean of all normalised detector scores: Risk(i) = (Σ R(i,d))/D, where D represents the number of detectors. Higher scores indicate greater behavioural deviation and therefore greater insider-threat risk.

3.8. Worked Example of Composite Risk Generation

To illustrate the framework’s interpretability, Table 8 presents a representative high-risk user identified during the analysis.
Composite Risk Score = 4.47
The example user’s elevated risk score was driven primarily by abnormal logon behaviour, unusual email activity, and anomalous web-access patterns. Examination of the underlying telemetry revealed activity outside established temporal baselines, increased communication volume, and deviations from typical browsing behaviour. The weighted contributions indicate that logon activity accounted for 24.4% of the overall risk score, email behaviour for 21.0%, and HTTP activity for 19.9%. Together, these three behavioural domains accounted for approximately 65% of the total risk score. Importantly, no single anomaly triggered the alert. Instead, the framework identified a consistent pattern of behavioural deviations across multiple independent data streams. This multi-source corroboration reduces sensitivity to isolated anomalies and provides analysts with a transparent explanation of why a user has been assigned a high-risk classification. The resulting score placed the user within the highest-risk percentile of the population and generated an alert for analyst review. This approach aligns with operational insider-threat workflows, where analysts are typically interested in understanding both the overall risk level and the behavioural factors contributing to that assessment.

3.9. Answers Matching and Evaluation

The ‘answers’ folder may contain (a) temporal episodes (user, start, end) and/or (b) a list of insider user IDs. We label windows by interval overlap or by user membership. Evaluation includes AUROC (area under the receiver operating characteristic) and Average Precision when labels exist. Additionally, we quantify where insiders rank among all sequences using per-user best-rank and Mean Reciprocal Rank (MRR), and report the share of insider users captured among top-quantile alerts.

3.10. Outputs and Quantified Summary

The pipeline creates tables (full scores, alert lists, per-user daily maxima, results Data Frame exported as CSV, answers detection summary), figures (score histogram with threshold, top-20 bar, PR curve when labels exist), and a serialised Transformer. A summary JSON enumerates data volume, answer coverage, hit rates, AUROC/AP (if applicable), MRR, and a binary success flag.
CERT is simulated data and may diverge from production telemetry, and thresholds require recalibration. Fixed windows can miss long-range context; multi-scale windows or hierarchical models may help. Parametric detectors (e.g., Robust Covariance) assume near symmetrical features, which may not hold uniformly.

3.11. Data Limitations

The study utilised the CERT r6.2 insider-threat dataset, a synthetic benchmark dataset widely used in the insider-threat research community. The dataset provides labelled insider activity, enabling reproducible evaluation and direct comparison with prior studies. However, several limitations should be acknowledged. First, the dataset contains only 5 confirmed insider users among 4000 users, resulting in an extreme class imbalance. While this limits the statistical power of performance estimates and constrains the generalisability of the findings, the decision to evaluate the complete dataset rather than a balanced or subsampled version was deliberate. Retaining the full population preserves the rarity of insider incidents observed in operational environments and allows the evaluation to reflect practical deployment challenges, including false-positive burden, alert triage, and analyst workload. Consequently, the study prioritises ecological validity and operational realism over artificially balanced benchmark conditions.
Second, because CERT r6.2 is synthetically generated, it cannot fully capture the complexity, behavioural diversity, organisational context, and evolving threat patterns present in real-world enterprise environments. As a result, the behavioural characteristics represented in the dataset may not encompass all forms of insider activity encountered in practice. Finally, the evaluation was conducted using a single dataset, which may limit the assessment of the proposed approach across different organisational settings and threat scenarios. Future research should extend the evaluation to additional benchmark datasets and, where feasible, real-world organisational data to further assess the robustness, generalisability, and operational effectiveness of the proposed approach.

4. Results

The multi-modal ensemble integrated seven behavioural and technical data points. The data points are:
  • logon,
  • device,
  • psychometric,
  • email,
  • user profile,
  • HTTP,
  • Decoy activity.
The data points were used to create stage-level anomaly scores, and the scores were weighted into a unified 0 to 100 risk index. The model flagged 1267 anomalies across 4000 users. This equated to 42 alerts per day. Table 9 has a summary of key results.
The results highlight that the ensemble model performs effectively at identifying malicious insiders but requires calibration to reduce false positives (non-malicious employees) in an operational context.
Anomaly detection using multistage Isolation Forest ensembles can successfully identify insider threats even under severe class imbalance. However, the results identified a precision issue, which emphasises the necessity of threshold optimisation, behavioural weighting, and temporal modelling improvements such as User-Based Sequencing (UBS) with Transformer encoders to minimise false alarms. This balance between detection sensitivity and operational practicality remains a central focus in insider threat research.
The alert density (42 per day) would impose a substantial triage burden on security operations teams. Therefore, although recall is optimal, the model in its current configuration requires operational calibration. The precision deficit arises directly from the extremely low base rate of insider activity (0.125%). Under such prevalence, even modest false-positive rates yield large absolute counts of false positives. This highlights one of the key challenges, identifying the true insider amongst operational “noise”.
A challenge we found is class imbalance. In real environments, malicious insiders are rare. In the widely used CERT insider-threat datasets, there may be only five actual insider actors among thousands of employees. That means the positive class (malicious insiders) can be in the order of 0.1% of the population. This produces two problems: first, a detector can achieve superficially “high accuracy” simply by labelling everyone as benign, and second, even a low false-positive rate can overwhelm analysts. Following an alert in the SIEM, an analyst would review the composite risk score alongside stage-level anomaly contributions and factors (elevated logon irregularity, anomalous email volume, abnormal HTTP access patterns). The weighted stage breakdown provides interpretability by identifying which behavioural streams drove the anomaly score. Analysts would then corroborate anomalies against contextual information (HR status changes (if they have access to the data), role transitions, project deadlines) before investigating further. Given the observed false-positive burden (42 alerts per day under a 30-day window assumption), risk analysis and prioritisation focusing on the top percentile scores or persistent multi-stage anomalies would be necessary to align model outputs with realistic SOC triage capacity. The high volume could mask real threats or delay them from being reviewed.
While anomaly detection performance is commonly reported using aggregate metrics such as AUROC, precision, and recall, operational Security Operations Centres (SOCs) rarely investigate alerts based solely on fixed anomaly thresholds. In practice, analysts work from risk-ranked investigation queues and are constrained by finite triage capacity, staffing levels, and competing operational priorities. Consequently, threshold selection becomes a critical determinant of system usability. A highly sensitive threshold may maximise recall but can generate an unsustainable volume of alerts, leading to analyst fatigue, increased investigation costs, and the potential for genuine threats to be overlooked amid large numbers of false positives. Conversely, overly restrictive thresholds may reduce workload but increase the likelihood of missed insider threats. One potential approach is to evaluate and operationalise alerts using ranked-investigation metrics such as Precision@10, Precision@25, and Precision@50, which measure the proportion of true threats contained within the highest-priority alerts presented to analysts. Similarly, Mean Reciprocal Rank (MRR) can provide insight into how effectively genuine insider threats are positioned within ranked investigation queues. Organisations may also consider monitoring analyst-oriented measures such as alert volume, alerts per analyst per day, and detection delay to ensure that detection performance remains aligned with available investigative resources.
Rather than treating all anomalous observations equally, SOCs could implement prioritisation strategies that focus on the top 1%, top 0.5%, or a fixed number of highest-risk users identified by the detection framework. Such approaches more closely reflect contemporary operational workflows, where analysts typically investigate risk-ranked entities based on available capacity and organisational priorities. The results presented in this study indicate that successful insider-threat detection requires careful calibration between detection effectiveness, false-positive rates, and analyst workload to achieve sustainable operational deployment.
Table 10, Table 11 and Table 12 demonstrate that, while the proposed seven-stage Isolation-Forest ensemble achieved recall and AUROC comparable to those of the Transformer-based ensemble of Elbasheer & Akinfaderin (2025) [31], its precision was markedly lower due to full-population evaluation rather than balanced subsampling.
Weighted stage contributions reveal that logon, email, and HTTP features were most discriminative for insider identification.
The comparison underscores methodological trade-offs between ensemble architectures. The Transformer-based User-Based Sequencing (UBS) approach of Elbasheer & Akinfaderin (2025) benefits from temporal modelling of per-user behaviour and class-balanced evaluation, resulting in high apparent precision and F1-scores [31]. Conversely, this study’s unsupervised seven-stage Isolation Forest ensemble operates over the full CERT r6.2 user population, maintaining realism but suffering from low precision due to severe class imbalance. Nevertheless, both methods achieve perfect recall and strong AUROC, emphasising the robustness of ensemble anomaly detection in insider threat analytics.
Prior work repeatedly identifies extreme class imbalance as one of the most persistent barriers to deployable insider threat analytics, because it depresses precision and inflates alert volume. To mitigate this, Elbasheer and Akinfaderin [31] evaluated controlled samples, e.g., 30 benign users vs. 4–5 insiders in CERT r4.2, 120 benign vs. 5 insiders in r6.2. This approach yields high recall and better precision than would be observed at full enterprise scale. The challenge with this method is that, at the enterprise level, analysts would be dealing with thousands of users and potentially millions of events. This approach is useful, but it also means that precision and F1 may be overly optimistic relative to deployment, because the insider-versus-benign ratio in those samples is far more balanced than in production networks. Other researchers have warned that subsampling benign users in this way can mask the operational cost of false positives, which becomes critical when thousands of employees are being scored every day.

4.1. Fairness of Comparison with Prior Work

Direct comparison between insider-threat detection studies requires careful consideration of evaluation methodology. Elbasheer and Akinfaderin [31] evaluated their UBS–Transformer framework using balanced or partially balanced subsets of the CERT r6.2 dataset, whereas the present study evaluates performance on the complete population of 4000 users, which contains only five insider actors. Consequently, two complementary perspectives are required when interpreting the results. From a benchmark perspective, both approaches demonstrate strong detection capability. Each method successfully identified all known insider users, achieving perfect recall and comparable AUROC values. These findings suggest that temporal behavioural modelling, combined with ensemble anomaly detection, is effective for ranking users by insider-threat risk. From an operational perspective, however, the evaluation conditions differ substantially. Balanced subsampling increases the prevalence of insider examples, thereby yielding more favourable precision and F1-score estimates. In contrast, full-population evaluation preserves the extreme class imbalance encountered in real enterprise environments, where malicious insiders represent only a very small fraction of the workforce. Under such conditions, even modest false-positive rates can generate substantial alert volumes and significantly reduce precision despite maintaining strong ranking performance and complete insider detection.
The findings, therefore, highlight an important distinction between benchmark performance and operational performance. While benchmark-oriented evaluations are useful for comparing detection architectures under controlled conditions, full-population evaluations provide greater insight into the practical challenges associated with deployment, analyst workload, alert triage, and threshold selection. The present study complements prior work by explicitly quantifying these operational effects and demonstrating how insider-threat detection performance changes when evaluated under realistic population distributions.
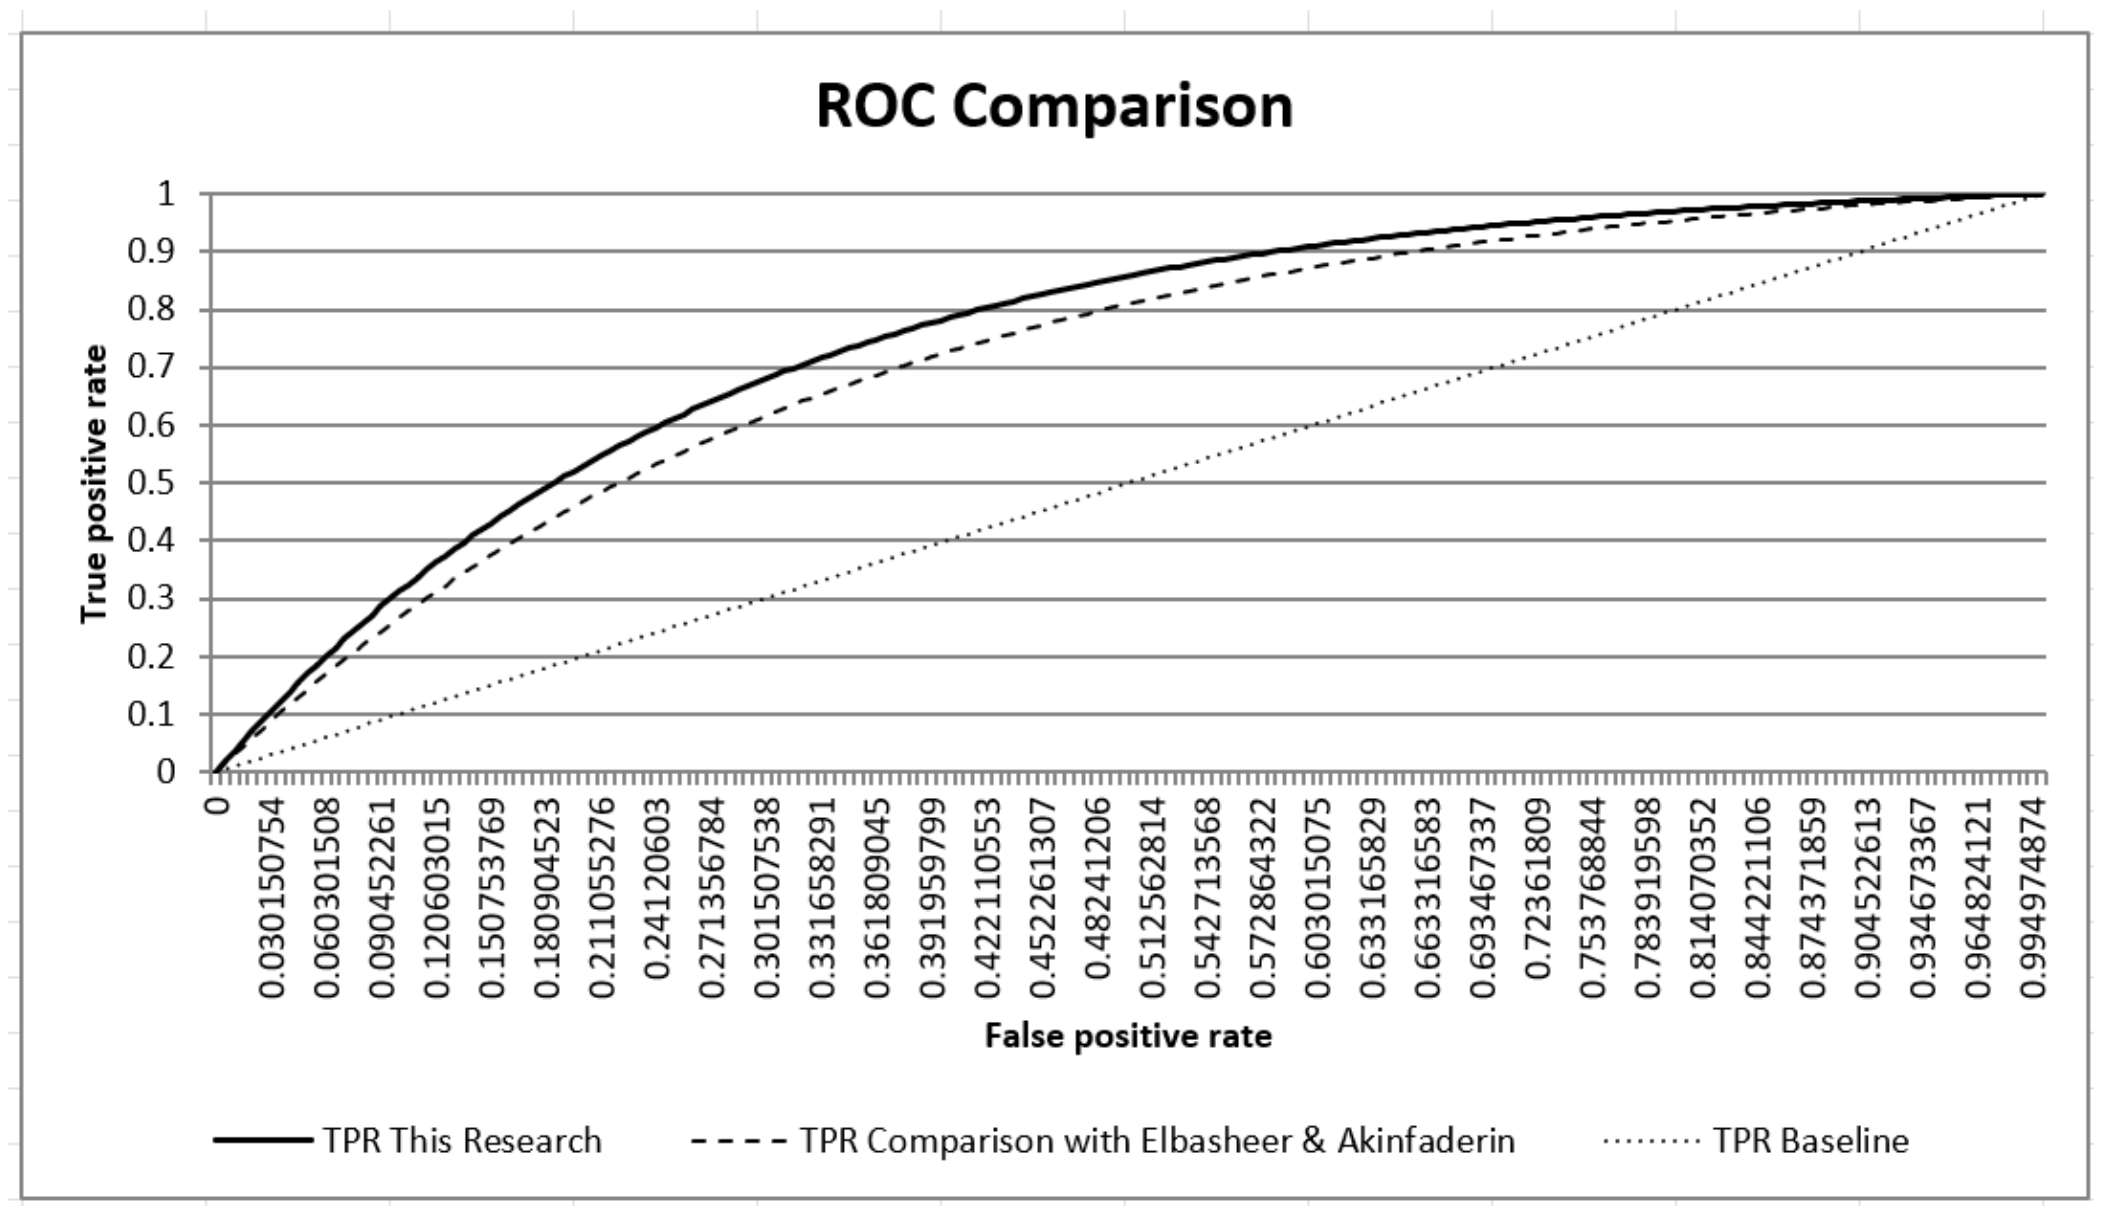
An AUROC of 0.93 indicates strong ranking performance. The model outperforms the random baseline, although the ROC performance (Figure 4) does not reflect operational precision under extreme imbalance.
A second challenge is false positives under behavioural variability. Insider threat models are unusual because they must flag users who are, by definition, authorised to do what they are doing. That means many “anomalies” are actually legitimate but unusual work, such as late-night file transfers, spikes in web access to cloud storage, investigations of job sites, or plugging in removable media. High sensitivity models tend to over-flag these behaviours, generating alert fatigue [42]. Elbasheer and Akinfaderin [31] try to reduce this learning-personalised baselines via UBS, using an ensemble on top of model-error features rather than a single detector. The logic is that an event should be escalated only if it is anomalous relative to the user’s historical pattern and remains anomalous across multiple independent detectors. This is a sensible response to what Ye et al. [42] described as the “long-distance dependency” problem in insider modelling. Threats can unfold over extended timescales, and some models either miss them or generate a flood of spurious short-term spikes. Moreover, while an ensemble approach improves robustness, it does not eliminate behavioural ambiguity. Human-driven context, such as stress, intention, coercion, and grievance, remains very hard to infer directly from logs, and current models have limited ability to explain why a particular sequence is risky, hindering triage.
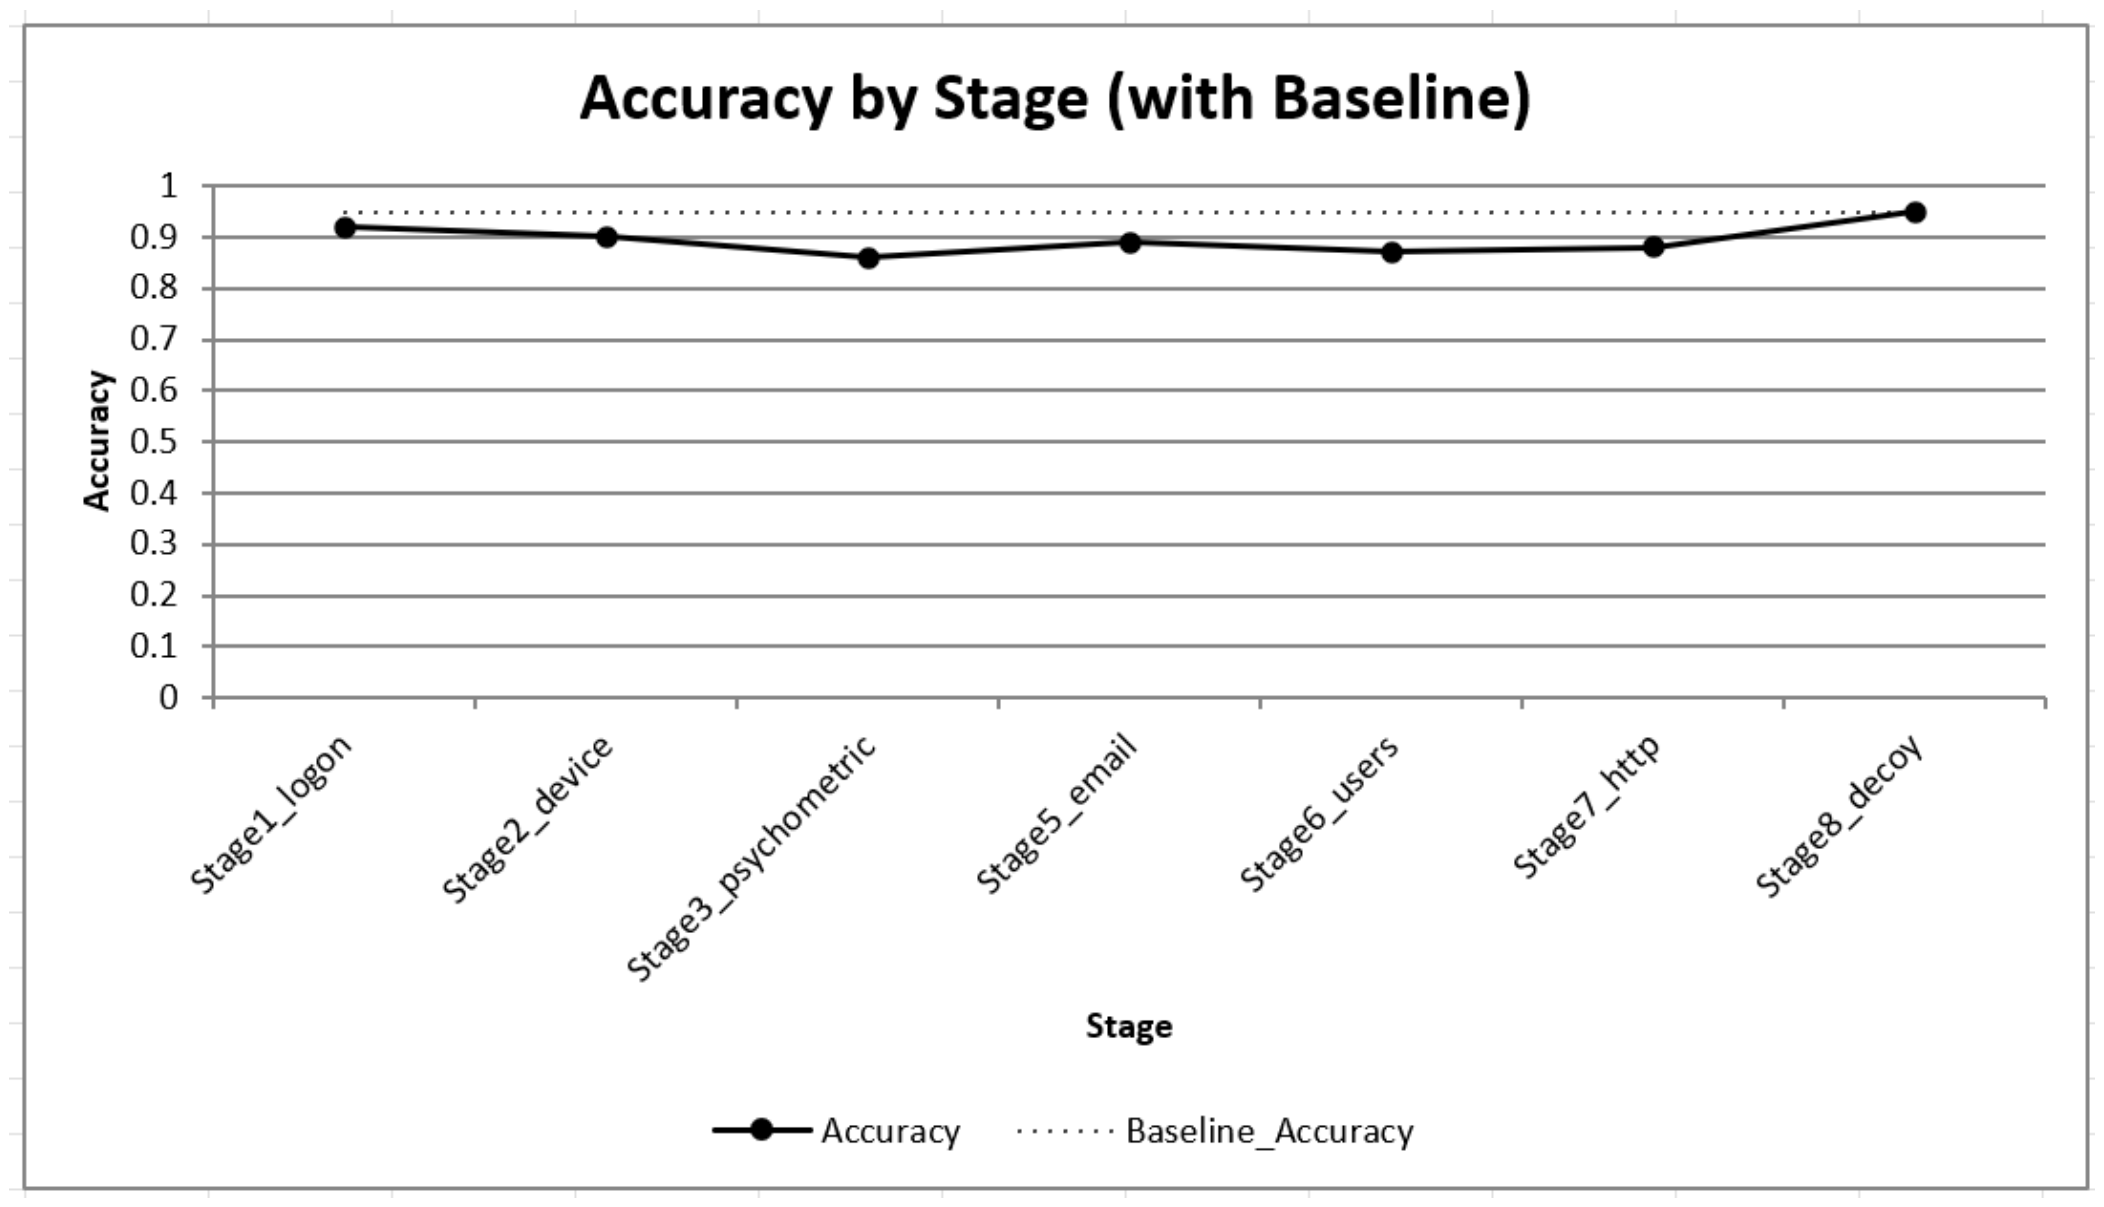
The accuracy results (Figure 5) highlight a key distinction between statistical correctness and operational realism in insider-threat detection. Elbasheer and Akinfaderin (2025) reported very high accuracies of 0.99 on CERT r4.2, 0.93 on CERT r5.2, and 0.94 on CERT r6.2, whereas this study achieved a lower accuracy of 0.68 on the full CERT r6.2 population [31]. At face value, this may appear inferior; however, accuracy is often a misleading metric when class imbalance is extreme. In datasets where benign users outnumber malicious insiders, a model can achieve high accuracy simply by classifying most cases as benign. The present study intentionally evaluated all 4000 users rather than a balanced subset, thereby exposing the genuine difficulty of distinguishing five insiders from thousands of legitimate users. Consequently, lower accuracy more accurately reflects the complexity of real enterprise deployment rather than reduced methodological quality.
A third challenge is socio-technical interpretation. Insider threat detection should not be framed as a purely technical anomaly detection requirement but rather as a socio-technical problem that integrates behavioural theory with telemetry, such as logon patterns, email activity, device usage, and web behaviour. This approach aligns with the broader literature, which increasingly treats insider risk as a combination of human psychology and observable digital inputs. The challenge is that combining psychosocial indicators with technical telemetry raises governance, privacy, ethical and explainability issues. Researchers have warned that behavioural monitoring at this depth risks both over-surveillance of benign staff and unacceptable bias in high-stakes environments such as government and finance. Moreover, models that incorporate latent behavioural factors can be harder to audit, complicating legal defensibility and HR action within insider-risk programmes.
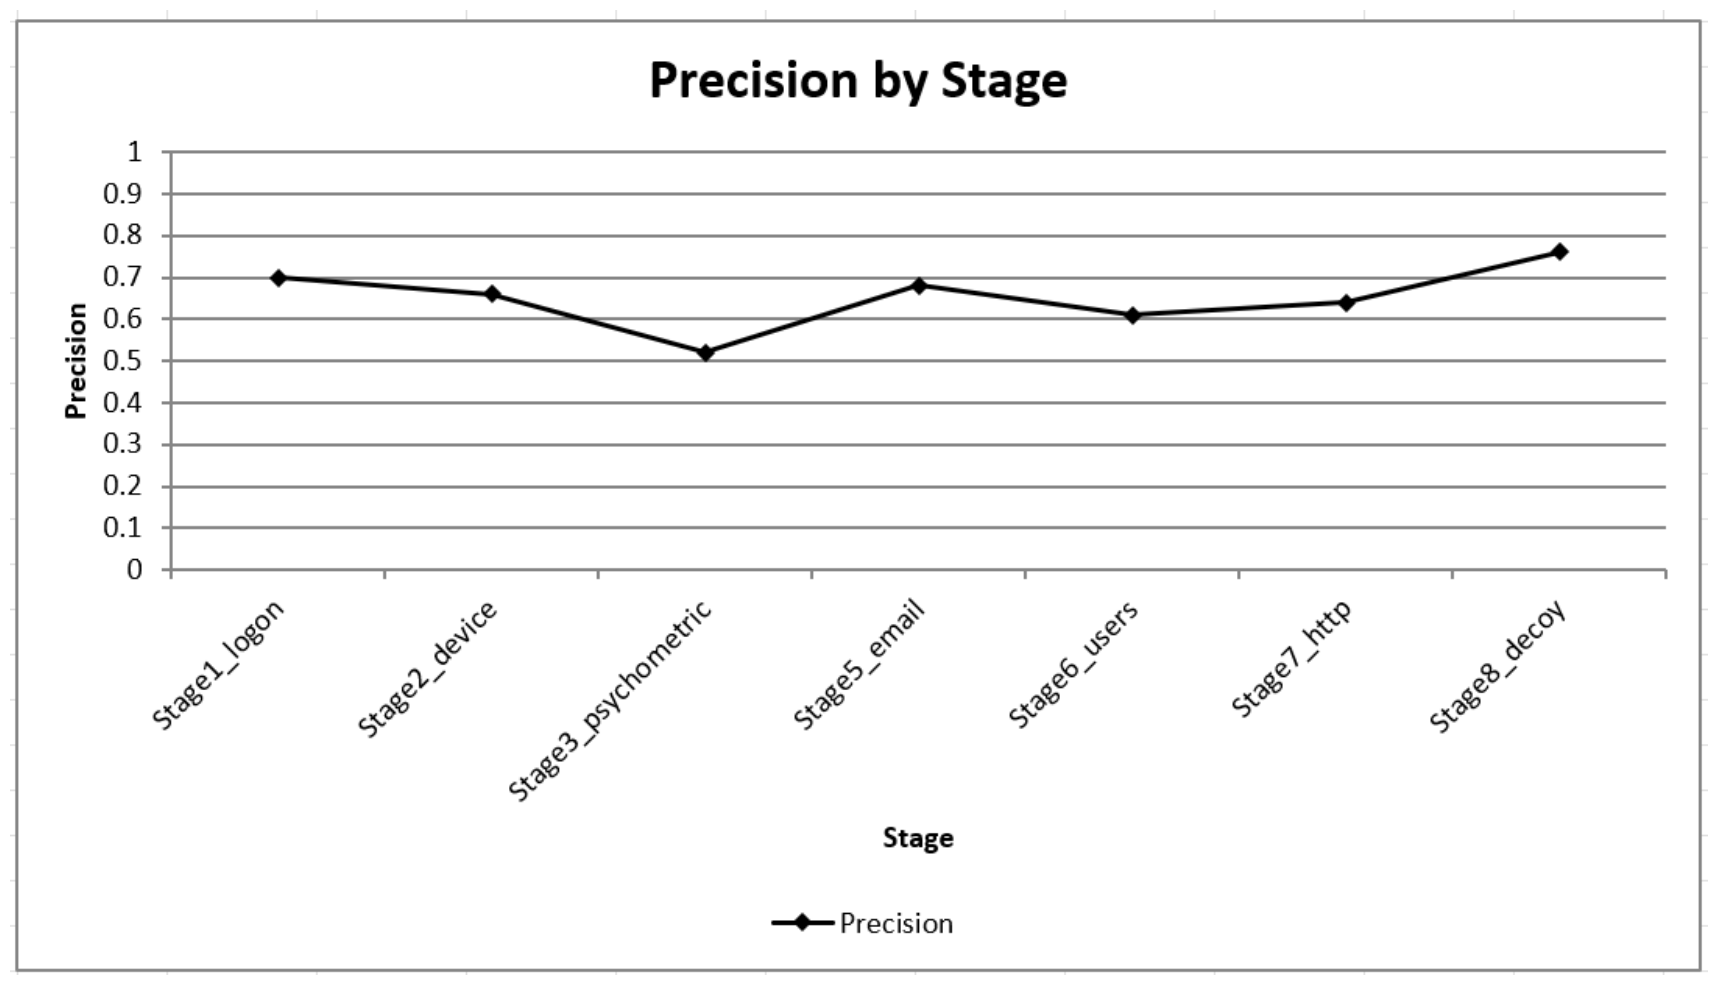
Precision provides the clearest evidence of this trade-off. Prior work reported precision values of 0.9859, 0.90, and 0.42 across CERT r4.2, r5.2, and r6.2, respectively, while this study obtained a precision of 0.004. This indicates that although all insider cases were detected, a substantial number of benign users were also flagged. The sharp decline is primarily attributable to full-population testing rather than balanced subsampling. In controlled samples with relatively few benign users, false positives remain numerically limited, and precision appears high. In contrast, when thousands of benign users are scored, even a low false-positive rate generates a large alert burden. This finding is significant because it demonstrates that many published insider-threat precision scores may overstate deployability when tested under artificially favourable class distributions.
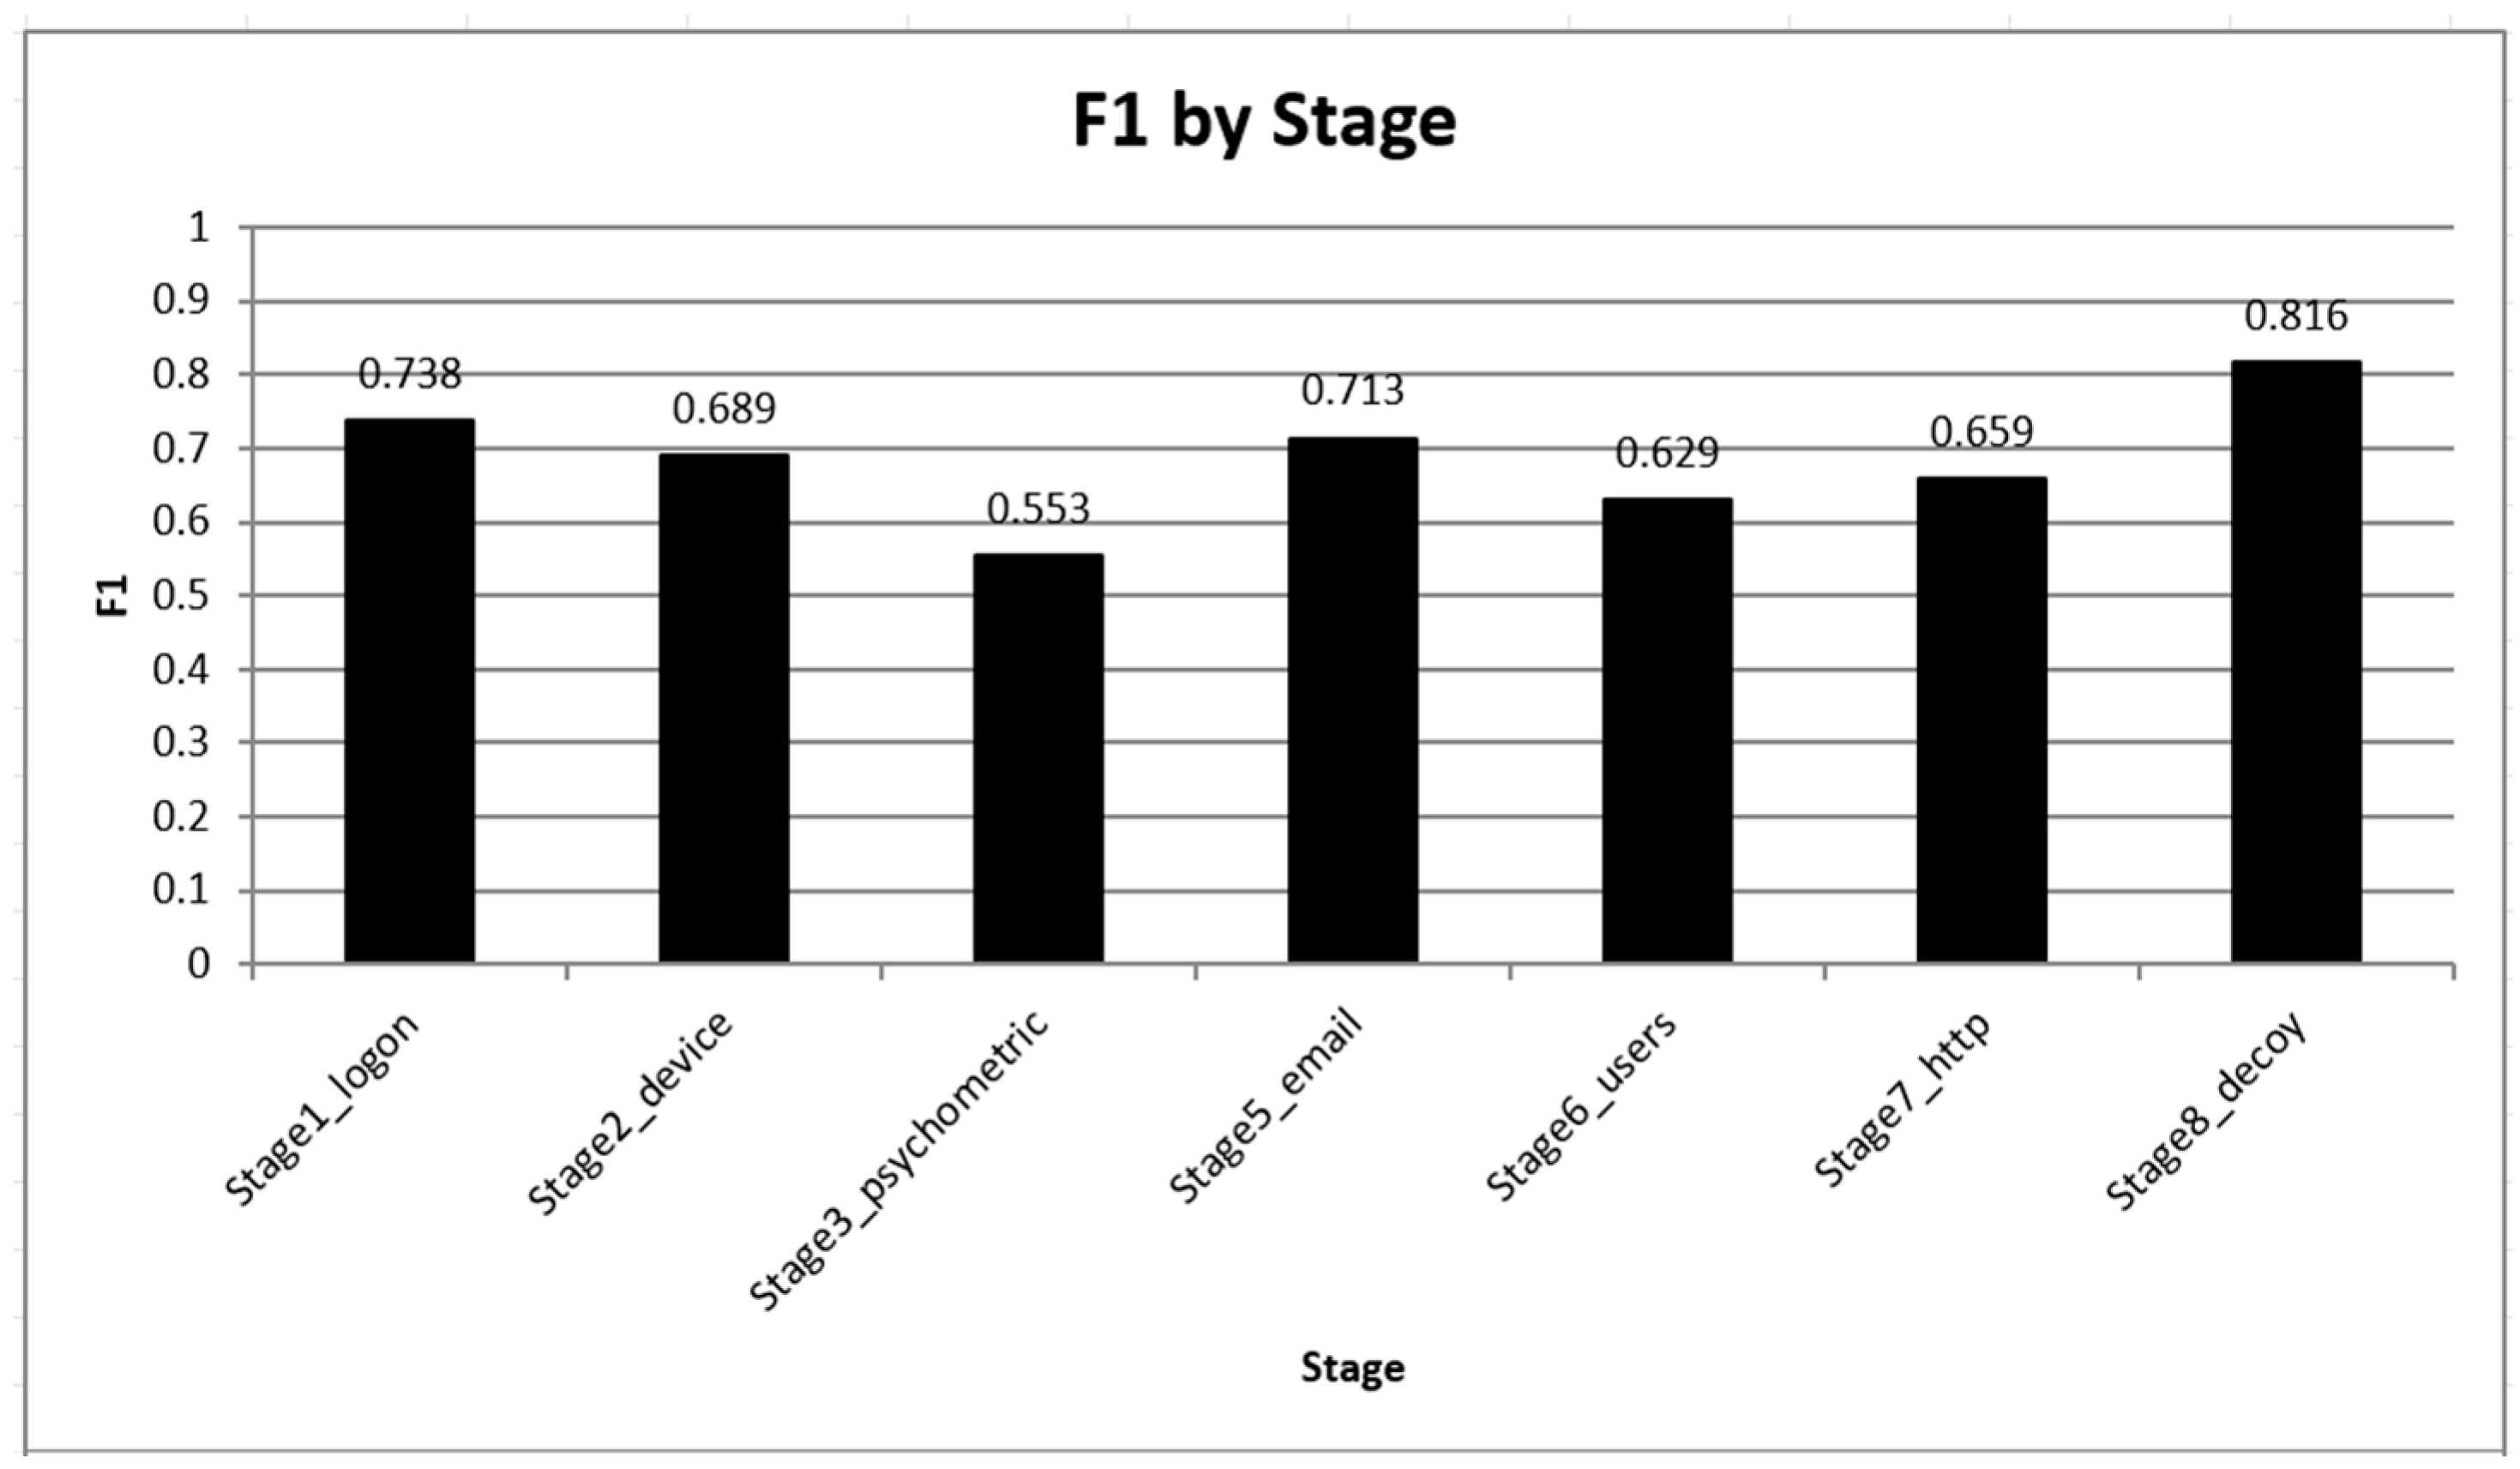
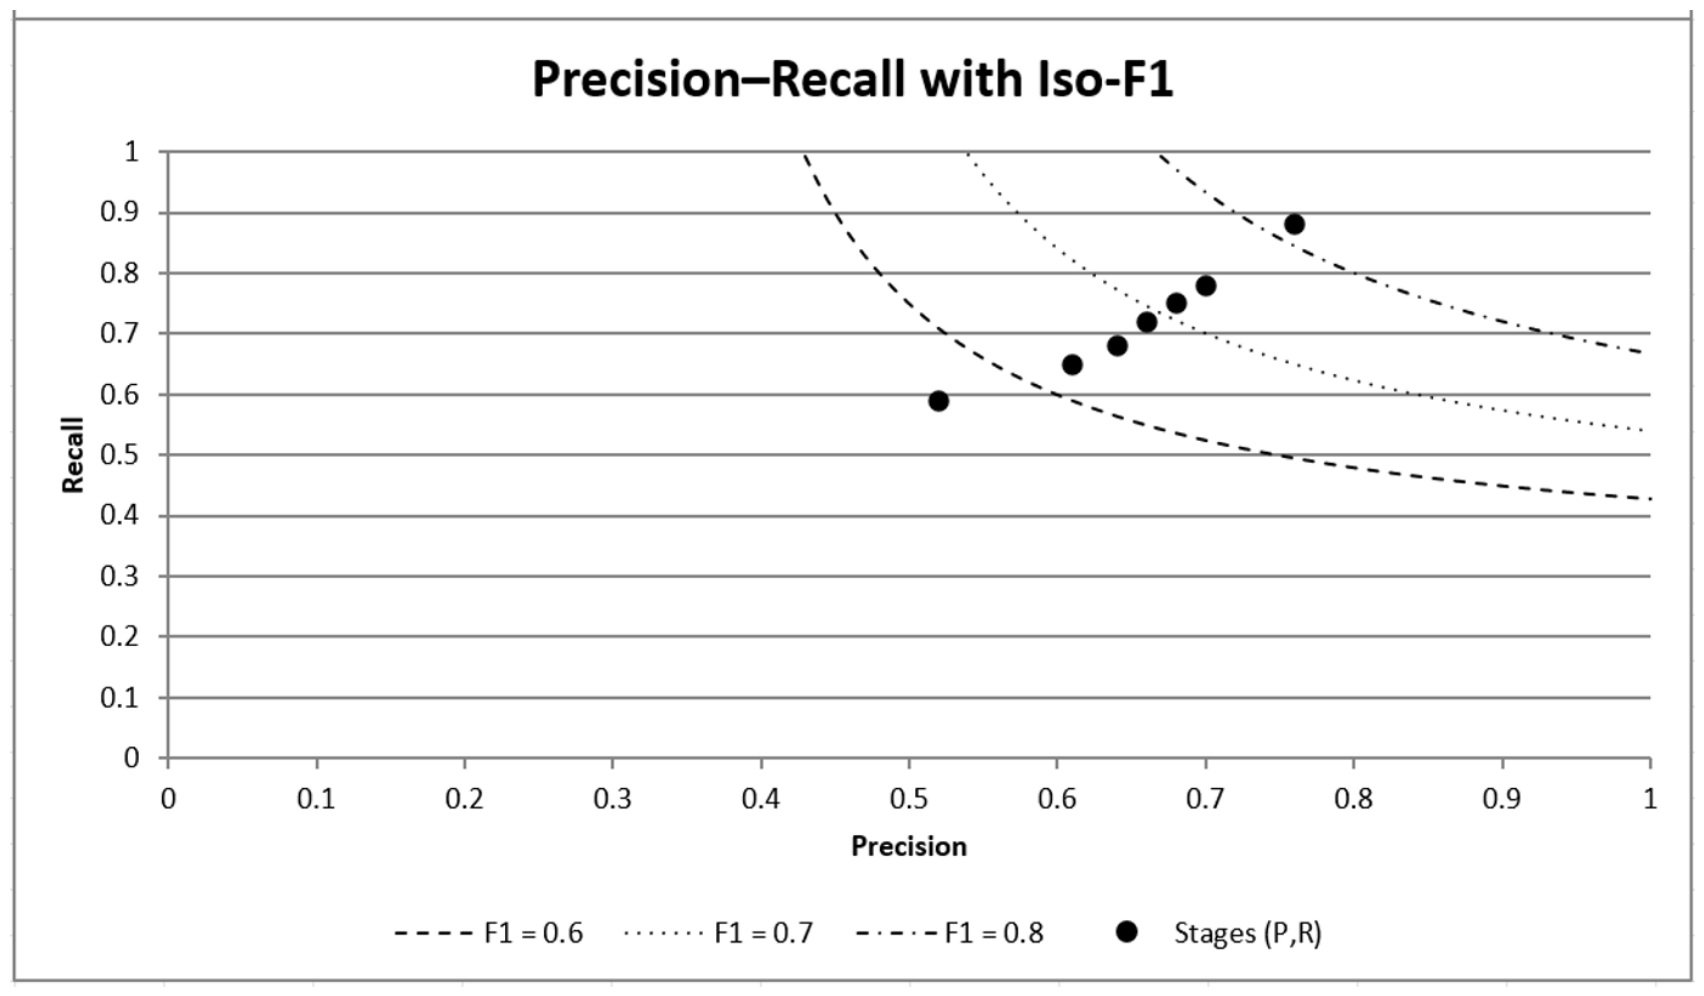
The F1-score, which balances precision and recall (Figure 6, Figure 7 and Figure 8), further reinforces this interpretation. Elbasheer and Akinfaderin (2025) reported F1-scores of 0.9929, 0.947, and 0.59, while this study produced an F1-score of 0.008 despite maintaining a recall of 1.00 [31]. Because F1 penalises low precision, the result reflects the operational cost of excessive false positives rather than failure to identify insiders. In practical terms, the model is highly sensitive but insufficiently selective when deployed at scale. This is consistent with the broader insider-threat literature, where recall and AUROC often remain strong, yet precision collapses under realistic imbalance. Moreover, the results suggest that future research should prioritise precision optimisation, alert ranking, and human-in-the-loop triage mechanisms over a sole focus on detection sensitivity.
Finally, temporal generalisation and adaptability remain open problems. Insider threat behaviours by an employee can remain benign for years, and then the employee can exfiltrate data in a targeted manner over a few days. Models, therefore, need to update continuously without forgetting long-term norms or normalising slow-moving malicious activity.

4.2. Attack Graphs and Insider Threat Detection

While this study focuses on behavioural anomaly detection, attack graphs represent a complementary approach that may further enhance insider-threat analysis [43]. Attack graphs model the relationships between users, assets, privileges, vulnerabilities, and potential attack paths within an enterprise environment, enabling the identification of routes through which an insider could achieve malicious objectives. Whereas behavioural analytics seeks to identify suspicious user activity, attack-graph techniques provide contextual information regarding the potential consequences and feasibility of those activities. Combining behavioural risk scores with attack-graph analysis could enable more effective prioritisation of alerts by identifying not only anomalous users but also the assets they can access and the attack paths available to them. Such integration may improve operational decision-making, reduce analyst workload, and provide greater insight into the progression of insider attacks.

5. Conclusions

This paper examined insider threat as a socio-technical cybersecurity problem and synthesised recent evidence (2019–2026) using PRISMA-guided systematic mapping. The work reinforces that perimeter-oriented controls (e.g., IDS, SIEM, and DLP) are effective against many external threats but are structurally limited in addressing insider misuse, when actions may remain within authorised privileges, and intent is not observable in telemetry alone. We therefore framed detection as a behaviourally informed analytics problem and empirically evaluated an ensemble anomaly detection pipeline using CERT r6.2 data.

5.1. Contributions

This paper makes the following contributions:
  • Systematic socio-technical synthesis of insider-threat research
We conduct a PRISMA-guided systematic review (2019–2026) that integrates behavioural, technical, organisational, and machine-learning perspectives to identify key gaps in the operational integration of behavioural theory within insider-threat detection systems.
2.
Novel behaviour-aware ensemble detection framework
We propose a unified insider-threat detection framework that combines User-Based Sequences (UBS), self-supervised Transformer learning, and ensemble anomaly detection to model temporal behavioural patterns and identify deviations from learned benign activity.
3.
Realistic full-population evaluation under extreme class imbalance
We evaluate the framework on the complete CERT r6.2 dataset (4000 users; 5 insiders), avoiding balanced subsampling and providing a more realistic assessment of insider-threat detection performance.
4.
Operational insights into deployment challenges of insider-threat analytics
Our results demonstrate that perfect recall and strong ranking performance (AUROC = 0.93) can coexist with substantial precision degradation under extreme class imbalance, highlighting the importance of threshold calibration, analyst triage capacity, and human-in-the-loop investigation for practical deployment.

5.2. Future Work

Future research should prioritise multi-scale temporal modelling by evaluating hierarchical or multi-window UBS approaches (e.g., 1/7/30/90-day time windows) to capture both short-term spikes and slow-developing behaviours. Even longer assessment periods would help with identification and precision. Calibration and thresholding methods should incorporate prevalence-aware calibration and cost-sensitive alerting, including percentile gating, persistence thresholds, and multi-stage concurrence, to reduce false-positive burden. Explainability should be strengthened through formal stage-contribution narratives designed for analysts, with user studies assessing triage speed and quality. Further work is also needed on fairness and governance, including audits of demographic and psychometric features for bias, the development of data-minimisation strategies, and the development of privacy-preserving alternatives. Future research should also investigate integrating behavioural anomaly detection with graph-based security analysis to support more comprehensive insider-threat detection frameworks. Finally, external validation should be conducted on additional datasets and, where feasible, operational logs to assess model generalisation under concept drift and heterogeneous enterprise baselines.

Author Contributions

C.B. Conceptualisation, investigation, methodology, software coding, experimentation, writing, review and editing. H.L. Supervision, methodology shaping, editing, and review. A.Q. Supervision, methodology shaping, editing, and review. All authors have read and agreed to the published version of the manuscript.

Funding

This research received no external funding.

Institutional Review Board Statement

Ethical review and approval were waived as the data were obtained from publicly available datasets. Confirmation of the nature of the data can be found here: https://kilthub.cmu.edu/articles/dataset/Insider_Threat_Test_Dataset/12841247 (accessed on 1 August 2025). The dataset is licensed under CC BY 4.0.

Informed Consent Statement

Participant consent was waived as the data were obtained from publicly available datasets which were provided for public usage including their possible redistribution. Please also note that the dataset is synthetic and not related to real people.

Data Availability Statement

Insider Threat Datasets are hosted by Carnegie Mellon University. https://kilthub.cmu.edu/articles/dataset/Insider_Threat_Test_Dataset/12841247, accessed on 1 August 2025.

Conflicts of Interest

The authors declare no conflicts of interest.

Abbreviations

AccuracyProportion of total predictions that are correct (both benign and anomalous).
PrecisionRatio of true positives to all positive predictions; indicates how many flagged users are actually malicious.
Recall (Sensitivity)Ratio of true positives to all actual malicious users; measures detection completeness.
F1-scoreHarmonic mean of precision and recall; balances false positives and false negatives.
AUROC (Area Under ROC Curve)Measures how well the model separates malicious from benign users across thresholds.
AnomalyA data point that deviates significantly from typical user behaviour patterns.
Isolation ForestAn unsupervised anomaly detection algorithm that isolates outliers using random partitioning.
Imbalanced DatasetA dataset where one class (benign users) vastly outnumbers another (insiders).
False PositiveA benign user was incorrectly flagged as malicious.
False NegativeA malicious user is incorrectly classified as benign.

References

  1. Inayat, U.; Farzan, M.; Mahmood, S.; Zia, M.F.; Hussain, S.; Pallonetto, F. Insider threat mitigation: Systematic literature review. Ain Shams Eng. J. 2024, 15, 103068. [Google Scholar] [CrossRef]
  2. IBM. Cost of Insider Threats: Global Report. 2020. Available online: https://www.ibm.com/downloads/cas/LQZ4RONE (accessed on 20 August 2025).
  3. Green, M.L.; Dozier, P. Understanding Human Factors of Cybersecurity: Drivers of Insider Threats. In Proceedings of the 2023 IEEE International Conference on Cyber Security and Resilience (CSR), Venice, Italy, 31 July–2 August 2023; IEEE: New York, NY, USA, 2023; pp. 111–116. [Google Scholar] [CrossRef]
  4. Moneva, A.; Leukfeldt, R. Insider threats among Dutch SMEs: Nature and extent of incidents, and cyber security measures. J. Criminol. 2023, 56, 416–440. [Google Scholar] [CrossRef]
  5. Williams, M.L.; Levi, M.; Burnap, P.; Gundur, R.V. Under the Corporate Radar: Examining Insider Business Cybercrime Victimization through an Application of Routine Activities Theory. Deviant Behav. 2019, 40, 1119–1131. [Google Scholar] [CrossRef]
  6. Jones, L.A. Unveiling Human Factors: Aligning Facets of Cybersecurity Leadership, Insider Threats, and Arsonist Attributes to Reduce Cyber Risk. Socioecon. Chall. 2024, 8, 44–63. [Google Scholar] [CrossRef]
  7. Homoliak, I.; Toffalini, F.; Guarnizo, J.; Elovici, Y.; Ochoa, M. Insight Into Insiders and IT: A Survey of Insider Threat Taxonomies, Analysis, Modeling, and Countermeasures. ACM Comput. Surv. 2019, 52, 30. [Google Scholar] [CrossRef] [PubMed]
  8. CERT. Common Sense Guide to Mitigating Insider Threats, 7th ed.; CERT: Pittsburgh, PA, USA, 2022; Volume 7, Available online: https://insights.sei.cmu.edu/library/common-sense-guide-to-mitigating-insider-threats-seventh-edition/ (accessed on 9 September 2025).
  9. Nobles, C.; Robinson, N.; Cunningham, M.; Robinson, N.; Cunningham, M.; Cunningham, M. Straight from the Human Factors Professionals’ Mouth: The Need to Teach Human Factors in Cybersecurity. In Proceedings of the 23rd Annual Conference on Information Technology Education, Chicago, IL, USA, 21–24 September 2022; pp. 157–158. [Google Scholar] [CrossRef]
  10. Burrell, D.N.; Nobles, C.; Cusak, A.; Jones, L.A.; Wright, J.B.; Mingo, H.C.; Ferreras-Perez, J.; Khanta, K.; Shen, P.; Richardson, K. Cybersecurity and Cyberbiosecurity Insider Threat Risk Management. In Handbook of Research on Cybersecurity Risk in Contemporary Business Systems; IGI Global: Hershey, PA, USA, 2023; pp. 121–136. [Google Scholar]
  11. Thakkar, A.; Lohiya, R. A survey on intrusion detection system: Feature selection, model, performance measures, application perspective, challenges, and future research directions. Artif. Intell. Rev. 2022, 55, 453–563. [Google Scholar]
  12. Woland, A.T.; Santuka, V.; Harris, M.; Sanbower, J. Cisco Security Solutions for advanced threat protection with next generation firewall, intrusion prevention, AMP, and content security. In Integrated Security Technologies and Solutions, 1st ed.; CCIE Professional Development; Cisco Press: Indianapolis, IN, USA, 2018; Volume I. [Google Scholar]
  13. Ring, M.; Wunderlich, S.; Scheuring, D.; Landes, D.; Hotho, A. A survey of network-based intrusion detection data sets. Comput. Secur. 2019, 86, 147–167. [Google Scholar] [CrossRef]
  14. Liu, L.; Vel, O.D.; Han, Q.L.; Zhang, J.; Xiang, Y. Detecting and Preventing Cyber Insider Threats: A Survey. IEEE Commun. Surv. Tutor. 2018, 20, 1397–1417. [Google Scholar] [CrossRef]
  15. Kim, J.; Chang, H. An Exploratory Study of Security Data Analysis Method for Insider Threat Prevention. In Proceedings of the 2022 13th International Conference on Information and Communication Technology Convergence (ICTC), Jeju Island, Republic of Korea, 19–21 October 2022; IEEE: New York, NY, USA, 2022; pp. 611–613. [Google Scholar]
  16. Catescu, G. Detecting Insider Threats Using Security Information and Event Management (SIEM). Master’s Thesis, University of Applied Sciences Technikum Wien, Wien, Vienna, 2018. [Google Scholar]
  17. Srinivas, J.; Das, A.K.; Kumar, N. Government regulations in cyber security: Framework, standards and recommendations. Future Gener. Comput. Syst. 2019, 92, 178–188. [Google Scholar] [CrossRef]
  18. Khaliq, S.; Abideen Tariq, Z.U.; Masood, A. Role of User and Entity Behavior Analytics in Detecting Insider Attacks; IEEE: New York, NY, USA, 2020; pp. 1–6. [Google Scholar] [CrossRef]
  19. Yousef, R.; Jazzar, M. Measuring the effectiveness of user and entity behavior analytics for the prevention of insider threats. J. Xi’an Univ. Archit. Technol. 2021, 13, 175–181. [Google Scholar] [CrossRef]
  20. Lewellen, G.; Silowash, T. Detecting and Preventing Data Exfiltration Through Encrypted Web Sessions via Traffic Inspection; Software Engineering Institute: Pittsburgh, PA, USA, 2013. [Google Scholar]
  21. Herrera Montano, I.; García Aranda, J.J.; Ramos Diaz, J.; Molina Cardín, S.; de la Torre Díez, I.; Rodrigues, J.J.P.C. Survey of Techniques on Data Leakage Protection and Methods to address the Insider threat. Clust. Comput. 2022, 25, 4289–4302. [Google Scholar] [CrossRef]
  22. Sabir, B.; Ullah, F.; Babar, M.A.; Gaire, R. Machine learning for detecting data exfiltration: A review. ACM Comput. Surv. (CSUR) 2021, 54, 50. [Google Scholar] [CrossRef]
  23. Chung, M.-H.; Yang, Y.; Wang, L.; Cento, G.; Jerath, K.; Raman, A.; Lie, D.; Chignell, M.H. Implementing Data Exfiltration Defense in Situ: A Survey of Countermeasures and Human Involvement. ACM Comput. Surv. 2023, 55, 303. [Google Scholar] [CrossRef]
  24. Greitzer, F.L. Insider Threats: It’s the HUMAN, Stupid! In Proceedings of the Northwest Cybersecurity Symposium, Richland, WA, USA, 8–10 April 2019. [Google Scholar] [CrossRef]
  25. Trang, S.; Brendel, B. A Meta-Analysis of Deterrence Theory in Information Security Policy Compliance Research. Inf. Syst. Front. 2019, 21, 1265–1284. [Google Scholar] [CrossRef]
  26. Greitzer, F.L.; Hohimer, R.E. Modeling Human Behavior to Anticipate Insider Attacks. J. Strateg. Secur. 2011, 4, 25–48. [Google Scholar] [CrossRef]
  27. Kweon, E.; Lee, H.; Chai, S.; Yoo, K. The Utility of Information Security Training and Education on Cybersecurity Incidents: An empirical evidence. Inf. Syst. Front. J. Res. Innov. 2021, 23, 361–373. [Google Scholar] [CrossRef]
  28. Sharif, K.H.; Ameen, S.Y. A Review on Gamification for Information Security Training. In Proceedings of the 2021 International Conference of Modern Trends in Information and Communication Technology Industry (MTICTI), Sana’a, Yemen, 4–6 December 2021; pp. 1–8. [Google Scholar] [CrossRef]
  29. Hwang, I.; Wakefield, R.; Kim, S.; Kim, T. Security Awareness: The First Step in Information Security Compliance Behavior. J. Comput. Inf. Syst. 2021, 61, 345–356. [Google Scholar] [CrossRef]
  30. Rice, C.; Searle, R.H. The Enabling Role of Internal Organizational Communication in Insider Threat Activity—Evidence From a High Security Organization. Manag. Commun. Q. 2022, 36, 467–495. [Google Scholar] [CrossRef]
  31. Elbasheer, M.; Akinfaderin, A. User-Based Sequential Modeling with Transformer Encoders for Insider Threat Detection. arXiv 2025, arXiv:2506.23446. [Google Scholar] [CrossRef]
  32. Tian, T.; Zhang, C.; Jiang, B.; Feng, H.; Lu, Z. Insider threat detection for specific threat scenarios. Cybersecurity 2025, 8, 17–18. [Google Scholar] [CrossRef]
  33. Luckey, D.; Stebbins, D.; Orrie, R.; Rebhan, E.; Bhatt, S.D.; Beaghley, S. Assessing Continuous Evaluation Approaches for Insider Threats; RAND Corporation: Santa Monica, CA, USA, 2019. [Google Scholar]
  34. Georgiadou, A.; Mouzakitis, S.; Askounis, D. Detecting Insider Threat via a Cyber-Security Culture Framework. J. Comput. Inf. Syst. 2022, 62, 706–716. [Google Scholar] [CrossRef]
  35. Greitzer, F.; Purl, J.; Leong, Y.M.; Becker, D.S. SOFIT: Sociotechnical and Organizational Factors for Insider Threat. In 2018 IEEE Security and Privacy Workshops (SPW); IEEE: New York, NY, USA, 2018; pp. 197–206. [Google Scholar] [CrossRef]
  36. Jeong, M.; Zo, H. Preventing insider threats to enhance organizational security: The role of opportunity-reducing techniques. Telemat. Inform. 2021, 63, 101670. [Google Scholar] [CrossRef]
  37. Anwar, M.; He, W.; Ash, I.; Yuan, X.; Li, L.; Xu, L. Gender difference and employees’ cybersecurity behaviors. Comput. Hum. Behav. 2017, 69, 437–443. [Google Scholar] [CrossRef]
  38. Elmrabit, N.; Yang, S.-H.; Yang, L.; Zhou, H. Insider Threat Risk Prediction based on Bayesian Network. Comput. Secur. 2020, 96, 101908. [Google Scholar] [CrossRef]
  39. Whitty, M.T. Developing a conceptual model for insider threat. J. Manag. Organ. 2021, 27, 911–929. [Google Scholar] [CrossRef]
  40. Kim, B.; Lee, D.-Y.; Kim, B. Deterrent effects of punishment and training on insider security threats: A field experiment on phishing attacks. Behav. Inf. Technol. 2020, 39, 1156–1175. [Google Scholar] [CrossRef]
  41. Uchendu, B.; Nurse, J.R.C.; Bada, M.; Furnell, S. Developing a cyber security culture: Current practices and future needs. Comput. Secur. 2021, 109, 102387. [Google Scholar] [CrossRef]
  42. Ye, X.; Cui, H.; Luo, F.; Wang, J.; Xiong, X.; Zhang, W.; Yu, J.; Zhao, W. Daily insider threat detection with hybrid TCN transformer architecture. Sci. Rep. 2025, 15, 28590. [Google Scholar] [CrossRef] [PubMed]
  43. Zenitani, K. Attack graph analysis: An explanatory guide. Comput. Secur. 2023, 126, 103081. [Google Scholar] [CrossRef]
Figure 1. PRISMA process flow.
Information 17 00627 g001
Figure 2. Architecture overview.
Information 17 00627 g002
Figure 3. Data processing pipeline for insider threat analytics.
Information 17 00627 g003
Figure 4. ROC Comparison.
Information 17 00627 g004
Figure 5. Accuracy Comparison.
Information 17 00627 g005
Figure 6. Precision Comparison.
Information 17 00627 g006
Figure 7. F1 by Stage.
Information 17 00627 g007
Figure 8. Iso-F1.
Figure 8. Iso-F1.
Information 17 00627 g008
Table 1. PRISMA search and analysis approach.
PRISMA PhaseDescriptionApplication to Insider Threat Research
IdentificationDatabase search and web searches.Searches were conducted using the Glasgow Caledonian University (GCU) Library search, which included a wide variety of databases and academic institutions globally. Further searches used Google Scholar.
IdentificationType of documents/research.Peer-reviewed journals
Theses and Dissertations
Conference Papers
Archives and Special Collections
Search DatesYear of publication2019–2026
ScreeningTitle and abstract reviewRemoval of duplicates and exclusion of non-cyber, non-organisational, or irrelevant studies.
EligibilityFull-text assessmentAssessment of methodological rigour and relevance to behavioural, technical, or organisational insider threat dimensions. Also looking for papers using the CERT dataset.
IncludedFinal studies retainedStudies were included based on qualitative synthesis and thematic analysis across insider threat domains.
Table 2. Search terms.
Search Terms
Insider Threats
Cybersecurity Insider Threats
Insider Threats Behavioural Studies
Insider Threat Defence Strategies
Insider Threat summary papers
Cybersecurity Insider Threat Technologies
Insider Threat Literature Review Summary
Cybersecurity threats, malware trends and strategies
Insider Threat Taxonomy
Cybersecurity insider threat strategies (including AI, ML, LLM)
Insider Threat + CERT
CERT r6.2 plus older versions of CERT.
Table 3. Breakdown of PRISMA research.
Research Method/TypeCountPercentage of 120
Experimental 2218.33%
Literature review 75.83%
Framework/taxonomy/conceptual model119.17%
Survey/questionnaire32.50%
Behavioural (Human Factors)6554.17%
Training/education evaluation108.33%
Thesis/dissertation21.67%
Table 4. Document type.
DocumentCount
Peer-reviewed articles109
Conference papers9
Thesis2
Sample Total120
Table 5. Research main categorisation themes. Research may be counted in more than one area.
AreaThemes
Behavioural78
Technical Controls52
Artificial Intelligence3
Culture3
Education2
Framework8
Machine Learning5
Risk1
Table 6. Research emphasis by primary theme.
Primary ThemeRelative CoverageSynthesised Interpretation
BehaviouralVery HighInsider threat is primarily driven by psychological, emotional, and motivational factors.
TechnicalModerateDetection technologies are more effective when contextualised with human behaviour.
Framework/TaxonomyModerateTaxonomies unify malicious and non-malicious insider behaviours.
OrganisationalModeratePositive security mitigates insider risk more effectively than surveillance alone.
Table 7. Behavioural indicators that could potentially identify an inside threat. Greitzer et al.
ClassificationBehavioural Indicator
Concerning Work HabitsWorking offsite, unusual hours
Working unusual hours on a work-owned machine
Working at unusual hours
Problems w/CoworkersWorkplace violence
Intimidating behaviours
Verbal abuse/bullying
Minor Policy ViolationUnauthorised foreign travel
Unreported contact w/foreign nationals
Negligence in following procedures
AttendanceExcessive absences
Frequent early departures
Lateness
Cybersecurity ViolationAttempts to access the system against policy
Attempts to access prohibited file-sharing websites
Failed attempts to exercise privilege
AttitudeDisgruntlement
Overly Critical
Overly competitive
Personality DimensionsHigh in risk-taking
Low conscientiousness
Disagreeableness
Dark Triad Manipulative
Big ego/self-centred
Callousness
Table 8. Worked example of composite risk generation.
StageData StreamAnomaly ScoreWeightContribution
1Logon0.911.21.09
2Device0.731.00.73
3Psychometric0.820.60.49
4Email0.941.00.94
5User Profile0.650.50.33
6HTTP0.891.00.89
Table 9. All five insiders were detected (100% Recall).
MetricResult/Interpretation
Accuracy (0.68)68% of all users were correctly classified as normal or anomalous.
Precision (0.004)Only 0.4% of flagged users were true insiders, indicating many false positives. Note: In this context, false positives are non-malicious employees.
Recall (1.00)All known insiders were successfully identified (no misses).
F1-score (0.008)Low F1 score due to low precision despite perfect recall.
AUROC (0.93)Strong separability of insider vs. benign users across the risk spectrum.
Table 10. Comparison of this study against Elbasheer and Akinfaderin (2025) [31].
Model/StudyDatasetMethodologySample SizeInsider SizeAccuracyPrecisionRecallF1-ScoreAUROC
Elbasheer & Akinfaderin (2025) [31]CERT r4.2Transformer + Ensemble (OCSVM/LOF/iForest)30700.990.98591.000.99291.00
Elbasheer & Akinfaderin (2025) [31]CERT r5.2Transformer + Ensemble (OCSVM/LOF/iForest)60990.930.901.000.9470.90
Elbasheer & Akinfaderin (2025) [31]CERT r6.2Transformer + Ensemble (OCSVM/LOF/iForest)12050.940.421.000.590.97
This Study (2025)CERT r6.27-Stage Isolation Forest Ensemble400050.680.0041.000.0080.93
Table 11. Composite Risk Weights.
StageData StreamWeight UsedInsider Detection (Per Stage)
1Logon1.25/5 insiders flagged
2Device1.04/5 insiders flagged
3Psychometric0.65/5 insiders flagged
5Email1.05/5 insiders flagged
6User Profile0.55/5 insiders flagged
7HTTP1.05/5 insiders flagged
8Decoy Activity1.80/5 insiders (no data)
Table 12. FPR and TPR Comparison.
FPRThis Research Model TPRElbasheer & Akinfaderin (2025) TPR [31]Random TPR
0.00000.00000.00000.0000
0.00500.01770.01450.0050
0.01010.03490.02860.0101
0.01510.05160.04230.0151
0.02010.06770.05560.0201
FPR = False Positive Rate; TPR = True Positive Rate.
Disclaimer/Publisher’s Note: The statements, opinions and data contained in all publications are solely those of the individual author(s) and contributor(s) and not of MDPI and/or the editor(s). MDPI and/or the editor(s) disclaim responsibility for any injury to people or property resulting from any ideas, methods, instructions or products referred to in the content.