2. State of the Art
Due to concrete components variability, accurately interpreting the relationship among concrete mix constituents, properties and proportions is one of the more complex tasks to be achieved by concrete researchers, and one of the potentially significant concrete mix optimization research contributions that requires costly and time-consuming empirical testing consisting of lab-based experimentation and daunting mathematical calculations [
14].
In recent years, ML techniques have gained significant attention for identifying patterns that are difficult to recognize and reproduce by human empirical tests. However, the literature confirms that collecting, selecting, preparing, and processing large, diverse datasets to train ML algorithms represents a significant challenge for AI in industry processes, and hurdles remain in terms of choosing the most suitable approach to optimize ML predictive models [
15]. In this context, concrete researchers and scholars are focused on integrating experimental research and ML techniques to ultimately converge on an accurate and efficient pathway to model and predict complex non-linear interactions among concrete mix design parameters, properties, and performance derived from extensive data sets trained in ML models; Artificial Neural Networks (ANNs), Support Vector Machine (SVM), Decision Trees (DTs), Random Forest Regressor (RFR), XGBoost Regressor (XGBR), and Genetic Algorithms (GA) successfully validated for: (1) The inclusion of a wider range of input variables for addressing environmental, performance, and cost demands of contemporary concrete designs. (2) Large dataset training without the need for costly and time-consuming experimental tests. (3) Accurately correlating the influence of variables on concrete mix design to provide significant support to concrete industry processes with reliable databases and application of suitable algorithms, model optimization, and a friendly user platform [
14]. These three objectives aligned with 4.0 industry efficiency goals are considered in industry 5.0 as part of a global resilient sustainable manufacturing plan supported by automated ML prediction models that will make possible “for humans and machines, not only to operate, but also to learn together, transforming today’s smart factory into a self-learning factory” [
12]. Self-learning factories transforming data into reliable and valuable information with the aid of experience, context, interpretation, reflection, and the support of technological tools are laying the ground for more decentralized Manufacturing Execution Systems (MESs) that will allow industries to reduce costs, increase efficiency, and achieve more sustainable industry processes [
3,
4].
In this challenging technological context, the more carefully the variables used in a model are selected, the more reliable the model becomes for supporting decision-making processes in industrial applications [
16]. Regarding the concrete industry, achieving more sustainable production processes by reducing cement consumption [
7] and limiting the exploitation of natural aggregates has become a major research objective. Several aggregate-alternative concrete mix optimization approaches have been proposed, including the use of waste materials such as concrete demolition waste (CDW), end-of-life manufactured material waste, and recycled forest or agricultural residues. However, these approaches are often limited by the difficulty of accurately estimating the optimal recycled content while complying with construction standards [
17]. In the same research line, several studies have investigated the influence of crushed fine aggregates on mortar rheological properties such as workability, yield stress, and plastic viscosity. These studies have shown that the irregular particle shape of heterogeneous crushed aggregates may limit the ability to achieve suitable aggregate grading. As a consequence, mixtures may require higher water demand, which can reduce workability and increase yield stress and plastic viscosity, ultimately leading to higher cement consumption. Other aggregate replacement approaches, such as the use of fly-ash-based geopolymer mortar, have shown that as long as proper aggregate grading is achieved, geopolymer binders can reach higher tensile, compressive, and transverse strengths. Marine sediment-based aggregate replacement, in contrast, often resulted in reduced mechanical performance and lower workability due to the additional water demand required. As a result, this latter approach has been mainly limited to non-structural concrete elements [
5]. In this context, the literature confirms that optimizing aggregate packing density and selecting suitable aggregate physico-chemical, petrographic, and morphological properties can significantly improve concrete and mortar mix performance while reducing cement consumption.
Regarding the impact of aggregate particle packing density optimization on mix designs, Kosmatka states that fewer voids to be filled with a lower w/c ratio will produce a homogeneous particle size distribution of aggregates, resulting in higher mix density and suitable workability [
18]. In general, aggregates that show a smooth grading curve for suitable aggregate particle packing and higher density will produce the most satisfactory mix designs. “To achieve the best mechanical properties, concrete must have a granular skeleton packed as densely as possible, and the amount of cement paste necessary to fill the voids it leaves.” [
19]. Further, the shape and particle size distribution of fine aggregates have also been demonstrated to have a great impact on mortar mix properties, water demand, and the overall mortar mix design optimization [
6,
20,
21]. Some other investigations support this theory, confirming that mortar strength and absorptivity are mainly ruled by the packing density of the mixture, independently of the grading and the shape of sand used to demonstrate that packing density represents a determinant mortar property [
10]. As for fine aggregates, they represent three-quarters of mortar mix designs, with the quality control of their properties essential to improve the mix interface transition zone (ITZ) in which the durability and strength of the composite is set.
Objective
This study aims to develop a hybrid grey-box framework that integrates petrographic and morphological descriptors into a decision-support model. The framework integrates petrographic composition, morphological descriptors, and particle packing theory to optimize aggregate selection, reduce cement paste demand, and improve mixture efficiency. The proposed approach seeks to assess the interplay between petrographic composition, particle morphology, and packing density in mortar systems.
Specific objectives:
Normalization of qualitative aggregate descriptors (petrographic and morphological) into numerical indices to enable quantitative analysis and their integration into machine learning models [
22].
To experimentally characterize the packing density of mortar mixtures and the physicochemical, morphological, and petrographic properties of fine aggregates, including uncompacted void content [
23], particle shape, surface texture, and petrographic composition.
To develop an RFR model capable of predicting the transverse strength of mortar mixtures using physically meaningful mixture-level descriptors.
To implement a strength-constrained optimization framework based on the Paste Demand Index (PDI), integrating aggregate packing density and physicochemical, morphological, and petrographic descriptors to identify aggregate blends with cement-reduction potential.
Despite the growing body of research on mortar and concrete mix optimization, most existing studies rely on empirical mix design approaches or data-driven models that do not explicitly incorporate physically meaningful descriptors of aggregate characteristics. In particular, the combined influence of petrographic composition, particle morphology, and packing density on mortar performance remains insufficiently explored within machine learning frameworks.
The main contribution of this study aims toward the development of a physics-informed machine learning framework that integrates aggregate petrographic, morphological, and packing-related descriptors into a predictive model for mortar mixture optimization. Unlike previous approaches, the proposed framework links physically interpretable aggregate properties with data-driven prediction to identify aggregate combinations that maintain mechanical performance while reducing cement paste demand.
3. Methodology
This section presents the overall methodology adopted in this study. The proposed framework integrates experimental characterization of fine aggregates, mortar mixture preparation and testing, and a machine learning-based modeling approach to predict transverse strength while optimizing aggregate combinations.
The methodology is structured into four main stages: (1) experimental design and mortar mixture preparation, (2) characterization of aggregate physical, morphological, and petrographic properties, (3) development and validation of an RFR model, and (4) optimization of aggregate combinations based on a strength-constrained Paste Demand Index (PDI).
4. Optimization and Paste Demand Index (PDI)
4.3. Workability and Paste Demand Index
To support the interpretation of fresh-state behavior in semi-dry systems, a workability score (WS) was defined as:
where
,
, and
are normalized variables representing uncompacted void content, surface texture, and particle shape, respectively. The adopted weights (
,
,
) reflect the dominant influence of packing efficiency, followed by frictional and interlocking effects.
The workability score should be interpreted as a relative indicator of compactability derived from aggregate properties and packing characteristics. In zero-slump systems, where conventional rheological tests are not applicable, such indicators provide a consistent basis for comparing mixtures under identical conditions rather than an absolute measure of workability. Therefore, the WS is explicitly defined as a compactability proxy for extrusion-based manufacturing, distinct from standard rheological flow measurements.
To evaluate paste demand, a Paste Demand Index (PDI) was defined as:
where lower PDI values indicate mixtures with improved packing efficiency and reduced expected paste demand.
The weighting factors (, , ) were defined based on their relative physical contribution to paste demand. Uncompacted void content (U) was assigned the highest weight due to its direct volumetric relationship with the paste required to fill inter-particle voids, representing the primary governing mechanism in excess paste theory. Surface texture (T) was assigned an intermediate weight, as it influences inter-particle friction and affects particle rearrangement during compaction. Particle shape (S) was assigned the lowest weight, reflecting its secondary role in geometric interlocking.
This hierarchical scheme (
) is consistent with particle packing theory and established frameworks such as excess paste theory and compressible packing models [
24]. The PDI is intended as a physically interpretable ranking metric rather than a predictive model, and its linear formulation was adopted to preserve transparency.
To evaluate the robustness of the proposed formulation, a sensitivity analysis was conducted by varying the weighting factors and normalized indices within a range of , while preserving their relative ordering. The results indicate that these variations do not significantly affect model predictions or the relative ranking of candidate mixtures.
Furthermore, the framework combines these physically based descriptors with a non-linear RFR model, which captures interaction effects (e.g., loosening and wall effects) not accounted for by linear approximations. Therefore, although the weights are not obtained through numerical optimization, they are physically grounded and yield consistent and objective decision-making outcomes without the need for parameter fitting.
5. Machine Learning-Based Optimization Framework
The objective of this machine learning (ML) framework is to develop a surrogate model capable of predicting the transverse strength of mortar mixtures based on physically interpretable descriptors and aggregate characteristics. In this framework, transverse strength is defined as the dependent variable, while mix design parameters, aggregate physical/morphological descriptors, and packing-related indices serve as independent variables. The input features include curing age, water-to-cement ratio, fresh density, packing density, uncompacted void content, fineness modulus, shape index, particle density, texture index, and petrographic index.
The overall workflow consists of dataset construction, preprocessing, model training, validation, and optimization. To capture non-linear relationships between these descriptors and transverse strength, the model was implemented using a Random Forest Regressor. RFR was selected as the core predictive engine due to its optimal balance between non-linear predictive power and physical interpretability. Given the dataset size () and the intricate dependencies between aggregate morphology and paste demand, RFR proves superior to both simple linear approximations and over-parameterized ‘black-box’ deep learning architectures. Furthermore, the model’s capacity for feature importance analysis enables a direct interpretation of how each physical descriptor influences mortar performance, aligning with our objective of maintaining a grounded engineering approach. To validate the model’s robustness and mitigate overfitting, a 5-fold cross-validation procedure was systematically implemented. The consistent performance observed across the five folds provides a quantitative measure of reliability, which serves as the statistical foundation for the uncertainty management within our proposed decision-support framework.
5.2. Data Preprocessing
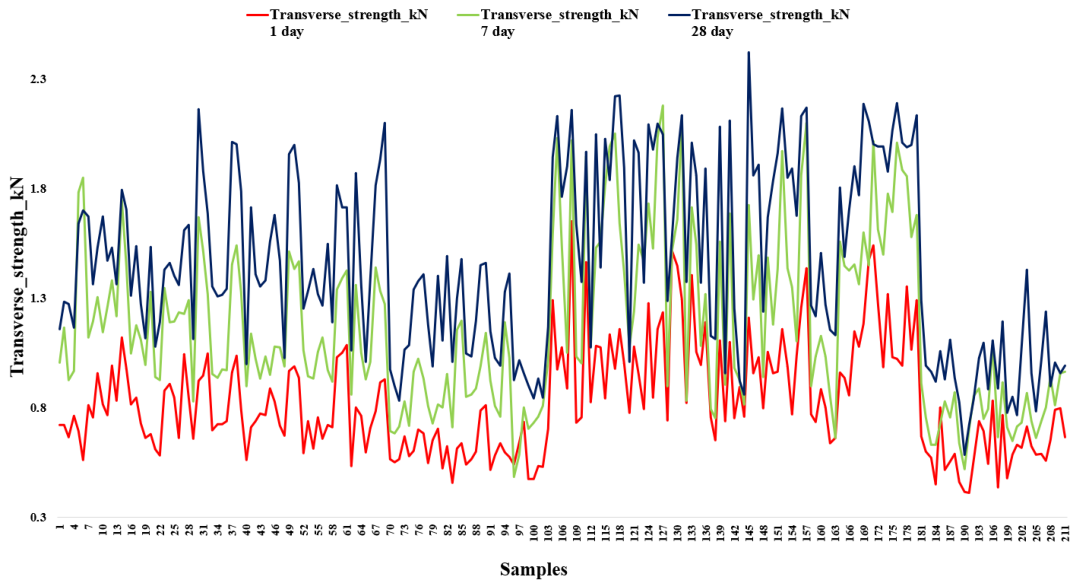
To ensure robust model training, all records were first filtered for completeness and physical consistency, including validation of mixture proportions summing to 100% and correct assignment of curing ages (1, 7, and 28 days). A fixed random seed was used throughout preprocessing and model training to ensure reproducibility. Although the dataset includes 633 observations, these correspond to 211 unique mixture compositions evaluated at three curing ages. For each mixture and curing age, transverse strength was calculated as the average of replicate specimens, yielding a single representative value for each mixture–age condition. This approach reduces experimental noise and avoids pseudo-replication in the machine learning dataset.
To prevent information leakage and overestimation of model performance, the dataset was split at the mixture level rather than at the individual record level. Each mixture corresponds to a unique composition tested at three curing ages, generating three associated records. All records belonging to the same mixture were grouped and assigned entirely to either the training or testing subset. An 80/20 partition was applied to the set of unique mixtures, resulting in independent training and testing subsets composed of distinct compositions. This grouped splitting strategy ensures that all observations associated with a given mixture are assigned to a single subset, thereby preventing information leakage and enabling model evaluation on unseen mixtures.
To assess the representativeness of the training and testing subsets, descriptive statistics of key input variables—including uncompacted void content (
U), particle shape index, surface texture, petrographic, and packing density indices—were compared between both subsets (
Table 10). The comparison indicates that the distributions are consistent, with similar mean values, dispersion, and ranges across both subsets. This confirms that the testing set adequately represents the variability of the entire dataset, thereby supporting an unbiased evaluation of the model’s performance.
Regarding variable representation, the selected input variables consist of physically meaningful descriptors expressed on comparable scales. Consequently, no additional feature scaling was required for the Random Forest Regressor (RFR) model, as this algorithm is inherently insensitive to variable scaling. Descriptive statistics were further analyzed to define the model’s domain of validity and to prevent extrapolation beyond the experimental range, which is critical for evaluating virtual mixtures during the optimization stage.
Categorical descriptors related to particle morphology and petrographic composition were transformed into continuous indices within the [0, 1] range using an ordered scaling scheme. This transformation enables their integration into the machine learning model while preserving the ordinal nature of the original classifications. The assigned scaling follows a physically informed hierarchy, in which increasing values represent higher angularity, surface roughness, or mineralogical complexity—characteristics known to influence inter-particle friction, particle interlocking, and ultimately packing efficiency.
Although an equidistant scaling was adopted for simplicity and interpretability, this represents a linear approximation of potentially non-linear physical effects. However, given that the model is intended for the relative comparison and ranking of mixtures rather than precise absolute prediction, minor variations in the assigned indices are not expected to significantly impact the comparative evaluation of mixtures within the defined experimental domain. This assumption is further supported by the observed stability of model predictions and mixture rankings. Finally, a sensitivity analysis conducted by varying the assigned index values within a reasonable range confirmed that these variations do not significantly affect model predictions or the relative ranking of mixtures, indicating that the adopted scaling does not introduce bias into the modeling framework.
6. Discussion
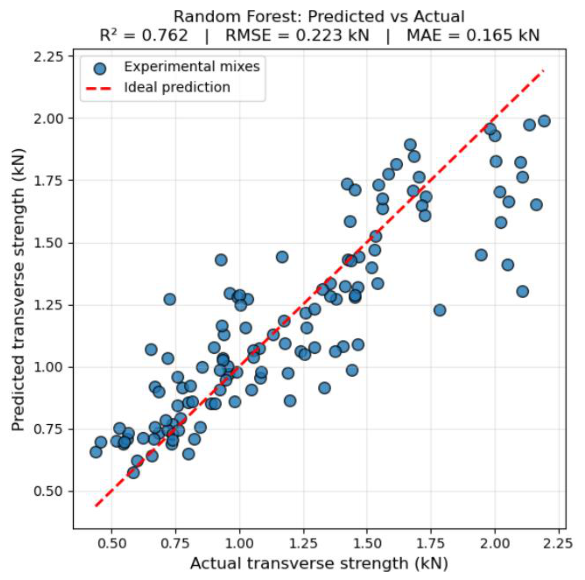
The predictive performance of the model must be interpreted within the context of industrial data. Although the of 0.762 is moderate by controlled laboratory standards, it reflects a high degree of industrial fidelity, capturing the inherent variability in quarry-derived mineralogy and moisture fluctuations. Thus, the model demonstrates robust generalizability within the operational boundaries of semi-dry mortar production.
This study specifically targets semi-dry roofing tile production, where compactability and green strength prevail over traditional rheological parameters. In these zero-slump systems, workability is defined by the mixture’s ability to consolidate under high-pressure extrusion. This domain-specific focus enables a high-resolution optimization framework; however, it limits direct applicability to other rheological regimes, and extrapolation to high-slump or self-compacting systems warrants further validation.
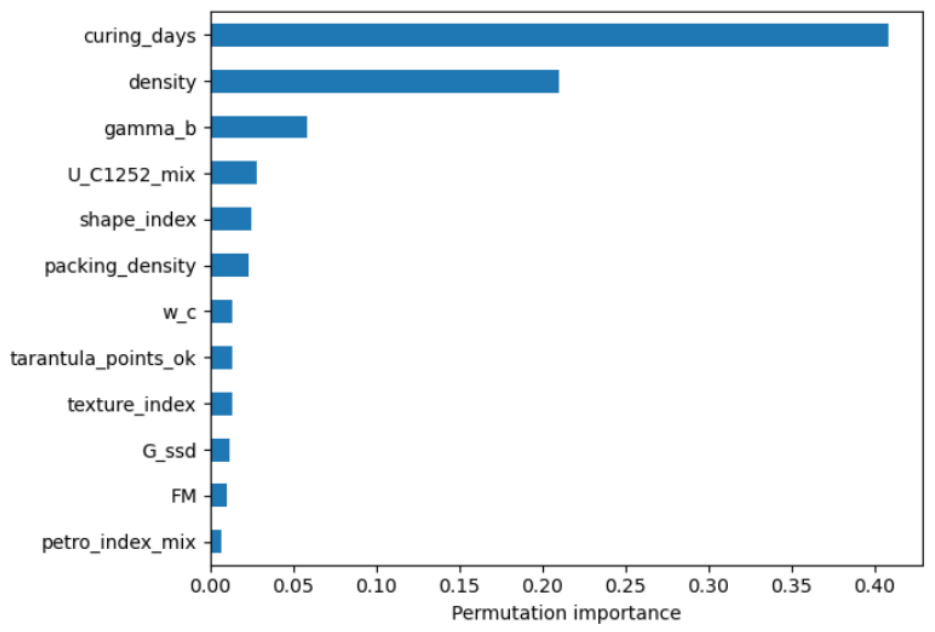
The results confirm that transverse strength is governed by aggregate packing characteristics. Specifically, uncompacted void content emerges as the primary factor influencing paste demand and mechanical performance, while particle shape and surface texture act as secondary modifiers of inter-particle friction. The machine learning model captures these nonlinear relationships by integrating physically interpretable descriptors—such as packing indices, morphology, and petrographic properties—thereby ensuring the physical consistency of the proposed framework.
This framework is primarily designed as a robust computational screening tool for identifying promising regions within the design space rather than a high-precision deterministic predictor. By interpreting model outputs as expected performance ranges, we effectively mitigate the impact of inherent model variance while maintaining a physically grounded basis for decision support. Consequently, any industrial implementation should be accompanied by confirmatory experimental validation. Future work is already underway to bridge this gap, focusing on laboratory-scale testing of the optimal mixtures identified by the model. This multi-phase strategy—transitioning from high-resolution digital screening to targeted experimental verification—ensures the necessary balance between industrial performance and efficient resource consumption.
Regarding workability, the proposed score serves as a physically informed proxy for compactability, addressing a critical gap where conventional rheological tests are inapplicable. Optimization results demonstrate the feasibility of reducing paste demand while maintaining mechanical performance within acceptable limits. Although an estimated cement reduction of 5–10% may appear modest, its significance at the industrial scale is substantial. Given that cement production accounts for approximately 8% of global anthropogenic CO
2 emissions [
25], a 5% clinker reduction—achieved solely through aggregate skeleton optimization—represents an efficient, readily implementable sustainability strategy.
Furthermore, optimal mixtures are not necessarily those that maximize strength, but rather those that balance packing efficiency and mechanical performance, highlighting the importance of aggregate characteristics as key design variables. While the recent literature increasingly applies machine learning to cementitious materials [
26], direct comparisons remain limited by variations in datasets and evaluation metrics. Unlike existing approaches focused on high-workability concrete and bulk parameters [
27], this study addresses zero-slump systems where particle interactions dominate. By incorporating the Paste Demand Index (PDI), this framework bridges the gap between purely data-driven models and particle packing theory, offering a mechanistically grounded approach.
Ultimately, the contribution of this work lies in the development of a physically informed, interpretable, and industrially applicable framework for mixture optimization under constrained conditions.
Author Contributions
Methodology, A.F.S.G.; validation, V.F.L.B., M.N.M.-G. and M.D.M.V.; investigation, J.F.S.G.; resources, A.F.S.G.; writing—original draft, J.F.S.G.; writing—review and editing, J.F.S.G.; visualization, M.N.M.-G. and M.D.M.V.; supervision, V.F.L.B. and A.F.S.G.; project administration, M.N.M.-G.; funding acquisition, M.N.M.-G. All authors have read and agreed to the published version of the manuscript.
Funding
This research was funded by the Regional Ministry of Education of the Junta de Castilla y León (Spain). Project SA061G24, under ORDEN EDU/740/2024 19 July 2024.
Institutional Review Board Statement
Not applicable.
Informed Consent Statement
Not applicable.
Data Availability Statement
The data used for this study are subject to restrictions in order to protect proprietary information. The original contributions presented in this study are included in the article. Further inquiries can be directed to the corresponding author.
Acknowledgments
The authors gratefully acknowledge Wienerberger Ltd. for providing access to the experimental data generated at the company’s Central Laboratory. Special thanks are extended to the laboratory staff for conducting the material preparation, curing procedures, and mechanical testing that made this study possible. The authors also gratefully acknowledge the University of Salamanca, through its Department of Computer Science and Automation, for the institutional support provided during the development of this research. The first author acknowledges the financial support provided by the Secretaría de Ciencia, Humanidades, Tecnología e Innovación (SECIHTI), Government of Mexico (2024–2030), through the national scholarship program that supported the doctoral studies associated with this research.
Conflicts of Interest
Author Aldo Fernando Sosa Gallardo was employed by the company Concrete Technologist, Operations Technical Management, Wienerberger Ltd. The remaining authors declare that the research was conducted in the absence of any commercial or financial relationships that could be construed as a potential conflict of interest.
References
- Zheng, W.; Shui, Z.; Xu, Z.; Gao, X.; Zhang, S. Multi-objective optimization of concrete mix design based on machine learning. J. Build. Eng. 2023, 76, 107396. [Google Scholar] [CrossRef] [Scilit]
- Damineli, B. Influence of packing and dispersion of particles on the cement content of concretes. IBRACON Struct. Mater. J. 2017, 10, 998–1024. [Google Scholar] [CrossRef] [Scilit]
- Almada-Lobo, F. The Industry 4.0 revolution and the future of manufacturing execution systems (MES). J. Innov. Manag. 2015, 3, 16–21. [Google Scholar] [CrossRef] [Scilit]
- Figueiredo, M.S.; Pereira, A.M. Managing knowledge: The importance of databases in scientific production. Procedia Manuf. 2017, 12, 166–177. [Google Scholar] [CrossRef] [Scilit]
- Couvidat, J. Feasibility of reused and processed contaminated marine sediments as fine aggregates in cemented mortars. Constr. Build. Mater. 2016, 112, 892–902. [Google Scholar] [CrossRef] [Scilit]
- Chouhan, H.S.; Kalla, P.; Nagar, R.; Gautam, P.K. Influence of dimensional stone waste on mechanical and durability properties of mortar: A review. Constr. Build. Mater. 2019, 227, 116662. [Google Scholar] [CrossRef] [Scilit]
- Li, H.; Gao, P.; Xu, F.; Sun, T.; Zhou, Y.; Zhu, J.; Peng, C.; Lin, J. Effect of fine aggregate particle characteristics on mechanical properties of fly ash-based geopolymer mortar. Minerals 2021, 11, 897. [Google Scholar] [CrossRef] [Scilit]
- Lamou, S.B.; Leroy, M.N.; Blanche, M.M.; Richard, M.J.; Japhet, T.W.; Elat, E.; Pliyad, P.; Elie, K. Influence of the mineralogical composition of aggregates from quarries on physical–mechanical, microstructural and durability properties of mortar. Int. J. Civ. Eng. 2025. [Google Scholar] [CrossRef] [Scilit]
- Ferreira, R.L.; Medeiros, M.; Pereira, J.E.; Henriques, G.F.; Tavares, J.C.; Marvila, M.T.; de Azevedo, A.R. Effects of particle size distribution of standard sands on the physical–mechanical properties of mortars. Materials 2023, 16, 844. [Google Scholar] [CrossRef] [Scilit] [PubMed]
- Gonçalves, J.P. Comparison of natural and manufactured fine aggregates in cement mortars. Cem. Concr. Res. 2007, 37, 924–932. [Google Scholar] [CrossRef] [Scilit]
- Bertolini, M.; Mezzogori, D.; Neroni, M.; Zammori, F. Machine learning for industrial applications: A comprehensive literature review. Expert Syst. Appl. 2021, 175, 114820. [Google Scholar] [CrossRef] [Scilit]
- Golovianko, M.; Terziyan, V.; Branytskyi, V.; Malyk, D. Industry 4.0 vs. Industry 5.0: Co-existence, transition, or a hybrid. Procedia Comput. Sci. 2023, 217, 102–113. [Google Scholar] [CrossRef] [Scilit]
- Xu, X.; Lu, Y.; Vogel-Heuser, B.; Wang, L. Industry 4.0 and Industry 5.0: Inception, conception and perception. J. Manuf. Syst. 2021, 61, 530–535. [Google Scholar] [CrossRef] [Scilit]
- Ziolkowski, P.; Niedostatkiewicz, M. Machine learning techniques in concrete mix design. Materials 2019, 12, 1256. [Google Scholar] [CrossRef] [Scilit] [PubMed]
- Oviedo, A.I.; Londoño, J.M.; Vargas, J.F.; Zuluaga, C.; Gómez, A. Modeling and optimization of concrete mixtures using machine learning estimators and genetic algorithms. Modelling 2024, 5, 34. [Google Scholar] [CrossRef] [Scilit]
- Pérez, J. Introducción a los Modelos de Optimización; Universidad Piloto de Colombia: Bogotá, Colombia, 2019. [Google Scholar]
- Dias, S.; Almeida, J.; Tadeu, A.; de Brito, J. Alternative concrete aggregates—Review of physical and mechanical properties and successful applications. Cem. Concr. Compos. 2024, 152, 105663. [Google Scholar] [CrossRef] [Scilit]
- Kosmatka, S.H.; Panarese, W.C.; Kerkhoff, B. Design and Control of Concrete Mixtures; Portland Cement Association: Washington, DC, USA, 2002. [Google Scholar]
- Chan, J.L. Packing Density and Its Influence on the Properties of Concrete. Ph.D. Thesis, University of Hong Kong, Hong Kong, 2003. [Google Scholar]
- Señas, L.; Priano, C.; Marfil, S. Influencia del Agregado Fino en Morteros Cementíceos de Alta Resistencia; Centro de Geología Aplicada, Universidad Nacional del Sur: Bahía Blanca, Argentina, 2017. [Google Scholar]
- Vandhiyan, R.; Vijay, T.J.; Kumar, M. Effect of fine aggregate properties on cement mortar strength. Mater. Today Proc. 2021, 37, 2019–2026. [Google Scholar] [CrossRef] [Scilit]
- ASTM D3398–00; Standard Test Method for Index of Aggregate Particle Shape and Texture. ASTM International: West Conshohocken, PA, USA, 2000.
- ASTM C1252–06; Standard Test Method for Uncompacted Void Content of Fine Aggregate. ASTM International: West Conshohocken, PA, USA, 2006.
- De Larrard, F. Concrete Mixture Proportioning: A Scientific Approach; E & FN Spon: London, UK, 1999. [Google Scholar]
- Miller, S.A.; Horvath, A.; Monteiro, P.J. Impacts of booming concrete production on water resources worldwide. Nat. Sustain. 2018, 1, 69–76. [Google Scholar] [CrossRef] [Scilit]
- Gamil, Y. Machine learning in concrete technology: A review of current researches, trends, and applications. Front. Built Environ. 2023, 9, 1145591. [Google Scholar] [CrossRef] [Scilit]
- Bagheri, A.; Nazari, A.; Sanjayan, J. The use of machine learning in boron-based geopolymers: Function approximation of compressive strength by ANN and GP. Measurement 2019, 141, 241–249. [Google Scholar] [CrossRef] [Scilit]
Figure 1.
Transverse strength (kN) vs. samples.
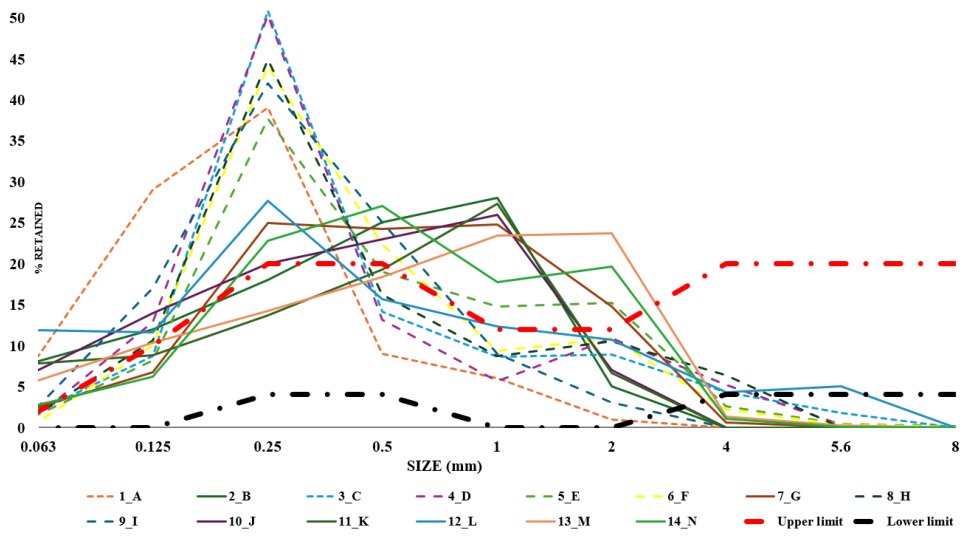
Figure 2.
Sieve size distribution—tarantula curve.
Figure 3.
Comparison between experimental and predicted transverse strength values.
Figure 4.
Relative importance of aggregate descriptors in strength prediction.
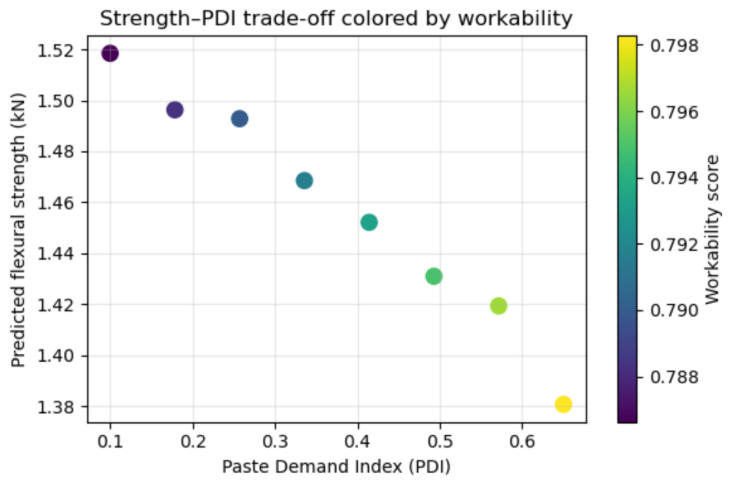
Figure 5.
Trade-off between predicted transverse strength and Paste Demand Index (PDI), colored by workability score. Mixtures with low PDI achieve higher strength but lower workability, reflecting reduced paste availability for lubrication. Optimal mix selection depends on the balance between mechanical performance and compactability requirements.
Table 1.
Mortar mix proportions.
| Compound | Kg |
|---|
| Cement | 1.79 |
| Fine aggregate | 7.31 |
| w/c | 0.38–0.50 |
Table 2.
Chemical composition of fine aggregates.
| Compound | 1_A | 2_B | 3_C | 4_D | 5_E | 6_F | 7_G | 8_H | 9_I | 10_J | 11_K | 12_L | 13_M | 14_N |
|---|
| SiO2 | 82.98 | 52.18 | 92.15 | 93.64 | 94.04 | 92.64 | 68.96 | 93.42 | 93.74 | 71.20 | 53.48 | 93.44 | 68.97 | 79.42 |
| Al2O3 | 6.40 | 12.16 | 2.18 | 2.11 | 2.00 | 2.11 | 14.56 | 2.64 | 2.18 | 14.70 | 15.16 | 2.24 | 14.82 | 2.67 |
| Fe2O3 | 2.95 | 9.13 | 3.45 | 2.90 | 2.70 | 2.90 | 2.95 | 1.86 | 1.51 | 1.63 | 8.13 | 1.17 | 2.96 | 1.97 |
Table 3.
Petrographic classification and normalized indices (0–1).
| Sand | Aggregate Type | Type Index |
|---|
| 1_A | Crushed sandstone | 0.60 |
| 2_B | Tuff | 0.75 |
| 3_C | Quartz | 0.00 |
| 4_D | Quartzose | 0.15 |
| 5_E | Quartz | 0.00 |
| 6_F | Quartz | 0.00 |
| 7_G | Recycled material | 1.00 |
| 8_H | Quartz | 0.00 |
| 9_I | Quartz | 0.00 |
| 10_J | Granite | 0.40 |
| 11_K | Tuff | 0.75 |
| 12_L | Gravel | 0.50 |
| 13_M | Granite | 0.40 |
| 14_N | Recycled material | 1.00 |
Table 4.
Morphological classification and normalized indices (0–1).
| Sand | Particle Shape | Shape Index | Surface Texture | Texture Index |
|---|
| 1_A | Angular to sub-angular | 0.835 | Rough to moderately rough | 0.835 |
| 2_B | Angular to sub-angular | 0.835 | Rough to moderately rough | 0.835 |
| 3_C | Angular to rounded | 0.500 | Rough to smooth | 0.500 |
| 4_D | Angular to rounded | 0.500 | Moderately rough to smooth | 0.335 |
| 5_E | Angular to rounded | 0.500 | Moderately smooth to moderately rough | 0.500 |
| 6_F | Angular to rounded | 0.500 | Moderately smooth | 0.330 |
| 7_G | Angular to sub-angular | 0.835 | Rough and porous | 1.000 |
| 8_H | Rounded to sub-rounded | 0.165 | Moderately smooth to moderately rough | 0.500 |
| 9_I | Sub-rounded to rounded | 0.165 | Slightly rough to smooth | 0.125 |
| 10_J | Angular | 1.000 | Rough to moderately rough | 0.835 |
| 11_K | Angular to sub-angular | 0.835 | Rough to moderately rough | 0.835 |
| 12_L | Rounded to sub-rounded | 0.165 | Moderately smooth to moderately rough | 0.500 |
| 13_M | Angular | 1.000 | Rough to moderately rough | 0.835 |
| 14_N | Angular to sub-angular | 0.835 | Rough and porous | 1.000 |
Table 5.
Interpretation of morphological characteristics and expected fresh-state behavior of fine aggregates.
| Sand | Morphology | Expected Packing and Fresh-State Effect |
|---|
| 1_A | A–SA = rough | High friction, higher voids, increased paste demand. |
| 2_B | A–SA = rough | Poor packing efficiency; reduced workability. |
| 3_C | A–WR = rough–smooth | Intermediate packing; moderate paste demand. |
| 4_D | A–WR = mod. rough–smooth | Balanced packing; moderate workability. |
| 5_E | A–R = mod. smooth–rough | Mixed accommodation; moderate paste demand. |
| 6_F | A–R = mod. smooth | Improved packing; better workability. |
| 7_G | A–SA = rough, porous | High absorption; high paste demand. |
| 8_H | R–SR = mod. smooth–rough | Good packing; reduced paste requirement. |
| 9_I | SR–R = slightly rough–smooth | Efficient packing; low paste demand. |
| 10_J | A = rough | High interlocking; increased paste demand. |
| 11_K | A–SA = rough | Reduced flow; higher paste requirement. |
| 12_L | R–SR = mod. smooth–rough | Dense packing; improved workability. |
| 13_M | A = rough | High interlocking; increased paste demand. |
| 14_N | A–SA = rough, porous | High absorption; high paste demand. |
Table 6.
Packing behavior and interpretative assessment of fine aggregates.
| Sand | U (%) | Workability | Packing Level | Paste Demand | Key Interpretation |
|---|
| 1_A | ≈46.3 | 0.3203 | Medium | Moderate | Crushed sandstone promotes interlocking; limited workability. |
| 2_B | ≈46.3 | 0.3203 | Medium | Moderate–High | Tuff origin may increase absorption and water sensitivity. |
| 3_C | ≈39.2 | 0.7849 | High | Low | Quartz-rich composition enables dense packing and improved workability. |
| 4_D | ≈48.3 | 0.4714 | Low | High | Reduced packing efficiency; higher paste volume required. |
| 5_E | ≈39.6 | 0.7697 | High | Low–Moderate | Quartz mineralogy supports efficient packing. |
| 6_F | ≈38.6 | 0.8695 | Very High | Low | Best natural sand; improved fresh-state performance. |
| 7_G | ≈49.6 | 0.1298 | Low | High | Recycled material increases porosity and paste demand. |
| 8_H | ≈44.2 | 0.6434 | Medium–High | Moderate | Quartz origin provides balanced packing behavior. |
| 9_I | ≈45.4 | 0.7202 | Medium | Moderate | Acceptable packing with stable workability. |
| 10_J | ≈43.7 | 0.3983 | Medium–High | Moderate | Granite may increase friction but maintains packing. |
| 11_K | ≈52.0 | 0.0862 | Very Low | Very High | Highest void content; reduced workability unless compensated. |
| 12_L | ≈40.3 | 0.8016 | High | Low | Gravel-based fines show good particle accommodation. |
| 13_M | ≈50.4 | 0.1231 | Low | High | Granite-derived sand increases inter-particle friction. |
| 14_N | ≈50.2 | 0.1023 | Low | High | Recycled material increases porosity and paste demand. |
Table 7.
Physical and morphological properties of fine aggregates (1_A to 14_N).
| Parameter | 1_A | 2_B | 3_C | 4_D | 5_E | 6_F | 7_G | 8_H | 9_I | 10_J | 11_K | 12_L | 13_M | 14_N |
|---|
| Particle Density (G ssd) (Kg/m3) | 2700 | 2700 | 2650 | 2590 | 2650 | 2590 | 2260 | 2740 | 2730 | 2610 | 2750 | 2580 | 2640 | 2210 |
| Fineness Modulus (FM) | 1.63 | 2.60 | 2.70 | 2.63 | 2.95 | 2.73 | 3.06 | 2.75 | 2.27 | 2.62 | 2.36 | 2.78 | 3.15 | 3.08 |
| Loose Bulk D. (gamma b) (Kg/m3) | 1450 | 1450 | 1610 | 1340 | 1600 | 1590 | 1140 | 1530 | 1490 | 1470 | 1320 | 1540 | 1310 | 1100 |
| Water Absorption (%) | 0.5 | 0.5 | 0.2 | 0.2 | 0.9 | 0.7 | 9.4 | 0.1 | 0.1 | 0.2 | 0.2 | 0.3 | 0.2 | 10.8 |
| Uncompacted Voids, u (%) | 46.3 | 46.3 | 39.25 | 48.26 | 39.62 | 38.61 | 49.56 | 44.16 | 45.42 | 43.68 | 52.00 | 40.31 | 50.38 | 50.23 |
| Packing Density () | 0.54 | 0.54 | 0.61 | 0.52 | 0.60 | 0.61 | 0.50 | 0.56 | 0.55 | 0.56 | 0.48 | 0.60 | 0.50 | 0.50 |
| Petrographic Class | css | t | q | qzo | q | q | rm | q | q | g | t | grav | g | rm |
| Petrographic Class Index (0–1) | 0.60 | 0.75 | 0.00 | 0.15 | 0.00 | 0.00 | 1.00 | 0.00 | 0.00 | 0.40 | 0.75 | 0.50 | 0.40 | 1.00 |
| Particle Shape (qualitative) | a/sa | a/sa | a/r | a/r | a/r | a/r | a/sa | r/sr | sr/r | a | a/sa | r/sr | a | a/sa |
| Particle Shape Index (0–1) | 0.83 | 0.83 | 0.50 | 0.50 | 0.50 | 0.50 | 0.83 | 0.16 | 0.16 | 1.00 | 0.83 | 0.16 | 1.00 | 0.83 |
| Surface Texture (qualitative) | r/mr | r/mr | r/sm | mr/sm | ms/mr | ms | r/p | ms/mr | sr/sm | r/mr | r/mr | ms/mr | r/mr | r/p |
| Surface Texture Index (0–1) | 0.83 | 0.83 | 0.50 | 0.33 | 0.50 | 0.33 | 1.00 | 0.50 | 0.12 | 0.83 | 0.83 | 0.50 | 0.83 | 1.00 |
Table 8.
Sensitivity of optimization results to the strength threshold ().
| Candidates | Strength (kN) | Packing Density | Workability Score | U (%) |
|---|
| 0.90 | 8 | 1.367 | 0.602 | 0.798 | 39.72 |
| 0.92 | 7 | 1.397 | 0.603 | 0.797 | 39.67 |
| 0.95 | 5 | 1.443 | 0.604 | 0.793 | 39.56 |
| 0.97 | 3 | 1.473 | 0.605 | 0.790 | 39.46 |
| 1.00 | 1 | 1.518 | 0.606 | 0.787 | 39.36 |
Table 9.
Categories of input variables used in the machine learning framework.
| Category | Variables | Physical Interpretation |
|---|
| Directly measured mix-design parameters | Curing time; water-to-cement ratio (w/c); fresh density | Represent hydration development, paste rheology, and mixture compactness. |
| Proportion-weighted aggregate |
| physical properties | Texture index; shape index; petrographic index; particle density | Capture mineralogical composition, particle morphology, and inter-particle friction effects. |
| Packing- and grading-related |
| indices (standardized tests) | Uncompacted void content (ASTM C1252); packing density () | Quantify granular skeleton efficiency and conformity with target PSD limits. |
Table 10.
Descriptive statistics of key input variables for training and testing datasets.
| Variable
| Training Set | Testing Set |
|---|
| Mean | Std. Dev. | Range | Mean | Std. Dev. | Range |
|---|
| U (Void Content, %) | 43.78 | 3.34 | 38.93–52.00 | 43.57 | 3.12 | 38.93–50.30 |
| Shape Index | 0.497 | 0.129 | 0.165–1.000 | 0.487 | 0.132 | 0.165–0.984 |
| Texture Index | 0.464 | 0.129 | 0.125–0.934 | 0.465 | 0.132 | 0.125–0.852 |
| Petrographic Index | 0.166 | 0.150 | 0.000–0.900 | 0.170 | 0.148 | 0.000–0.625 |
| Packing Density | 0.562 | 0.033 | 0.480–0.611 | 0.564 | 0.031 | 0.480–0.611 |
Table 11.
Sensitivity of PDI ranking under representative weighting combinations.
| Mixture (12_L/3_C) | PDI | Rank | | | |
|---|
| (10/90) | 0.100 | 1 | 0.6 | 0.3 | 0.1 |
| (20/80) | 0.171 | 2 | 0.6 | 0.3 | 0.1 |
| (30/70) | 0.243 | 3 | 0.6 | 0.3 | 0.1 |
| (10/90) | 0.200 | 1 | 0.5 | 0.3 | 0.2 |
| (20/80) | 0.243 | 2 | 0.5 | 0.3 | 0.2 |
| (30/70) | 0.286 | 3 | 0.5 | 0.3 | 0.2 |
| (10/90) | 0.100 | 1 | 0.7 | 0.2 | 0.1 |
| (20/80) | 0.186 | 2 | 0.7 | 0.2 | 0.1 |
| (30/70) | 0.271 | 3 | 0.7 | 0.2 | 0.1 |
Table 12.
Variation in predicted strength, PDI, packing density, and workability for 12_L/3_C mixtures.
| S12_L(%) | S3_C (%) | Strength (kN) | PDI | Packing Density | Workability |
|---|
| 10 | 90 | 1.518 | 0.100 | 0.60644 | 0.78663 |
| 20 | 80 | 1.496 | 0.178 | 0.60538 | 0.78829 |
| 30 | 70 | 1.493 | 0.257 | 0.60432 | 0.78995 |
| 40 | 60 | 1.468 | 0.336 | 0.60326 | 0.79162 |
| 50 | 50 | 1.452 | 0.414 | 0.60220 | 0.79328 |
| 60 | 40 | 1.431 | 0.493 | 0.60114 | 0.79494 |
| 70 | 30 | 1.419 | 0.571 | 0.60008 | 0.79661 |
| 80 | 20 | 1.381 | 0.650 | 0.59902 | 0.79827 |
| Disclaimer/Publisher’s Note: The statements, opinions and data contained in all publications are solely those of the individual author(s) and contributor(s) and not of MDPI and/or the editor(s). MDPI and/or the editor(s) disclaim responsibility for any injury to people or property resulting from any ideas, methods, instructions or products referred to in the content. |





 ,
,