Article

Explainable AI-Integrated Stacked Machine-Learning Model for Detection of Infectious Conditions Utilizing Vital Signs and Hematological Biomarkers


by
Savithri Prabhu
1,
Giliyar Muralidhar Bairy
1,*,
Niranjana Sampathila
1,* and
BRP Siddarama Dhruva Darshan
2
1
Manipal Institute of Technology, Manipal Academy of Higher Education, Manipal 576104, India
2
Department of Computer Science and Engineering, M. S. Ramaiah University of Applied Sciences, Bengaluru 560058, India
*
Authors to whom correspondence should be addressed.
Information 2026, 17(3), 227; https://doi.org/10.3390/info17030227
Submission received: 1 January 2026 / Revised: 24 February 2026 / Accepted: 25 February 2026 / Published: 27 February 2026

Abstract

Infectious diseases are contributing to a major public health challenge worldwide, affecting individuals across all age groups and regions. An infectious disease is a pathological condition caused by harmful microorganisms. These are bacteria, viruses, fungi, or parasites that enter the body, multiply, and disturb normal physiological functions, leading to clinical manifestations. At present, the detection of infectious disease is mainly based on vital signs and a limited set of biomarkers. This limited approach fails to fully capture the complications of infection-related physiological changes. To address these limitations, vital signs and a broad range of hematological and biochemical biomarkers are integrated with machine learning and explainable artificial intelligence (XAI). The data set used in this study was collected from the Kaggle data source. The dataset consists of vital sign values, such as body temperature, systolic and diastolic blood pressure, respiratory rate, heart rate, and oxygen saturation, along with blood-based biomarkers including albumin, base excess, bicarbonate, bilirubin, blast cells, calcium, creatinine, gamma-glutamyl transferase (GGT), glucose, hematocrit, hemoglobin, lactate, leukocytes, neutrophils, C-reactive protein (CRP), platelets, potassium, sodium, alanine aminotransferase (TGP/ALT), activated partial thromboplastin time (TTPA), and urea. These parameters provide a complete view of the patient’s physiological and biochemical state during infection. Feature selection was performed using a hybrid approach combining correlation filtering, mutual information, tree-based feature importance, and XAI validation (SHAP, permutation sensitivity) to ensure both predictive accuracy and interpretability. The integration of these techniques supports accurate classification and AI-assisted decision-making. The findings of this study highlight the importance of integrating both vital sign monitoring and laboratory assessments for effective infectious disease management.

Graphical Abstract

1. Introduction

Infectious diseases, especially viral ones, are still a great challenge to world health in both tropical and subtropical areas of the world. Dengue transmission is essentially facilitated by Aedes mosquitoes. The clinical consequence may range from asymptomatic or mild to severe shock, bleeding, and functional impairment of organs [1,2,3]. Urinary tract infections (UTIs) are among the most common infections that precipitate hospital admission among elderly persons. It is considered the most common infectious threat for long-term care facility residents [4,5,6]. Sepsis is a non-homeostatic, deleterious systemic inflammatory response to infection, which may cause widespread tissue injury and organ failure. Sepsis affects a large fraction of hospitalized patients. Because it carries a high risk for mortality, timely recognition of sepsis is of paramount importance, and various clinical practice guidelines recommend the use of screening strategies that are combined with vital signs and bedside parameters [7,8,9]. Many of the sepsis-related deaths happen in patients with previous chronic conditions. This indicates the importance of the management of chronic conditions together with the treatment of sepsis for better patient outcomes. Early recognition and timely, appropriate intervention significantly reduce the risk of the disease progressing to more advanced stages, including septic shock, and reduce mortality [10,11,12]. Infectious diseases, represented by sepsis, are one of the most important challenges for healthcare systems because they may result in severe impairment of organs, shock, and even mortality [13,14,15].
Infectious diseases remain one of the most serious global health burdens, and due to their high incidence among children, they can result in severe outcomes, complications, or long-lasting disability. The outcomes of serious infections in pediatric trauma emphasize that in such cases, identification needs to be done early and accurately, with immediate treatment and organized support. Infectious diseases burden public health hugely, as their consequences directly or indirectly result in morbidity and mortality in subjects of all ages. Infectious diseases in children often necessitate pediatric intensive care units for the management of severe complications and preventing multiple organ failures [16,17]. Children are particularly prone to rapid clinical deterioration due to infection resulting from their immature immune system. Infection can lead to severe inflammation; in extreme cases, this results in systemic complications targeting various organs [18,19]. Assessment of patients can be rather challenging, especially for older adults and those with chronic diseases or compromised immunity, where abnormalities in vital signs are usually masked [20,21]. Biomarkers, such as inflammatory markers or metabolic changes, can help improve the accuracy of disease prediction [22,23]. The main objective of this research is to identify infectious conditions using vital signs and hematological and biochemical biomarkers and to predict ICU admissions.

2. Literature Review

Biomarkers, also known as biological markers, provide objective information about normal or abnormal biological processes. In addition, biomarkers give information about disease states or the body’s responses to therapeutic interventions. Biomarkers serve as valuable tools for detecting, diagnosing, and monitoring various health conditions. Vital signs are measured to know the basic functions of the body. Vital signs give information about the stability status, which is important for the human body. Body temperature, heart rate, blood pressure, oxygen saturation, and respiration rate are the important vital signs. Body temperature and the analysis of its patterns are important vital signs for differentiating between infectious and non-infectious diseases [24,25]. Viral infections can lead to noticeable changes in heart rate, respiratory rate, heart rate variability, temperature, and physical activity [26].
According to definitions by the National Institutes of Health (NIH) and the World Health Organization (WHO), biomarkers include a wide range of indicators that show functional, biochemical, or disease-related changes at molecular, cellular, or tissue levels. In clinical medicine, biomarkers have been used to determine health status, including routine checks like blood pressure and pulse rate, as well as more detailed biochemical tests performed on bodily fluids. Biomarkers are commonly categorized by their roles—antecedent biomarkers show disease risk, screening biomarkers identify disease detection, diagnostic biomarkers confirm disease presence, staging biomarkers describe disease severity, and prognostic biomarkers predict outcomes or treatment responses. Biomarker integration into clinical workflows supports precision-medicine approaches and results in better health outcomes in various infectious diseases [27,28,29]. Studies have demonstrated its effectiveness in the early recognition of sepsis, and it has been cleared for use in emergency settings [30,31].
To aid clinicians, there has been an increasing utilization of a variety of biomarkers of inflammation and infection to support early diagnosis and prognosis. Blood biomarkers are important tools in the diagnosis and management of infectious diseases because they reflect the body’s physiological and immune responses to infection. The presence of high levels of such markers can usually indicate a significant immune response, while certain patterns can imply infection and its severity [32,33,34]. Hundreds of samples per hour can be processed and analyzed through automated systems, thus being suitable for large-scale clinical and outbreak situations. New technologies and new molecular assays are continuously being developed, which further expand their use in support of better patient outcomes due to earlier detection, more accurate diagnosis, and targeted therapy.
The rapidly emerging approaches in harnessing fine-grained electronic health records and advanced statistical modeling will better map and predict complex patient response patterns. These, along with continued refinement in biomarker use and analysis of digital data, hold promises for improvements in early identification and risk stratification and personalized management of infectious diseases. Identifying patients with low risk will avoid unnecessary hospitalization and thus reduce hospital costs. Rapid identification of high-risk patients is considered important; however, traditionally, diagnosis is generally based on symptoms that may manifest much later than the actual infection [35,36]. Thus, timely identification and prompt management of severe infection remain critical to reducing morbidity and mortality. It is similar in trauma management, wherein rapid assessment and triage are of great importance. Commonly, healthcare providers for infectious diseases face many diagnostic challenges, especially in prehospital or resource-poor settings. They have to base their judgment on clinical signs and other basic diagnostic modalities primarily to decide which of the patients should be treated urgently and with specialized care. Clinicians may be able to alter the pace of intervention according to temporal response tracking and individual, patient-specific recovery patterns [37,38,39].
Specifically, emerging machine learning methodologies, especially ensemble learning techniques, have the potential to transform the detection and management of severe infections [40,41,42]. Assessing these approaches via key performance indicators, such as Area Under the Receiver Operating Characteristic Curve (AUC), precision, and recall, presents promising opportunities to reduce complications and lower mortality associated with infectious diseases through improved early interventions. Machine-learning-driven clinical decision support systems are now recognized for enhancing diagnostic accuracy, risk stratification, and personalization of patient care, ultimately improving patient outcomes and easing the global burden of infectious diseases [43,44]. The above studies show that infectious diseases can be predicted effectively using blood biomarkers and vital sign parameters. The main objective of this research is to classify individuals as infectious or non-infectious.
  • Descriptive statistical analysis of the dataset was carried out to examine distributions and correlations among vital signs and biomarkers.
  • A hybrid feature selection pipeline was implemented, combining correlation filtering, mutual information, and tree-based feature selection.
  • Of great importance was XAI validation (SHAP, permutation sensitivity, ICE plots), used to identify the most significant predictors.
  • Machine-learning models, including Random Forest, Logistic Regression, Decision Tree, KNN, Adaboost, Catboost, Light GBM, and XGBoost, along with ensemble techniques such as stacking, were employed to predict ICU admission risk.
  • The performance of these classifiers was further compared with explainable AI techniques, including SHAP, LIME, and permutation-based sensitivity analysis, to ensure interpretability of predictions.
  • A clinical perspective discussion was provided to highlight the most important biomarkers and vital signs, such as lactate, respiratory rate, and systolic and diastolic blood pressure, for the detection of infectious diseases and early ICU risk stratification.
  • In this study, ICU admission is considered a clinically relevant indicator of infection-associated severity.

3. Materials and Methods

3.1. Dataset Description

The dataset consists of clinical and laboratory data collected from patients, intended to analyze and predict the likelihood of Intensive Care Unit (ICU) admission. The file includes a total of 31 columns and 1926 rows over 384 patient records; each patient has 5 rows because their vital signs were recorded across different time windows. Among the columns, one serves as the gender and the other column as the outcome variable—ICU, a binary label indicating whether a patient was admitted to the ICU or not based on the severity. The remaining 29 columns contain various laboratory measurements and vital sign details. The dataset contains clinical and laboratory measurements collected across multiple time windows, which resulted in missing values for certain vital signs and biomarkers. As the dataset contained a few missing entries, missing values were handled using median imputation, where empty values were replaced with the median of the corresponding feature. Subsequently, all numerical features were standardized using z-score normalization prior to model training. The dataset was split into 80% for training and 20% for testing. The clinical markers chosen are tabulated in Table 1.

3.2. Data Pre-Processing

The dataset contained missing values across several features, which were addressed through appropriate imputation techniques. All features were standardized using z-score normalization. Biomarker values and vital signs recorded across different time windows were averaged (e.g., albumin mean, bilirubin mean, temperature mean, etc.) for severe and non-severe patient groups. The number of measurements for each clinical marker in non-severe and severe patients is presented in Table 2. Descriptive statistics were performed on biomarkers and vital signs for non-severe and severe patient groups to assess differences in their distribution and variability. The non-severe group showed values grouped close to the standardized mean, whereas the severe group demonstrated wider variability and more extreme values. Severe patients had lower mean values of albumin and blood pressure, with higher variability in the measures of creatinine, lactate, and inflammatory markers such as CRP, leukocytes, and neutrophils. Other vital signs, such as heart rate, respiratory rate, and temperature, were also more variable among severe cases, reflecting significant physiological instability. These findings may indicate that these features are strong predictors of disease severity and risk of admission to the ICU.
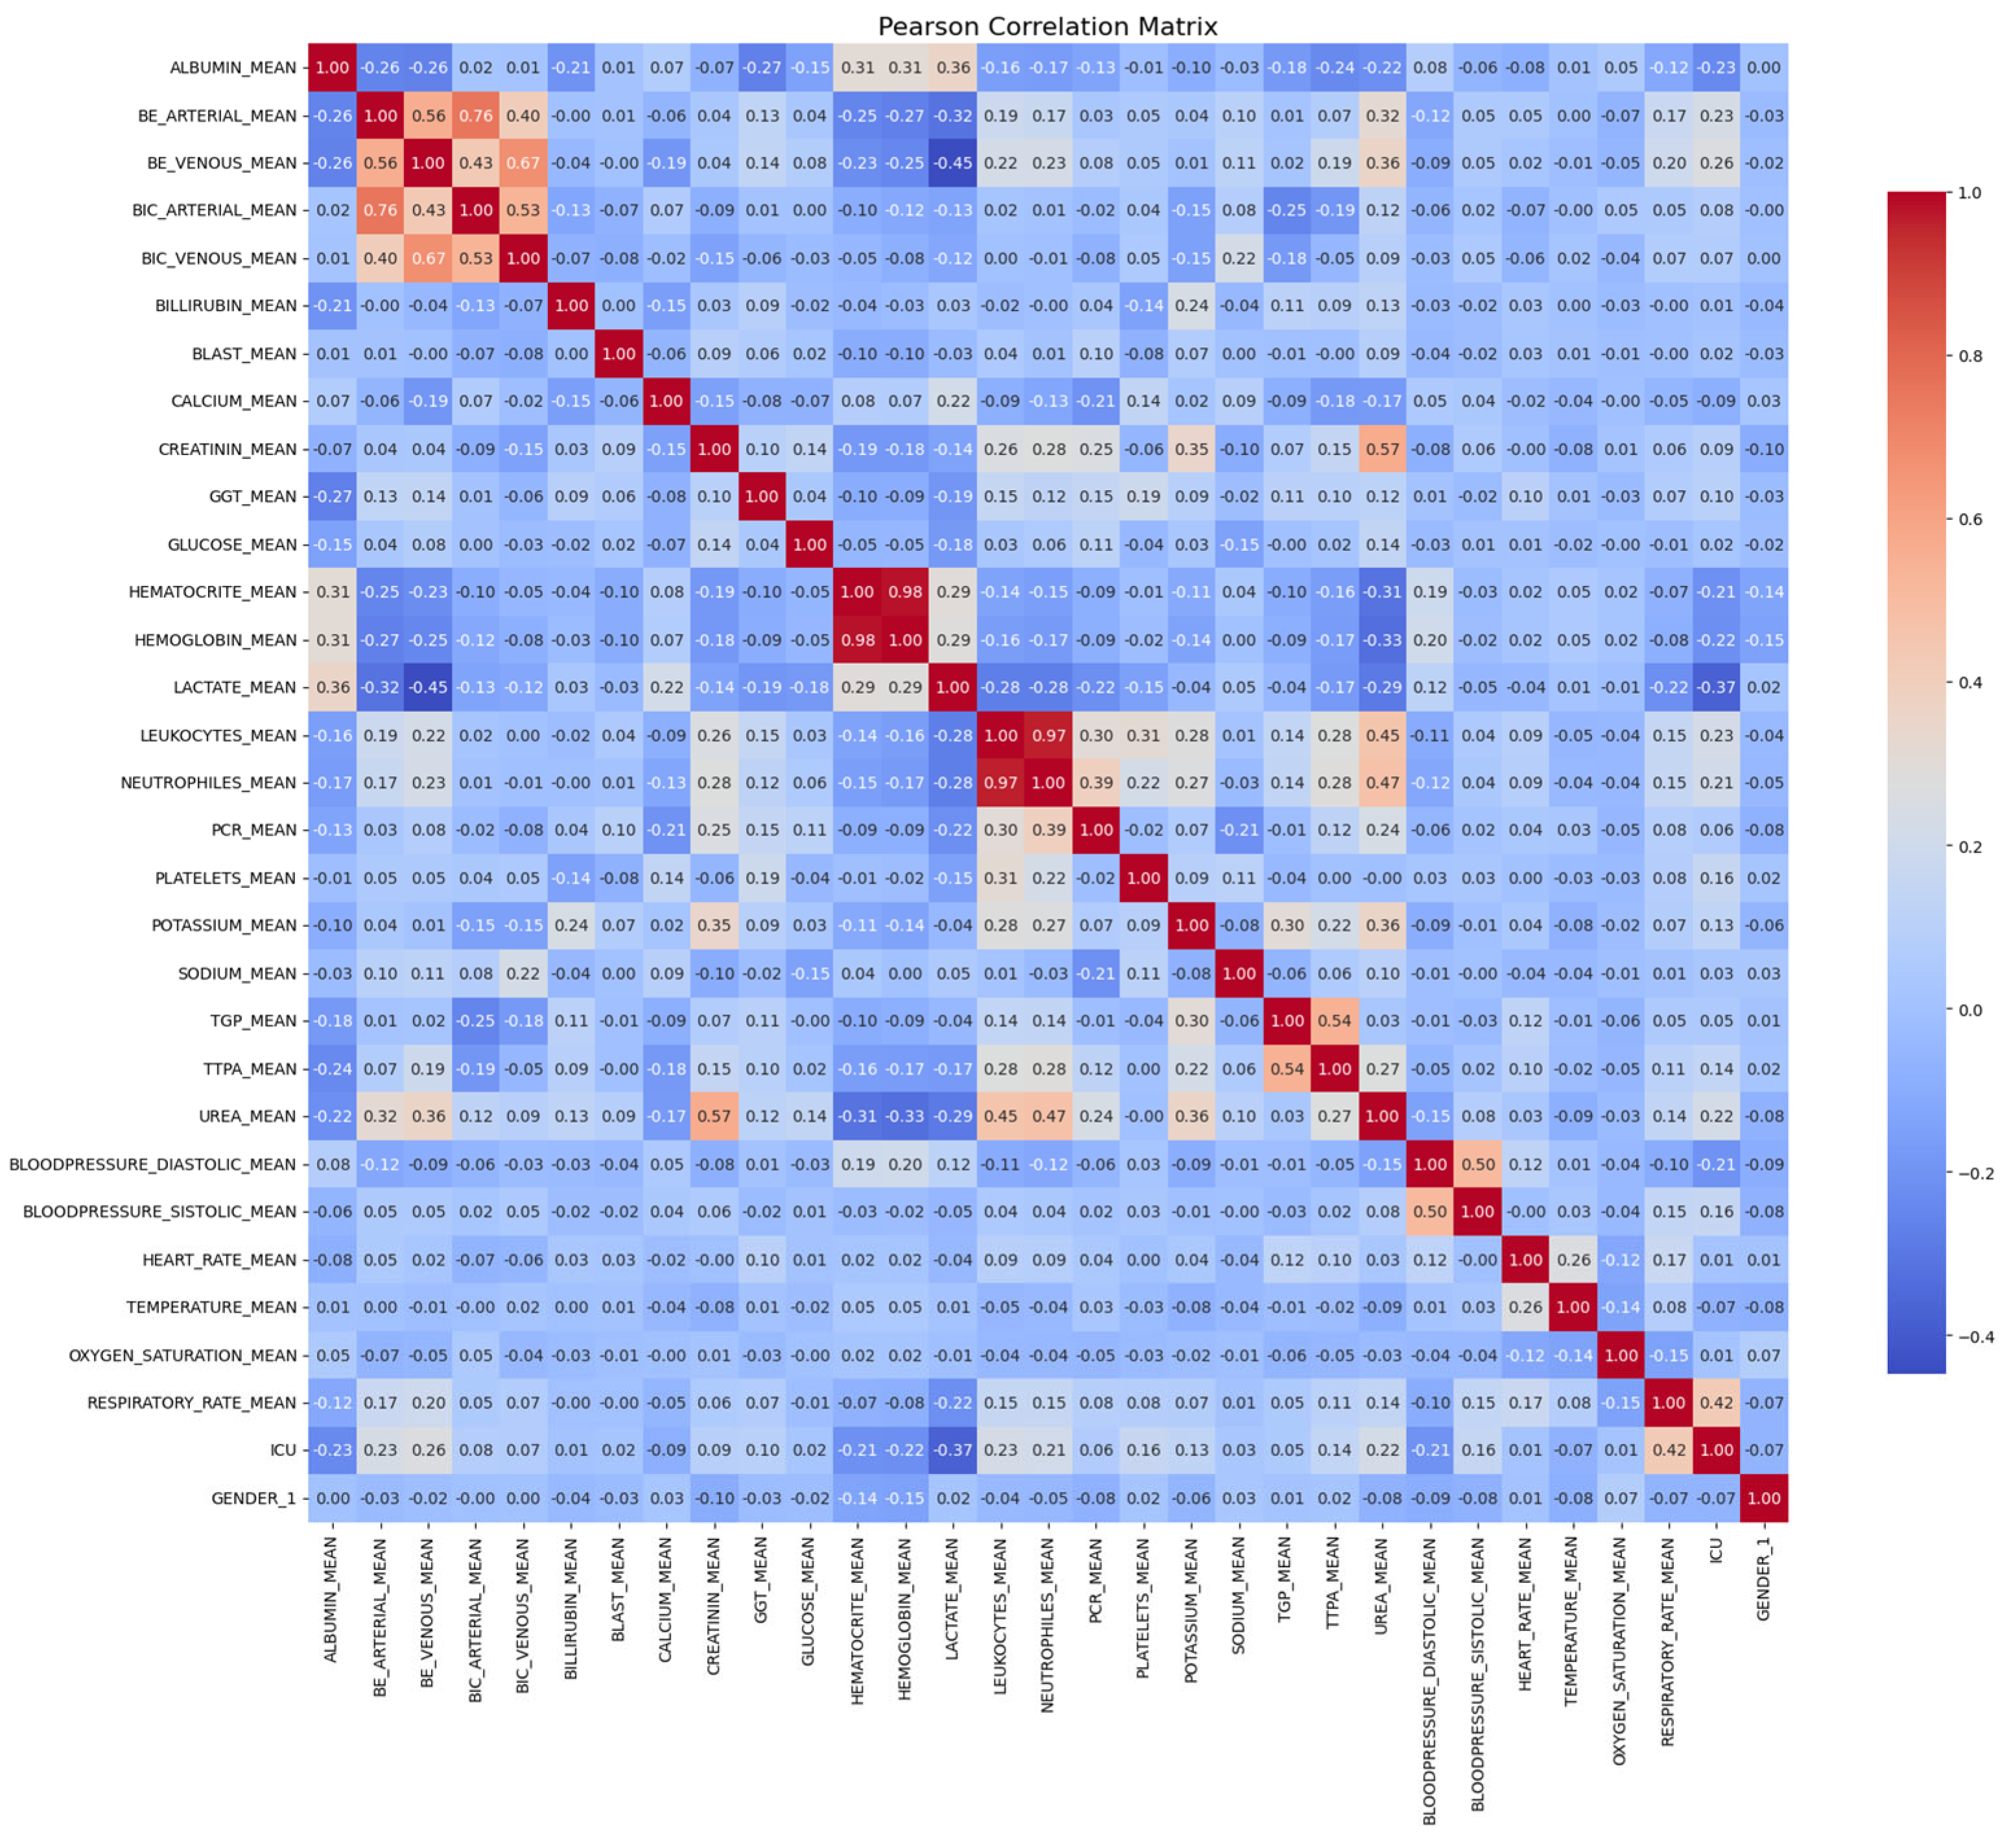
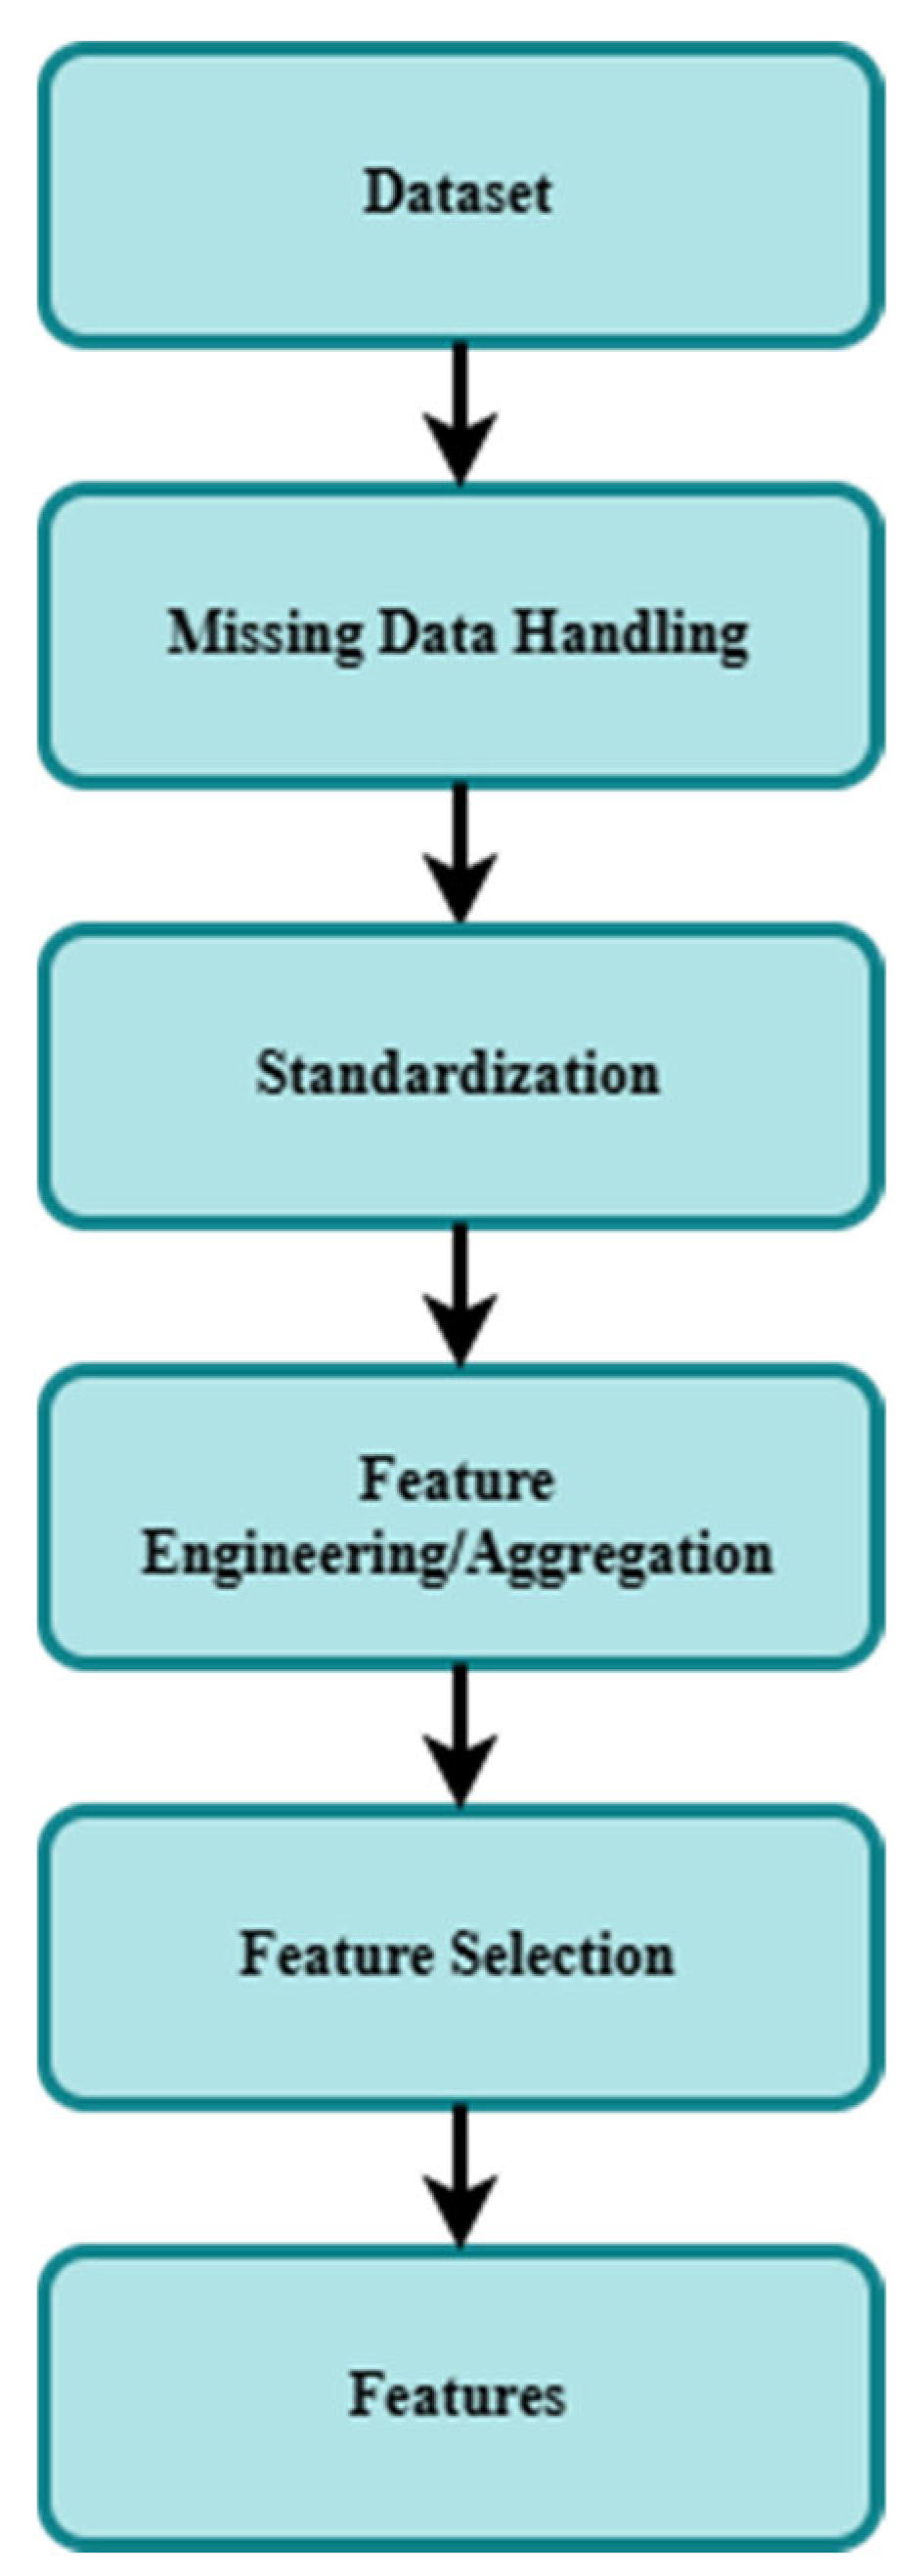
Feature selection strategy: A hybrid feature selection pipeline was adopted for the present study, in which several methods were applied to ensure robustness and interpretability. Initially, a correlation filtering was carried out using the Pearson correlation analysis to remove redundant features. The Pearson correlation matrix is shown in Figure 1. Filter-based methods, such as mutual information, were employed to quantify the dependency between individual predictors and the severity of disease, thereby prioritizing the most relevant variables for ICU admission outcome. Feature selection combined correlation analysis, mutual information, and model-based ranking. Pearson correlation reduced redundancy, while mutual information emphasized predictors strongly linked with ICU admission. Figure 2 presents a flowchart illustrating the sequential steps applied for data preprocessing and feature selection.
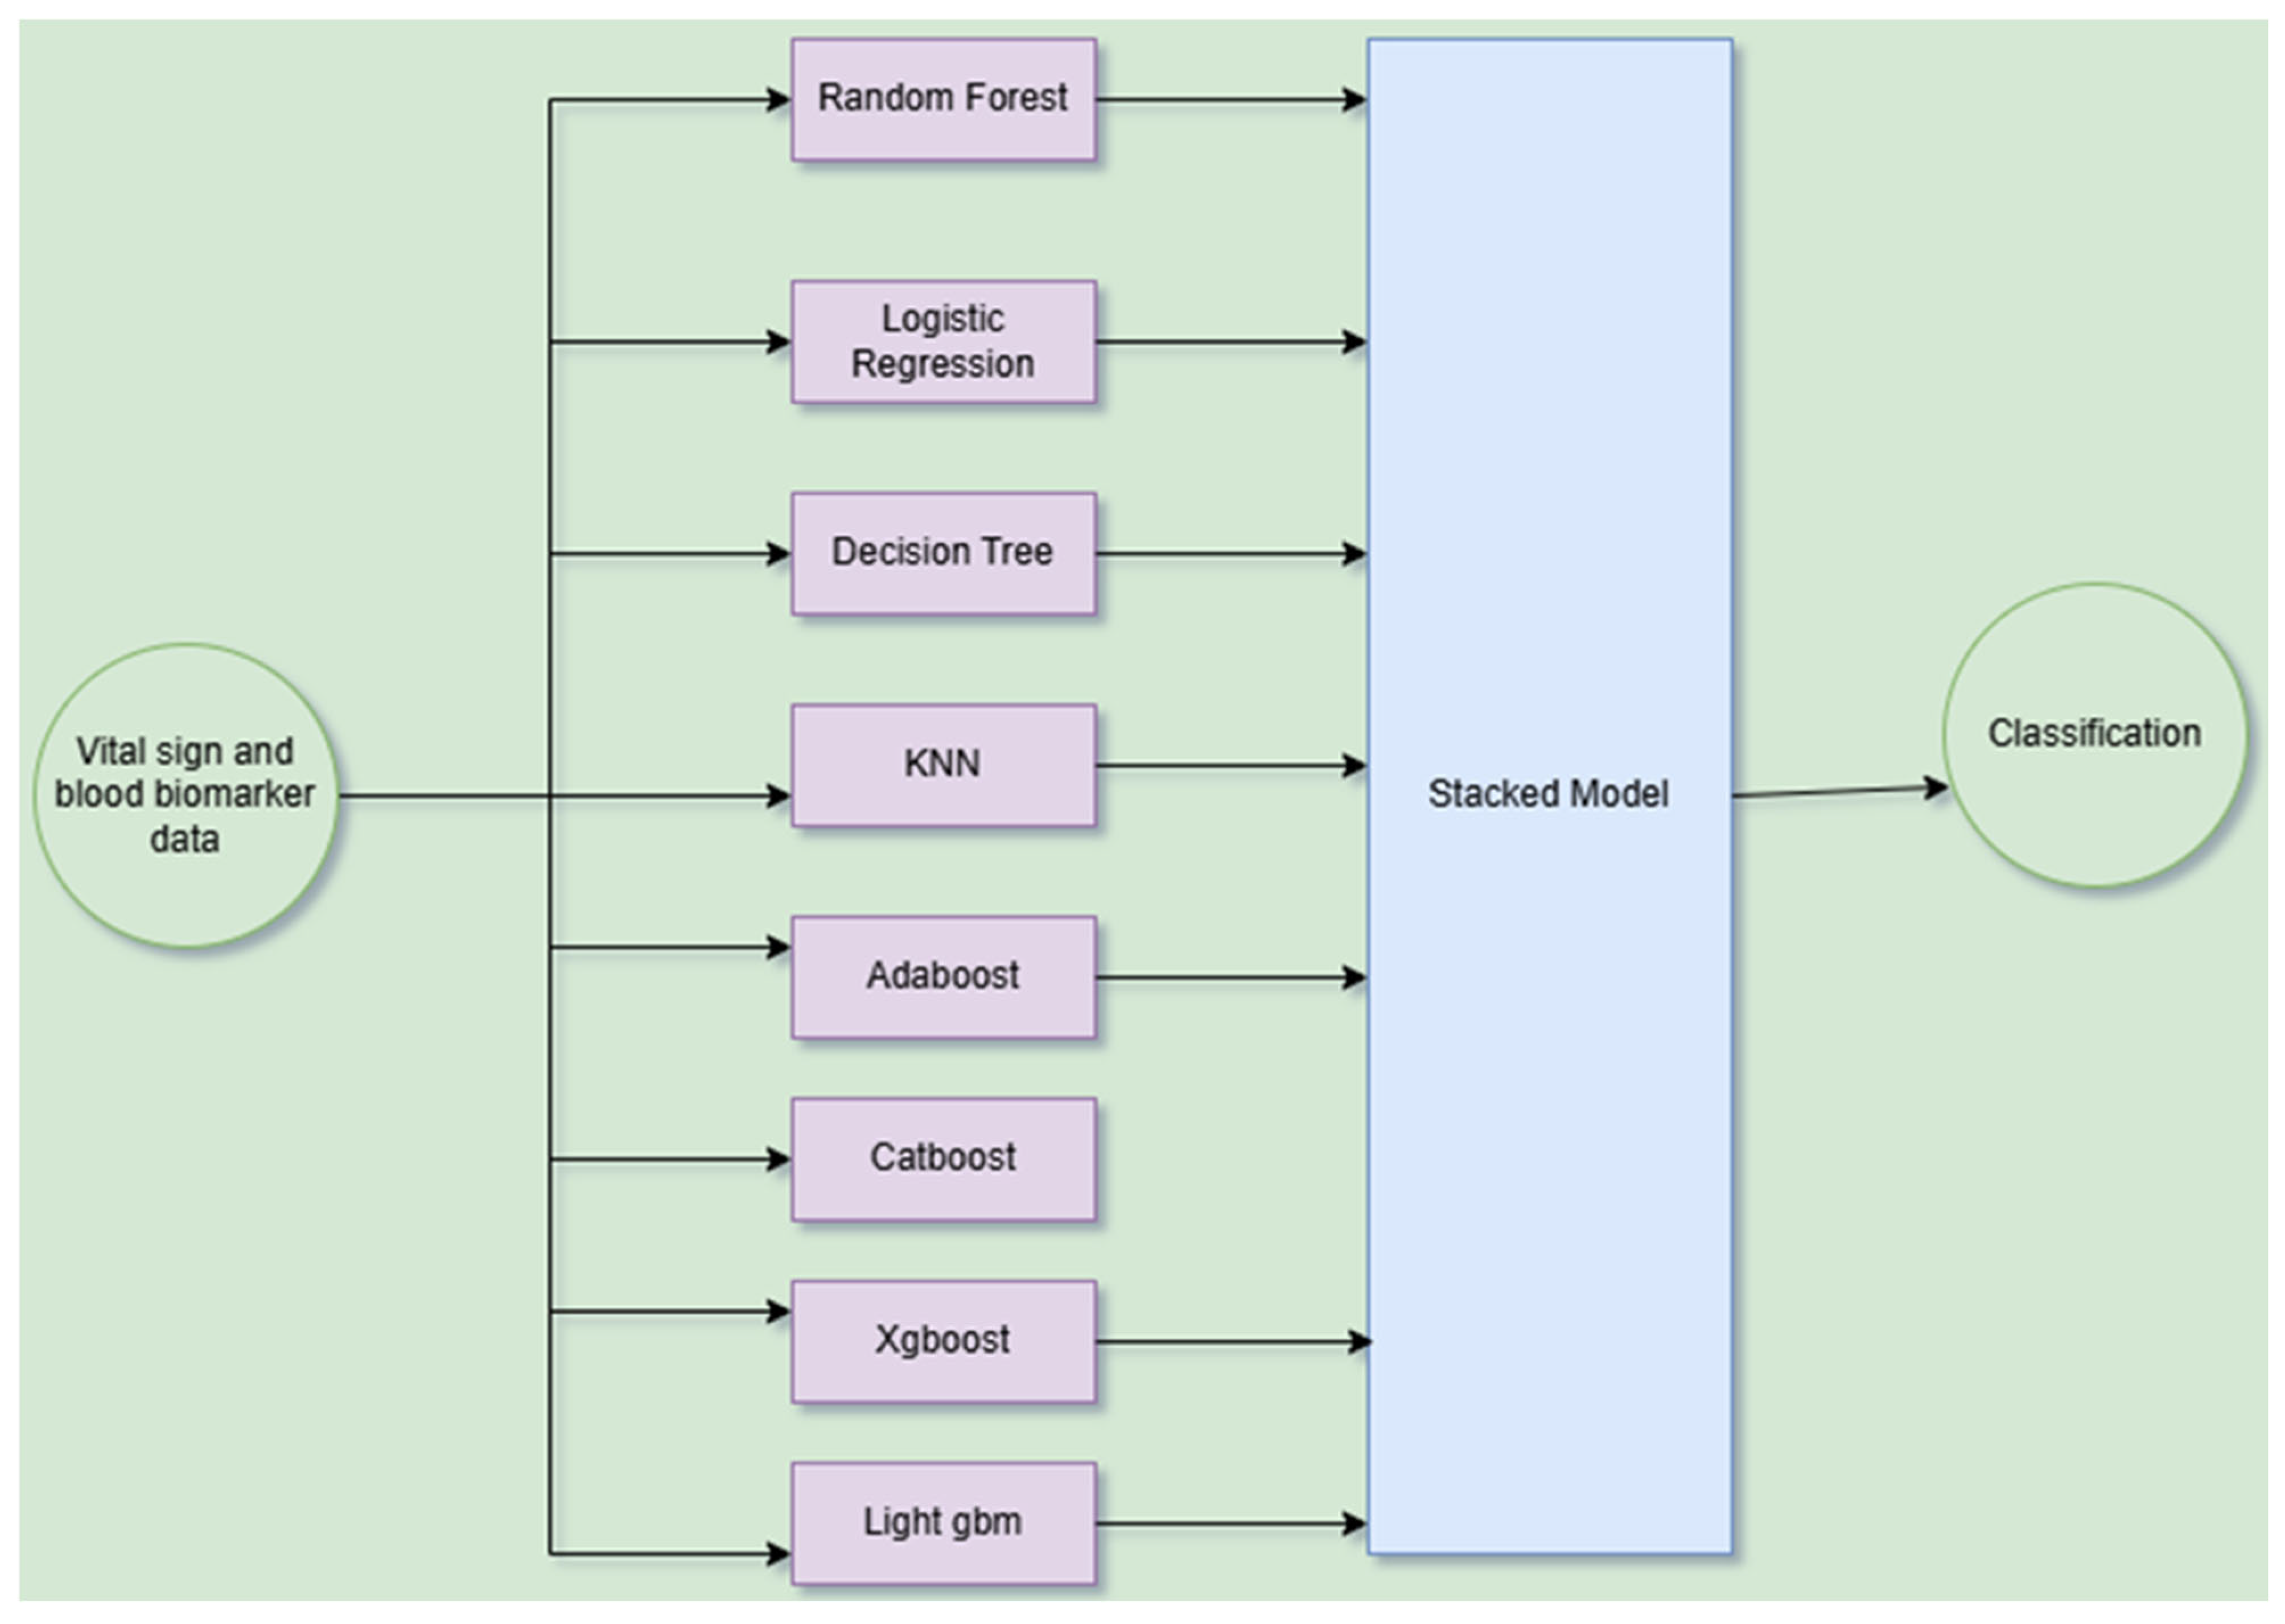
Figure 3 illustrates the stacked ensemble learning architecture used for classifying patient outcomes based on vital sign and blood marker data. In this workflow, patient data serve as the input for machine-learning models—including Random Forest, Logistic Regression, Decision Tree, KNN, Adaboost, Catboost, XGBoost, and LightGBM—each acting as a base learner. A supervised two-level stacked ensemble learning framework was implemented in this study. In the first level, the base classifiers were independently trained using the same set of input features consisting of vital signs and hematological and biochemical biomarkers. The predictions generated by these individual models are then passed to a final stacked model. In the second level, the predictions from the base classifiers were used as input features to a meta-learner, which combines the outputs of the base models to produce the final output, accurate for classification decisions (severe or non-severe). Explainable artificial intelligence techniques are applied to interpret the results of the stacked ensemble model, which supports clinical validation.
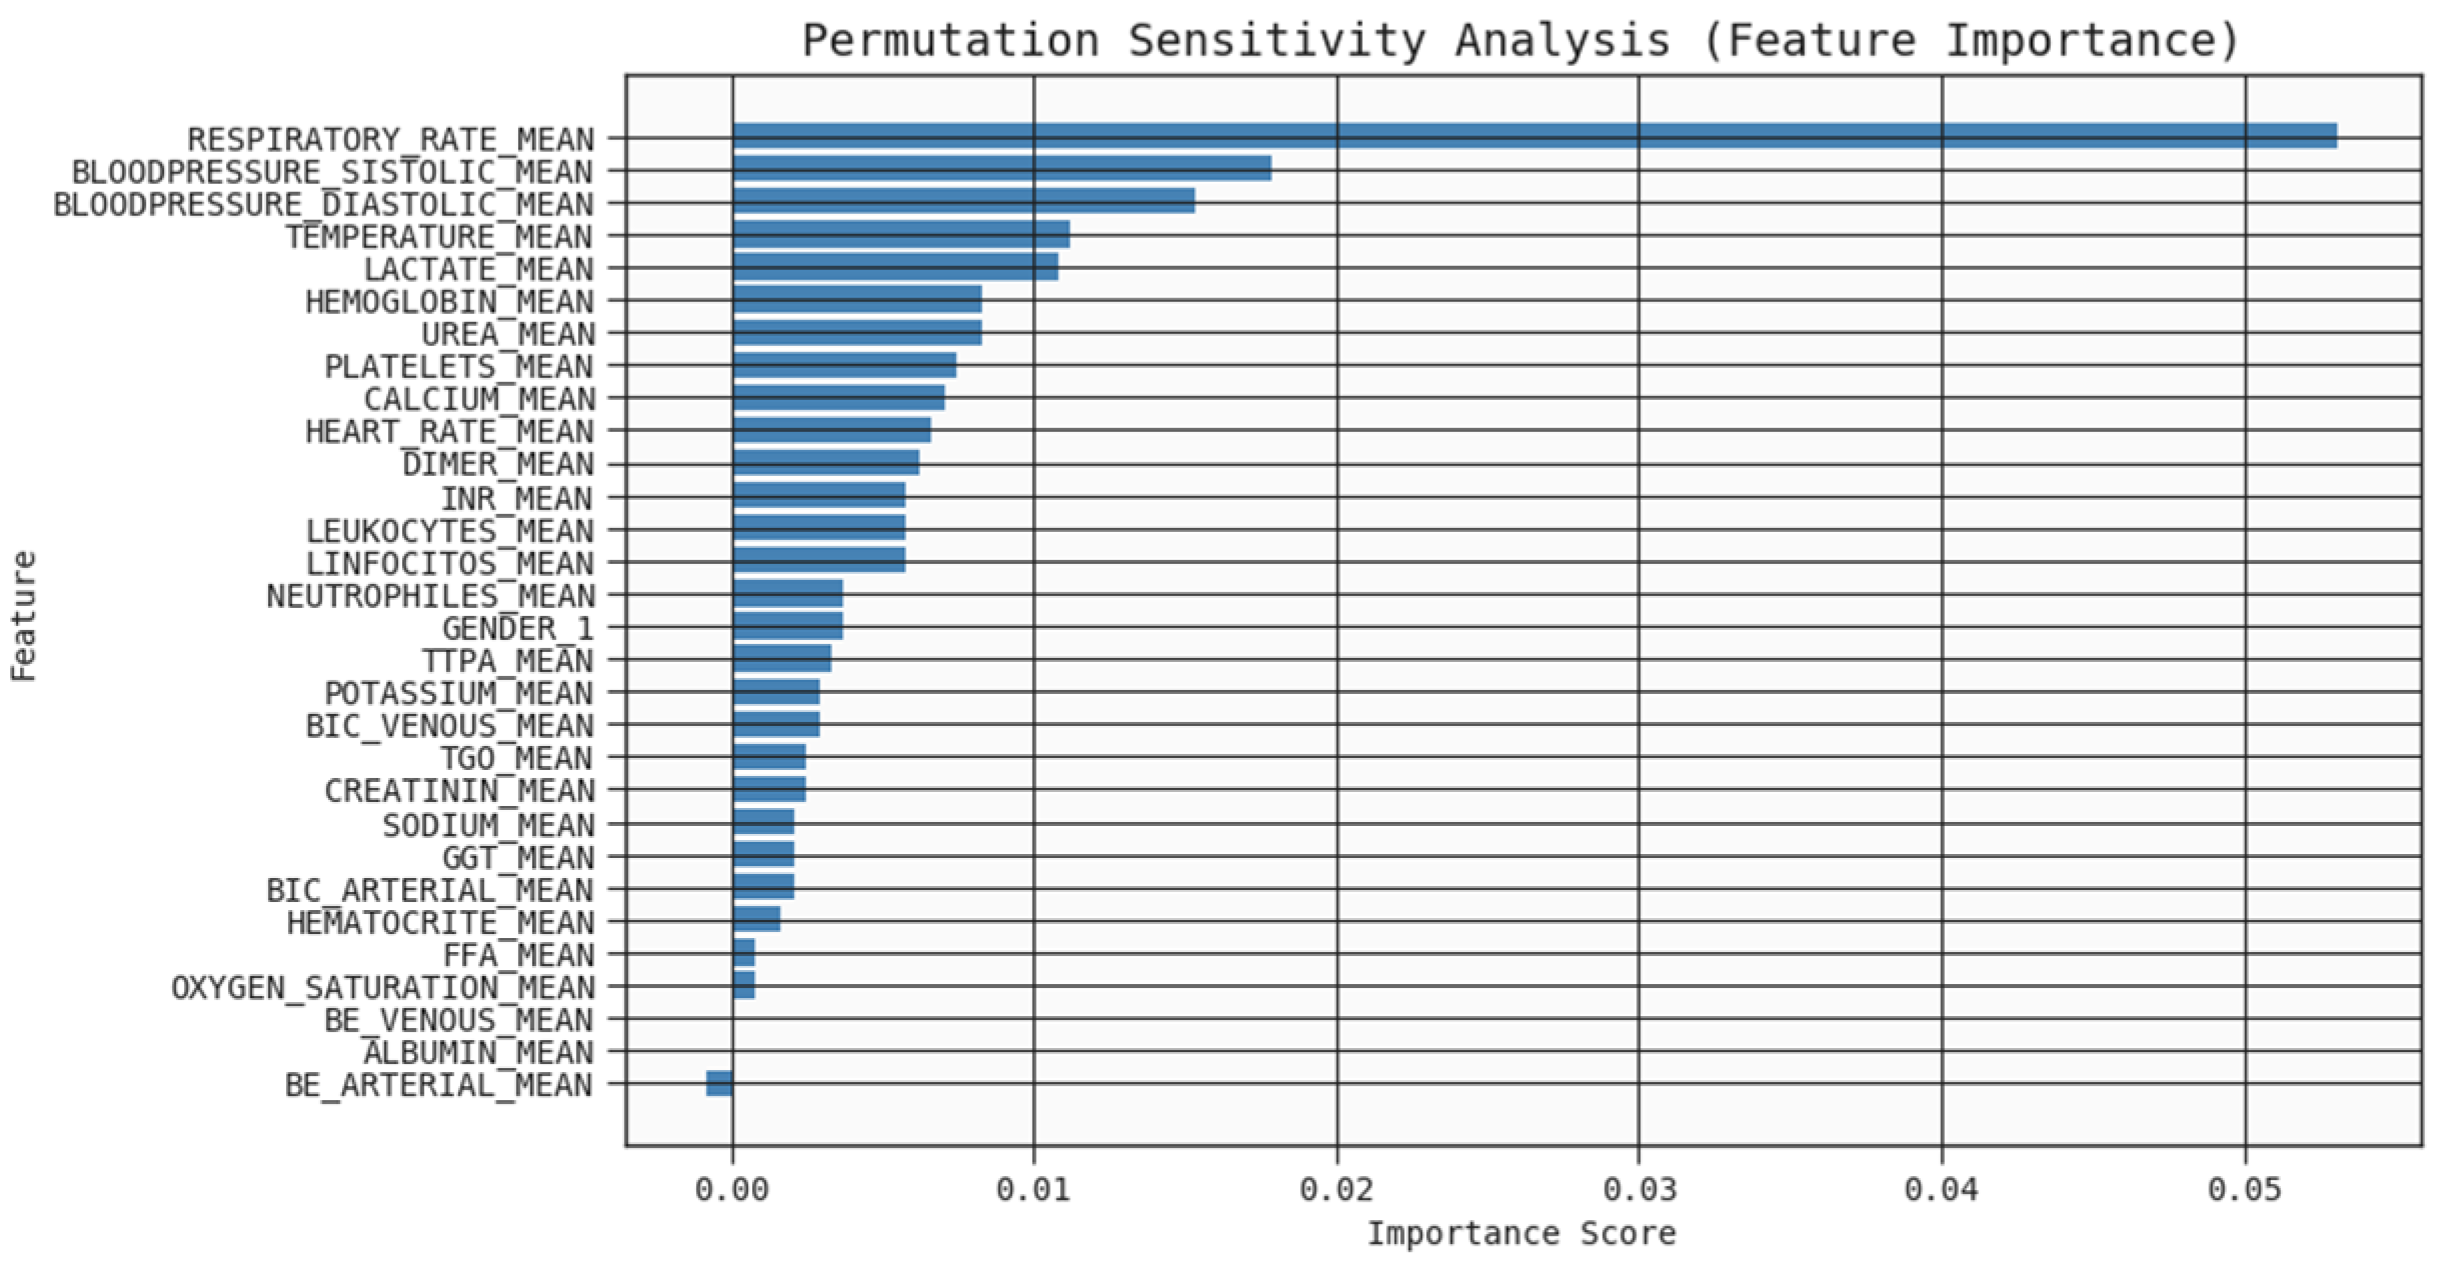
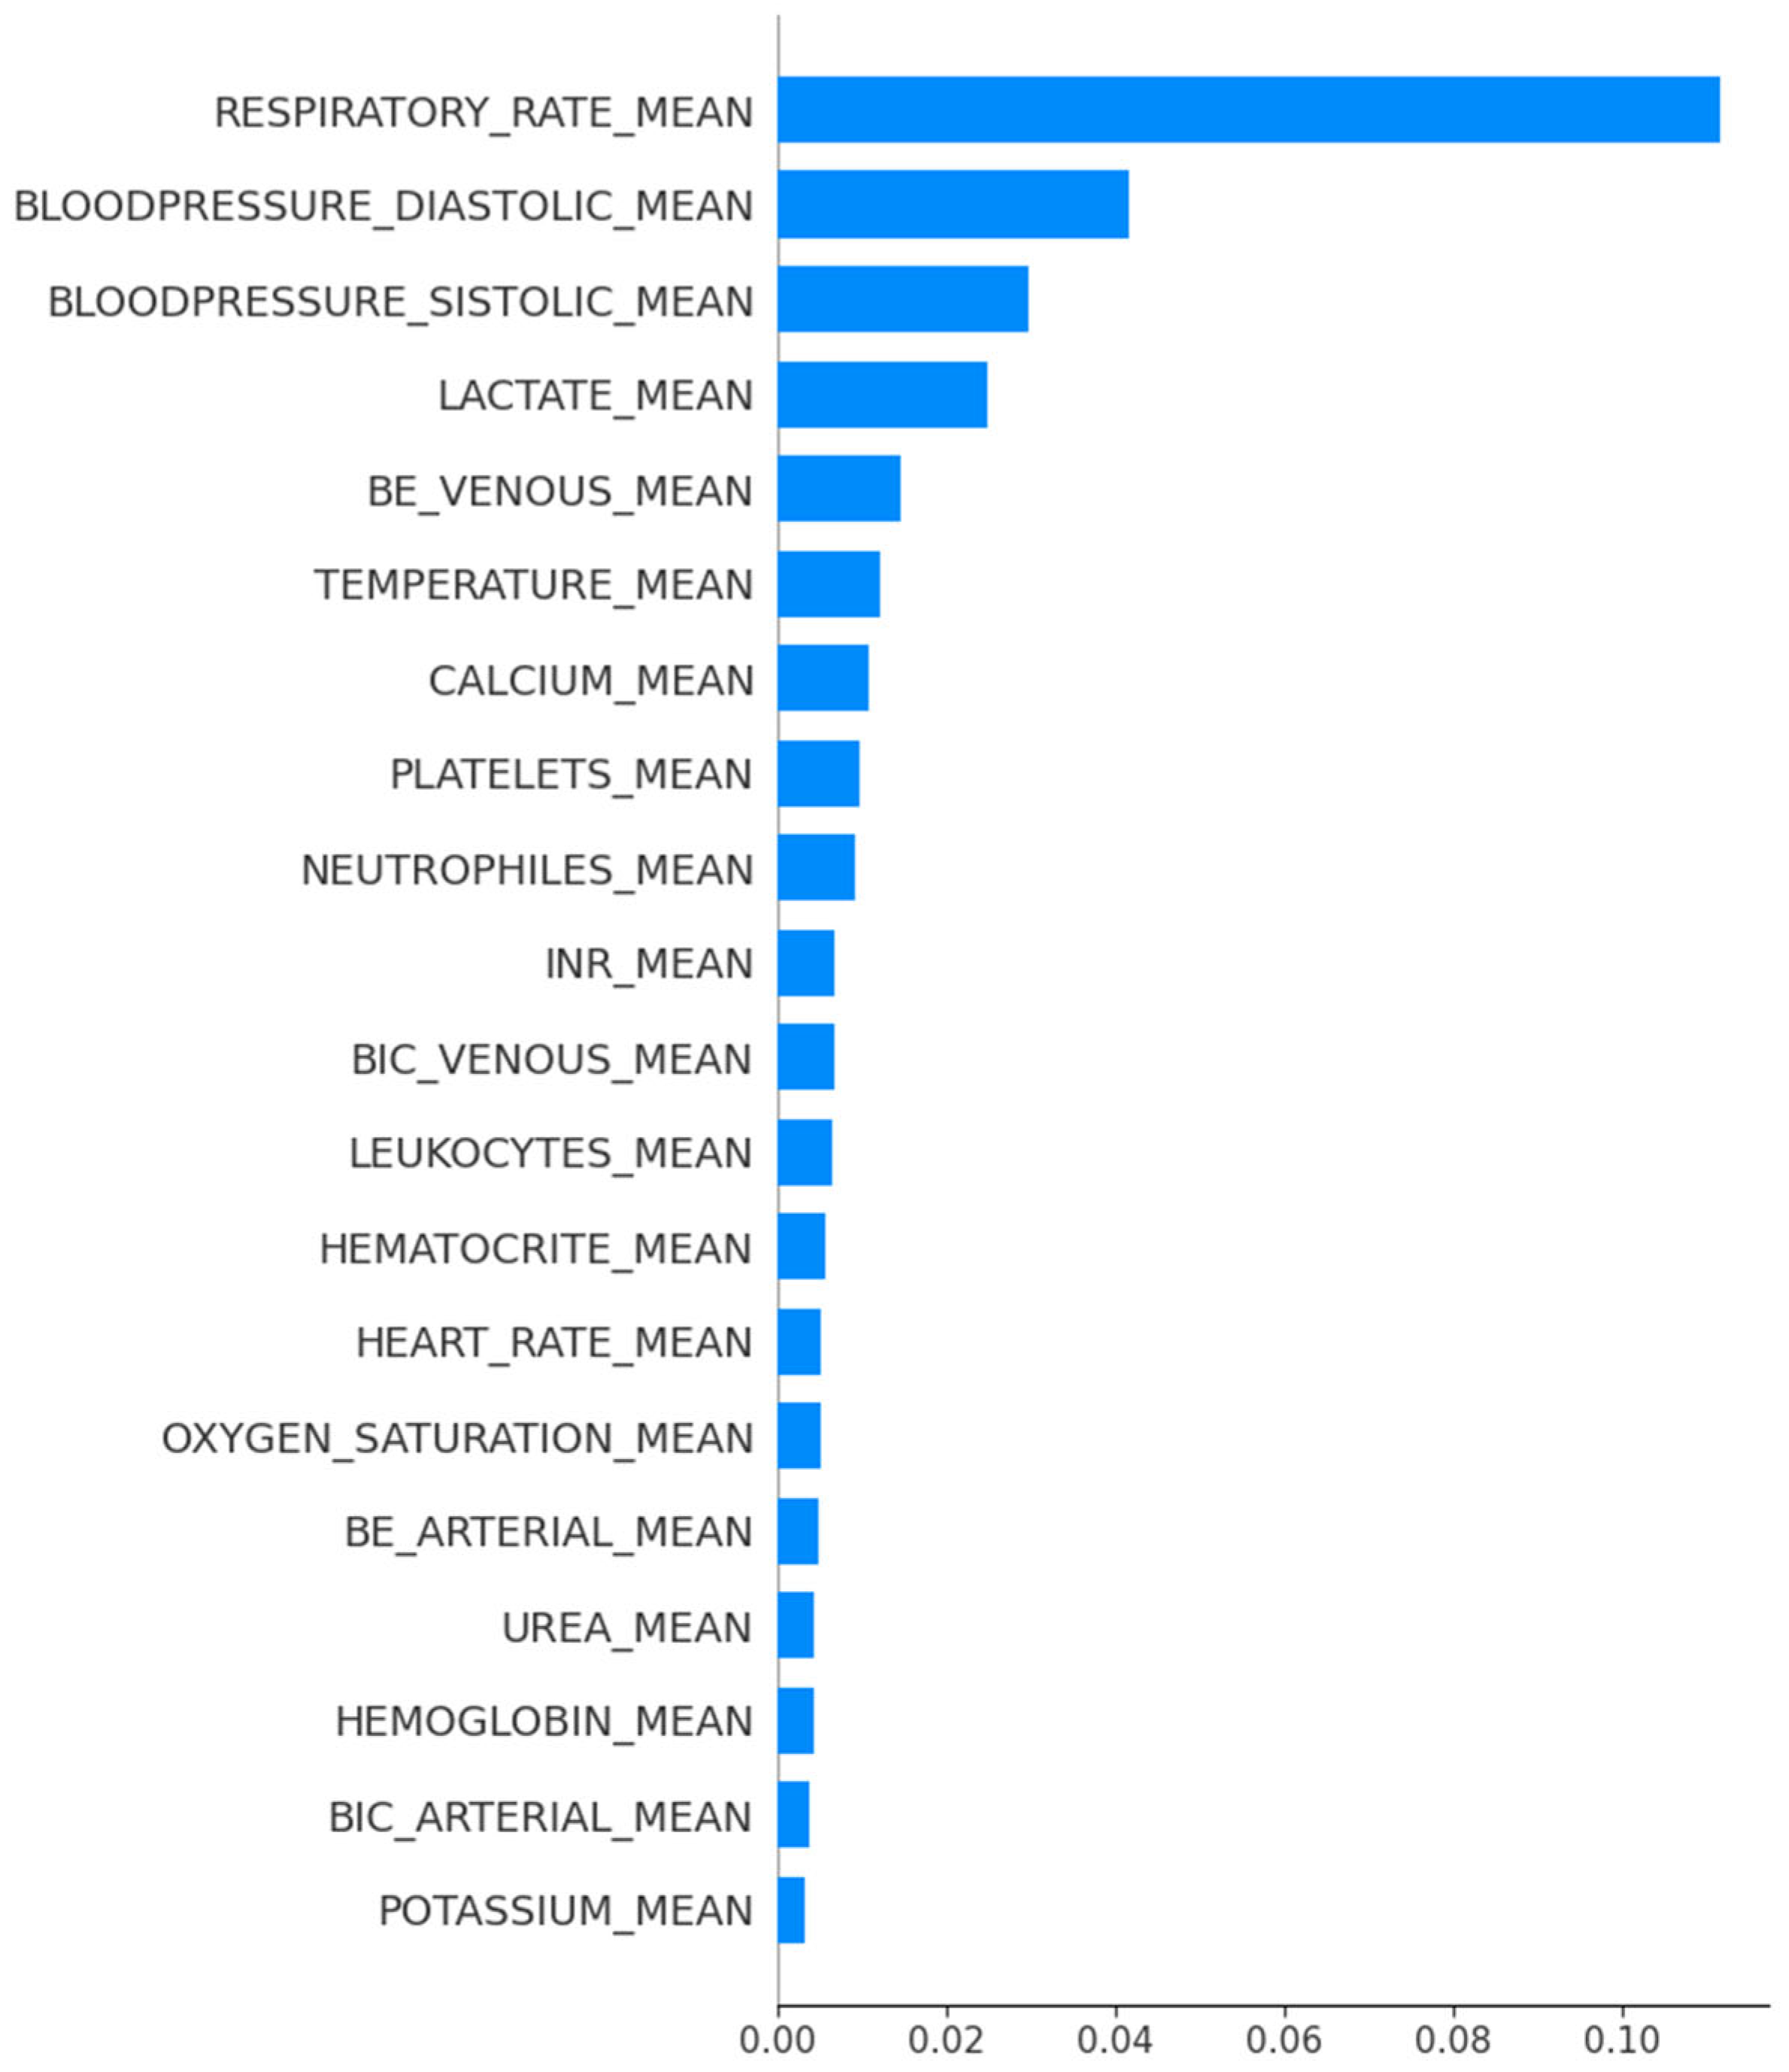
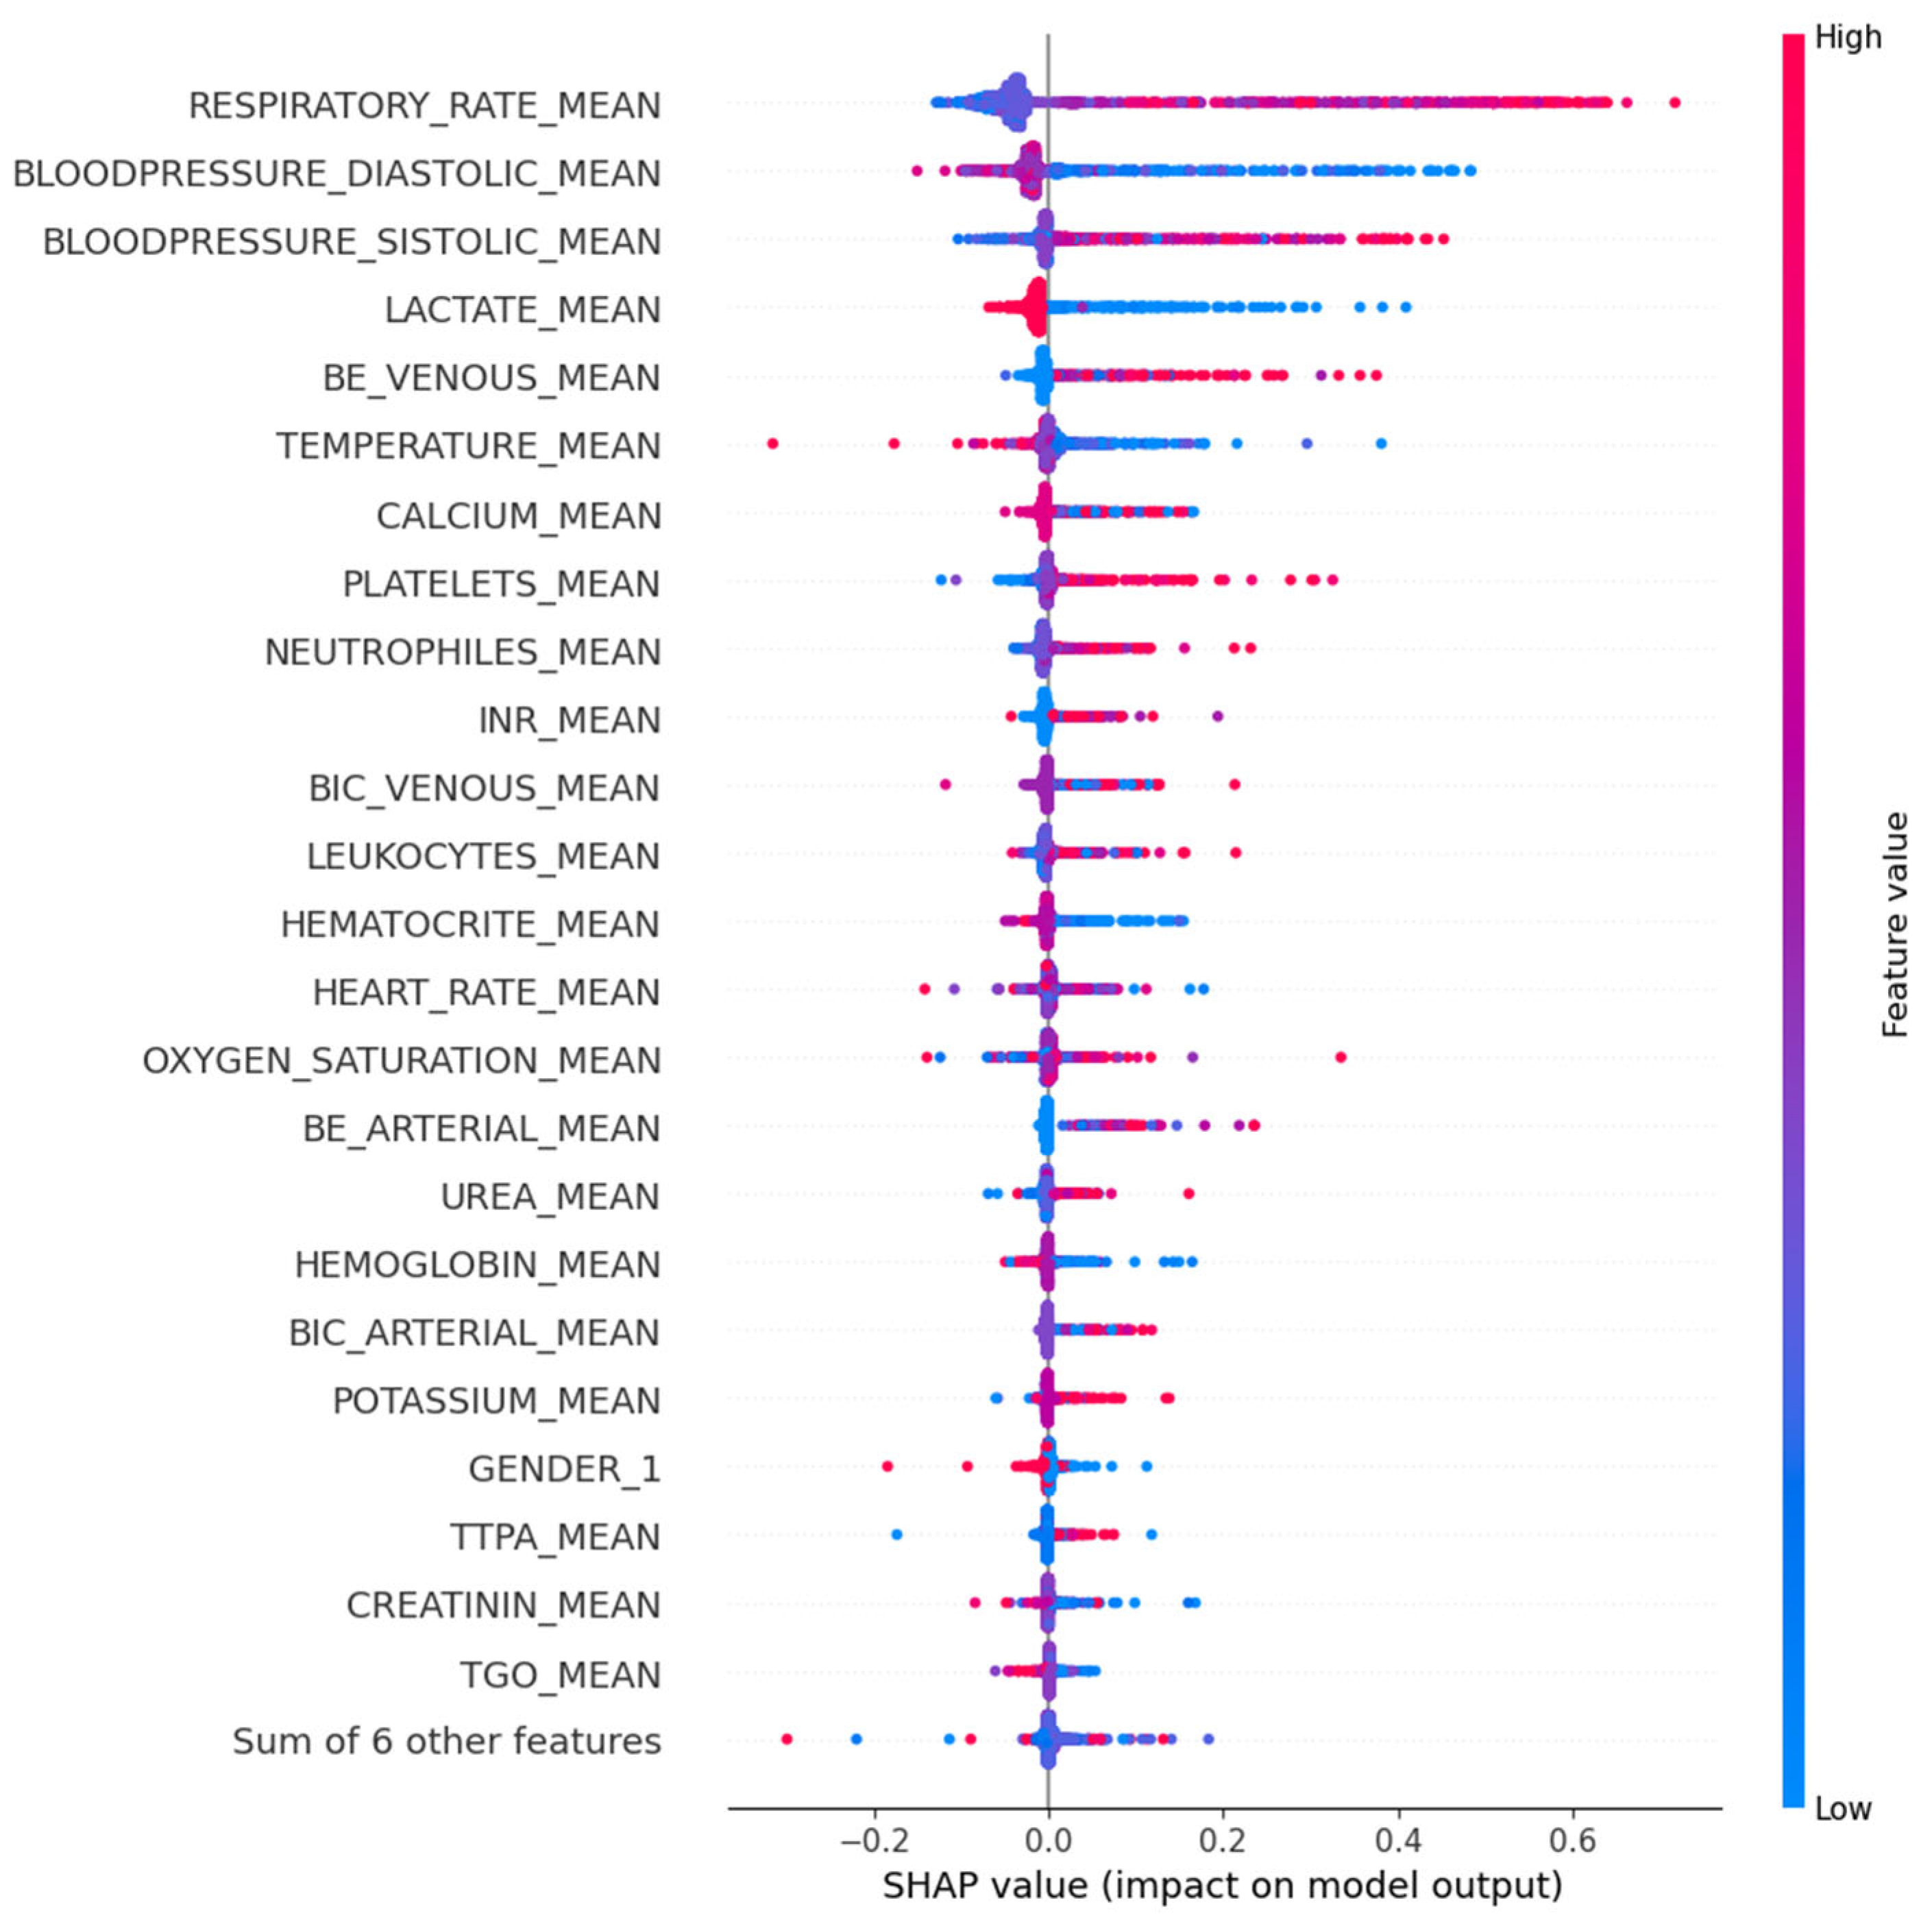
To interpret the predictions of the proposed stacked ensemble model, explainability analysis was performed using SHAP and permutation sensitivity analysis. SHAP analysis was conducted to quantify the contribution of each vital sign and biomarker to ICU admission prediction. Global feature importance was derived from the mean absolute SHAP values across all test samples. These values were used to rank predictors such as respiratory rate, systolic and diastolic blood pressure, lactate, and inflammatory markers. Additionally, SHAP summary plots were generated to examine both the magnitude and direction of feature influence, allowing identification of whether higher or lower feature values increased predicted ICU risk. To validate the robustness of SHAP findings, permutation importance was performed. Each feature was randomly shuffled in the dataset.

4. Results

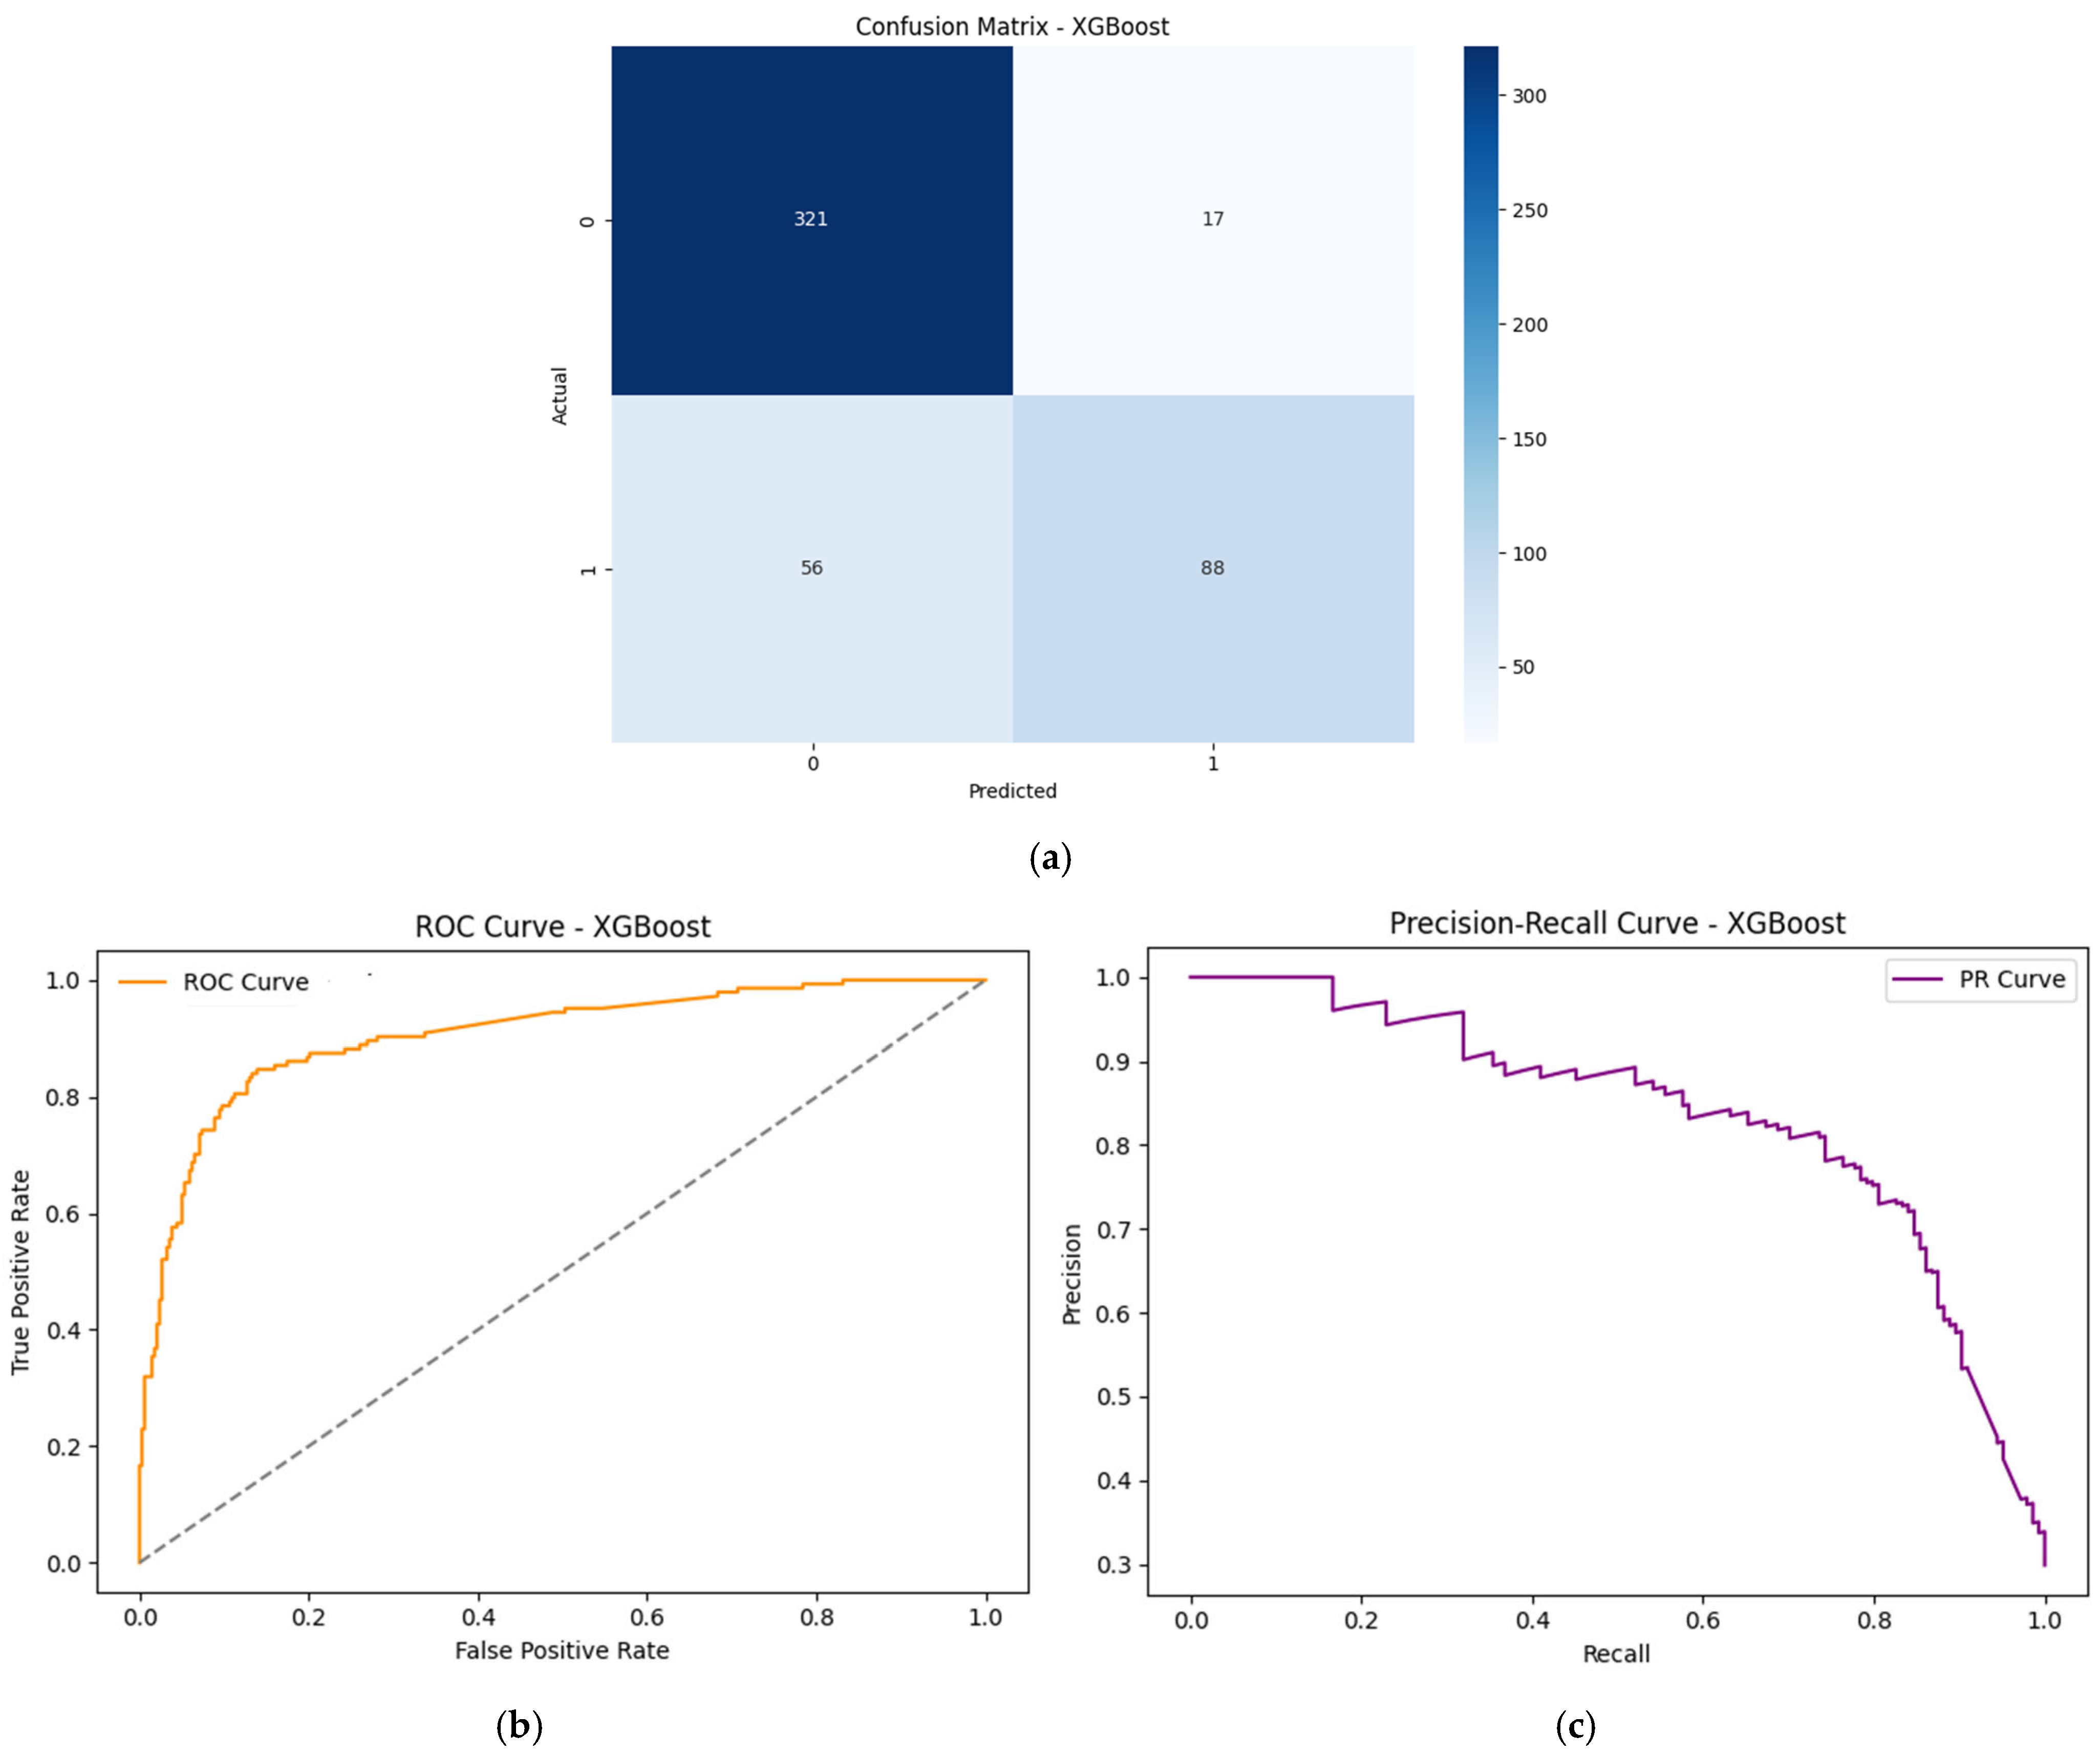
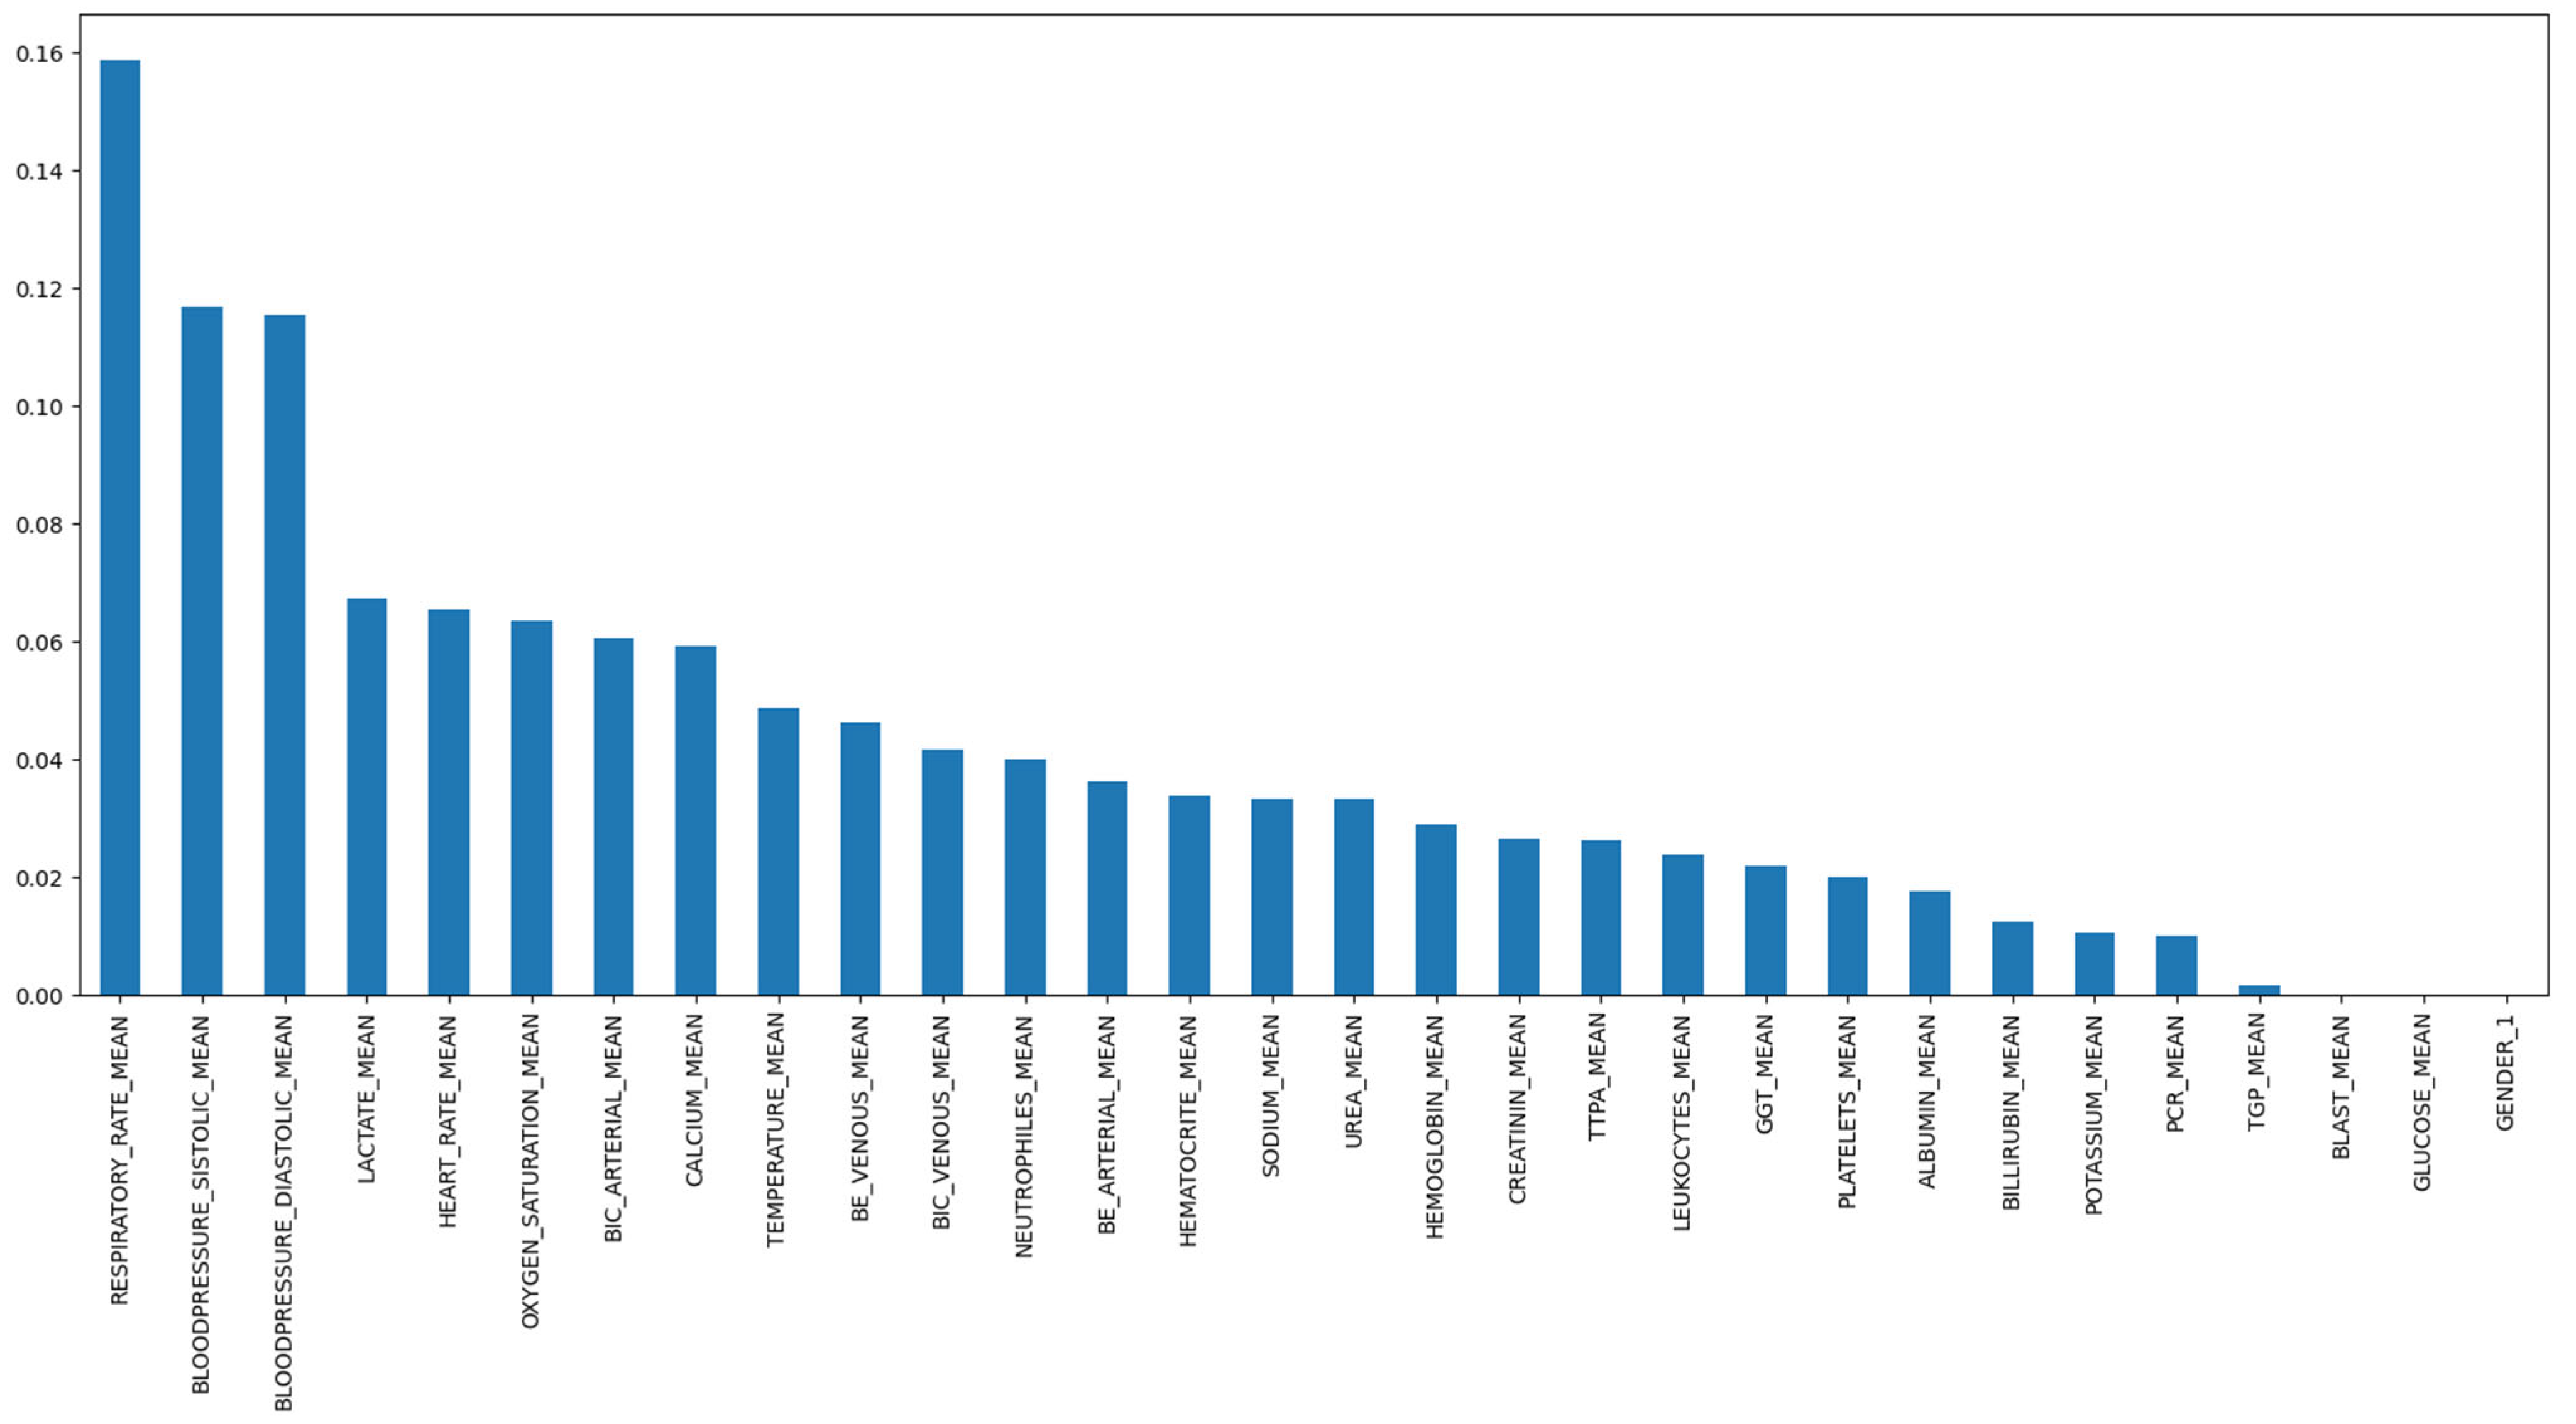
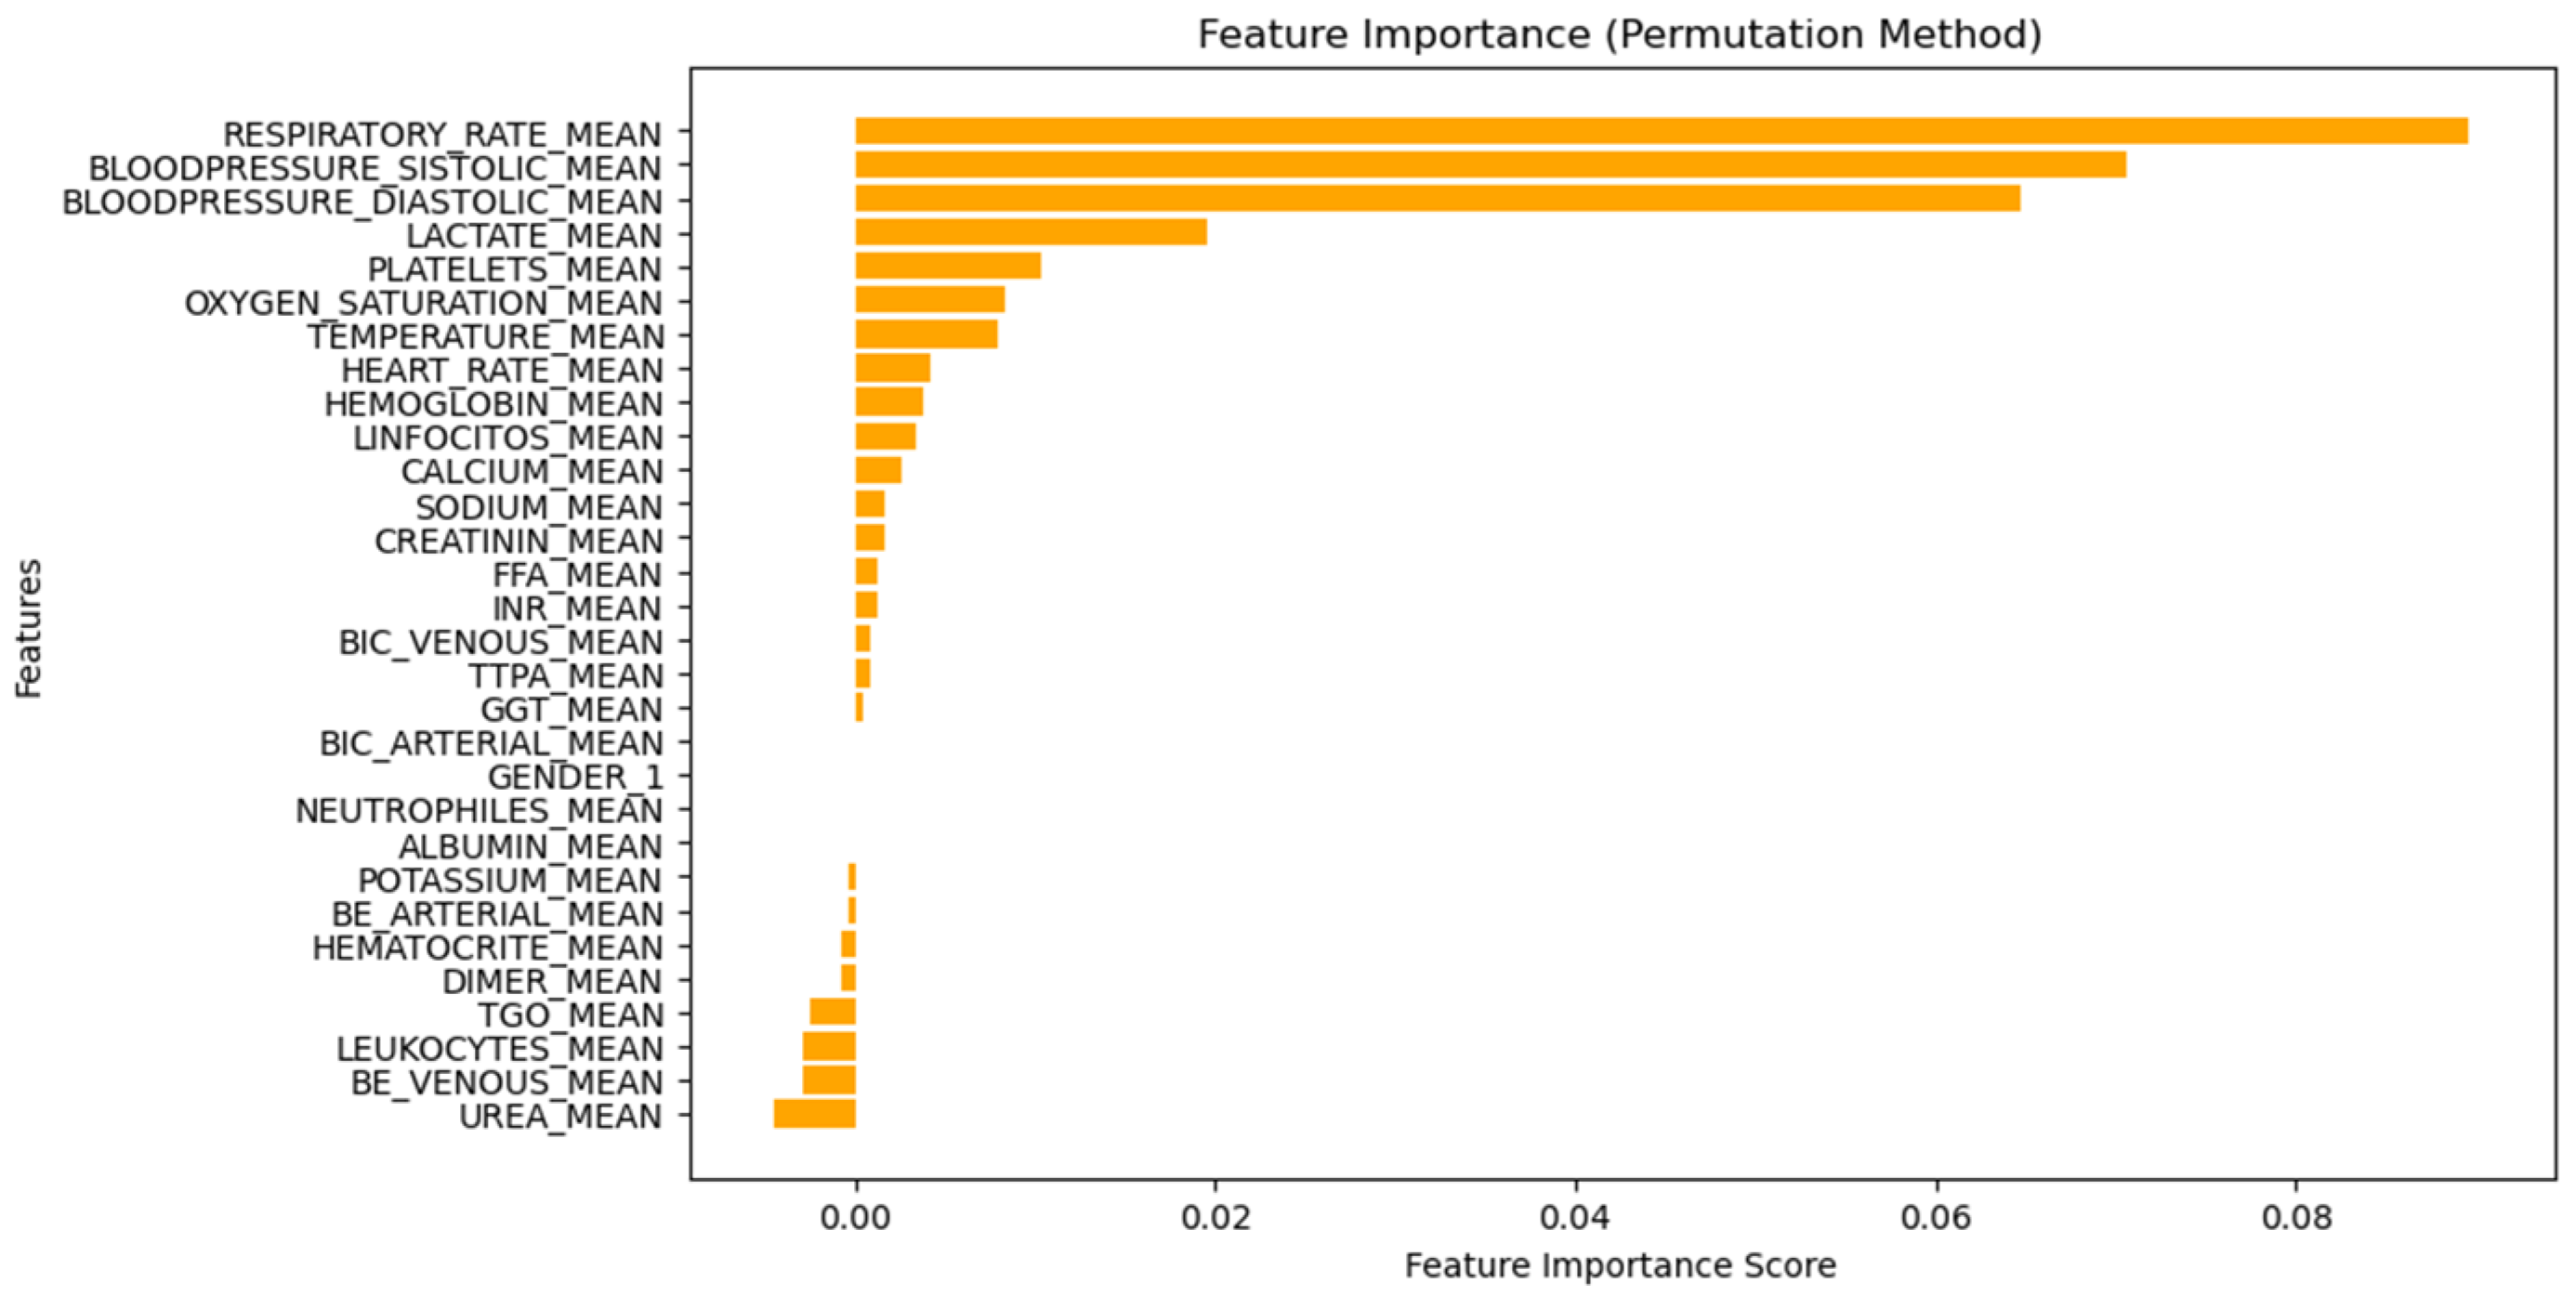
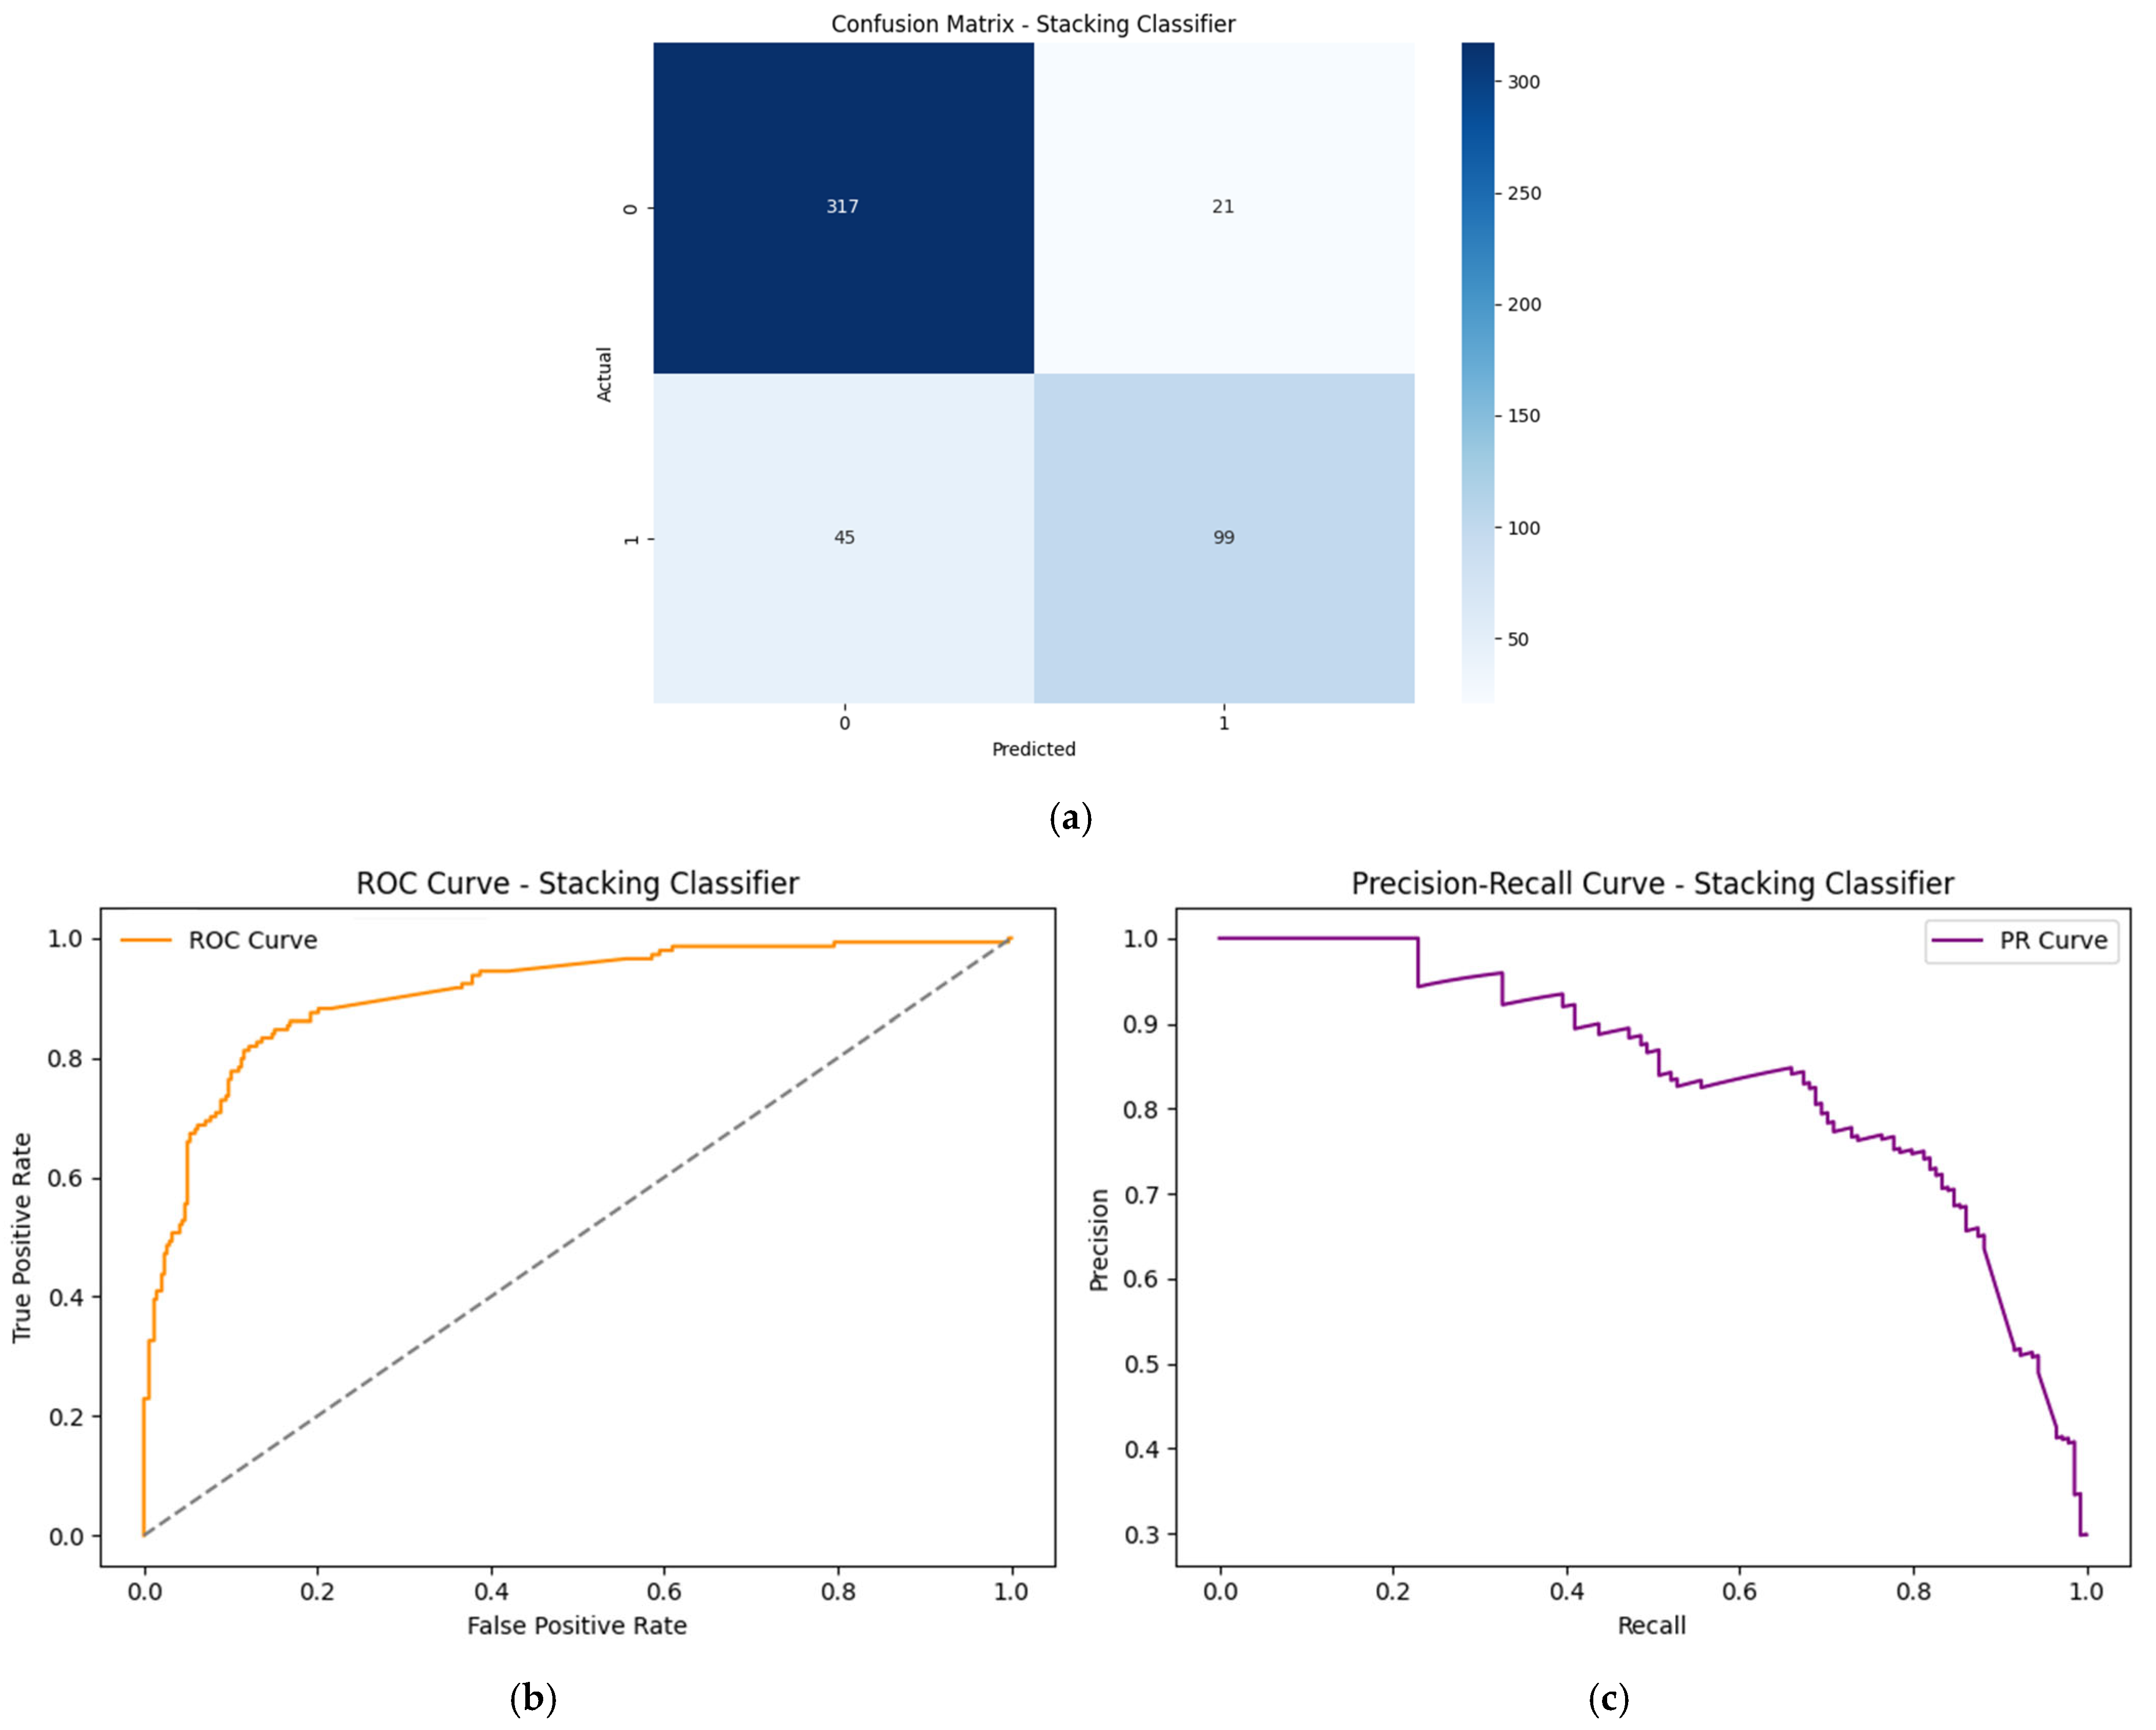
The hybrid feature selection pipeline identified lactate as the most significant predictor for classifying infectious disease severity and ICU admission risk, as confirmed by mutual information and SHAP analysis. To further interpret model behavior, Figure 4 shows a mutual information plot demonstrating how strongly each feature is associated with the prediction target. The machine-learning models, including Random Forest, Logistic Regression, Decision Tree, KNN, Adaboost, Catboost, XGBoost, and LightGBM, were compared with a stacking model. The stacking model achieved the highest performance with an AUC of 0.97, precision of 0.93, and recall of 0.91, as shown in Table 3. Figure 5 presents the mean absolute SHAP values for all features, indicating their average contribution to the model’s prediction output. Figure 6 presents a SHAP summary plot showing the distribution and direction of feature contributions to the model’s prediction across the dataset. Figure 7 shows a plot that ranks all features by their contribution to model accuracy. Figure 8 shows the impact on model performance when individual features are permuted or shuffled. The confusion matrix, ROC, and precision–recall curve for the XGBoost model are shown in Figure 9a–c. The confusion matrix, ROC, and precision–recall curve for the stacked model are presented in Figure 10a–c.

5. Discussion

Timely identification of disease advancement is essential, as delays in detection significantly contribute to increased morbidity and mortality among infectious patients. Strong performance metrics (AUC = 0.97, precision = 0.93, recall = 0.91) demonstrate that the proposed model is clinically reliable for early severity assessment. Indeed, the results shown here further suggest that integration of vital signs and hematological biomarkers with stacked ensemble machine-learning models, supplemented by explainable AI, allows for robust classification of disease severity and ICU risk, as evidenced by model comparisons and feature interpretations. Compared to models based on any single predictor, the multimodal and explainable approach enabled both strong predictive metrics and clinical trust by unmasking the most impactful clinical markers.
Indeed, the most important features, including mean respiratory rate and systolic and diastolic blood pressure, are of strong clinical relevance for the identification of inflammatory and metabolic dysregulation during the course of severe infection and thus validate the model outputs within established critical care practice. Markedly raised lactate represents metabolic dysfunction, indicating the onset of sepsis and multiple organ dysfunction. A low albumin concentration denotes a poor nutritional state and low physiological reserve. To add interpretability to predictions, explainable AI measures were integrated: SHAP and permutation importance. The findings, therefore, support the fact that machine learning methods can help improve early clinical decision-making in infectious disease management when integrated with clinical data.

6. Conclusions

Feature importance analysis, permutation sensitivity analysis, and SHAP-based interpretation were used to interpret the predictions of the proposed model. The model achieved strong predictive performance (AUC = 0.97), demonstrating its effectiveness in early severity classification. Respiratory rate emerged as the most influential feature across all analyses in identifying clinical deterioration. Blood pressure parameters (systolic and diastolic) were also identified as the top predictors in severe infectious conditions. Among biomarkers, lactate was among the most influential predictors in the model. Body temperature and venous base excess further contributed to severity prediction. Hematological biomarkers, including platelets, neutrophils, leukocytes, and hemoglobin, showed moderate importance. Variables such as oxygen saturation, albumin, creatinine, and potassium exhibited lower importance across all methods. This result is interpreted using a publicly available dataset, and further validation using real-world data is required before clinical application.

Author Contributions

S.P.: software, original draft, and data curation. G.M.B.: conceptualization, methodology, and funding acquisition. N.S.: resources, review and editing, and supervision. B.S.D.D.: project administration and formal analysis. All authors have read and agreed to the published version of the manuscript.

Funding

This research received no external funding.

Institutional Review Board Statement

Not applicable.

Informed Consent Statement

Not applicable.

Data Availability Statement

The dataset used in this study is from the Kaggle data source, “ICU Admission Data: Classification Model” — URL: https://www.kaggle.com/epdrumond/icu-admission-data-classification-model/data (accessed on 25 June 2025).

Acknowledgments

We would like to express our gratitude to the Manipal Academy of Higher Education for their support in conducting the research.

Conflicts of Interest

The authors declare no conflicts of interest.

References

  1. Chaw, J.K.; Chaw, S.H.; Quah, C.H.; Sahrani, S.; Ang, M.C.; Zhao, Y.; Ting, T.T. A predictive analytics model using machine learning algorithms to estimate the risk of shock development among dengue patients. Healthc. Anal. 2024, 5, 100290. [Google Scholar] [CrossRef] [Scilit]
  2. Wong, F.; de la Fuente-Nunez, C.; Collins, J.J. Leveraging artificial intelligence in the fight against infectious diseases. Science 2023, 381, 164–170. [Google Scholar] [CrossRef] [Scilit]
  3. Al Meslamani, A.Z.; Sobrino, I.; de la Fuente, J. Machine learning in infectious diseases: Potential applications and limitations. Ann. Med. 2024, 56, 2362869. [Google Scholar] [CrossRef] [Scilit]
  4. Bilsen, M.P.; Treep, M.M.; Aantjes, M.J.; van Andel, E.; Stalenhoef, J.E.; van Nieuwkoop, C.; Leyten, E.M.; Delfos, N.M.; van Uhm, J.I.; Sijbom, M.; et al. Diagnostic accuracy of urine biomarkers for urinary tract infection in older women: A case-control study. Clin. Microbiol. Infect. 2024, 30, 216–222. [Google Scholar] [CrossRef] [Scilit]
  5. Mancuso, G.; Midiri, A.; Gerace, E.; Marra, M.; Zummo, S.; Biondo, C. Urinary tract infections: The current scenario and future prospects. Pathogens 2023, 12, 623. [Google Scholar] [CrossRef] [Scilit]
  6. Czajkowski, K.; Broś-Konopielko, M.; Teliga-Czajkowska, J. Urinary tract infection in women. Prz. Menopauzalny 2021, 20, 40–47. [Google Scholar] [CrossRef] [Scilit]
  7. Evans, L.; Rhodes, A.; Alhazzani, W.; Antonelli, M.; Coopersmith, C.M.; French, C.; Machado, F.R.; Mcintyre, L.; Ostermann, M.; Prescott, H.C.; et al. Surviving sepsis campaign: International guidelines for management of sepsis and septic shock. Intensive Care Med. 2021, 47, 1181–1247. [Google Scholar] [CrossRef] [Scilit]
  8. Van der Poll, T.; Shankar-Hari, M.; Wiersinga, W.J. The immunology of sepsis. Immunity 2021, 54, 2450–2464. [Google Scholar] [CrossRef] [Scilit]
  9. Schlapbach, L.J.; Watson, R.S.; Sorce, L.R.; Argent, A.C.; Menon, K.; Hall, M.W.; Akech, S.; Albers, D.J.; Alpern, E.R.; Balamuth, F.; et al. International consensus criteria for pediatric sepsis and septic shock. JAMA 2024, 331, 665–674. [Google Scholar] [CrossRef] [Scilit] [PubMed]
  10. Torres, J.S.S.; Tamayo-Giraldo, F.J.; Bejarano-Zuleta, A.; Nati-Castillo, H.A.; Quintero, D.A.; Ospina-Mejía, M.J.; Salazar-Santoliva, C.; Suárez-Sangucho, I.; Ortiz-Prado, E.; Izquierdo-Condoy, J.S. Sepsis and post-sepsis syndrome: A multisystem challenge requiring comprehensive care and management—A review. Front. Med. 2025, 12, 1560737. [Google Scholar] [CrossRef] [Scilit] [PubMed]
  11. Giamarellos-Bourboulis, E.J.; Aschenbrenner, A.C.; Bauer, M.; Bock, C.; Calandra, T.; Gat-Viks, I.; Kyriazopoulou, E.; Lupse, M.; Monneret, G.; Pickkers, P.; et al. The pathophysiology of sepsis and precision-medicine-based immunotherapy. Nat. Immunol. 2024, 25, 19–28. [Google Scholar] [CrossRef] [Scilit]
  12. Menon, K.; Schlapbach, L.J.; Akech, S.; Argent, A.; Biban, P.; Carrol, E.D.; Chiotos, K.; Chisti, M.J.; Evans, I.V.R.; Inwald, D.P.; et al. Criteria for pediatric sepsis—A systematic review and meta-analysis by the pediatric sepsis definition taskforce. Crit. Care Med. 2022, 50, 21–36. [Google Scholar] [CrossRef] [Scilit] [PubMed]
  13. Gilholm, P.; Raman, S.; Irwin, A.; Lister, P.; Harley, A.; Schlapbach, L.J.; Gibbons, K.S. Identification of distinct clinical profiles of sepsis risk in paediatric emergency department patients using Bayesian profile regression. BMJ Paediatr. Open 2025, 9, e003100. [Google Scholar] [CrossRef] [Scilit]
  14. Baker, R.E.; Mahmud, A.S.; Miller, I.F.; Rajeev, M.; Rasambainarivo, F.; Rice, B.L.; Takahashi, S.; Tatem, A.J.; Wagner, C.E.; Wang, L.-F.; et al. Infectious disease in an era of global change. Nat. Rev. Microbiol. 2022, 20, 193–205. [Google Scholar] [CrossRef] [Scilit] [PubMed]
  15. Ugwu, O.P.C.; Alum, E.U.; Ugwu, J.N.; Eze, V.H.U.; Ugwu, C.N.; Ogenyi, F.C.; Okon, M.B. Harnessing technology for infectious disease response in conflict zones: Challenges, innovations, and policy implications. Medicine 2024, 103, e38834. [Google Scholar] [CrossRef] [Scilit] [PubMed]
  16. Colak, M.; Kilinc, M.A.; Güven, R.; Kutlu, N.O. Procalcitonin and blood lactate level as predictive biomarkers in pediatric multiple trauma patients’ pediatric intensive care outcomes: A retrospective observational study. Medicine 2023, 102, e36289. [Google Scholar] [CrossRef] [Scilit]
  17. Wald, E.R.; Schmit, K.M.; Gusland, D.Y. A pediatric infectious disease perspective on COVID-19. Clin. Infect. Dis. 2021, 72, 1660–1666. [Google Scholar] [CrossRef] [Scilit] [PubMed]
  18. Alsabri, M.; Siddiq, A.; Aderinto, N.; Ishola, I.V.; Shahid, M.A.; Kaul, A.; Taha, N.A.; Ahmad, A.H.; Gamboa, L.L. Infectious Disease Management in Pediatric Emergency Departments in Low-and Middle-Income Countries: A Review of Diagnostic Tools, Treatment Protocols, and Preventive Measures. Glob. Pediatr. Health 2024, 11, 2333794X241304663. [Google Scholar] [CrossRef] [Scilit]
  19. Fauziah, N.; Aviani, J.K.; Agrianfanny, Y.N.; Fatimah, S.N. Intestinal parasitic infection and nutritional status in children under five years old: A systematic review. Trop. Med. Infect. Dis. 2022, 7, 371. [Google Scholar] [CrossRef] [Scilit]
  20. Clemente, C.; Fuentes Ferrer, M.E.; Ortega Heredia, D.; Julián Jiménez, A.; Martín-Sánchez, F.J.; González Del Castillo, J. Usefulness of combining inflammatory biomarkers and clinical scales in an emergency department to stratify risk in patients with infections. Emergencias 2024, 36, 9–16. [Google Scholar] [CrossRef] [Scilit]
  21. Brunker, L.B.; Boncyk, C.S.; Rengel, K.F.; Hughes, C.G. Elderly patients and management in intensive care units (ICU): Clinical challenges. Clin. Interv. Aging 2023, 18, 93–112. [Google Scholar] [CrossRef] [Scilit]
  22. Bodaghi, A.; Fattahi, N.; Ramazani, A. Biomarkers: Promising and valuable tools towards diagnosis, prognosis and treatment of Covid-19 and other diseases. Heliyon 2023, 9, e13323. [Google Scholar] [CrossRef] [Scilit]
  23. Scavello, F.; Brunetta, E.; Mapelli, S.N.; Nappi, E.; Martin, I.D.G.; Sironi, M.; Leone, R.; Solane, S.; Angelotti, G.; Supino, D.; et al. The long Pentraxin PTX3 serves as an early predictive biomarker of co-infections in COVID-19. eBioMedicine 2024, 105, 105213. [Google Scholar] [PubMed]
  24. Zaman, N.I.D.; Hau, Y.W.; Leong, M.C.; Al-Ashwal, R.H.A. A review on the significance of body temperature interpretation for early infectious disease diagnosis. Artif. Intell. Rev. 2023, 56, 15449–15494. [Google Scholar] [CrossRef] [Scilit]
  25. Awotunde, J.B.; Folorunso, S.O.; Bhoi, A.K.; Adebayo, P.O.; Ijaz, M.F. Disease diagnosis system for IoT-based wearable body sensors with machine learning algorithm. In Hybrid Artificial Intelligence and IoT in Healthcare; Springer: Singapore, 2021; pp. 201–222. [Google Scholar]
  26. Goergen, C.J.; Tweardy, M.J.; Steinhubl, S.R.; Wegerich, S.W.; Singh, K.; Mieloszyk, R.J.; Dunn, J. Detection and monitoring of viral infections via wearable devices and biometric data. Annu. Rev. Biomed. Eng. 2022, 24, 1–27. [Google Scholar] [CrossRef] [Scilit]
  27. Ahmad, A.; Imran, M.; Ahsan, H. Biomarkers as biomedical bioindicators: Approaches and techniques for the detection, analysis, and validation of novel biomarkers of diseases. Pharmaceutics 2023, 15, 1630. [Google Scholar] [CrossRef] [Scilit] [PubMed]
  28. Marques, L.; Costa, B.; Pereira, M.; Silva, A.; Santos, J.; Saldanha, L.; Silva, I.; Magalhães, P.; Schmidt, S.; Vale, N. Advancing precision medicine: A review of innovative in silico approaches for drug development, clinical pharmacology and personalized healthcare. Pharmaceutics 2024, 16, 332. [Google Scholar] [CrossRef] [Scilit] [PubMed]
  29. Tong, L.; Shi, W.; Isgut, M.; Zhong, Y.; Lais, P.; Gloster, L.; Sun, J.; Swain, A.; Giuste, F.; Wang, M.D. Integrating multi-omics data with EHR for precision medicine using advanced artificial intelligence. IEEE Rev. Biomed. Eng. 2023, 17, 80–97. [Google Scholar] [CrossRef] [Scilit]
  30. Upadhyaya, D.P.; Tarabichi, Y.; Prantzalos, K.; Ayub, S.; Kaelber, D.C.; Sahoo, S.S. Machine learning interpretability methods to characterize the importance of hematologic biomarkers in prognosticating patients with suspected infection. Comput. Biol. Med. 2024, 183, 109251. [Google Scholar] [CrossRef] [Scilit]
  31. Konjety, P.; Chakole, V.G.; Konjety, P., Jr.; Pathade, A.G. Beyond the Horizon: A Comprehensive Review of Contemporary Strategies in Sepsis Management Encompassing Predictors, Diagnostic Tools, and Therapeutic Advances. Cureus 2024, 16, e64249. [Google Scholar] [CrossRef] [Scilit]
  32. Zhou, W.; Wang, Y.; Gu, X.; Feng, Z.P.; Lee, K.; Peng, Y.; Barszczyk, A. Importance of general adiposity, visceral adiposity and vital signs in predicting blood biomarkers using machine learning. Int. J. Clin. Pract. 2021, 75, e13664. [Google Scholar] [CrossRef] [Scilit]
  33. Mayne, E.S.; George, J.A.; Louw, S. Assessing biomarkers in viral infection. In Application of Omic Techniques to Identify New Biomarkers and Drug Targets for COVID-19; Springer: Cham, Switzerland, 2023; pp. 159–173. [Google Scholar]
  34. Fazal, M. C-reactive protein a promising biomarker of COVID-19 severity. Korean J. Clin. Lab. Sci. 2021, 53, 201–207. [Google Scholar] [CrossRef] [Scilit]
  35. Jazayeri, A.; Yang, C.C.; Capan, M. Frequent temporal patterns of physiological and biological biomarkers and their evolution in sepsis. Artif. Intell. Med. 2023, 143, 102576. [Google Scholar] [CrossRef] [Scilit]
  36. Zhang, B.; Shi, H.; Wang, H. Machine learning and AI in cancer prognosis, prediction, and treatment selection: A critical approach. J. Multidiscip. Healthc. 2023, 16, 1779–1791. [Google Scholar] [CrossRef] [Scilit]
  37. Gu, Q.; Wei, J.; Yoon, C.H.; Yuan, K.; Jones, N.; Brent, A.; Llewelyn, M.; Peto, T.E.; Pouwels, K.B.; Eyre, D.W.; et al. Distinct patterns of vital sign and inflammatory marker responses in adults with suspected bloodstream infection. J. Infect. 2024, 88, 106156. [Google Scholar] [CrossRef] [Scilit] [PubMed]
  38. Uffen, J.W.; Oosterheert, J.J.; Schweitzer, V.A.; Thursky, K.; Kaasjager, H.A.H.; Ekkelenkamp, M.B. Interventions for rapid recognition and treatment of sepsis in the emergency department: A narrative review. Clin. Microbiol. Infect. 2021, 27, 192–203. [Google Scholar] [CrossRef] [Scilit] [PubMed]
  39. Noor, N.M.; Sousa, P.; Paul, S.; Roblin, X. Early diagnosis, early stratification, and early intervention to deliver precision medicine in IBD. Inflamm. Bowel Dis. 2022, 28, 1254–1264. [Google Scholar]
  40. Ansari Khoushabar, M.; Ghafariasl, P. Advanced Meta-Ensemble Machine Learning Models for Early and Accurate Sepsis Prediction to Improve Patient Outcomes. arXiv 2024, arXiv:2407.08107. [Google Scholar] [CrossRef] [Scilit]
  41. Gangula, R.; Thirupathi, L.; Parupati, R.; Sreeveda, K.; Gattoju, S. Ensemble machine learning based prediction of dengue disease with performance and accuracy elevation patterns. Mater. Today Proc. 2023, 80, 3458–3463. [Google Scholar] [CrossRef] [Scilit]
  42. Santangelo, O.E.; Gentile, V.; Pizzo, S.; Giordano, D.; Cedrone, F. Machine learning and prediction of infectious diseases: A systematic review. Mach. Learn. Knowl. Extr. 2023, 5, 175–198. [Google Scholar] [CrossRef] [Scilit]
  43. Xu, C.; Zhao, L.Y.; Ye, C.S.; Xu, K.C.; Xu, K.Y. The application of machine learning in clinical microbiology and infectious diseases. Front. Cell. Infect. Microbiol. 2025, 15, 1545646. [Google Scholar] [CrossRef] [Scilit] [PubMed]
  44. Lam, C.; Calvert, J.; Siefkas, A.; Barnes, G.; Pellegrini, E.; Green-Saxena, A.; Hoffman, J.; Mao, Q.; Das, R. Personalized stratification of hospitalization risk amidst COVID-19: A machine learning approach. Health Policy Technol. 2021, 10, 100554. [Google Scholar] [CrossRef] [Scilit]
Figure 1. Pearson correlation matrix.
Information 17 00227 g001
Figure 2. Feature selection workflow.
Information 17 00227 g002
Figure 3. Stacking methodology.
Information 17 00227 g003
Figure 4. Mutual information plot.
Information 17 00227 g004
Figure 5. Feature importance derived using SHAP.
Information 17 00227 g005
Figure 6. SHAP summary plot showing feature impact.
Information 17 00227 g006
Figure 7. Feature importance score.
Information 17 00227 g007
Figure 8. Permutation sensitivity analysis.
Information 17 00227 g008
Figure 9. (a). Confusion matrix of XGBoost. (b) ROC curve of XGBoost. (c) Precision–recall curve of XGBoost.
Information 17 00227 g009
Figure 10. (a) Confusion matrix of stacking. (b) ROC curve for stacking. (c) Precision–recall curve for stacking.
Information 17 00227 g010
Table 1. Attributes chosen in this study.
SI No.Clinical MarkerMarker DescriptionUnit
1AlbuminA protein made by the liverg/dL
2Base ExcessAmount of excess base in bloodmmol/L
3BicarbonateMain buffer in bloodmmol/L
4BilirubinBreakdown product of hemoglobinmg/dL
5Blast CellsImmature blood cells% or cells/µL
6CalciumMineral essential for bone, nerve, and muscle functionmg/dL
7CreatinineWaste product from muscle metabolismmg/dL
8Gamma-Glutamyl-TransferaseEnzyme produced in liver and bile ductsIU/L
9GlucoseMain blood sugarmg/dL
10HematocritThe percentage of blood volume made up by red blood cells.%
11HemoglobinOxygen-carrying molecule in red blood cellsg/dL
12LactateBy-product of anaerobic metabolismmmol/L
13LeukocytesWhite blood cells of the immune system103/µL
14NeutrophilsA subtype of white blood cells%
15C-Reactive ProteinAcute-phase protein produced by the livermg/L
16PlateletsSmall cells involved in clot formation103/µL
17PotassiumMain intracellular electrolytemmol/L
18SodiumMajor extracellular cationmmol/L
19Alanine aminotransferaseLiver enzymeIU/L
20Activated partial thromboplastin timeTime taken for blood to clot via the intrinsic pathwayseconds
21UreaEnd-product of protein metabolismmg/dL
SI No.Vital SignsVital sign descriptionUnit
1Body TemperatureIndicates core heat of the body°C
2Systolic Blood PressurePressure generated when the heart contracts and pumps blood into the arteriesmmHg
3Diastolic Blood PressureThe pressure in the arteries when the heart relaxes between beatsmmHg
4Respiratory RateNumber of breaths taken per minuteBreaths/Minute
5Heart RateNumber of heartbeats per minuteBeats/Minute
6Oxygen SaturationThe percentage of hemoglobin in arterial blood that is carrying oxygen%
Table 2. Number of measurements per clinical marker in non-severe and severe patients.
MarkerLabelNumber of Instances
Albumin MeanNon-severe533
Albumin MeanSevere288
Base Excess Arterial MeanNon-severe533
Base Excess Arterial MeanSevere288
Base Excess Venous MeanNon-severe533
Base Excess Venous MeanSevere288
Bicarbonate Arterial MeanNon-severe533
Bicarbonate Arterial MeanSevere288
Bicarbonate Venous MeanNon-severe533
Bicarbonate Venous MeanSevere288
Bilirubin MeanNon-severe533
Bilirubin MeanSevere288
Blast MeanNon-severe533
Blast MeanSevere288
Calcium MeanNon-severe533
Calcium MeanSevere288
Creatinine MeanNon-severe533
Creatinine MeanSevere288
Gamma-Glutamyl-Transferase MeanNon-severe533
Gamma-Glutamyl-Transferase MeanSevere288
Glucose MeanNon-severe533
Glucose MeanSevere288
Hematocrit MeanNon-severe533
Hematocrit MeanSevere288
Hemoglobin MeanNon-severe533
Hemoglobin MeanSevere288
Lactate MeanNon-severe533
Lactate MeanSevere288
Leukocytes MeanNon-severe533
Leukocytes MeanSevere288
Neutrophils MeanNon-severe533
Neutrophils MeanSevere288
C-Reactive Protein MeanNon-severe533
C-Reactive Protein MeanSevere288
Platelets MeanNon-severe533
Platelets MeanSevere288
Potassium MeanNon-severe533
Potassium MeanSevere288
Sodium MeanNon-severe533
Sodium MeanSevere288
Alanine Aminotransferase MeanNon-severe533
Alanine Aminotransferase MeanSevere288
Activated Partial Thromboplastin Time MeanNon-severe533
Activated Partial Thromboplastin Time MeanSevere288
Urea MeanNon-severe533
Urea MeanSevere288
Blood Pressure Diastolic MeanNon-severe778
Blood Pressure Diastolic MeanSevere462
Blood Pressure Systolic MeanNon-severe778
Blood Pressure Systolic MeanSevere462
Heart Rate MeanNon-severe785
Heart Rate MeanSevere455
Temperature MeanNon-severe779
Temperature MeanSevere452
Oxygen Saturation MeanNon-severe788
Oxygen Saturation MeanSevere451
Respiratory Rate MeanNon-severe730
Respiratory Rate MeanSevere447
Table 3. Performance of ML models (with XAI integration).
ModelAUCPrecisionRecall
Logistic Regression0.840.800.78
SVM0.860.820.79
Decision Tree0.870.830.80
KNN0.880.840.81
AdaBoost0.910.860.83
Light GBM0.940.890.86
CatBoost0.950.900.87
XGboost0.960.920.89
Stacking (Ensemble)0.970.930.91
Disclaimer/Publisher’s Note: The statements, opinions and data contained in all publications are solely those of the individual author(s) and contributor(s) and not of MDPI and/or the editor(s). MDPI and/or the editor(s) disclaim responsibility for any injury to people or property resulting from any ideas, methods, instructions or products referred to in the content.