Review

Beyond the Comfort Zone: A Review and Gap Analysis of Fuzzing in Smart City IoT Ecosystems

School of Cyber Science and Engineering, Sichuan University, Chengdu 610207, China
*
Author to whom correspondence should be addressed.
Information 2026, 17(3), 218; https://doi.org/10.3390/info17030218
Submission received: 31 December 2025 / Revised: 17 February 2026 / Accepted: 20 February 2026 / Published: 24 February 2026
(This article belongs to the Special Issue IoT-Based Systems for Resilient Smart Cities)

Abstract

With the widespread application of Internet of Things (IoT) technology in smart cities, its security issues have become increasingly prominent. Fuzzing, as an efficient automated vulnerability discovery technique, has been widely used in IoT security assessment. However, current research mostly focuses on general IoT environments or specific device types, lacking a systematic analysis of the complex, dynamic, and deeply integrated context of smart cities. This paper presents a review and integration of 42 representative IoT fuzzing studies published between 2021 and 2025, analyzed via an eight-dimensional analytical framework. It reveals significant gaps with reports on real-world attacks on the IoT systems between current research and the practical security needs of smart cities across three dimensions: device, protocol, and methodology. Based on this, this paper innovatively proposes: (1) an Observability-Complexity Based IoT Device Classification Model based on device observability and business logic complexity, providing a navigation chart for migrating testing capabilities across devices; (2) a technology migration framework based on protocol feature matching, facilitating rapid coverage of emerging and vertical protocols; (3) a methodological evolution path from “vulnerability mining” to “system resilience probing.” This research aims to promote the future role of IoT fuzzing in the assessment and assurance of smart city security resilience by providing structured analytical tools and clear research directions.

1. Introduction

Smart cities have emerged as a core platform for the deep integration of the digital economy and physical space. Enabled by the Internet of Things (IoT) technology, smart cities are profoundly reshaping the operations of modern society. These systems span domains such as transportation, energy, and public safety. Billions of interconnected embedded devices form the city’s ‘sensory and nervous systems,’ enabling data-driven decision-making and services. According to the latest IDC forecast, the total number of globally connected IoT devices will reach 31 billion by 2025. Deployments in smart city scenarios are predicted to constitute a significant portion of this ecosystem, accounting for 17.7% (approximately 5.5 billion devices) [1].
However, IoT systems in smart cities are fundamentally distinct from those in consumer electronics or general industrial IoT scenarios. They are deeply embedded in urban physical infrastructure and support core public service functions. These systems exhibit massive heterogeneity and deep cyber–physical coupling. Moreover, they are mission-critical by nature, as they are directly linked to urban lifelines such as transportation, energy, and water supply. This means that the consequences of security failures escalate from data breaches directly to physical damage, service paralysis, and even public safety crises. Consequently, their security requirements, failure impacts, and the corresponding testing and evaluation paradigms differ radically from the goal of protecting general IoT devices from data leaks or service disruptions. Therefore, the testing methods and evaluation criteria (i.e., metrics and safety conditions to evaluate the effectiveness of a fuzzing technique) applicable to general IoT are called into question in this context.
Therefore, in smart cities, security threats carry severe consequences and often stem from systemic vulnerabilities. While pervasive connectivity offers immense benefits, it also dramatically expands the cyber attack surface. Resource constraints, long device lifecycles, and often fragile security measures make IoT devices attractive targets. Exploiting vulnerabilities can lead to large-scale disruptions, sensitive data breaches, and tangible physical damage, directly threatening urban resilience and citizen safety. Landmark incidents underscore this risk: The Stuxnet worm [2], first discovered in 2010, primarily targeted Siemens S7-315 and S7-417 model industrial control systems. By exploiting multiple vulnerabilities in the Windows operating system and the Siemens SIMATIC WinCC system, it became the first known cyber weapon capable of inflicting physical damage on real-world infrastructure. In December 2017, FireEye’s Mandiant team disclosed incident response details regarding the TRITON framework [3]. The TRITON malware leveraged a zero-day vulnerability in the Schneider Electric Triconex Safety Instrumented System to launch a cyber-attack against an oil and gas plant in the Middle East, resulting in the plant’s operational shutdown. In 2020, the JSOF research laboratory discovered the Ripple20 vulnerabilities within the Treck TCP/IP stack [4]. Due to these critical security flaws affecting the Treck TCP/IP protocol stack, hundreds of millions of IoT devices globally became potentially susceptible to remote attacks. These repeated attacks, launched by exploiting security vulnerabilities in IoT devices, demonstrate their potential to cause widespread service outages, data leaks, and even physical harm, directly endangering critical infrastructure and public safety. Therefore, detecting and mitigating such latent vulnerabilities is a necessary and effective approach to securing these environments.
Fuzzing has proven to be a powerful and efficient technique for discovering software vulnerabilities. As a dynamic testing method, it injects malformed or unexpected inputs while monitoring the target’s runtime behavior—such as crashes, assertion failures, or resource exhaustion—to uncover deep-seated bugs like memory corruption. Its application has successfully extended to the IoT domain for testing embedded firmware and specific communication protocols [5,6,7]. However, its efficacy traditionally relies on the presence of clear, machine-observable fault signals (e.g., crashes). In smart city IoT scenarios, some critical vulnerabilities—such as silent data corruption, logical flaws in control algorithms, or security policy bypasses—may not manifest as crashes but could lead to erroneous physical actions or degraded service. Detecting these “non-crash” vulnerabilities requires augmenting fuzzing with additional oracles, which remains a significant methodological challenge.
Given these context-specific challenges, a systematic understanding of how current fuzzing research addresses (or fails to address) the unique requirements of smart cities is crucial.
However, a review focusing specifically on the intersection of IoT fuzzing and the smart city context is currently lacking. This gap creates a disconnect between the capabilities of state-of-the-art fuzzing research and the practical, high-stakes requirements for securing smart city infrastructure.
To bridge this gap, this review maps current fuzzing capabilities to smart city security requirements, adopting a bidirectional ‘requirements-capabilities’ mapping approach that goes beyond mere technique cataloging in existing surveys. The key contributions of this paper are:
  • Proposed eight-dimensional analytical framework: A structured classification system has been established to evaluate IoT fuzzing research from three aspects: the problem space, the solution space, and the gap. This provides a methodological foundation for subsequent gap analysis.
  • Comprehensive gap diagnosis for IoT fuzzing in the smart-city scenario: Comprehensive identification of misalignments between the current progress (e.g., device coverage, protocol support, and methodological approaches) and the practical requirements of current smart cities.
  • Proposed evolution pathways: Concrete models including the Observability-Complexity Based IoT Device Classification Model (hereinafter referred to as the four-quadrant model) Model for device testing and feature-matching framework for protocol testing transfer.
  • Paradigm shift proposal: Advocacy for transitioning from component-focused vulnerability mining to system-level resilience assessment.
The remainder of this paper is organized as follows: Section 2 introduces the background of IoT security in smart cities. Section 3 provides a systematic analysis of current IoT fuzzing research. Section 4 presents a detailed gap analysis and discusses future opportunities. Section 5 concludes the paper.

2. Background and Motivation

2.1. Smart City IoT: Definition and Layered Architecture

A smart city utilizes advanced technologies, data analytics, and the Internet of Things (IoT) to optimize urban operations and service efficiency [8,9,10]. The International Telecommunication Union (ITU) defines a “smart city” as a new urban form that leverages Information and Communication Technology (ICT) to intelligently upgrade urban infrastructure, public services, and governance models, aiming to enhance residents’ quality of life and urban operational efficiency. Its core characteristic is “data-driven decision-making,” which integrates data from various sectors like transportation, energy, and administration to transform governance from a “reactive” to a “proactive and predictive” mode. In this vision, the IoT is no longer an isolated technological application but forms the physical foundation of the city’s digital twin and intelligent nervous system.
To systematically deconstruct its security challenges, this paper adopts the classic three-layer IoT architecture (Perception, Network, and Application layers) [11,12,13] as the foundational model for understanding its complexity (see Figure 1). This layered model not only clearly delineates the data flow and functional partitioning from physical sensing to intelligent decision-making but, more importantly, provides a structured operational framework for the subsequent analysis of protocol ecosystem gaps in Section 4.2. And we will classify communication protocols accordingly and reveal the unique testing challenges inherent to protocols at different layers. Simultaneously, the model helps to contextualize the root causes of device diversity (e.g., the fundamental differences in resources and functions between Perception-layer devices and Application-layer servers), providing the necessary context for the analysis based on attributes such as device observability in Section 4.1.
Perception Layer: The foundational tier of an IoT system, comprises a massive number of diverse endpoint devices. These include environmental sensors (temperature, humidity, air quality), smart meters (water, electricity, gas), surveillance cameras, vehicle-mounted units, RFID tags and readers, among others [14,15]. Its defining characteristic is extreme fragmentation—significant diversity exists across hardware architectures (ARM, MIPS, RISC-V), operating systems (bare-metal, RTOS, custom Linux distributions), power supply modes (battery, solar, wired), and communication interfaces. This heterogeneity and resource disparity imply that security mechanisms and update strategies viable for one device class may be infeasible for another, resulting in a long list of vulnerable and hard-to-maintain endpoints.
Network Layer: The Network Layer consists of two main components: the access network and the core network. The access network is highly diverse, encompassing short-range wireless communications (e.g., Wi-Fi, Zigbee, Bluetooth, infrared), long-range wireless access (e.g., cellular networks, WiMAX), as well as wired network access and satellite communications [16]. The core network acts as the transmission hub, responsible for relaying data collected by the Perception Layer to the Application Layer for processing. A key feature is the coexistence and convergence of multiple communication paradigms. These multi-protocol stacks are not merely transport mediums; different protocols embody different state management models, security postures (often simplified for efficiency), and physical-layer assumptions. The interdependencies and protocol translations at gateways create complex, stateful interaction points, which are prime targets for attacks. Forescout’s The Riskiest Connected Devices of 2025 [17] report listed protocol gateways as one of the highest-risk connected device types for the year. From a technical perspective, vulnerability research targeting protocol translation logic has revealed attack paths capable of causing severe consequences. An in-depth study of the HTTP/2 to HTTP/1 gateway translation mechanism uncovered numerous novel web application attack methods, such as request black holes, denial-of-service, and request smuggling, all achievable through meticulously crafted protocol anomalies [18]. Therefore, comprehensively testing these complex interaction points poses a significant challenge, yet assessing their security is of critical importance.
Application Layer: Situated at the apex of the IoT system, the Application Layer is responsible for the deep integration of vertical business logic and cross-domain data fusion. It transforms the widely collected data into tangible, actionable information and services for users (municipal managers, enterprises, citizens) [19], enabling applications such as smart healthcare, smart transportation, smart industry, smart home, and e-government. In smart cities, applications do not exist in isolation; they involve the deep fusion of vertical industry logic (e.g., traffic signal control algorithms, power grid load balancing, water treatment processes) with cross-domain data. For instance, a smart traffic application might use data from environmental sensors, traffic cameras, and bus GPS, and send control signals to streetlights and variable message signs. This tight coupling between business logic and physical processes implies that software vulnerabilities or flaws in business logic can bypass all underlying protections, directly leading to erroneous physical actions or critical decision-making failures. Examples include errors in traffic signal control algorithms, vulnerabilities in energy billing logic, or automated responses triggered by anomalous environmental monitoring data. Such failures often do not cause system crashes but can instead provoke covert, persistent security incidents with immediate physical and societal consequences, representing the highest-order threat to urban resilience and public safety.
The following section (Section 2.2) will elaborate on the specific security threats arising from this unique architecture.

2.2. Security Challenges: A Four-Layer Taxonomy

While smart city IoT enhances urban operational efficiency and service quality, its inherent complexity and openness also make it a high-value target for cyber-attacks. Persistent cyber-attacks have become the norm, with critical infrastructure operators in countries like the United States and Israel reporting thousands of probing and attack attempts per second on their systems [20,21]. Although most attacks are unsuccessful, studies indicate that nearly 70% of utility and manufacturing companies experience at least one security incident leading to data breach or operational disruption within a year [22]. However, merely recognizing the universality of attacks is not sufficient to guide effective security testing. These frequently occurring security incidents are not isolated cases; they collectively reveal a more severe and distinctive risk structure in smart city IoT compared to traditional IT systems. To systematically understand these risks, we must move beyond mere incident descriptions and map them onto an analytical framework that explains their root causes.
By analyzing typical security incidents from 2013 to 2023 across critical domains such as transportation, energy, and water supply (summarized in Table 1), this paper distills four interrelated levels of security challenges for smart city IoT. This framework aims to categorize the diverse attack phenomena and explain the systemic weaknesses behind them: from the inherent fragility of devices, to the intrinsic risks of protocols and communications, then to the complexities introduced by system integration and supply chains, and finally to the high-order risks arising from the deep coupling of business logic and the physical world. The following sections will dissect the specific challenges of each layer accordingly.

2.2.1. Inherent Device-Layer Vulnerabilities

This is the technical root of security risks. Vast numbers of perception-layer and edge-layer devices, constrained by cost and resources, commonly suffer from a lack of hardware security mechanisms (e.g., no Memory Protection Unit), software implementation flaws (e.g., use of unsafe C library functions, insecure or absent firmware update mechanisms), and weak security configurations (e.g., hard-coded credentials, plaintext communication, use of outdated operating systems). The Mirai incident [27] exemplifies a concentrated outbreak of weak configurations, while the Oldsmar water treatment [28] plant incident highlights the fatal risk posed by stalled software updates on critical equipment.

2.2.2. Protocol and Communication Risks

Complex communication protocol stacks introduce multiple risks. On one hand, protocol design flaws or implementation inconsistencies (e.g., in wireless protocols for some traffic sensors and signals) can be directly exploited for physical interference (as demonstrated in traffic light hacking experiments). On the other hand, to adapt to resource-constrained environments, security mechanisms are often simplified or disabled, making communications susceptible to eavesdropping or tampering. Furthermore, traditional designs of industrial protocols often lack strong authentication and encryption, enabling deep penetration.

2.2.3. System Integration, Supply Chain, and Insider Threats

Smart cities are integrated from multi-vendor, multi-generational, cross-domain subsystems, introducing systemic weaknesses. Supply chain security is difficult to guarantee, as backdoors or vulnerabilities may be introduced from chips, third-party software libraries, to cloud services. Security boundaries between systems are blurred and fragile. Attackers can exploit vulnerabilities in a low-security subsystem (e.g., ticketing system, employee VPN) as a foothold for lateral movement into core control systems (e.g., power grid, pipelines, traffic), a path evident in the Ukraine grid [26] and Colonial Pipeline attacks [29]. Additionally, insider threats (as in the vehicle control case) are particularly dangerous due to privileged access.

2.2.4. Risk from Deep Coupling of Business and the Physical World

This is a unique, highest-order risk specific to smart cities. The “Cyber–Physical” nature of IoT means digital attacks can directly trigger catastrophic physical consequences and social impact. Attackers are no longer satisfied with just data theft but pursue physical destruction (e.g., derailing trains, contaminating water supply), functional paralysis (e.g., causing large-scale blackouts), or disruption of social order (e.g., disturbing traffic). These attacks directly target the availability, safety, and reliability of urban lifelines, with impacts escalating rapidly from economic loss to public safety crises and even national security threats.

2.3. Fuzzing

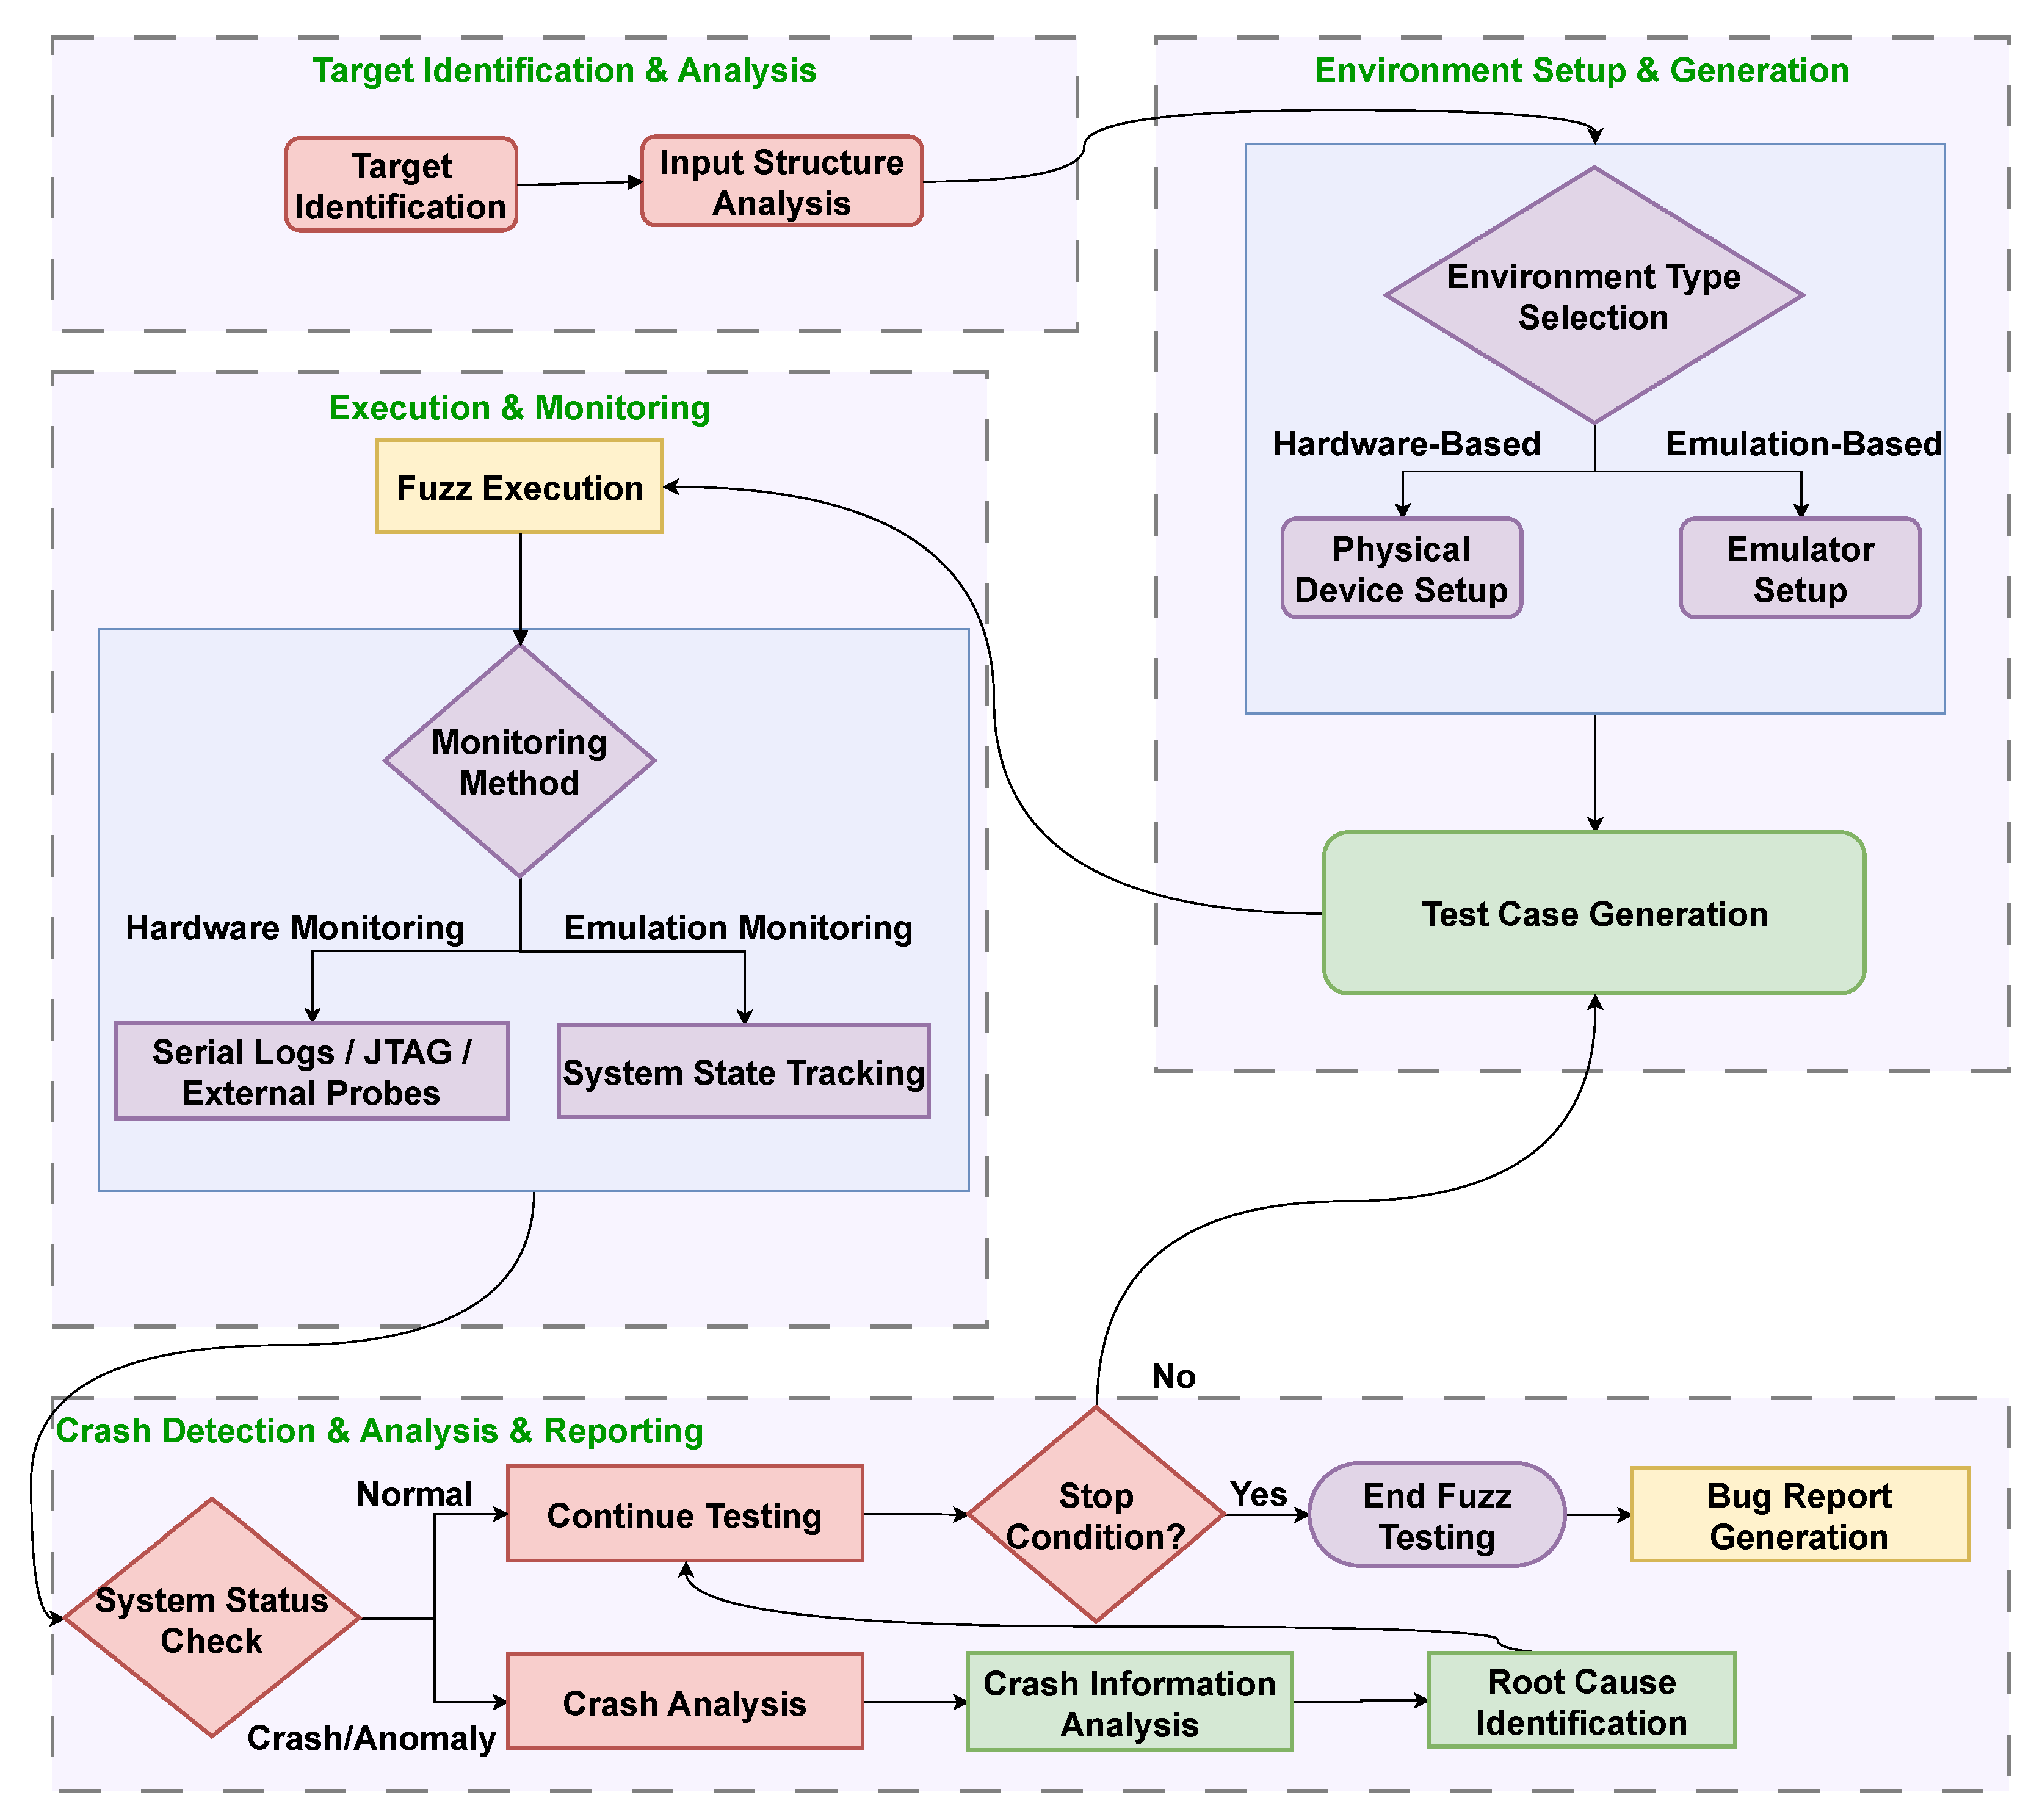
Fuzzing is an automated vulnerability discovery technique that involves injecting a large volume of unexpected or randomly generated anomalous inputs (called “test cases”) into a target system and observing the system’s behavior to trigger potential crashes or anomalies [31]. Its core value lies in discovering boundary-condition vulnerabilities (e.g., buffer overflow, memory leak) that are difficult for traditional testing to cover. As shown in Figure 2, the fuzzing process typically consists of the following phases.
  • Target Identification & Analysis: Identifying the specific target to be tested and understanding the structure and expected format of input data. Unlike fuzzing general-purpose computers which focuses on software programs, services, or protocols, fuzzing for IoT devices places greater emphasis on hardware+firmware, diverse interfaces (physical/wireless/cloud), and proprietary protocols.
  • Test Case Generation: Providing various input data to the target. These inputs can be randomly generated, predefined, or abnormal data generated according to specific rules.
  • Fuzzing Execution: Automatically feeding the generated test cases to the target system. The execution environment for IoT device fuzzing includes simulation or real hardware.
  • Monitoring: Real-time monitoring of the target system’s state during test execution, including whether it crashes, produces abnormal output, or consumes abnormally high resources (e.g., memory, CPU time). Monitoring in simulated environments can resemble that for general-purpose computers, but monitoring real hardware is challenging and relies on serial logs, JTAG, external probes, etc.
  • Analysis: When the system crashes or produces an anomaly, recording the crash information and abnormal output. Subsequently analyzing this information to determine the root cause of the vulnerability.
  • Bug Reporting: Upon completion of the fuzzing campaign, compiling and writing a report on the vulnerabilities identified during the monitoring phase and subsequently analyzed. Archiving all test cases that successfully triggered anomalies to ensure they can be reused to reliably reproduce the crash, thereby supporting in-depth root cause analysis of the vulnerability.
The workflow and intrinsic nature of fuzzing determine that it excels at discovering attack attributes typically related to implementation flaws, such as memory safety defects, protocol parsing errors, and state machine violations [32]. However, it is often ineffective at detecting design or logic-level issues, such as business logic vulnerabilities, security policy bypasses, or supply chain backdoors [33]. Consequently, fuzzing is a powerful tool for uncovering deep-seated technical implementation vulnerabilities, but it is essentially an “injection of faults” rather than a tool for “logical reasoning” [34]. For the high-order risks arising from the deep coupling of business logic and physical processes in smart cities, relying solely on fuzzing is far from sufficient; it must be positioned within a broader system security assessment framework.
This inherent capability limitation serves as a critical lens for evaluating current research and identifying its gaps relative to real-world needs. For the high-order risks arising from the deep coupling of business logic and physical processes in smart cities, relying solely on the traditional crash-guided fuzzing paradigm is far from sufficient. This directly leads to a core methodological question: Does existing research remain confined to its “fault injection” comfort zone, or does it attempt to approach “logical reasoning” through technical integration (e.g., combining static analysis, symbolic execution, or AI inference)? More fundamentally, how should fuzzing position itself—as a standalone vulnerability discovery tool, or as a probe integrated within a broader framework encompassing digital twins and system resilience assessment? The examination of these questions forms the logical starting point for our subsequent analysis of the current research’s focus bias and technical limitations.

2.4. Research Methodology Design

2.4.1. Literature Selection and the Eight-Dimensional Analytical Framework

To ensure the relevance and quality of analyzed studies, we retrieved literature from core databases including IEEE Xplore Digital Library, ACM Digital Library, Scopus, Web of Science Core Collection, and Engineering Village (Compendex), covering the period 1 January 2021, to 31 December 2025. We focused on studies involving IoT devices/protocols/systems, with core contributions of novel or substantially improved fuzzing methods and verifiable experimental results. Non-English publications, conceptual studies without experimental validation, and duplicate works were excluded. As an example, the core query used for IEEE Xplore was:
(("Abstract":"iot" OR "Internet of Things") AND
 ("Abstract":fuzz* OR "Title":fuzz*) AND
 ("Abstract":"smart city" OR "cyber-physical" OR "embedded"))
Furthermore, the following synonyms and related terms were incorporated to expand the search:
  • IoT: “Internet of Things”, “embedded system”, “cyber–physical system”.
  • Fuzzing: “fuzz testing”, “security testing”, “vulnerability discovery”.
Additionally, we included representative studies from vertical domains (industrial control, autonomous driving, smart homes) due to their technical commonality with smart city IoT, methodological foresight, and problem representativeness.
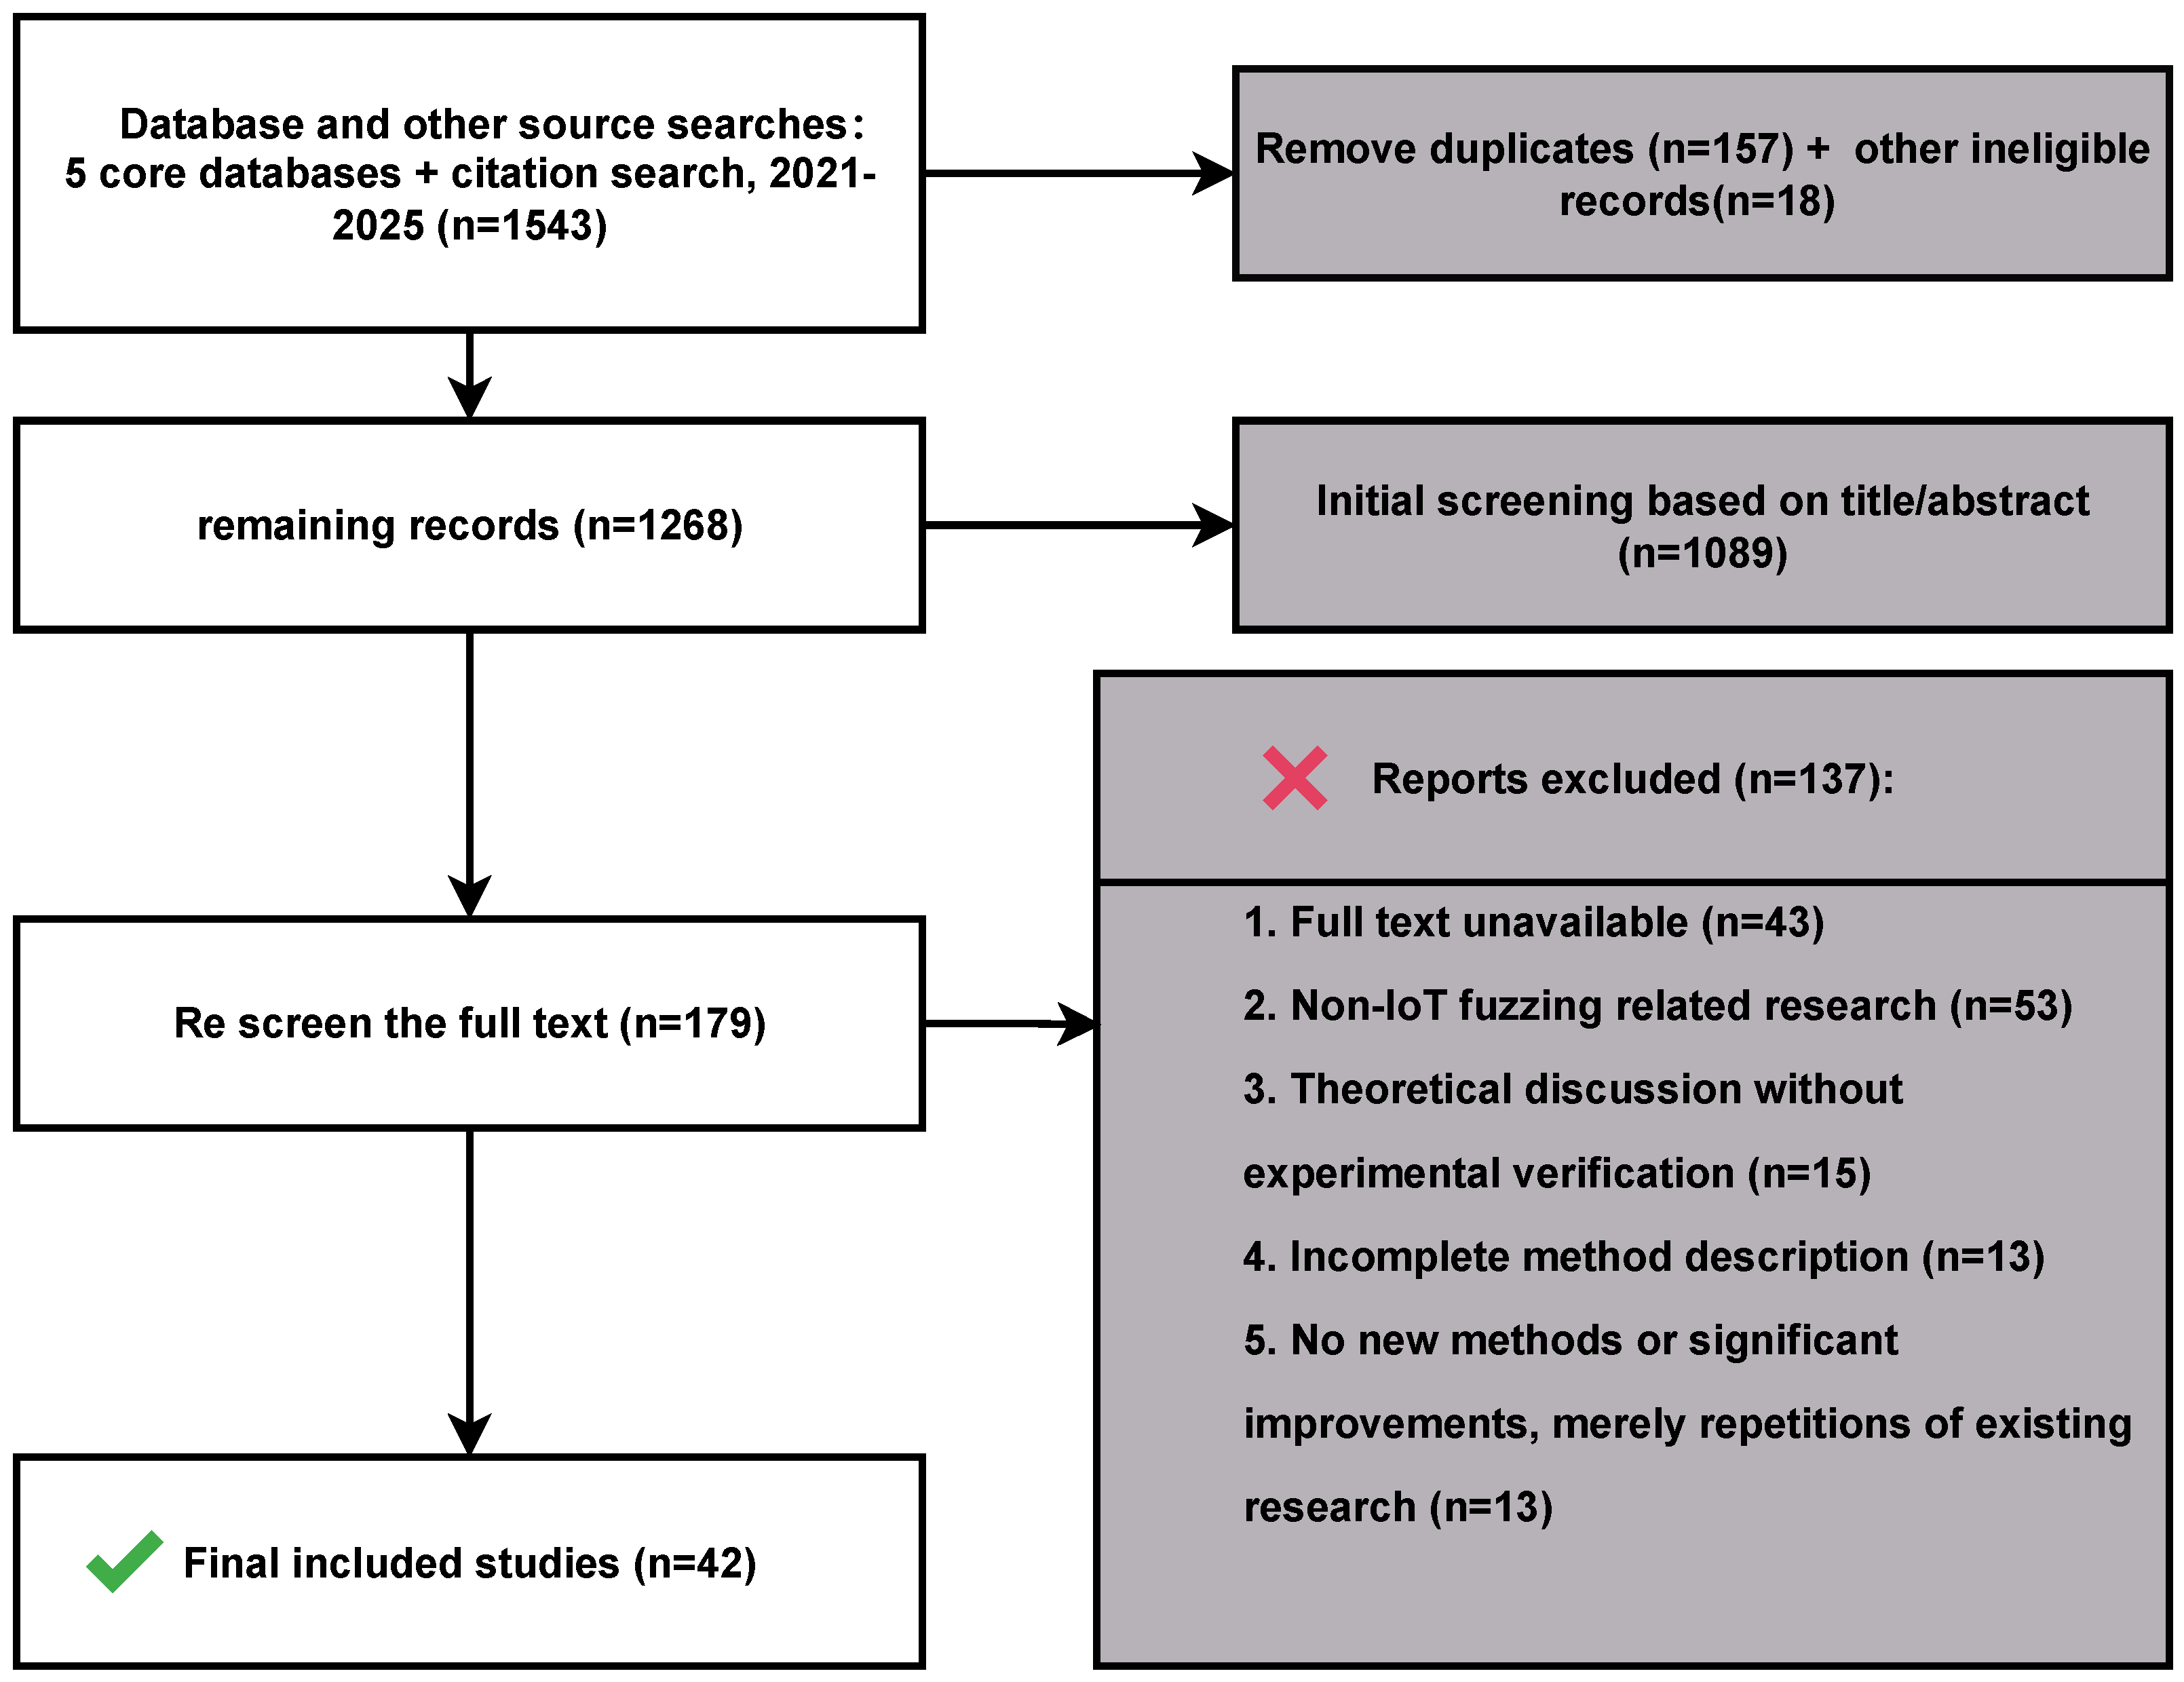
To ensure the transparency and reproducibility of our literature selection process, we followed a multi-stage screening protocol. This screening process, visualized in Figure 3, yielded the final corpus of 42 studies.

2.4.2. Eight-Dimensional Framework Design

In this study, we construct an eight-dimensional analytical framework to evaluate current IoT fuzzing technologies and accurately identify their gaps to the unique security requirements of smart cities. The framework follows a three-part structure: Problem Space, Solution Space, and Gaps. This structure clarifies what problems are being addressed, what methods are used to solve them, and what shortcomings remain, forming a complete and coherent analytical chain.
Problem Space: This space defines the core challenges and targets of IoT fuzzing in smart cities. It answers the question: What are the testing objects and scenario requirements we face? It consists of three dimensions:
  • Object Category: This dimension classifies the core level of the testing target into Device (D), Protocol (P), or System (S). As shown in Table 2, we propose a taxonomy based on Operating System (OS) complexity. This is a fundamental architectural attribute that directly determines a device’s programmability, resource management model, and exposed interfaces. The device layer is further divided into T1 (OS-less devices), T2 (RTOS-based devices), and T3 (general-purpose OS devices) to accurately map the heterogeneity of IoT hardware. This dimension clarifies the primary scope of each study.
  • Object Type: This dimension specifies the concrete target under test, such as a particular smart camera firmware, the Zigbee communication protocol, or an autonomous driving subsystem. It defines the specific application scenario of the research.
  • Target Vulnerability: This dimension identifies the primary types of vulnerabilities a study aims to discover, linking directly to core security risks. We classify vulnerabilities into six main types: Memory Safety, Denial-of-Service (DoS), Logic/Specification Violations, Security Policy Violations, Resource/Concurrency Issues, and Others.
Solution Space: This space examines the technical approaches proposed by current research to address the problems identified above. It answers the question: What methods are used to solve these problems? It consists of two dimensions:
  • Fuzzing Technique: This dimension captures the core technical paradigm adopted in a study. We summarize ten standard categories: Random Mutation (RM), Grammar-based (GR), Dynamic Symbolic Execution (DSE), Dynamic Taint Analysis (DTA), Coverage-Guided (CG), Scheduling Algorithm (SA), Static Analysis (STA), Genetic Algorithm (GA), Machine Learning (ML), and Large Language Model (LLM). This reflects the technical preferences and trends within the field.
  • Satisfied Requirements: Smart city IoT environments present specific challenges. This dimension assesses the extent to which a study actively addresses the practical challenges of IoT environments. We inductively summarized nine common characteristics from the literature (e.g., hardware interaction, protocol statefulness, system heterogeneity). The gap between the characteristics a study addresses and the full spectrum of real-world challenges often points to deeper scientific or engineering gaps.
Gaps: This space focuses on the mismatches between the Problem Space and the Solution Space. It answers the question: What shortcomings remain in current approaches, and how can they be improved? It consists of three dimensions:
  • Validation: This dimension evaluates the external validity of a study’s findings by considering the experimental scale (number of test subjects) and the authenticity of the testing environment (use of emulation versus real hardware). The divergence between controlled laboratory settings and large-scale, dynamic real-world deployments mainly reveals engineering gaps.
  • Acknowledged Limitations: This dimension extracts recurring issues from the shortcomings that the papers themselves identify. These limitations generally stem from two sources: (1) inherent technical limitations arising from the nature of the technology or the scenario (scientific gaps), or (2) limitations due to research design choices or tool implementation (engineering gaps). These “self-criticisms” directly point to bottlenecks in the field’s development.
  • Future Direction: This dimension collects the future research directions proposed across the literature to identify common evolutionary pathways. It highlights the collective vision of the research community for addressing the identified gaps.
We apply this analytical framework to the 42 selected papers. One reviewer is responsible for deciding the classification of a paper in a certain dimension by reading through the paper. Potential ambiguities were discussed and resolved by consensus among the reviewers. While the selected eight dimensions do not cover all potential aspects, our studies show that they provide sufficient information, including the capabilities, boundaries, and development directions of current research, and lay a solid foundation for the subsequent in-depth gap analysis presented in this paper.

2.4.3. Comparison with Existing Surveys

To clarify the differentiation and research value of this survey, we selected 6 representative IoT fuzzing survey papers published in top-tier security and software engineering conferences between 2021 and 2025 as a baseline for comparative analysis. These works represent the mainstream research perspectives in this field. Table 3 systematically compares this survey with existing works based on two core dimensions: Research Scope & Objective and the presence of a Gap-Driven Analysis Perspective.
The Scope & Objective dimension reveals a common characteristic among existing surveys: they primarily focus on specific technical aspects (e.g., embedded firmware fuzzing, MCU emulation) or generic IoT environments. However, these surveys generally lack a systematic examination of the special requirements posed by the smart city context, such as the complexity of cross-domain protocol stacks, the proprietary logic of vertical-industry devices, and the need for assessing city-level system resilience.
To address this, we innovatively introduce the Gap-Driven Analysis dimension to assess whether a survey conducts a bidirectional comparison and gap diagnosis between “current academic research capabilities” and “real-world security requirements.” As shown in the table, most existing surveys are rated “No” or only “Partial” on this dimension. While one existing survey [38] also focuses on identifying technical gaps in IoT fuzzing, its analysis lacks specificity to the smart city context. It does not consider cyber–physical fusion, remains detached from practical deployment concerns, and primarily discusses intra-academic technical gaps (e.g., emulation efficiency) without connecting them to real-world application needs.
In contrast, this survey focuses on the bidirectional gap between smart city academic research and deployment requirements. This indicates a current lack of a survey perspective that uses the practical needs of smart cities as an anchor to systematically diagnose research gaps.
This survey aims to fill this gap. We do not merely list and categorize technologies; instead, we strive to construct a “Requirements–Capabilities” bidirectional mapping analytical framework. By deeply dissecting the unique challenges of smart cities across three dimensions—devices, protocols, and methodologies—we systematically uncover the structural gaps between current research and practical application. Furthermore, we chart a demand-oriented evolution path for future research. Not only do we present the research landscape in Section 3, but we also preliminarily reveal potential gaps. These gaps will be collectively and thoroughly analyzed in Section 4, thereby clearly answering the question: On the path to ensuring smart city resilience, what are the core, urgent gaps in IoT fuzzing research at the protocol, device, and methodological levels?

3. Analysis of Current Research Status

As shown in Table 4, this section provides a comprehensive analysis of selected research on IoT fuzzing. The analysis is based on the eight-dimensional analytical framework established in Section 2.4.2, following the logic of “Problem Space–Solution Space–Gaps”. We will examine the current status and characteristics of existing research in turn, including the distribution of testing targets, the selection of technical methods, the validity of experimental validation and self-reported limitations. Through this analysis, we aim to clearly present the focus of technical capabilities in this field, the main research paradigms adopted and the existing limitations. This work will lay a foundation for the subsequent gap analysis. It should be noted that the analysis conclusions of this section are restricted to a certain extent by the methodological limitations inherent in the reviewed studies.

3.1. Analysis of the Problem Space: Structural Imbalance in Target Coverage

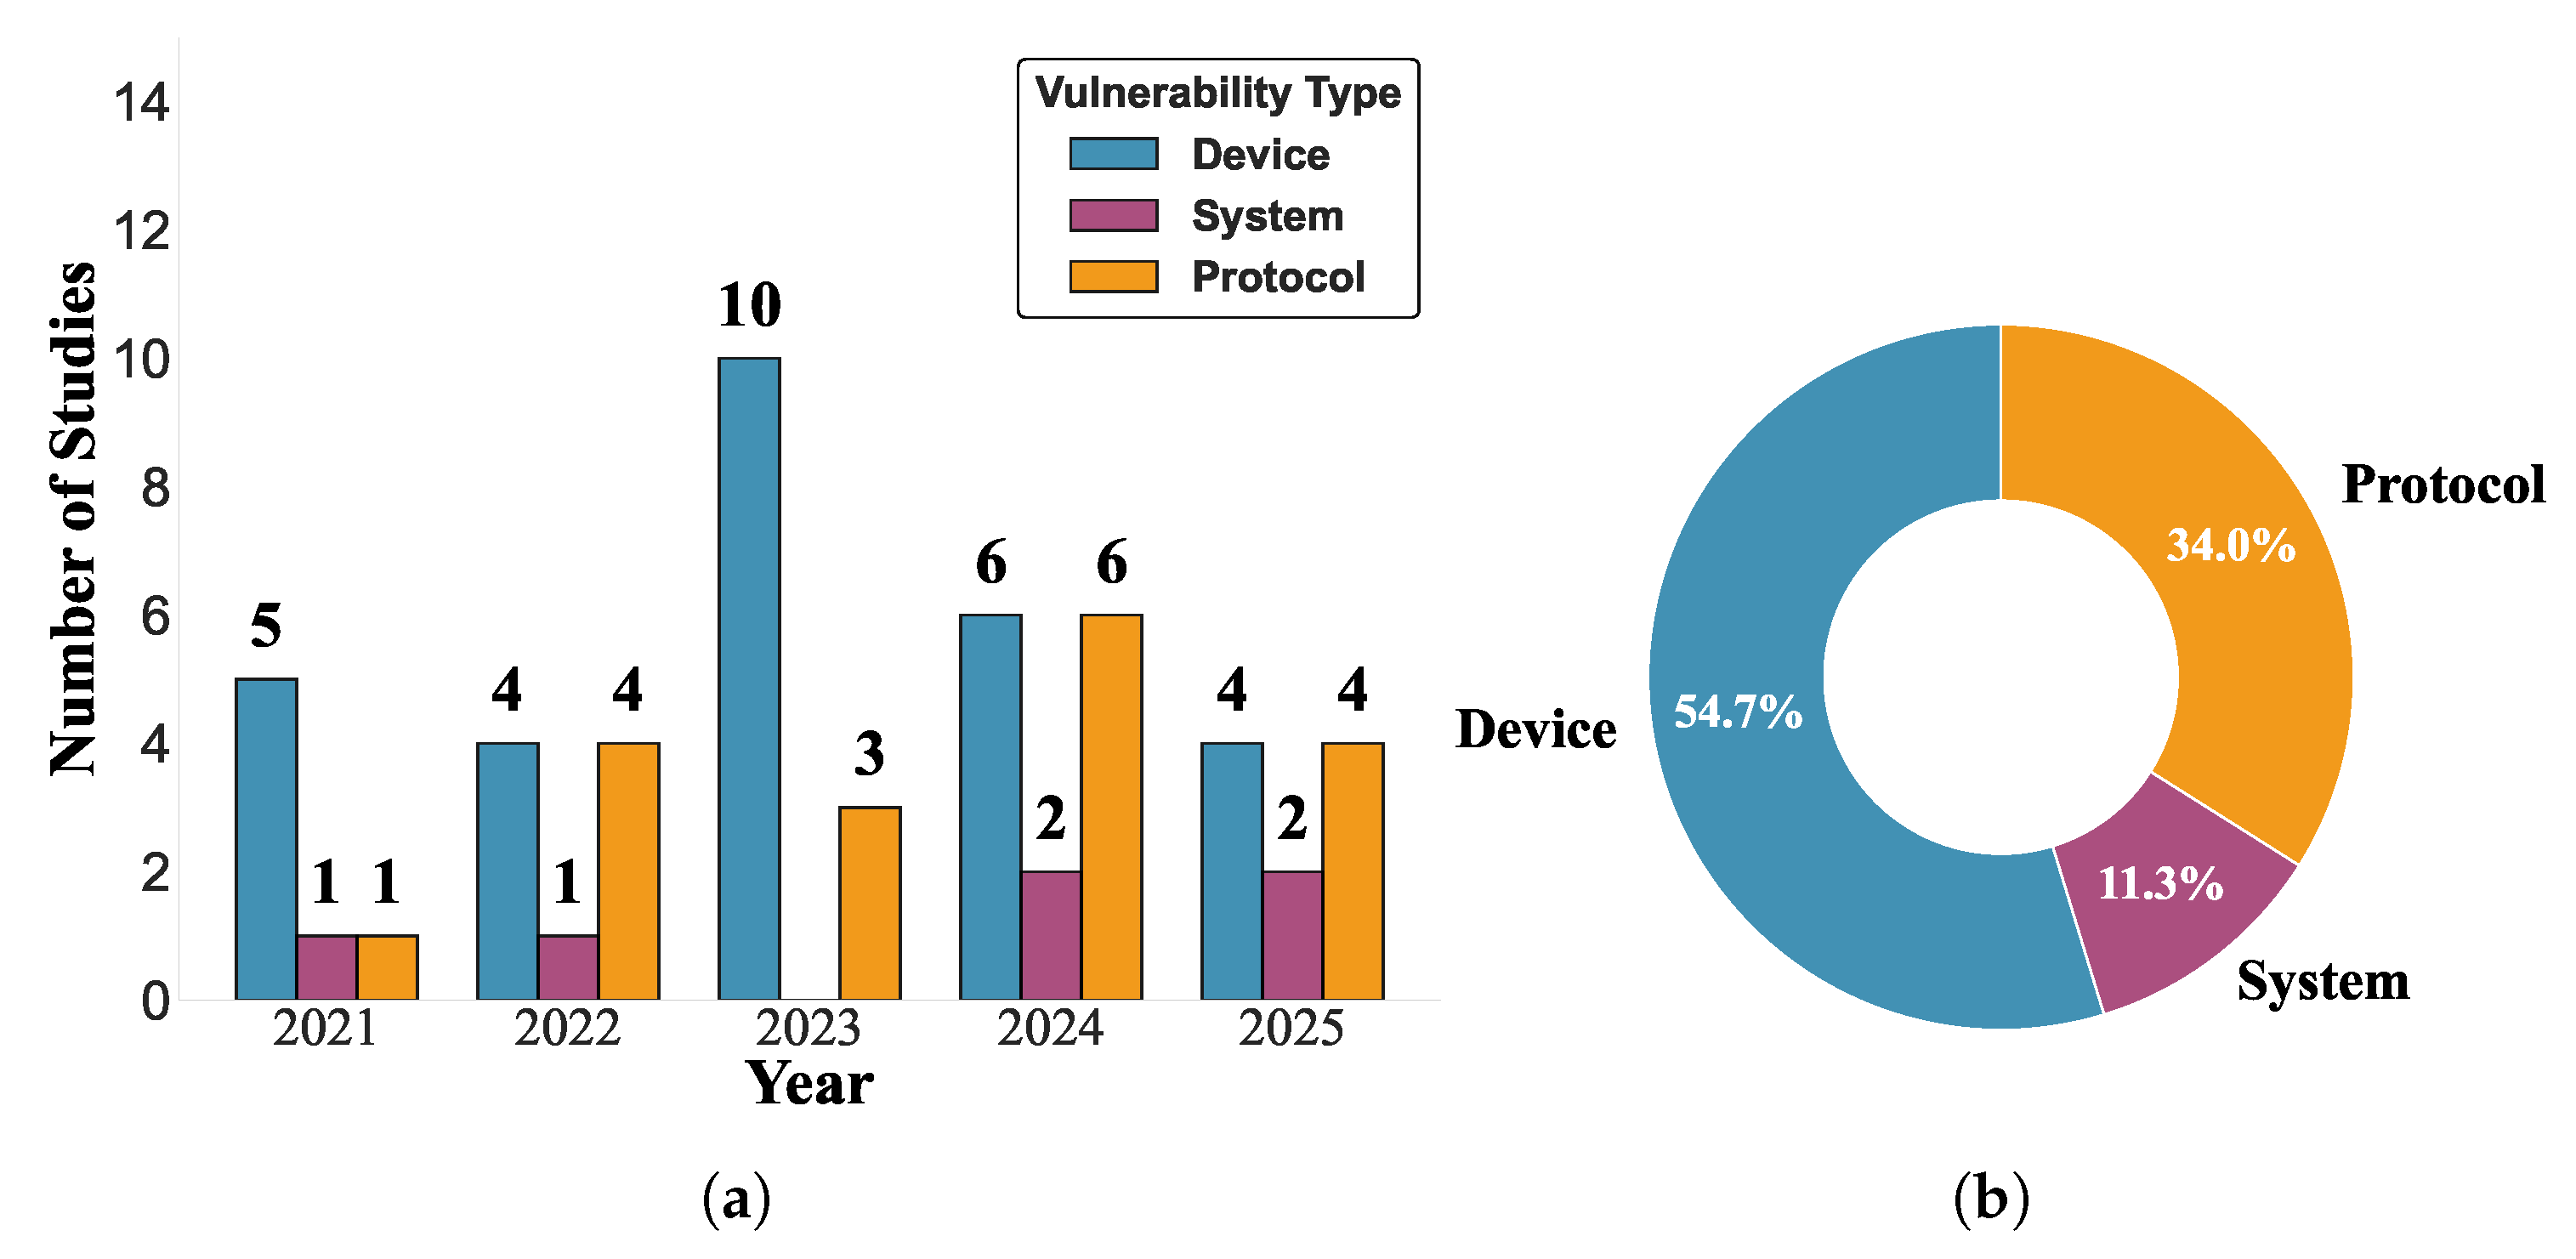
An analysis of the object category distribution shows a clear and consistent pattern of imbalance. As shown in Figure 4, testing focused on devices (D) has remained dominant over the five-year period, with an average annual share exceeding 50%. In contrast, system (S) testing accounts for less than 12% in most years.
It is a result of technical path dependence and considerations of research resource efficiency. Device-layer testing, especially the analysis of single firmware images, is technically easier to inherit and develop from mature binary analysis and emulation methods. In contrast, system-layer testing involves multi-component interaction and complex environment modeling, with methodologies still immature and associated with high research barriers and uncertainty.
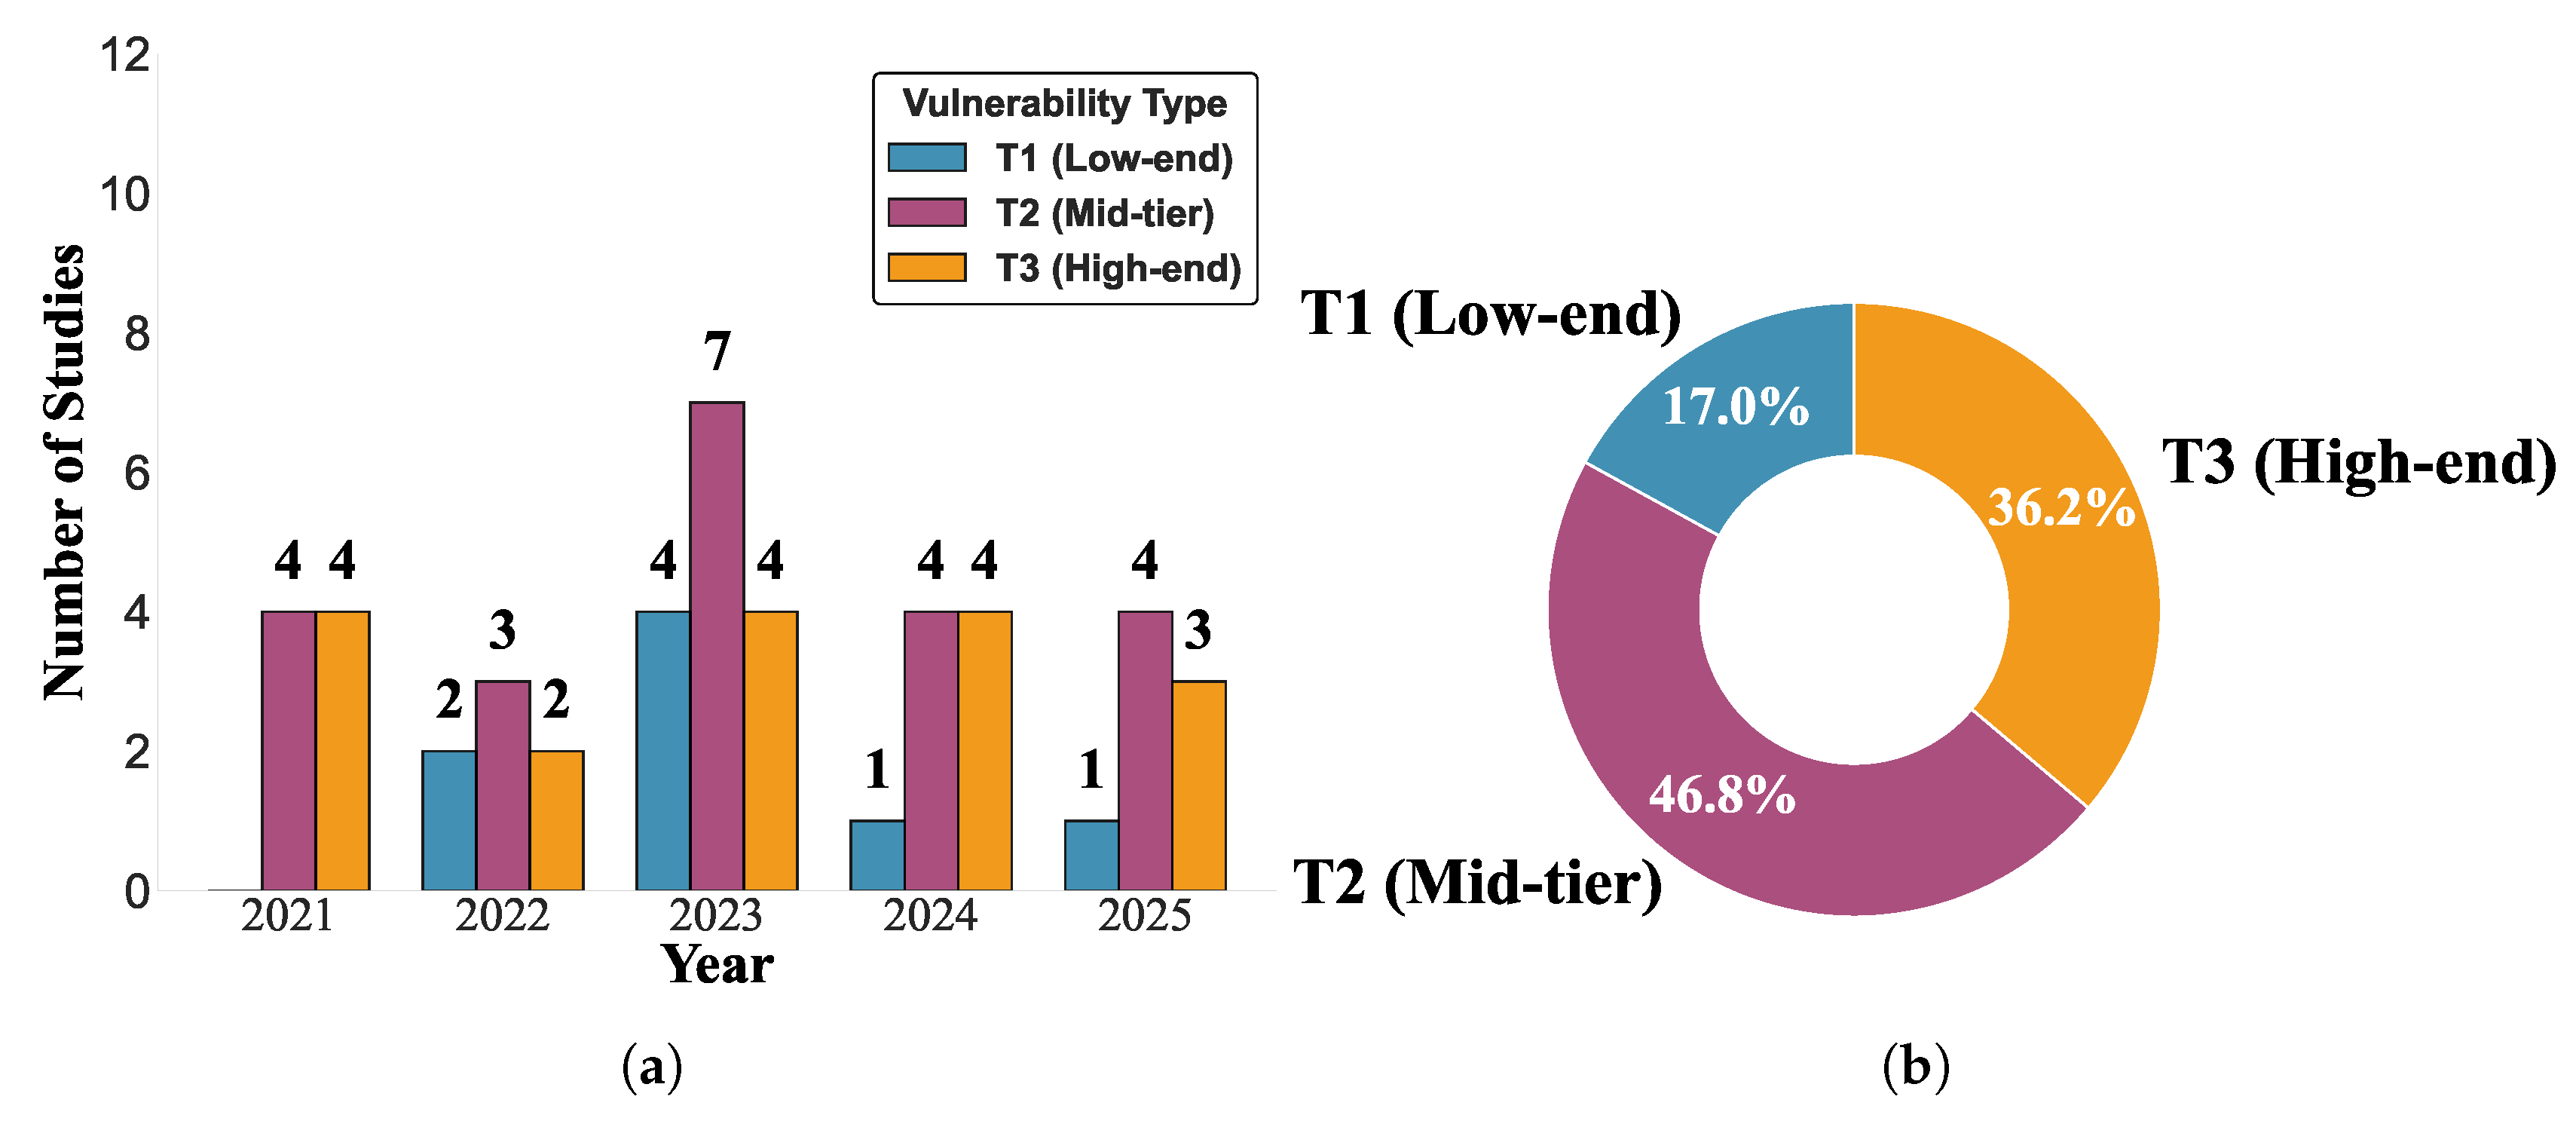
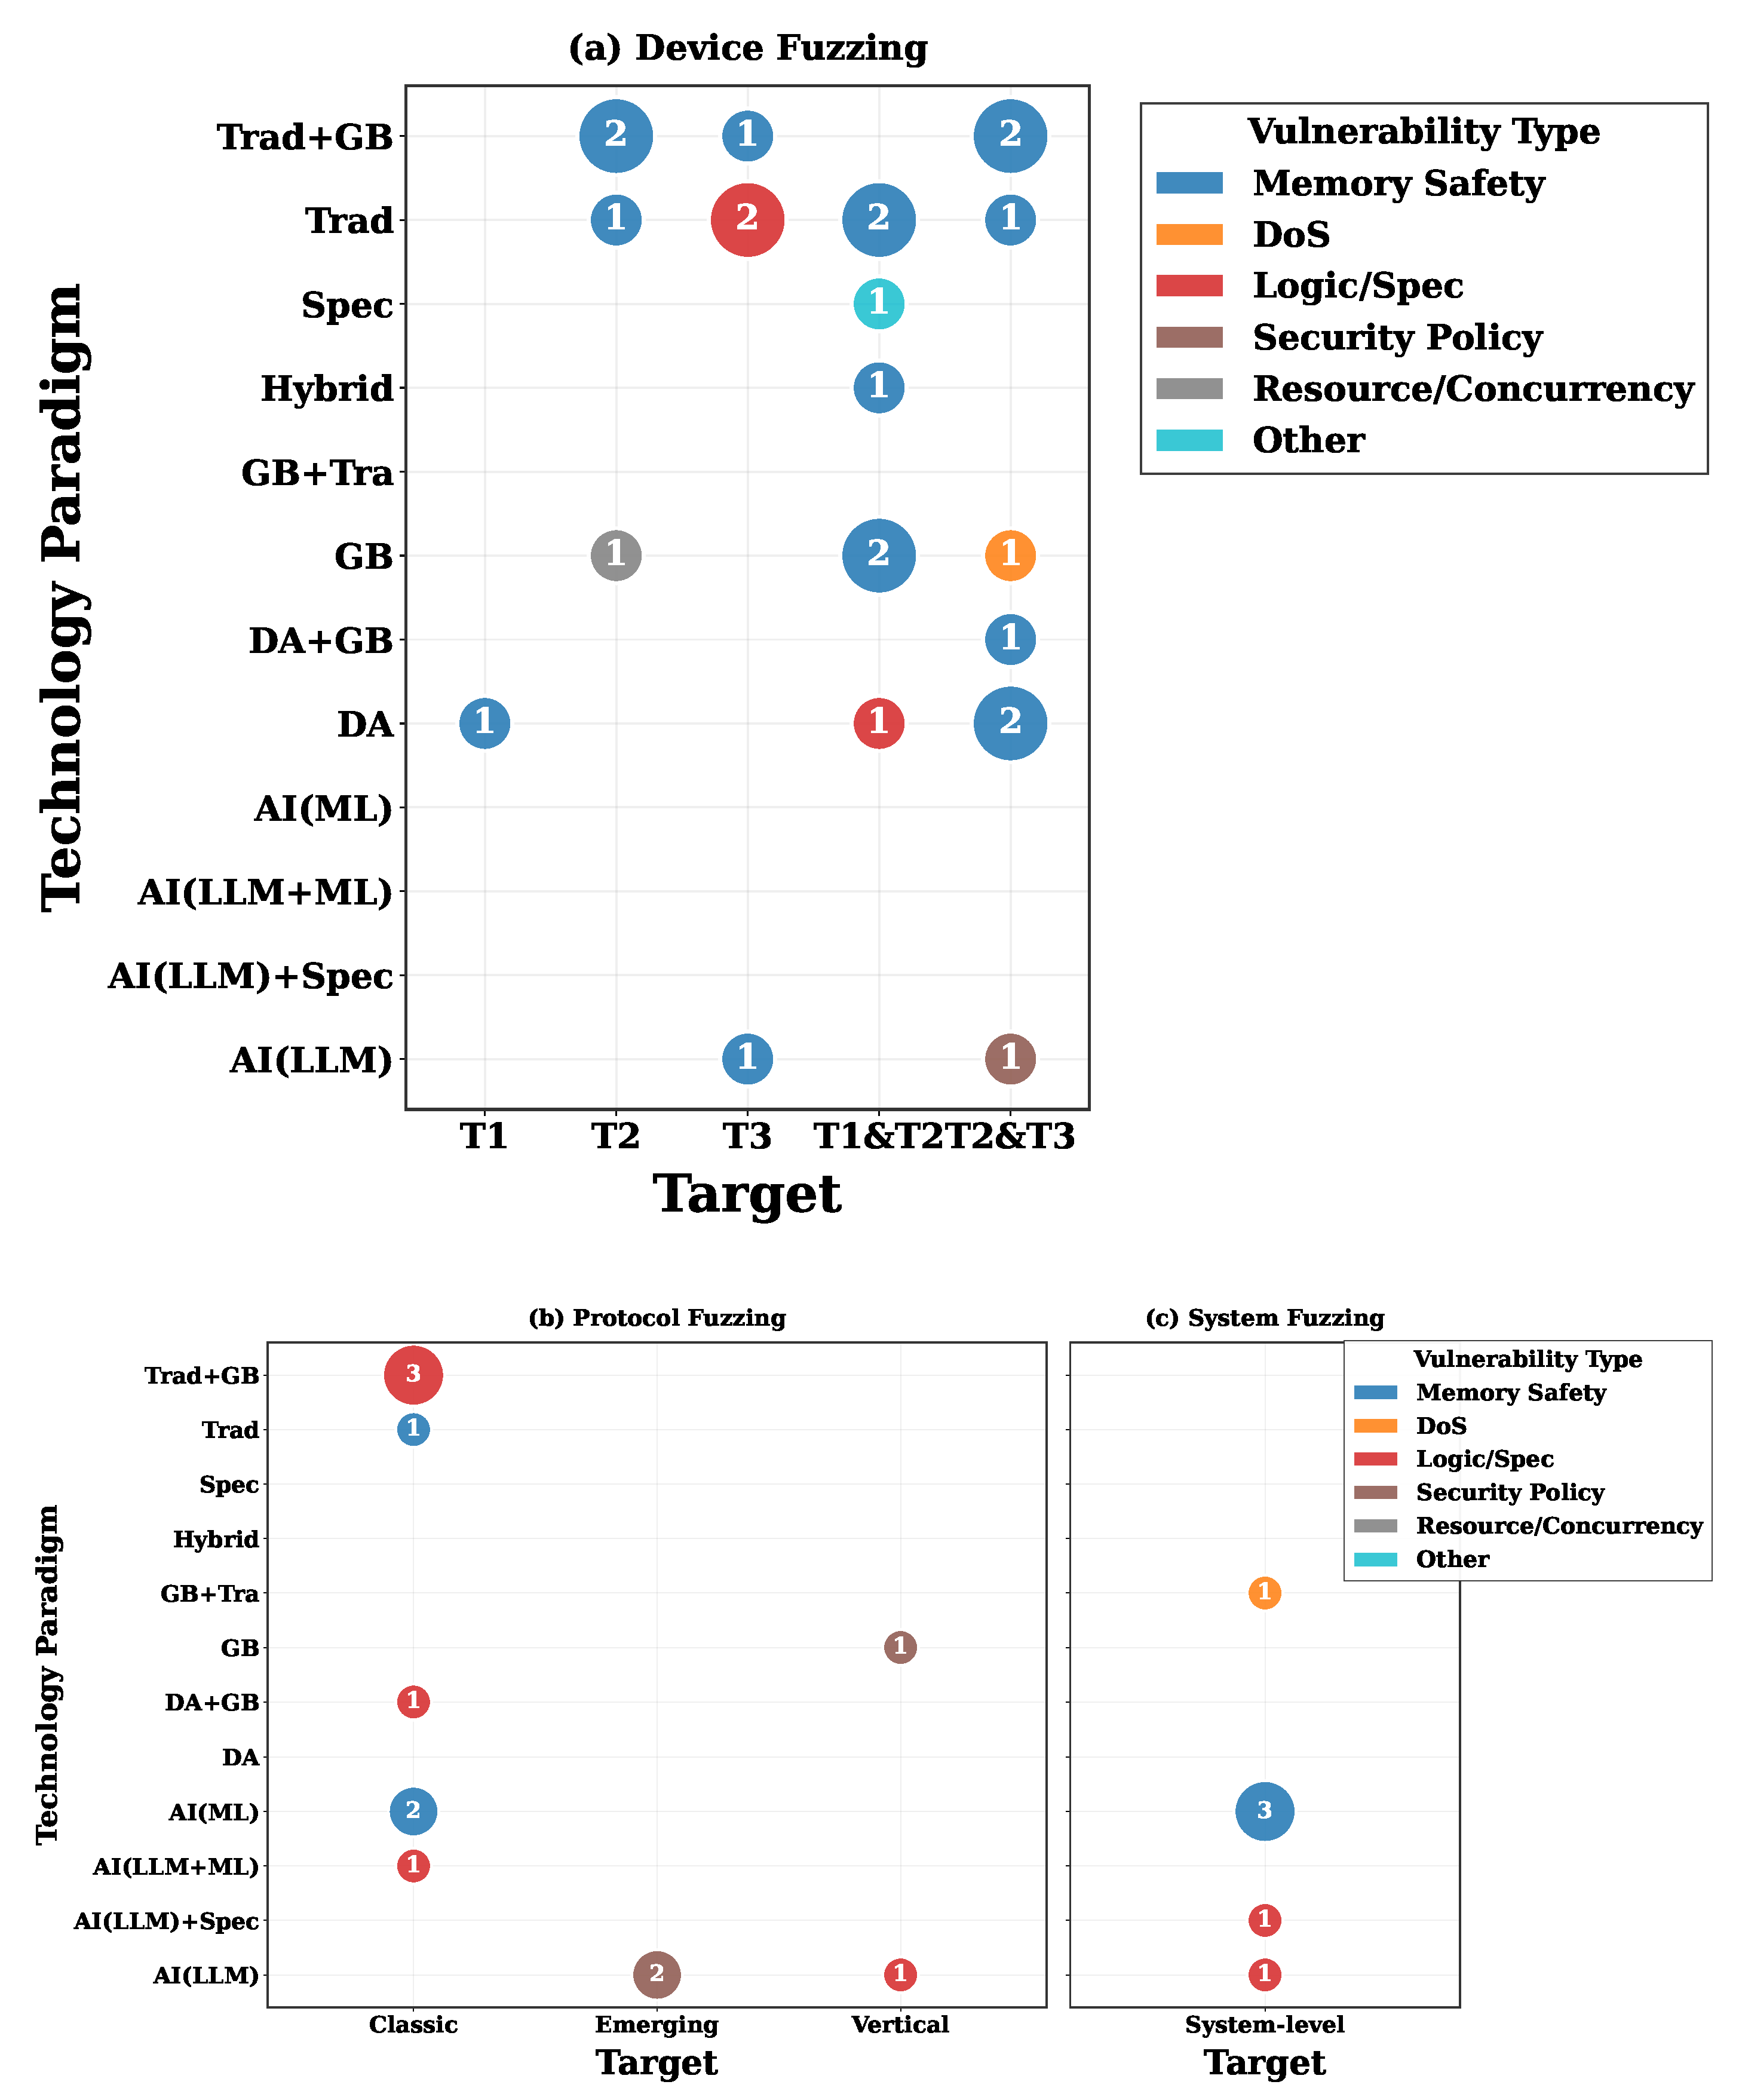
The research attention on device types (Figure 5) is also unevenly distributed. Regardless of the annual proportion or the overall total, T2 devices are the absolute focal point. These devices typically possess moderate computing resources, run RTOS, and perform protocol translation functions, providing a relatively friendly testing environment for existing fuzzing techniques.
In contrast, research on T1 devices, which constitute the sensory nerve endings of cities, has long been scarce. A brief spike occurred only in 2023 due to a few pioneering works focusing on bare-metal firmware analysis. The extreme resource constraints (KB-level memory, lack of an OS), absence of debugging interfaces, and “silent failure” characteristics of these devices render mainstream fuzzing paradigms almost ineffective. Although there is a relatively larger number of studies on T3 devices (high-end platforms/servers), most are essentially simple adaptations of traditional server fuzzing methods, failing to deeply address IoT-specific challenges such as customized kernels, lightweight services, and non-standard configurations.
Research on protocols (P) shows a similar pattern of concentration. Over half of the protocol studies are concentrated on a few academically popular protocols such as MQTT, Bluetooth/BLE, and Modbus. This concentration can be attributed to: (1) Ecosystem maturity: These protocols have widespread open-source implementations and standardized documentation, lowering the data acquisition and model-building costs for research; (2) Academic inheritance: Testing methods (e.g., state machine inference, grammar-based mutation) for these protocols have accumulated over time, facilitating innovation upon existing foundations. However, this focus severely misaligns with the actual protocol ecosystem of smart cities. Protocols rapidly deployed in critical urban infrastructure, such as LoRaWAN, OPC UA, GB/T 28181, as well as emerging cross-ecosystem protocols like Matter, have almost no dedicated fuzzing research. This exposes a lag in research topic selection relative to real-world needs, as well as the barriers of domain knowledge and bottlenecks in automated modeling when facing complex, proprietary protocols.
The weakness of system-layer research is particularly noteworthy. The existing six system-level studies are highly concentrated on relatively closed scenarios like autonomous driving (DriveFuzz [50], ScenarioFuzz [74]) and smart homes (Huynh et al. [78], RIoTFuzzer [71]), with limited test scales (e.g., Huynh et al. [78] tested only 3 devices with 12 rules). The component stacking or simple rule simulation methods employed by these studies are completely incapable of capturing the operational characteristics of smart cities, which involve “interconnection of tens of thousands of devices and dynamic topology changes.” For city-level systems driven by the deep coupling of multiple subsystems and cross-domain business logic, existing research lacks the ability to assess their cascading failure risks, cross-domain attack paths, and business resilience, creating a vast research vacuum.

3.2. Analysis of the Problem Space: Output Bias in Target Vulnerability Types

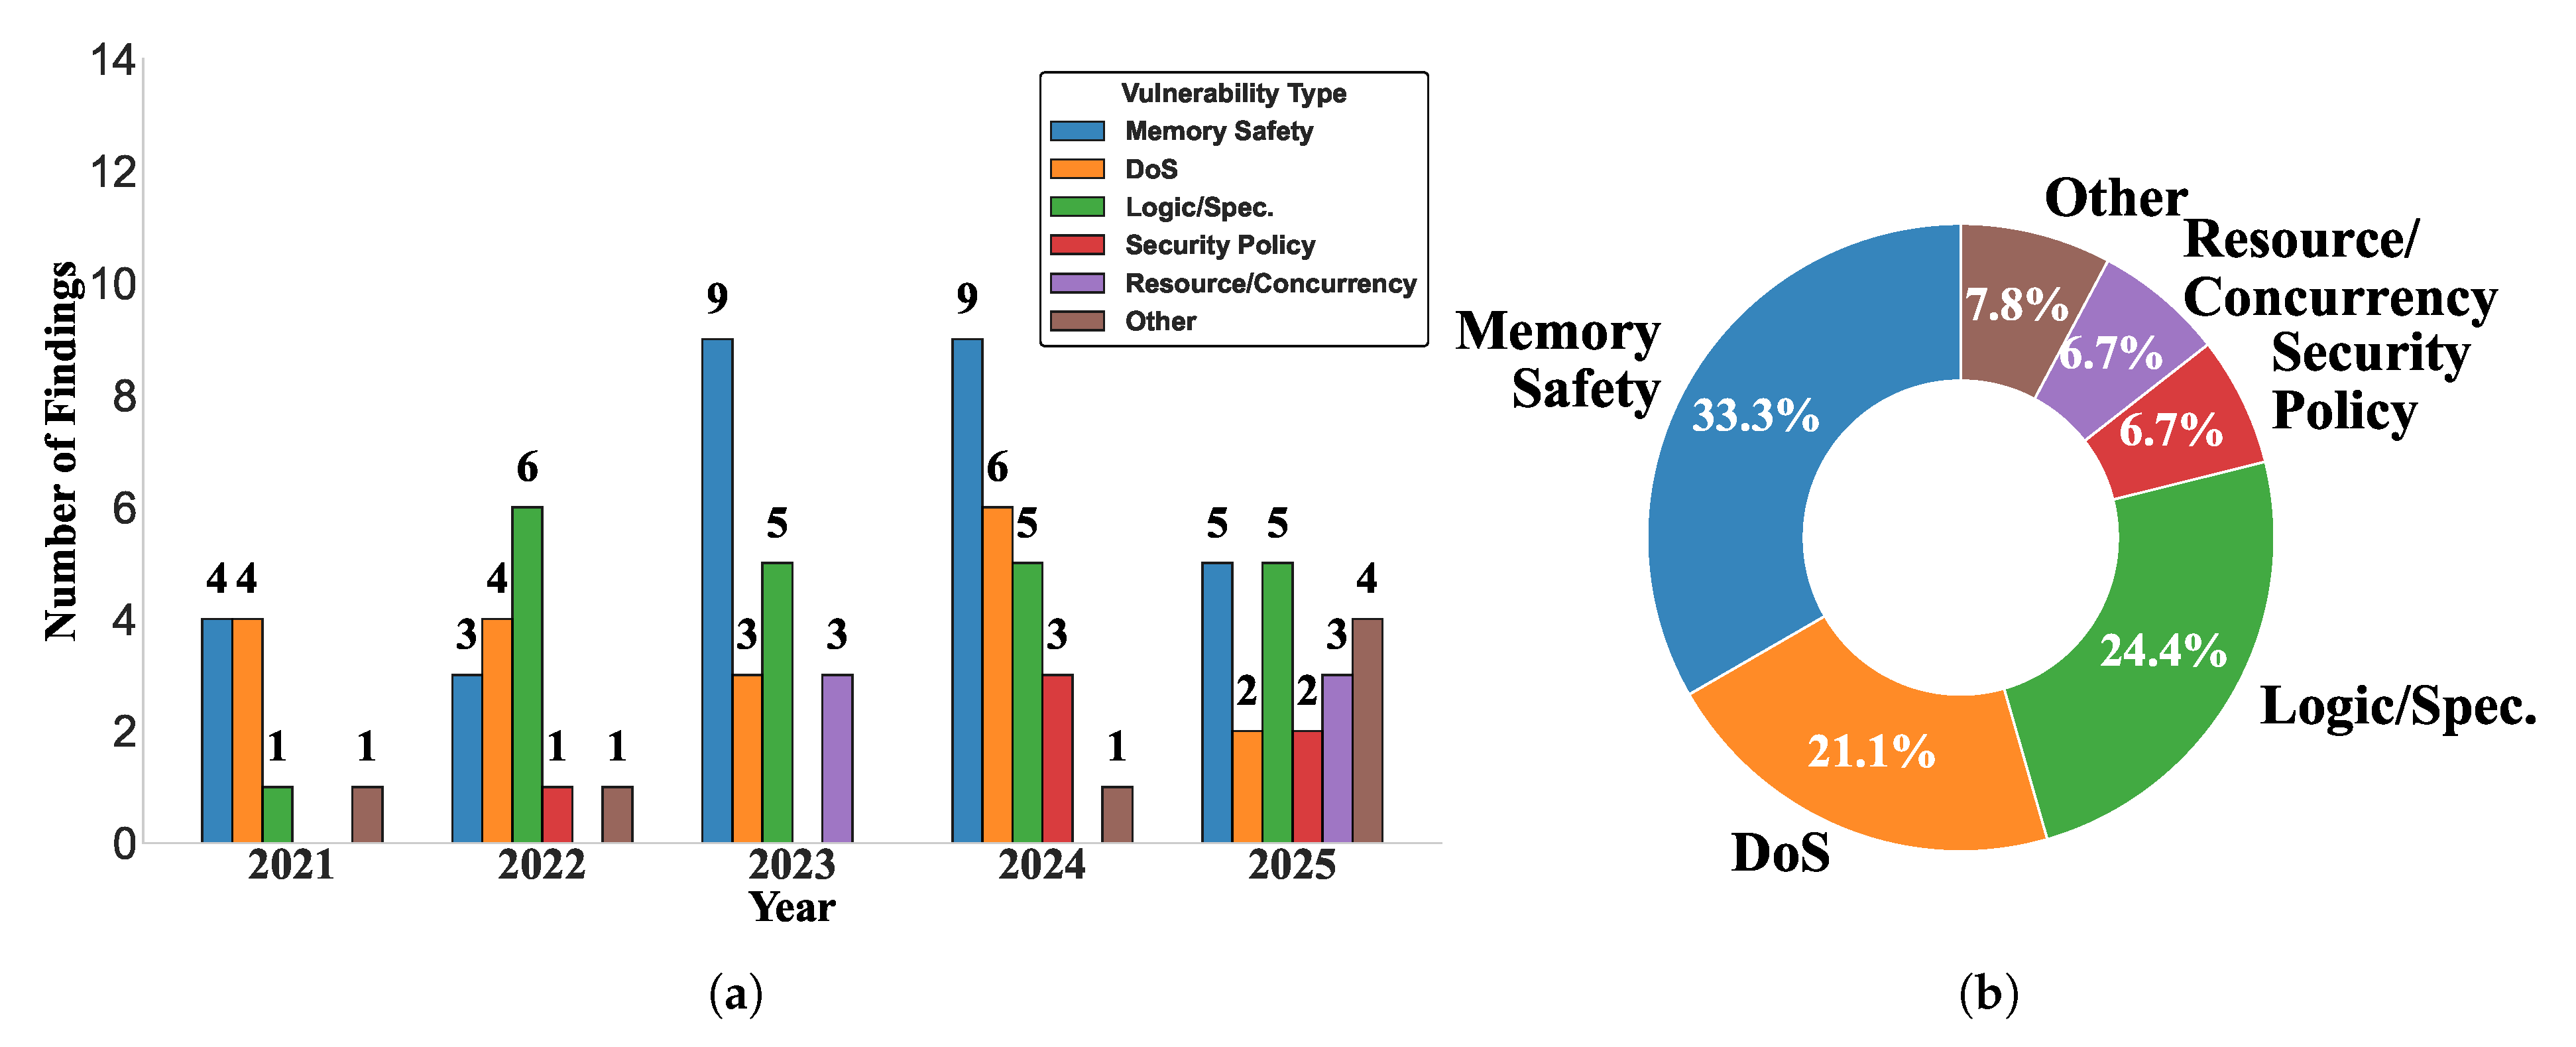
Current research shows a strong preference in the types of vulnerabilities it finds. As shown in Figure 6, Memory Safety and Denial of Service (DoS) vulnerabilities consistently account for the largest proportion of vulnerabilities reported each year, while the discovery of vulnerabilities like Security Policy Bypass is less frequent and consistent.
This output bias is closely tied to the dominant technical paradigms identified in Section 3.3. Coverage-guided fuzzing excels at triggering crashes from memory errors (e.g., buffer overflows), which often manifest as DoS. Consequently, research concentrating on device firmware with this method naturally over-represents these two vulnerability types.
In contrast, uncovering logic or policy violations requires understanding business rules or state machines. For example, MBFuzzer [76] discovers logic inconsistencies through differential testing of multiple MQTT broker implementations, and LLMIF [65] uses LLMs to understand Zigbee access control policies. However, these methods either depend heavily on manual modeling or are still in exploratory stages, failing to form stable, efficient, and scalable capabilities.
This output bias severely misaligns with the risk concerns of smart cities. For city operators, the severity of a vulnerability causing a device reboot (DoS) is typically far lower than that of a logic vulnerability allowing silent tampering of sensor data or bypassing critical security authentication. The former may cause temporary, localized service disruption, while the latter can lead to automated decisions based on misinformation, triggering long-term, covert, and potentially catastrophic physical and social consequences. The current imbalance in the vulnerability discovery capability of fuzzing research means its ability to detect the most lethal threats to urban security is severely inadequate.

3.3. Analysis of the Solution Space: Path Dependency in Fuzzing Technique Paradigms

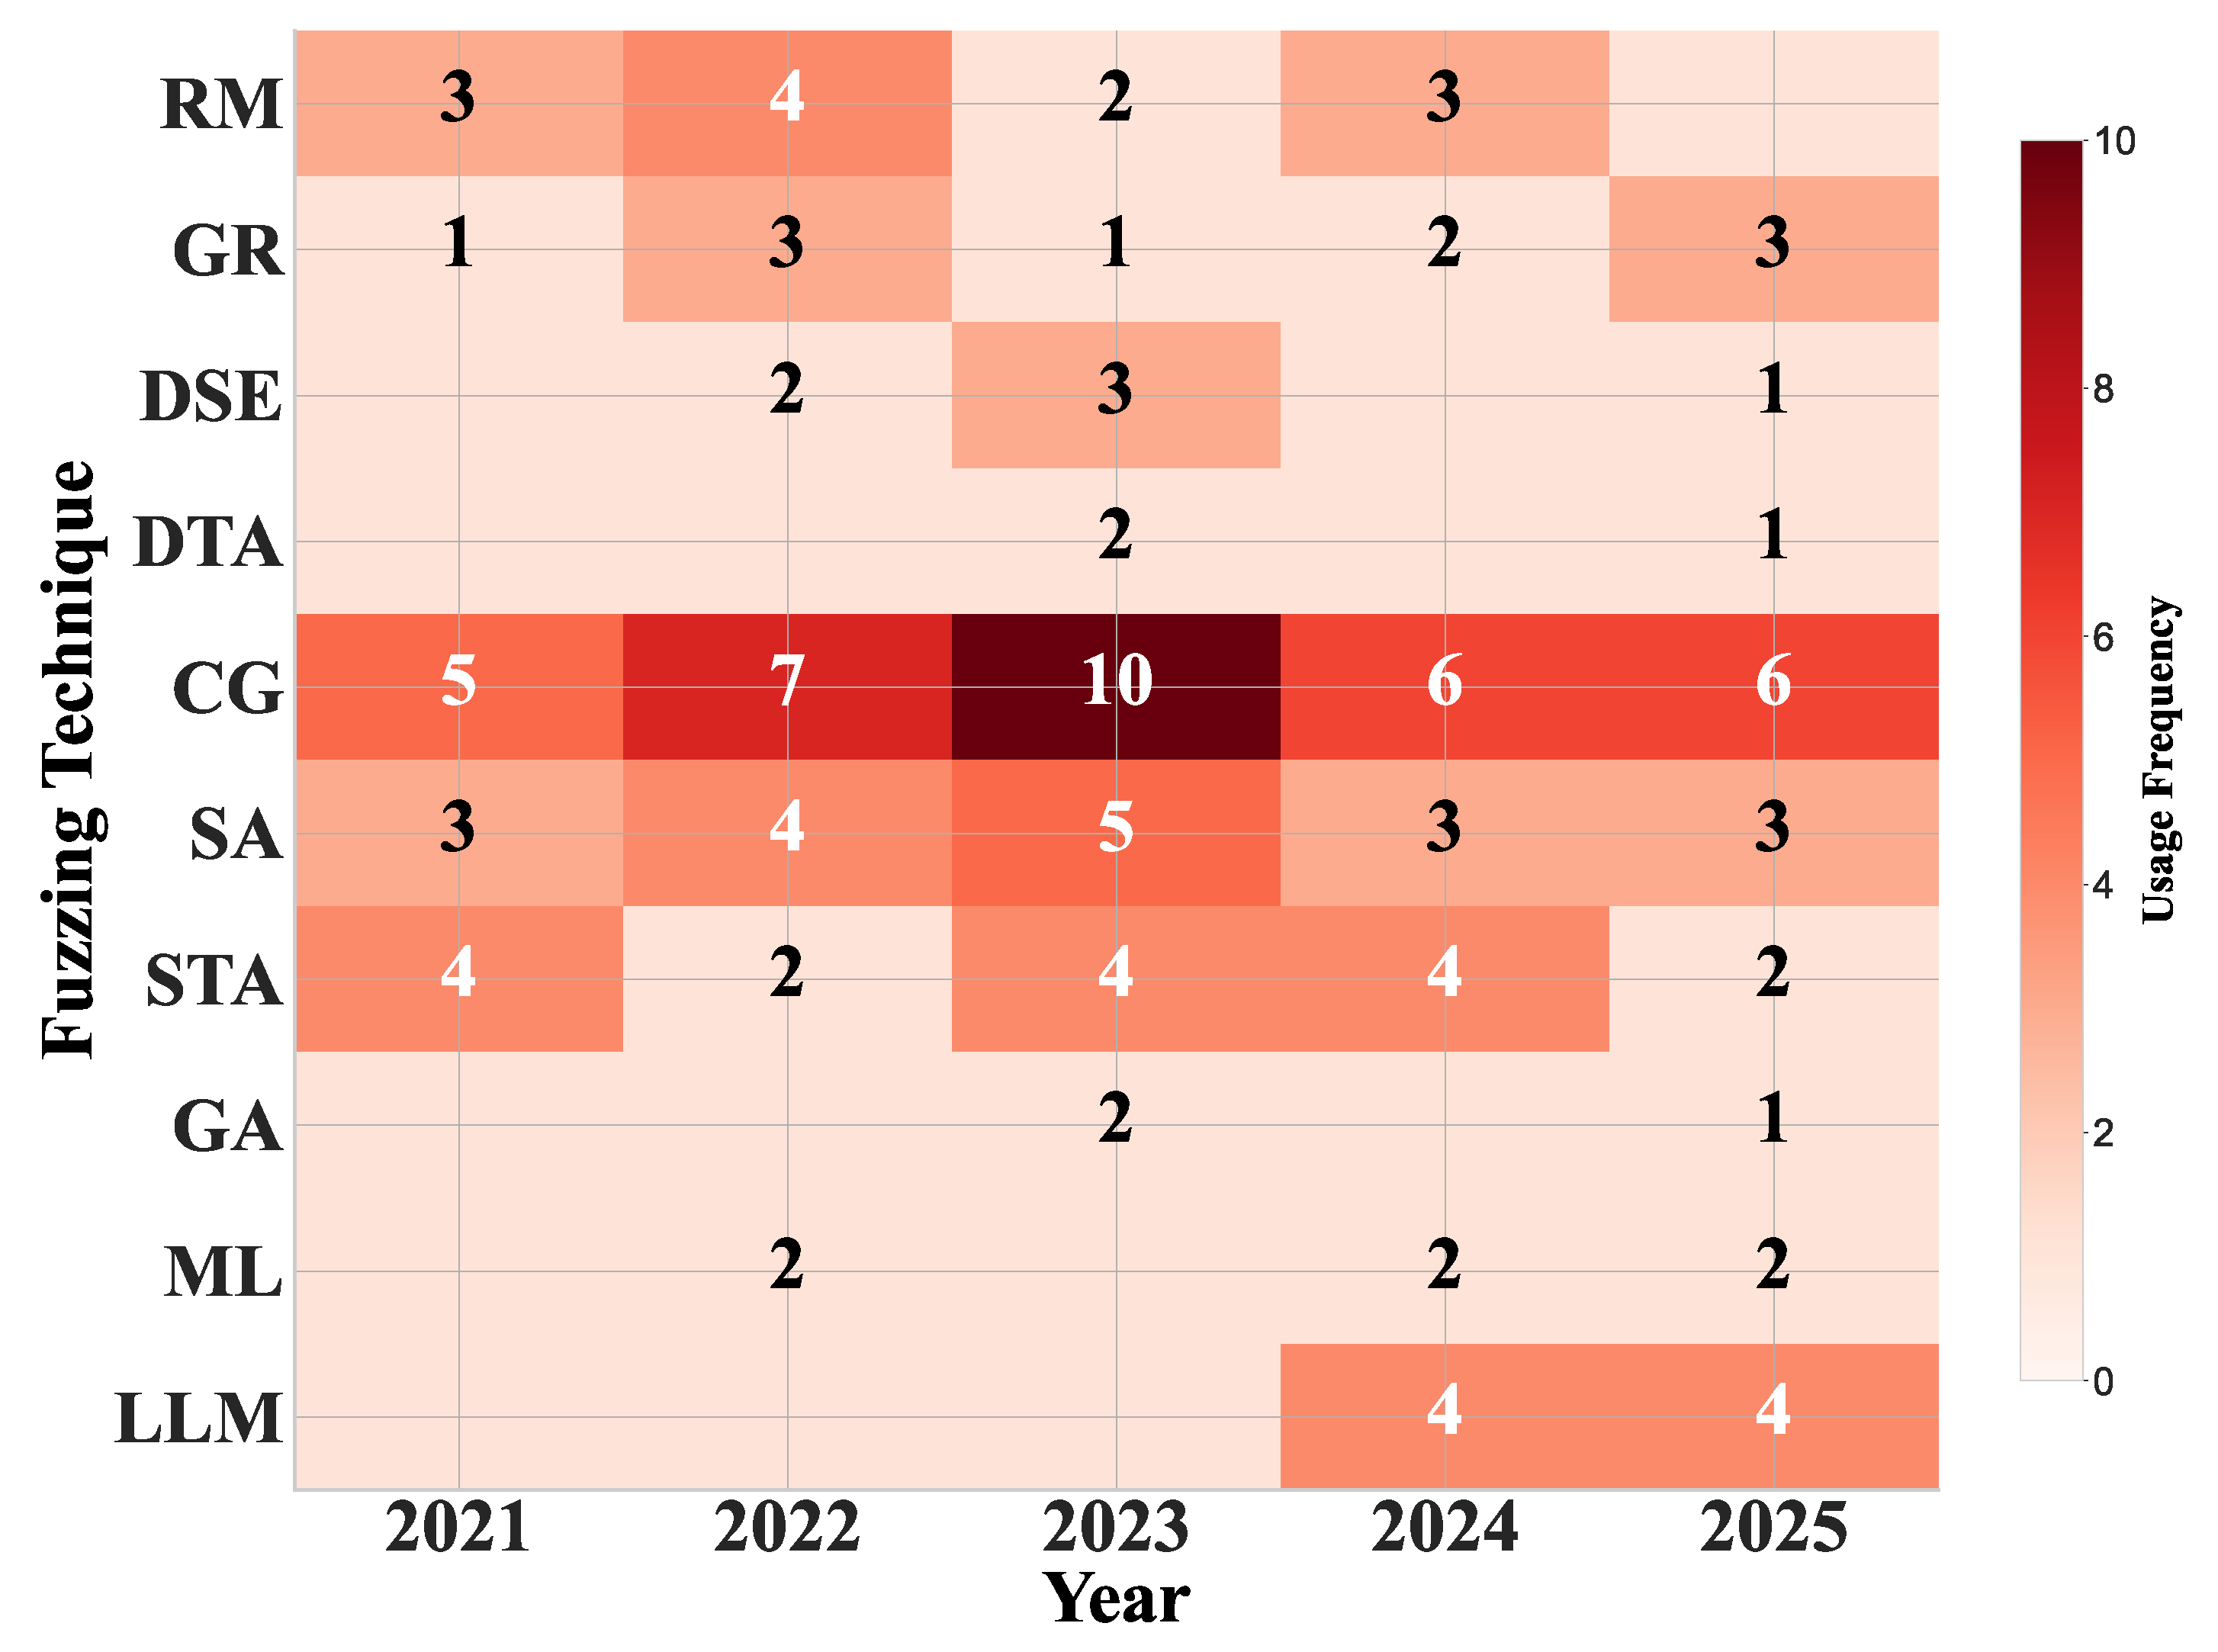
Analysis of technical choices profoundly reveals the methodological roots behind the imbalanced research focus. As shown in Figure 7, Coverage-Guided Fuzzing (CG) constitutes the dominant core paradigm, serving as the primary technique in over 70% of the studies each year. This establishes a dominant paradigm centered on coverage guidance, often combined with Random Mutation (RM) and Scheduling Algorithms (SA). This approach works well for finding memory safety bugs in device firmware but is best suited for T2/T3 devices that provide clear execution feedback. This suitability mismatch may worsen the lack of testing for T1 devices and complex protocols.
The evolution of techniques mainly involves enhancing coverage-guided fuzzing. Static Analysis (STA) is frequently combined (16 studies in total), used before fuzzing to aid in understanding binary code structures or extracting protocol formats, overcoming the common difficulty of lacking source code and documentation for IoT targets. Since 2024, methods using Machine Learning (ML) and Large Language Models (LLM) have grown. Researchers are starting to use LLMs to read protocol specifications or ML to learn interaction patterns, aiming to automate test creation for complex targets like the Matter protocol, where traditional methods struggle with semantics.
By aggregating the 10 key technical paradigms into six major categories (Table 5), the adaptation relationship between technical paradigms and target types is intuitively presented in Figure 8.
Technical choice is highly constrained by the observability and feedback mechanisms of the testing target, demonstrating a pattern of adaptive compromise. Research on these low-observability devices (T1 devices and some T2 devices) tends to use Deep Analysis (like symbolic execution) or hybrid methods, as these devices lack crash signals. These alternative techniques are more complex and less scalable, which helps explain why T1 device research is scarce.
Although the AI-driven paradigm (especially LLMs) has emerged in 2024–2025 research (corresponding to the increased frequency of Method 10 in Figure 7), the bubble chart indicates its application is still concentrated on specific frontier challenges: one is emerging complex protocols (e.g., Matter, Zigbee), and the other is system-level testing. This suggests new tools are tried where old ones fail, while mature paradigms are still preferred for familiar tasks. Furthermore, the limited number and scattered distribution of “Hybrid Paradigm” bubbles in the chart indicate that explorations which deeply and organically integrate deep analysis, AI, and traditional coverage guidance are still in their early stages and have not yet formed a dominant new paradigm to systematically solve the automation problems of semantic understanding and state modeling.

3.4. Analysis of the Solution Space: Gradient Support for IoT Characteristics

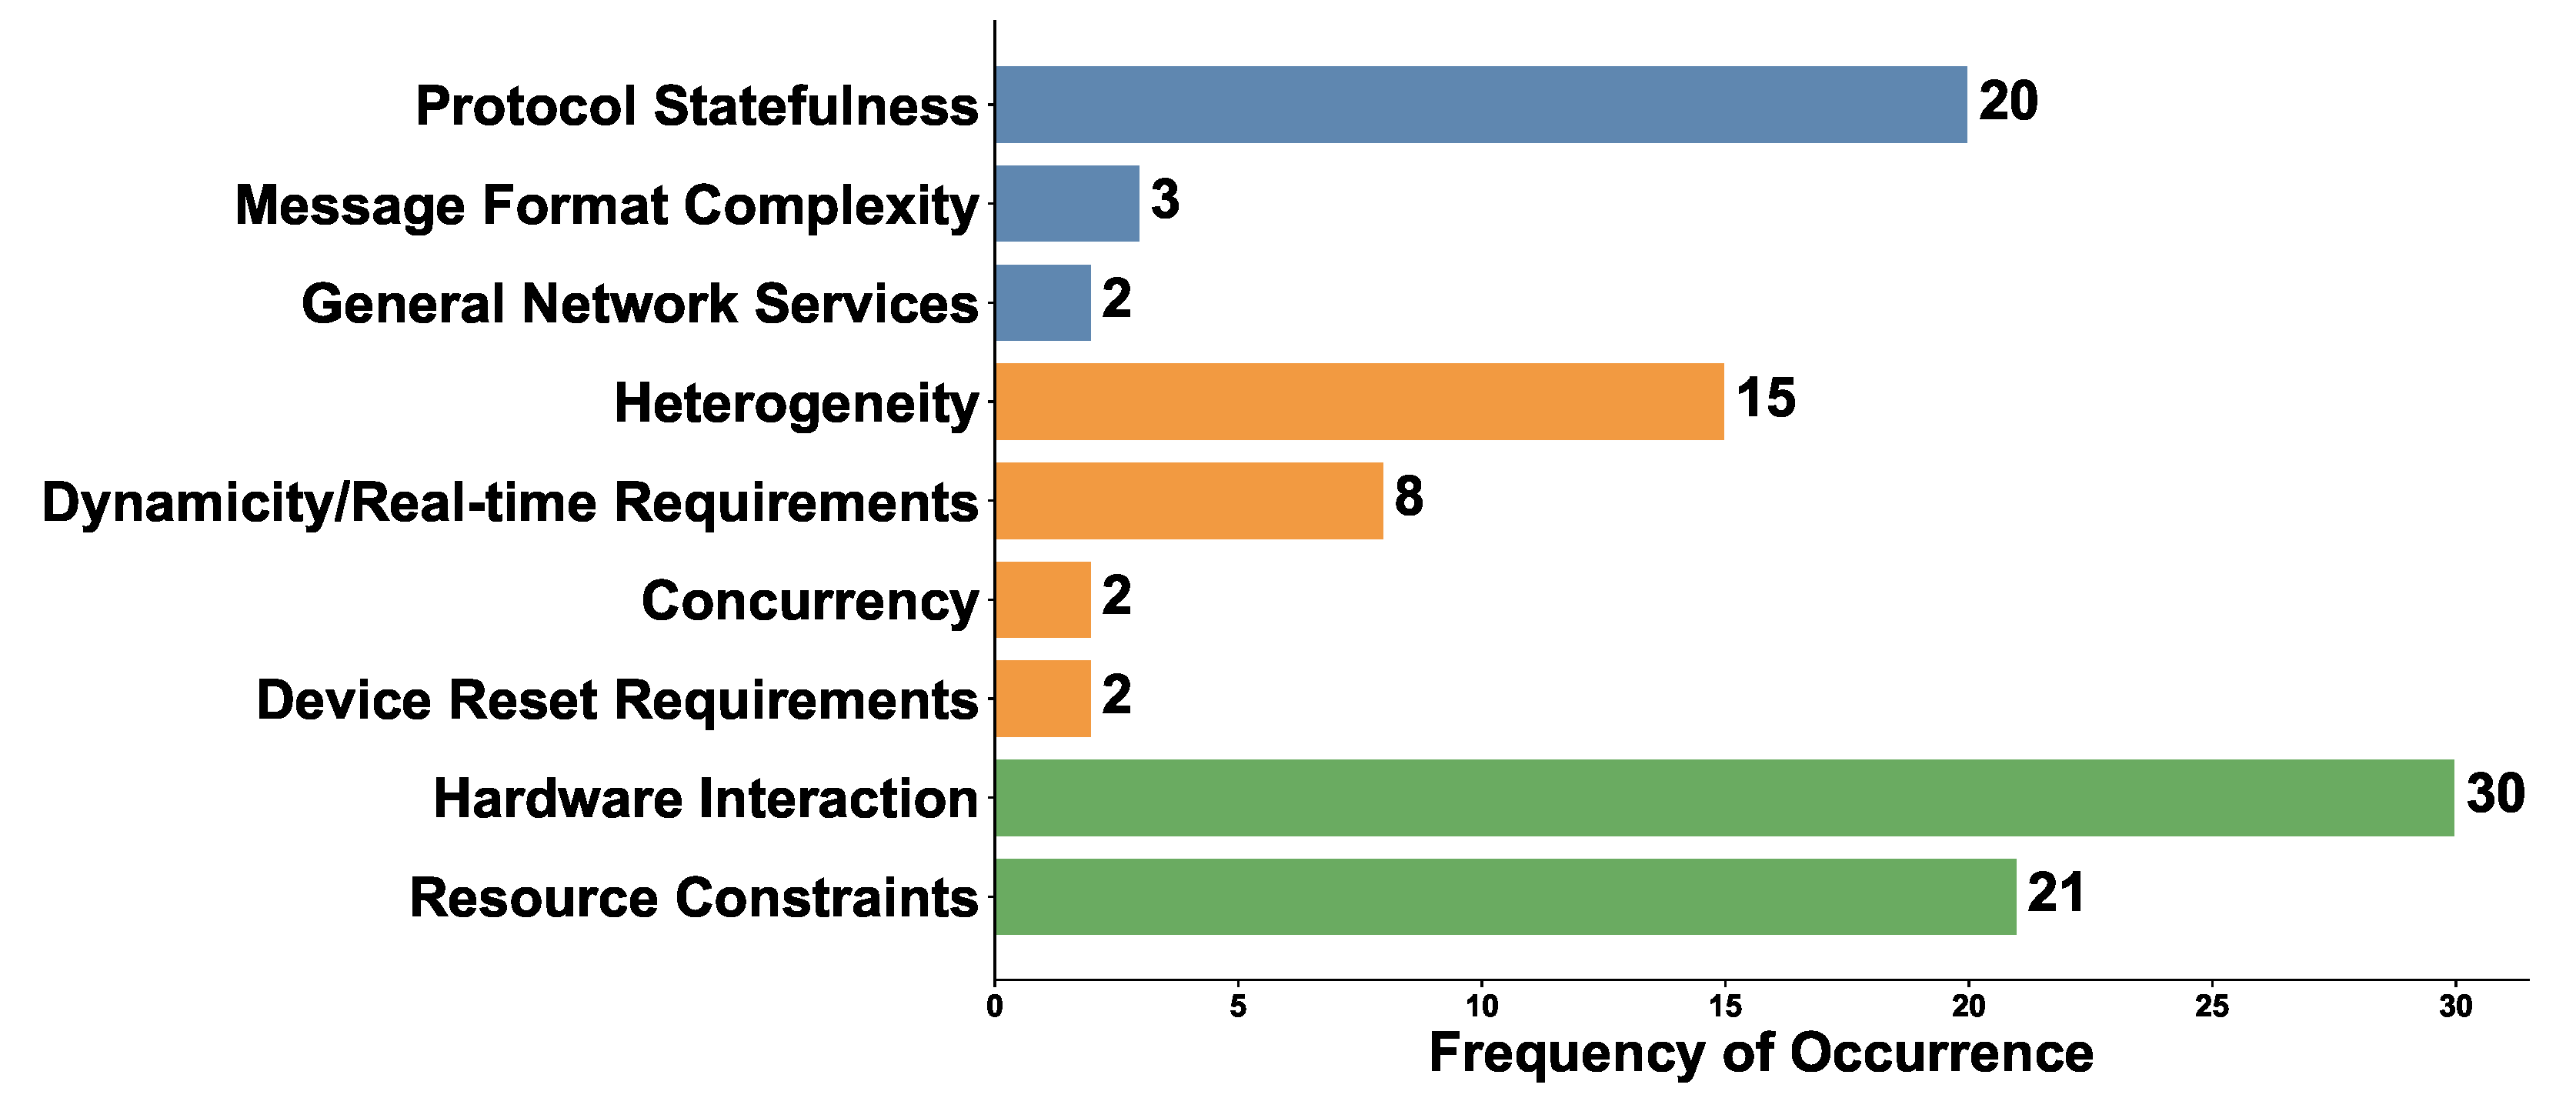
The Satisfied Requirements dimension evaluates how current fuzzing research contends with the practical challenges of IoT environments. By analyzing the explicit consideration of nine key characteristics derived from the reviewed studies (see Figure 9), we observe a stark gradient of support that reveals the field’s methodological priorities and blind spots.
Hardware interaction depth and resource constraints are the two most widely addressed characteristics, reflecting the academic community’s basic consensus on the cyber–physical fusion nature of IoT. Related studies address these challenges by simulating peripherals, modeling interrupts, or optimizing the fuzzer’s own resource consumption. However, support for protocol state complexity remains at a superficial level. Most studies can handle basic session states like connection authentication, but they lack deep modeling and testing capabilities for the multi-step, long-context, timeout-dependent business process state machines inherent in smart city vertical protocols (e.g., video stream control in GB/T 28181, complex object model operations in DLMS/COSEM).
The most serious issue is the widespread neglect of system heterogeneity and environmental dynamics. The highly customized and fragmented nature of tools (each typically adapted only to specific architectures or OSes) causes testing costs to skyrocket when dealing with heterogeneous device clusters composed of different vendors, architectures, and operating systems. Simultaneously, almost all studies are conducted in static, stable laboratory networks and simulation environments, completely divorced from real urban environmental factors like dynamic network topology changes and real-time fluctuations in environmental variables (temperature, signal strength). This renders testing incapable of assessing system resilience and safety under dynamic conditions. This neglect stems from the fact that current research mostly adopts the isolated component testing paradigm, and has not yet evolved to testing philosophies like system-in-the-loop or digital twin.

3.5. Gap Analysis: Validity Constrained by Simulation Dependency and Small-Scale Evaluation

The common limitations of these studies are their reliance on simulated environments, small sample sizes, and low target diversity. Together, these factors severely threaten the external validity of the findings, casting doubt on their applicability to real-world, large-scale, and heterogeneous urban IoT environments.
Simulation dependence is a necessary compromise constrained by physical device accessibility and testing controllability, but it raises questions about fidelity. Among the 42 studies we analyzed, over half of the studies were conducted primarily in high-fidelity simulators (e.g., QEMU [83,84]) or software re-hosting environments. While this resolves dependencies on specialized hardware and debugging tools, simulators have inherent limitations in accurately modeling peripheral timing, interrupt responses, power management states, and the physical behavior of environmental sensors. This may lead to the systematic omission of a class of physically-aware vulnerabilities that are triggered only by real hardware-environment interactions (e.g., race conditions caused by clock drift, memory bit flips caused by electromagnetic interference).
In the research, the testing scale is generally below 20. Only a few studies have achieved a larger scale, lacking verification in large-scale deployment scenarios at the city level. For instance, most protocol tests target only 1–2 open-source implementations (e.g., TXL-FUZZ [68] tested only 3 Modbus implementations), while in smart cities, a single protocol (e.g., Modbus TCP, OPC UA) often has dozens of different closed-source implementations from various vendors, and their vulnerability patterns may vary widely due to implementation differences. Critical infrastructure devices (e.g., specific models of traffic signal controllers, grid RTUs) are almost never included in the evaluation scope of mainstream research due to their closed nature, high cost, and potential testing risks. This sampling bias means that the effectiveness claimed by current studies may only apply to a highly simplified, laboratory-specific subset of IoT, not to real-world city-level deployments.

3.6. Gap Analysis: Self-Reported Limitations and Consensus on Future Directions

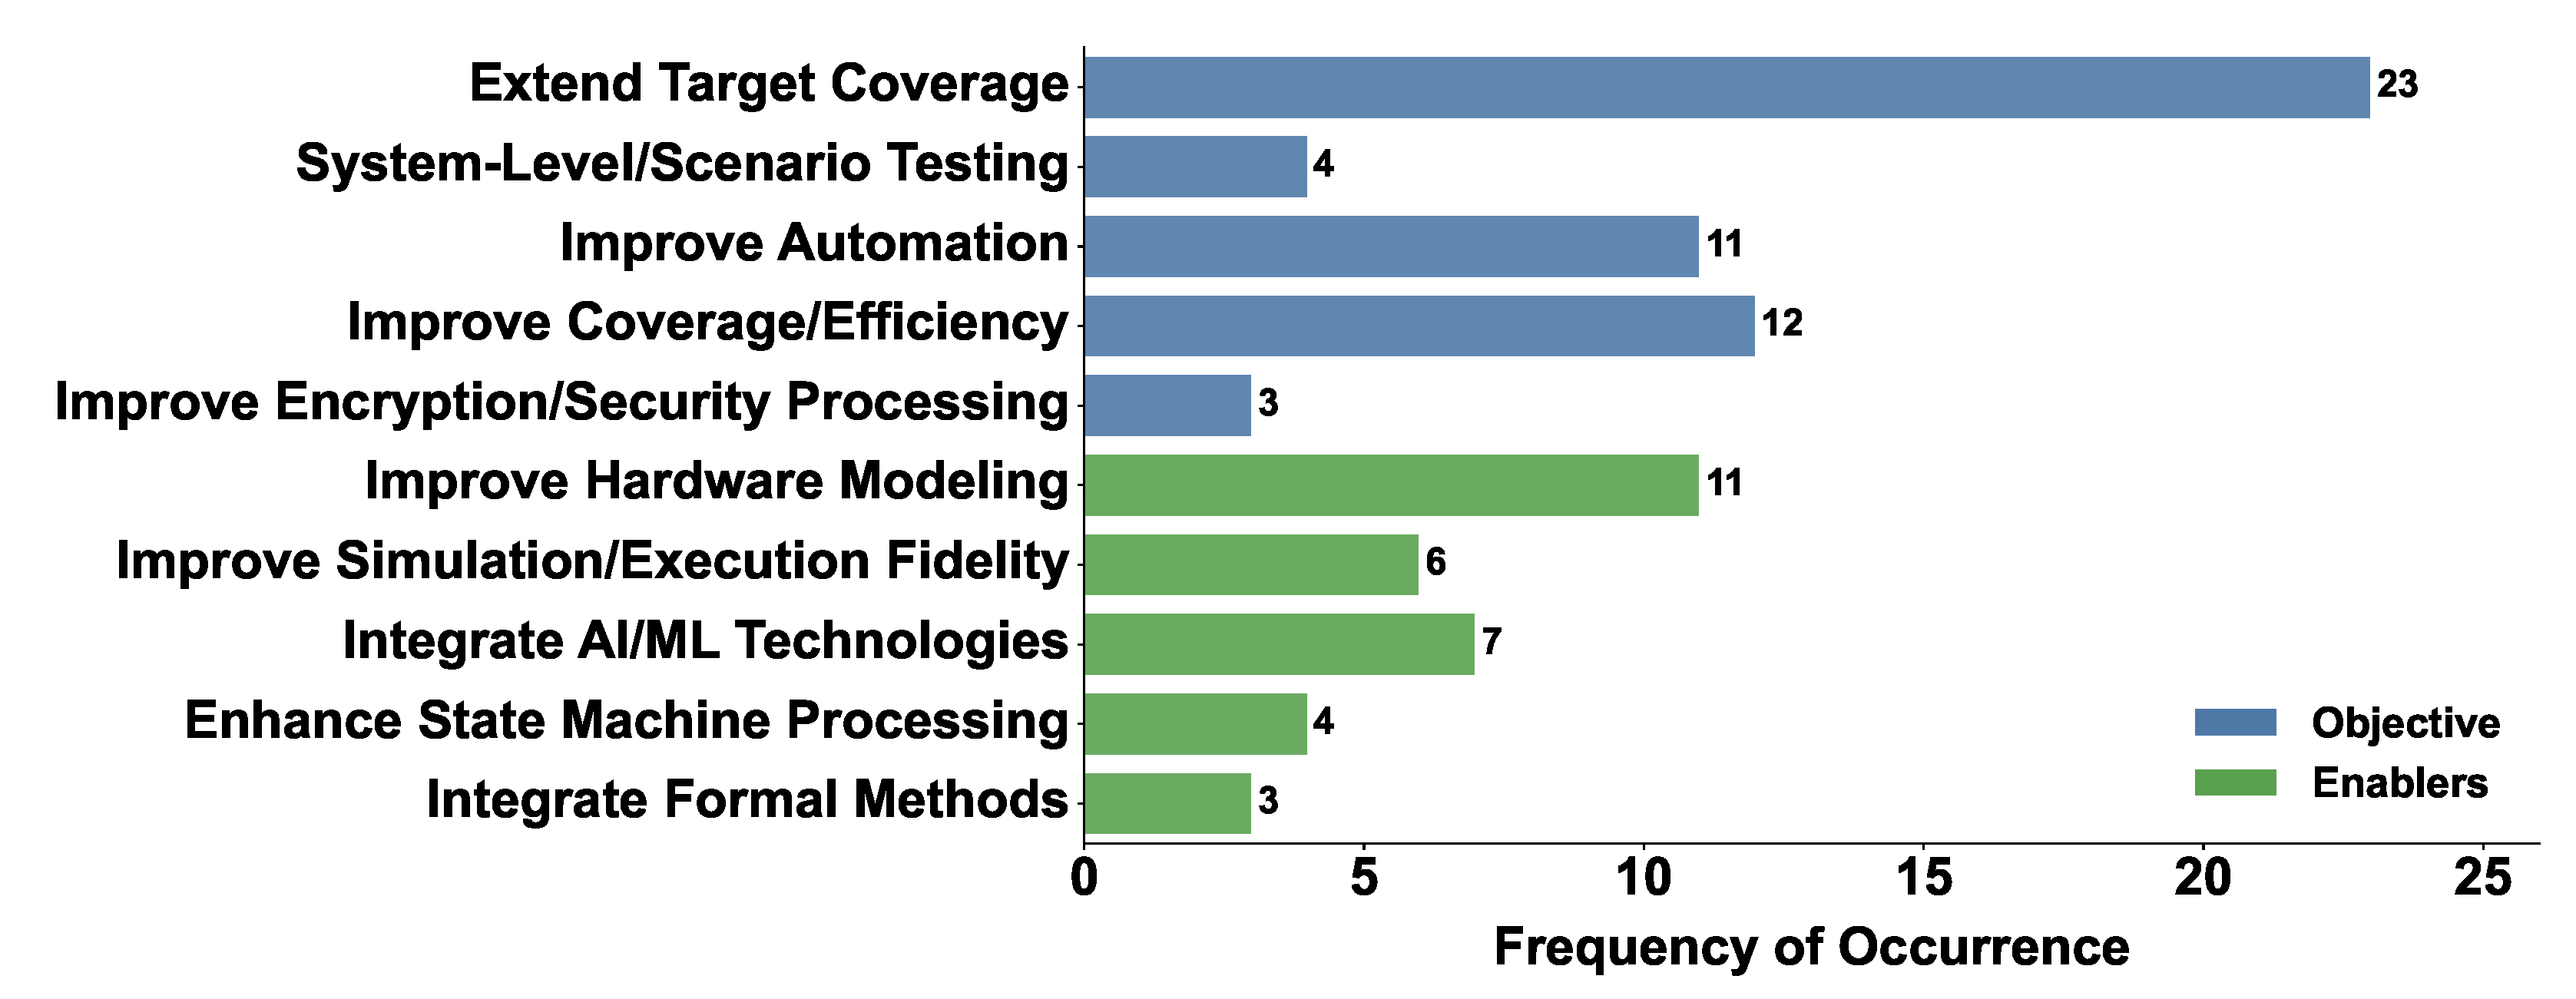
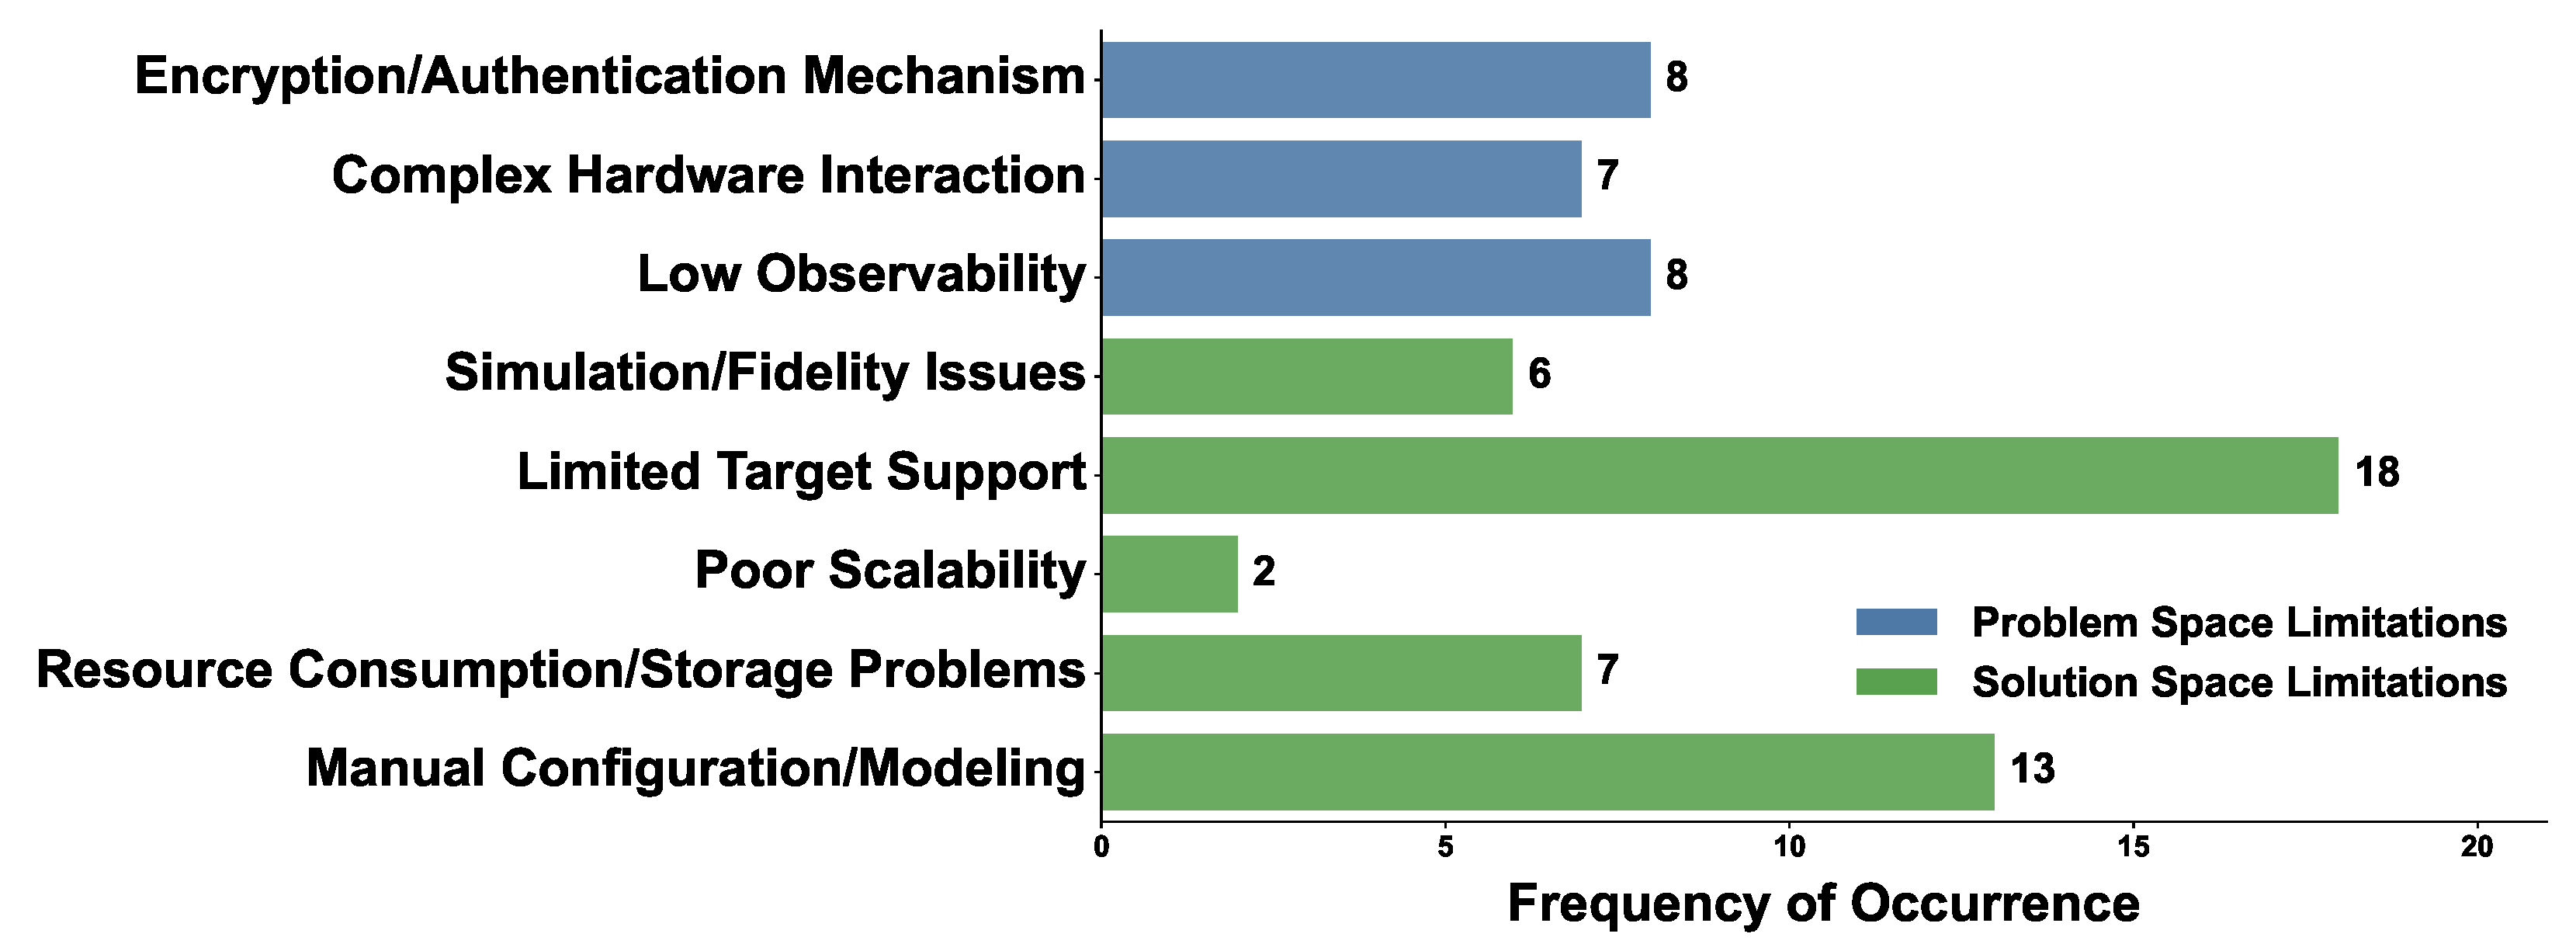
We reviewed the Self-Reported limitations and future directions in the papers we surveyed. This helps us understand the challenges and development ideas in this field from the researchers’ own perspective. Figure 10 and Figure 11 visually show the distribution of these challenges and future directions from a quantitative viewpoint.
We continue to use the structure of Problem Space and Solution Space introduced in Section 2.4.2 and further analyze the content from three levels: limitations, objectives, and enablers. Table 6 clearly shows how these two spaces and three levels relate to each other.
Comparing Figure 10 and Figure 11, we see that the limitations and objectives mentioned in the literature mainly focus on engineering challenges and improvements within the Solution Space, such as expanding support or increasing automation. However, our analysis suggests that a deeper issue comes from a fundamental shift in the Problem Space: smart cities require moving from finding component vulnerabilities to assessing system resilience, but current research methods are not yet ready for this change. This basic mismatch is the root cause of the various unbalanced patterns shown in Section 3.1, Section 3.2, Section 3.3, Section 3.4 and Section 3.5, such as uneven target coverage, limited techniques, and unrealistic validation.
Based on this understanding, Section 4 will not repeat the engineering gaps already widely discussed in the literature. Instead, it focuses on explaining the more fundamental research gaps caused by this shift in the Problem Space and proposes structured ways to move forward.

3.7. Section Summary

The eight-dimensional analysis reveals a field marked by systematic imbalances and self-reinforcing preferences:
  • Imbalanced Focus in the Problem Space: Research efforts are concentrated on testing observable, mid-tier devices (T2) and a few common protocols, while neglecting the vast numbers of low-observability endpoints (T1), critical emerging/vertical protocols, and the security of system-level interactions that determine urban resilience.
  • Constrained Capabilities in the Solution Space: The technical paradigm is dominated by coverage-guided fuzzing, which is efficient for finding memory safety bugs but lacks semantic understanding. This paradigm shapes what can be tested effectively, leaving gaps in addressing complex protocol states, system heterogeneity, and environmental dynamics.
  • Significant Gaps in Validation: Experimental setups rely heavily on simulation and small-scale, homogeneous samples. This limits the external validity of findings and their applicability to large-scale, heterogeneous, and physically-coupled smart city deployments.
These patterns point to a fundamental mismatch. Current research is optimized for finding software bugs in isolated components. However, securing a smart city requires assessing the resilience of an entire interconnected system where digital, physical, and social elements interact. Until this mismatch is addressed, the practical value of IoT fuzzing research for smart city security will remain limited.

4. Gaps and Opportunities

Section 3.6 summarized the self-reported limitations in the literature, which primarily reflect challenges at the implementation level of current methods. However, when examined from the systemic perspective of smart city security, another more fundamental type of limitation exists: the structural mismatch between the current research paradigm and city-level security requirements. Based on the preceding analysis, this section will systematically elaborate on these underlying limitations across three dimensions: devices, protocols, and methodology. Table 6 also summarizes and presents this information. Building on this, it proposes a testing capability migration direction and a preliminary resilience metric evaluation framework.
It should be noted that the gap diagnosis in this study primarily stems from the analysis of academic literature. Therefore, its conclusions may be influenced by the methodological limitations inherent in the selected studies and might not fully encompass all practical constraints encountered in industrial deployments.

4.1. Gap in the Device Dimension

The diversity of IoT devices in smart cities constitutes the first major barrier to security testing. Although current IoT fuzzing research has made significant progress on specific device types, a notable structural gap exists between its overall adaptability and the demands of the complex device spectrum found in smart cities. The literature reports general limitations but fails to reveal structural imbalances in device test coverage.

4.1.1. Device Testing Challenges

Testing Vacuum for T1 Devices: These devices face extreme resource constraints and a complete lack of debugging feedback. This renders traditional fuzzing paradigms that rely on crash feedback and code coverage guidance completely ineffective. More critically, current research almost entirely overlooks their energy profiles: the finely-tuned sleep-wake cycles optimized for multi-year battery life can be severely disrupted by traditional continuous stress testing. Consequently, vulnerabilities discovered under such distorted operational modes may never be triggered in real-world deployments.
Fragmentation in T2 Device Research: Although T2 devices are the absolute focus of current research, the methodology is trapped in a cycle of custom development for specific device models, operating systems, or architectures. For instance, AidFuzzer [75] focuses on the combination of ARM Cortex-M architecture and FreeRTOS but becomes ineffective against smart metering devices using RISC-V architecture and Zephyr RTOS. It cannot adapt to the reality of rapid device iteration and multi-vendor coexistence in smart cities, making research outputs difficult to translate into scalable testing capabilities.
Absence of the Physical Deployment Context: Ignore environmental factors that trigger vulnerabilities in the physical world. For example, temperature-induced clock drift can trigger timing race conditions, and electromagnetic interference can cause memory bit-flips or communication errors. Future testing frameworks should consider incorporating environmental models or, more ideally, integrating with Hardware-in-the-Loop (HIL) simulation and digital twin technologies. This would enable “environment-device” joint fuzzing by simulating realistic environmental perturbations in virtual or controlled physical settings.

4.1.2. Observability-Complexity Based IoT Device Classification Model

To systematically diagnose these issues, we propose a two-dimensional analytical framework—the Observability-Complexity Based IoT Device Classification Model. To enhance the operability of the four-quadrant model, we provide the following two-level operational definitions for its two core dimensions:
Device Observability (Horizontal Axis): Based on a device’s capability to provide effective feedback during the fuzzing process.
  • High Observability (Quadrants I, II): The device provides clear, actionable feedback signals during testing. This includes: program crash or assertion failure signals, runtime log output (serial/network), code coverage feedback, or execution state capturable via debugging interfaces (e.g., JTAG).
  • Low Observability (Quadrants III, IV): The device lacks the aforementioned feedback mechanisms. Its behavior can only be inferred indirectly through final functional outputs (e.g., whether sensor data is updated, whether a relay actuates) or external side-channels (e.g., power consumption, electromagnetic emissions).
Business Logic Complexity (Vertical Axis): Based on the interaction depth and state management requirements involved in the device’s functionality.
  • Low Complexity (Quadrants II, III): The device’s function corresponds to a fixed, linear, or periodic task flow. It does not involve multi-step state transitions, multi-device coordination, or context-dependent input sequences. Typical examples include sensors that periodically report data.
  • High Complexity (Quadrants I, IV): The device’s function involves state machines, multi-step interaction protocols, cross-component coordination, or deep coupling with external systems/physical processes. Its correct operation depends on the context of historical interactions or complex business rules. Typical examples include protocol gateways and industrial controllers.
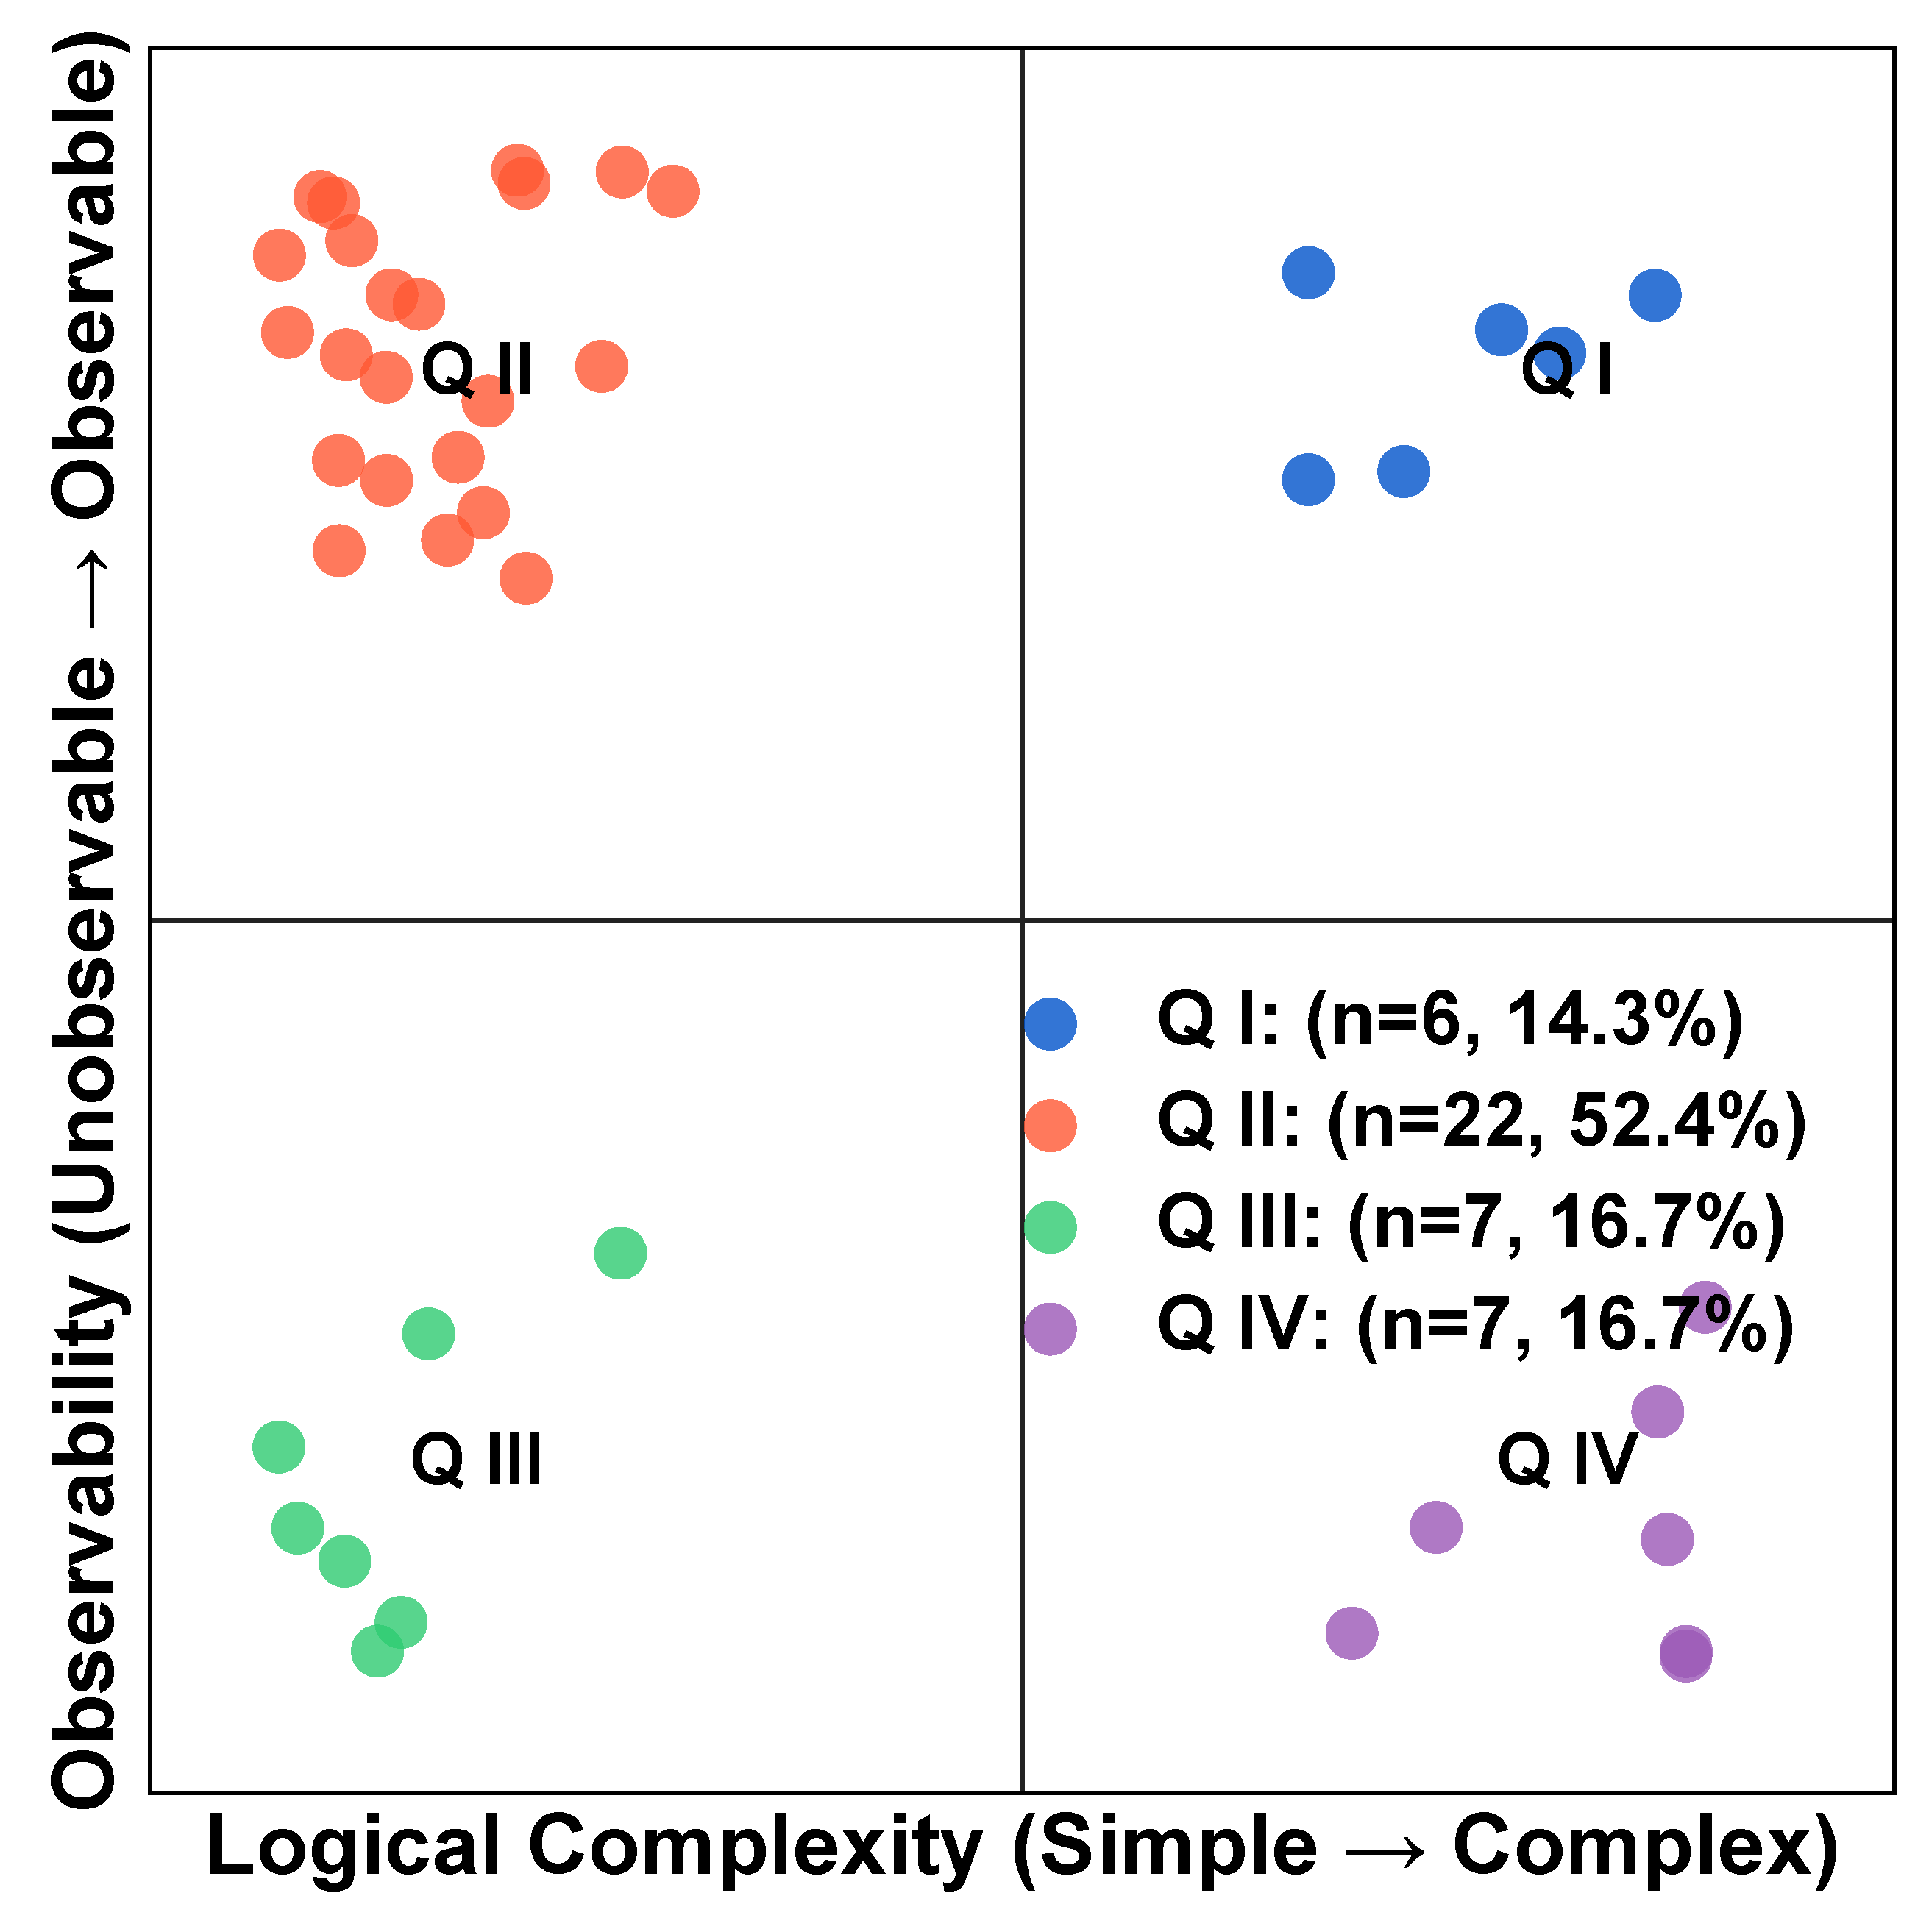
Taking the study Fuzzware [51] as an example, it tests ARM Cortex-M firmware via emulation. This firmware typically runs on an RTOS, providing certain crash and log feedback (high observability), but its logic is relatively singular (low complexity), mainly focused on hardware peripheral drivers and protocol stack parsing. Therefore, its primary effectiveness lies on the edge of Quadrant II. While the tool enhances observability through emulation, its capabilities remain insufficient when facing Quadrant IV devices (e.g., complex industrial controllers with no feedback) or Quadrant I systems (involving multi-device coordination). This case validates the model’s effectiveness and highlights the distribution limitations of current research.
Based on this model, Table 7 summarizes the core characteristics and example devices for each quadrant.
  • Quadrant I (Observable, Complex Systems): Contains devices requiring complex interactive logic but offering good runtime feedback. Typical examples include traffic command center systems, autonomous vehicle fleet coordination systems, and building automation centers. These systems usually consist of multiple T3 devices interacting through complex protocol stacks; their security failure can cause city-scale service disruptions.
  • Quadrant II (Observable, Simple Devices): Typical devices include smart cameras, home routers, and commercial gateways running standard Linux. These devices provide clear crash signals and code coverage feedback, with relatively standardized protocols and interfaces, enabling coverage-guided grey-box fuzzing to operate efficiently. However, devices in this quadrant often do not occupy the most critical positions in the smart city risk landscape.
  • Quadrant III (Unobservable, Simple Devices): This quadrant contains the vast number of devices at the city’s sensory periphery, such as low-power temperature/humidity sensors, smart utility meters, and LoRaWAN end nodes. These devices perform fixed, simple functions but completely lack runtime debugging interfaces, creating a “feedback black hole.”
  • Quadrant IV (Unobservable, Complex Devices): This is the deep water of specialized domains, containing devices like industrial PLCs, medical device controllers, and dedicated traffic signal controllers. They run proprietary firmware implementing complex control logic but typically lack standard debugging interfaces and require deep domain knowledge.
As shown in Figure 12, the mapping of 42 studies clearly reveals structural imbalances—intense concentration on Quadrant II, where technical difficulty is moderate and output visibility is high. In contrast, the critical risks of smart cities are widely distributed across Quadrants I, III, and IV. This mismatch between the research comfort zone and high-risk areas indicates a fundamental disconnect between the overall capability map of current IoT fuzzing and the actual security needs of smart cities.

4.1.3. Technology Migration Pathways Across Quadrants

To fill the testing capability gaps in the device dimension, we need systematic technology migration strategies. As outlined in Table 8, the four-quadrant model not only diagnoses problems but also provides a clear navigation chart for technological evolution.
Vertical Migration (From Quadrant II to Quadrant I): The complexity of Quadrant I devices stems from multi-component coordination, cross-protocol interaction, and long-running business logic. Traditional single-point fuzzing cannot capture system-level interaction vulnerabilities.
  • Extend mature protocol state machine inference methods from Quadrant II (e.g., the state learning for BLE in IoTInfer [46]) to model multi-device collaborative states. For a traffic signal network, this means learning not just the state machine of a single controller, but also inferring the timing coordination logic between multiple controllers.
  • Integrate coverage-guided fuzzing with digital twin models of urban infrastructure. Instantiate device clusters in a virtual environment, use attack graph techniques to identify critical interaction paths, and then perform targeted fuzzing.
  • Move beyond code coverage to define new metrics that capture inter-component interaction coverage and business scenario coverage, guiding fuzzers to explore complex system behavior spaces.
Horizontal Migration A (From Quadrant II to Quadrant III): The fundamental problem for Quadrant III devices is the complete absence of traditional crash feedback.
  • Draw inspiration from black-box response analysis in works like SNIPUZZ [43] to develop anomaly detection mechanisms based on multi-dimensional side-channel signals: power consumption traces, electromagnetic emissions, timing characteristics, etc. Internal faults can be inferred indirectly by monitoring deviations in a device’s physical signature during test case execution.
  • Develop fuzzing frameworks capable of simulating real device energy management strategies (e.g., Pemu [77]). The testing process must respect the device’s sleep-wake cycles and optimize test scheduling under energy constraints to ensure discovered vulnerabilities are triggerable under real energy profiles.
  • For devices with physical actuators (e.g., valve controllers), establish a model of their normal physical behavior (based on sensor readings, actuator states). Detect deviations between actual physical outputs and model predictions to uncover software vulnerabilities that could lead to dangerous physical states.
Horizontal Migration B: From Quadrant II to Quadrant IV Quadrant IV devices combine “unobservability” with “complex proprietary logic,” creating a dual testing barrier.
  • Leverage the approach from works like mGTPFuzz [73], which uses Large Language Models (LLMs) to parse specification documents. Build toolchains that can automatically process multi-modal domain knowledge—industrial protocol standards, device technical manuals, configuration files—to reduce reliance on domain experts.
  • Adapt static analysis and dynamic taint analysis techniques from Quadrant II (targeting common protocols) for reverse engineering proprietary protocols. Analyze device firmware, network traffic, and API interactions to automatically infer message formats, state machines, and business logic constraints of proprietary protocols.
  • For devices deeply coupled with physical processes (e.g., industrial PLCs), integrate the fuzzing engine with high-fidelity Hardware-in-the-Loop (HIL) simulation environments. By providing realistic I/O responses via the simulator, fuzzing can probe control logic vulnerabilities under conditions close to actual operation.
A concrete example illustrating how this model guides testing decisions is as follows: for an LPWAN temperature sensor (a typical Quadrant III device with low observability and simple logic), the model guides researchers to move beyond traditional coverage-guided fuzzing that relies on crash feedback. Instead, it encourages adapting proven techniques from Quadrant II, prioritizing multi-modal side-channel detection (e.g., power consumption tracing) and energy-aware scheduling. This approach addresses the feedback absence problem inherent to such devices, thereby improving the targeting and efficiency of vulnerability discovery.

4.2. Gap in the Protocol Dimension

The communication protocol stack in a smart city is a complex, multi-layered, multi-domain ecosystem where the security perimeter is jointly determined by the implementation robustness of each protocol layer. While current research has made progress on individual protocols, it fails to holistically address the fundamental challenges of this ecosystem.

4.2.1. Protocol Testing Challenges

Structural Coverage Gap: Protocol research is heavily concentrated on classic targets such as MQTT, BLE, and Modbus, creating a sharp contradiction with the rapid technological evolution in smart cities. Taking LoRaWAN and Matter as examples: the former is the foundation of low-power wide-area sensing networks, and the latter is a core standard aimed at breaking down ecosystem barriers. Both are being deployed rapidly in smart municipal and home applications. However, as of 2025, systematic fuzzing research targeting them is nearly zero and limited to just one study (mGTPFuzz [73] for Matter), respectively. The root of this coverage gap may lies in the inertia of research topic selection: open-source implementations of mature protocols, existing toolchains, and prior research outcomes constitute a low-risk foundation for innovation. In contrast, the uncertainty and cost of research increase dramatically for emerging, closed, or complex protocols.
Effectiveness Challenge for Protocols: For protocols like DNP3, OPC UA, and GB/T 28181, their message formats are complex (often binary TLV or specific XML Schema), and command validity is entirely embedded within multi-step business processes. The discovery rate for logic/specification-class vulnerabilities in such protocols is relatively low, directly reflecting the limitations of mainstream methods. When applied to these protocols, pure random byte mutation or grammar rule mutation exponentially generates a vast number of semantically invalid test cases (e.g., writing data to a non-existent register). These invalid cases cannot penetrate the shallow parsing logic of the protocol stack, let alone reach the core control state machine or business logic, resulting in extremely low testing efficiency. Essentially, current fuzzing lacks the ability to understand the semantic context of the protocol; it knows the message format but does not understand the meaning of a message within a specific business scenario or its legitimate state transitions. This is an inherent methodological flaw and explains why research combining static analysis or AI understanding (e.g., LLMIF [65]) is emerging in protocol testing to tackle this barrier.

4.2.2. A Protocol Taxonomy

To systematically address the security testing challenges of communication protocols in smart cities, we propose a two-dimensional classification framework, as shown in Table 9. This framework not only describes a protocol’s functional location but also reveals its state management characteristics—a key factor determining the effectiveness of fuzzing methods. The approach is based on the fundamental three-layer IoT architecture, extended with a state model reflecting its core interaction logic.
Protocols are categorized according to their primary functional layer within the smart city IoT architecture: Perception Layer (P), Network Layer (N), and Application Layer (A). This classification directly links protocols to their operational scope and the types of devices they connect, providing initial insight for the testing context. Within the broad Application Layer, we further distinguish sub-functions (e.g., control, messaging, vertical business) to clarify their specific roles.
To capture the inherent complexity of protocol interactions, which is crucial for stateful fuzzing, we classify them based on the nature and scope of the state they maintain. This dimension is defined by the entity and degree of protocol context maintenance, resulting in categories such as: S-N (Strong state, network-maintained), S-S (Strong state, session-maintained), S-D (Strong state, distributed-maintained), W-T (Weak state, transactional), or None (Stateless). This classification is vital because the approach to modeling, implementing, and testing a protocol’s core logic fundamentally depends on how it manages state.
To ensure the reproducibility of the protocol state classification (S-N, S-S, S-D, W-T, None), we provide the following decision criteria:
  • S-N: State is centrally maintained by network infrastructure (base stations, servers). Device state depends on processes such as network registration and key negotiation. Decision Basis: The protocol specification explicitly defines a network-side state table or device activation procedures (e.g., the Join procedure in LoRaWAN).
  • S-S: State is maintained by communicating parties at the session layer, typically involving connection establishment, authentication, and transaction sequences. Decision Basis: The protocol requires maintenance of session identifiers, sequence numbers, or security contexts (e.g., OPC UA sessions).
  • S-D: State is maintained in a distributed manner by multiple peer nodes, common in decentralized protocols. Decision Basis: The protocol involves consensus mechanisms, distributed state synchronization, or decentralized identity management.
  • W-T: State exists only within a single request-response transaction and does not persist across messages. Decision Basis: Protocol messages are self-contained with no explicit session identifiers (e.g., basic HTTP requests).
  • None: The protocol does not maintain any state; each message is entirely independent. Decision Basis: The protocol specification does not define any state machine or context retention mechanism.
This two-dimensional framework (Layer and State) moves beyond a simple protocol list. It enables a structured analysis of why different protocol clusters pose distinct challenges for security testing—for example, why fuzzing a network-maintained protocol like LoRaWAN is inherently different from fuzzing a session-maintained protocol like OPC UA, even though both are stateful.

4.2.3. Methodology Transferability Analysis

As discussed in Section 4.1.1, current research exhibits significant coverage gaps in the smart city protocol ecosystem and faces a semantic gap when dealing with complex protocols. To systematically and reproducibly fill these capability gaps, this section proposes a technology migration framework that uses the protocol Layer and the state Category as its core discriminative features. The fundamental logic of this framework is that protocols sharing similar basic features inherently share similar core testing challenges and technical solutions. Therefore, by analyzing the feature matching between a target protocol and already researched protocols, we can efficiently identify the most promising technology migration paths from existing mature methods, thereby accelerating the construction of testing capabilities for emerging or vertical protocols.
Table 10 systematically presents the analysis results based on this framework. It first identifies the core feature combinations to which key but under-researched protocols in the smart city scenario belong, according to the taxonomy defined in Section 4.2.2. Then, it analyzes the unique testing challenges posed by these protocols, and finally maps them to the transferable technologies and methods from the reviewed studies.
The aforementioned (Layer, State) feature-matching migration framework provides researchers with a structured and reasoned pathway for technological evolution. For instance, when confronted with the smart grid standard protocol DLMS/COSEM (A, S-S), this framework directly points to the technical routes of state machine inference from IoTInfer and semantic sequence learning from TXL-FUZZ [68]. Researchers can then prioritize exploring adaptations of these methods, significantly lowering the entry barrier.
The value of this framework lies in its extensibility. Any new protocol emerging in the future can first be categorized into a specific (Layer, State) feature combination based on its specification documents and interaction patterns. Subsequently, a starting point for development can be found in the “Transferable Technologies” column of Table 10. This essentially establishes a “pattern library” for IoT protocol testing technology, transforming discrete research outcomes into reusable strategic assets. This approach, to some extent, enhances the field’s overall capacity to cope with protocol fragmentation and rapid evolution.
However, the limitations of this framework must be clearly stated. Its inductive reasoning is primarily based on the 42 studies systematically reviewed in this paper and the limited set of protocols they cover. Although we endeavored to include key protocols from classic, emerging, and vertical domains (as shown in Table 9), the smart city IoT protocol ecosystem is extremely vast and complex. Many proprietary, niche, or not-yet-widely-studied protocols remain outside the scope of this analysis. Therefore, the framework’s completeness requires continuous validation and enrichment as future research covers more protocol types.
Moreover, the effectiveness of feature matching is a heuristic process. Mapping a target protocol to a (Layer, State) category and selecting a migration technology based on this does not guarantee success; the final outcome still depends on the degree of match between the target and source protocols on finer-grained features, such as message encoding complexity, specific encryption implementations, and the strictness of real-time constraints. This framework provides a high-probability path to success, not an absolute guarantee.
Nevertheless, these limitations also point to future research directions. We envision that this framework could evolve into a community-driven, continuously updated “Protocol Testing Knowledge Base.” Whenever future research develops an effective testing method for a new protocol, it can contribute the protocol’s features, core challenges, and solutions as a new case back to this knowledge base. Through this collaborative effort, the entire research community can work together to continuously validate, refine, and expand this feature-matching model, ultimately establishing it as a robust and dynamically evolving infrastructure within the field of IoT security testing.

4.3. The Methodological and Technical Dimension

Current IoT fuzzing, philosophically, still belongs to the paradigm of traditional software security, with its core goal being the maximization of memory or logic defects found in individual components. However, smart city security is an emergent property arising from the complex interactions of countless heterogeneous components in a dynamic environment. Simply superimposing fuzzing aimed at individual devices or protocols cannot touch the essence of system-level security.

4.3.1. The Vacuum in System-Level Testing and Insensitivity to High-Order Risks

Security threats in smart cities often manifest as attack chains, where an attacker might exploit a vulnerability in a camera as a foothold to infiltrate a building control system, ultimately affecting the stability of the regional power grid. Yet, existing fuzzing research is almost exclusively vertical and isolated. Only a handful of works (e.g., DriveFuzz [50], ScenarioFuzz [74]) attempt system-level testing, but their scope is strictly confined to relatively closed subsystems like autonomous driving and heavily reliant on specific simulators.
When expanding our view to the entire city, constructing a unified test environment covering subsystems like transportation, energy, and security becomes nearly impossible both technically and financially. More crucially, even with such an environment, we would not know what to test. Because system-level vulnerabilities do not manifest as a concrete buffer overflow but may be service cascading failures triggered by a series of seemingly compliant operations under specific timing and states. Current tools lack an understanding of city-level business semantics (e.g., ensure main artery traffic efficiency, maintain hospital power supply) and cannot automatically construct complex test scenarios aimed at disrupting these high-level objectives.
This requires future research to shift direction from vulnerability mining efficiency to business impact coverage, and to explore scenario-based, goal-driven system resilience testing methods leveraging digital twins and attack graph modeling.

4.3.2. Misalignment Between Technical and Business-Risk Metrics

The academic community typically justify the superiority of a fuzzing technique by the number of CVEs discovered, code coverage, or unique crash signatures. However, for a city operations center, the risk level between a vulnerability causing a smart streetlight controller to reboot and one capable of tampering with traffic signal timing plans or paralyzing a water plant’s chlorination system is worlds apart. The former may cause only local inconvenience, while the latter directly threatens public safety and social stability. The bias in vulnerability types shown in Figure 6 of Section 3 is a direct manifestation of this evaluation misalignment. Existing techniques and evaluation metrics are incapable of quantifying this difference: they remain at the level of technical severity and cannot assess business impact. This barrier results in the outputs of many academically efficient tools being difficult for practical city security teams to prioritize, digest, and apply, undermining the technology’s practical value. Future research must drive a transformation in the evaluation system, introducing metrics directly related to urban resilience, such as service downtime, public safety impact scope, societal recovery cost, etc., and explore methods to map technical vulnerabilities to these business risk indicators.
It must be noted that collecting resilience-oriented metrics face two challenges. First, some resilience-oriented metrics are difficult to measure with existing tools or monitoring infrastructure, e.g., the impacted population of a faulty water pollution sensor. Second, in smart cities, destructive testing, i.e., triggering a real failure on purpose, is not possible for social and economic reasons.
Besides the path of developing a tool that can reduce both the technical complexity as well as the social/economic costs, we propose an actionable guidelines summarized in Table 11 to advance the practical quantification of resilience-oriented metrics:
  • Build prediction models to map tests to business KPIs: e.g., link “signal light fault” to “intersection throughput reduction”.
  • Integrate with digital twin simulators: Use platforms like SUMO (traffic) or GridLAB-D (grid) to assess system-wide impact and to simulate “destructive testing” without introducing failure to the physical world.
  • Develop fuzzer plugins: Extend tools (e.g., AFL) to generate a resilience risk score alongside crash reports.
This framework aims to provide an actionable starting point for future research, rather than a final solution. Its effectiveness can be gradually improved through case studies.

4.3.3. The Automation Dilemma: From Expert-Driven to Autonomous

Although applying AI/ML (especially large language models) to fuzzing has become a frontier trend, showing potential in areas like protocol understanding, it has not fundamentally resolved the automation dilemma. Currently, every step of the process—from identifying the test target, extracting protocol specifications, modeling device states, to configuring the test environment—heavily relies on manual intervention and domain knowledge input from security experts. The introduction of LLMs might automate the task of reading protocol documentation, but how to enable a machine to automatically understand a brand new, proprietary urban sensor network protocol and build an effective test model for it remains an open problem. True automation would mean a fuzzing system could act like an autonomous agent, actively exploring an unknown smart city IoT environment, learning its interaction interfaces and behavioral models, and autonomously formulating testing strategies. This is far beyond the capabilities of the current paradigm based on fixed seeds and mutation strategies. Future opportunities lie in developing meta-learning and autonomous exploration capabilities, enabling fuzzing tools to adapt to unknown targets and dynamically optimize strategies during testing using reinforcement learning.

4.4. Section Summary

In this section, we discuss gaps regarding devices, protocols, and methodologies not addressed in Section 3.6. Based on this analysis, we establish a four-quadrant model and a protocol framework grounded in protocol layers and states. This enables device testing capabilities to migrate toward the blank quadrant, while protocol testing capabilities can rapidly shift toward emerging protocols and those lacking research. Additionally, to advance the implementation of resilience metrics, we propose a preliminary quantitative framework.
These gaps and directions collectively outline a challenging yet promising research landscape for fuzz testing in the IoT domain within smart cities. Bridging these gaps requires repositioning fuzz testing as part of a security assessment infrastructure serving the city’s overall resilience, thereby truly advancing urban security.

5. Conclusions

This study reviews and analyzes representative literature by constructing an eight-dimensional analytical framework. It reveals a significant mismatch between current IoT fuzzing research and the security needs of smart cities: existing work primarily focuses on improving the efficiency of vulnerability discovery in individual components, whereas smart city security fundamentally requires the assessment of resilience in complex, dynamic systems. This mismatch leads to a threefold structural imbalance in research focus, technical paradigms, and evaluation methods: resources are heavily skewed toward easily testable devices and protocols; technical capabilities tend to favor the detection of low-order vulnerabilities such as memory safety flaws and DoS; and the reliance on small-scale simulation in experimental design severely undermines the validity of research findings in real-world urban environments.
To bridge this gap, this study proposes three structured research directions based on the gap analysis results, offering guidance for future work:
  • Device testing orientation: A four-quadrant classification model based on device observability and business logic complexity is proposed. It serves as a navigation map for migrating testing capabilities across devices, encouraging research to shift from the currently concentrated observable–simple logic devices toward high-risk areas such as unobservable devices and complex systems.
  • Protocol testing orientation: A feature-matching-based technology migration path is introduced. It provides a reference for the rapid and targeted transfer of testing methods from mature protocols to emerging ones, etc, thereby addressing the rapid evolution of the smart city protocol ecosystem.
  • Business-oriented assessment system: A shift in evaluation criteria is advocated—from technical metrics such as code coverage and crash counts to business-risk indicators like service downtime and public safety impact scope. Integrated assessment methods combining digital twins and autonomous exploratory agents are also encouraged.
It should be noted that these analyses and proposed directions are derived from a synthesis of existing academic literature. They inherently carry laboratory-oriented limitations and have not yet been empirically validated in real-world, large-scale smart city scenarios. Therefore, the main contribution of this paper lies in providing the field with a structured diagnosis of the current state and a clear evolutionary direction, rather than a fully validated solution framework. Future work should advance the field in a more practical and systematic manner through case studies and tool development in real urban environments.

Author Contributions

Conceptualization, K.G.; Methodology, Q.L.; Validation, K.G.; Investigation, Q.L.; Writing—original draft, Q.L.; writing—review and editing, K.G.; visualization, Q.L.; Funding acquisition, K.G. All authors have read and agreed to the published version of the manuscript.

Funding

This research received no external funding.

Data Availability Statement

Data are contained within the article.

Conflicts of Interest

The authors declare no conflicts of interest.

Abbreviations

The following abbreviations are used in this manuscript:
6LoWPANIPv6 over Low-Power Wireless Personal Area Networks
AIArtificial Intelligence
APIApplication Programming Interface
ARMAdvanced RISC Machine
BLEBluetooth Low Energy
C/SClient/Server
CGCoverage-Guided (Fuzzing Technique)
CoAPConstrained Application Protocol
CPSSCyber–Physical-Social System
CSAConnectivity Standards Alliance
CVECommon Vulnerabilities and Exposures
CVSSCommon Vulnerability Scoring System
DDoSDistributed Denial of Service
DMADirect Memory Access
DNP3Distributed Network Protocol
DSEDynamic Symbolic Execution (Fuzzing Technique)
DTADynamic Taint Analysis (Fuzzing Technique)
E2EEnd-to-End
GAGenetic Algorithm (Fuzzing Technique)
GB/TGuo Biao/Tuijian (Chinese National Standard/Recommended Standard)
GPSGlobal Positioning System
GRGrammar-based (Fuzzing Technique)
HILHardware-in-the-Loop
HTTPHypertext Transfer Protocol
HTTPSHypertext Transfer Protocol Secure
IECInternational Electrotechnical Commission
ICSIndustrial Control Systems
IIoTIndustrial Internet of Things
IoTInternet of Things
ITUInternational Telecommunication Union
JTAGJoint Test Action Group
JSONJavaScript Object Notation
LANLocal Area Network
LLMLarge Language Model (Fuzzing Technique)
LLNLow-Power and Lossy Network
LoRaLong Range
LoRaWANLong Range Wide Area Network
LPWANLow-Power Wide-Area Network
MCUMicrocontroller Unit
MIPSMicroprocessor without Interlocked Pipeline Stages
MLMachine Learning (Fuzzing Technique)
MQTTMessage Queuing Telemetry Transport
NATNetwork Address Translation
NB-IoTNarrow Band Internet of Things
ONVIFOpen Network Video Interface Forum
OPC UAOPC Unified Architecture
OSOperating System
PANPersonal Area Network
PLCProgrammable Logic Controller
ProtobufProtocol Buffers
Pub/SubPublish/Subscribe
QEMUQuick Emulator
Req/ResRequest/Response
RFIDRadio Frequency Identification
RISC-VReduced Instruction Set Computer-V
RMRandom Mutation (Fuzzing Technique)
RTLRegister Transfer Level
RTOSReal-Time Operating System
RTURemote Terminal Unit
SAScheduling Algorithm (Fuzzing Technique)
SCADASupervisory Control and Data Acquisition
SIPSession Initiation Protocol
SISSafety Instrumented System
SLRSystematic Literature Review
SMISystem Management Interrupt
SOAPSimple Object Access Protocol
SoCSystem on Chip
STStructured Text
STAStatic Analysis (Fuzzing Technique)
TCP/IPTransmission Control Protocol/Internet Protocol
TLSTransport Layer Security
UEFIUnified Extensible Firmware Interface
USBUniversal Serial Bus
USBPDUSB Power Delivery
VPNVirtual Private Network
WiMAXWorldwide Interoperability for Microwave Access
WLANWireless Local Area Network
XMLExtensible Markup Language
XDLMSExtended Device Language Message Specification

References

  1. IDC. IDC FutureScape: Worldwide Connected Devices 2025 Predictions; Market Forecast Report; International Data Corporation: Needham, MA, USA, 2024. [Google Scholar]
  2. Langner, R. Stuxnet: Dissecting a Cyberwarfare Weapon. IEEE Secur. Priv. 2011, 9, 49–51. [Google Scholar] [CrossRef] [Scilit]
  3. Johnson, B.; Caban, D.; Krotofil, M.; Scali, D.; Brubaker, N.; Glyer, C. Attackers Deploy New ICS Attack Framework “TRITON” and Cause Operational Disruption to Critical Infrastructure. Available online: https://www.fireeye.com/blog/threat-research/2017/12/attackers-deploy-new-ics-attack-framework-triton.html (accessed on 19 January 2026).
  4. Research, J. Ripple20: Critical Vulnerabilities in TCP/IP Stacks Affecting Millions of Devices; Technical Report; JSOF (Israeli Cyber Security Firm): Jerusalem, Israel, 2020. [Google Scholar]
  5. Manès, V.J.; Han, H.; Han, C.; Cha, S.K.; Egele, M.; Schwartz, E.J.; Woo, M. The Art, Science, and Engineering of Fuzzing: A Survey. IEEE Trans. Softw. Eng. 2021, 47, 2312–2331. [Google Scholar] [CrossRef] [Scilit]
  6. Muench, M.; Stijohann, J.; Kargl, F.; Francillon, A.; Balzarotti, D. What You Corrupt Is Not What You Crash: Challenges in Fuzzing Embedded Devices. In Proceedings of the 25th Annual Network and Distributed System Security Symposium, NDSS 2018, San Diego, CA, USA, 18–21 February 2018; The Internet Society: Fredericksburg, VA, USA, 2018. [Google Scholar]
  7. Aldysty, A.R.; Moustafa, N.; Lakshika, E. A Holistic Review of Fuzzing for Vulnerability Assessment in Industrial Network Protocols. IEEE Open J. Commun. Soc. 2025, 6, 4437–4461. [Google Scholar] [CrossRef] [Scilit]
  8. ITU-T. Y.2060; Overview of the Internet of Things. Recommendation ITU-T Y.2060; International Telecommunication Union: Geneva, Switzerland, 2014.
  9. ISO 37120:2018; ISO 37120: Sustainable Development of Communities—Indicators for City Services and Quality of Life, 2nd ed. International Organization for Standardization: Geneva, Switzerland, 2018.
  10. Al-Fuqaha, A.; Guizani, M.; Mohammadi, M.; Aledhari, M.; Ayyash, M. Internet of Things: A Survey on Enabling Technologies, Protocols, and Applications. IEEE Commun. Surv. Tutor. 2015, 17, 2347–2376. [Google Scholar] [CrossRef] [Scilit]
  11. Ray, P. A survey on Internet of Things architectures. J. King Saud Univ. Comput. Inf. Sci. 2018, 30, 291–319. [Google Scholar] [CrossRef] [Scilit]
  12. Zhong, C.L.; Zhu, Z.; Huang, R.G. Study on the IoT Architecture and Gateway Technology. In Proceedings of the 2015 14th International Symposium on Distributed Computing and Applications for Business Engineering and Science (DCABES), Guiyang, China, 18–24 August 2015; pp. 196–199. [Google Scholar] [CrossRef] [Scilit]
  13. Steed, A.; Oliveira, M.F. Chapter 6—Sockets and middleware. In Networked Graphics: Building Networked Games and Virtual Environments; Steed, A., Oliveira, M.F., Eds.; Morgan Kaufmann: Burlington, MA, USA, 2010; pp. 195–216. [Google Scholar] [CrossRef] [Scilit]
  14. Gubbi, J.; Buyya, R.; Marusic, S.; Palaniswami, M. Internet of Things (IoT): A vision, architectural elements, and future directions. Future Gener. Comput. Syst. 2013, 29, 1645–1660. [Google Scholar] [CrossRef] [Scilit]
  15. El Jaouhari, S.; Bouvet, E. Secure firmware Over-The-Air updates for IoT: Survey, challenges, and discussions. Internet Things 2022, 18, 100508. [Google Scholar] [CrossRef] [Scilit]
  16. Hazra, A.; Adhikari, M.; Amgoth, T.; Srirama, S.N. A Comprehensive Survey on Interoperability for IIoT: Taxonomy, Standards, and Future Directions. ACM Comput. Surv. 2021, 55, 1–35. [Google Scholar] [CrossRef] [Scilit]
  17. Labs, F.V. The Riskiest Connected Devices of 2025; Technical Report; Forescout Technologies, Inc.: San Jose, CA, USA, 2025. [Google Scholar]
  18. Jabiyev, B.; Sprecher, S.; Gavazzi, A.; Innocenti, T.; Onarlioglu, K.; Kirda, E. FRAMESHIFTER: Security Implications of HTTP/2-to-HTTP/1 Conversion Anomalies. In Proceedings of the 31st USENIX Security Symposium (USENIX Security 22), Boston, MA, USA, 10–12 August 2022; pp. 1061–1075. [Google Scholar]
  19. Novo, O. Blockchain meets IoT: An architecture for scalable access management in IoT. IEEE Internet Things J. 2018, 5, 1184–1195. [Google Scholar] [CrossRef] [Scilit]
  20. Paganini, A. Israeli Road Control System Hacked, Caused Traffic Jam on Haifa Highway. Hacker News, 15 August 2013.
  21. Anand, P. The ‘Mind-Boggling’ Risks Your City Faces from Cyber Attackers. Market Watch, 14 March 2016.
  22. Prince, B. Almost 70 Percent of Critical Infrastructure Companies Breached in Last 12 Months: Survey. Security Week, 11 November 2014.
  23. Nanni, G. Transformational “Smart Cities”: Cyber Security and Resilience; Technical Report; Symantec: Mountain View, CA, USA, 2013. [Google Scholar]
  24. Ghena, B.; Beyer, W.; Hillaker, A.; Pevarnek, J.; Halderman, J.A. Green Lights Forever: Analyzing the Security of Traffic Infrastructure. In Proceedings of the 8th USENIX Workshop on Offensive Technologies (WOOT 2014), San Diego, CA, USA, 19 August 2014; USENIX Association: Berkeley, CA, USA, 2014. [Google Scholar]
  25. Cerrudo, C. Hacking US (and UK, Australia, France, etc.) Traffic Control Systems; IOActive Blog: Seattle, WA, USA, 2014. [Google Scholar]
  26. Zetter, K. Inside the Cunning, Unprecedented Hack of Ukraine’s Power Grid. Wired News, 4 March 2016.
  27. Antonakakis, M.; April, T.; Bailey, M.; Bernhard, M.; Bursztein, E.; Cochran, J.; Durumeric, Z.; Halderman, J.A.; Invernizzi, L.; Kallitsis, M.; et al. Understanding the Mirai Botnet. In Proceedings of the 26th USENIX Security Symposium (USENIX Security 17), Vancouver, BC, Canada, 16–18 August 2017; pp. 1093–1110. [Google Scholar]
  28. BBC News. Hacker Tries to Poison Water Supply of Florida City. BBC News, 9 February 2021.
  29. U.S. Cybersecurity and Infrastructure Security Agency (CISA); Federal Bureau of Investigation (FBI). Cybersecurity Alert: DarkSide Ransomware Attack on Colonial Pipeline; Technical Report; US Department of Homeland Security: Washington, DC, USA, 2021.
  30. Riess-Marchive, V. Olsztyn, Pologne: Quand Une Cyberattaque Fait déRailler la Smart City. LeMagIT, 28 June 2023.
  31. Liang, H.; Pei, X.; Jia, X.; Shen, W.; Zhang, J. Fuzzing: State of the Art. IEEE Trans. Reliab. 2018, 67, 1199–1218. [Google Scholar] [CrossRef] [Scilit]
  32. Böhme, M.; Pham, V.T.; Roychoudhury, A. Coverage-based Greybox Fuzzing as Markov Chain. In Proceedings of the 2016 ACM SIGSAC Conference on Computer and Communications Security, New York, NY, USA, 24–28 October 2016; CCS ’16, pp. 1032–1043. [Google Scholar] [CrossRef] [Scilit]
  33. Sutton, M.; Greene, A.; Amini, P. Fuzzing: Brute Force Vulnerability Discovery; Addison-Wesley Professional: Lebanon, IN, USA, 2007. [Google Scholar]
  34. Schwartz, E.J.; Avgerinos, T.; Brumley, D. All You Ever Wanted to Know about Dynamic Taint Analysis and Forward Symbolic Execution (but Might Have Been Afraid to Ask). In Proceedings of the 2010 IEEE Symposium on Security and Privacy, Berkeley/Oakland, CA, USA, 16–19 May 2010; pp. 317–331. [Google Scholar] [CrossRef] [Scilit]
  35. Eceiza, M.; Flores, J.L.; Iturbe, M. Fuzzing the Internet of Things: A Review on the Techniques and Challenges for Efficient Vulnerability Discovery in Embedded Systems. IEEE Internet Things J. 2021, 8, 10390–10411. [Google Scholar] [CrossRef] [Scilit]
  36. Yun, J.; Rustamov, F.; Kim, J.; Shin, Y. Fuzzing of Embedded Systems: A Survey. ACM Comput. Surv. 2022, 55, 1–33. [Google Scholar] [CrossRef] [Scilit]
  37. Mallissery, S.; Wu, Y.S. Demystify the Fuzzing Methods: A Comprehensive Survey. ACM Comput. Surv. 2023, 56, 137. [Google Scholar] [CrossRef] [Scilit]
  38. Touqir, A.; Iradat, F.; Iqbal, W.; Rakib, A.; Taskin, N.; Jadidbonab, H.; Haas, O. Systematic exploration of fuzzing in IoT: Techniques, vulnerabilities, and open challenges. J. Supercomput. 2025, 81, 877. [Google Scholar] [CrossRef] [Scilit]
  39. Zhou, W.; Shen, S.; Liu, P. IoT Firmware Emulation and Its Security Application in Fuzzing: A Critical Revisit. Future Internet 2025, 17, 19. [Google Scholar] [CrossRef] [Scilit]
  40. Asmita, A.; Tsang, R.; Ghimire, S.; Salehi, S.; Homayoun, H. Bare-Metal Firmware Fuzzing: A Survey of Techniques and Approaches. IEEE Access 2025, 13, 98253–98277. [Google Scholar] [CrossRef] [Scilit]
  41. Redini, N.; Continella, A.; Das, D.; De Pasquale, G.; Spahn, N.; Machiry, A.; Bianchi, A.; Kruegel, C.; Vigna, G. Diane: Identifying Fuzzing Triggers in Apps to Generate Under-constrained Inputs for IoT Devices. In Proceedings of the 2021 IEEE Symposium on Security and Privacy (SP), San Francisco, CA, USA, 24–27 May 2021; pp. 484–500. [Google Scholar] [CrossRef] [Scilit]
  42. Mera, A.; Feng, B.; Lu, L.; Kirda, E. DICE: Automatic Emulation of DMA Input Channels for Dynamic Firmware Analysis. In Proceedings of the 2021 IEEE Symposium on Security and Privacy (SP), San Francisco, CA, USA, 24–27 May 2021; pp. 1938–1954. [Google Scholar] [CrossRef] [Scilit]
  43. Feng, X.; Sun, R.; Zhu, X.; Xue, M.; Wen, S.; Liu, D.; Nepal, S.; Xiang, Y. Snipuzz: Black-box Fuzzing of IoT Firmware via Message Snippet Inference. In Proceedings of the 2021 ACM SIGSAC Conference on Computer and Communications Security, New York, NY, USA, 15–19 November 2021; CCS ’21, pp. 337–350. [Google Scholar] [CrossRef] [Scilit]
  44. Kim, J.; Yu, J.; Kim, H.; Rustamov, F.; Yun, J. FIRM-COV: High-Coverage Greybox Fuzzing for IoT Firmware via Optimized Process Emulation. IEEE Access 2021, 9, 101627–101642. [Google Scholar] [CrossRef] [Scilit]
  45. Kim, H.; Ozmen, M.O.; Bianchi, A.; Celik, Z.B.; Xu, D. PGFUZZ: Policy-Guided Fuzzing for Robotic Vehicles. In Proceedings of the 2021 Network and Distributed System Security Symposium, San Diego, CA, USA, 24 February 2021. [Google Scholar]
  46. Shu, Z.; Yan, G. IoTInfer: Automated Blackbox Fuzz Testing of IoT Network Protocols Guided by Finite State Machine Inference. IEEE Internet Things J. 2022, 9, 22737–22751. [Google Scholar] [CrossRef] [Scilit]
  47. Garbelini, M.E.; Wang, C.; Chattopadhyay, S. Greyhound: Directed Greybox Wi-Fi Fuzzing. IEEE Trans. Dependable Secur. Comput. 2022, 19, 817–834. [Google Scholar] [CrossRef] [Scilit]
  48. Yu, Z.; Wang, H.; Wang, D.; Li, Z.; Song, H. CGFuzzer: A Fuzzing Approach Based on Coverage-Guided Generative Adversarial Networks for Industrial IoT Protocols. IEEE Internet Things J. 2022, 9, 21607–21619. [Google Scholar] [CrossRef] [Scilit]
  49. Kim, K.; Kim, T.; Warraich, E.; Lee, B.; Butler, K.R.B.; Bianchi, A.; Jing Tian, D. FuzzUSB: Hybrid Stateful Fuzzing of USB Gadget Stacks. In Proceedings of the 2022 IEEE Symposium on Security and Privacy (SP), San Francisco, CA, USA, 22–26 May 2022; pp. 2212–2229. [Google Scholar] [CrossRef] [Scilit]
  50. Kim, S.; Liu, M.; Rhee, J.J.; Jeon, Y.; Kwon, Y.; Kim, C.H. DriveFuzz: Discovering Autonomous Driving Bugs through Driving Quality-Guided Fuzzing. In Proceedings of the 2022 ACM SIGSAC Conference on Computer and Communications Security, New York, NY, USA, 7–11 November 2022; CCS ’22, pp. 1753–1767. [Google Scholar] [CrossRef] [Scilit]
  51. Scharnowski, T.; Bars, N.; Schloegel, M.; Gustafson, E.; Muench, M.; Vigna, G.; Kruegel, C.; Holz, T.; Abbasi, A. Fuzzware: Using Precise MMIO Modeling for Effective Firmware Fuzzing. In Proceedings of the 31st USENIX Security Symposium (USENIX Security 22), Boston, MA, USA, 10–12 August 2022; pp. 1239–1256. [Google Scholar]
  52. Trippel, T.; Shin, K.G.; Chernyakhovsky, A.; Kelly, G.; Rizzo, D.; Hicks, M. Fuzzing Hardware Like Software. In Proceedings of the 31st USENIX Security Symposium (USENIX Security 22), Boston, MA, USA, 10–12 August 2022; pp. 3237–3254. [Google Scholar]
  53. Salehi, M.; Degani, L.; Roveri, M.; Hughes, D.; Crispo, B. Discovery and Identification of Memory Corruption Vulnerabilities on Bare-Metal Embedded Devices. IEEE Trans. Dependable Secur. Comput. 2023, 20, 1124–1138. [Google Scholar] [CrossRef] [Scilit]
  54. Situ, L.; Zhang, C.; Guan, L.; Zuo, Z.; Wang, L.; Li, X.; Liu, P.; Shi, J. Physical Devices-Agnostic Hybrid Fuzzing of IoT Firmware. IEEE Internet Things J. 2023, 10, 20718–20734. [Google Scholar] [CrossRef] [Scilit]
  55. Qin, S.; Hu, F.; Ma, Z.; Zhao, B.; Yin, T.; Zhang, C. NSFuzz: Towards Efficient and State-Aware Network Service Fuzzing. ACM Trans. Softw. Eng. Methodol. 2023, 32, 160. [Google Scholar] [CrossRef] [Scilit]
  56. Yin, J.; Li, M.; Li, Y.; Yu, Y.; Lin, B.; Zou, Y.; Liu, Y.; Huo, W.; Xue, J. RSFuzzer: Discovering Deep SMI Handler Vulnerabilities in UEFI Firmware with Hybrid Fuzzing. In Proceedings of the 2023 IEEE Symposium on Security and Privacy (SP), San Francisco, CA, USA, 22–25 May 2023; pp. 2155–2169. [Google Scholar] [CrossRef] [Scilit]
  57. Cheng, Y.T.; Cheng, S.M. Firmulti Fuzzer: Discovering Multi-process Vulnerabilities in IoT Devices with Full System Emulation and VMI. In Proceedings of the 5th Workshop on CPS & IoT Security and Privacy, Copenhagen, Denmark, 26 November 2023; CPSIoTSec ’23, pp. 1–9. [Google Scholar] [CrossRef] [Scilit]
  58. Jang, J.; Kang, M.; Song, D. ReUSB: Replay-guided USB driver fuzzing. In Proceedings of the 32nd USENIX Conference on Security Symposium, Anaheim, CA, USA, 9–11 August 2023; SEC ’23. [Google Scholar]
  59. Kim, K.; Kim, S.; Butler, K.R.B.; Bianchi, A.; Kennell, R.; Tian, D.J. Fuzz The Power: Dual-role State Guided Black-box Fuzzing for USB Power Delivery. In Proceedings of the 32nd USENIX Security Symposium (USENIX Security 23), Anaheim, CA, USA, 9–11 August 2023; pp. 5845–5861. [Google Scholar]
  60. Scharnowski, T.; Buchmann, F.; Wörner, S.; Holz, T. A Case Study on Fuzzing Satellite Firmware. In Proceedings of the 1st Workshop on Security of Space and Satellite Systems, SpaceSec 2023, San Diego, CA, USA, 27 Feburary 2023; The Internet Society: Reston, VA, USA, 2023. [Google Scholar] [CrossRef] [Scilit]
  61. Scharnowski, T.; Wörner, S.; Buchmann, F.; Bars, N.; Schloegel, M.; Holz, T. HOEDUR: Embedded firmware fuzzing using multi-stream inputs. In Proceedings of the 32nd USENIX Conference on Security Symposium, Anaheim, CA, USA, 9–11 August 2023; SEC ’23. [Google Scholar]
  62. Seidel, L.; Maier, D.; Muench, M. Forming faster firmware fuzzers. In Proceedings of the 32nd USENIX Conference on Security Symposium, Anaheim, CA, USA, 9–11 August 2023; SEC ’23. [Google Scholar]
  63. Yu, J.; Kim, J.; Yun, Y.; Yun, J. Poster: Combining Fuzzing with Concolic Execution for IoT Firmware Testing. In Proceedings of the 2023 ACM SIGSAC Conference on Computer and Communications Security, Copenhagen, Denmark, 26–30 November 2023; CCS ’23, pp. 3564–3566. [Google Scholar] [CrossRef] [Scilit]
  64. Wang, Q.; Chang, B.; Ji, S.; Tian, Y.; Zhang, X.; Zhao, B.; Pan, G.; Lyu, C.; Payer, M.; Wang, W.; et al. SyzTrust: State-aware Fuzzing on Trusted OS Designed for IoT Devices. In Proceedings of the 2024 IEEE Symposium on Security and Privacy (SP), San Francisco, CA, USA, 20–23 May 2024; pp. 2310–2387. [Google Scholar] [CrossRef] [Scilit]
  65. Wang, J.; Yu, L.; Luo, X. LLMIF: Augmented Large Language Model for Fuzzing IoT Devices. In Proceedings of the 2024 IEEE Symposium on Security and Privacy (SP), San Francisco, CA, USA, 20–23 May 2024; pp. 881–896. [Google Scholar] [CrossRef] [Scilit]
  66. Zhang, Z.; Zou, F.; Hong, J.; Chen, L.; Yi, P. Detection and Analysis of Broken Access Control Vulnerabilities in App–Cloud Interaction in IoT. IEEE Internet Things J. 2024, 11, 28267–28280. [Google Scholar] [CrossRef] [Scilit]
  67. Liu, H.; Gan, S.; Zhang, C.; Gao, Z.; Zhang, H.; Wang, X.; Gao, G. Labrador: Response Guided Directed Fuzzing for Black-box IoT Devices. In Proceedings of the 2024 IEEE Symposium on Security and Privacy (SP), San Francisco, CA, USA, 20–23 May 2024; pp. 1920–1938. [Google Scholar] [CrossRef] [Scilit]
  68. Chen, L.; Wang, Y.; Xiang, X.; Jin, D.; Ren, Y.; Zhang, Y.; Pan, Z.; Chen, Y. TXL-Fuzz: A Long Attention Mechanism-Based Fuzz Testing Model for Industrial IoT Protocols. IEEE Internet Things J. 2024, 11, 38238–38245. [Google Scholar] [CrossRef] [Scilit]
  69. Asmita; Oliinyk, Y.; Scott, M.; Tsang, R.; Fang, C.; Homayoun, H. Fuzzing BusyBox: Leveraging LLM and Crash Reuse for Embedded Bug Unearthing. In Proceedings of the 33rd USENIX Security Symposium (USENIX Security 24), Philadelphia, PA, USA, 14–16 August 2024; pp. 883–900. [Google Scholar]
  70. Chesser, M.; Nepal, S.; Ranasinghe, D.C. MultiFuzz: A Multi-Stream Fuzzer For Testing Monolithic Firmware. In Proceedings of the 33rd USENIX Security Symposium (USENIX Security 24), Philadelphia, PA, USA, 14–16 August 2024; pp. 5359–5376. [Google Scholar]
  71. Liu, K.; Yang, M.; Ling, Z.; Zhang, Y.; Lei, C.; Luo, J.; Fu, X. RIoTFuzzer: Companion App Assisted Remote Fuzzing for Detecting Vulnerabilities in IoT Devices. In Proceedings of the 2024 on ACM SIGSAC Conference on Computer and Communications Security, Salt Lake City, UT, USA, 14–18 October 2024; CCS ’24, pp. 2341–2354. [Google Scholar] [CrossRef] [Scilit]
  72. Mera, A.; Liu, C.; Sun, R.; Kirda, E.; Lu, L. SHiFT: Semi-hosted Fuzz Testing for Embedded Applications. In Proceedings of the 33rd USENIX Security Symposium (USENIX Security 24), Philadelphia, PA, USA, 14–16 August 2024; pp. 5323–5340. [Google Scholar]
  73. Ma, X.; Luo, L.; Zeng, Q. From one thousand pages of specification to unveiling hidden bugs: Large language model assisted fuzzing of matter IoT devices. In Proceedings of the 33rd USENIX Security Symposium (USENIX Security 24), Philadelphia, PA, USA, 14–16 August 2024; SEC ’24. [Google Scholar]
  74. Wang, T.; Gu, T.; Deng, H.; Li, H.; Kuang, X.; Zhao, G. Dance of the ADS: Orchestrating Failures through Historically-Informed Scenario Fuzzing. In Proceedings of the 33rd ACM SIGSOFT International Symposium on Software Testing and Analysis, Vienna, Austria, 16–20 September 2024; ACM: New York, NY, USA, 2024; ISSTA 2024; pp. 1086–1098. [Google Scholar] [CrossRef] [Scilit]
  75. Wang, J.; Wang, Q.; Scharnowski, T.; Shi, L.; Wörner, S.; Holz, T. AidFuzzer: Adaptive Interrupt-Driven Firmware Fuzzing via Run-Time State Recognition. In Proceedings of the USENIX Security Symposium, Seattle, WA, USA, 13–15 August 2025. [Google Scholar]
  76. Song, X.; Wu, J.; Zeng, Y.; Pan, H.; Zuo, C.; Zhao, Q.; Guo, S. MBFuzzer: A multi-party protocol fuzzer for MQTT brokers. In Proceedings of the 34th USENIX Conference on Security Symposium, Seattle, WA, USA, 13–15 August 2025; SEC ’25. [Google Scholar]
  77. Bley, M.; Scharnowski, T.; Wörner, S.; Schloegel, M.; Holz, T. Protocol-Aware Firmware Rehosting for Effective Fuzzing of Embedded Network Stacks. In Proceedings of the 2025 ACM SIGSAC Conference on Computer and Communications Security, Taipei, Taiwan, 13–17 October 2025; ACM: New York, NY, USA, 2025; CCS ’25; pp. 4484–4498. [Google Scholar] [CrossRef] [Scilit]
  78. Huynh, T.N.B.; Xu, T.; Wan, Y.; Dai, J.; Sun, X. Optimizing IoT Cross-rule Vulnerability Detection through Reinforcement Learning-Based Fuzzing. In Proceedings of the 23rd ACM Conference on Embedded Networked Sensor Systems; Association for Computing Machinery: New York, NY, USA, 2025; pp. 594–595. [Google Scholar]
  79. Villa, C.; Doumanidis, C.; Lamri, H.; Rajput, P.H.N.; Maniatakos, M. ICSQuartz: Scan Cycle-Aware and Vendor-Agnostic Fuzzing for Industrial Control Systems. In Proceedings of the 32nd Annual Network and Distributed System Security Symposium, NDSS 2025, San Diego, CA, USA, 24–28 February 2025; The Internet Society: Reston, VA, USA, 2025. [Google Scholar]
  80. Ning, B.; Zong, X.; He, K. MALF: A Multi-Agent LLM Framework for Intelligent Fuzzing of Industrial Control Protocols. arXiv 2025, arXiv:2510.02694. [Google Scholar] [CrossRef] [Scilit]
  81. Xia, Z.; Zeng, Y.; Song, X.; Guo, S.; Wu, T. HSPFuzzer: High-Speed Network Protocol Fuzzing With Connection Reuse. IEEE Internet Things J. 2025, 12, 40779–40792. [Google Scholar] [CrossRef] [Scilit]
  82. Liu, H.; Zheng, L.; Gan, S.; Zhang, C.; Gao, Z.; Zhang, H.; Zeng, Y.; Jiang, Z.; Yang, J. EAGLEYE: Exposing Hidden Web Interfaces in IoT Devices via Routing Analysis. In Proceedings of the 32nd Annual Network and Distributed System Security Symposium, NDSS 2025, San Diego, CA, USA, 24–28 February 2025; The Internet Society: Reston, VA, USA, 2025. [Google Scholar]
  83. Bellard, F. QEMU, a fast and portable dynamic translator. In Proceedings of the Annual Conference on USENIX Annual Technical Conference, Anaheim, CA, USA, 10–15 April 2005; ATEC ’05, p. 41. [Google Scholar]
  84. Chen, I.H.; King, C.T.; Chen, Y.H.; Lu, J.M. Full System Emulation of Embedded Heterogeneous Multicores Based on QEMU. In Proceedings of the 2018 IEEE 24th International Conference on Parallel and Distributed Systems (ICPADS), Sentosa, Singapore, 11–13 December 2018; pp. 771–778. [Google Scholar] [CrossRef] [Scilit]
  85. IEEE Std 802.15.4-2020; IEEE Standard for Low-Rate Wireless Networks. (Revision of IEEE Std 802.15.4-2015). IEEE: Piscataway, NJ, USA, 2020; pp. 1–800. [CrossRef] [Scilit]
  86. Zigbee Alliance. Zigbee Specification; Connectivity Standards Alliance (CSA): Davis, CA, USA, 2021. [Google Scholar]
  87. Bluetooth SIG. Bluetooth Core Specification; Bluetooth Special Interest Group: Kirkland, WA, USA, 2022. [Google Scholar]
  88. LoRa Alliance. LoRaWAN Specification; LoRa Alliance: Fremont, CA, USA, 2020. [Google Scholar]
  89. Hui, J.; Thubert, P. Compression Format for IPv6 Datagrams over IEEE 802.15.4-Based Networks; Technical Report; IETF: Fremont, CA, USA, 2011. [Google Scholar] [CrossRef] [Scilit]
  90. Modbus Organization. Modbus Messaging on TCP/IP Implementation Guide; Modbus Organization: Hopkinton, MA, USA, 2012. [Google Scholar]
  91. OPC Foundation. OPC Unified Architecture; IEC/OPC Foundation: Scottsdale, AZ, USA, 2021. [Google Scholar]
  92. Biondani, F.; Cheng, D.S.; Fummi, F. Adopting OPC UA for Efficient and Secure Firmware Transmission in Industry 4.0 Scenarios. In Proceedings of the 2024 IEEE 33rd International Symposium on Industrial Electronics (ISIE), Ulsan, Republic of Korea, 18–21 June 2024; pp. 1–6. [Google Scholar] [CrossRef] [Scilit]
  93. DLMS User Association. DLMS/COSEM Specification, 2022th ed.; DLMS UA: Steinhausen, Switzerland, 2022. [Google Scholar]
  94. ONVIF. ONVIF Core Specification; ONVIF: San Ramon, CA, USA, 2022. [Google Scholar]
  95. Standardization Administration of China. Technical Requirements for Public Safety Video Surveillance Networking System Information Transmission, Exchange, and Control; SAC: Beijing, China, 2022. [Google Scholar]
  96. OASIS. MQTT, Version 5.0; OASIS: Burlington, MA, USA, 2019. [Google Scholar]
  97. Shelby, Z.; Hartke, K.; Bormann, C. The Constrained Application Protocol (CoAP); Technical Report; IETF: Fremont, CA, USA, 2014. [Google Scholar] [CrossRef] [Scilit]
  98. Fielding, R.; Nottingham, M.; Reschke, J. HTTP Semantics; Technical Report; IETF: Fremont, CA, USA, 2022. [Google Scholar] [CrossRef] [Scilit]
  99. Connectivity Standards Alliance. Matter Specification; CSA: Toronto, ON, Canada, 2022. [Google Scholar]
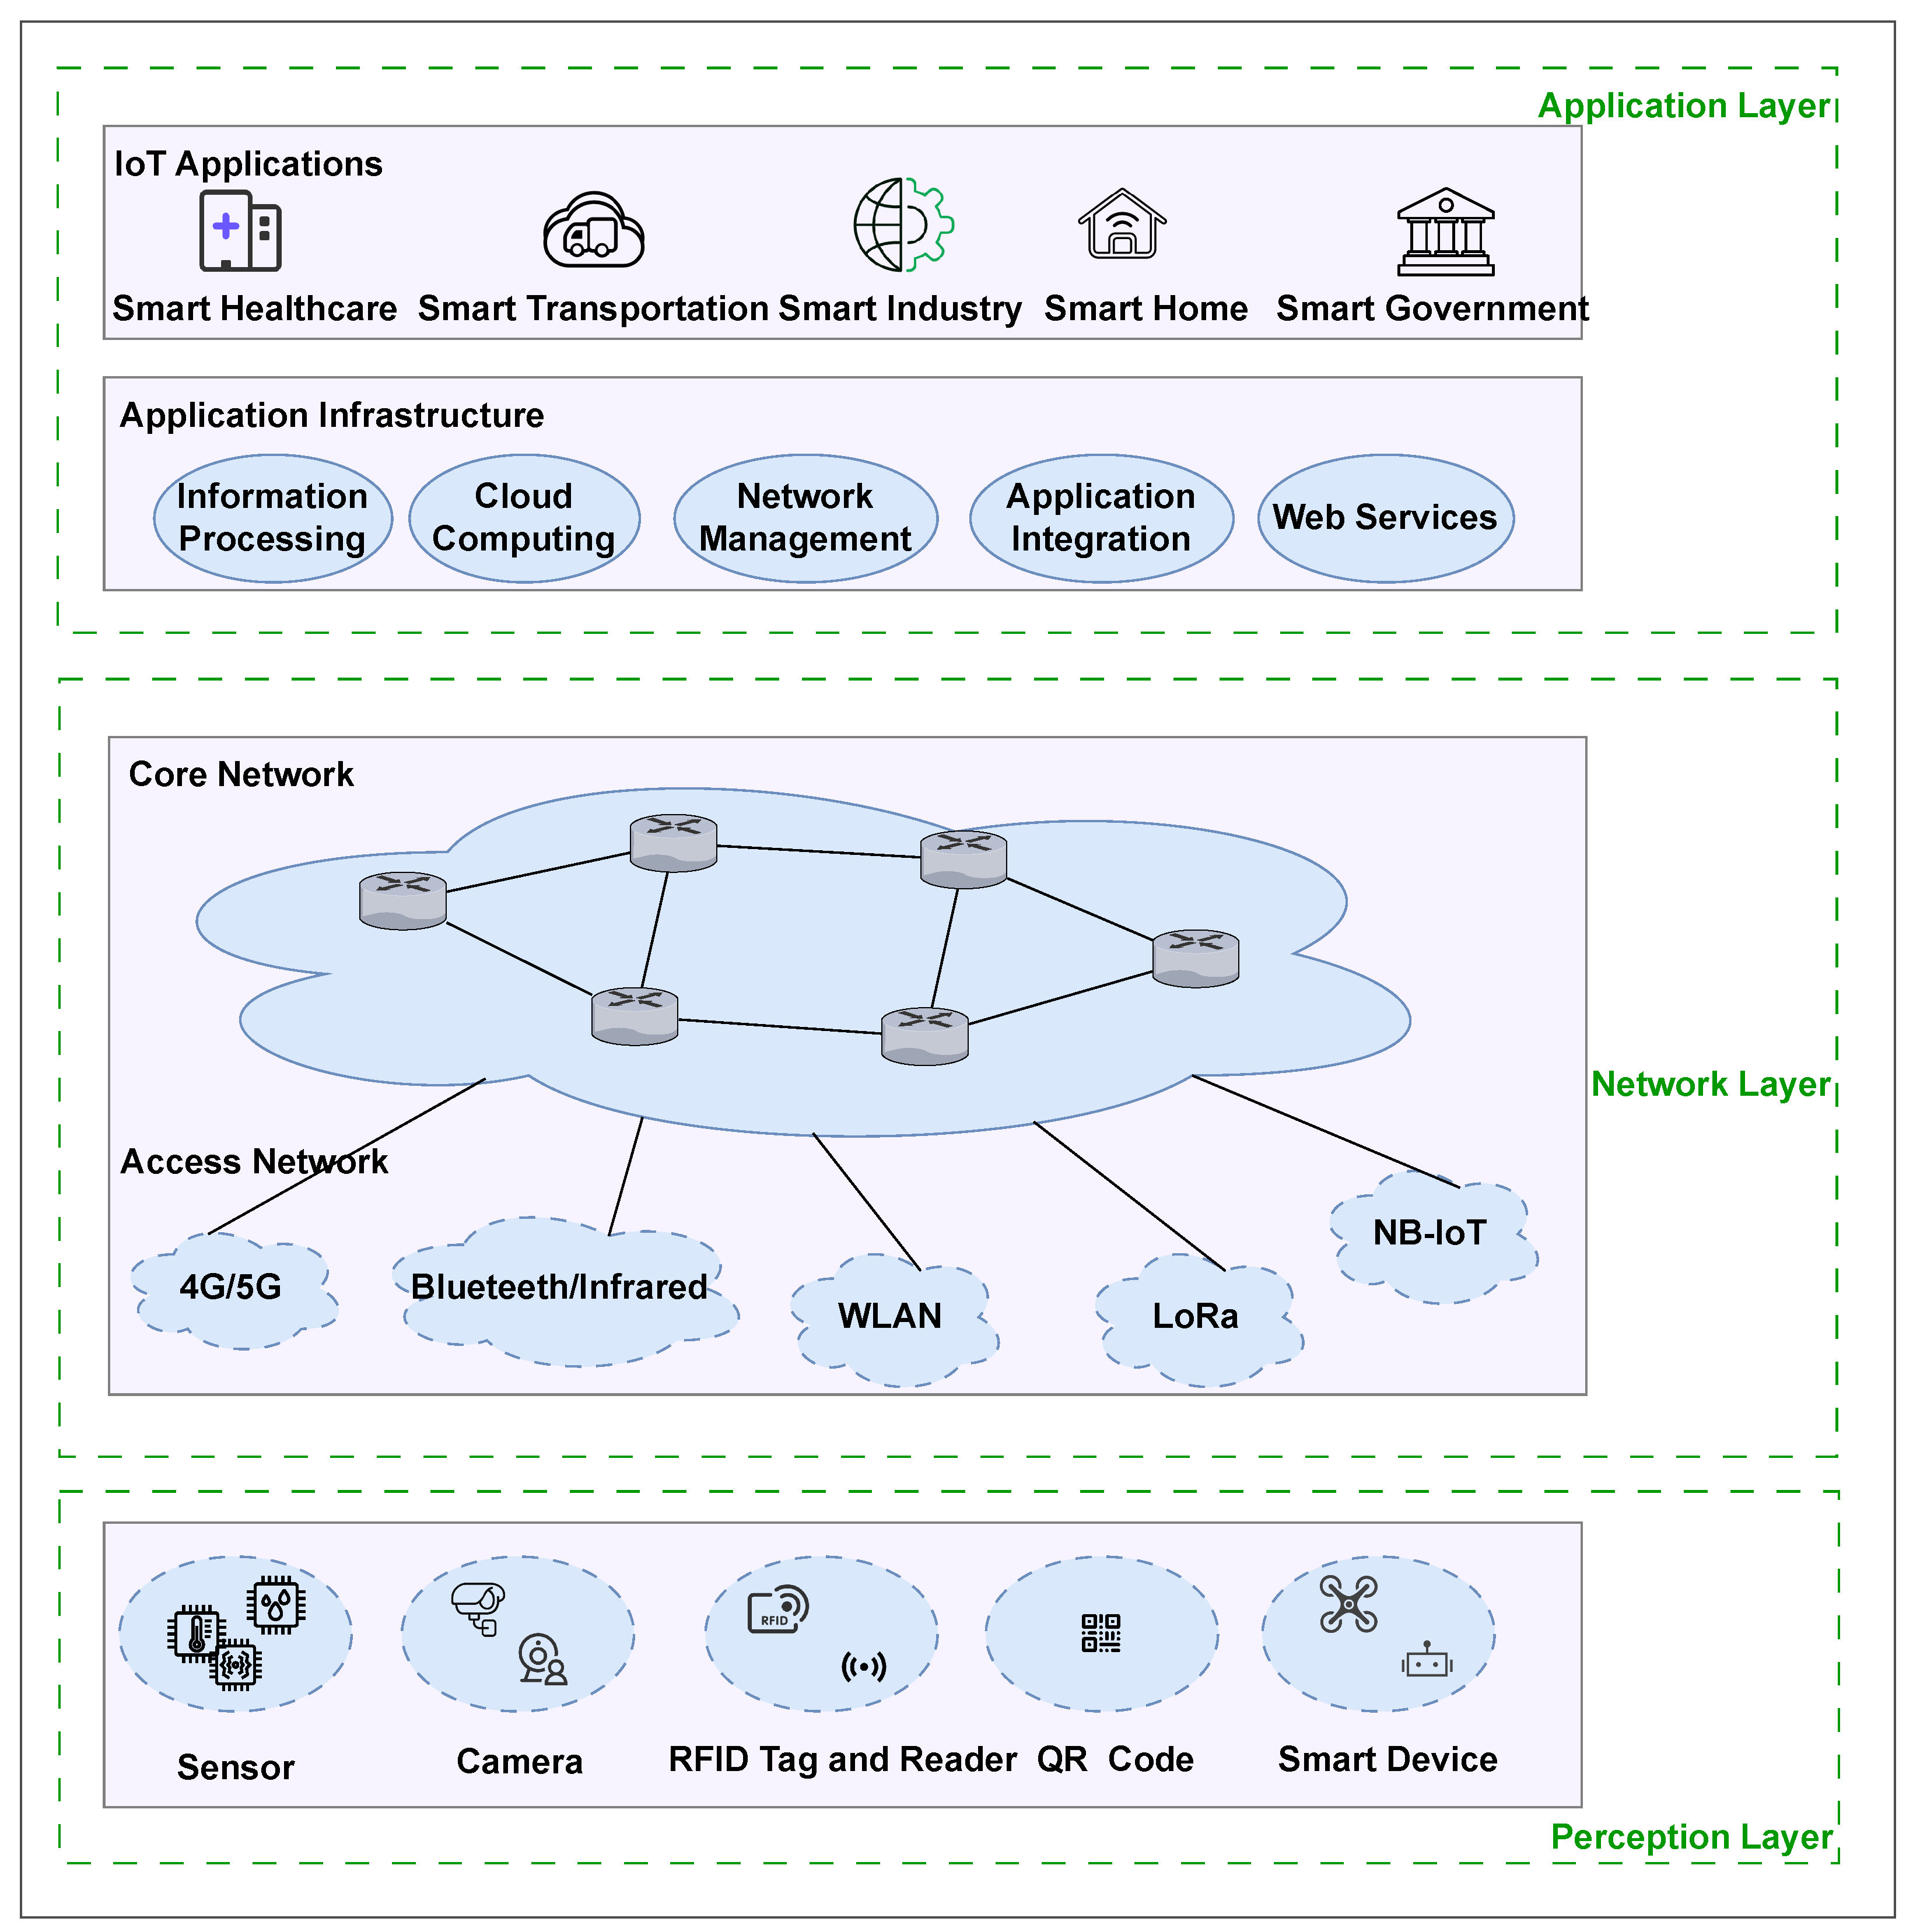
Figure 1. A three-layer IoT system architecture.
Information 17 00218 g001
Figure 2. Basic process of fuzzing.
Information 17 00218 g002
Figure 3. Flowchart of the literature screening and selection process. (n = 42 studies included).
Information 17 00218 g003
Figure 4. Distribution of research focus in IoT fuzzing studies (2011–2025): device vs. protocol vs. system testing. (a) Annual distribution. (b) Cumulative proportion.
Information 17 00218 g004
Figure 5. Distribution of targeted device types(T1/T2/T3) in IoT fuzzing studies (2021–2025). (a) Annual distribution. (b) Cumulative proportion.
Information 17 00218 g005
Figure 6. Annual distribution of vulnerability types discovered by IoT fuzzing studies (2021–2025). (a) Distribution of vulnerability types per year. (b) Cumulative proportion of reported vulnerability types (2021–2025).
Information 17 00218 g006
Figure 7. Adoption frequency of key fuzzing techniques (2011–2025) (Heatmap: rows = years, columns = techniques, colors = frequency).
Information 17 00218 g007
Figure 8. Distribution of vulnerability types discovered by different fuzzing paradigms. The horizontal axis represents the target, the vertical axis represents the technical paradigm, and the color indicates the primary type of vulnerability discovered. The number within each bubble represents the count of studies. For example, a blue bubble labeled “2” indicates that two studies targeting the corresponding horizontal axis category used the vertical axis technical paradigm, with memory safety being the most frequently discovered vulnerability type.
Information 17 00218 g008
Figure 9. Common IoT characteristics considered in the reviewed studies.
Information 17 00218 g009
Figure 10. Categorized distribution of major limitations acknowledged in the reviewed studies.
Information 17 00218 g010
Figure 11. Categorized distribution of future directions acknowledged in the reviewed studies.
Information 17 00218 g011
Figure 12. The Four-Quadrant Risk-Capability Model reveals a mismatch between research effort (concentrated in Q-II) and smart city risk landscape (dispersed in Q-I, III, IV).
Information 17 00218 g012
Table 1. Representative IoT Security Incidents in Smart Cities and Their Threat Categorization.
YearEventAttack VectorImpactThreat Cat.
2013Lodz Tram Hack (Poland) [23]Hacked tram control systemDerailed 4 trams, injuriesC & D
2014US Traffic Light Study [24,25]Wireless protocol vulnsProved mass remote control feasibleP
2015Ukraine Grid Attack [26]Phishing, malware, SCADA vulns~250 k customers lost power for hoursS
2016Mirai Botnet [27]Default/weak IoT credentials>600 k devices infected, major DDoSD
2021Oldsmar Water Attack [28]Outdated OS, insecure remote accessAttempted chemical poisoning (thwarted)D & S
2021Colonial Pipeline [29]Compromised VPN credentialsMajor fuel pipeline shut for a weekS
2023Olsztyn Transit Paralysis (Poland) [30]Ransomware spread from ticketing systemTransit & traffic systems degradedS
Note: Threat Cat. (Threat category abbreviations): D: Inherent Device-layer Vulnerabilities, P: Protocol and Communication Risks, S: System Integration, Supply Chain, and Insider Threats, C: Risk from Deep Coupling of Business and the Physical World.
Table 2. Categorization and characteristics of smart city IoT devices based on OS complexity.
DimensionT1: OS-Less DevicesT2: RTOS-Based DevicesT3: General-Purpose OS Devices
OS ComplexityBare-metal programs/Micro-kernelsReal-Time Operating System (RTOS)Full OS (e.g., Linux), Cloud-native
ExamplesEnvironmental sensors, Smart metersStreetlight/Traffic controllers, Industrial PLCsData center servers, Video analytics units
HardwareHighly constrained (MHz MCU, KB memory)Moderate (MB memory, multi-modal network interfaces)Powerful (general-purpose compute/storage/network)
Power/
Deployment
Battery/Energy harvesting; Outdoor exposureStable power; Semi-controlled environmentMains power; Highly controlled environment (e.g., server room)
Core FunctionSimple sensing & actuationProtocol translation, Edge computing, Local controlCity-level data processing & decision-making
RoleSensory nerve endingsCritical bridge between network and applicationCore brain of city intelligence
Table 3. Comparative Analysis of IoT Fuzzing Surveys (2021–2025): Scope, Focus, and Gap-Analysis Perspective.
Ref.YearScope and ObjectiveGap-Driven
[35]2021Embedded IoT fuzzing techniques & challengesNo
[36]2022Review embedded fuzzing techniques/toolsNo
[37]2023Analysis of fuzzing methods (generation/mutation/evolution) (General software + Embedded/kernel/firmware)No
[38]2025Review IoT fuzzing techniques and identify gaps (Firmware/Protocol)Partial
[39]2025MCU firmware emulation/fuzzing (RTOS/Bare-metal)No
[40]2025Bare-metal firmware fuzzing (Automotive/Medical)No
Table 4. Overview of IoT Fuzzing Tools and Methods (2021–2025).
NameYearObject CategoryObject TypeVul.Tech.ScaleEmu.
123456
Diane [41]2021D (T2,T3)IoT Device Firmware (via Companion Apps)1,5,6,7
DICE [42]2021D (T2)DMA-enabled MCU Firmware1,5,7Y
SNIPUZZ [43]2021D (T2,T3); P (Multiple)Firmware via Network Messages1,5,6
FIRM-COV [44]2021D (T3)Network Programs in Firmware5,6,7 Y
PGFUZZ [45]2021D (T2,T3); SControl Software of Robotic Vehicles2,5,7 Y
IoTInfer [46]2022P (Bluetooth, Telnet)Network Protocols1,5,6,7
Greyhound [47]2022P (Wi-Fi); D (T2,T3)Wi-Fi Client Protocol1,2,5,6
CGFuzzer [48]2022P (DNP3)DNP3 Protocol Stack1,5,6,9 Y
FUZZUSB [49]2022P (USB); D (T3)USB Gadget Stack2,3,5,7
DriveFuzz [50]2022SAutonomous Driving Systems (end-to-end)1,5,6,9 Y
Fuzzware [51]2022D (T1,T2)Monolithic ARM Cortex-M Firmware3,5Y
Trippel et al. [52]2022D (T1,T2)RTL Hardware Designs2,5 Y
Salehi et al. [53]2023D (T1)Bare-metal Firmware Binaries4,7
FirmHybirdFuzzer [54]2023D (T1,T2)MCU Firmware1,3,5,6,8Y
NSFuzz [55]2023P (10 protocols)Stateful Network Services5,6,7
RSFuzzer [56]2023D (T2,T3)SMI Handlers in UEFI Firmware3,4,5,7Y
FirmultiFuzzer [57]2023D (T3)Multi-process Logic in Linux Firmware5 Y
ReUSB [58]2023D (T3); P (Wireless)USB Wireless Drivers in Linux Kernel5,6Y
FUZZPD [59]2023D (T2); P (USBPD)Closed-source USBPD Firmware2,5,6
Scharnowski et al. [60]2023D (T2)Satellite PDHS Firmware5,7 Y
HOEDUR [61]2023D (T1,T2)Diverse Embedded System Firmware1,5,6Y
SAFIREFUZZ [62]2023D (T1,T2)ARM Cortex-M Binary Firmware5,8
FirmColic [63]2023D (T2,T3)Firmware Web App Binaries3,5 Y
SyzTrust [64]2024D (T2)Trusted OSes5,6
LLMIF [65]2024P (Zigbee)Zigbee Protocol2,5,10 Y
BACDetector [66]2024P (App-Cloud)BAC in IoT App-Cloud Interactions1,7
Labrador [67]2024D (T2,T3); P (Web)Web Interface of Enterprise IoT1,7Y
TXL-FUZZ [68]2024P (Modbus/TCP)IIoT Communication Protocols5,9 Y
Asmita et al. [69]2024D (T3)BusyBox Applets5,10Y
MultiFuzz [70]2024D (T1,T2)Monolithic Firmware5,6Y
RIoTFuzzer [71]2024P (Cloud); SCloud-mediated & All-in-one App Ecosystems7,10
SHiFT [72]2024D (T2,T3)MCU Firmware5,7
mGTPFuzz [73]2024P (Matter)Matter IoT Devices2,10
ScenarioFuzz [74]2024S; D(T3)Autonomous Driving Systems (modules)1,6,9 Y
AidFuzzer [75]2025D (T2,T3)ARM Cortex-M Firmware with Interrupt Deps.3,5Y
MBFuzzer [76]2025P (MQTT)MQTT Broker (Server-side)2,5,6,9,10
Pemu [77]2025D (T1,T2); P (Multiple)Embedded Network Stacks within Firmware  ■  □  ■  □  □  ■2,5 Y
Huynh et al. [78]2025STrigger-Action Rules in Smart Homes7,9 Y
ICSQuartz [79]2025D (T2,T3); SIEC 61131-3 ST Programs & ICS Libraries4,5,8,10Y
MALF [80]2025P (3 ICPs)Industrial Control Protocols in PLCs2,6,10 Y
HSPFuzzer [81]2025P (12 protocols)Network Protocol Servers5,6
EAGLEYE [82]2025D (T2,T3)Hidden Web Interfaces in IoT Devices5,7,10
Note: Object Category: D = Device, P = Protocol, S = System; T1 = OS-less Devices, T2 = RTOS-based Devices, T3 = General-Purpose OS Devices. Vul. (Target Vulnerabilities): 1 = Memory Safety, 2 = DoS, 3 = Logic/Specification Violations, 4 = Security Policy Violations, 5 = Resource/Concurrency Issues, 6 = Others. Tech. (Main Technique): 1 = Random Mutating, 2 = Grammar Representation, 3 = Dynamic Symbolic Execution, 4 = Dynamic Taint Analysis, 5 = Coverage Guided, 6 = Scheduling Algorithms, 7 = Static Analysis, 8 = Genetic Algorithm, 9 = Machine Learning, 10 = Large Language Model. Emu.: Y = Emulation is adopted, blank = Emulation is not adopted. Scale (experimental scale): blank = Less than 10, ✓ = 10–20, △ = 20–50, ★ = More than 50.
Table 5. Aggregated fuzzing paradigms and core compositions.
Aggregated ParadigmCore Compositions
TraditionalCoverage-Guided (5) and/or Random Mutation (1) and/or Scheduling Algorithms (6)
Grammar-basedGrammar Representation (2) and/or Static Analysis (7)
Deep AnalysisDynamic Symbolic Execution (3) and/or Dynamic Taint Analysis (4)
AI-drivenMachine Learning (9) and/or Large Language Model (10)
HybridExplicit combination of more than two the above paradigms without a single dominant one
SpecializedGenetic Algorithm (8)
Table 6. Limitations, Objectives, Enablers in Smart City IoT Fuzzing (Literature vs. Ours).
LimitationsObjectivesEnablers
Problem Space• Encryption/Authentication mechanism interference test feedback• Extend target coverage• Improve hardware modeling
• Complex hardware interactions are difficult to model with high fidelity• System-level/scenario testing• Integrate AI/ML technologies
• Low observability of T1 devices (no error logs/debugging interfaces) • Enhance state machine processing
• Integrate formal methods
• Imbalanced device testing coverage (Section 4.1.1)• Fill testing capability gaps across the Four-Quadrant Model (Section 4.1.3)• Cross-quadrant technology migration pathways (Section 4.1.3)
• Lagging protocol support (Section 4.2.1)• Achieve rapid coverage of emerging/vertical protocols (Section 4.2.3)• Protocol (Layer-State) feature-matching pathways (Section 4.2.3)
• The vacuum in system-level testing (Section 4.3.1)• Complete the paradigm shift from vulnerability mining to system resilience probing (Section 4.3.3)• Urban resilience quantification indicator system (Section 4.3.2)
Solution Space• Simulation fidelity is insufficient• Improve automation• Integrate AI/ML technologies
• Poor scalability• Improve coverage/efficiency• Integrate formal methods
• High resource consumption• Improve encryption/security processing• Improve simulation/execution fidelity
• Heavy reliance on manual configuration/modeling • Enhance state machine processing
• Limited support for protocols/devices/architectures
• Fragmentation in T2 device research (Section 4.1.1)• Construct an environment-device joint testing framework (Section 4.1.1)• Integration of HIL simulation and digital twins (Section 4.1.3)
• Absence of the physical deployment context (Section 4.1.1)• Develop protocol semantic-driven testing tools (Section 4.2.1)• LLM-driven domain knowledge extraction (Section 4.2.3)
• Lack of semantic understanding for protocols (Section 4.2.1)• Establish a business risk-oriented evaluation system (Section 4.3.2)• Reinforcement learning-based autonomous exploration test strategies (Section 4.3.3)
• Misalignment between methodological evaluation metrics and business risks (Section 4.3.2)
Note: This table is constructed based on the problem space and solution space derived from the Eight-Dimensional Analysis Framework. Blue text indicates findings from the literature (Self-Reported), while black text represents insights summarized in Section 4 through our in-depth analysis.
Table 7. Observability-Complexity Based IoT Device Classification Model: Categorization and Examples.
QuadrantCategoryCore TraitExample DevicesTesting Challenge
IObservable yet Complex Observable SystemsComplex, multi-component logic with feedback.Traffic control centers, autonomous vehicle fleets.Semantic gap
IIObservable & Simple DevicesModerate logic with clear feedback.IP cameras, smart speakers, Linux gateways.Comfort Zone
IIIUnobservable yet Simple DevicesSimple logic but no runtime feedback.LPWAN sensors, smart meters, bare-metal actuators.Feedback desert
IVUnobservable & Complex DevicesComplex, vertical logic with no feedback.Industrial PLCs, medical controllers, proprietary RTUs.Black Box + Deep Logic
Note: This four-quadrant model is defined based on two dimensions: Device Observability (horizontal axis) and Business Logic Complexity (vertical axis).
Table 8. Technology Migration Roadmap for IoT Device Fuzzing Across the Four Quadrants: Challenges and Implementation Pathways.
TargetCore ChallengeKey Migration DirectionsExemplary WorksExpected Capability Gain
IComplex multi-component logic1. Multi-device state inference
2. Digital twin integration
3. System-level coverage guidance
IoTInfer [46], DriveFuzz [50]From unit to system-level vulnerability discovery
IIILack of runtime feedback1. Multi-modal side-channel detection
2. Energy-aware scheduling
3. Physical behavior verification
SNIPUZZ [43], Pemu [77]From feedback difficulties to indirect detection
IVProprietary logic & closed system1. LLM-driven domain knowledge extraction
2. Automated reverse engineering
3. HIL simulation integration
mGTPFuzz [73], Fuzzware [51]From expert-dependent to automated domain modeling
Note: This migration roadmap addresses the testing capability gaps identified for each quadrant (Q-I, Q-III, Q-IV) in the model presented in Table 7 and Section 4.1.2.
Table 9. Taxonomy of Communication Protocols in Smart City IoT Ecosystems: Layer, State Model, and Security Posture Analysis.
ProtocolLayerE(~)Primary ScenarioStateTypical Security PostureCIM
Zigbee [85,86]P (PAN)2004Wireless PANS-NLink-layer enc.; key mgmt. risksCluster-based E2E
BLE [87]P (PAN)2010Short-Range Comm.S-NPairing flaws; GATT access controlClient/Server; Pub/Sub
LoRaWAN [88]N (LPWA)2015LPWAN AccessS-NE2E enc.; keys at server riskStar; Uplink/Downlink
6LoWPAN [89]N (Adapt.)2007IPv6 AdaptationNoneDepends on upper layersIPv6 Adaptation
Modbus/TCP [90]A (Ctrl)1999Industrial ControlW-TOften plaintext; weak/no authRequest/Response
OPC UA [91,92]A (Interop)2008Industrial Interop.S-SFull spec., often downgradedC/S; Object Model
DLMS/COSEM [93]A (Meter)1990sUtility MeteringS-SMulti-layer model, minimal usedC/S; XDLMS
ONVIF [94]A (Video)2008Video Interop.S-SWS-Security; often simplifiedSOAP/XML Flows
GB/T 28181 [95]A (Video)2011Video NetworkingS-SImplementation-dependentSIP Ext.; Long Flows
MQTT [96]A (Msg)2011MessagingS-STLS optional; simple passwordPublish/Subscribe
CoAP [97]A (Web)2014Web for LLNS-SDTLS optional, often disabledReq/Res; Observe
HTTP/S [98]A (Interface)1990sMgmt. InterfaceNoneOutdated servers; weak TLSRequest/Response
Matter [99]A (X-Eco)2022Cross-Eco. Interop.S-DMandatory cert. auth & E2E enc.Data Model (Clusters)
Note: Column descriptions: Layer follows the three-tier IoT architecture (P: Perception, N: Network, A: Application). State classification (e.g., S-N, S-S) is defined in Section 4.2.2. Primary Scenario lists common use cases. Typical Security Posture reflects common deployment practices, not the specification. Core Interaction Model describes the primary communication pattern. Full expansions of abbreviations are provided in the Abbreviations section. Protocols highlighted in red within the table are those identified as lacking systematic fuzzing support in the reviewed 42 studies.
Table 10. Feature Combination of Target Protocols and Transferable IoT Fuzzing Techniques.
Target Protocol Feature CombinationTypical Protocol ExamplesCore Testing ChallengesTransferable Techniques/Methods (Source Tools)
Application (A) & Strong State-Session (S-S)DLMS/COSEM, GB/T 28181, OPC UA1. Strict multi-step business processes.
2. State validity coupled with industry semantics.
3. Complex proprietary message formats.
State Machine Inference (IoTInfer [46], CGFuzzer [48])
Semantics-Guided Testing (TXL-FUZZ [68])
Application (A) & Strong State-Distributed (S-D) + EncryptionMatter1. Complex data model-based interaction.
2. Mandatory E2E encryption & certificate authentication.
3. High cross-ecosystem interoperability requirements.
LLM-Driven Semantic Modeling (mGTPFuzz [73])
Differential & Conformance Testing (MBFuzzer [76])
Network (N) & Strong State-Network (S-N)LoRaWAN1. Network server-managed state.
2. Network-layer encryption & key management.
3. Extremely resource-constrained end devices.
LLM-Driven Semantic Modeling (mGTPFuzz [73])
Black-box Response-Guided Mutation (SNIPUZZ [43])
Perception (P)/Network (N) & Weak/No State + LightweightPrivate Zigbee Clusters, 6LoWPAN1. Uninstrumentable T1/T2 resource-constrained devices.
2. Non-IP/private binary frame formats.
3. Weak/zero feedback (silent failures).
Black-box Response-Guided Mutation (SNIPUZZ [43])
Generic App-Cloud Interaction ParadigmVendor-Specific Cloud-Control Protocols (HTTPS/WebSocket)1. Encrypted long connections (HTTPS/TLS).
2. Custom  structured  payloads   (JSON/
Protobuf).
3. Closed proprietary protocol interfaces.
Ecosystem Interception & Simulation (BACDetector [66], RIoTFuzzer [71])
Note: This table maps the feature combinations of typical IoT protocols to transferable fuzzing techniques, which to some extent solves the protocol specific testing challenges in IoT fuzzing.
Table 11. Proposed framework for quantifying smart city resilience metrics.
Metric CategoryQuantifiable Sub-MetricsData Source/Simulation Method
Service DisruptionMean Time to Recovery (MTTR), Service Availability %Monitoring Logs, Fault Injection, Digital Twin Simulation
Public Safety ImpactAffected Population/Area, Number of Disrupted Critical Infrastructure NodesGIS Data Overlay, Impact Propagation Models, Domain Expert Assessment
Societal Recovery CostDirect Economic Loss (Repair/Downtime), Indirect Social Cost (Traffic Delay/Healthcare Impact)Historical Incident Database, Economic Models, Multi-agent Simulation
Disclaimer/Publisher’s Note: The statements, opinions and data contained in all publications are solely those of the individual author(s) and contributor(s) and not of MDPI and/or the editor(s). MDPI and/or the editor(s) disclaim responsibility for any injury to people or property resulting from any ideas, methods, instructions or products referred to in the content.