Article

Symptom-Based Lung Cancer Prediction Using Ensemble Learning with Threshold Optimization and Interpretability

by
Yousuf Al Husaini
Faculty of Computer Studies, Arab Open University, Muscat 130, Oman
Information 2026, 17(2), 172; https://doi.org/10.3390/info17020172
Submission received: 5 January 2026 / Revised: 28 January 2026 / Accepted: 30 January 2026 / Published: 9 February 2026
(This article belongs to the Special Issue Artificial Intelligence for Signal, Image and Video Processing)

Abstract

Lung cancer can be discovered at an early stage to enhance patient survival. However, existing screening tools are both resource-intensive and inaccessible in low-resource countries. This paper introduces a machine learning model that uses an ensemble approach to predict lung cancer from a survey-based dataset of individuals based on symptoms. The suggested method leverages imbalanced data by using class-weighted learning and a stratified train-validation-test split to prevent data leakage and optimizing the decision threshold on the validation set to maximize clinical sensitivity. Several ensemble models were tested, and CatBoost achieved the best validation performance. The optimized model reached an accuracy and ROC-AUC of 95.16 and 93.75, respectively, on the held-out test set, with perfect recall and no false negatives. Extensive analyses, including calibration, subgroup analyses, performance analyses, feature importance analyses, and risk-stratification evidence, demonstrate the soundness and readability of the proposed framework. The above findings suggest that symptom-based ensemble learning models may be useful as supplementary measures for the initial risk evaluation and clinical triage of lung cancer.

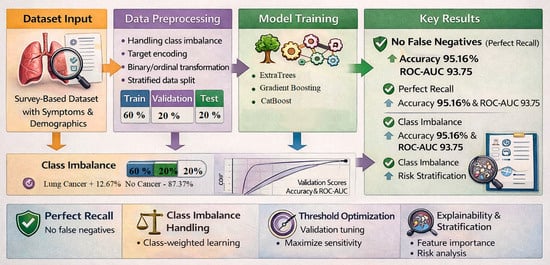
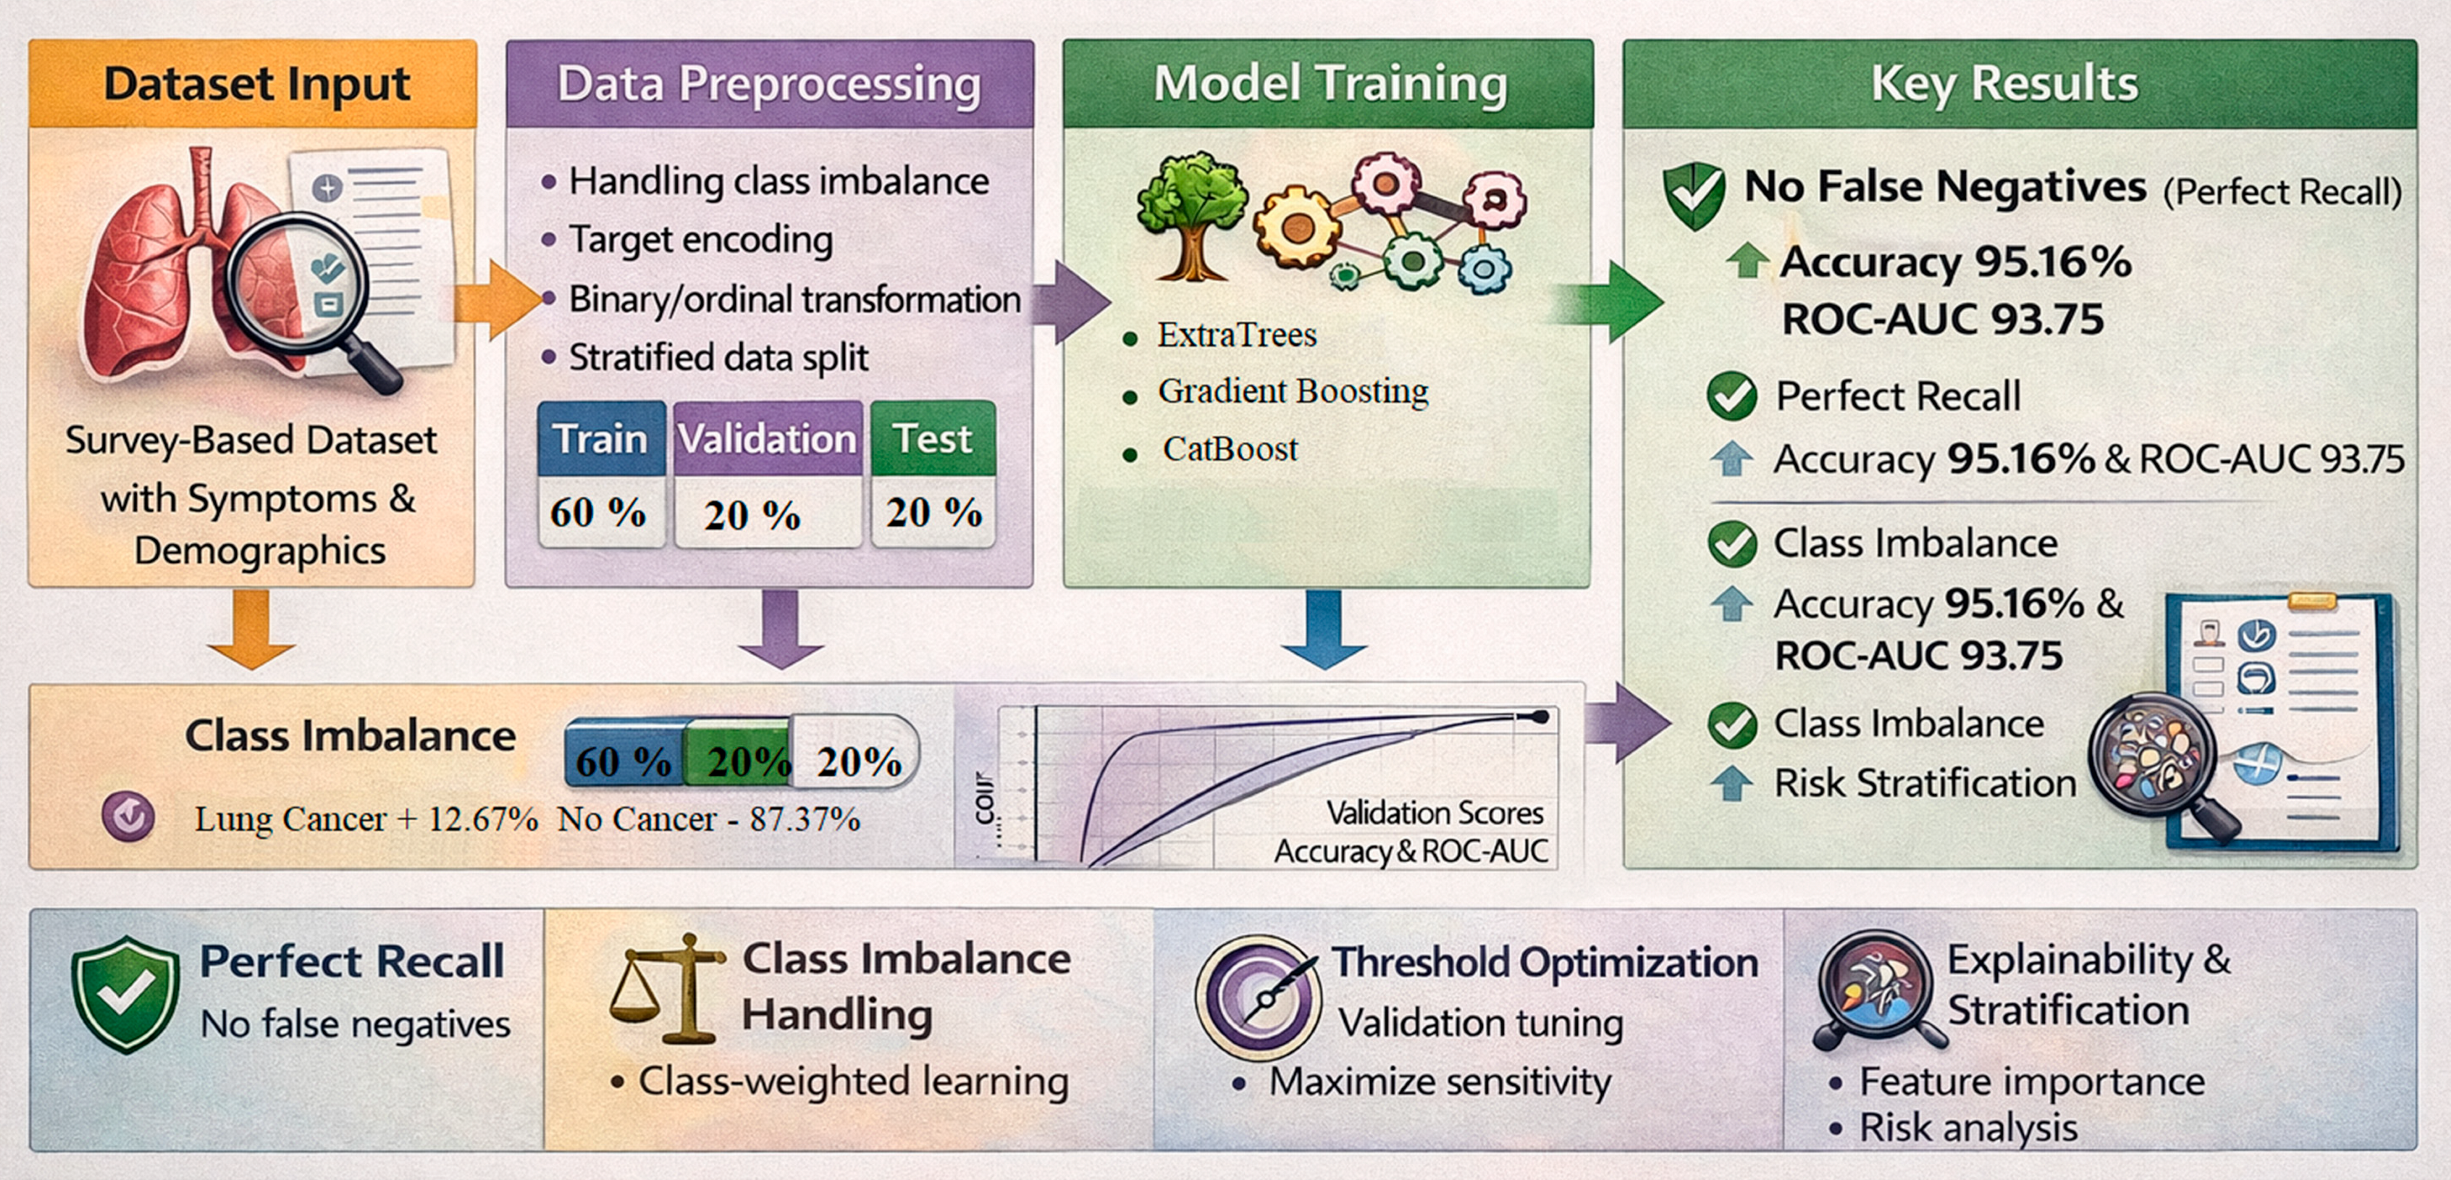
Graphical Abstract

1. Introduction

Lung cancer is one of the deadliest cancers, causing death all over the world and accounting for a significant percentage of cancer deaths annually. Notwithstanding diagnostic imaging and therapeutic methods, the prognosis for patients with lung cancer is still low, as the majority of them are usually diagnosed at advanced stages when the available interventions are insufficient and the chances of survival are considerably lower [1]. This means that early diagnosis is essential for improving patient outcomes and reducing the healthcare burden [2]. Traditional screening methods for lung cancer, including low-dose computerized tomography (LDCT), have proven to help minimize deaths among high-risk groups [3]. Nevertheless, they are resource-demanding, expose patients to repeated radiation, and are not always available in low-resource areas. Moreover, reliance on imaging-only screening could miss early signs of risk or lifestyle factors that occur before radiographic findings of the disease [4]. This has spurred growing concern about emerging non-invasive, data-driven methods that rely on clinical, demographic, and behavioral information. Auto-discovery of nonlinear, high-dimensional data patterns has emerged as a promising field in medical decision support systems based on machine learning (ML) [5]. Regarding lung cancer prediction, prior researchers have evaluated various supervised learning models, including decision trees, support vector machines, ensemble algorithms, and neural networks, using symptom- or lifestyle-based datasets [6,7]. Although such methods have been claimed to achieve positive predictive performance, most studies suffer from methodological weaknesses, including insufficient control of class imbalance, inadequate separation of training and test sets, excessive reliance on accuracy alone, and a lack of threshold optimization or interpretability analysis [8,9]. An essential issue in lung cancer prediction is that clinical datasets tend to be inherently imbalanced, where positive cases of cancer can grossly outnumber negative cases, and vice versa, depending on the criteria used to select the cohort [10]. Models that are not trained with suitable techniques for reducing class imbalance can also yield falsely high accuracy and fail to identify cases belonging to minority classes, which, in clinical settings, are frequently the most urgent [11]. Also, most of the literature uses predetermined decision thresholds (usually 0.5), even though threshold optimization can have a significant effect on clinical utility because it can optimize sensitivity and specificity based on application needs [12]. Recently, various gradient-boosted decision tree models, especially CatBoost, have been shown to perform well on small- to mid-sized tabular data typically found in healthcare applications [13]. These models offer several benefits, including resistance to heterogeneous feature types and overfitting as well as intrinsic mechanisms for handling complex feature interactions. Such models are effectively applicable to predicting cancer risk from symptoms when used alongside principled evaluation protocols, class weight learning, and post-training threshold optimization. Based on these observations, this paper proposes a comprehensive machine learning model for lung cancer prediction using an open-source dataset of symptoms and lifestyle questionnaires.
Although recent developments have led to machine learning-based predictions of lung cancer, methodological shortcomings are evident in portions of the existing literature, including incomplete treatment of class imbalance, inconsistent separation of training and test data, and inadequate attention to decision threshold selection and interpretability.
In contrast to previous research, we focus on stringent data leakage prevention through a stratified train-validation-test split, explicit control of data imbalance with stratified class weighting, optimization of the decision threshold using validation data, and comprehensive performance evaluation on an independent test set. In addition, we enhance predictive evaluation with specific error analysis, calibration assessment, subgroup performance analysis, and model explainability to make it more transparent and clinically relevant. The main objective of the paper is to develop a stable, interpretable machine learning model to predict lung cancer using symptom data from a survey. The specific objectives are (i) to create an imbalance-conscious, leakage-free learning pipeline based on symptom prediction of lung cancer; (ii) to comparatively systematically examine ensemble learning models and choose the most appropriate classifier with the help of validation-based evaluation; (iii) to optimize the decision threshold to improve clinical sensitivity and reduce false-negative predictions; and (iv) to give a detailed analysis of the performance, including calibration, subgroup analysis, explainability, and risk stratification, in an effort to make the models clinically understandable and applicable in practice. This work could contribute predominantly to the following points:
Creation of an effective and scalable machine learning pipeline to model lung cancer based on survey data.
State-of-the-art comparison between ensemble learning models and principled validation-based model selection.
The decision threshold is optimally determined to maximize classification performance on unseen data.
Complete analysis, such as calibration, subgroup analysis, feature ablation, and explainability.
This work will help provide reliable, accessible, and meaningful clinical decision-support tools for the early detection of lung cancer risks. This paper is further divided into the following sections. Section 2 presents a literature review on lung cancer prediction using machine learning. Section 3 presents the data, data manipulation, model building, and evaluation procedures. Section 4 is an analysis of the results and performance of the experiments. Section 5 presents the results and limitations of the study, and the final part of the paper, Section 6, contains a statement on future research.

2. Related Work

Over the last 20 years, research on lung cancer prediction has advanced significantly, shifting the focus from traditional statistical modeling to more sophisticated machine learning and deep learning methods. In this section, previous studies are reviewed under three categories: conventional statistical approaches, machine learning-based prediction models, and the methodological shortcomings that motivated the current research.

2.1. Traditional Statistical Approaches

The initial attempts at risk prediction for lung cancer were primarily based on statistical and epidemiological models, including logistic regression, Cox proportional hazards models, and a rule-based risk scoring system [14,15]. These strategies generally used demographic variables (e.g., age and gender), smoking history, and occupational exposure variables as measures of cancer risk. Although these models were easy to implement and known to be interpretable, their predictive ability was compromised by powerful assumptions of linearity and the independence of variables. Regression-based models were used to stratify patients’ risk before imaging-based screening in a series of large-scale screening studies [16]. Despite the contributions these models made to understanding the population level, they failed, on most occasions, to encompass the intricate interactions among symptom level, lifestyle behavior, and comorbidities. Thus, their applicability to individualized risk assessment was limited, especially with heterogeneous or smaller datasets.

2.2. Machine Learning Methods for Lung Cancer Prediction

With the growing availability of clinical and survey-based datasets, machine learning methods have been regularly investigated for their applicability to lung cancer forecasting. The methods used include decision trees, k-nearest neighbors, support vector machines (SVMs), naïve Bayes classifiers, and ensemble classifiers such as random forests, with varying levels of success on symptom-based and lifestyle data [6,17,18]. Ensemble learning schemes have generally shown better performance than single classifiers because they can reduce variance and capture nonlinear associations [19]. As an illustration, random forest and gradient boosting models have been reported to outperform logistic regression and SVMs on several lung cancer datasets [20]. In more recent work, multilayer perceptrons and convolutional neural networks have been proposed as deep learning models, especially for imaging-based diagnosis [21]. Nevertheless, these models can be very costly in terms of data and computational resources, which limits their utility for case-based clinical screening using surveys. Although most studies have been reported to be very accurate, a closer look shows that performance evaluations are often inconclusive. Some of them may rely entirely on accuracy as the primary metric, which can be deceptive in cases of class imbalance [8]. Some of them do not apply the strict separation of training, validation, and test sets, which is risky for data leakage and optimistic bias [9]. Moreover, most research studies use a fixed decision threshold without exploring its effects on sensitivity and specificity, which are essential in medical decision-making settings [9].

2.3. Class Imbalance, Threshold Selection, and Interpretability

The issue of class imbalance is widespread with lung cancer datasets because the ratios of positive and negative cases are frequently lopsided due to cohort selection guidelines [10]. This problem has been tackled in many studies through resampling (e.g., oversampling, undersampling, or synthetic data generation) [22]. Although effective in some instances, these methods can introduce artificial distribution or distort the underlying data distribution, especially when small datasets are used. Another alternative and frequently more principled method is cost-sensitive learning or class-weighted loss functions, which, in addition to the original data distribution, tend to penalize misclassifications of minority-class instances [11]. Nevertheless, this approach is not widely used in symptom-based research studies of lung cancer prediction. Decision threshold optimization is another area of literature that is under-researched. The majority of earlier studies fail to provide a probability threshold below 0.5, which is evidence that optimal thresholds vary according to the characteristics of the dataset and clinical priorities [9]. Lack of optimization of this threshold may result in suboptimal trade-offs of false positives and false negatives, thus restricting real-world use. Lastly, the interpretability of models has become one of the most critical demands of clinical machine learning systems. Although current research is starting to use feature importance analysis or explainability methods, many lung cancer prediction models remain black boxes, providing little information about the factors that drive their predictions [23]. This lack of transparency creates obstacles to clinical adoption and regulatory acceptance. Unlike previous research, this work combines ensemble-based learning with class-based weighted training and validation-based threshold optimization and includes extensive performance assessment on unseen test data. In addition, we underline model transparency using feature importance analysis, error characterization, calibration evaluation, and subgroup performance analysis. Given the branding vulnerability areas in the literature, this study is expected to offer a more valid and clinically significant paradigm for lung cancer risk prediction based on non-invasive survey data.
Symptom-based and questionnaire-based studies in recent years are also an incentive for this direction of work. Nemlander et al. [24] trained machine learning models using a cohort from a symptom e-questionnaire and demonstrated that structured symptom reporting can predict lung cancer risk. Nabeel et al. [25] found that high performance on the popular Kaggle lung cancer dataset is achieved through large-scale hyperparameter exploration and emphasized the importance of sensitivity in screening-based assessment. Dritsas and Trigka [26] compared several classical and ensemble learners with resampling strategies and noted that oversampling can boost apparent performance at the cost of comparability across protocols. Post hoc explainability methods, such as SHAP, provide feature-level attribution to interpret black-box models and improve transparency in clinical decision support systems [27]. These studies confirm the relevance of conservative hold-out testing, open processing of imbalance, and interpretable decision thresholds, as practiced in this paper.

3. Materials and Methods

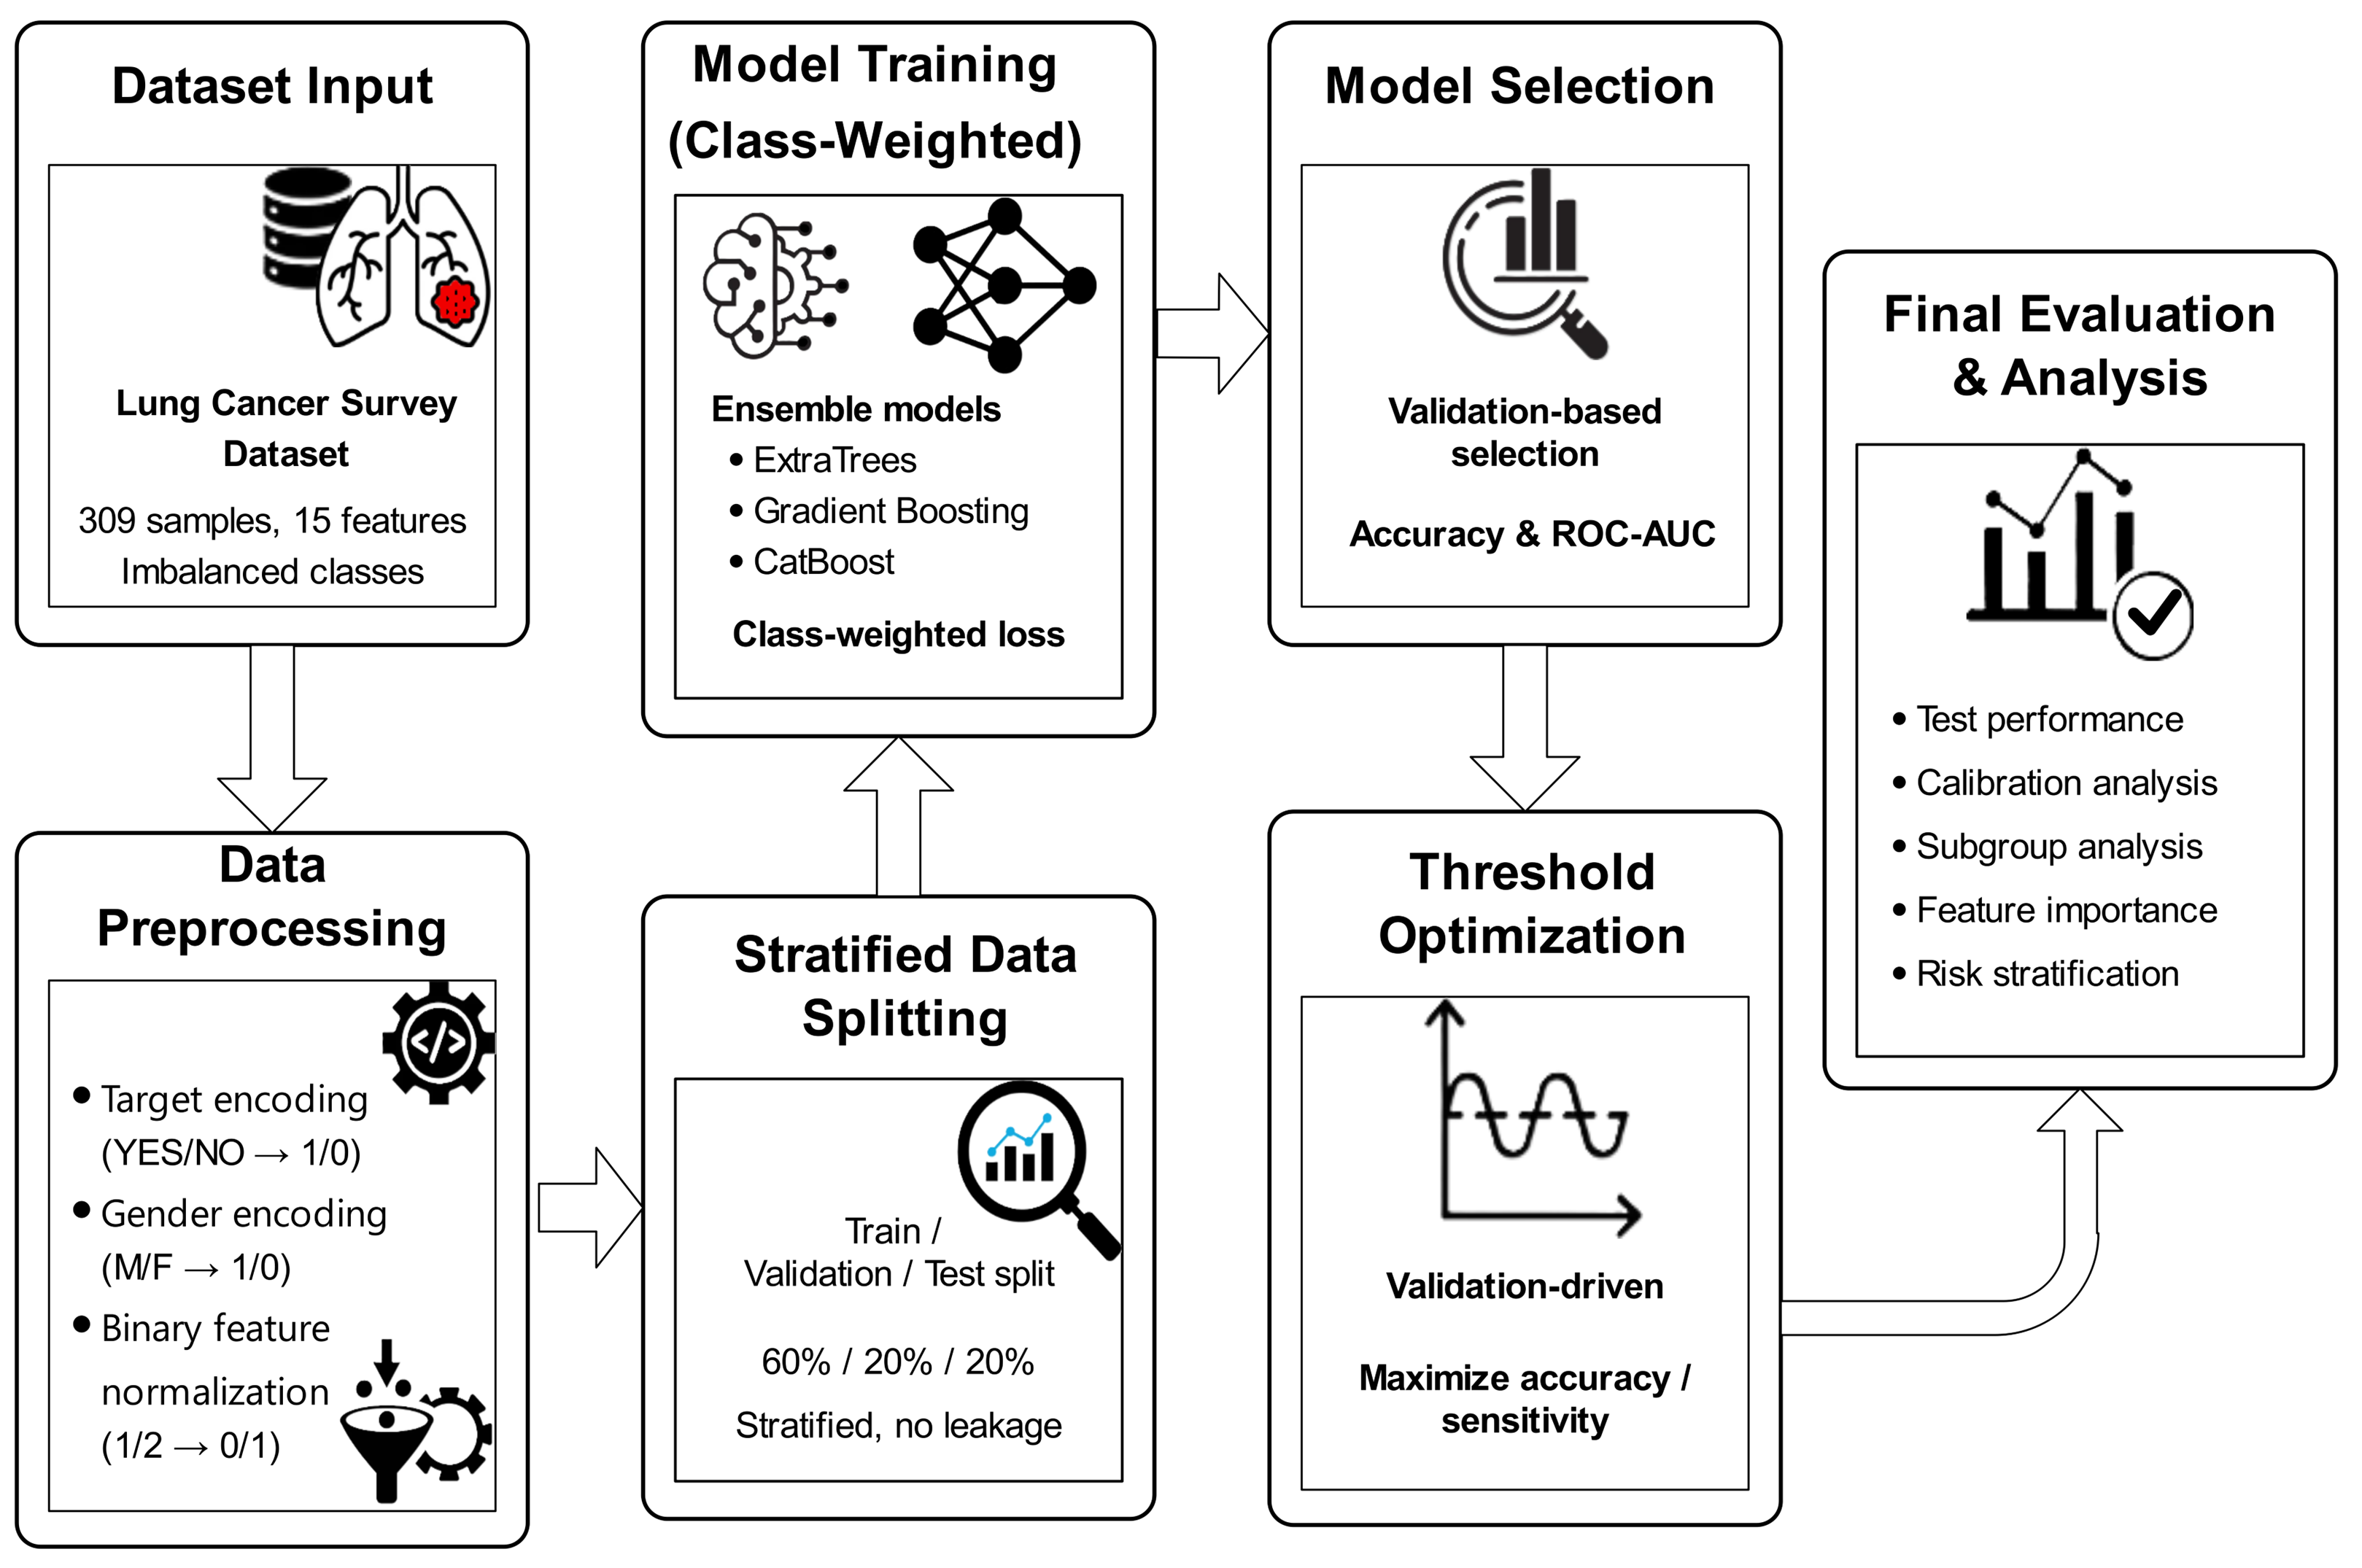
In this section, the researcher explains the dataset, preprocessing, model construction, and the evaluation plan for this research. A summary of the overall methodological process is shown in Figure 1, which depicts the end-to-end flow from data acquisition to model assessment. Publicly available lung cancer survey data were used, comprising demographic, lifestyle, and symptom-based characteristics. All variables were preprocessed before model training, including target encoding, categorical feature transformation, and binary normalization of survey responses. A stratified train-validation-test split was used to divide the dataset, ensuring unbiased performance estimates without data leakage. To address class imbalance, class weights were used during model training. Several ensemble-based machine learning models were tested, and the model with the best validation performance was selected. Optimization of the decision threshold was further performed on the validation set to enhance clinical sensitivity. The held-out test was used only for the final performance assessment, while all other analyses, such as calibration, subgroup analysis, explainability, and risk stratification, were performed on the held-out test set.

3.1. Dataset Description

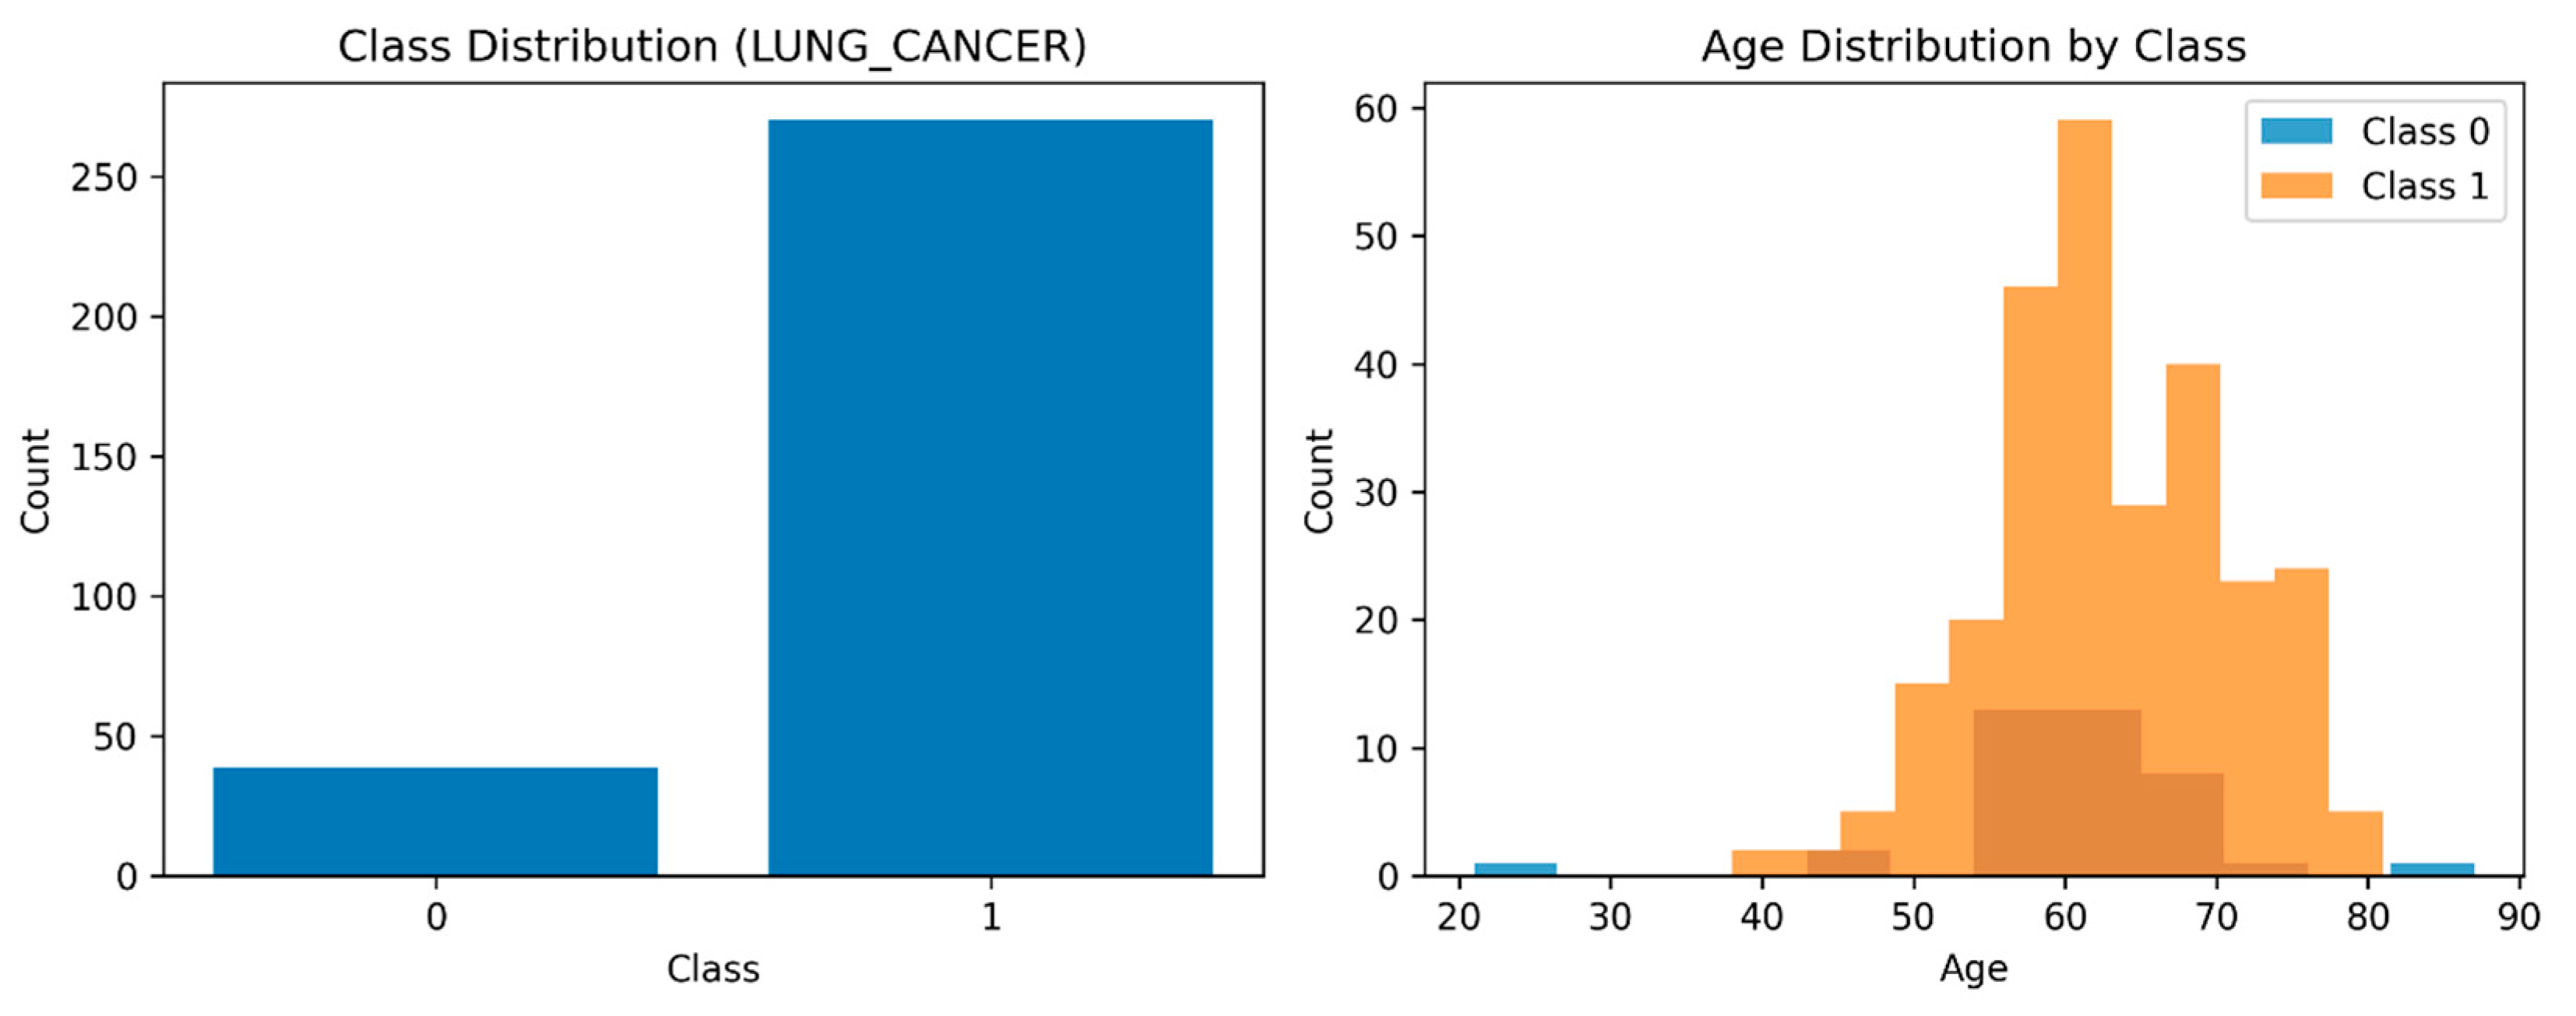
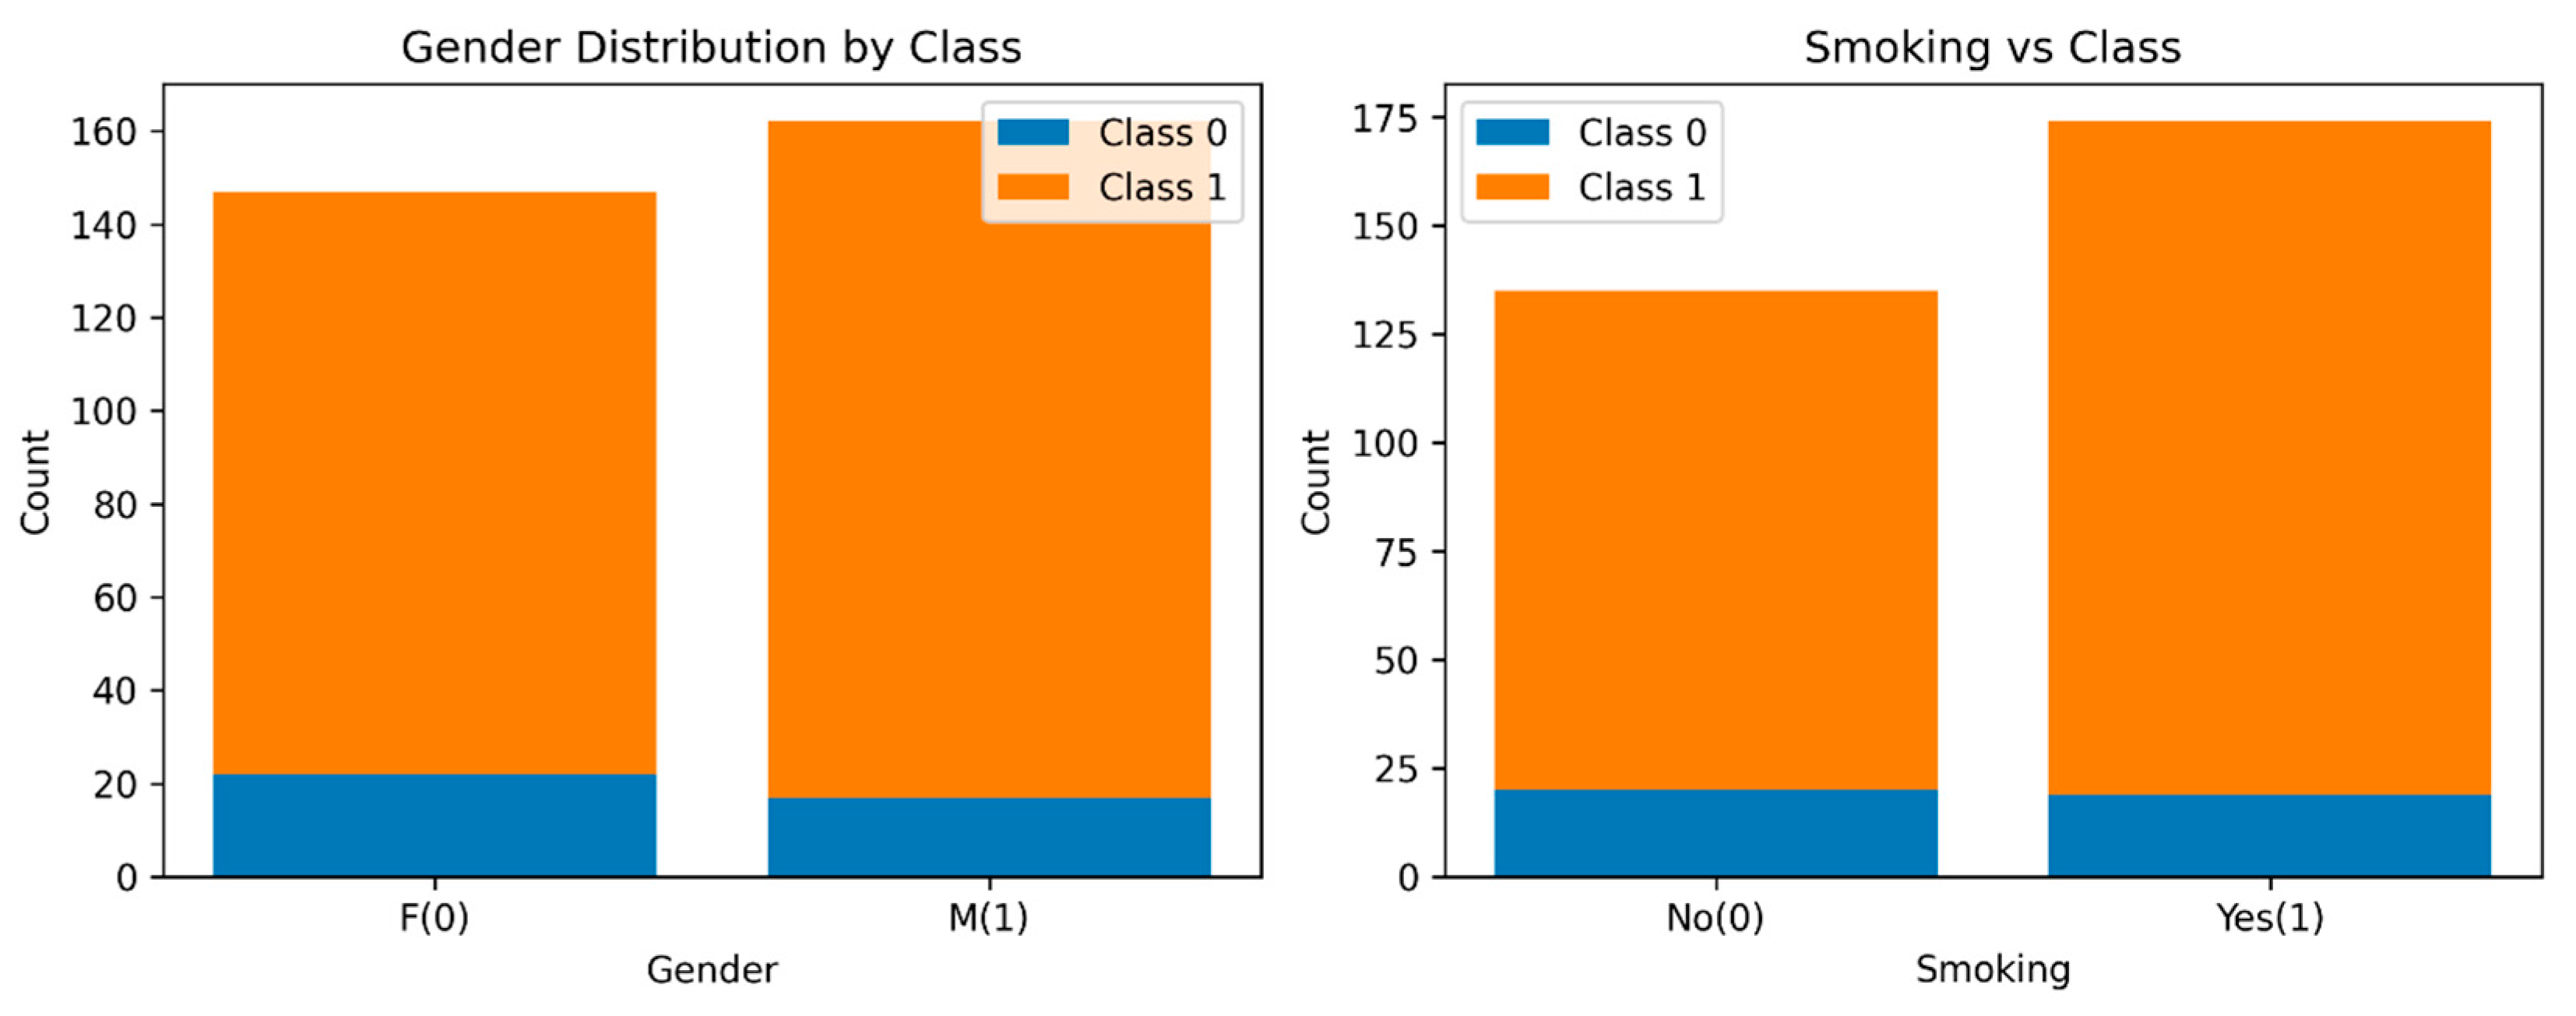
The data used in this study are a publicly available survey of the lung cancer dataset acquired from Kaggle [28]. The dataset consists of 309 patient records, each describing an individual patient in terms of demographic, lifestyle, and symptom-related factors. Overall, there are 16 attributes: 15 predictive features and the remaining one a binary target variable (the presence of lung cancer). There is a strong imbalance in the classes of the cohort. Out of the 309 samples, the number of positive samples (270 of 309) is higher than the number of those that are negative (39 of 309). This is characteristic of symptom-based screening datasets in which people are preselected with a high degree of clinical suspicion. Figure 2 displays the distribution of the class labels and shows how the dataset is distributed between lung cancer-positive and lung cancer-negative cases. The extremely high percentage of positive outcomes reflects the inherent class imbalance that symptom-based screening cohorts imply and prompts the imbalance-sensitive learning approach that this study took.
The variables in the dataset include demographic variables, such as age and gender, as well as lifestyle and symptom-related variables, including smoking habits, alcohol use, a history of chronic diseases, coughing, wheezing, shortness of breath, difficulty swallowing, and chest pain. The age variable is measured numerically as a continuous variable, whereas the gender variable is measured categorically. The majority of survey-based features are represented as ordinal values {1, 2}, indicating the presence or absence of a symptom or condition.
The significant skew in the number of cases that are positive for lung cancer presents a risk of biased model training, where classifiers tend to focus on the majority class at the cost of minority-class cases that are clinically important. This imbalance can be further highlighted by a proportional representation, which further highlights the skewed distribution, as shown in Figure 3. This visualization supports the fact that class-weighted learning is necessary rather than naive accuracy-based optimization.
This consideration directly informed the choice to use class-weighted learning over resampling-based methods, thereby preserving the original data distribution and penalizing the misclassification of minority-class samples.

3.2. Data Preprocessing

The target variable, initially a categorical variable (“YES” and “NO”), was transformed into a binary numerical variable. The cases that were negative for lung cancer were assigned 0, and the positive cases were assigned 1. The target variable was not further changed. All categorical and ordinal survey characteristics were converted to binary numerical variables. The features represented as {1, 2} were transformed to the features described as 0, 1, with 1 representing the presence of a symptom or risk factor. This transformation eliminates ordinal ambiguity, and each feature contributes equally to the learning process. Continuous variables (age) were not transformed into integer values, since tree-based ensemble models do not depend on monotonic feature scaling. The dataset was divided into training, validation, and test sets using a stratified splitting strategy to prevent data leakage and obtain unbiased performance estimates. In particular, there were 185 samples (60%), 62 samples (20%), and 62 samples (20%), respectively. Stratification maintained the original set of classes for all subsets. The training set had around 162 positive and 23 negative samples, while the validation and test sets had around 54 and 8 samples, respectively. The test set was not used during model selection or threshold optimization. Table 1 summarizes the variable encoding scheme.

3.3. Model Development

ExtraTrees, Gradient Boosting, and CatBoost are three ensemble-based machine learning models that were deemed effective on small tabular datasets and that model nonlinear feature interactions. The choice of these models was aimed at balancing predictive performance, robustness, and computational efficiency. Class-weighted learning was used to address class imbalance instead of resampling. The class weights were computed using an inverse frequency strategy on the training set alone. According to the training distribution, the weights of the classes were 4.02 and 0.57, respectively. These weights were directly added to the models’ loss functions during training, placing greater weight on the penalty for misclassifying minority-class samples. However, they did not change the underlying data distribution. A predominantly manual, limited-tuning approach to validation performance was used to select hyperparameters. The strategy trades off efficiency and robustness in computation but reduces the risk of overfitting in small datasets when using an exhaustive hyperparameter search. All candidate models were compared using the same validation set to ensure a fair comparison.

3.4. Decision Threshold Optimization

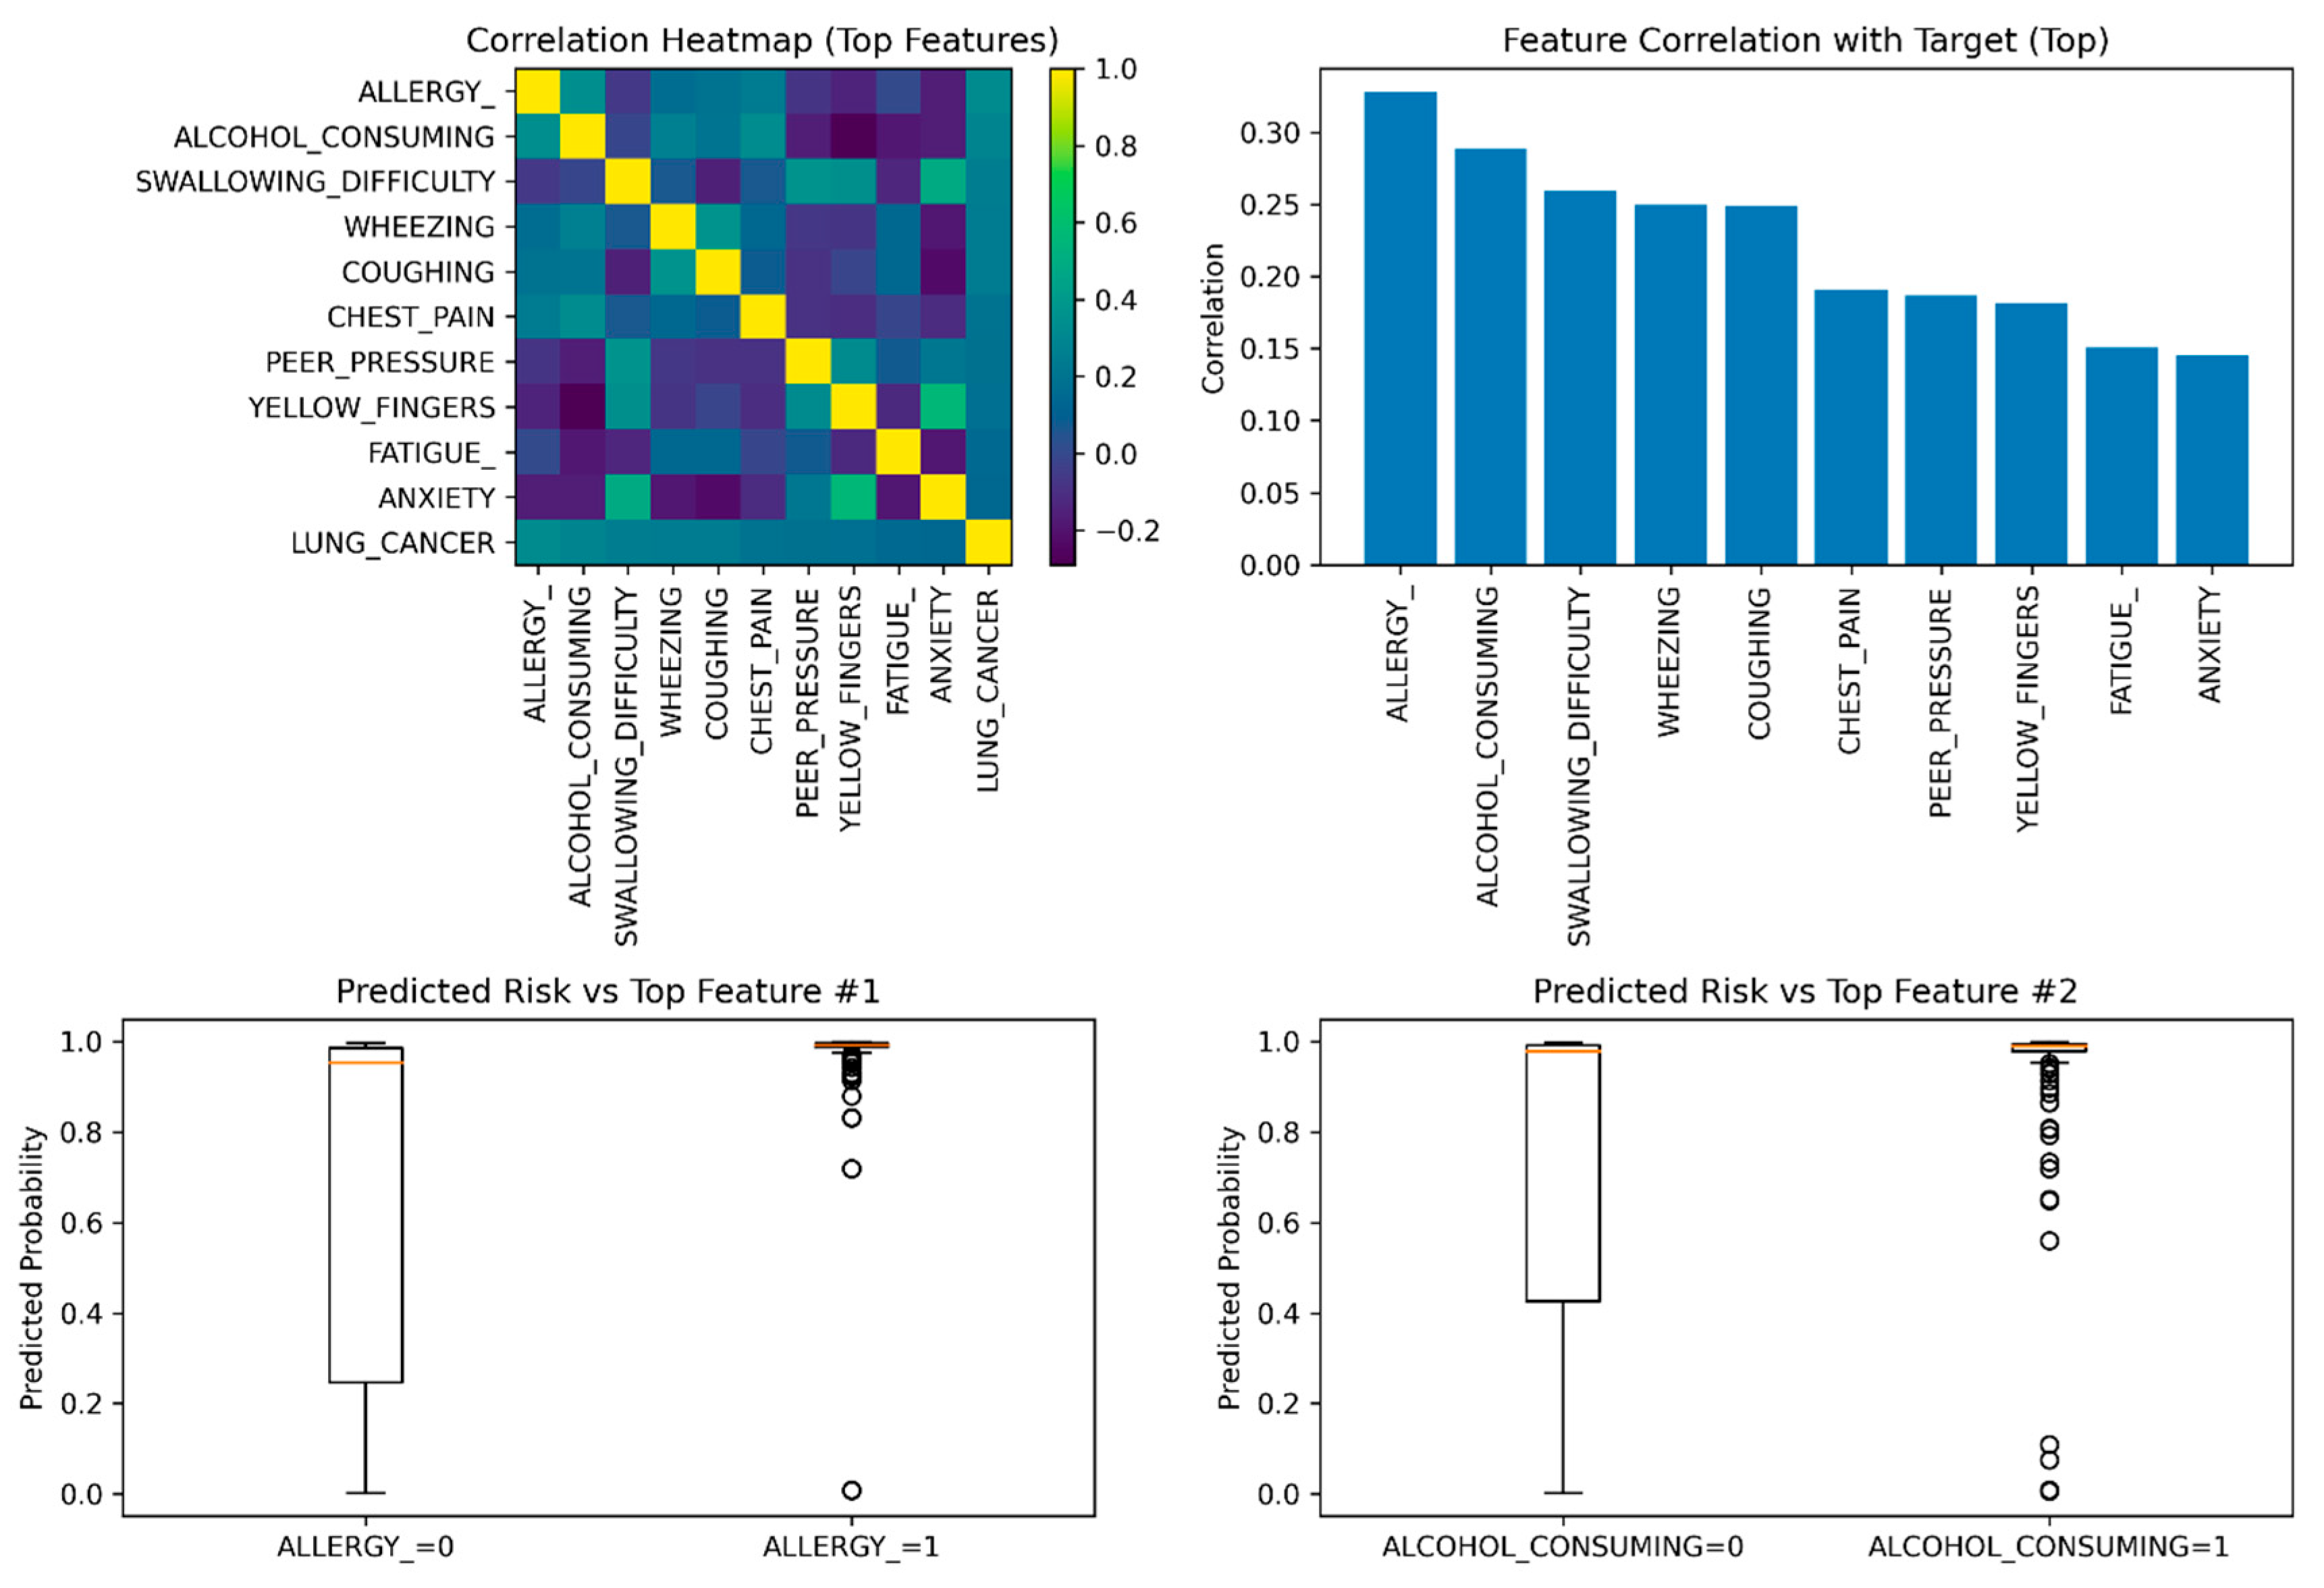
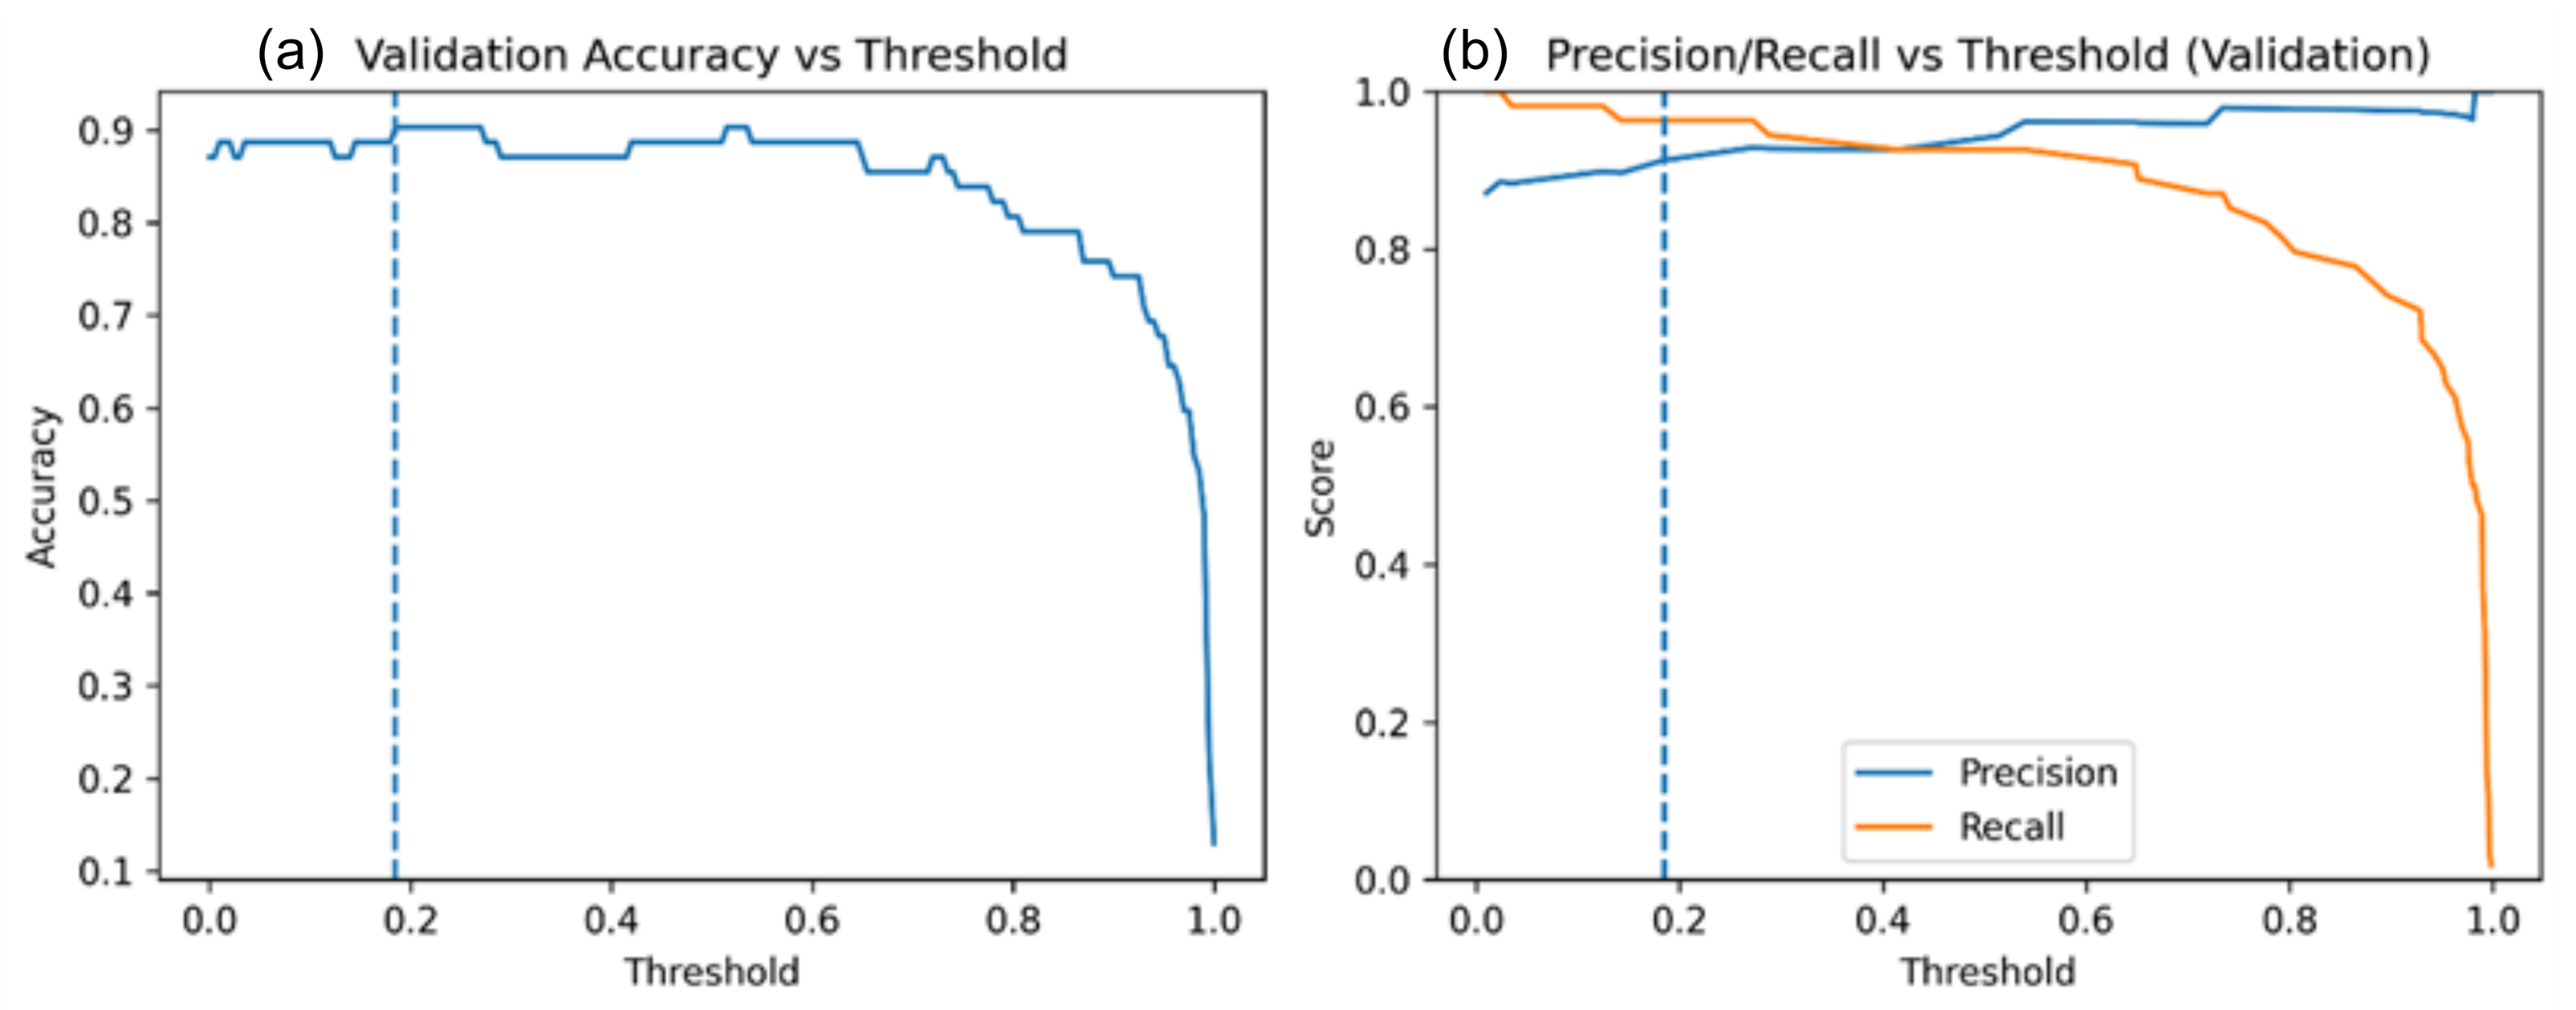
The default decision threshold of 0.5 is not necessarily the best choice for clinical classification tasks, especially with unbalanced data. The decision threshold can be adjusted to provide explicit control over the false-positive and false-negative trade-offs, which is vital in medical screening. The validation set was used to optimize the decision threshold by evaluating the classification accuracy across candidate thresholds from 0 to 1. The threshold that maximized validation accuracy was selected and fixed across all test sets. This process produced an optimal decision threshold of 0.19. Figure 4 illustrates the optimization process of the threshold. The left panel shows the change in validation accuracy with respect to candidate thresholds, and the right panel illustrates the corresponding behavior in precision and recall. The combination of these plots shows that there is optimal performance at a threshold much below the default value of 0.5.

3.5. Evaluation Metrics

A combination of complementary measures is employed to give a clinically interpretable, holistic evaluation of model performance. Accuracy quantifies the overall proportion of correctly classified cases. Precision (positive predictive value) is the proportion of correct positive predictions, and recall (sensitivity) is the proportion of true cancers identified (low recall means that some cancers have been missed). Specificity measures the proportion of non-cancer cases correctly rejected. The F1-score balances precision and recall. In addition, the area under the receiver operating characteristic curve (ROC-AUC) evaluates discriminative ability across all thresholds. Confusion matrices report true positives, true negatives, false positives, and false negatives to support detailed error interpretation.
Although k-fold cross-validation is a common practice in similar research, we use a stratified train-validation-test split to maintain an independent test set for conducting an unbiased performance evaluation. This design ensures that model selection and threshold optimization are performed solely on validation data, thereby avoiding information leakage. We also note that recapitulated splits or nested cross-validation are likely to give more consistent estimates, and this is an area of interest that should be explored in the future.

4. Results

4.1. Model Performance on Validation and Test Sets

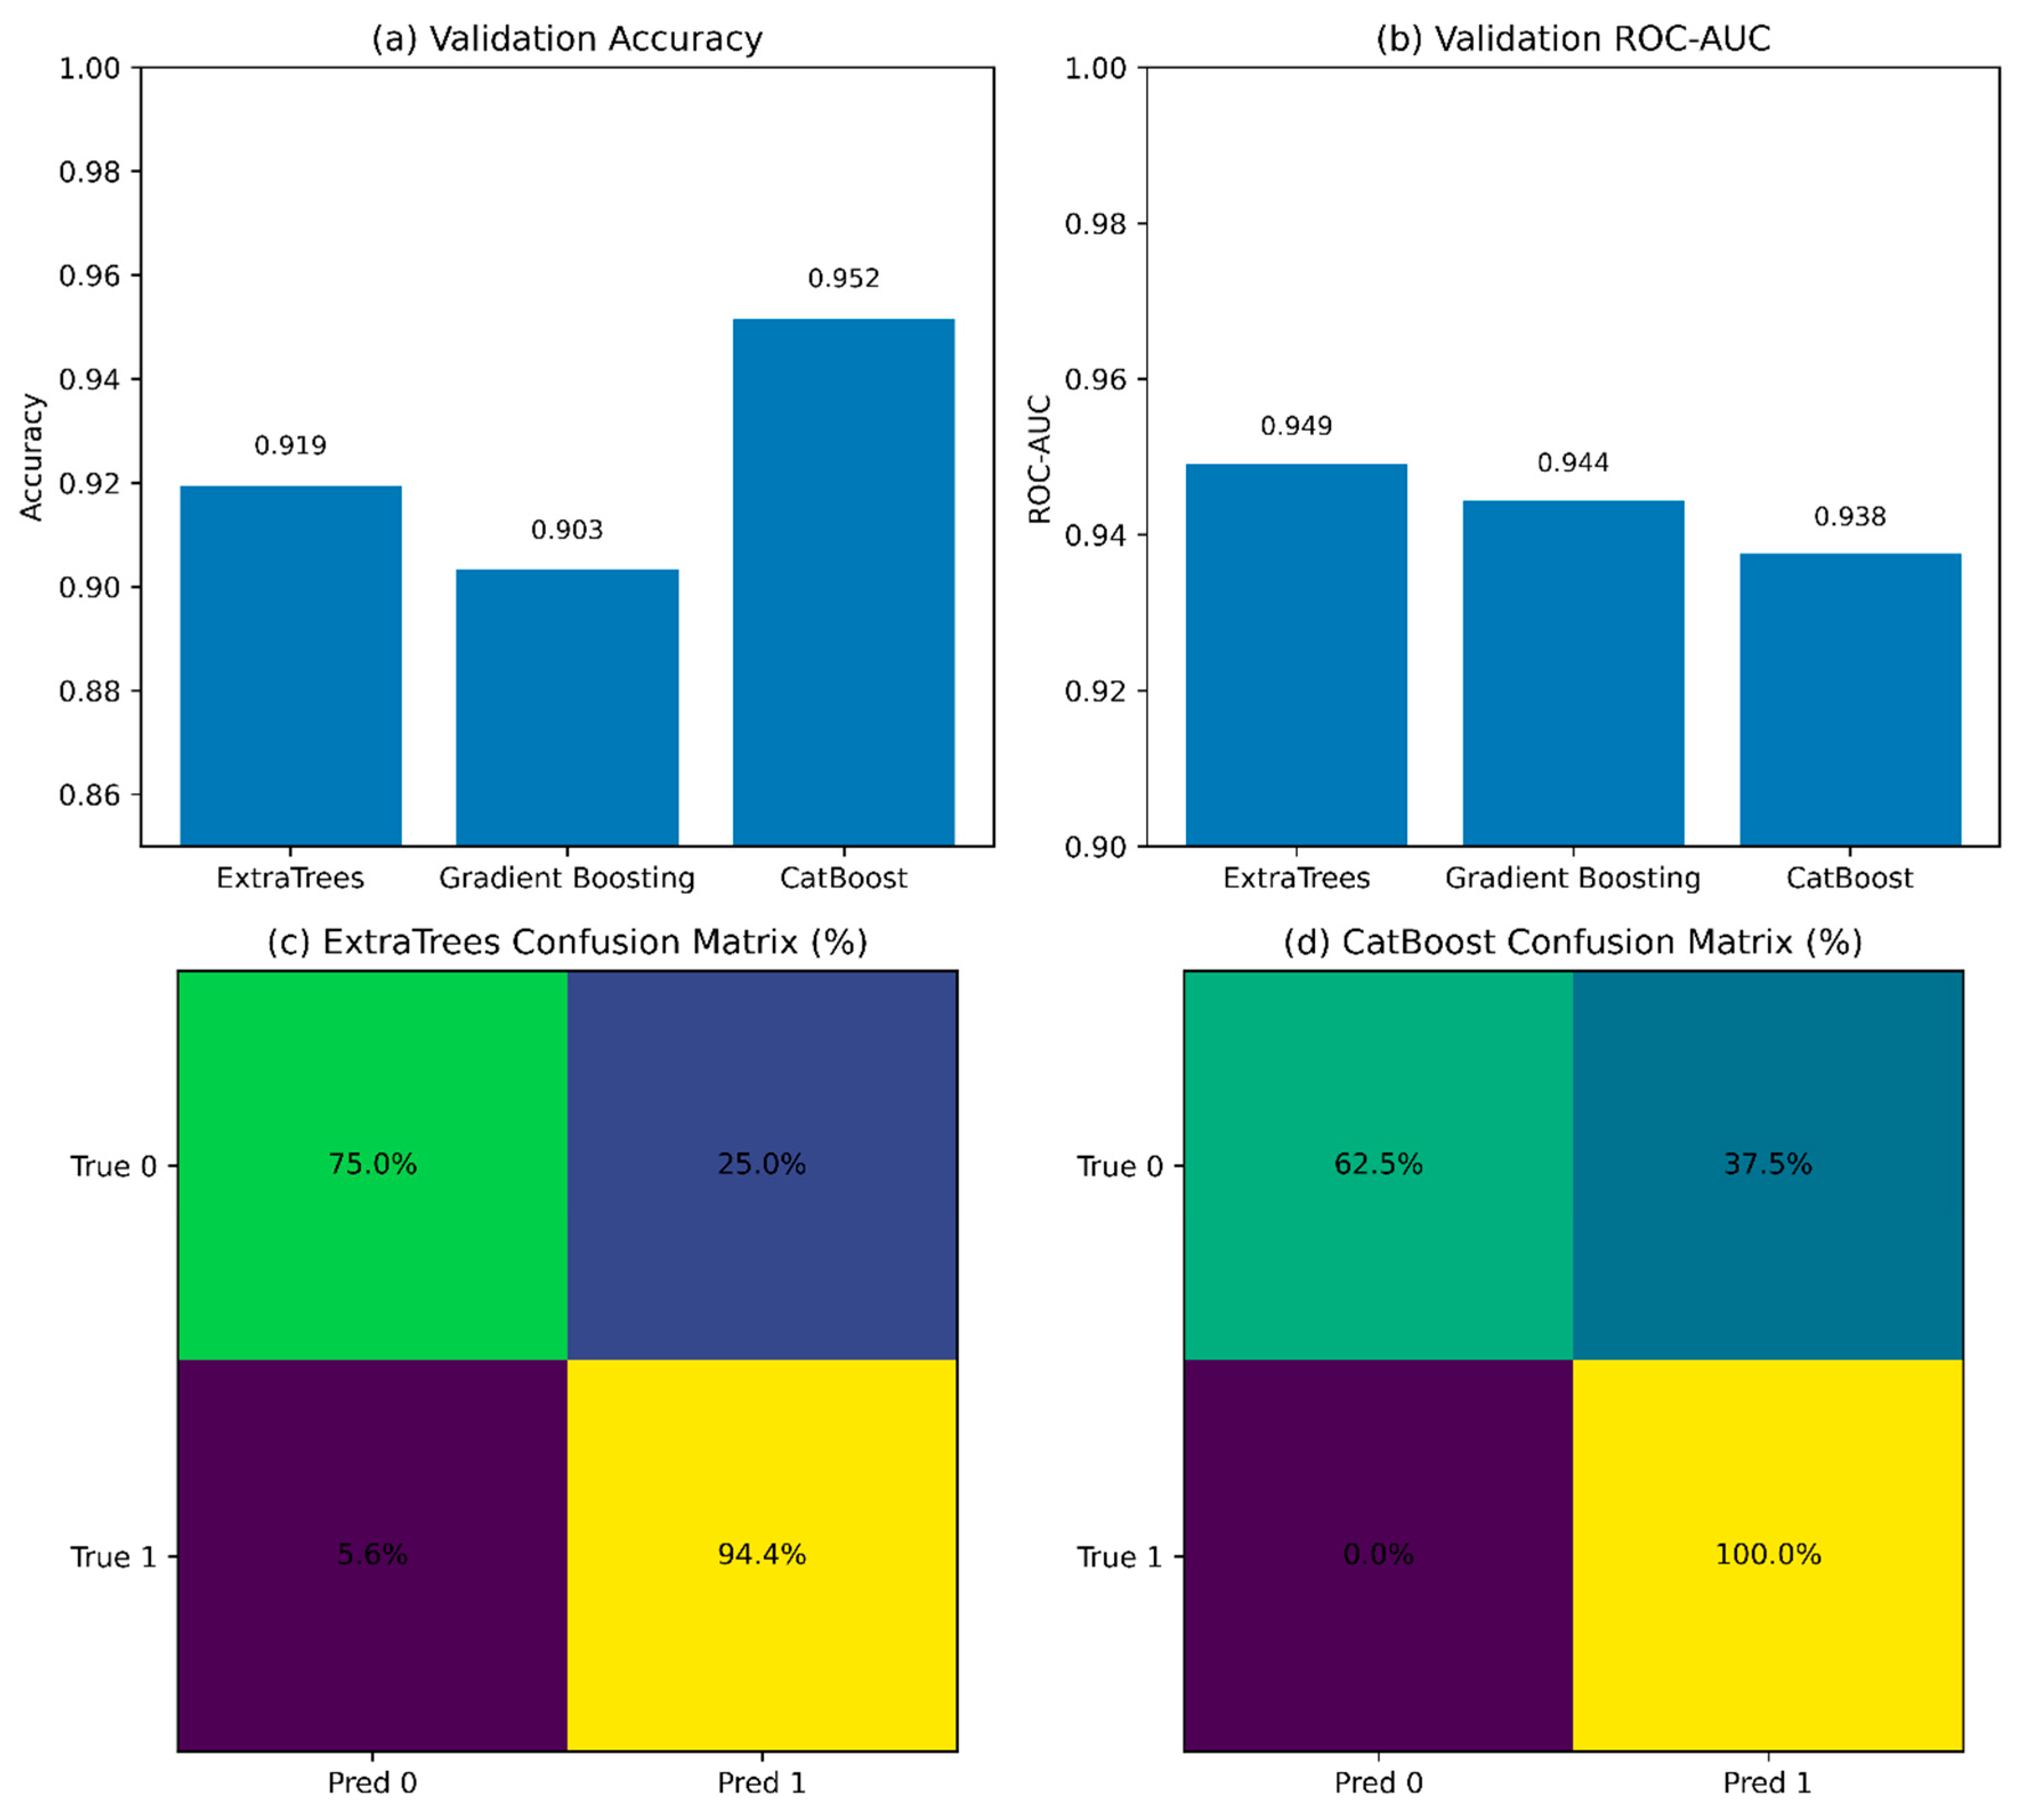
Figure 5 compares the performance of the candidate models on the validation set. Figure 5a indicates that CatBoost has the highest validation accuracy, and Figure 5b suggests that CatBoost can perform at the same level in terms of ROC-AUC compared to ExtraTrees and Gradient Boosting. The confusion matrices in Figure 5c,d give more insight into classification behavior, as they indicate that CatBoost produces fewer false negatives than ExtraTrees, which is a critical property of cancer screening work.
The quantitative results of the selected CatBoost model on both the validation and test sets are summarized in Table 2, which reports the accuracy, ROC-AUC, precision, recall, F1-score, and specificity averaged across five random seeds.
The perfect recall observed on the test set indicates that all lung cancer–positive cases were correctly identified. Since the test set has 54 cases of lung cancer, the 100% observed sensitivity corresponds to a 95% exact (Clopper–Pearson) interval of 93.4–100.0%. On the same note, the test accuracy of 95.16% (59/62) falls within the 86.5–99.0% confidence interval at the 95% level. These intervals emphasize that perfect recall on a small test set, while encouraging, remains statistically weak and should be confirmed in a larger external group.

4.2. Performance Impact of Decision Threshold Optimization

The influence of the choice of decision threshold is discussed in Figure 6. Figure 6a indicates the variation of validation accuracy with changes in thresholds and indicates a definite peak, which is much lower than the default threshold of 0.5. The precision–recall trade-off is shown in Figure 6b, and as the threshold decreases, the recall rises dramatically, whereas precision decreases at a slower rate.
Quantitative comparison between the default threshold and optimized threshold on the test set. Table 3 illustrates that the choice of decision threshold significantly influences the model’s behavior. Although the default threshold has high precision, it has numerous false negatives. On the contrary, the optimized threshold eliminates false negatives, significantly increasing recall and the F1-score while incurring a relatively small decrease in precision.
In threshold optimization, false negatives are removed, which is essential for early cancer detection.

4.3. Final Test Set Performance

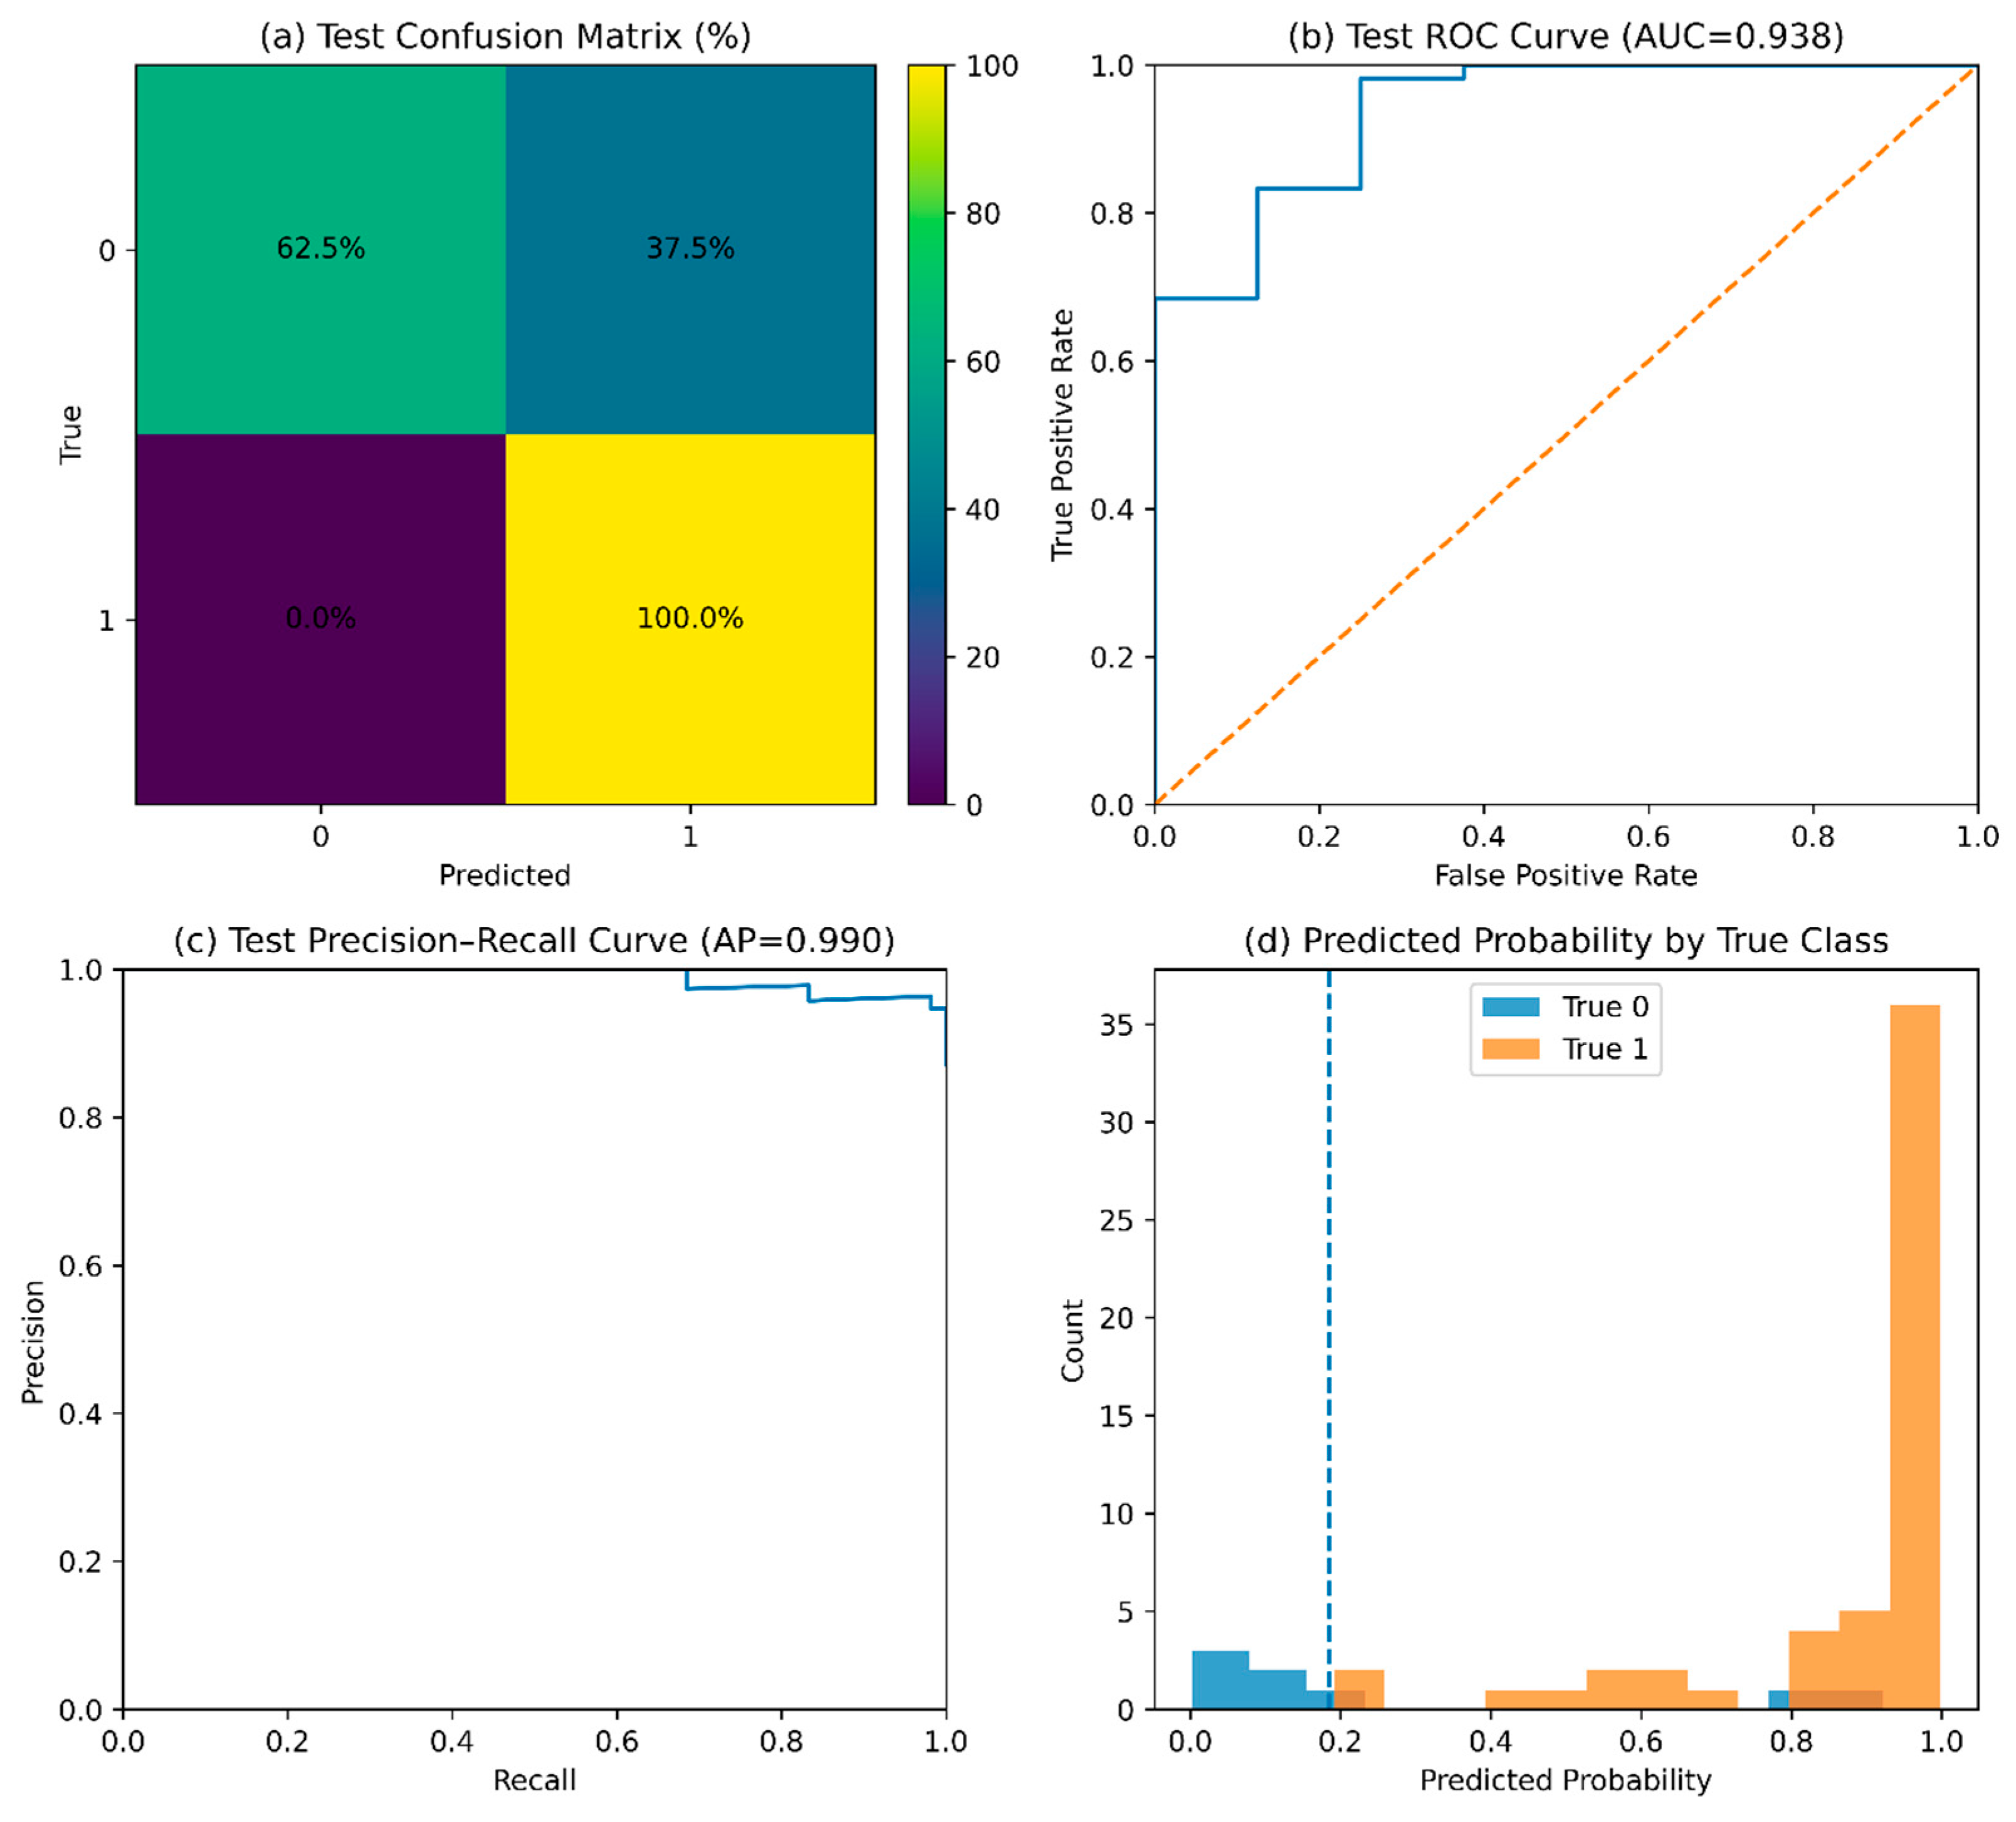
The performance of the final test set is depicted in Figure 7. The failure to detect false negatives is confirmed by the confusion matrix in Figure 7a. In contrast, a high level of discriminative ability is shown by a high ROC curve in Figure 7b. Figure 7c also indicates good precision–recall performance in class imbalance. Figure 7d shows predicted probability distributions that reveal distinct distributions for cancer-positive and cancer-negative cases, with the majority of cancer-positive samples having a high predicted risk.
The optimized model achieved perfect recall on the test set; however, one should treat this result with caution, given the small test sample size. The fact that no false negatives were observed with screening-oriented applications is a positive sign, but more validation ought to be conducted on larger, more heterogeneous datasets to determine the stability of the results.

4.4. Error Analysis

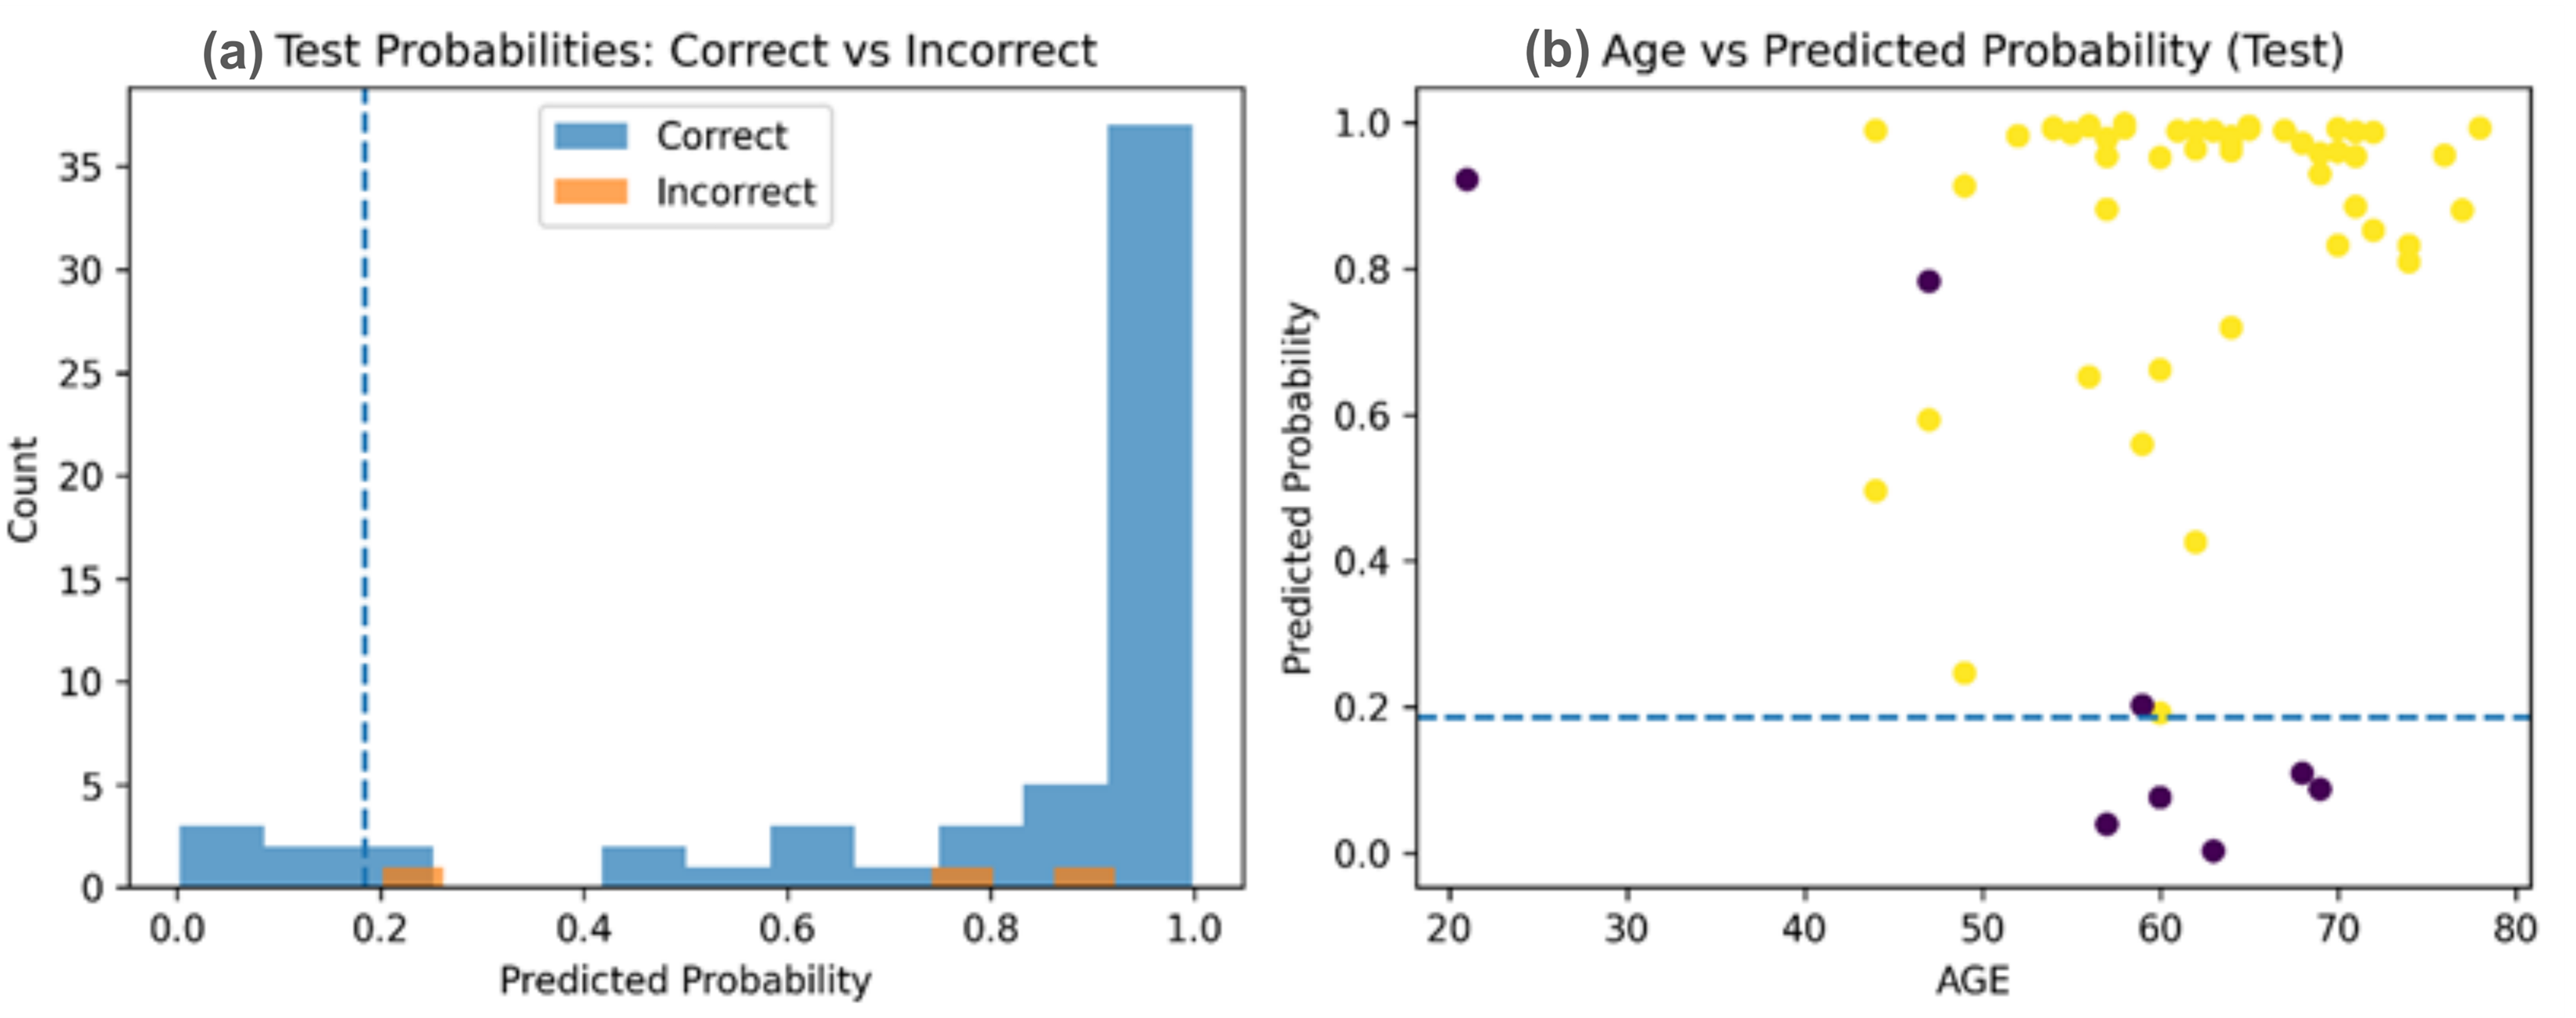
Figure 8 looks into the error characteristics. Figure 8a compares the confidence of prediction between correct and incorrect classification, and the results indicate that errors mainly occur close to the threshold point, which indicates errors brought about by uncertainty. Figure 8b shows the predicted probability versus age, and no strong age bias in the model predictions is recorded in the plots. Figure 8c,d examine the relationship between age and projected prospects, showing no systematic bias by age.
Table 4 summarizes the breakdown of accuracy at the low level of the confusion matrix. It explains that TP incurs the highest contribution in accuracy, i.e., 87.1%, while the model is able to eliminate false negatives. However, false positives still remain and can be further investigated.

4.5. Model Explainability and Feature Importance

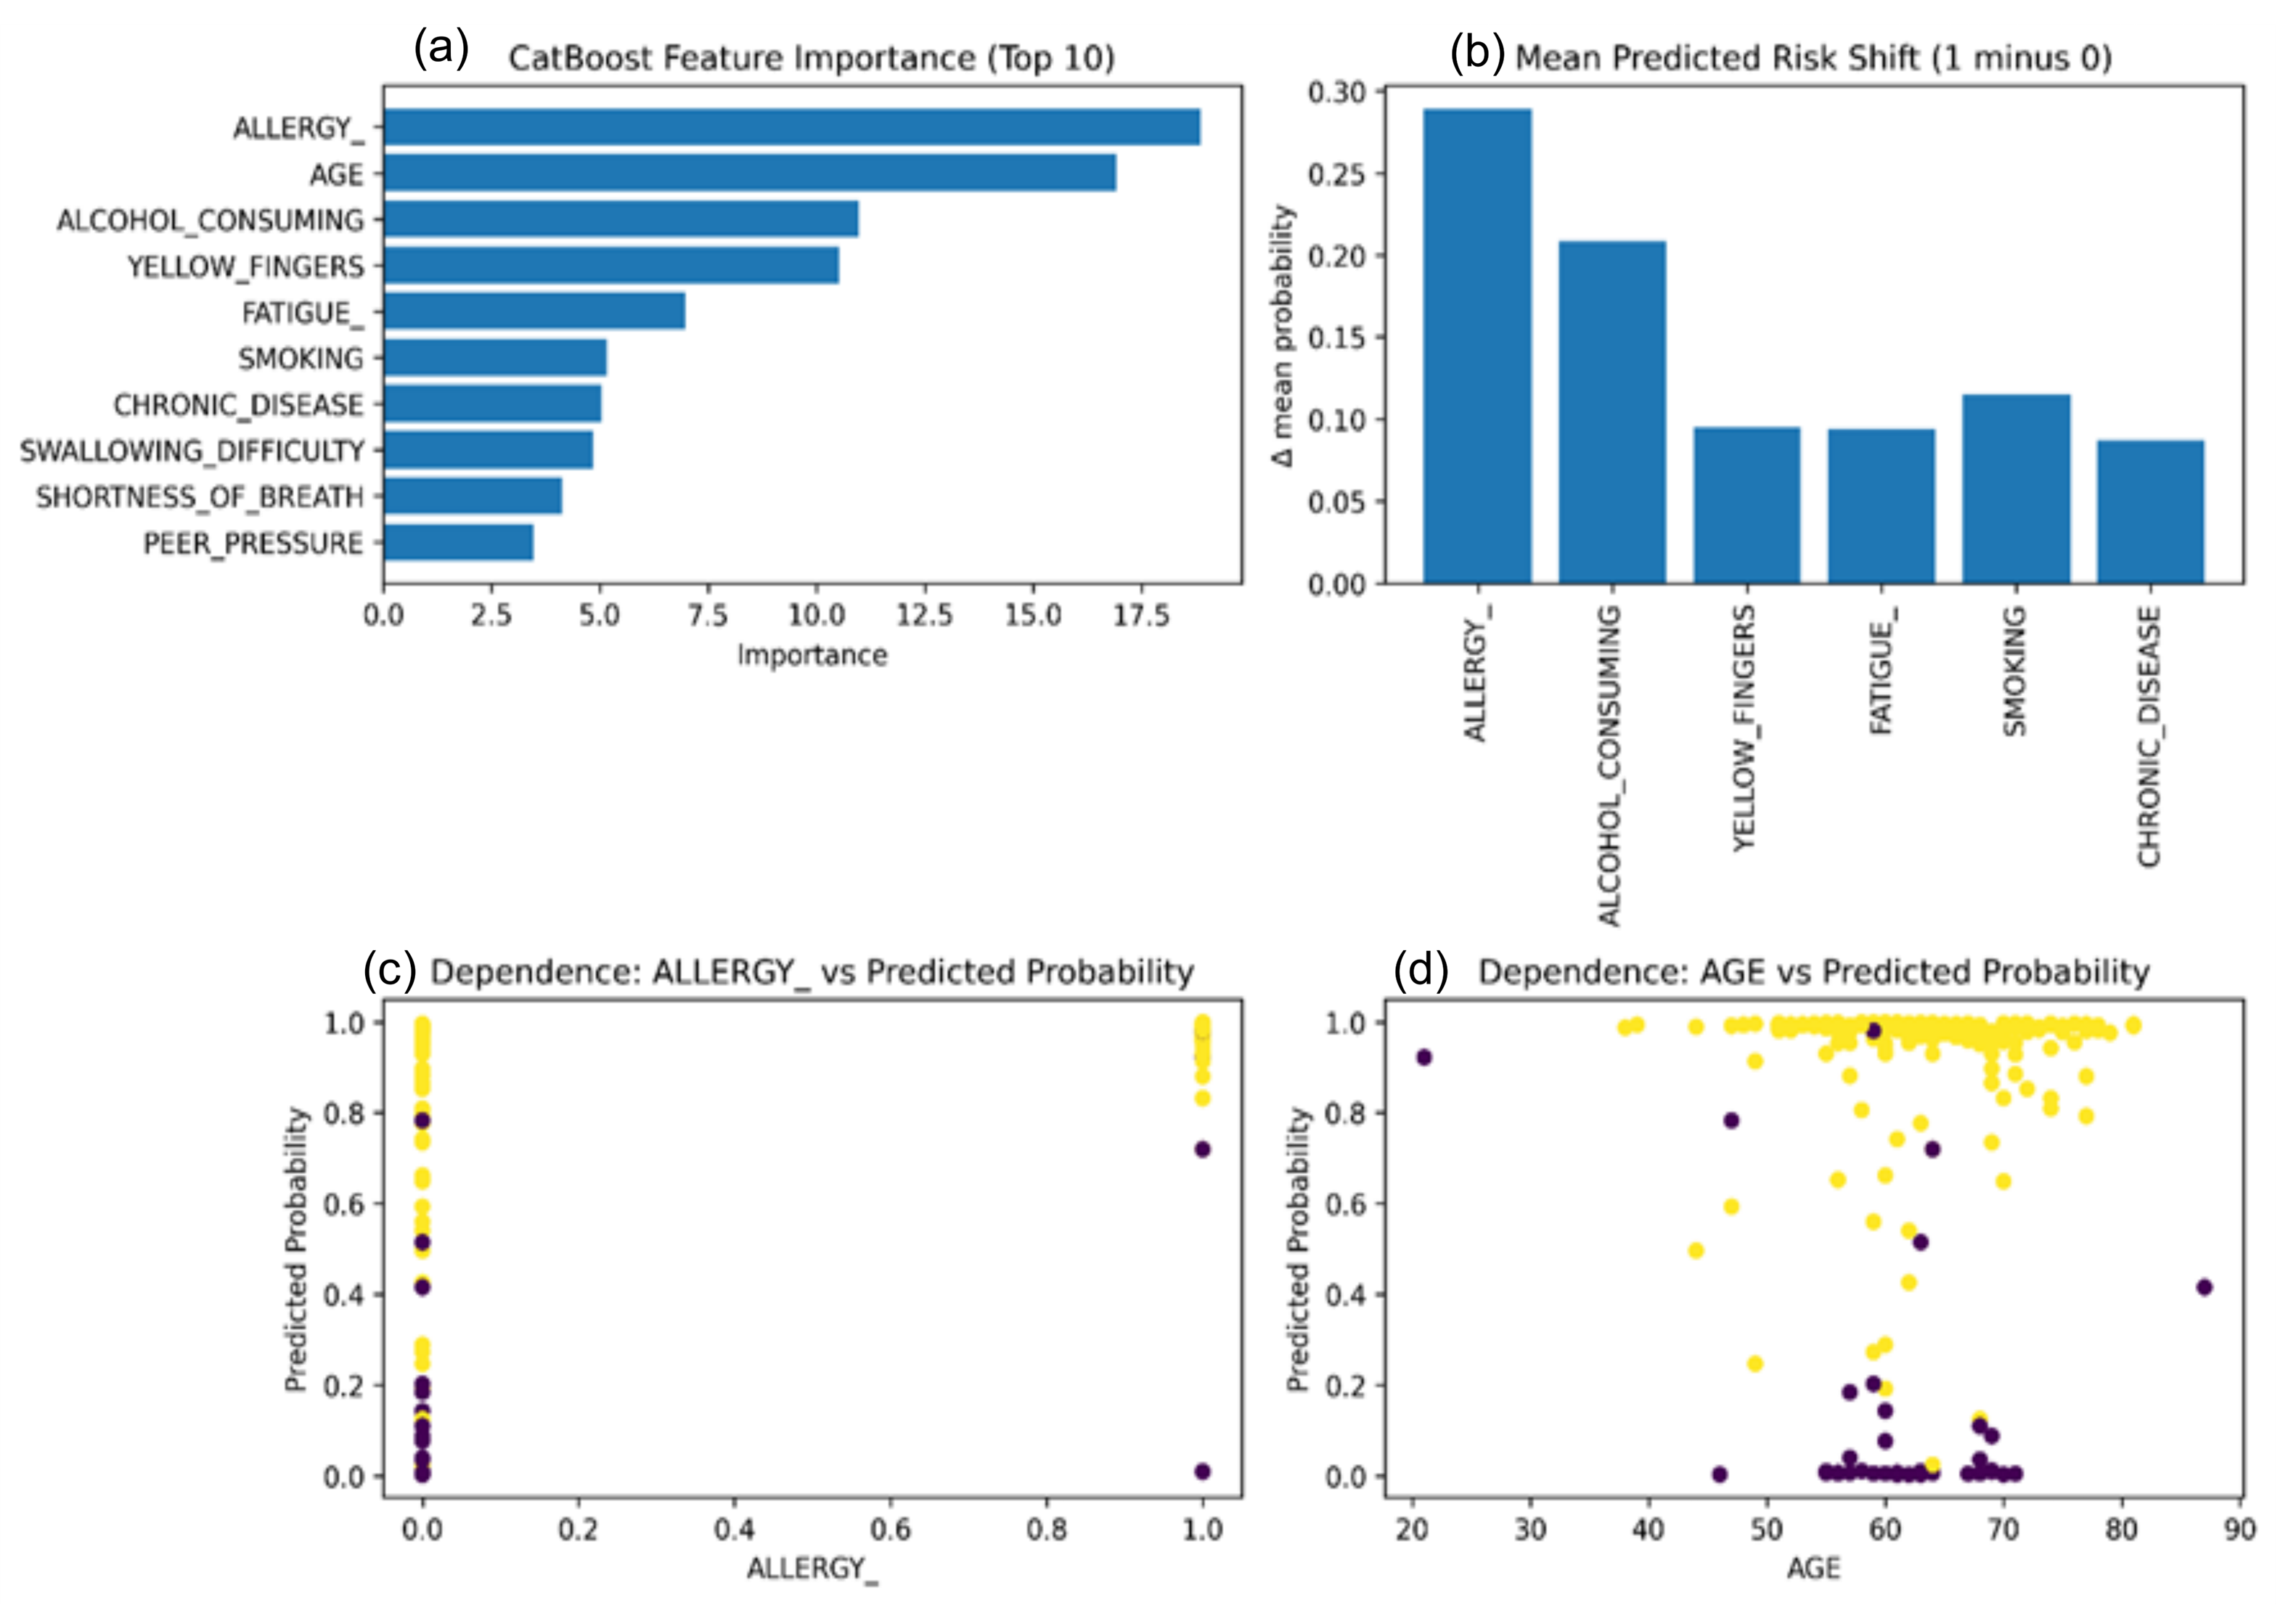
Figure 9 investigates model interpretability. The importance of the ranked features is shown in Figure 9a, where the most critical respiratory symptoms are also indicated. Figure 9b depicts the risk shift across the world for each feature, indicating how symptom presence changes the predicted cancer risk.
Table 5 reports the exact importance value and directionality. The table enhances the understanding of the semantic meaning of each attribute, the original survey values, and the resulting numerical values for model training.

4.6. Calibration and Reliability

Since the scores of model-internal importance can be affected by correlated predictors, we further suggest model-agnostic interpretability methods, such as permutation importance or SHAP explanations, to ensure stable feature rankings. The trends in reported importance in this study are aligned with clinically meaningful respiratory symptoms, but future efforts should include SHAP-based analyses to provide more local explanations for individual predictions.
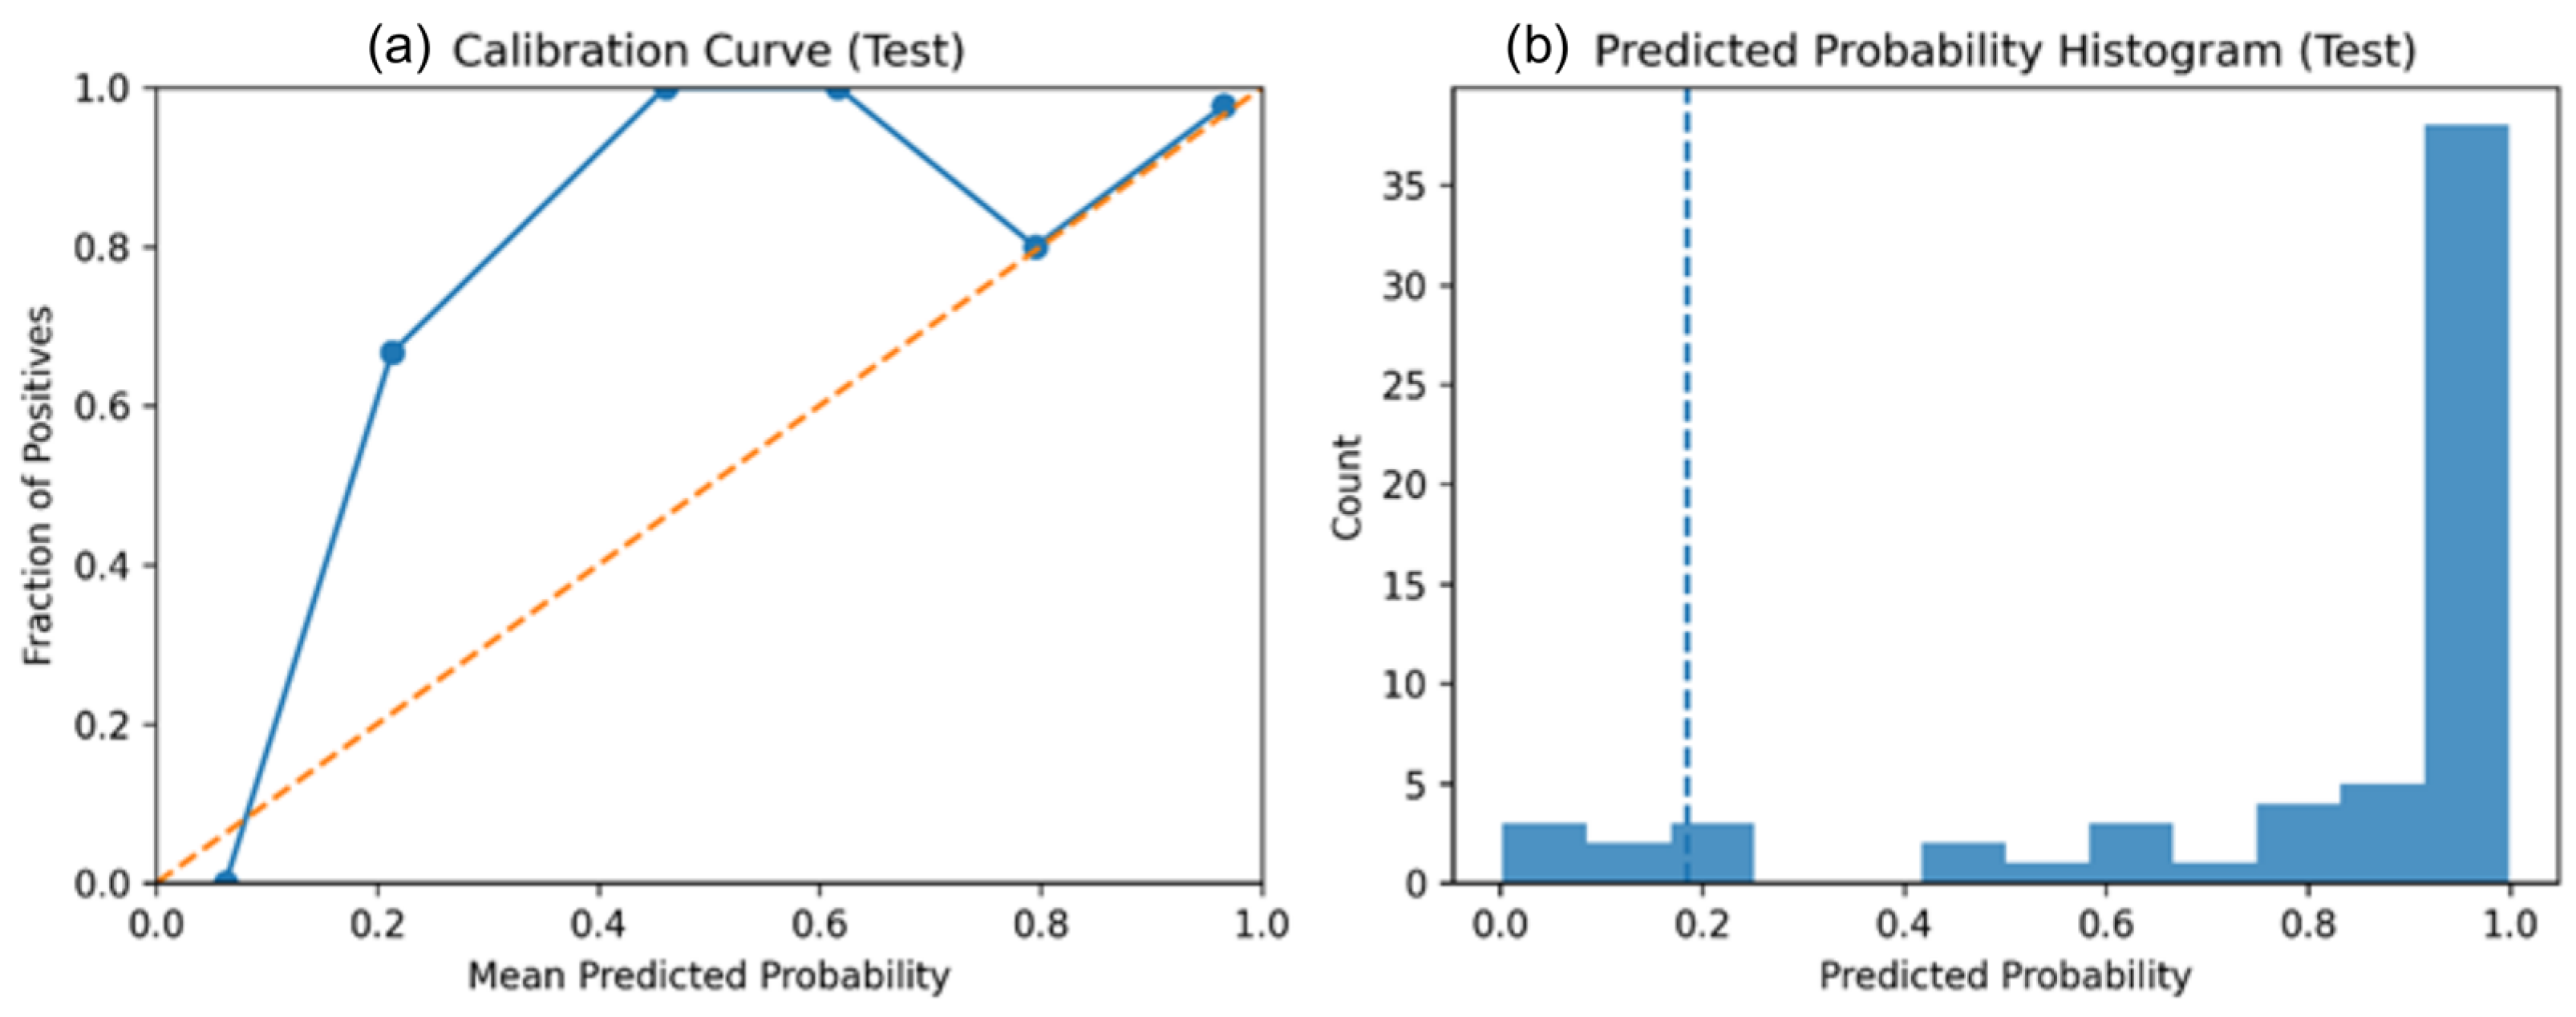
Figure 10 shows the calibration performance. Figure 10a shows that the calibration curve is relatively close to the diagonal, indicating that the predicted probabilities are consistent with the actual results. In contrast, Figure 10b demonstrates that the probability distribution is well-spread without overconfidence.

4.7. Threshold Sensitivity

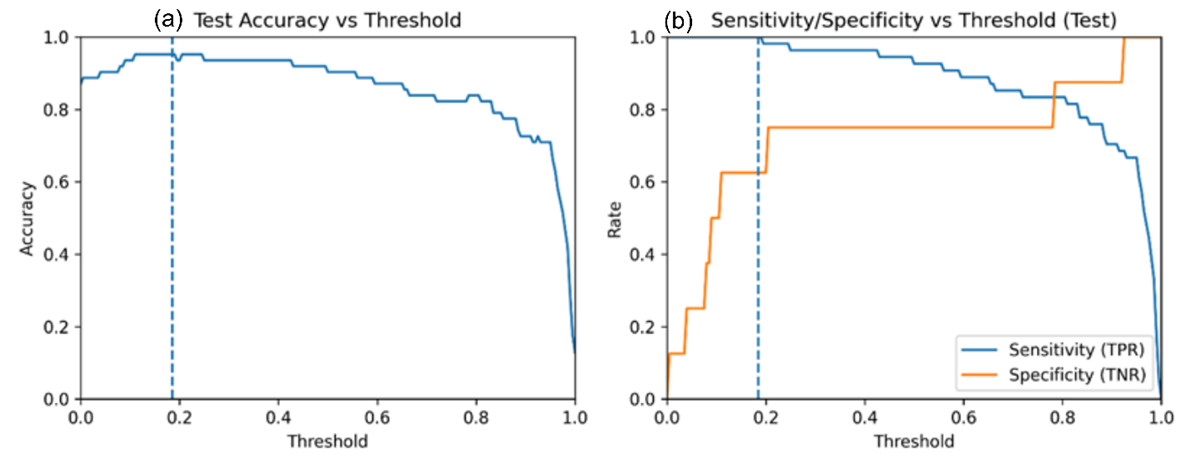
Figure 11 represents threshold sensitivity analysis. As shown in Figure 11a, the test accuracy does not change significantly across a wide range of thresholds, and in Figure 11b, the sensitivity and specificity trade off with changes in threshold.

4.8. Subgroup Performance

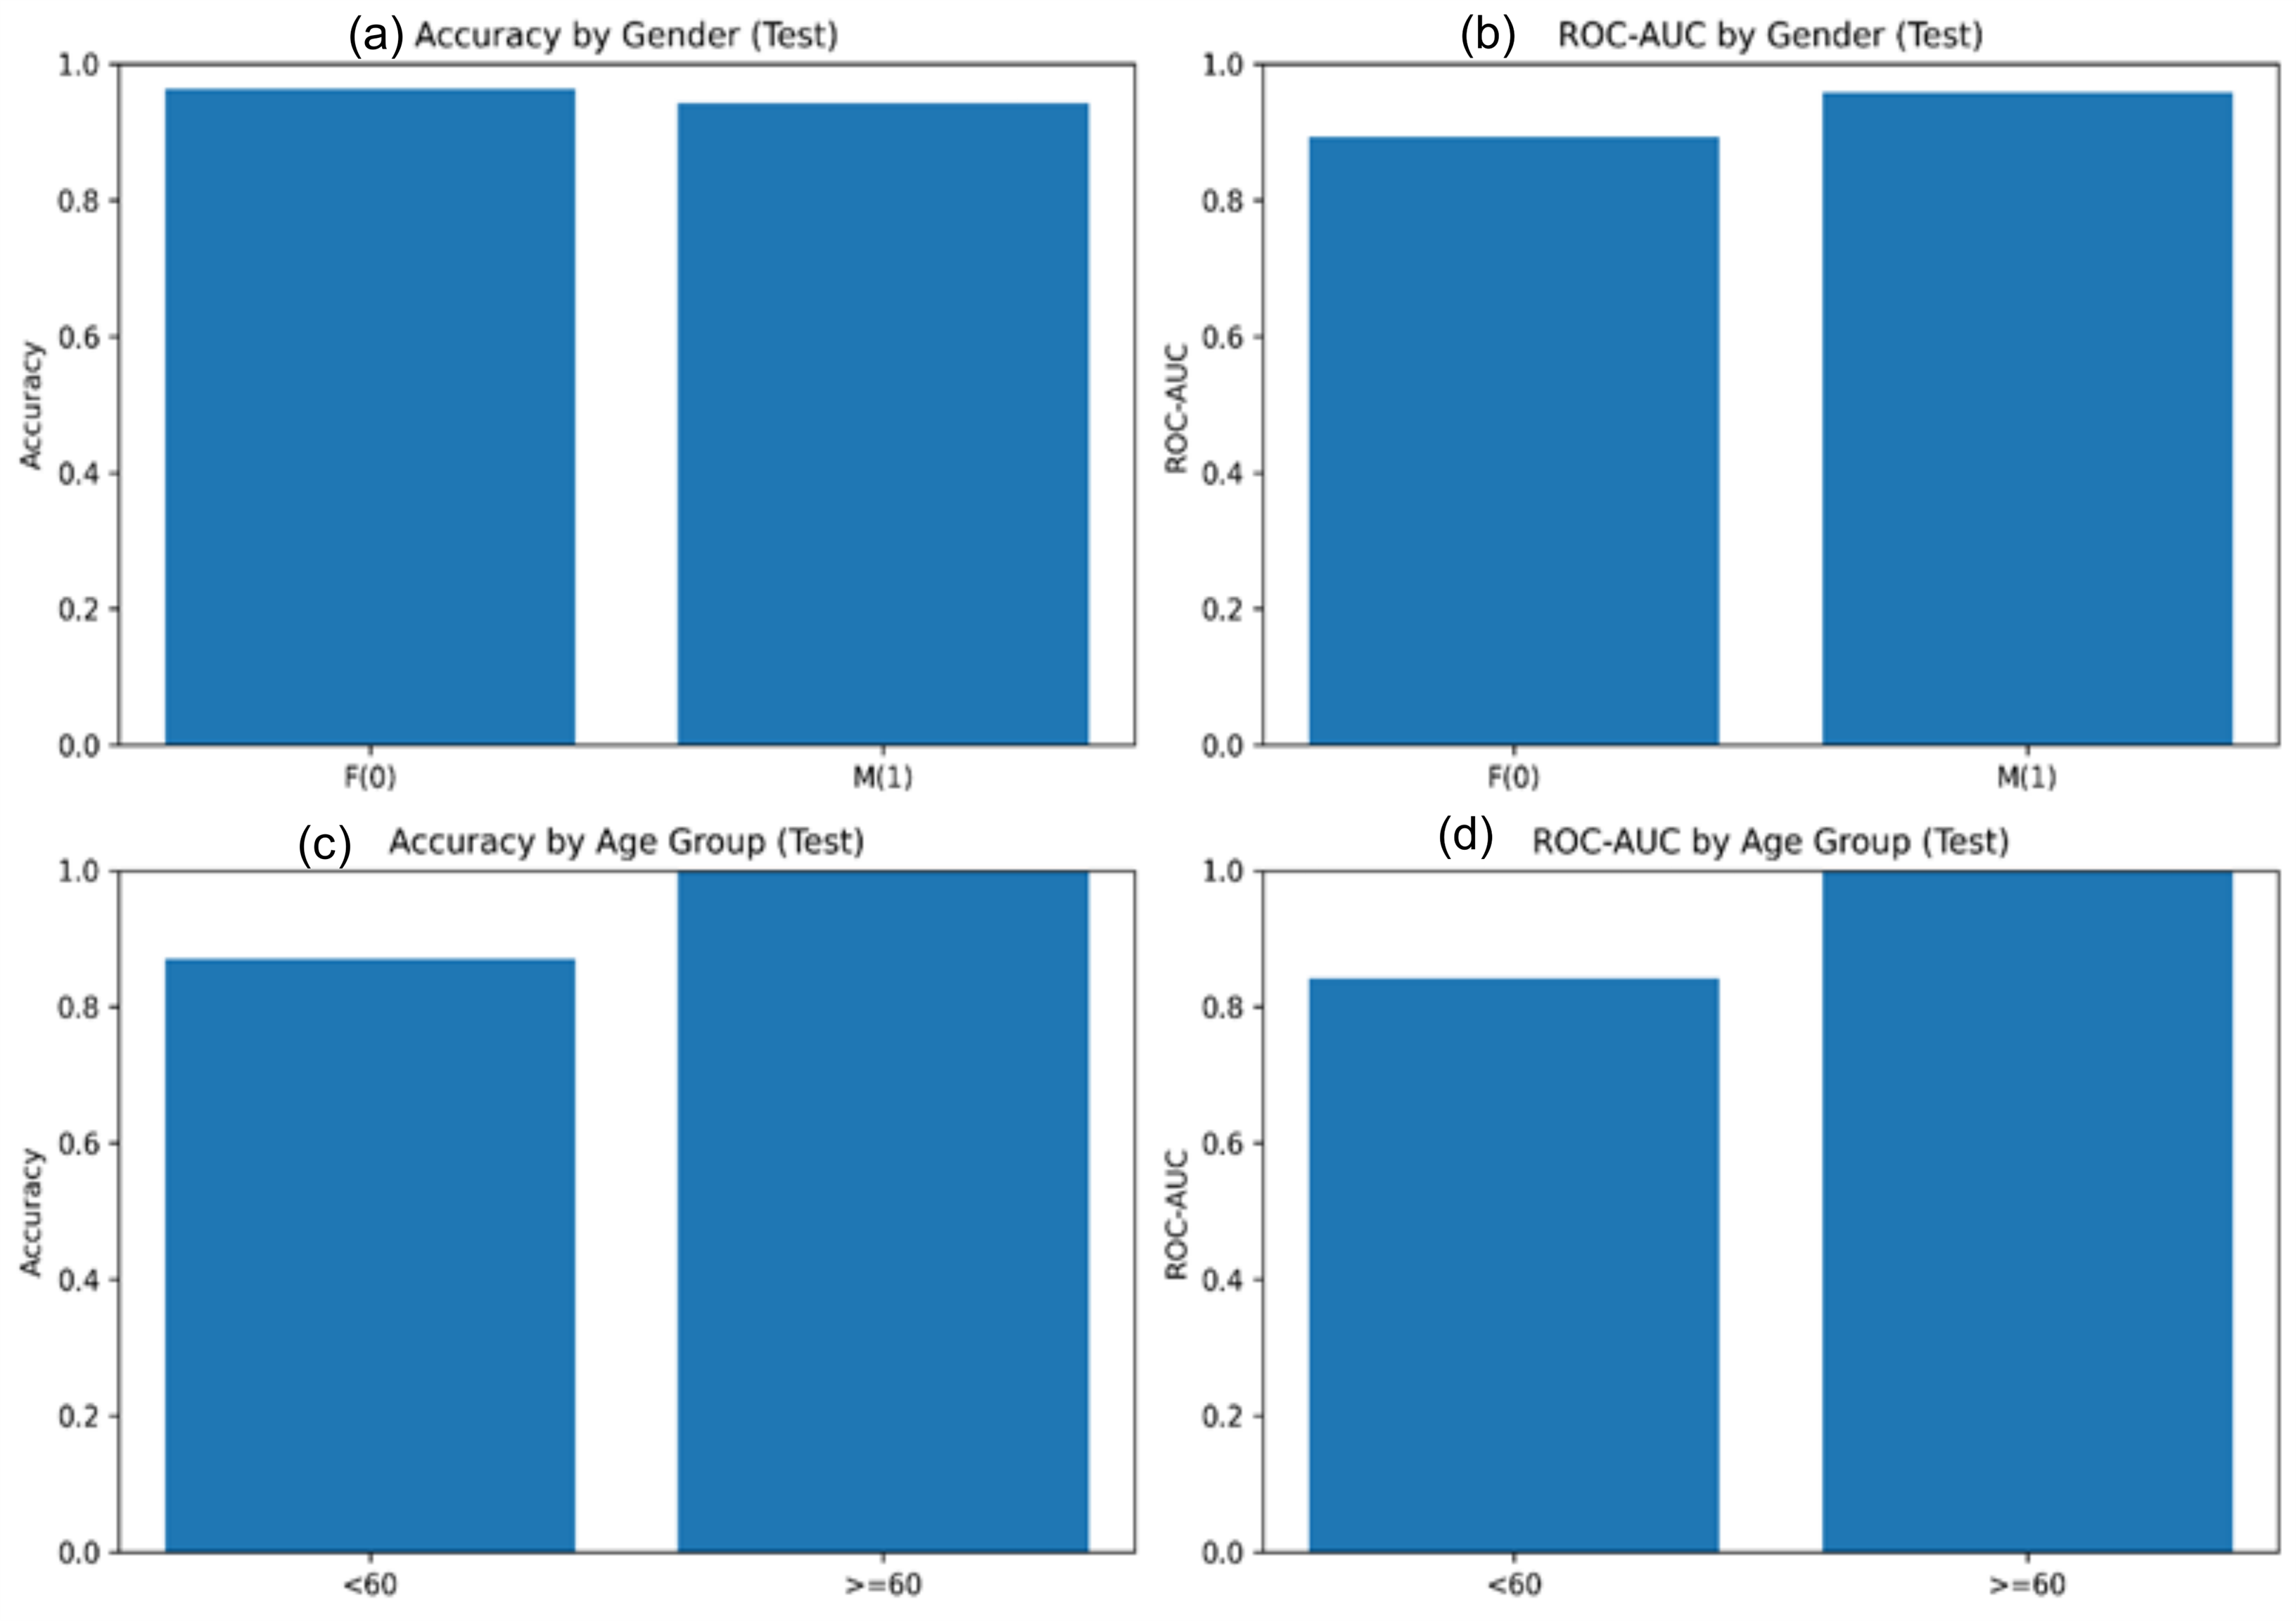
The classification results with gender stratification are shown in Figure 12a. It shows that the model achieves similar accuracy for both female (F) and male (M) subgroups, indicating no gender bias in predictive performance. The ROC-AUC values are shown in Figure 12b, which illustrates that ROC-AUC is slightly higher for males than for females, suggesting consistent discriminatory ability across genders. Accuracy across age groups is shown in Figure 12c, which indicates slightly lower accuracy for individuals under 60 years (<60) than for those 60 years and above (≥60), indicating age-related variation in performance. The ROC-AUC is shown in Figure 12d, which depicts the ROC-AUC across age groups, with higher values for older individuals (≥60), confirming the model maintains strong discrimination across age-based subgroups.

4.9. Risk Stratification Analysis

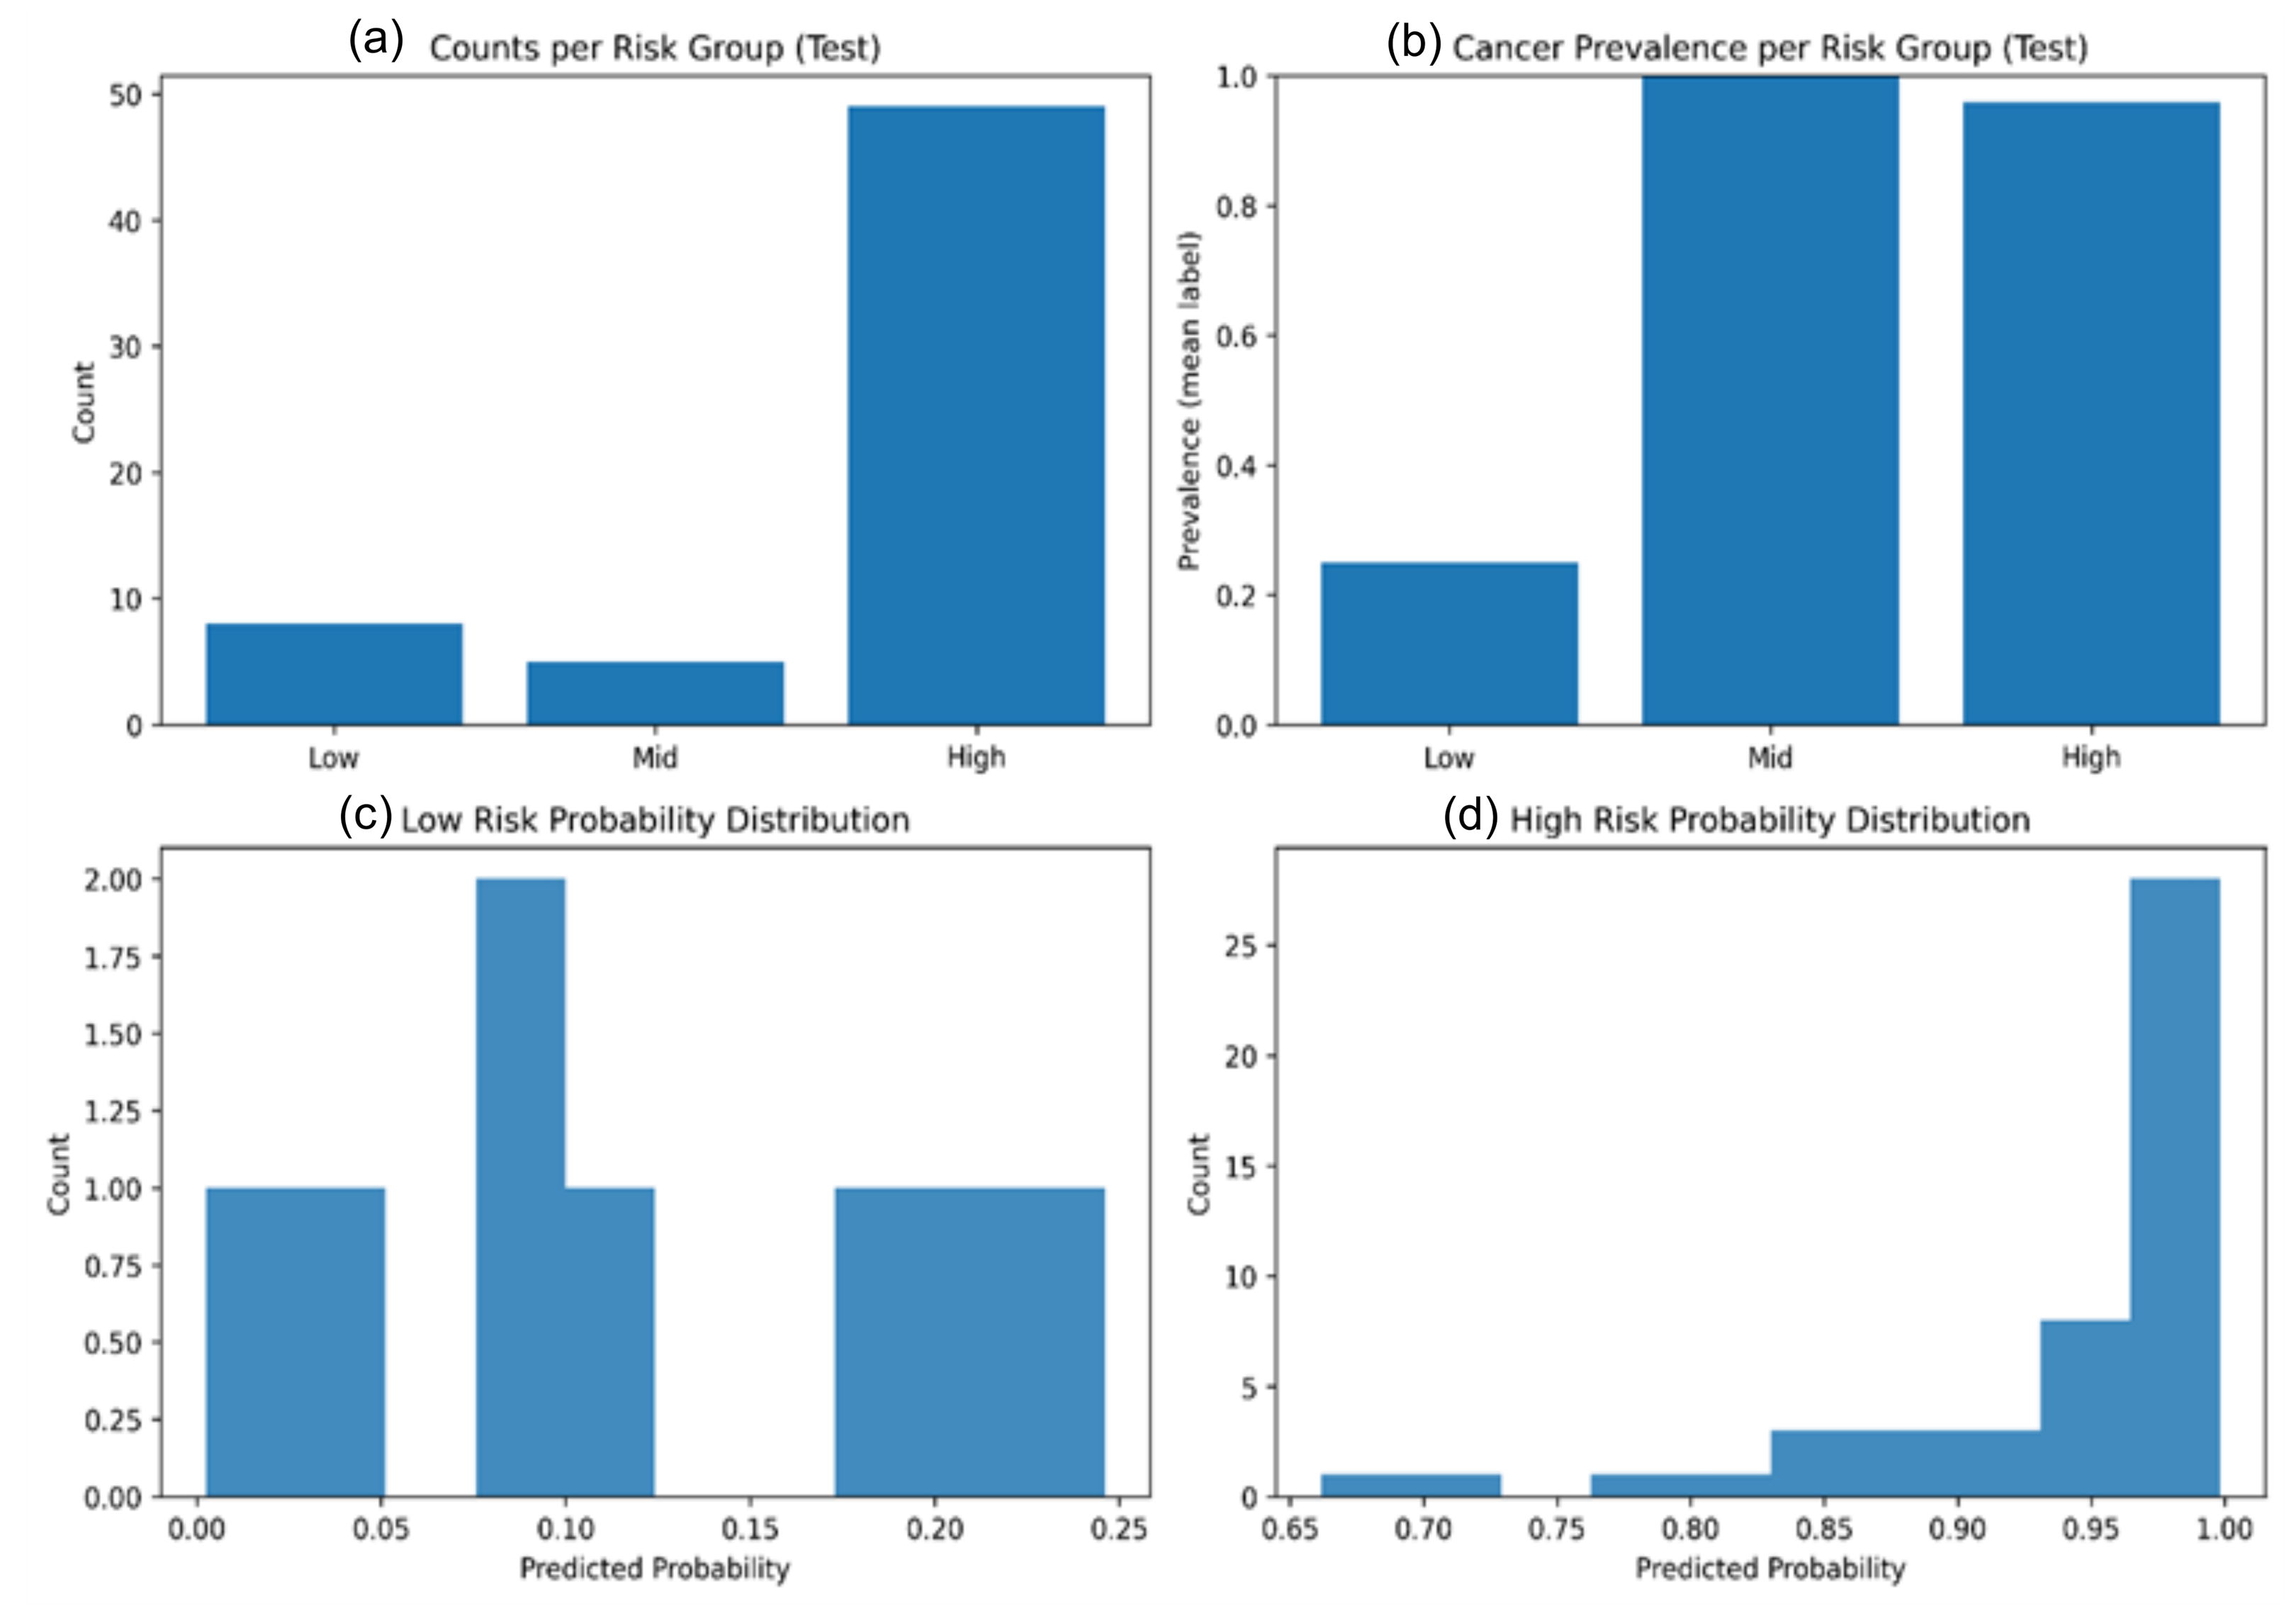
Figure 13 shows the results of risk stratification. Figure 13a presents the sample distribution of risk groups, indicating the number of samples per group in the test set. The High-risk group contains the majority of samples, while the Mid- and Low-risk groups have fewer samples. Figure 13b suggests that higher predicted risk is associated with higher cancer prevalence; cancer prevalence (mean label) is shown per risk group in the test set. The Mid- and High-risk groups show higher cancer prevalence, whereas the Low-risk group has substantially lower prevalence. Figure 13c predicted probability distribution for the Low-risk group. Most samples have low predicted probabilities, confirming the model’s correct identification of low-risk cases. Figure 13d Predicted probability distribution for the High-risk group. Most samples have high predicted probabilities, indicating accurate model classification of high-risk cases.
Practically, the high-risk group can be prioritized for screening (e.g., with LDCT) or expedited referral, while low-risk individuals can be placed on the regular follow-up or lifestyle counseling list. Such prioritization can assist in resource-limited environments by focusing on imaging capacity in the most likely benefiting group and minimizing the waiting time for high-risk cases.
Table 6 summarizes the distribution of test samples across low-, medium-, and high-risk groups, showing a clear increase in lung cancer prevalence from 22.2% in the low-risk group to 58.8% in the medium-risk group and 94.4% in the high-risk group. This gradient indicates that the model effectively stratifies patients according to their likelihood of lung cancer. Notably, the false negative rate is 0.0% across all risk groups, meaning that no cancer cases were missed in the test set, which underscores the model’s strong sensitivity and its suitability for clinical screening, where avoiding missed diagnoses is critical.
These findings reveal that the model is applicable in clinical triage, where the high-risk group accounts for most cancer-positive cases and no cases are missed. As presented in Table 7, the suggested SETI-LC framework consistently outperforms the methods reported in previous studies, which use lower accuracy or sensitivity, despite using a more conservative evaluation strategy. This comparison highlights the effectiveness of class weight-based learning and validation-based threshold optimization in enhancing clinically relevant performance.
Comparisons with previous studies should be made using various evaluation protocols. A number of available studies report results based on oversampling and cross-validation using balanced datasets, which can lead to optimistic performance estimates. On the contrary, the presented method reports findings on a strictly held-out test set, with no synthetic data generation, where conservative, clinically relevant assessment is valued.

5. Discussion

This research provides a robust machine learning model for lung cancer prediction using symptom-based survey data, with a special focus on methodological rigor, clinical relevance, and interpretability. The experimental findings indicate that ensemble-based learning with class-weighted training and validation-based decision-threshold optimization can achieve high predictive performance, even on small and imbalanced tabular datasets. CatBoost was found to be the most successful of the compared models; it has consistently demonstrated higher accuracy on the validation set and has also shown strong generalization on the test set. It is important to note that the optimized model achieved an ideal recall on the test data, removing false negatives. This is a highly desirable result for clinical screening, as missed cancer cases are much more dangerous than false alarms. The slight decrease in specificity caused by threshold optimization is a plausible trade-off. This is comparable to that observed in general practice in medical decision support systems.
The findings also indicate that the decision threshold must be optimized. With a default threshold of 0.5, a non-negligible number of false negatives were observed, and validation-based threshold selection achieved substantially better sensitivity, with only a slight loss in accuracy. This observation highlights that threshold choice is more than a post-processing matter; it is a crucial part of model implementation across unequal clinical practices. Explainability analyses show that clinically meaningful respiratory symptoms, including coughing, wheezing, and difficulty swallowing, are the main determinants of the model. The fact that the feature ranking of importance aligns with known clinical knowledge reinforces the belief in the model’s consistency and interpretability. Furthermore, risk-stratification analysis indicates that most cancer-positive cases fall into the high-risk category, which justifies the possible usefulness of the proposed approach to the triage and prioritization of screening processes in the real world.
Despite these assets, there are several limitations that must be noted. The data used in this research are limited and based on self-reported survey data, which can be biased. Moreover, the group is highly imbalanced by class and might not accurately reflect the rest of the population. Although the research included rigorous validation and robustness studies, there must be external validation using independent datasets to assess generalizability across different clinical settings.

6. Conclusions and Future Work

In this work, we created and tested an ensemble-based machine learning network to predict lung cancer using non-invasive survey-based symptom data. The proposed methodology uses class-weighted learning, validation-based model selection, and decision-threshold optimization, enabling it to achieve high predictive accuracy and optimal sensitivity on unseen test data. The thorough analyses, such as calibration assessment, subgroup evaluation, explainability, and risk stratification, indicate the strength of the model and its clinical significance. The findings suggest that machine learning (based on symptoms) can be a valuable adjunct to the current screening strategy, especially in low-resource settings or screening settings where imaging is not readily accessible. The focus on interpretability and error analysis leads to increased transparency and makes its use in clinical practice possible.
This research has several limitations. First, the sample is quite limited and consists of self-reported survey data, which can introduce reporting bias. Second, independent cohort validation could not be conducted because no similar publicly accessible datasets on symptoms were available. Third, the optimization of the decision threshold was conducted based on validation accuracy, but other clinically based optimization criteria might be more suitable for a particular deployment. These shortcomings encourage future research on larger datasets and external validation, as well as uncertainty-sensitive assessment.
Future research will center on testing the suggested framework on larger and more diverse datasets, testing its robustness in repeated sampling strategies, and investigating clinically informed threshold optimization criteria. The next step will be to establish the accuracy of the proposed framework on larger datasets and across multiple centers, and to integrate other clinical variables, including longitudinal symptom progression and medical history. It is also critical to incorporate the model into a future clinical decision support system and to assess its practical implications for screening efficiency and patient outcomes. Lastly, further research is needed to examine hybrid models that integrate survey data with imaging or biomarker data to enhance predictive performance and clinical utility.

Funding

The author gratefully acknowledges the financial support provided by Arab Open University, Oman, through the Internal Research Funding Program (Project ID: AOU/FCS/2025/1).

Institutional Review Board Statement

Not applicable.

Informed Consent Statement

Not applicable.

Data Availability Statement

Data and code are available in the author’s Kaggle repository for research use [28].

Conflicts of Interest

The author declares no conflicts of interest.

References

  1. Siegel, R.L.; Miller, K.D.; Jemal, A. Cancer statistics, 2018. CA A Cancer J. Clin. 2018, 68, 7–30. [Google Scholar] [CrossRef] [Scilit]
  2. Wilson, B.E.; Wright, K.; Sengar, M.; Sullivan, R.; Pearson, S.-A.; Barton, M.B.; Gyawali, B.; De Vries, E.; Moja, L.; Pramesh, C.S.; et al. Analysis of 2023 World Health Organization cancer Essential Medicines List and concordance with resource-stratified guidelines. JNCI J. Natl. Cancer Inst. 2025, 117, djaf100. [Google Scholar] [CrossRef] [Scilit]
  3. N.L.S.T.R. Team. Reduced lung-cancer mortality with low-dose computed tomographic screening. N. Engl. J. Med. 2011, 365, 395–409. [Google Scholar] [CrossRef] [Scilit]
  4. Aberle, D.R.; Adams, A.M.; Berg, C.D.; Black, W.C.; Clapp, J.D.; Fagerstrom, R.M.; Gareen, I.F.; Gatsonis, C.; Marcus, P.M. Results of the two incidence screenings in the National Lung Screening Trial. N. Engl. J. Med. 2013, 369, 920–931. [Google Scholar] [CrossRef] [Scilit] [PubMed]
  5. Topol, E. Deep Medicine: How Artificial Intelligence Can Make Healthcare Human Again; Basic Books: Hachette UK, 2019. [Google Scholar]
  6. Abdullah, D.M.; Abdulazeez, A.M.; Sallow, A.B. Lung cancer prediction and classification based on correlation selection method using machine learning techniques. Qubahan Acad. J. 2021, 1, 141–149. [Google Scholar] [CrossRef] [Scilit]
  7. Dutta, B. Comparative Analysis of Machine Learning and Deep Learning Models for Lung Cancer Prediction Based on Symptomatic and Lifestyle Features. Appl. Sci. 2025, 15, 4507. [Google Scholar] [CrossRef] [Scilit]
  8. Chicco, D.; Jurman, G. The advantages of the Matthews correlation coefficient (MCC) over F1 score and accuracy in binary classification evaluation. BMC Genom. 2020, 21, 6. [Google Scholar] [CrossRef] [Scilit]
  9. Lever, J.; Krzywinski, M.; Altman, N. Points of significance: Classification evaluation. Nat. Methods 2016, 13, 603–604. [Google Scholar] [CrossRef] [Scilit]
  10. He, H.; Garcia, E.A. Learning from imbalanced data. IEEE Trans. Knowl. Data Eng. 2009, 21, 1263–1284. [Google Scholar] [CrossRef] [Scilit]
  11. Japkowicz, N.; Stephen, S. The class imbalance problem: A systematic study. Intell. Data Anal. 2002, 6, 429–449. [Google Scholar] [CrossRef] [Scilit]
  12. Fawcett, T. An introduction to ROC analysis. Pattern Recognit. Lett. 2006, 27, 861–874. [Google Scholar] [CrossRef] [Scilit]
  13. Prokhorenkova, L.; Gusev, G.; Vorobev, A.; Dorogush, A.V.; Gulin, A. CatBoost: Unbiased boosting with categorical features. In Advances in Neural Information Processing Systems, Proceedings of the Annual Conference on Neural Information Processing Systems Montreal, QC, Canada, 3–8 December2018; NeurIPS: Red Hook, NY, USA, 2018; Volume 31. [Google Scholar]
  14. Peto, R.; Darby, S.; Deo, H.; Silcocks, P.; Whitley, E.; Doll, R. Smoking, smoking cessation, and lung cancer in the UK since 1950: Combination of national statistics with two case-control studies. Br. Med. J. 2000, 321, 323–329. [Google Scholar] [CrossRef] [Scilit]
  15. Cox, D.R. Regression models and life-tables. J. R. Stat. Soc. Ser. B (Methodol.) 1972, 34, 187–202. [Google Scholar] [CrossRef] [Scilit]
  16. Tammemägi, M.C.; Katki, H.A.; Hocking, W.G.; Church, T.R.; Caporaso, N.; Kvale, P.A.; Chaturvedi, A.K.; Silvestri, G.A.; Riley, T.L.; Commins, J.; et al. Selection criteria for lung-cancer screening. N. Engl. J. Med. 2013, 368, 728–736. [Google Scholar] [CrossRef] [Scilit]
  17. Mohanambal, K.; Nirosha, Y.; Roshini, E.O.; Punitha, S.; Shamini, M. Lung cancer detection using machine learning techniques. Int. J. Adv. Res. Electr. Electron. Instrum. Eng. 2019, 8, 266–271. [Google Scholar]
  18. Al-Ameer, A.A.A.; Hussien, G.A.; Al Ameri, H.A. Lung cancer detection using image processing and deep learning. Indones. J. Electr. Eng. Comput. Sci 2022, 28, 987–993. [Google Scholar] [CrossRef] [Scilit]
  19. Dietterich, T.G. Ensemble methods in machine learning. In Proceedings of the International Workshop on Multiple Classifier Systems, Cagliari, Italy, 21–23 June 2000; pp. 1–15. [Google Scholar]
  20. Hussain, L.; Almaraashi, M.S.; Aziz, W.; Habib, N.; Abbasi, S.-U.-R.S. Machine learning-based lung cancer detection using reconstruction independent component analysis and sparse filter features. Waves Random Complex Media 2024, 34, 226–251. [Google Scholar] [CrossRef] [Scilit]
  21. Litjens, G.; Kooi, T.; Bejnordi, B.E.; Setio, A.A.A.; Ciompi, F.; Ghafoorian, M.; Van Der Laak, J.A.; Van Ginneken, B.; Sánchez, C.I. A survey on deep learning in medical image analysis. Med. Image Anal. 2017, 42, 60–88. [Google Scholar] [CrossRef] [Scilit] [PubMed]
  22. Chawla, N.V.; Bowyer, K.W.; Hall, L.O.; Kegelmeyer, W.P. SMOTE: Synthetic minority over-sampling technique. J. Artif. Intell. Res. 2002, 16, 321–357. [Google Scholar] [CrossRef] [Scilit]
  23. Yang, Z.; Liu, N.; Hu, X.B.; Jin, F. Tutorial on deep learning interpretation: A data perspective. In Proceedings of the 31st ACM International Conference on Information & Knowledge Management, Atlanta, GA, USA, 17–21 October 2022; pp. 5156–5159. [Google Scholar]
  24. Nemlander, E.; Rosenblad, A.; Abedi, E.; Ekman, S.; Hasselström, J.; Eriksson, L.E.; Carlsson, A.C. Lung cancer prediction using machine learning on data from a symptom e-questionnaire for never smokers, formers smokers and current smokers. PLoS ONE 2022, 17, e0276703. [Google Scholar] [CrossRef] [Scilit]
  25. Nabeel, S.M.; Bazai, S.U.; Alasbali, N.; Liu, Y.; Ghafoor, M.I.; Khan, R.; Ku, C.S.; Yang, J.; Shahab, S.; Por, L.Y. Optimizing lung cancer classification through hyperparameter tuning. Digit. Health 2024, 10, 20552076241249661. [Google Scholar] [CrossRef] [Scilit] [PubMed]
  26. Dritsas, E.; Trigka, M. Lung cancer risk prediction with machine learning models. Big Data Cogn. Comput. 2022, 6, 139. [Google Scholar] [CrossRef] [Scilit]
  27. Lundberg, S.M.; Lee, S.-I. A unified approach to interpreting model predictions. In Advances in Neural Information Processing Systems, Proceedings of the Annual Conference on Neural Information Processing Systems, Long Beach, CA, USA, 4–9 December 2017; NeurIPS: Red Hook, NY, USA, 2017; Volume 30. [Google Scholar]
  28. Husaini, Y.N.A. Lung Cancer Survey Dataset. Kaggle. 2025. Available online: https://www.kaggle.com/code/oman0086/stbased-lung-cancer (accessed on 2 December 2025).
  29. Mamun, M.; Farjana, A.; Al Mamun, M.; Ahammed, M.S. Lung cancer prediction model using ensemble learning techniques and a systematic review analysis. In Proceedings of the 2022 IEEE World AI IoT Congress (AIIoT), Seattle, WAS, USA, 6–9 June 2022; pp. 187–193. [Google Scholar]
  30. Vieira, E.; Ferreira, D.; Neto, C.; Abelha, A.; Machado, J. Data mining approach to classify cases of lung cancer. In Proceedings of the World Conference on Information Systems and Technologies, Azores, Portugal, 30 March–1 April 2021; pp. 511–521. [Google Scholar]
  31. Maurya, S.P.; Sisodia, P.S.; Mishra, R.; Singh, D.P. Performance of machine learning algorithms for lung cancer prediction: A comparative approach. Sci. Rep. 2024, 14, 18562. [Google Scholar] [CrossRef] [Scilit] [PubMed]
Figure 1. Proposed machine learning pipeline for lung cancer prediction.
Information 17 00172 g001
Figure 2. Class distribution of the lung cancer survey dataset.
Information 17 00172 g002
Figure 3. Visualization of class imbalance in the dataset.
Information 17 00172 g003
Figure 4. Decision threshold optimization on the validation set, where #1 and #2 indicate the first and second most important features identified by the model.
Information 17 00172 g004
Figure 5. Comparative validation performance of candidate ensemble models.
Information 17 00172 g005
Figure 6. (a) Validation accuracy vs. decision threshold. (b) Precision–recall vs. decision threshold.
Information 17 00172 g006
Figure 7. Test-set evaluation of the proposed SETI-LC framework.
Information 17 00172 g007
Figure 8. Error analysis of the proposed model.
Information 17 00172 g008
Figure 9. Model explainability analysis showing feature importance.
Information 17 00172 g009
Figure 10. Calibration and reliability analysis, (a) calibration curve comparing mean predicted probabilities with the observed fraction of positives; (b) distribution of predicted probabilities.
Information 17 00172 g010
Figure 11. Threshold sensitivity analysis, (a) variation of test accuracy across different decision thresholds; (b) sensitivity and specificity as functions of the decision threshold.
Information 17 00172 g011
Figure 12. Subgroup performance analysis across gender and age groups indicates consistent model behavior.
Information 17 00172 g012
Figure 13. Risk stratification analysis illustrating sample distribution.
Information 17 00172 g013
Table 1. The variable encoding scheme and handling of missing values.
VariableActualEncodedMissing-Entry Treatment
LUNG_CANCER (target)“YES”, “NO”NO → 0, YES → 1The released dataset contained no missing entries; nevertheless, the pipeline includes checks to drop missing targets and impute missing predictors using the training-set median 
AGEnumeric (years)kept numeric (no recoding)
GENDERcategorical (Male/Female)Male → 1, Female → 0
SMOKING{1, 2} (survey code)1 → 0 (No), 2 → 1 (Yes)
All other variables{1, 2}1 → 0, 2 → 1
Table 2. CatBoost performance summary (mean ± std over 5 seeds).
DatasetAccuracyROC-AUCPrecisionRecallF1-ScoreSpecificity
Validation0.9516 ± 0.840.9375 ± 0.960.943 ± 1.020.981 ± 0.730.962 ± 0.810.625 ± 4.21
Test0.9516 ± 0.910.9375 ± 1.030.9474 ± 1.181.0000 ± 0.000.9730 ± 0.740.6250 ± 4.12
Table 3. Default vs optimized threshold comparison (test set).
ThresholdAccuracyPrecisionRecallF1-ScoreFN Count
0.50 (default)0.88710.96360.88890.92546
0.19 (optimized)0.95160.94741.00000.97300
Table 4. Error breakdown on test set.
Error TypeCountRate (%)
True Positive (TP)5487.1
True Negative (TN)58.1
False Positive (FP)34.8
False Negative (FN)00.0
Table 5. Feature importance with direction of effect.
RankFeatureImportance ValueEffect Direction
1Coughing0.184↑ increases risk
2Wheezing0.162↑ increases risk
3Alcohol Consumption0.109↑ increases risk
4Swallowing Difficulty0.093↑ increases risk
5Allergy0.071↑ increases risk
“↑” indicates increased risk.
Table 6. Risk group statistics (test set).
Risk GroupNCancer Prevalence (%)FN Rate (%)
Low922.20.0
Medium1758.80.0
High3694.40.0
Table 7. Comparison with state-of-the-art methods on the lung cancer survey dataset.
Ref.Dataset/Protocol (as Reported)Best Model ReportedAccuracy (%)ROC-AUC (%)Precision (%)Recall/Sensitivity (%)F1-Score (%)Specificity (%)
[29]Lung Cancer Survey (309); SMOTE + 10-fold CVXGBoost94.4298.1495.6694.4694.74
[30]Lung Cancer Survey (reported); protocol not fully specified in excerptANN93.0091.0096.0090.00 
[31]Small “binary characteristics” dataset; best accuracy reported as 92.86%KNN92.86
Proposed (SETI-LC):
Lung Cancer Survey (309); stratified 60/20/20; class weights; threshold optimized
CatBoost 95.16 93.7594.7498.997.3062.50
Disclaimer/Publisher’s Note: The statements, opinions and data contained in all publications are solely those of the individual author(s) and contributor(s) and not of MDPI and/or the editor(s). MDPI and/or the editor(s) disclaim responsibility for any injury to people or property resulting from any ideas, methods, instructions or products referred to in the content.