Review

Decoding Technical Diagrams: A Survey of AI Methods for Image Content Extraction and Understanding

Department of Electrical and Computer Engineering, University of Nebraska-Lincoln, Lincoln, NE 68588, USA
*
Author to whom correspondence should be addressed.
Information 2026, 17(2), 165; https://doi.org/10.3390/info17020165
Submission received: 17 November 2025 / Revised: 28 January 2026 / Accepted: 3 February 2026 / Published: 6 February 2026
(This article belongs to the Special Issue Intelligent Image Processing by Deep Learning, 2nd Edition)

Abstract

With artificial intelligence (AI) rapidly increasing in popularity and presence in everyday life, new applications utilizing AI are being explored across virtually all domains, from banking and healthcare to cybersecurity to generative AI for images, voice, and video content creation. With that trend comes an inherent need for increased AI capabilities. One cornerstone of AI applications is the ability of generative AI to consume documents and utilize their content to answer questions, generate new content, correlate it with other data sources, and more. No longer constrained to text alone, we now leverage multimodal AI models to help us understand visual elements within documents, such as images, tables, figures, and charts. Within this realm, capabilities have expanded exponentially from traditional Optical Character Recognition (OCR) approaches towards increasingly utilizing complex AI models for visual content analysis and understanding. Modern approaches, especially those leveraging AI, are now focusing on interpreting more complex diagrams such as flowcharts, block diagrams, Unified Modeling Language (UML) diagrams, electrical schematics, and timing diagrams. These diagram types combine text, symbols, and structured layout, making them challenging to parse and comprehend using conventional techniques. This paper presents a historical analysis and comprehensive survey of scientific literature exploring this domain of visual understanding of complex technical illustrations and diagrams. We explore the use of deep learning models, including convolutional neural networks (CNNs), recurrent neural networks (RNNs), and transformer-based architectures. These models, along with OCR, enable the extraction of both textual and structural information from visually complex sources. Despite these advancements, numerous challenges remain, however. These range from hallucinations, where the content extraction system produces outputs not grounded in the source image, which leads to misinterpretations, to a lack of contextual understanding of diagrammatic elements, such as arrows, grouping, and spatial hierarchy. This survey focuses on five key diagram types: flowcharts, block diagrams, UML diagrams, electrical schematics, and timing diagrams. It evaluates the effectiveness, limitations, and practical solutions—both traditional and AI-driven—that aim to enable the extraction of accurate and meaningful information from complex diagrams in a way that is trustworthy and suitable for real-world, high-accuracy AI applications. This survey reveals that virtually all approaches struggle with accurately extracting technical diagram information. It also illustrates a path forward. Pursuing research to further improve their accuracy is crucial for supporting and enabling various applications, including complex document question answering and Retrieval Augmented Generation (RAG), document-driven AI agents, accessibility applications, and automation.

1. Introduction

We are experiencing the rapid proliferation of AI in our everyday lives. We can now find AI applications in virtually every domain, from virtual assistants and AI researchers to cybersecurity tools, intelligent industrial automation systems, and much more. Driven by generative AI, these tools are increasingly multi-modal. They are no longer constrained to text and can be used to generate images, videos, sounds, and voices. They can also be used to analyze multi-modal sources, such as comprehending text, summarizing image content, and intelligently editing videos. In particular, the ability to extract meaningful information from visual data has long been a central focus of computer vision research, dating back to traditional algorithmic OCR methods. Initially, OCR was developed to recognize typed or handwritten text in scanned documents, converting them from pixel-based images into machine-readable formats, such as plain text, source code, and formatted text. Robotics applications have pushed the boundaries of what computer vision algorithms can achieve, but they have always been limited by the capabilities of the underlying algorithms.
In recent years, the rise of artificial intelligence and machine learning has led to significant advancements across many fields, including image content analysis. While traditional OCR was limited to structured, text-heavy inputs, such as books, forms, or printed documents, modern deep learning techniques have been introduced that can support more complex visual data.
One particular emerging application domain for AI image analysis is the automation of extracting complex descriptions of both text and structure from technical diagrams and other technical illustrations. These types of illustrations are commonly found in engineering, software development, and electronics, and contain a mixture of textual, symbolic, and graphical elements. Increasingly, AI models are being used to extract not only the textual content but also vital structural and relational information from these diagrams, enabling greater automation, analysis, and digital transformation. This capability is critical for applications such as RAG [1], where large language models (LLMs) are used together with information extracted from documents to answer specific questions related to these documents. For any RAG pipeline, it is critically important to capture all content of the provided documents, not just their textual aspects. It also greatly aids in question-answering processes, enabling the generation of full and accurate answers to user questions by extracting relevant text and visual information from technical documents. This also supports accessibility applications, such as screen readers, in accurately describing visual content, as well as many sophisticated and AI-driven automation applications. Thus, the ability to extract visual details from technical illustrations within these documents, alongside the textual content, is crucial for accurately answering user questions, informed decision-making, and more.
This image content extraction survey focuses on five specific, widely used types of technical illustrations: flowcharts, block diagrams, UML diagrams, electrical schematics, and timing diagrams. For analysis purposes, block diagrams and UML diagrams are grouped together due to their shared structural characteristics and hierarchical representation approaches. These diagram types are important elements in technical documentation, user guides, network protocol specifications, software and algorithm documentations, and many other types of documents crucial to virtually all scientific fields and end-user applications. Our aim for this survey is to provide an overview of the current state-of-the-art in image content analysis for technical illustrations, including their current capabilities, shortcomings, and suggested areas of further research.
From a conceptual standpoint, many diagram-understanding approaches can be viewed as structured prediction problems, where an input image is mapped to a structured semantic representation, such as a graph, netlist, program, or symbolic description. In practice, however, the surveyed literature adopts a wide variety of task-specific representations and intermediate formats, reflecting differing application goals rather than a unified formalism. Accordingly, this survey does not impose a single mathematical definition of diagram understanding, but instead evaluates methods based on the structure, fidelity, and usability of their extracted representations.
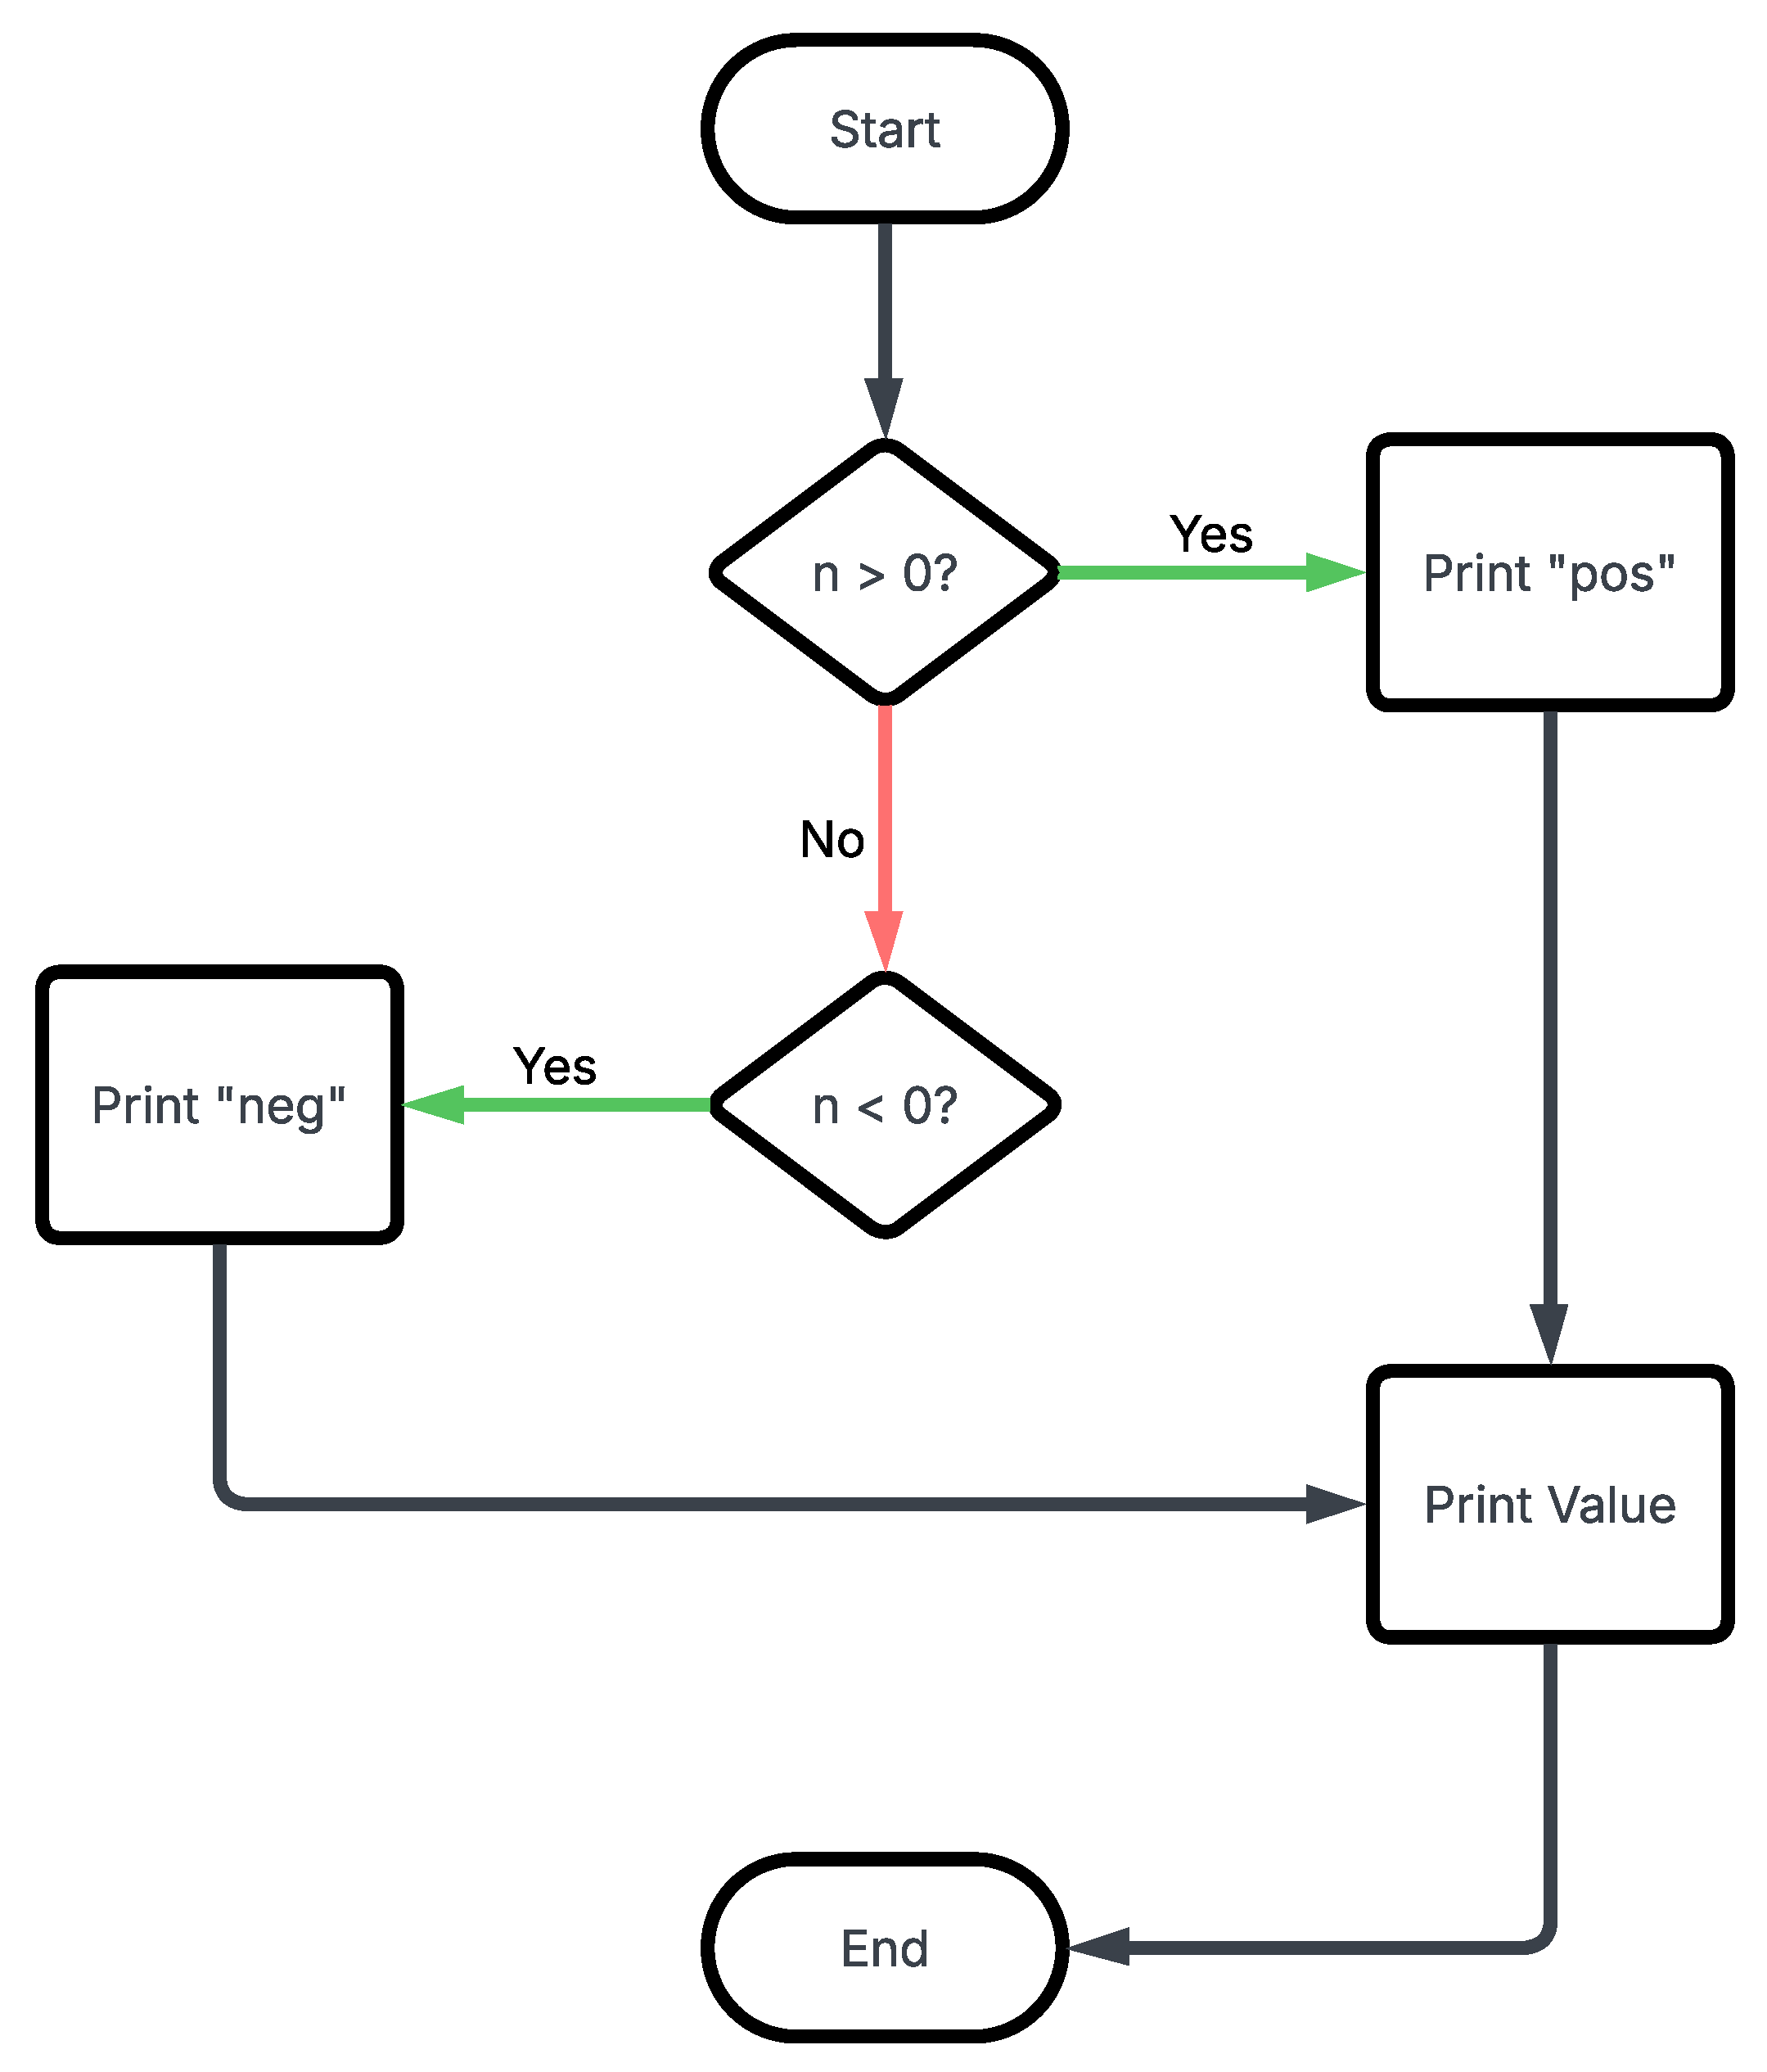
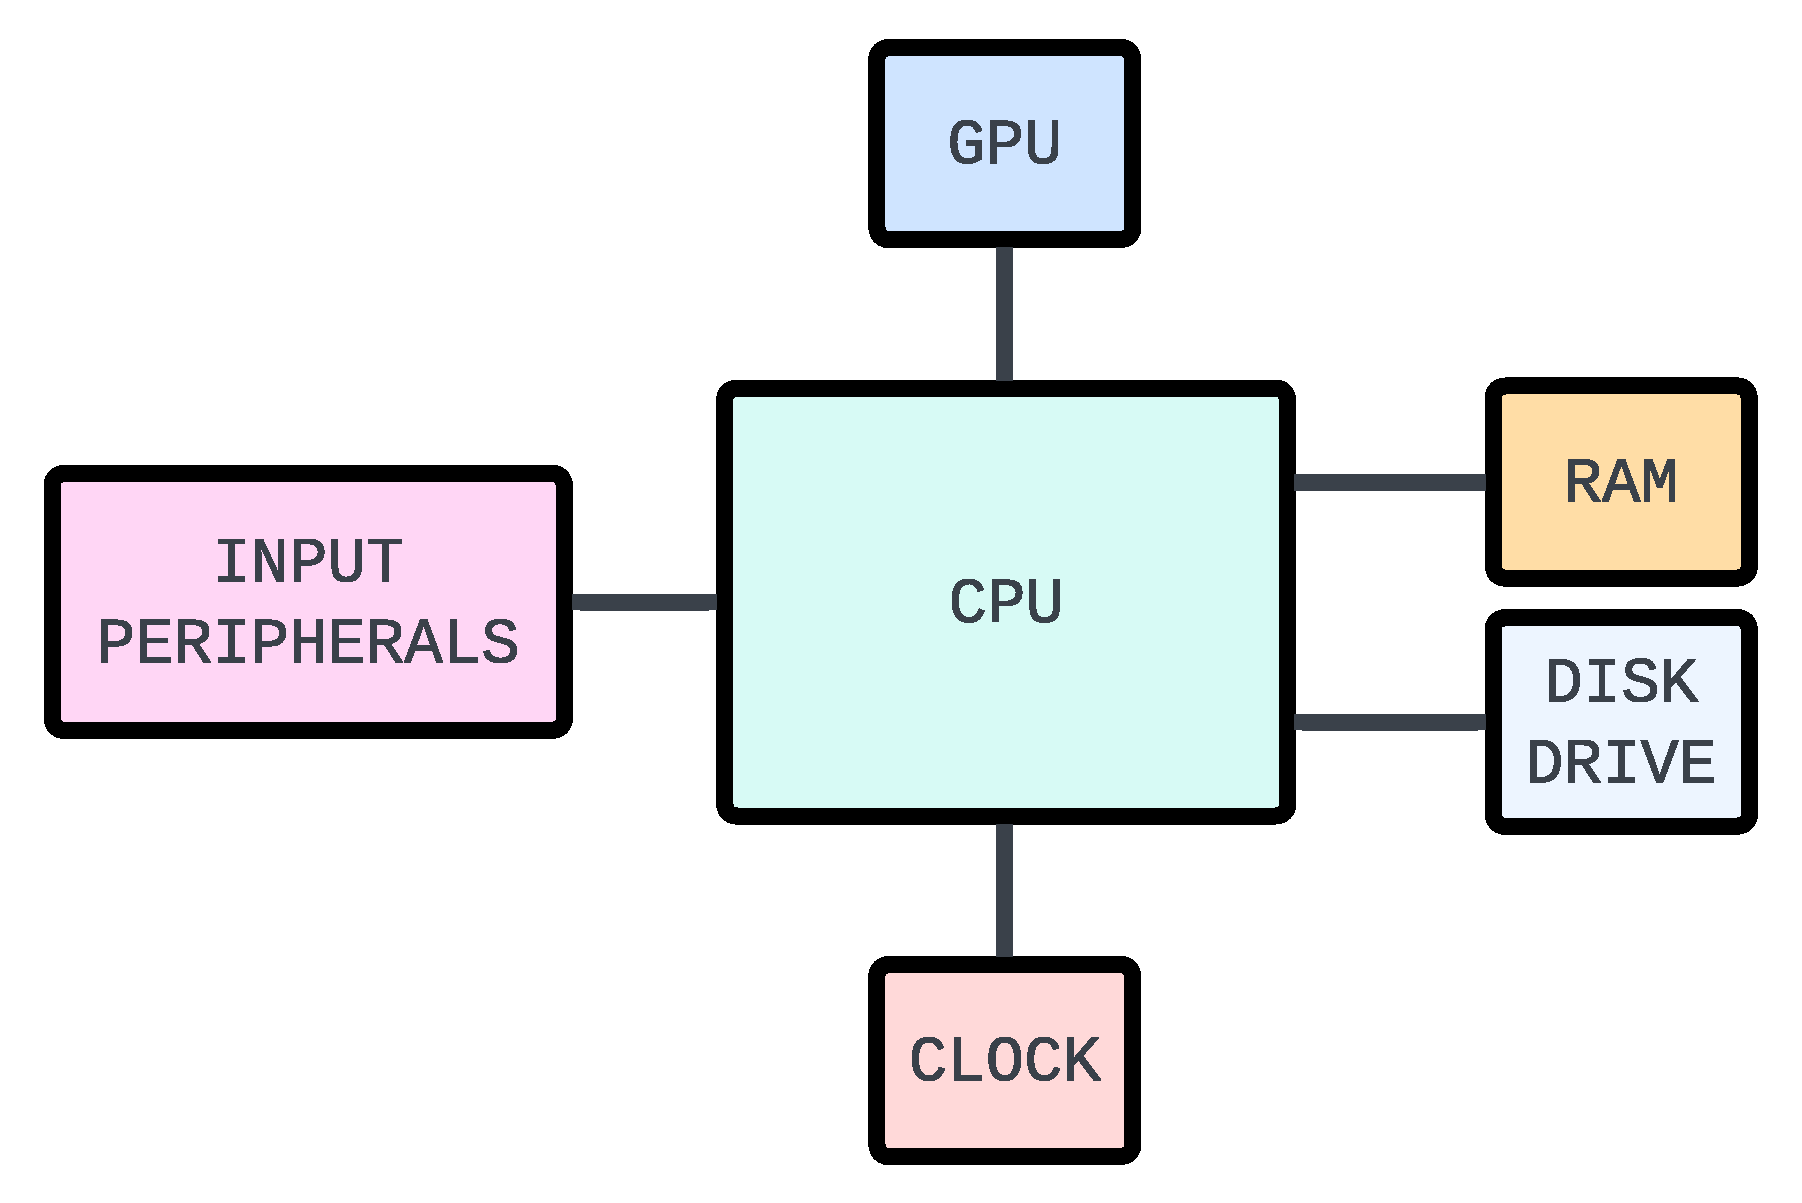
Flowcharts and block diagrams excel at representing complex systems in a clear and easy-to-understand format. They can be used to describe processes, systems, data flow, computer programs and algorithms, document structure, workflows, and decision-making. In addition, closely related to flowcharts are State Machine Diagrams and more structured forms such as swimlane flowcharts. These diagram types are widely used in fields such as engineering, electronics, and telecommunications, where systems need to be broken down into smaller components for analysis, design, and troubleshooting. Figure 1 shows a typical example of a flowchart, and a simple block diagram is shown in Figure 2.
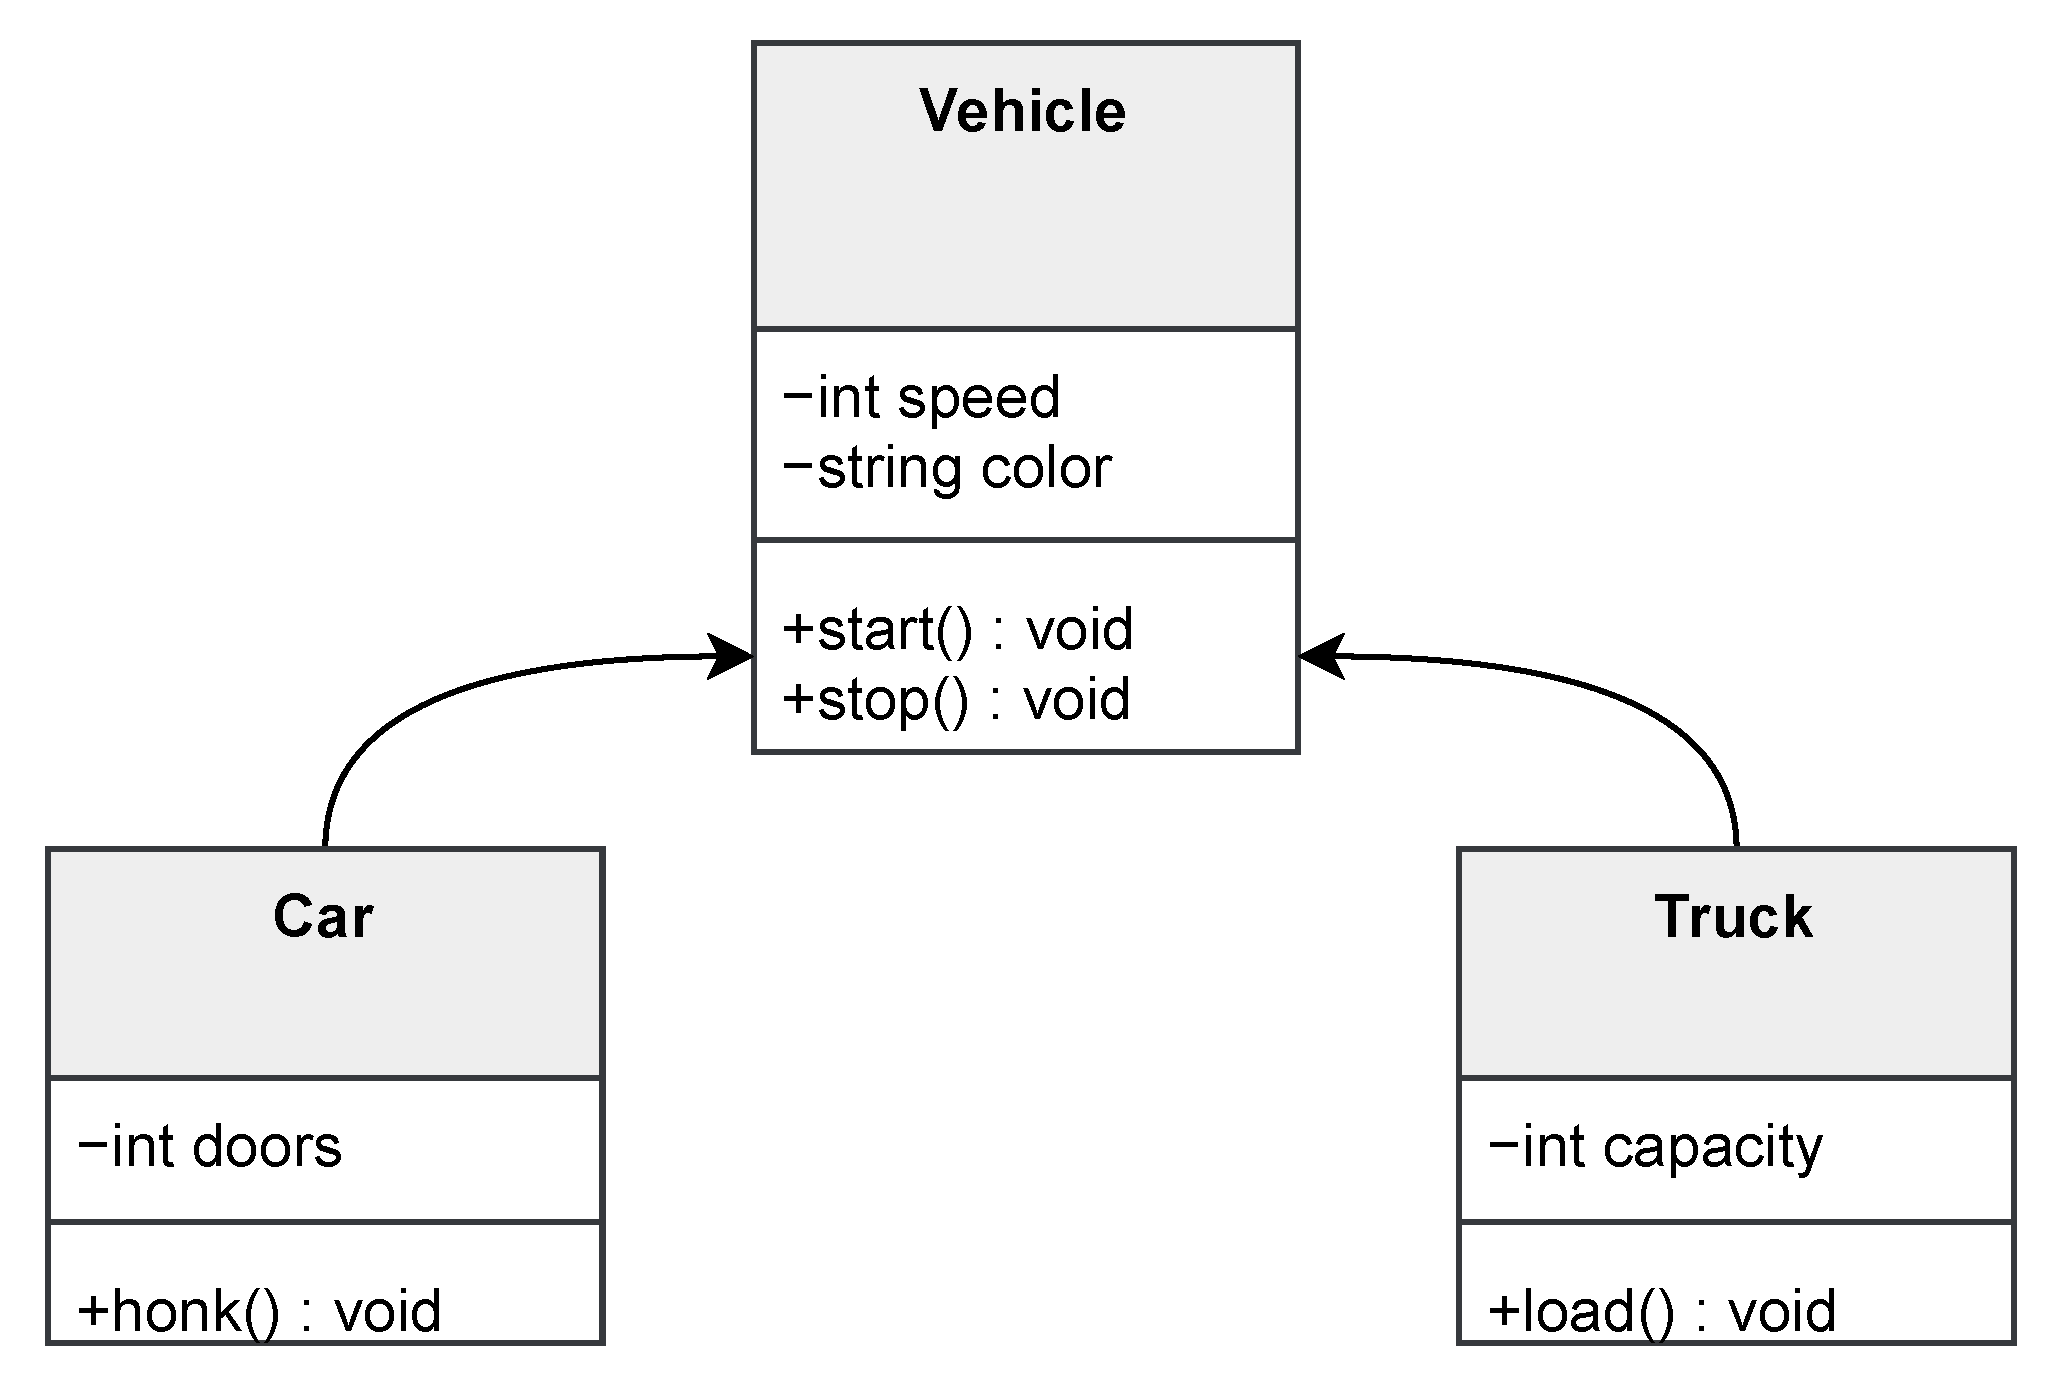
Another category of box-and-connector diagrams widely used in software engineering is UML diagrams. While block diagrams typically represent hardware and system architecture, UML diagrams model software structure and behavior. Despite their different application domains, both diagram types share similar visual characteristics—boxes connected by lines—and thus present comparable challenges for content extraction. From a computer vision perspective, both require detecting rectangular shapes, extracting embedded text, identifying connecting lines and their directionality, and understanding spatial relationships. Figure 3 shows a basic UML diagram.
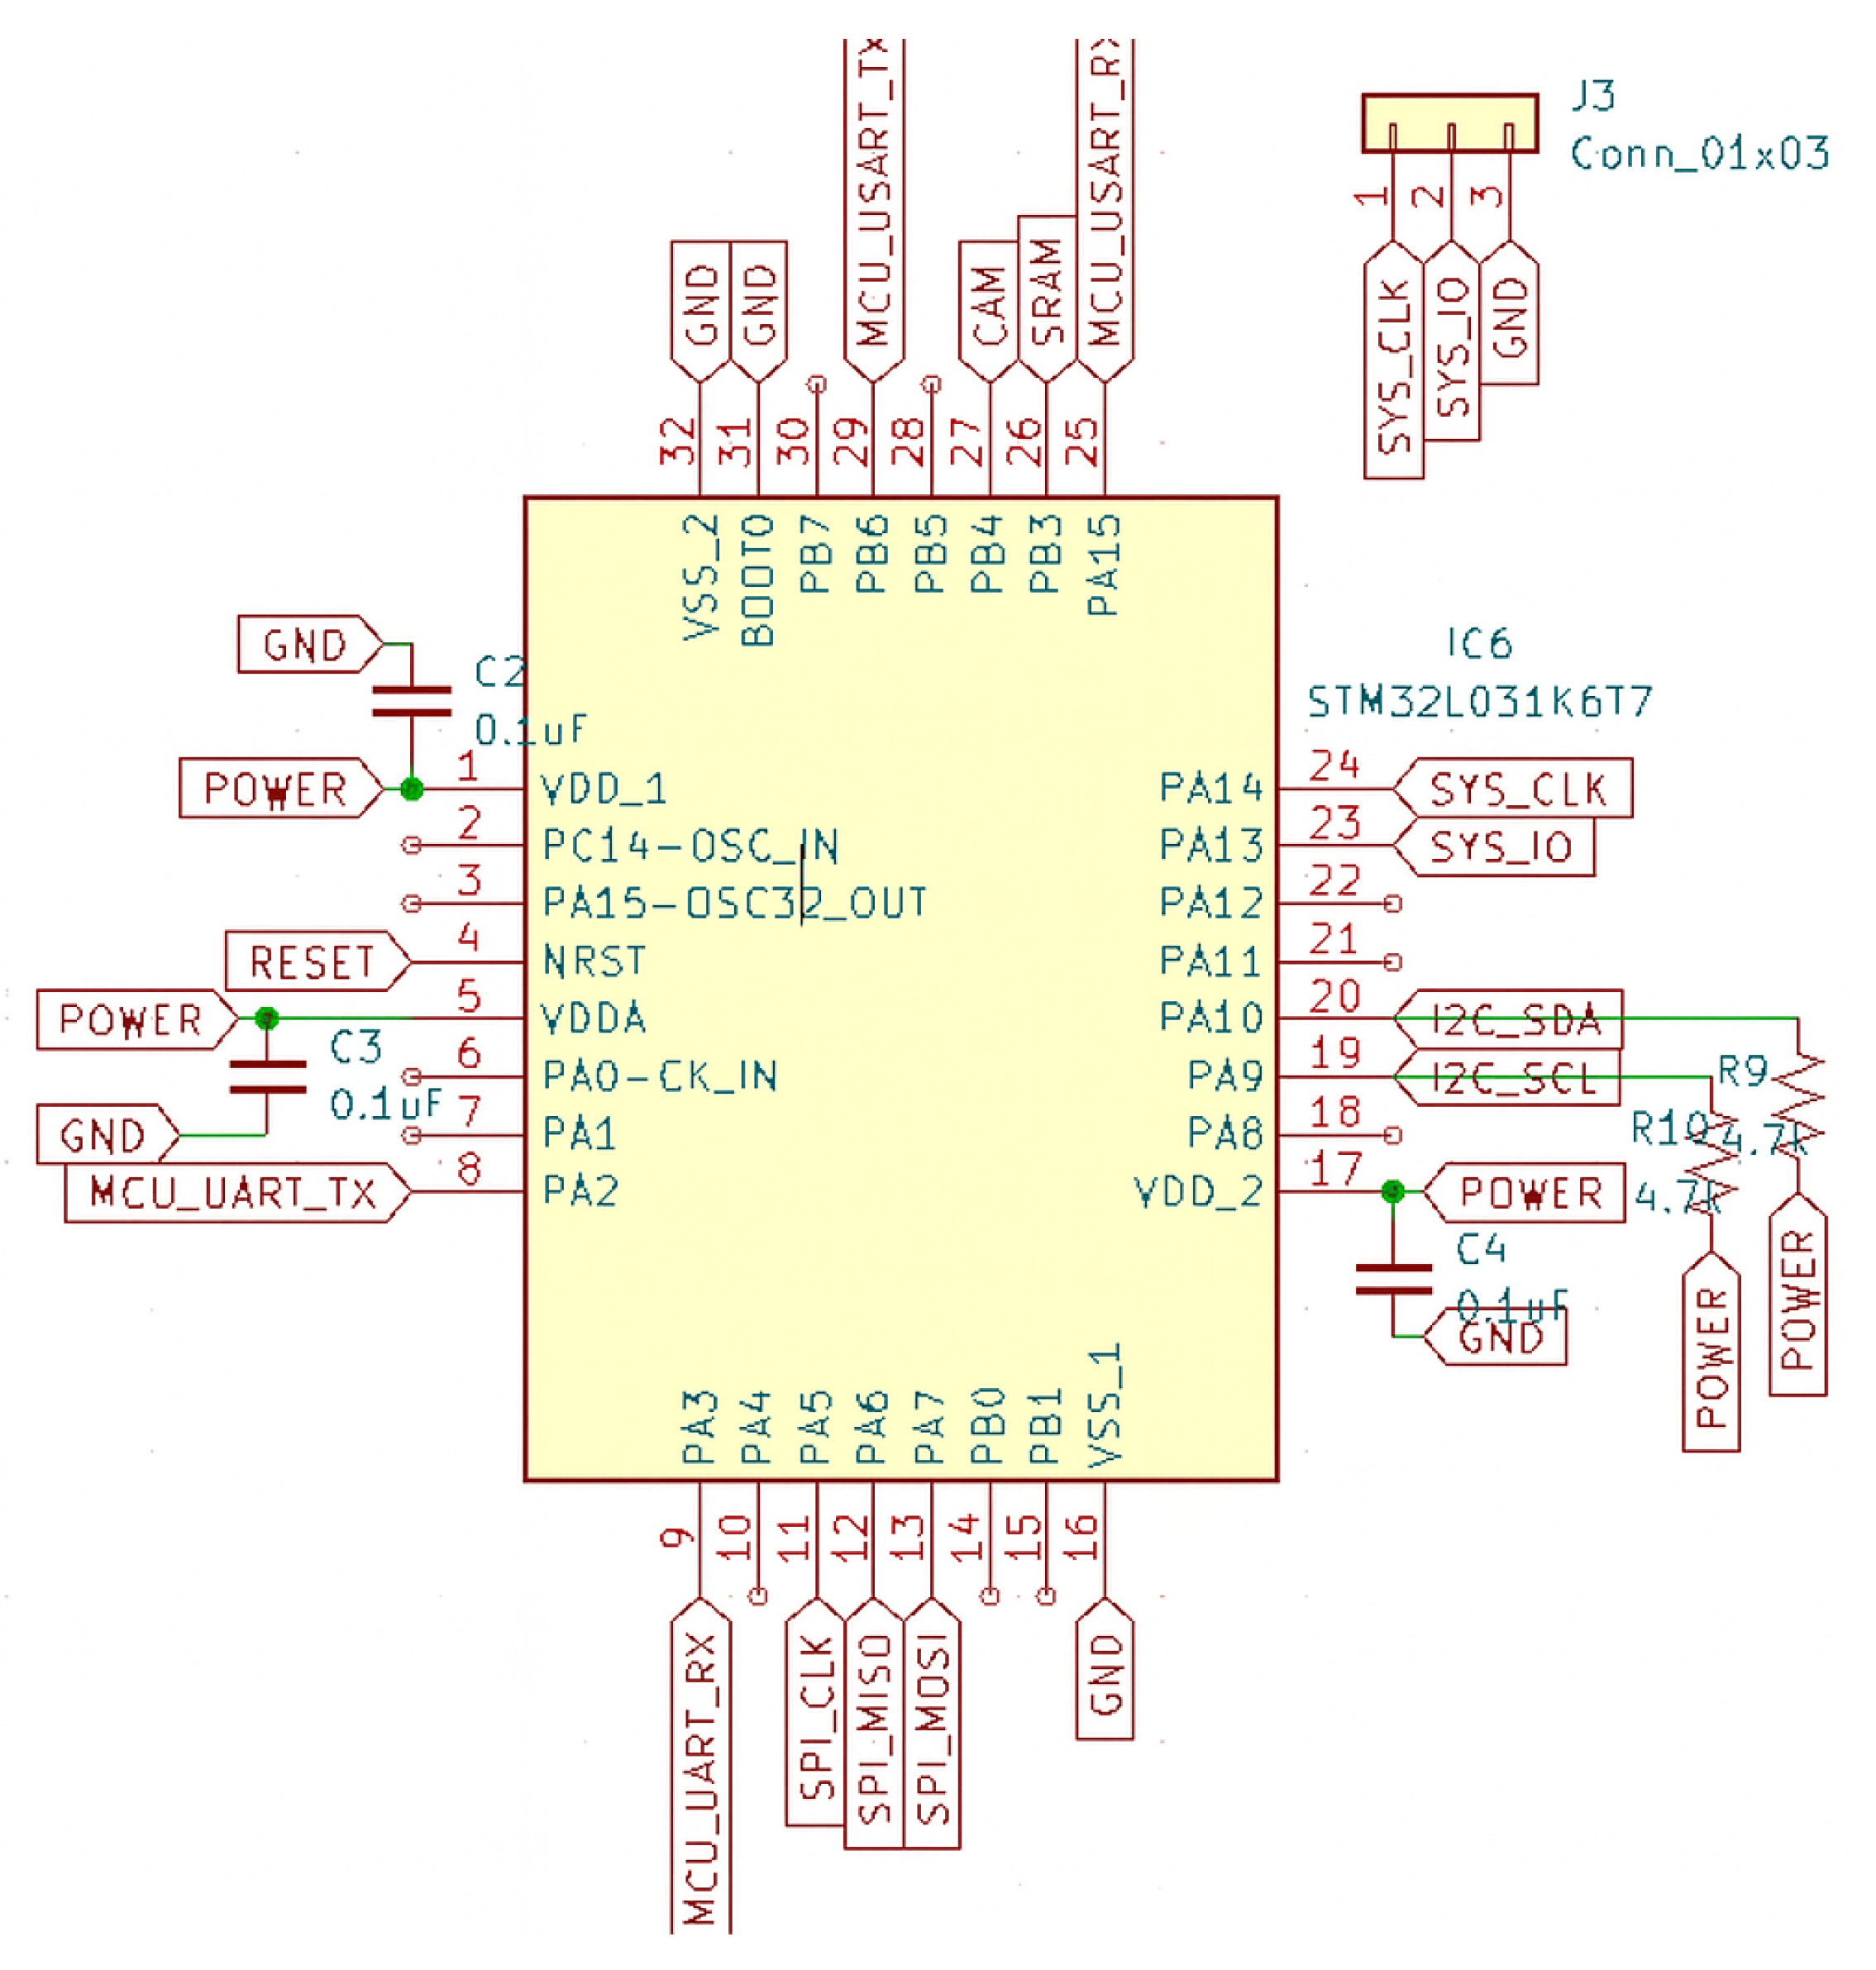
When it comes to electrical systems and electronics, scientists and engineers often rely on electrical circuit diagrams, which provide a detailed and standardized visual representation of circuits and electronic components, as well as the connections between them, to achieve a specific function. Circuit diagrams serve as blueprints for electrical systems, converting abstract design concepts into a visual representation that is easy to understand. A circuit diagram that describes a microcontroller (MCU) pin-out is shown in Figure 4.
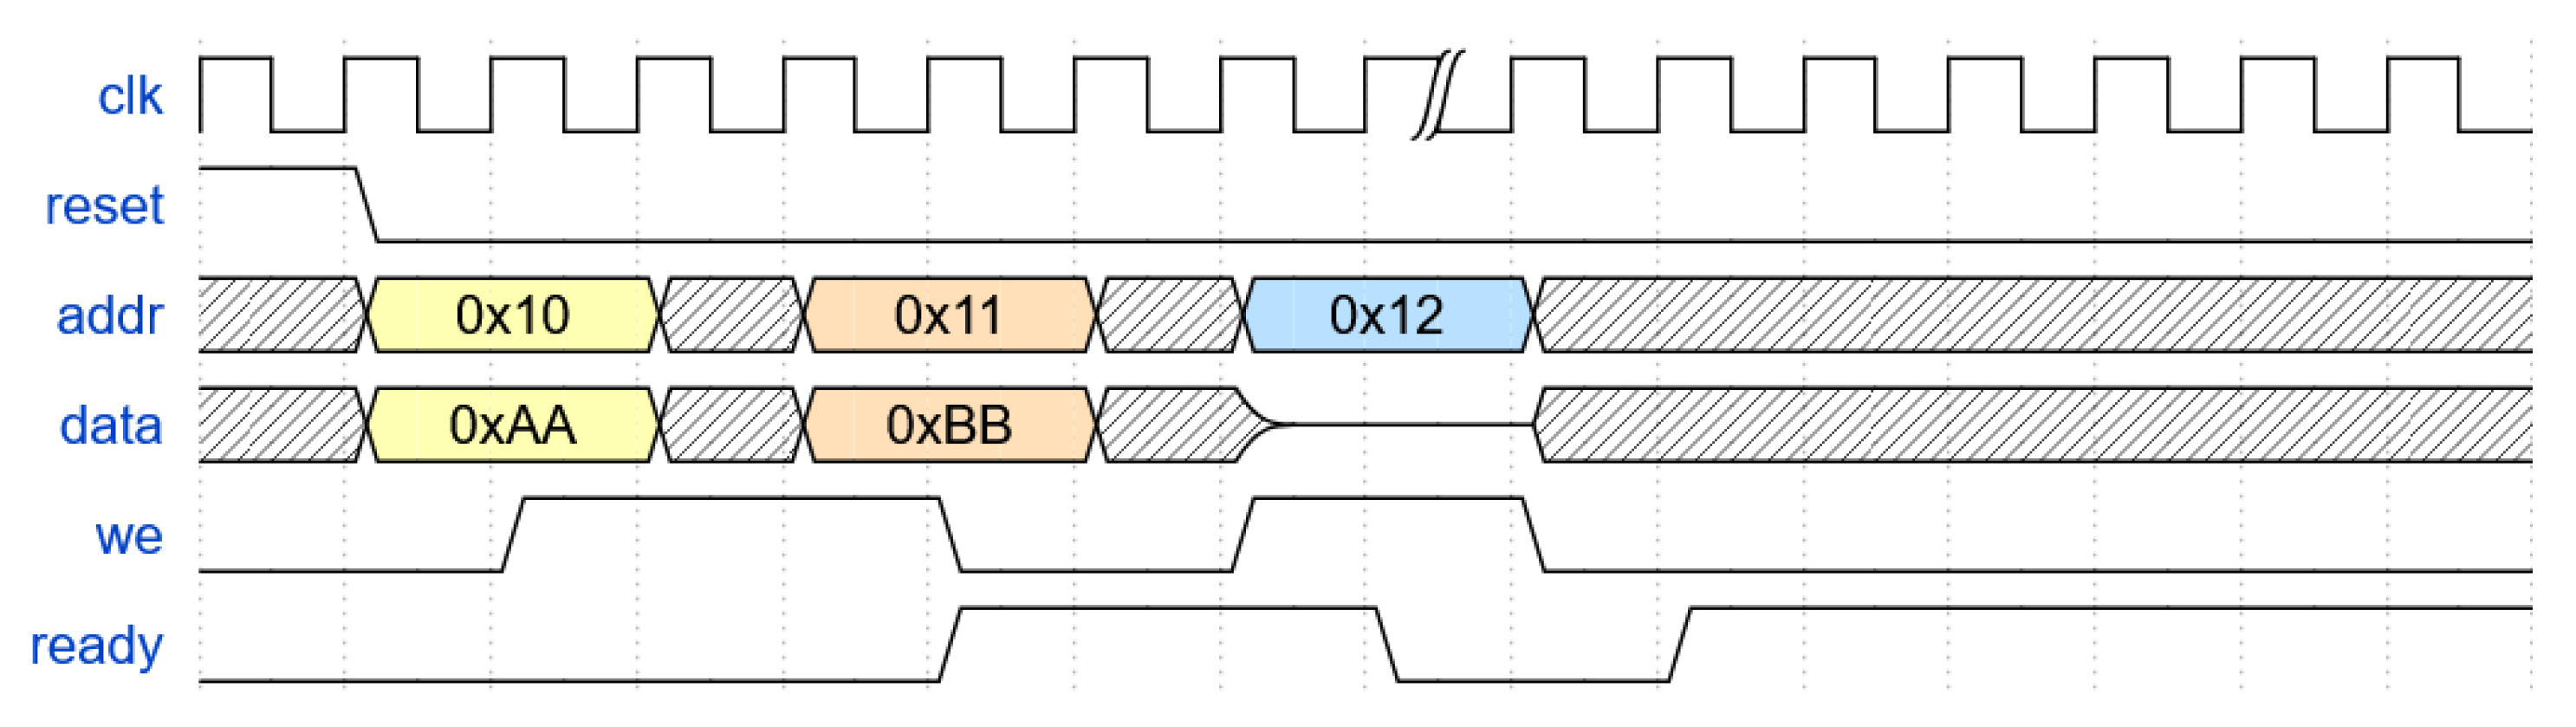
Finally, this survey also specifically reviews approaches related to the analysis of timing diagrams. They are a type of visual representation that describes the behavior of signals or events over time, for example, in digital circuits, systems, or communication networks. Timing diagrams provide a clear and organized way of observing how various signals evolve and interact over specific intervals. While there is a wide variety of diagrams that could be loosely grouped into timing diagrams, in this survey, we strictly refer to those describing signal level changes over time as timing diagrams.
An example timing diagram is shown in Figure 5, illustrating the relationship between the clock, reset, address, data, write enable, and ready signals.
These diagram types all pose unique challenges. While OCR can typically be applied to extract the textual content, a comprehensive representation of these diagram types encompasses far more than simply text. It needs to include shapes, color, and the structural relation between all these elements, in order to fully capture their content and meaning.
OCR itself has evolved over the years, progressing from a purely algorithmic approach to incorporating various deep learning techniques.
Despite these improvements, significant limitations remain. One major challenge arising from the use of AI models is hallucination, where AI models generate text or structures that are not grounded in actual content. Another challenge is the lack of contextual understanding. Many image content analysis systems still struggle to accurately interpret connections such as directional arrows, grouped symbols, or hierarchical structures, all of which are crucial in understanding the intent and logic behind technical diagrams. These issues can lead to flawed outputs, misinterpretations, or even cause system failures when used in automated pipelines.
This paper presents a comprehensive survey and historical analysis of image content extraction techniques, including OCR, applied to the five major diagram types mentioned above. It encompasses both traditional and AI-driven approaches, highlighting their methodologies, strengths, and specific limitations, with a focus on AI advances within this area of research. By analyzing a wide range of models and algorithms, we assess their effectiveness in extracting both textual and structural information. We also evaluate their readiness for deployment in high-accuracy, real-world environments.
The remainder of this paper will be organized as follows. Section 2 will go over the steps for how this survey was conducted. In Section 3, we present a brief review of the evolution of image content analysis approaches and related evaluation techniques. Section 4 presents our survey findings, analyzing and discussing the various research papers we included for this survey, as well as exploring their inspiration, techniques, and results. Finally, in Section 5 we present our conclusions and suggest future research directions.

2. Survey Methodology

This study employed a systematic literature review methodology inspired by the PRISMA 2020 (Preferred Reporting Items for Systematic Reviews and Meta-Analyses) [2] guidelines to ensure transparency and reproducibility in identifying, screening, and selecting relevant research papers. The review process consisted of four main stages: identification, screening, eligibility assessment, and inclusion.

2.1. Eligibility Criteria

Studies were considered eligible for inclusion if they met the following criteria: (1) published between January 2020 and August 2025; (2) proposed, implemented, or evaluated methods for technical diagram extraction or understanding that process complete diagram images to extract structural, semantic, or relational information at the diagram level rather than addressing individual symbols or text elements in isolation; (3) written in English; and (4) provided sufficient methodological detail, including model architecture, training setup, and datasets, to support assessment of transparency and reproducibility. A limited set of time series diagram papers was also included, though these represent a distinct research domain focused on statistical data visualization rather than technical system specifications. Studies were excluded if they focused solely on isolated sub-tasks without diagram-level integration or non-diagram documents (e.g., natural images or plain text).

2.2. Information Sources and Search Strategy

A comprehensive literature search was conducted across six major academic databases on 27 August 2025: IEEE Xplore Digital Library, SpringerLink, ScienceDirect (Elsevier), MDPI Digital Library, arXiv, and Google Scholar. The search strategy employed Boolean combinations of controlled vocabulary and free-text terms organized into three concept groups: (1) Deep learning architectures: “deep learning” OR “neural network” OR “CNN” OR “RNN” OR “LSTM” OR “transformer” OR “autoencoder”; (2) Technical diagrams: “technical diagram” OR “engineering diagram” OR “schematic” OR “flowchart” OR “circuit diagram” OR “architectural diagram” OR “UML diagram”; and (3) Diagram extraction and understanding tasks: “diagram extraction” OR “diagram parsing” OR “diagram recognition” OR “symbol detection” OR “diagram segmentation” OR “structure understanding” OR “relationship inference” OR “diagram interpretation.” The complete search string was adapted to the syntax and indexing rules of each database. No restrictions were imposed on study design or geographic location. In addition, reference lists of included studies and relevant review articles were manually screened to identify further eligible publications through backward citation tracking.

2.3. Selection Process

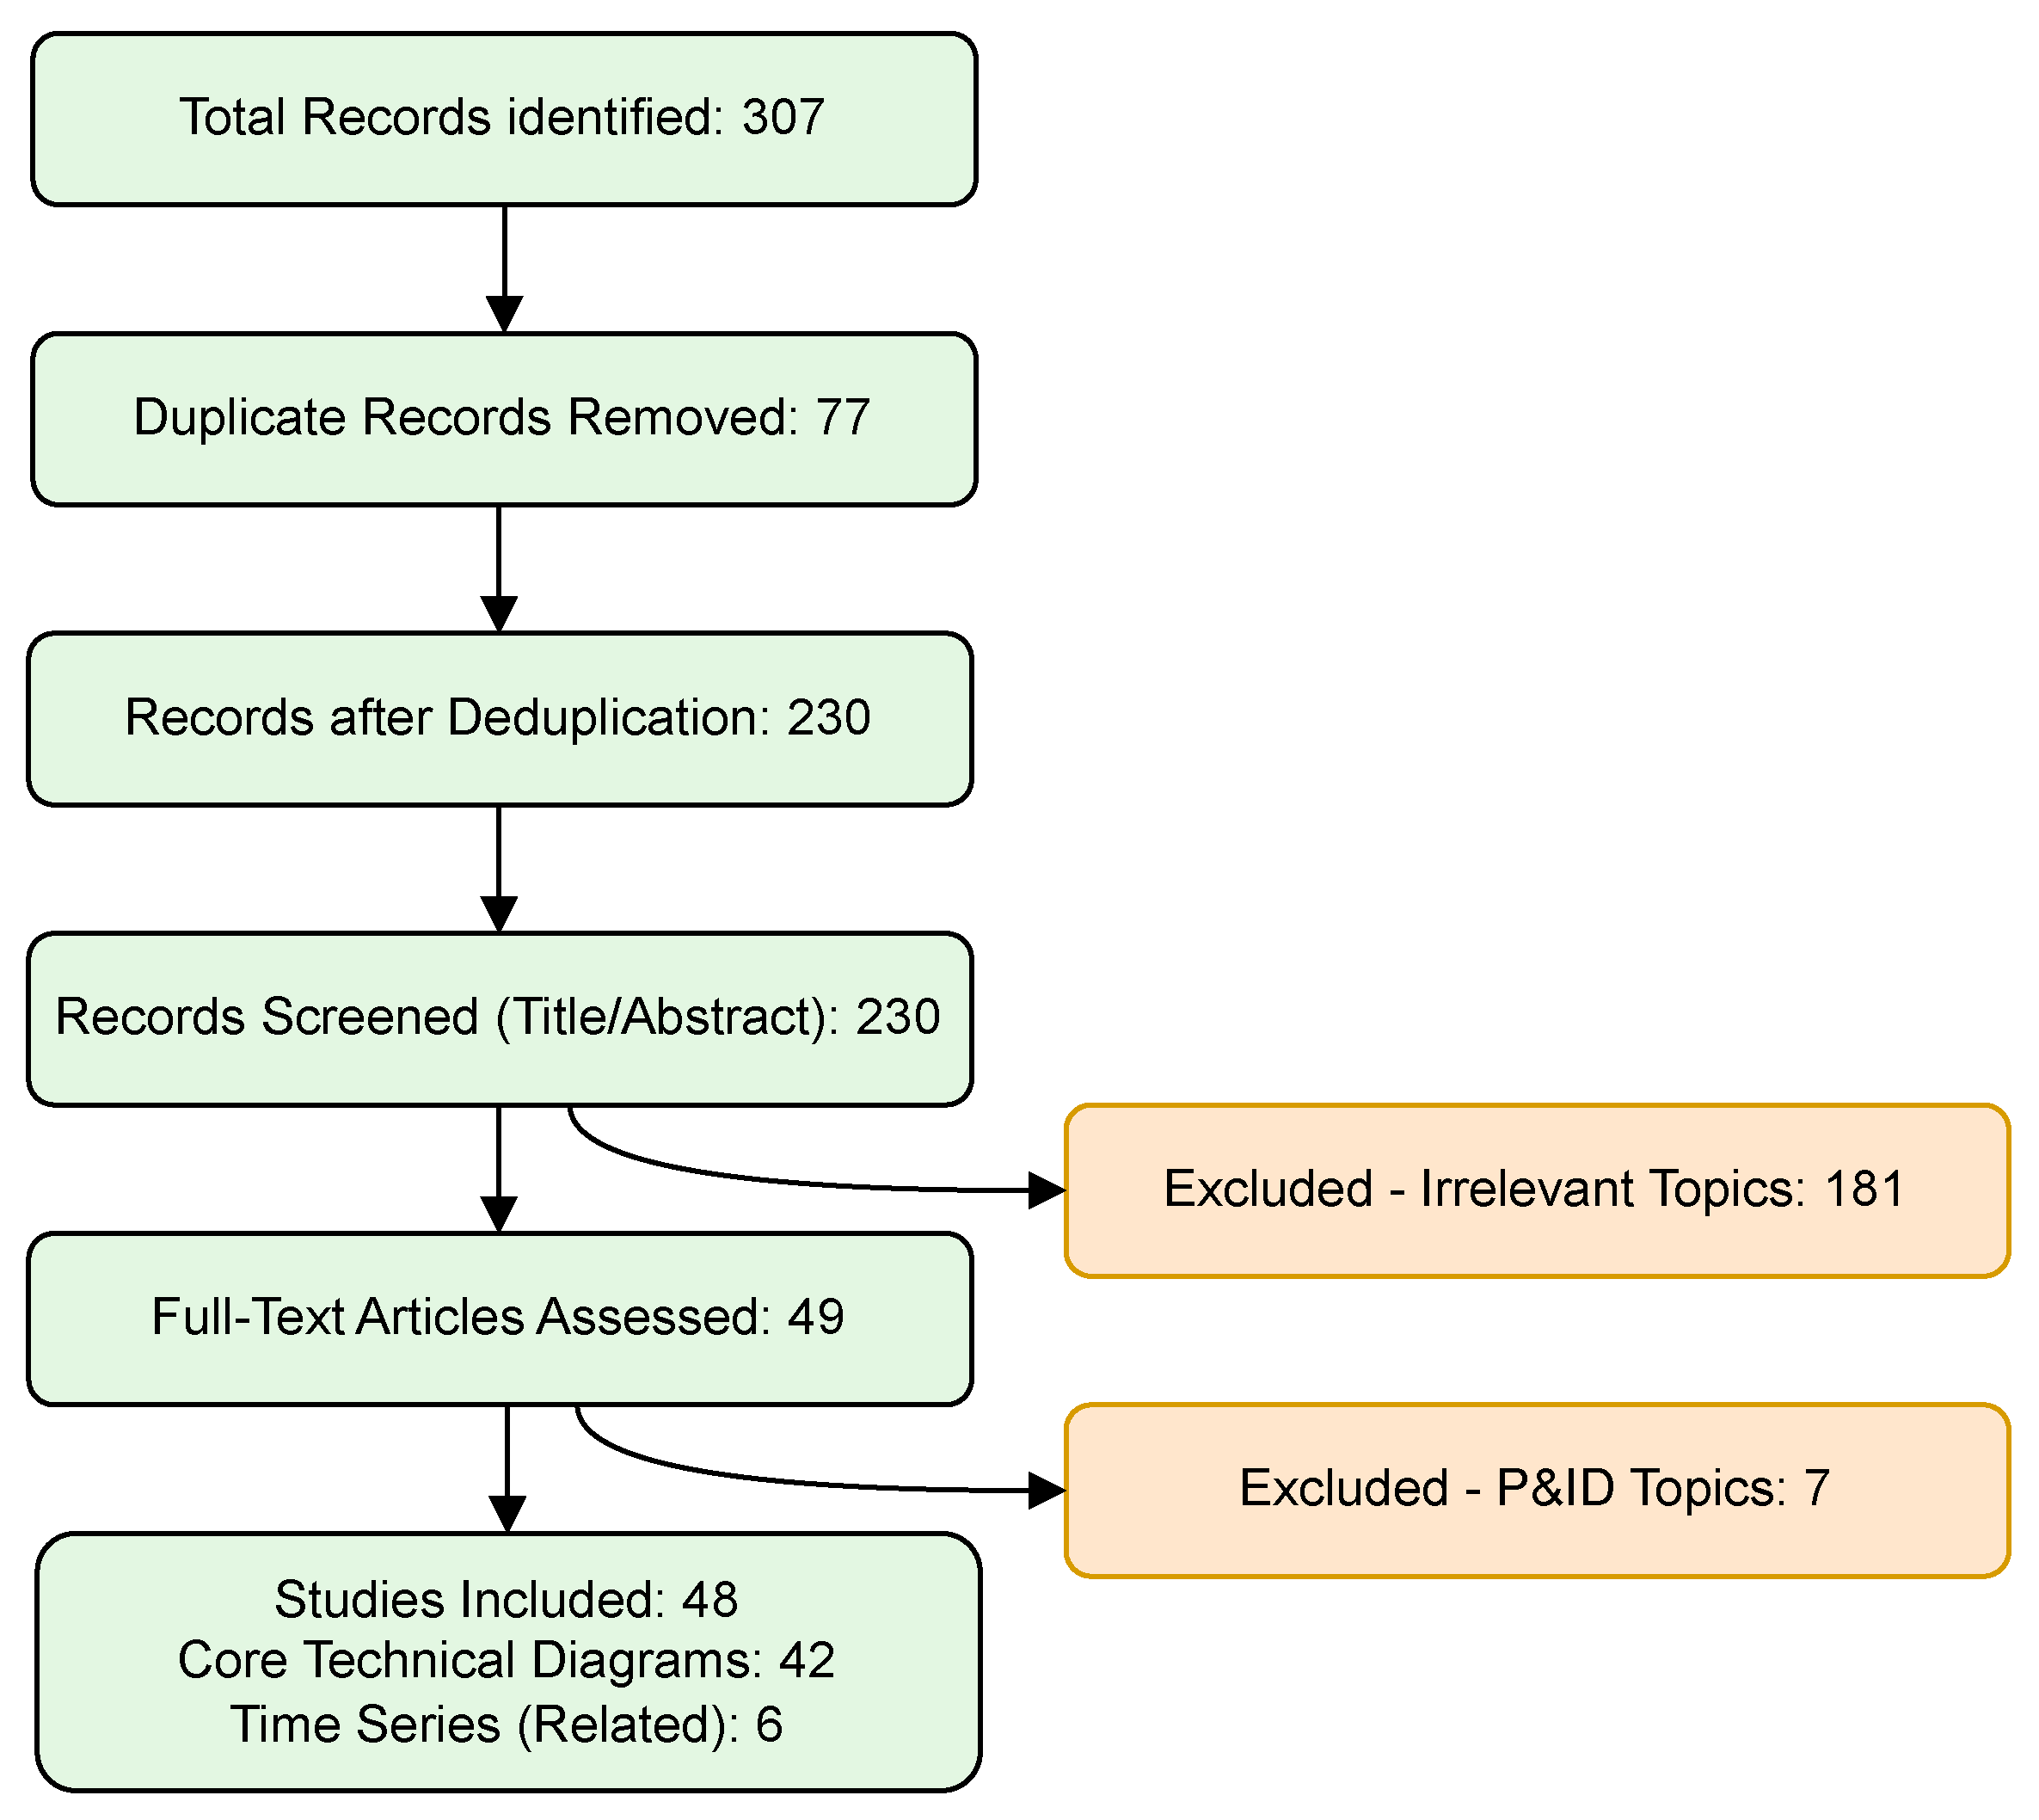
The study selection process followed a multi-stage screening approach, as illustrated in Figure 6. The initial database search identified a total of 307 records. After removing 77 duplicates, 230 unique papers remained for screening. These records underwent title and abstract screening against the predefined eligibility criteria. The screening process was conducted by a single reviewer to ensure consistency in decision-making. However, while we did our utmost to follow strict objective selection criteria, we acknowledge that our choice to use a single reviewer may also introduce selection bias. Given the broad search strategy, full-text articles were retrieved and examined for all 230 records to accurately assess their relevance to deep learning-based technical diagram extraction and understanding tasks.
Following full-text screening, 181 articles were excluded as false positives, primarily because they addressed non-diagram document analysis, natural image processing, or focused on converting text to technical diagrams. The remaining 49 studies were then independently categorized according to the primary diagram type addressed (e.g., flowcharts, circuit diagrams, block diagrams, UML diagrams, and timing diagrams).
During the literature review, we identified a comprehensive survey published in 2024 [3] that provides an in-depth analysis of deep learning techniques for text and shape extraction from Piping and Instrumentation Diagrams (P&ID). As this diagram category was thoroughly covered in the referenced survey, P&ID-focused studies were excluded from the present review to avoid duplication. Consequently, an additional seven papers were excluded, resulting in a final corpus of 42 core studies. Additionally, six time series diagram studies are briefly discussed for comparative purposes in the larger context of timing diagrams, bringing the total to 48 papers.
Table 1 summarizes the distribution of the included studies across different diagram types. Of the 42 core technical diagram papers, flowchart diagrams account for 19 studies (39.58%), followed by electrical schematic diagrams with 14 studies (29.17%). Block and UML diagrams contain seven studies (14.58%), while timing diagrams contain only two studies (4.17%). Additionally, six time series diagram studies (12.50%) are included to acknowledge related temporal visualization research. This distribution indicates that existing deep learning-based diagram extraction research has primarily focused on flowchart and electrical schematic diagrams, while other diagram types have received rather limited attention.

2.4. Data Extraction and Quality Assessment

From each eligible study, the following data elements were systematically extracted: author(s), publication year, deep learning architecture type (e.g., CNN, RNN/LSTM, transformer, graph neural network), target diagram type(s) (e.g., flowchart, block and UML diagram, electrical schematic, timing diagram), diagram analysis task(s) addressed (e.g., detection, segmentation, symbol recognition, text extraction, structural parsing, relationship inference, or end-to-end interpretation), dataset characteristics (synthetic versus real-world diagrams, publicly available versus proprietary datasets), and performance metrics. As our review encompasses both traditional computer vision approaches and modern deep learning methods to support historical analysis, we also documented the primary methodological approach (traditional, hybrid, or deep learning-based) for each study.
Quality assessment was conducted in a descriptive manner, focusing on the completeness of methodological reporting rather than on comparative performance evaluation. Specifically, studies were assessed for clarity in problem formulation, adequacy of dataset description, transparency of model architecture and training procedures, and the presence of quantitative evaluation results. No cross-study performance comparison, ranking, or benchmarking was performed. All included studies were treated as independent contributions within their respective diagram types and task categories. The full set of 42 studies that met the inclusion criteria formed the basis for the technical analysis presented in Section 4.

2.5. Synthesis Methods and Bibliometric Analysis

A qualitative narrative approach was employed to synthesize the selected literature. Studies were organized according to diagram type and the primary diagram analysis task addressed, with attention to the evolution of methodological approaches from traditional computer vision techniques to modern deep learning methods. Key methodological characteristics and reported outcomes were summarized without attempting quantitative aggregation or comparative evaluation. This approach was adopted due to the heterogeneity of datasets, diagram styles, task definitions, and evaluation protocols across studies.
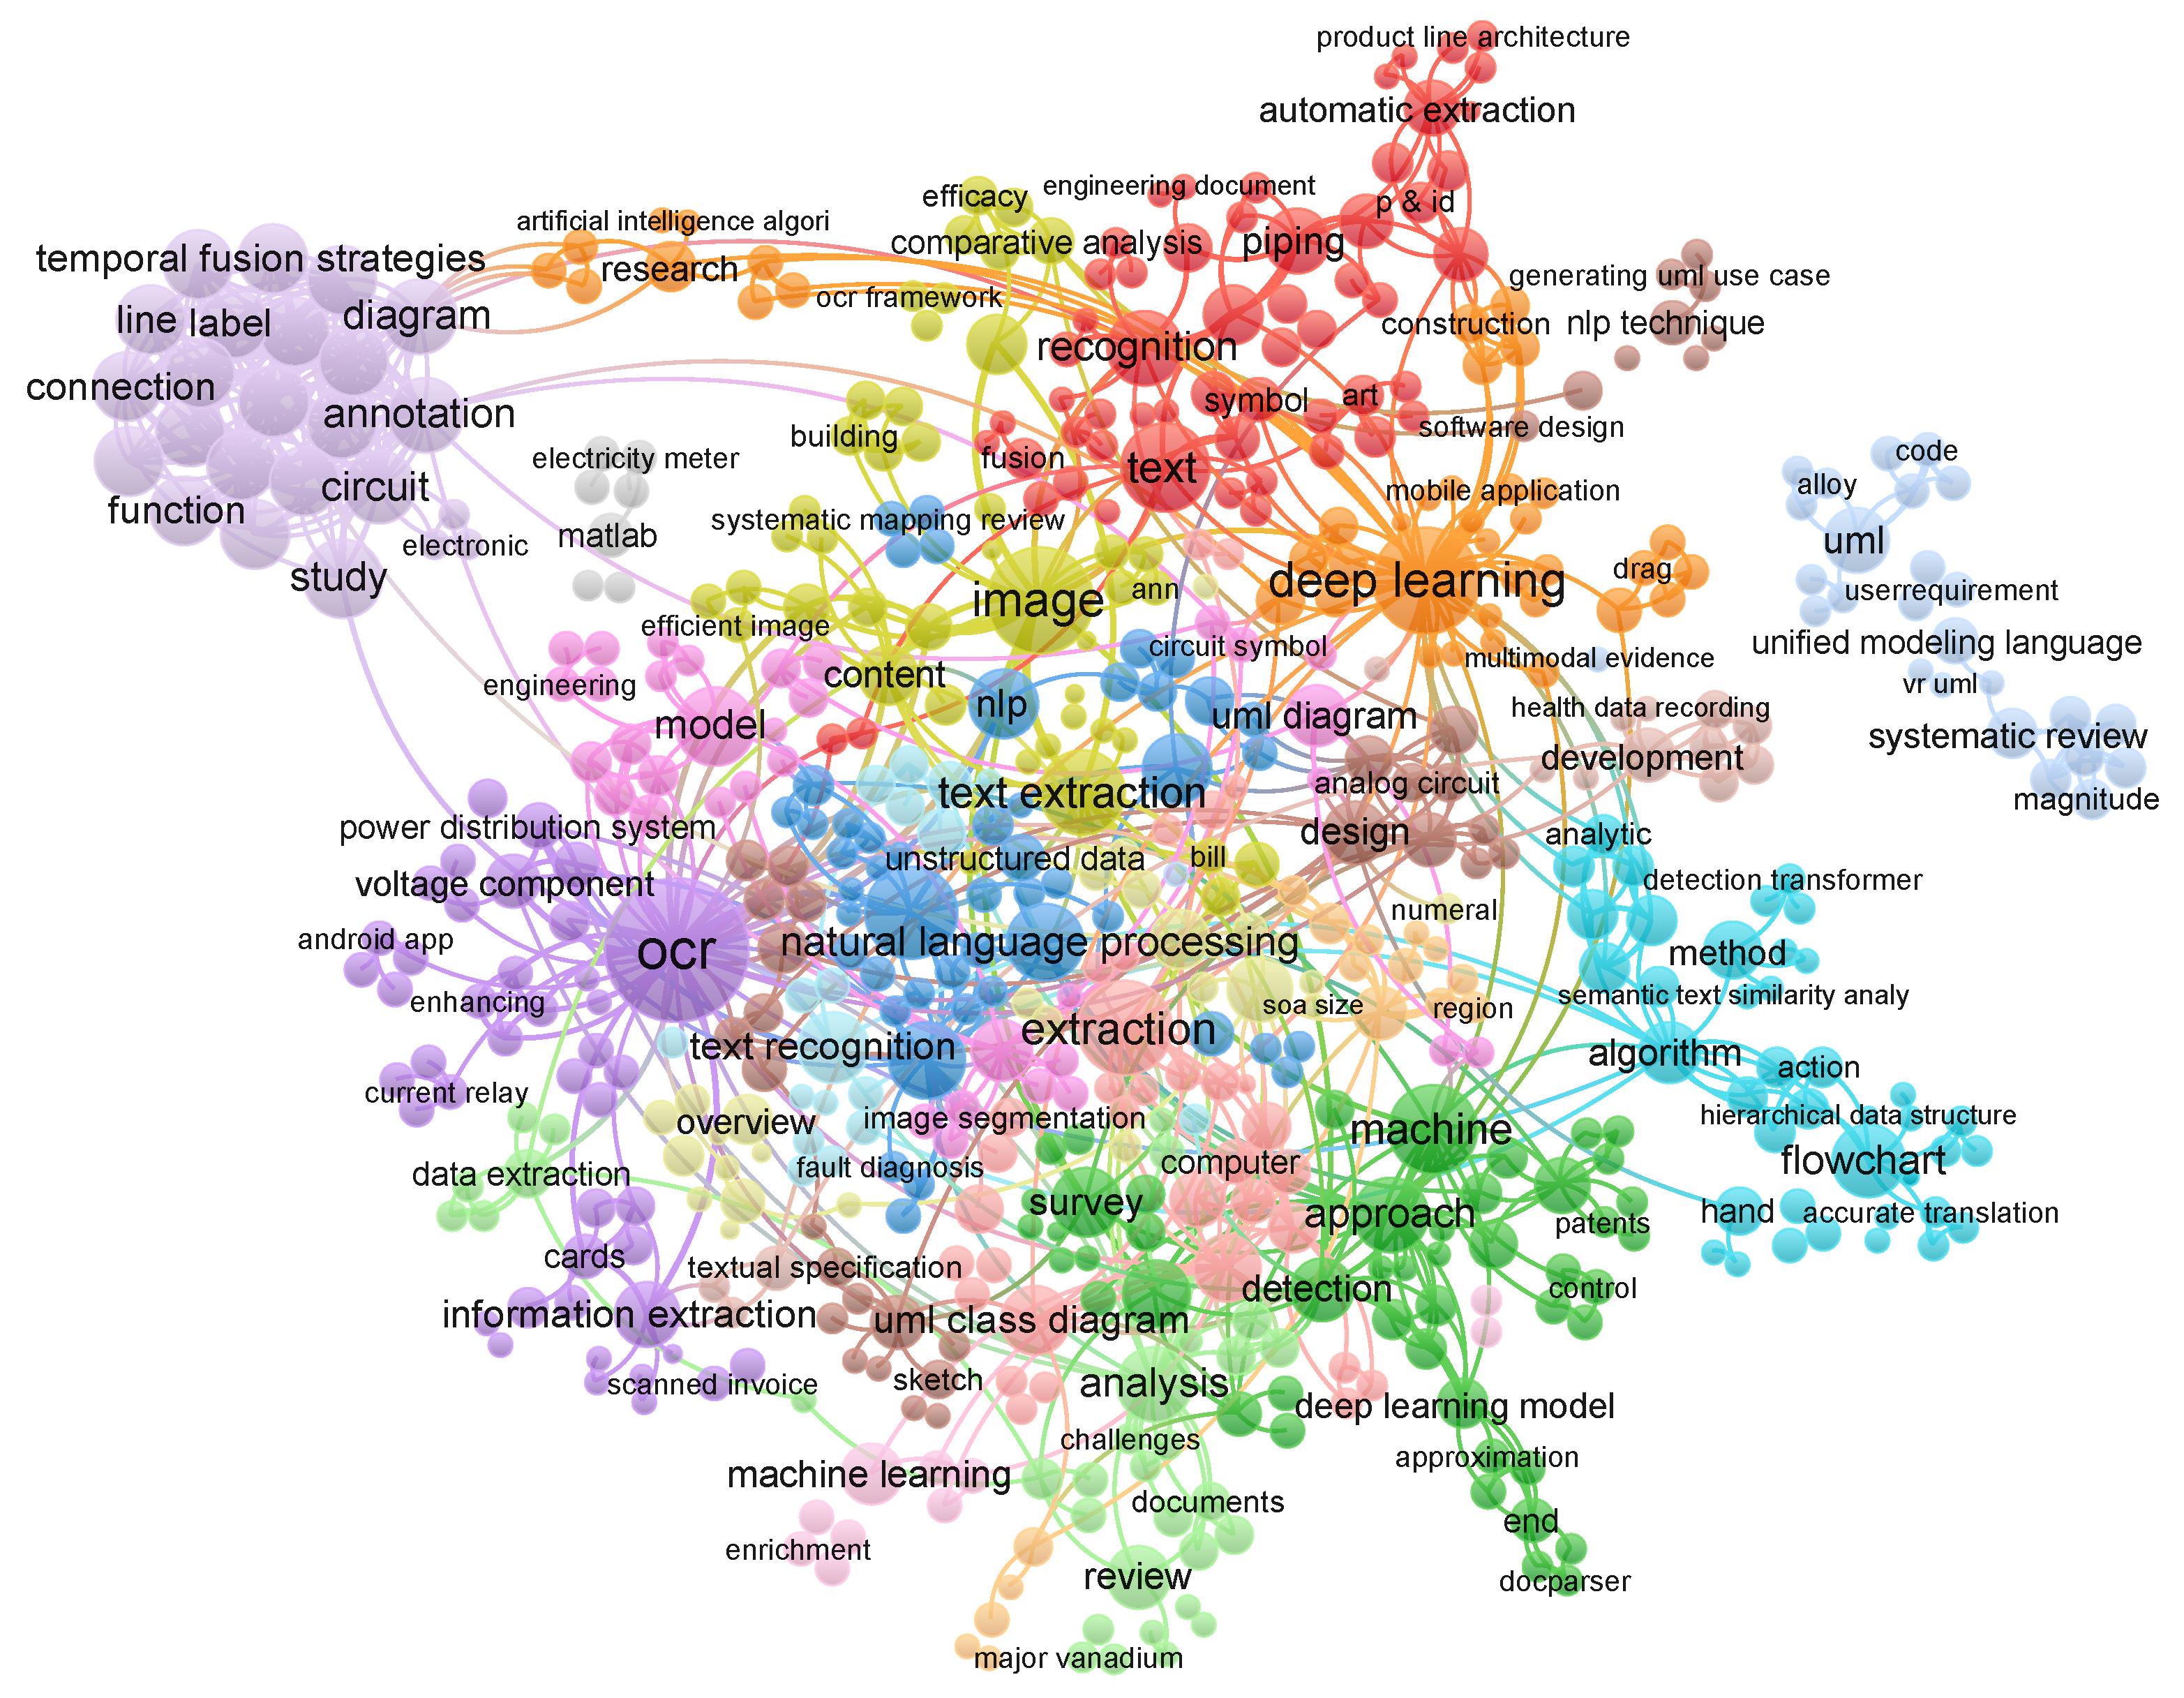
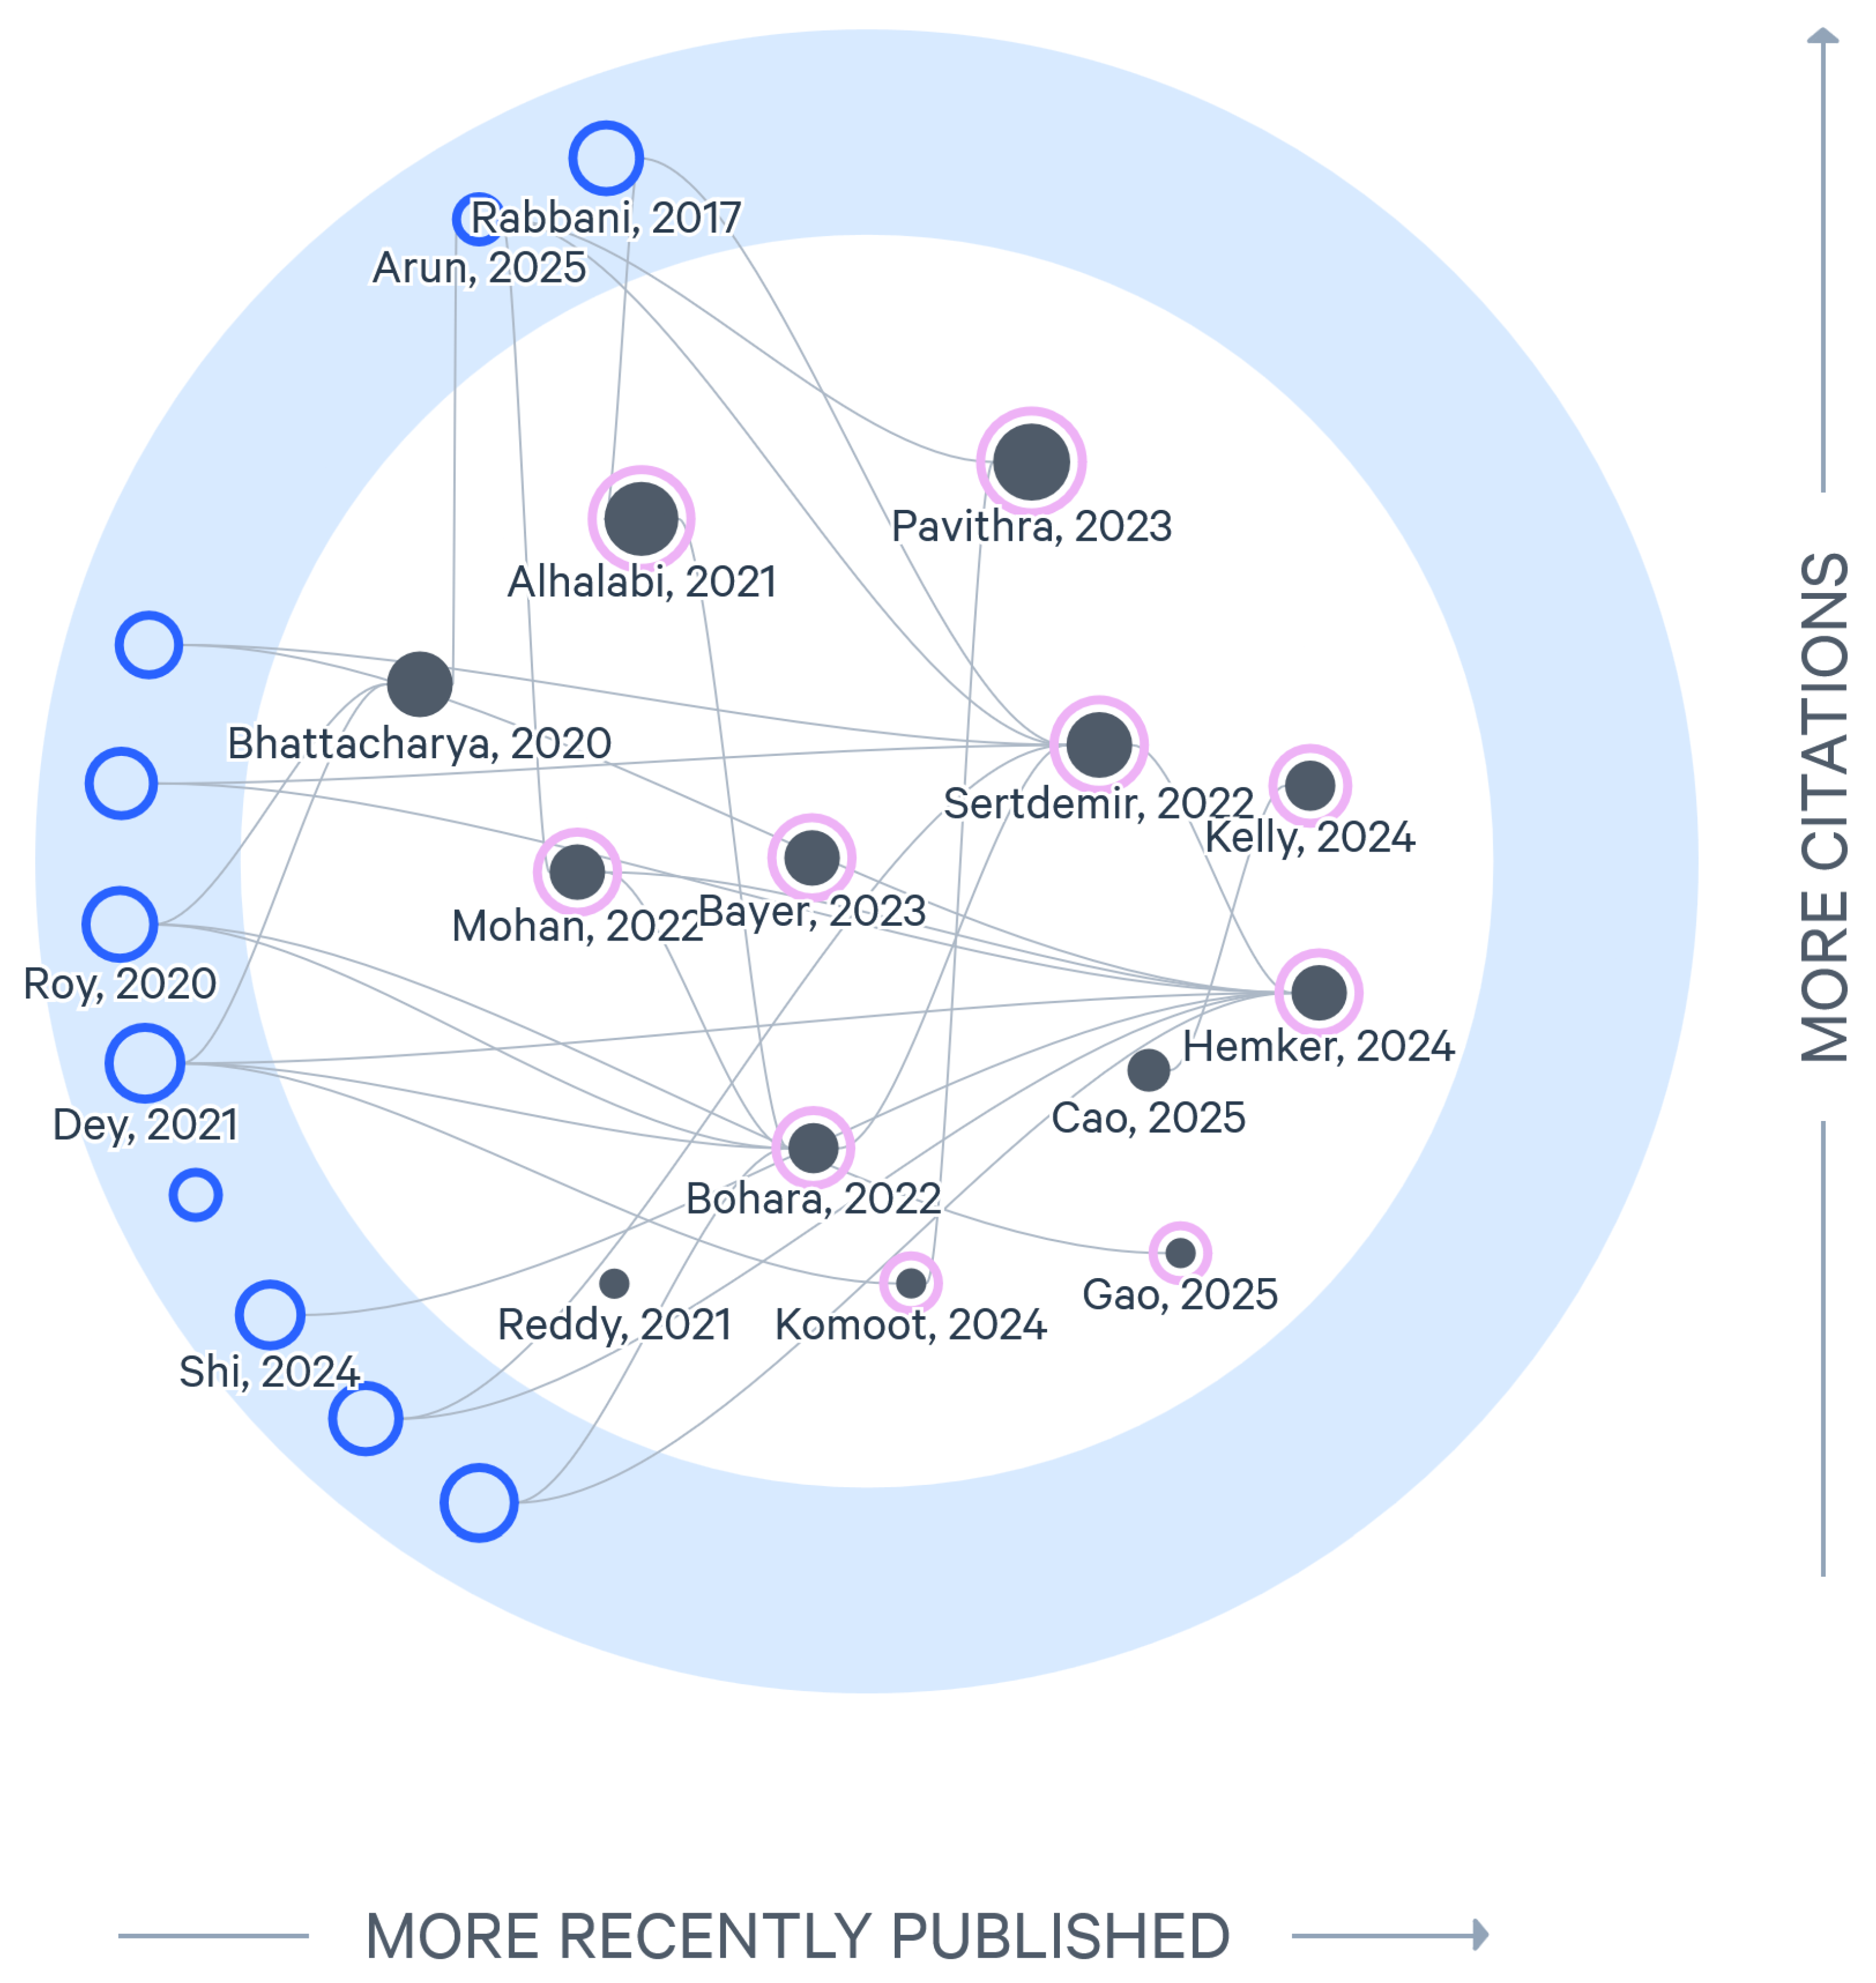
To explore thematic clusters and research trends in the broader literature on technical diagram extraction, an initial bibliometric analysis was conducted using VOSviewer (version 1.6.18) on the title and abstract keywords of 230 retrieved papers. Co-occurrence analysis with a minimum keyword frequency threshold of five occurrences revealed prominent research communities, including work on symbol detection, diagram segmentation, structural parsing, relationship inference, and end-to-end diagram interpretation, as illustrated in Figure 7. This preliminary analysis provided an overview of the landscape and informed the subsequent selection and synthesis of studies for the focused review.

3. Background

3.1. Early Image Content Extraction Approaches

Over the years, numerous methods have been developed for extracting textual and visual information from documents and images. Earlier approaches focused heavily on OCR, which aims to detect printed or handwritten text and convert it into machine-readable formats. As image processing improved, shape and pattern recognition methods emerged, allowing systems to detect and recognize shapes, diagrams, and geometric figures. In recent years, the emergence of deep learning methods for computer vision tasks, including convolutional neural networks (CNNs) and recurrent neural networks (RNNs), has dramatically improved the accuracy and versatility of text and image content extraction techniques [4,5]. These advancements have enabled the development of more intelligent systems capable of handling complex layouts, handwritten variants, and providing contextual understanding.
Traditional OCR techniques are the earliest methods for text extraction from images. They typically follow a multi-step process comprised of [4]:
1.
Preprocessing involves noise reduction, binarization, and skew correction to enhance image quality.
2.
Segmentation separates text regions from non-text elements, and individual characters or words are isolated.
3.
Feature Extraction identifies key characteristics of each symbol, such as edges, corners, and stroke widths.
4.
Classification and Recognition compares the features to already trained character models to output machine-readable text.
5.
Post-Processing is often utilized by modern OCR systems to correct recognition errors using language models.
While OCR is primarily limited to text recognition, research into shape recognition techniques focuses on the detection and extraction of symbols, icons, diagrams, and geometric figures. The steps associated with shape recognition typically involve [5]:
  • Edge Detection or Contour Extraction is utilized to identify shape boundaries.
  • Shape Description computes area, perimeter, or moments.
  • Feature Matching uses template matching or feature descriptor techniques.
  • Classification maps the detected shapes to predefined categories.
These methods are the cornerstone of content extraction from complex images, which comprise technical diagrams, engineering drawings, flowcharts, and other intricate diagrammatic representations.
The advent of deep learning has enabled significant advances in image content extraction, particularly for complex technical imagery. For example, CNNs [6] are comprised of three primary types of layers, which are typically stacked to extract and combine features from input data before producing a resulting value. By optimally structuring CNNs using these different layer types, the resulting CNNs excel at a variety of computer vision tasks. The three distinct layer types are:
  • Convolutional layers apply a series of learnable filters or kernels that perform convolutional operations over the input image. These filters detect edges, textures, and color gradients.
  • Pooling layers perform a down-sampling operation on the feature maps, reducing their spatial dimensions while retaining the significant information.
  • Fully Connected (FC) layers operate after the feature maps are flattened into a one-dimensional feature vector. Flattening converts the multidimensional feature maps into a single continuous vector. These layers integrate the extracted features and compute the final prediction.
The convolutional capabilities of CNNs make them an ideal foundational approach for processing spatial data such as images. For sequential data, such as text, however, RNNs [7] often outperform CNNs by modeling contextual dependencies through the process of remembering and incorporating prior input values. Hybrid versions of these frameworks also exist, such as convolutional recurrent neural networks (CRNNs), which combine CNN feature extraction with RNN sequence modeling, enabling end-to-end image content analysis [8].
More recently, transformer-based models emerged as a dominant architecture that enables modern large language models (LLMs) and other advances in deep neural networks. LLMs, as a result, have rapidly become a cornerstone of everyday life use cases for AI applications. Transformers are capable of capturing long-range dependencies and contextual relationships across an entire document. Transformer architectures also include non-textual adaptations such as vision transformers (ViT) [9] and TrOCR [10]. Transformers can often outperform RNNs in recognizing complex layouts [11]. Building on this capability, vision transformers were introduced to apply the transformer paradigm to image analysis. They provide the foundational component for building Vision Language Models (VLM), which are multimodal LLMs capable of generating output based on textual and visual content. The initial step in a VLM typically involves vision encoding using ViT (to represent image data using feature vectors), followed by language encoding (to represent the text such as the user query as feature vectors), followed by a projection and integration step (to align both of these embeddings within a common encoding space combined with a transformer model), and finally the output step that generates the text-based result.
While many diagram extraction pipelines implicitly involve uncertainty—arising from noisy images, ambiguous symbols, or OCR errors—most surveyed approaches rely on deterministic inference at inference time. Explicit probabilistic modeling and uncertainty propagation are comparatively rare, largely due to computational complexity and the difficulty of defining tractable joint distributions over heterogeneous diagram components. Bayesian and uncertainty-aware methods have been explored in related vision domains, but remain underrepresented in end-to-end technical diagram understanding systems.
These deep learning approaches form the technical foundation for extracting content from the five diagram types examined in this survey: flowcharts, block and UML diagrams, electrical schematics, and timing diagrams. Each of these diagram types presents unique challenges in terms of structural complexity, symbolic notation, and spatial relationships that must be captured for accurate interpretation.

3.2. Existing Evaluation Approaches for Content Extraction Methods

Having established the technical foundations of content extraction methods, we now turn to the evaluation frameworks used to assess their performance. With the development of these architectures, it became essential to establish and implement rigorous evaluation and scoring mechanisms to quantitatively and qualitatively assess the performance of each such framework, particularly under challenging conditions such as noisy inputs, complex layouts, as well as dense or overlapping content, in order to determine their robustness, reliability, accuracy, and suitability for real-world applications.
There are multiple methods that assess these frameworks, with one prominent example being Recall-Oriented Understudy for Gisting Evaluation (ROUGE-1) [12]. ROUGE-1 is a metric for evaluating text summarization that measures single-word (uni-gram) overlap between a generated summary and one or more reference summaries. It uses Precision, Recall, and F1-Score to quantify performance. The scores range from 0 to 1, where 0 represents no matching of words and 1 represents perfect matching of words.
Another scoring technique used for recognition evaluation is the Bilingual Evaluation Understudy (BLEU) scoring [13]. BLEU is used for evaluating the quality of the extracted text. The BLEU scoring scale ranges from 0 to 1, where 0 represents the lowest quality and 1 the highest [14]. Some variants of BLEU scoring include CodeBLEU [15], which specifically targets the evaluation of program code extraction, and BLEURT [16], which is based on the bidirectional encoder representation from transformers (BERT) to mimic a more human-like evaluation approach for extractions. It uses the same scoring scale as the original BLEU. BLEU-4 [17] is primarily used for evaluating extractions, utilizing a comparison to human translations. BLEU-4 is named thus because it utilizes four words to calculate precision, using a scoring scale that once again ranges from 0 to 1.
Another scoring approach is the mean Average Precision (mAP) [18], which evaluates both the localization and classification performance. While precision is employed to measure the accuracy of the model’s positive predictions, recall measures the completeness of the model’s predictions, and the F1-score represents the mean of precision and recall [19]. For object detection and segmentation tasks, IoU [20] is commonly used to measure the overlap between predicted and ground truth bounding boxes or regions. IoU is calculated as the area of overlap divided by the area of union between the prediction and ground truth, producing a score between 0 and 1, where higher values indicate better spatial alignment. IoU is often used in conjunction with mAP, where a prediction is considered correct if its IoU exceeds a specified threshold of 0.5 or 0.75.
It is important to note the limitations of cross-study comparisons in this context. As shown above, the various studies employ different evaluation metrics, including BLEU, IoU, mAP, accuracy, ROUGE-1, and F1-score, each of which captures distinct aspects of model performance. Because these metrics measure performance in fundamentally different ways, direct numerical comparison across studies is challenging and may be misleading. Additionally, for ease of interpretation and comparison throughout this survey, certain metrics such as BLEU and ROUGE-1 are reported on a 0–100 scale (obtained by multiplying the original 0–1 scores by 100), though readers should note that source papers typically report these metrics on the original 0–1 scale. While some approaches attempt to normalize metrics to a common scale, such transformations introduce additional assumptions and are not always feasible. Therefore, comparisons across studies should be interpreted qualitatively, focusing on overall trends and methodological differences rather than a direct metric-to-metric evaluation.

4. Diagram Analysis

4.1. Analysis Overview

Since this paper focuses on recent developments in diagram analysis, each paper we survey in this section builds upon an extensive foundation of substantial prior work. We fully acknowledge and appreciate this deep historical grounding of the cited works and encourage the reader to delve into these works for a deeper understanding of these techniques. The scientific works we are focusing on in our survey represent a cross-section of the state-of-the-art in image content analysis for the five specific technical illustration types we selected. The authors of these respective papers build upon the extensive prior work to explore new approaches and improvements that push the boundaries for analyzing diagrammatic images. These techniques are critical in numerous application areas, in particular as information extraction tools for AI workflows, multimodal document understanding, document digitization, and literary curation efforts.
The provided analysis examines each article for three key review criteria:
1.
Inspiration, which covers the foundational ideas that influenced the study;
2.
Techniques, where we explore specific methods and tools used in the research, along with their results; as well as
3.
Future directions, which outline the areas the authors wish to enhance or explore further.
Our analysis is further divided into the structure of the image content being extracted, as different methods have been evaluated against various types of diagrams, including flowcharts, block diagrams, UML diagrams, electrical circuit schematics, and timing diagrams.

4.2. Common Pipeline Architecture Across Diagram Types

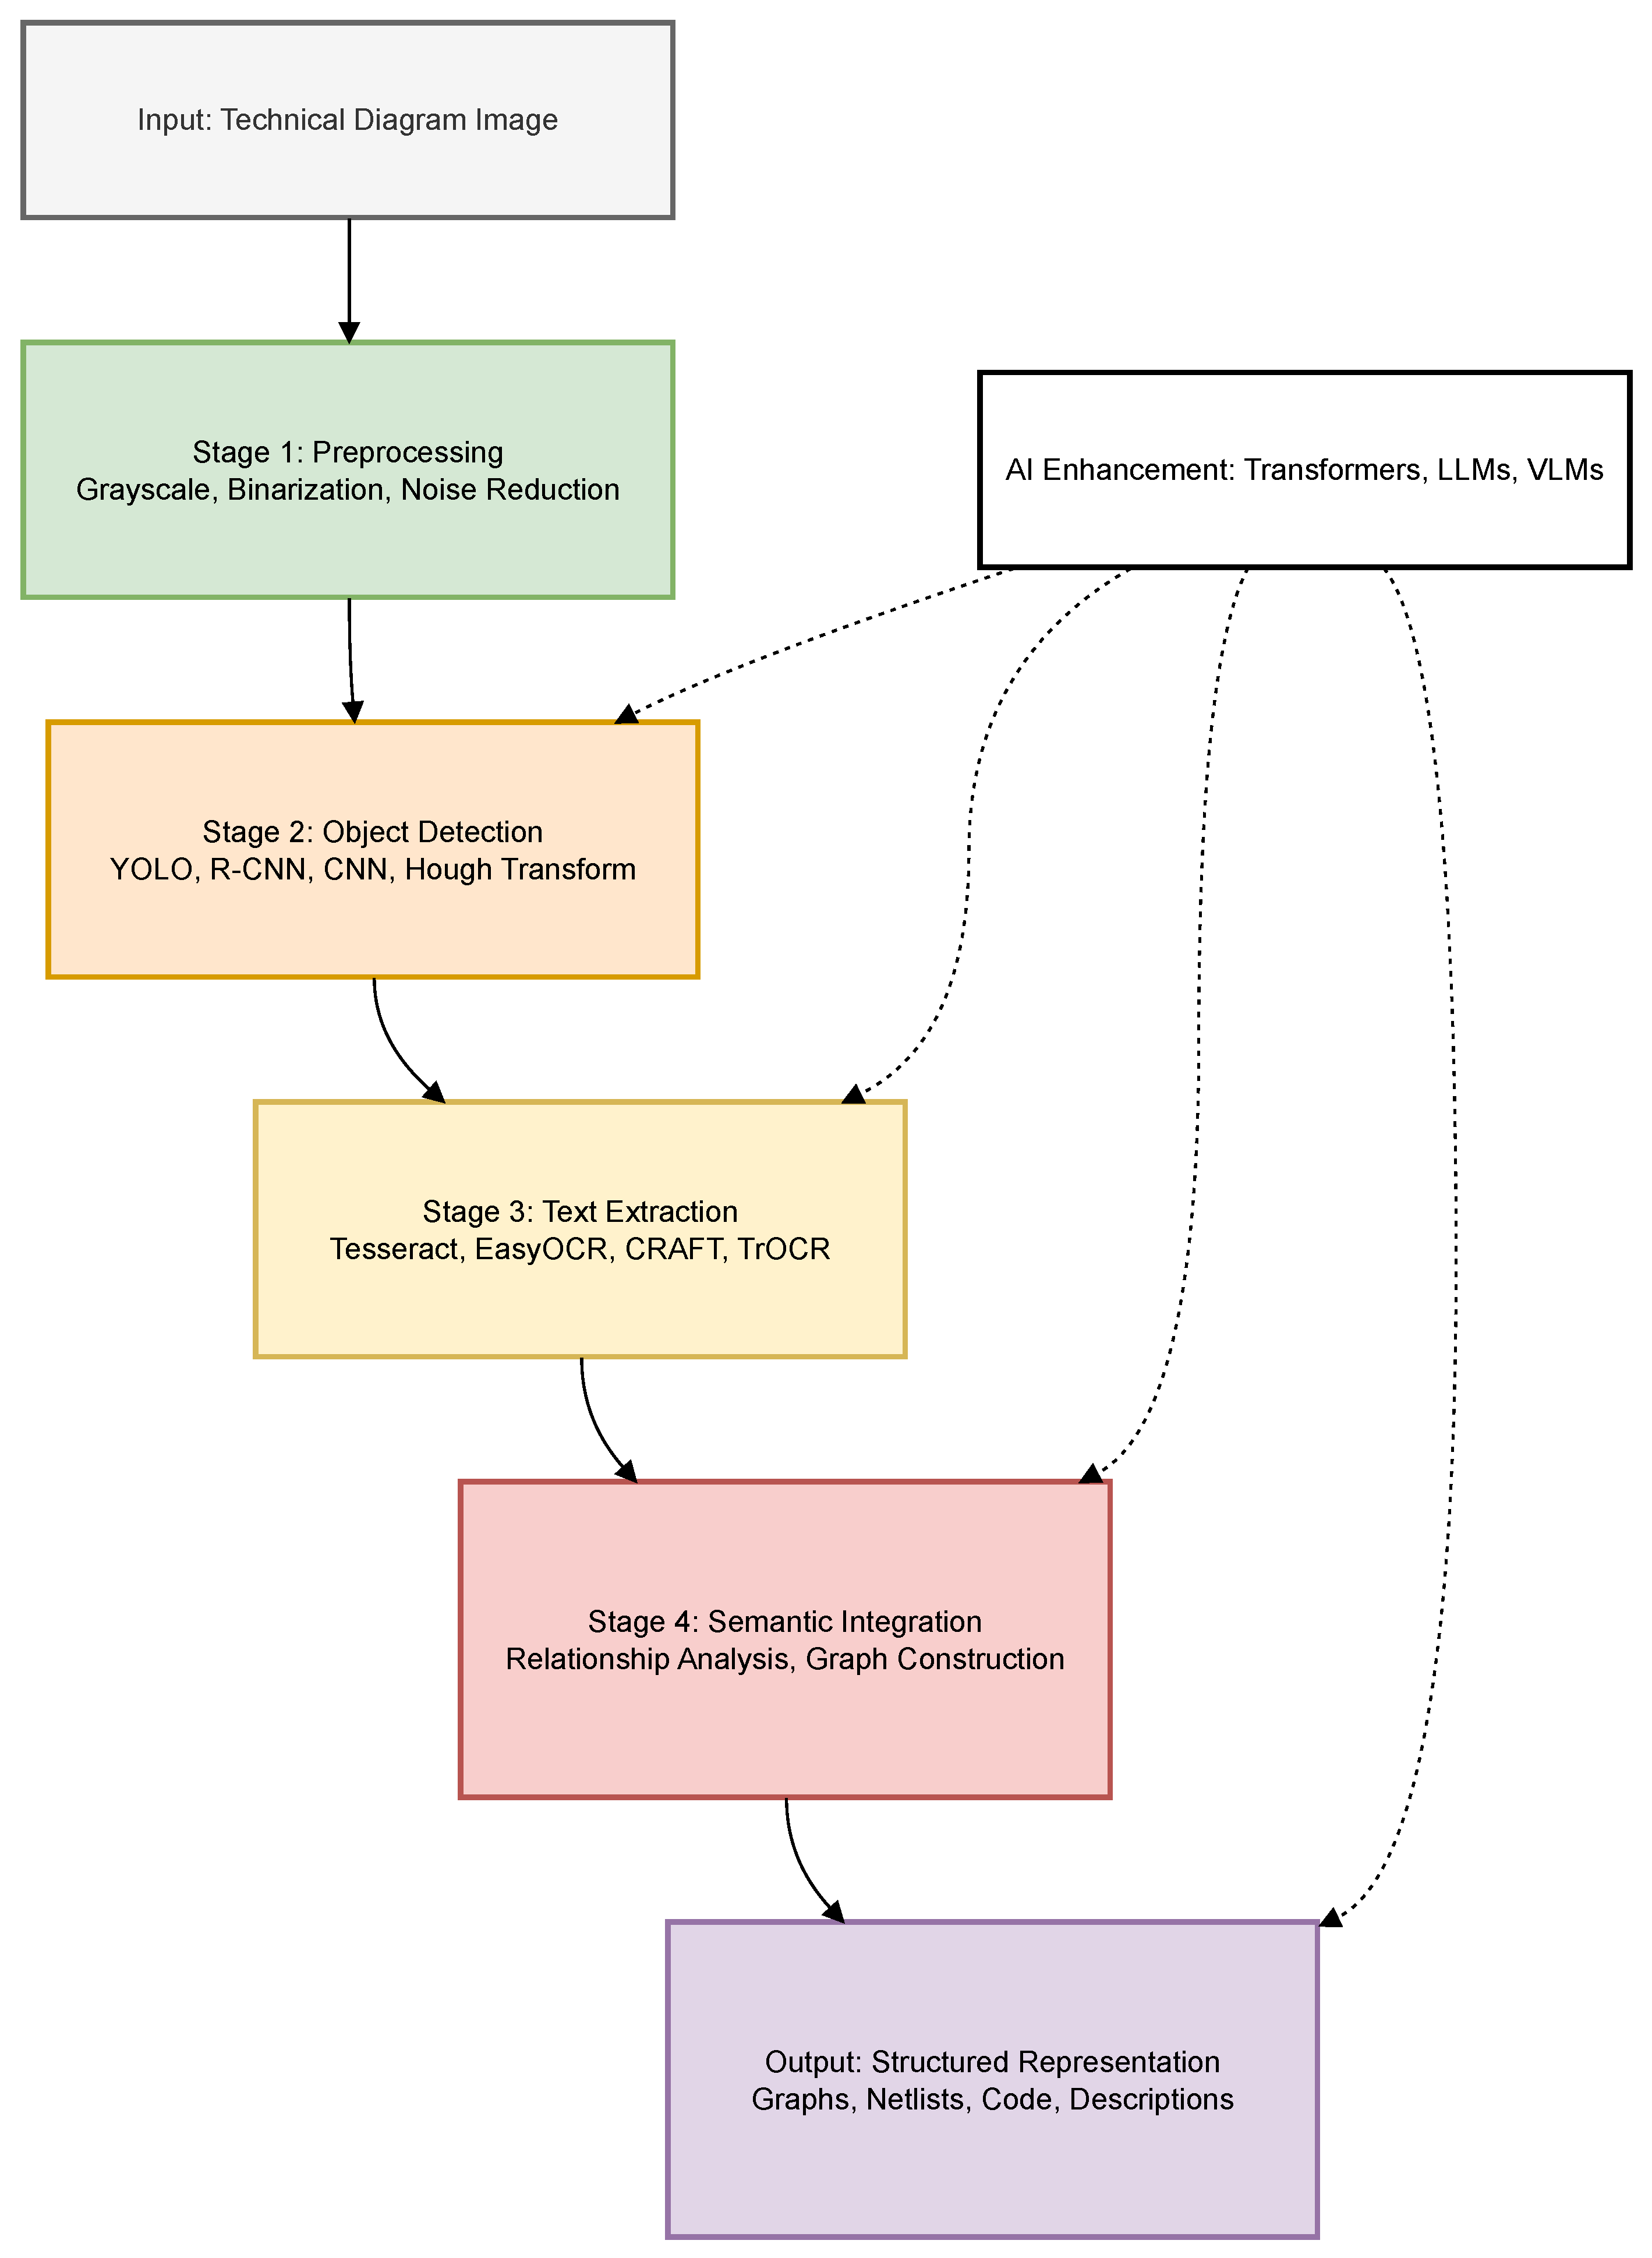
Before examining specific diagram types in detail, we present a unified taxonomy that illustrates the common pipeline components observed across technical diagram extraction methods, shown in Figure 8. Despite variations in implementation and the unique characteristics of different diagram types, most approaches follow a similar architectural structure consisting of five primary stages:
1.
Image Preprocessing—Grayscale conversion, noise reduction, binarization, morphological operations (dilation, erosion), and image enhancement techniques such as Gaussian sharpening.
2.
Object/Shape Detection—Identification of diagram components using CNNs, YOLO variants, Faster R-CNN, or traditional computer vision methods.
3.
Text Extraction—OCR-based text recognition using Tesseract, EasyOCR, PaddleOCR, CRAFT, or TrOCR.
4.
Relationship/Semantic Integration—Analysis of spatial relationships, connection detection (lines, arrows), graph construction, and semantic interpretation.
5.
Output Generation—Conversion to structured representations (graphs, netlists, pseudocode, PlantUML, or natural language descriptions).
Figure 8. Unified pipeline architecture for technical diagram extraction. Common stages are shown with representative techniques used across different diagram types. While the diagram shows a linear flow, Stages 2 and 3 may occur in parallel or in reverse order depending on the specific implementation.
Information 17 00165 g008
The modular pipeline decomposition shown in Figure 8 enables interpretability and targeted optimization of individual stages such as OCR, object detection, and relationship inference. However, this modularity can also amplify errors, as inaccuracies in early stages propagate downstream. Several recent works attempt to mitigate this issue through tighter multimodal fusion or end-to-end learning using transformers or Vision-Language Models, trading interpretability for improved robustness. The surveyed literature reflects an ongoing tension between modular design and holistic optimization.
The following subsections detail how specific methods implement these stages for flowcharts, block diagrams, UML diagrams, electrical schematics, and timing diagrams. While the core pipeline remains consistent, each diagram type presents unique challenges that require specialized adaptations within these stages. It should be noted that while preprocessing always occurs first and output generation last, the order and parallelization of the intermediate stages—particularly object detection and text extraction—may vary across different approaches. Some methods detect objects first and then apply OCR to specific regions, while others extract all text globally before associating it with detected shapes.

4.3. Flowchart Analysis

4.3.1. Review of Identified Papers

In 2020, the authors of [21] proposed using region-based segmentation to convert flowcharts into graph structures, introducing a custom approach for the precise extraction of 2D elements from flowcharts. They reviewed prior work, such as [22], which focused on flowchart extraction from digital images using a neural network, and [23], which developed Flow2Code, a mobile app that converted photographs of hand-drawn flowcharts into executable code. While Flow2Code’s original text extraction was performed using offline sketch recognition and computer vision, to advance flowchart text extraction for increased precision and structure recovery, the authors of [21] proposed and evaluated their own technique. The authors followed a traditional preprocessing step using Gaussian blur for grayscale, Otsu method [24] for image thresholding, and thinning was applied to reduce the image to a single-pixel width. Feature extraction was achieved through region-based segmentation, which separates text and non-text regions, also referred to as regions of interest (ROIs) [25]. Morphological labeling was then used to extract text from corresponding regions, and shape identification was performed by analyzing contour vertices to determine flowchart shapes. The flowcharts were ultimately converted into graph-like structures composed of nodes, labels, shapes, and edges. A final plot was generated to visualize the graph. The Open Source Computer Vision Library (OpenCV) [26] and Python were used for implementation, and their experimental evaluation involved a small dataset of only 25 different flowcharts, which were categorized and converted into graph representations. Each element of the flowcharts was parsed and examined. The approach successfully handled more complex parameters such as scaling, dashed or directed lines, and colored shapes, and achieved 90% accuracy during testing. The content extraction process effectively transformed flowcharts into structured graphs. This result demonstrated the effectiveness of the method in handling diverse graphical features. The authors noted that future work would address greater flowchart complexity and explore alternative extraction methods.
The authors of [27] created their own method of flowchart extraction called graph recognition convolutional neural network (GRCNN) in 2020. The work is motivated by program synthesis techniques, such as FlashFill [28], an algorithm famously used in Microsoft Excel, which takes a set of given input-output text pairs and determines the user-desired text transformation from those samples. Unlike FlashFill’s example-based approach, GRCNN uses flowcharts as specifications for program synthesis. In GRCNN, a CNN is utilized for image content extraction, with an edge network used to transform the feature vector from the CNN into an edge description of the given flowchart. Using this approach, the nodes of the flowchart are identified and also described. A custom dataset comprising 2490 flowchart images was used for the evaluation of GRCNN, featuring flowcharts with 3 to 6 nodes and 0 to 2 decisions. These flowcharts were created using Graphviz [29]. The edge and sequence scores were 94.1% and 90.6%, respectively. However, for node extraction, a relatively low accuracy score of 67.9% was achieved. Consequently, the overall graph extraction accuracy (comprised of edge, sequence, and node extraction) was only 66.4%. This indicated that significantly more research was needed to consistently and accurately extract the structure of a flowchart.
Another approach to flowchart extraction was published in 2020 in [30]. It aims to improve upon other flowchart extraction approaches, such as [31,32], by facilitating the extraction of handwritten flowcharts instead of programmatically generated flowcharts. Images are first acquired using a camera or scanner. It then utilizes the Otsu method to transform each input image via threshold-based binarization, followed by morphological operations (erosion and dilation) and application of the Ramer–Douglas–Peucker (RDP) method [33] for object and line detection, as well as beam search [34] for the handwritten text detection. For evaluating their approach, a small dataset of 20 flowcharts was used. The average word and character accuracies are 66.01% and 86.52%, respectively. While the resulting scores are relatively low, they nonetheless illustrated the potential of this technique and warranted further exploration. The authors themselves stated that their future work aimed to improve the accuracy of flowcharts containing loops and to create more diverse and complex flowcharts.
Another study conducted and published in 2020 utilized deep learning and OCR to convert flowcharts into graphs [35]. The authors referenced earlier works, such as [36], which employed graph grammar for flowchart analysis, and [37], which converts flowcharts into source code. The first step in their presented approach involved image preprocessing to obtain the flowchart in a planar perspective, followed by the application of OpenCV contour detection. For shape recognition, the authors applied Tiny YOLOv3 [38] in conjunction with Darknet [39]—a C and CUDA-based deep neural network (DNN) framework commonly used for implementing YOLO. YOLOv3-SPP (YOLOv3-Spatial Pyramid Pooling) [40] was used for lines and arrow recognition, and Google Cloud’s Vision API was used for OCR-based text extraction. Graph Models (GM) were constructed to represent the flowchart structure, which were then populated with parse trees for each node to create the final Flowchart Graphs (FGs). All experiments were implemented using Python on Ubuntu 18.04. For the performance evaluation of this work, a new dataset comprising 161 images was created, consisting of 38 digital and 123 hand-drawn flowcharts. Using mAP, their presented method achieved an average precision of 99.82% for shape recognition and 88.14% for arrow and line detection. Although these results are promising, the authors emphasize that further improvements could be achieved by using larger datasets and more advanced models. This approach nevertheless demonstrated significant potential for accurately extracting flowcharts. The authors further suggest that it would be worthwhile to develop a mobile application capable of capturing flowcharts and translating them directly into code.
In 2022, Liu et al. [41] proposed FlowChart to Code (FC2Code), a system that extracts text from flowcharts, converts it into pseudocode, and generates executable source code from it. Prior work, such as [42], introduced RAPTOR, a visual programming tool that helps students translate flowcharts into pseudocode. The FC2Code system used a custom dataset of 320 flowcharts with corresponding source code, of which 50 were used for testing. A rule-based structure recognition algorithm was applied to convert flowcharts into pseudocode, while Bidirectional LSTM [43] and Graph Attention Network (GAT) models [44] extracted textual information. To maintain information integrity, Reversed Flowchart, GAT, and the TranX decoder [45] were utilized to convert pseudocode into executable code. Results were compared against LSTM and transformers [46] baselines. Performance was evaluated using the BLEU score, where the proposed method achieved a score of 55.68, compared to 38.25 for LSTM and 44.05 for the transformer baseline approach. As shown, this method significantly outperforms both LSTM and transformer networks. Although effective, the authors note that further work is required to enhance precision and address challenges in integrating flowchart structure into pseudocode.
In 2023, the authors of [47] introduced a public flowchart dataset named FloCo and a method, FloCo-T5, that converts flowcharts into Python code. This method was evaluated using their dataset, which contains 11,884 flowcharts, including both digital and handwritten ones, with 1188 (10%) used for testing. Their presented approach is based on the work in [48], another flowchart dataset but unsuited for programming tasks, as well as the work in [23], which converted handwritten flowcharts into executable code. Additionally, it draws inspiration from the seminal work in [49], the groundbreaking work that introduced BERT for NLP language representation. Closely related is the work in [50], which digitizes handwritten flowcharts using Faster R-CNN and OCR methods, though its dataset lacked corresponding C codes. A Hough transform (HT) [51] was employed for shape recognition, EasyOCR was used for text recognition, while Code-T5 [52] was employed for source code generation. Handwritten text detection was handled using Character-Region Awareness For Text Detection (CRAFT) [53], and TrOCR was used for text recognition. To support their evaluation efforts, data augmentation was performed to increase the size of the available dataset, and a BERT-like Code-T5 masked modeling pre-training strategy was employed to enhance the structural and semantic understanding of code and flowcharts. Positional encoding was added to flowchart encodings before feeding to the transformer encoder. A single NVIDIA A6000 with 48GB VRAM was used for training. On the digital flowchart test set, the proposed method achieved a BLEU score of 67.4 and a CodeBLEU score of 75.7. On hand-drawn flowcharts (40 samples), BLEU and CodeBLEU scores of 21.4 and 34.6 were achieved. Although effective on digital flowcharts, the authors note that extracting hand-drawn flowcharts into Python source code required further study. Future efforts thus aim to expand the dataset with more complex code samples and improve performance on longer programs.
In 2024, Darda and Jain introduced a system that extracts flowcharts and generates Python code [54]. It builds upon the work in [37,41]. This work was influenced by the preceding efforts in [55], which introduced and presented S-DistilBERT, along with Ray et al.’s Flow2Code published in 2019 [56] used for processing pictures of handwritten flowcharts and converting them into executable code. Darda and Jain utilized EasyOCR and OpenCV for text extraction, and employed Llama 2 LLM [57] for Python code generation via a cloud-based API. Python code generation was successful for 75% of the flowcharts, and the method produced accurate source code, even when 62% of the flowcharts had added noise. However, the authors also note that improvements are needed for more accurate text extraction and to provide multilingual capabilities.
As shown by these works, the advancements in LLMs have enabled new techniques for flowchart information extraction, which prove to be quite effective across a range of different imagery. However, significantly more work is needed to improve accuracy and precision, which the following works aim to address.
Another study in 2023, Ghosh et al. [55] proposed a fine-tuned S-DistilBERT model for matching handwritten flowcharts, pseudocode, and English descriptions. The model combines Sentence-BERT (S-BERT) [58] with DistilBERT [59], a lightweight variant of BERT [49]. Their work builds upon prior research in flowchart recognition, including online handwritten flowchart recognition systems [60] and document generation from flowcharts [30,61]. Their experiments utilized 50 handwritten flowcharts, each with manually created pseudocode and descriptions for validation. Binarization, thinning, and polygon detection were used for preprocessing the data, and a third-party text OCR application was used for text recognition. Pseudocode symbols were converted to English equivalents before embedding. The system successfully generated equivalent pseudocode in 85% of cases and achieved matching accuracies of 75.59% for existing pseudocode-to-text pairs and 74.57% for generated pseudocode. This work demonstrated that transformer-based approaches are effective for algorithm-to-text matching tasks. The authors note that recursive flowcharts may be addressed in future work.
Several studies published between 2024 and 2025, such as [62,63,64], all reference FlowLearn [65] to enhance dataset annotation and architectural performance.
For example, the authors of [62] introduced TEXTFLOW, a dual-stage framework for flowchart understanding that decomposes the task into vision textualization and textual reasoning. Building upon prior work in flowchart understanding, such as FlowchartQA [48], which emphasizes reasoning over geometric and topological features, the authors addressed limitations in end-to-end VLM approaches by separating visual extraction from logical reasoning. TEXTFLOW was evaluated on FlowVQA [66] (2005 QA pairs from 200 sampled flowcharts) and FlowLearn [65] (seven tasks with 100 flowchart/QA pairs each) datasets. The framework explores three alternative textual representation formats—MERMAID, GRAPHVIZ, and PLANTUML—with GRAPHVIZ proving most effective. The system utilizes Vision-Language Models (VLMs) such as Claude 3.5 Sonnet [67], GPT-4o [68], and Qwen2-VL [69] for the vision textualization stage, and either VLMs or LLMs for the reasoning stage. Experiments were conducted using 1 to 4 NVIDIA A100 (80GB) GPUs depending on model requirements, with no model training performed. The system achieved state-of-the-art performance, with 82.74% accuracy on FlowVQA and 80.57% on FlowLearn. Notably, tool-assisted methods achieved an accuracy of 88.23% on FlowVQA. The authors note that future work should address extraction accuracy, dataset diversity, and generalizability to more complex diagram types.
The authors of [70] proposed GenFlowchart, a generative AI-enhanced framework for automated flowchart parsing and understanding. The approach builds upon prior work in flowchart recognition [37,71] and flowchart-grounded task-oriented dialogs [72]. GenFlowchart employs a multi-stage pipeline: images are preprocessed via grayscale conversion and binarization, text is extracted using Pytesseract OCR configured with Page Segmentation Mode (PSM) 4 and OCR Engine Mode 3, and geometric shapes are identified using the Segment Anything Model (SAM) [73]. The textual and geometric data are then integrated using GPT-3.5 Turbo with prompt engineering techniques (zero-shot and instruction-based prompting). The system was evaluated on a dataset of 550 flowcharts extracted from patent documents using PyMuPDF. Multiple evaluation metrics were employed: manual satisfaction scoring (achieving 4.24/5), BERT Score metrics (with instruction-based prompting achieving BERT-F1 of 86.49), Cosine Similarity with Word2Vec [74] (72.38%), and Cosine Similarity with sentence transformers (76.25%). An ablation study demonstrated SAM’s critical role, as its removal reduced satisfaction scores from 4.24 to 3.14. The results demonstrated that generative AI significantly enhances flowchart parsing and understanding.
In [75], the authors present FR-DETR (Flowchart Recognition DEtection TRansformer), an end-to-end multi-task network for machine-generated flowchart recognition. FR-DETR builds upon DEtection TRansformer (DETR) [76] and LinE segment TRansformer (LETR) [77], combining object detection and line segment detection in a unified framework. The architecture employs a CNN backbone (ResNet-50/101) for feature extraction and a multi-scale transformer structure with shared encoders and separate decoders for encoding and decoding. A coarse-to-fine strategy enables the model to first analyze low-resolution features (1/32 scale) to identify potential target regions, then examine high-resolution features (1/16 scale) for precise detection of symbols and line segments. The model was evaluated on two datasets: CLEF-IP (approximately 60 flowcharts) and a newly constructed dataset of 1000+ flowcharts (800 training, 200 testing) with 25K+ symbol instances and 20K+ line segments. FR-DETR achieved 98.7% precision and 98.1% recall on CLEF-IP (F1-Score: 98.4%), and 94.0% precision with 93.1% recall on the new dataset (F1-Score: 93.5%), outperforming prior methods. However, the authors note that the model’s computational requirements limit its applicability for real-time processing and mobile deployment, which remained a direction for future research.
A graph neural network-based method for handwritten flowchart recognition was introduced in 2022 by Yun et al. [61], building on the work shown in [60,78], among others, with the goal of improving upon their overall performance and accuracy. The authors proposed Instance GNN (InstGNN), a framework that represents each flowchart as a graph where nodes represent strokes and edges represent relationships between strokes. The method extracts 27 node features and 19 edge features, then employs GAT for learning. InstGNN performs three tasks: node classification, edge classification, and node embedding learning. Three inference methods were proposed: InstGNN-EC (edge-based), InstGNN-NE (clustering-based), and InstGNN (combining both). Symbol verification uses a ResNet-18 CNN classifier [79]. The framework was implemented using Deep Graph Library (DGL) with PyTorch and evaluated on four datasets: FC_A [80], FC_B [81], FA [82], and CASIA-OHFC (2957 flowcharts—a new dataset created by the authors). The method achieved a Stroke Classification Accuracy (SCA) of 95.80% and Symbol Recognition Recall (SRR) of 79.47%, outperforming previous methods.
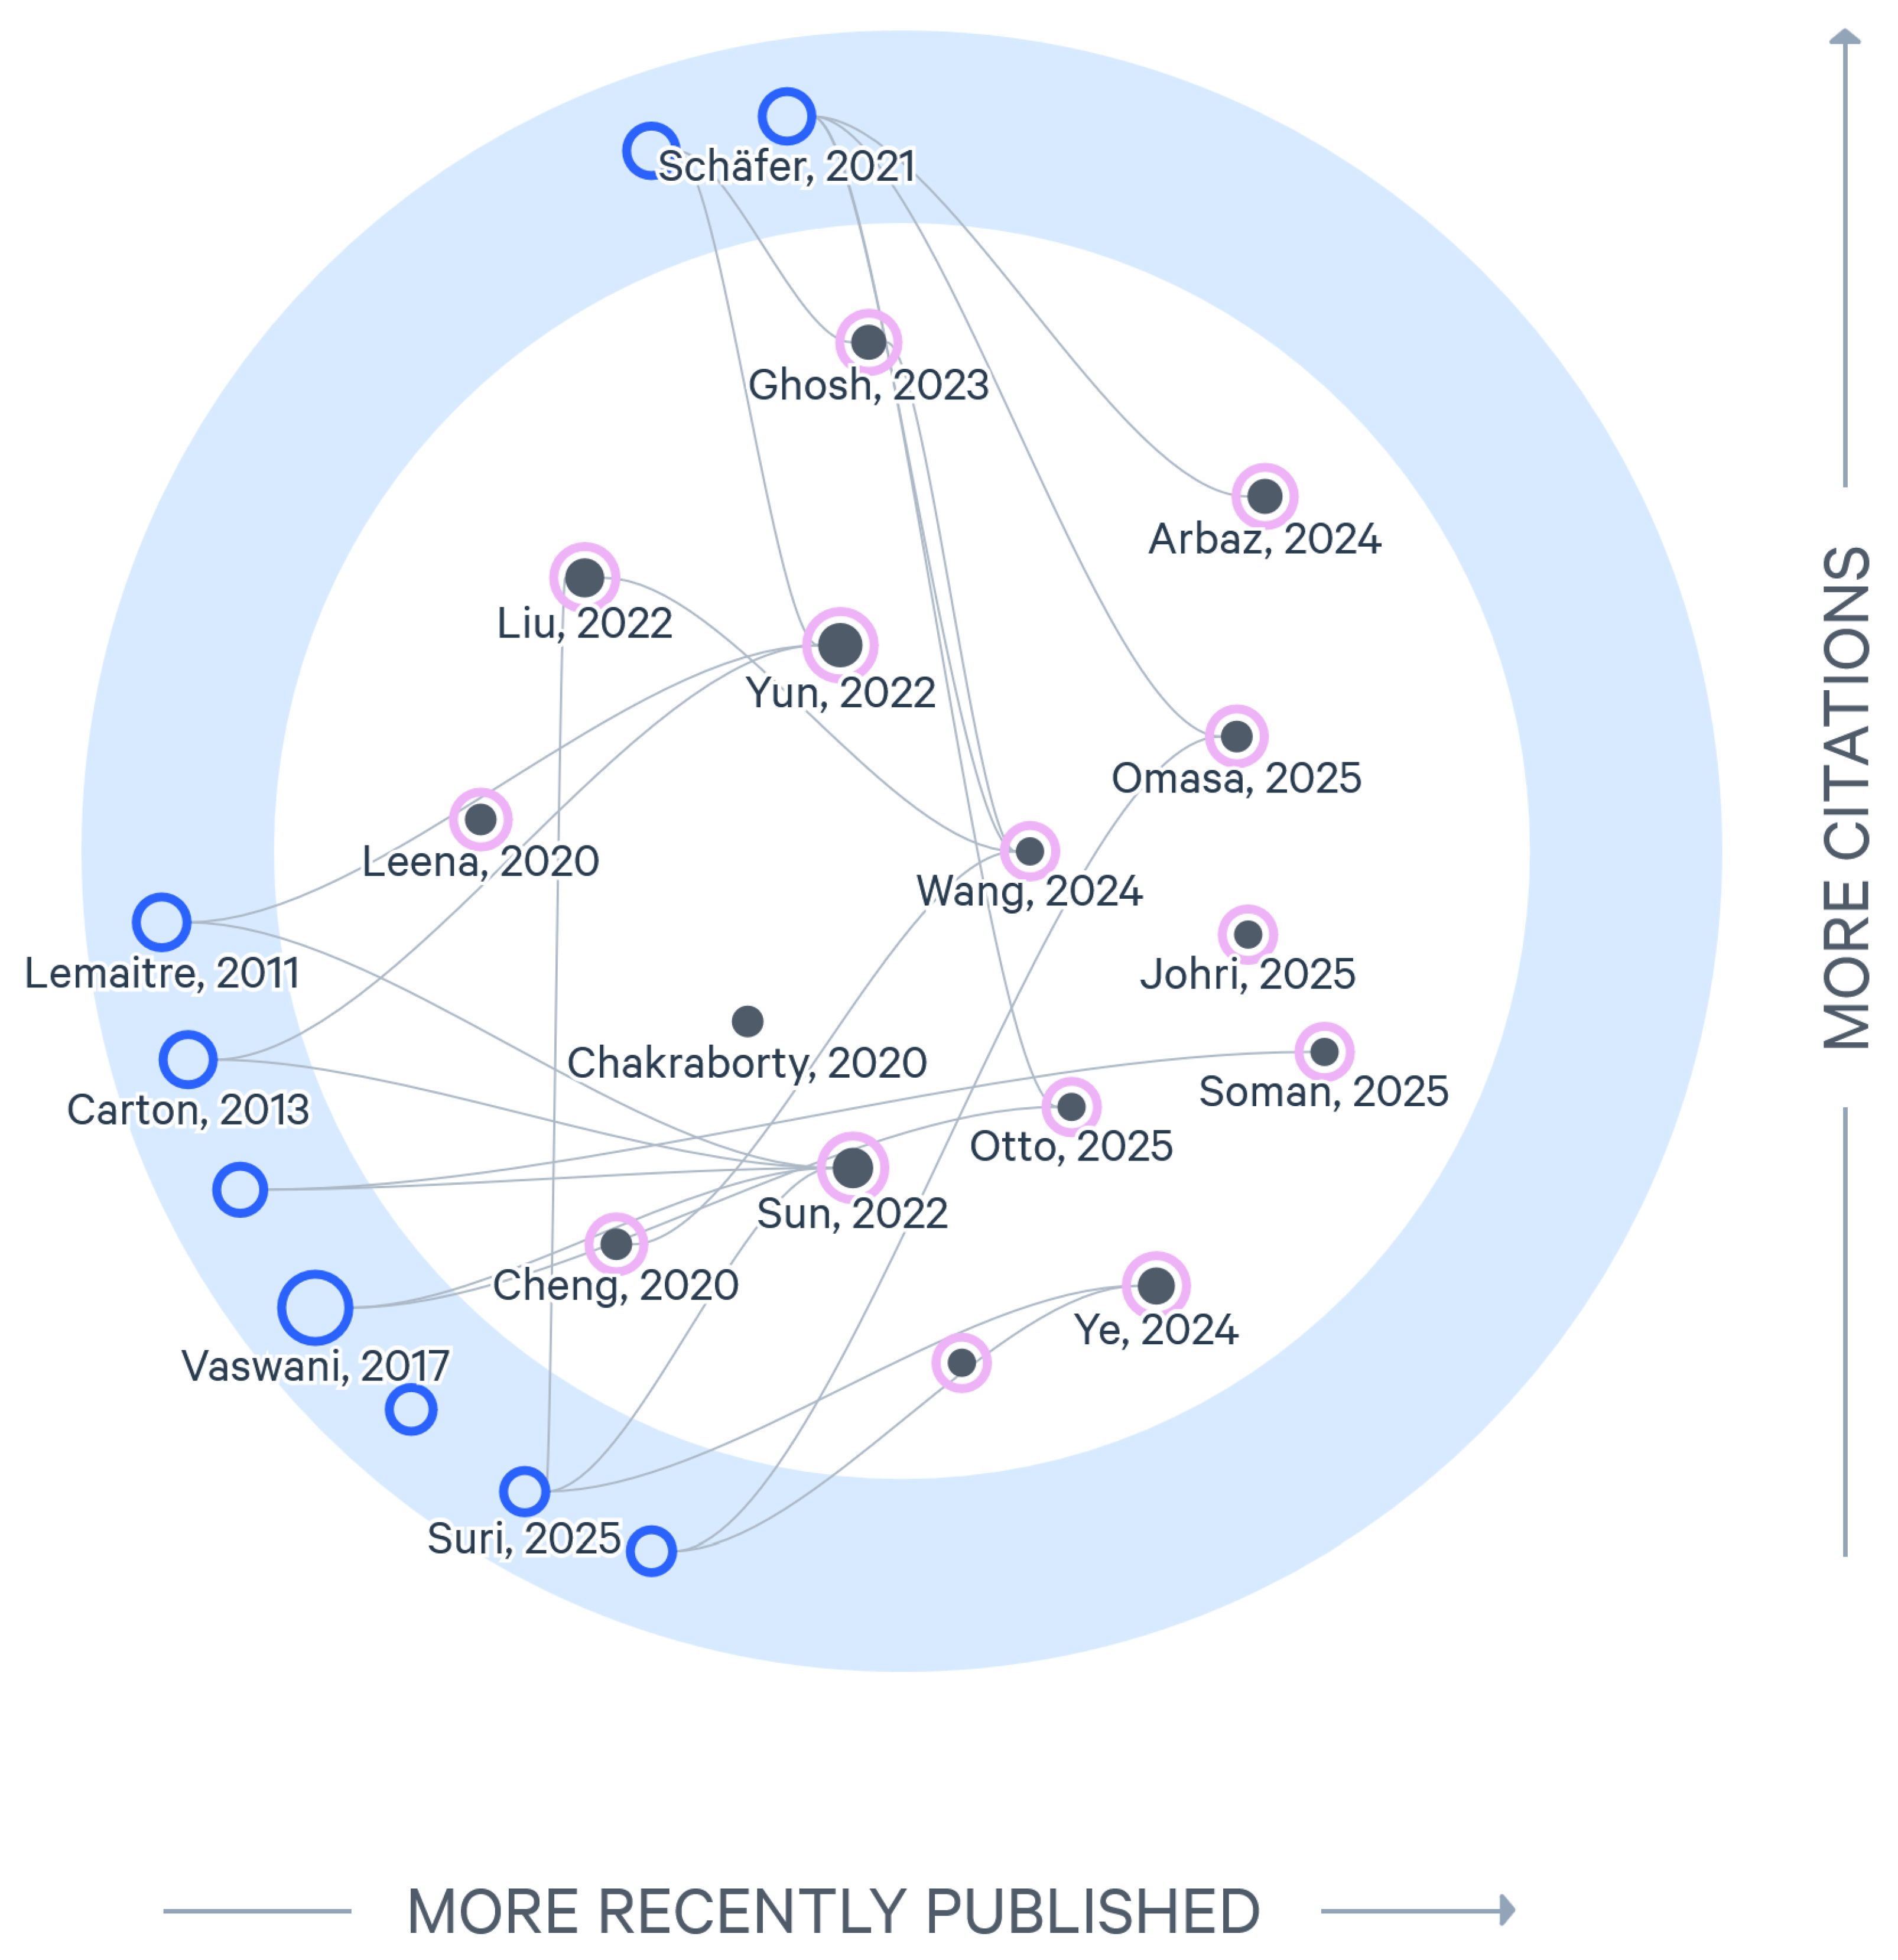
Flowchart extraction has recently received increasing attention, with 2025 seeing the highest number of methods developed, as illustrated in Figure 9. This view was generated using Litmaps, which shows the connectedness of the papers discussed in this section, with related works identified in the blue ring.
A 2025 study introduced LS-DETR [83], targeting handwritten flowchart recognition, referencing several prior works in flowchart recognition [27,41,47,55,75,84]. LS-DETR enhances the DETR decoder with two novel mechanisms: learnable reference boxes to quickly locate features and semantic alignment to query region-level features. The system uses LS-DETR for border recognition and DPText-DETR [85] (a separate model) for text recognition, which handles arbitrary-shaped text using Enhanced Factorized Self-Attention (EFSA). A key contribution is the introduction of logic rules based on program execution principles and flowchart construction principles to analyze flowchart structures, verify sequential and loop structures, and calculate loop iterations. The framework was trained on four NVIDIA A100 GPUs and evaluated on multiple datasets: V3-Flowchart and UPV3-Flowchart (620 test) for borders, GFTotal-Text (200 test) for text, and a custom set of 150 handwritten flowcharts for logic rule validation. LS-DETR achieved 99.18% AP at IoU = 0.5 on UPV3-Flowchart, representing a 2.39% improvement over DETR, with convergence speed 8.3 times faster. The logic rule-based analysis successfully verified 85 test cases covering sequential and loop structures. The authors also experimented with code generation using FLoCo-T5 [47] for flowcharts that passed logic rule verification, though improvements in flowchart-to-code translation remained a future direction.
Figure 9. Citation graph visualization for flowcharts [21,27,35,41,55,61,62,63,64,70,75,83,86,87,88,89,90,91,92].
Information 17 00165 g009
In 2025, Omasa et al. [63] focused on improving the arrow precision and noise reduction that limited prior work like GenFlowchart [70]. Their work builds upon GenFlowchart, along with [65], and also discusses their approach in the context of FloCo-T5 [47] and GRCNN [27], which serve as foundational inspirations. Using OCR for text extraction and DAMO-YOLO [93] for object detection, they combined OCR and detection data to identify arrow start–end pairs by annotating arrow endpoints as separate small bounding boxes. The extracted text and spatial coordinates are then serialized into coordinate-rich prompts—with each token annotated by its normalized (x, y) position—enabling GPT-4o to infer edge orientations and perform reasoning over the flowchart topology. Evaluated on 90 questions across 30 flowcharts using human evaluation as the primary metric, the method achieved 88.9% overall question-answering accuracy compared to 80% for the image-only baseline. Performance was particularly strong on next-step queries (100% accuracy, up from 83.3%), though previous-step queries remained challenging (50% accuracy). The authors acknowledged that additional work was needed to scale the benchmark, enhance graph-based prompting, integrate confidence-aware reasoning, and refine evaluation methods for robust and generalizable real-world deployment.
Another VLM-based approach was published in 2025 by Soman et al. [64]. Their work references FlowVQA [66] and FlowLearn [65] as addressing flowchart-to-graph conversion, while identifying a gap in flowchart retrieval for RAG systems. Their method first classifies images using a fine-tuned document image transformer (DIT) [94] model, then converts flowchart images into directed graph structures (JSON format) using a fine-tuned Qwen2-VL model. The VLM was fine-tuned on 10,000 synthetic flowcharts from the FlowLearn dataset (augmented with additional synthetic data) and evaluated using Graph Edit Distance (GED) [95], achieving a GED of 2.74 on the FlowLearn test set, compared to 10.21 for the base model. The authors then embedded these graph structures as text and integrated them into a RAG system, evaluating retrieval performance on 105 proprietary telecom flowcharts with 502 QA pairs using TeleRoBERTa [96] and bge-large [97] embedding models. The system achieved 71.91% top-3 retrieval accuracy using TeleRoBERTa with the “all nodes as one chunk” approach. A key advantage of this method is that it avoids the need for VLMs during inference, significantly reducing deployment costs. The authors discussed plans to evaluate end-to-end generation performance and extend the approach to other technical diagrams, such as UML sequence diagrams.
The author of [98], published in 2025, introduced a unified multi-modal framework for automated software diagram generation, building upon prior work in conceptual modeling and image-to-code conversion [54,99,100]. The approach combines image preprocessing (rescaling, grayscaling, binarization) with a hybrid OCR methodology that merges Tesseract for raw text extraction and GPT-4o for contextual error correction, enabling robust processing of both computer-generated and hand-drawn diagrams. While initially exploring RAG to enable external document integration, the final system adopted a streamlined approach using diagram type identification to retrieve relevant Domain-Specific Language (DSL) documentation. The system was evaluated across diverse diagram types (class diagrams, flowcharts, C4 models) using datasets created with Mermaid, PlantUML, Structurizr [101], Graphviz, and Diagrams as Code, with evaluation focusing on compilation success, consistency, and accuracy metrics. Mermaid achieved 100% compilation success rates (18/18) in optimal configurations, significantly outperforming PlantUML (12/18) and Structurizr (2/18). Future work includes developing agentic AI for dynamic diagram type determination, enhancing usability through improved UI and integration, refining document structuring with flexible rules, strengthening diagram compilation with multi-DSL validation and feedback loops, and expanding the dataset to improve generalization and output quality.
Another 2025 study by Johri et al. [86] introduced an API-based flowchart-to-code generation system that integrates multiple transformer models. Building upon work in RNN/LSTM limitations and LLM applications [102,103], their architecture employs a pipeline consisting of a Main API coordinating with specialized services: an Image Upload Service for flowchart processing, GPT-4 Vision API for visual content extraction and validation, and a Processing Service API utilizing multiple LLMs (GPT-4o mini and Claude 3.5 Sonnet) for code generation. The system extracts tokens from flowchart elements (decision points, processes, input/output operations) and converts them into functional code across multiple programming languages. The authors selected GPT-4o based on its superior performance on standard benchmarks (Artificial Analysis Quality Index score of 77 and HumanEval coding efficiency of 92%), though they do not report quantitative evaluation results for their own system. The paper demonstrated successful code generation for algorithms including stack insertion, odd/even detection, and merge sort. The authors acknowledged limitations in handling complex or hand-drawn flowcharts and outlined future work to enhance visual recognition capabilities, support additional programming languages, and integrate with development environments and version control systems.
Several papers published in 2025 demonstrated that multi-modal LLMs can compete with purpose-built computer vision frameworks for diagram recognition. Otto et al. [87] introduced an LLM-based approach for state diagram recognition and code generation in Industry 4.0 contexts. Their pipeline involves manual cropping from PDFs, prompt-engineered GPT-4o for node/edge extraction, and template-based C++ code generation. Evaluated on IEC 61158 (PROFINET, 80 diagrams) and IEC 62541 (OPC UA, 15 diagrams), GPT-4o achieved 68% zero-shot accuracy, outperforming Claude 3 (40%) and Llama 3 (16%). Practical edge recognition reached 63% for PROFINET and 45% for OPC UA, enabling the generation of thousands of lines of boilerplate code and unit tests. The study demonstrated that LLMs generalize across diagram styles without retraining, unlike computer vision models, though they required prompt engineering and manual review for complex diagrams.
Finally, the work presented by Pawar [104] introduced the Dynamic Flow-to-Code Generator (DFCG), a system for automated flowchart-to-code translation across multiple programming languages. Building upon sketch-based flowchart detection [105] and prior code generation frameworks [41,47,106], the DFCG employs a multi-stage pipeline integrating computer vision and deep learning techniques. The system uses binarization and edge enhancement for preprocessing, Faster R-CNN with a VGG-16 backbone for shape detection, a Region Proposal Network (RPN) for object localization, Keras OCR combined with a CRNN model for text recognition, Probabilistic Hough Transform for arrow detection, and Graph Neural Networks (GNNs) for constructing logical flowchart representations that are then translated into C, C++, Java, and Python code. Evaluated on a dataset of 7500 segmented flowchart symbols (derived from 775 full diagrams) and 100 manually drawn flowcharts, the shape detection module achieved 95.8% for mAP and F1-Score. The end-to-end system demonstrated 95.0% Graph Matching Score (GMS) for flowchart reconstruction and 92.4 BLEU score for code generation, outperforming baselines including FloCo-T5 and FC2Code. Future improvements include expanding language support, integrating LLMs for enhanced code quality, improving handwriting and complex graph recognition, optimizing for mobile deployment, and adding multimodal inputs such as speech-to-code and sketch-based flowchart creation.
In this section, we surveyed a wide variety of image content analysis approaches for flowchart images. Table 2 summarizes these studies.

4.3.2. Flowchart Review Summary

Of the 19 methods reviewed, we observe that nine reported performance metrics that demonstrate a strong ability to successfully conduct this task, while 10 of the surveyed papers reported results that we would deem insufficient for many real-world applications. Despite substantial progress in this domain, we observe that none of the techniques have demonstrated consistently high performance across all tested flowchart images. Thus, we conclude that further improvement is needed in areas such as dataset quality, arrow and line recognition, and comprehensive flowchart extraction.

4.4. Block Diagram Analysis and UML Diagram Analysis

Our survey identified only very few research works specifically related to extracting content from Block Diagrams and UML Diagrams. We believe that this stems from the close relationship between flowcharts and the block and UML diagrams, as most works related to image content analysis can utilize the work already performed for flowcharts.

4.4.1. Review of Identified Block Diagram Papers

In 2022, BloSum [107] was published for block diagram-to-text generation using OCR and deep learning models. Unlike template-based approaches, such as Chart-Text [108], BloSum employed a generic framework without predefined templates. The authors created a Computerized Block Diagram (CBD) dataset containing 502 diagrams (300 training, 106 validation, 96 test) with over 13,000 annotated elements, and extended two handwritten datasets: FC_A (248 training, 171 test) and FC_B (280 training, 196 validation, 196 test) by adding summaries and triplets. The BloSum architecture used Faster R-CNN with FPN [109] and Inception-ResNet-v2 [110] for shape prediction, EasyOCR for text extraction, Hough Line Transform (HLT) for arrow detection, and a Triplet Generator to convert shape-arrow relationships into <head, relation, tail> format. T5 [111] and BART language models, pre-trained on WebNLG 2017 [112] and fine-tuned on the block diagram datasets, generated final descriptions. BloSum with T5_Large (770M parameters) achieved BLEU of 42.86 and ROUGE-1 of 81.29 on the CBD dataset. When using ground-truth OCR values, performance on handwritten datasets improved to BLEU of 51.73 and ROUGE-1 of 88.24 on FC_A, and BLEU of 53.17 and ROUGE-1 of 85.56 on FC_B. The authors identified key challenges, including the complexity of accurately detecting arrows, the relatively low accuracy of OCR for handwritten text, hallucinations in language model outputs, and the need for larger-scale datasets.
In 2024, another framework for block diagram extraction was introduced called BlockNet [113]. This paper referenced BloSum [107], due to the similarity of block diagram extraction. The authors stated that BloSum can suffer from hallucinations due to the use of language models. They also pointed out the smaller dataset size of BloSum (502 images total for CBD) as a contributing factor. BlockNet, by comparison, used a dataset of 83,394 images (BD-EnKo), with 75,034 samples used for training. Other related work mentioned involved symbol detection using Faster R-CNN. To create the BD-EnKo dataset used by BlockNet, Mermaid code was utilized for block diagram creation and visualization, along with the addition of noise, blur effects, and grayscale effects to the images to enhance the robustness of the resulting BlockNet approach. GPT-3.5 was used for both generating the Mermaid code and creating text descriptions for the block diagrams. The BD-EnKo dataset comprised 83,394 English and Korean block diagrams, consisting of 46,599 English samples and 36,795 Korean samples across eight distinct diagram types (Flowchart, GraphLR, GraphTD, Journey, Sequence, Simple Graph, State Diagram, and C4), as well as real-world samples. The authors divided their technique into three key components: a local extractor, a global extractor, and an integrator. In the local extractor stage, YOLOv5 was utilized for object detection, trained on the CBD, FC_A, and FC_B datasets. The Pororo OCR package was used due to its support of both English and Korean text. A custom algorithm called BlockSplit divided block diagrams into sub-diagrams containing two connected nodes, utilizing the Triplet Generator to represent shapes, arrows, and their relationships in the format <head, relation, tail>. In the global information extraction stage, the Swin Transformer [114] was employed as the visual encoder, and BART was used for text decoding. In the integrator stage, to minimize errors, GPT-4V was utilized to combine local and global information and to output a final summary of the given block diagram. On the CBD dataset, BlockNet achieved a BLEU of 72.31 and a ROUGE-1 of 88.9. On the BD-EnKo English subset, BlockNet achieved a BLEU of 58.61 and a ROUGE-1 of 74.25. This demonstrated that using a larger dataset and a more complex fusion-based framework can achieve higher precision and accuracy. Nonetheless, the reliability of these approaches remains a significant challenge when applied to a wide range of diagram images of varying quality.

4.4.2. Block Diagram Review Summary

Table 3 shows the high-level comparison of the surveyed approaches. For both BloSum and BlockNet, the published results demonstrate the viability of the presented approaches, while also highlighting the potential for further performance improvements. Both methods indicate that they encountered significant errors at the end stage, making them unsuitable for everyday use.

4.4.3. Review of Identified UML Diagram Papers

One UML diagram extraction approach proposed by [115], named ReSECDI, builds upon earlier methods such as Img2UML [116] and the work of [117]. The method applies image preprocessing techniques, including grayscale conversion, Gaussian sharpening, dilation, and erosion. OpenCV was used to detect class rectangles through polygon approximation and contour detection, while Hough transforms, polygonal line merging, and relationship target integration were employed to identify diagram relationships. Relationship type extraction incorporated AForge.NET and Point-Polygon techniques [118] for shape checking, along with a custom double-recognition-approximation method to handle low-resolution relationship-type symbols (triangles, arrows, and diamonds). Subsequently, text extraction from classes was performed using Tesseract-OCR. The evaluation was conducted on 30 UML diagrams created using StarUML, Enterprise Architect (EA), and Rational Rose, using precision and recall metrics. Performance was reported for class recognition and four relationship types: generalization, realization, dependency, and aggregation. The calculated overall F1-scores for relationship extraction were 88.39% for StarUML, 91.63% for Enterprise Architect, and 89.33% for Rational Rose. Additional evaluation on 50 diagrams from open-source communities yielded an F1-score of 91.91% for relationship recognition and 97.88% for class recognition. This evaluation shows promising results for UML extraction, although challenges remain with gradient backgrounds, low-resolution images, overlapping text, and complex polygonal lines. Future work aimed to extend the approach to additional diagram sources, evaluate robustness across more diverse datasets, and compare against a broader range of recognition techniques.
In 2022, Weerasinghe et al. [119] introduced Smart UML, an assignment management tool for automated UML diagram plagiarism detection and correctness evaluation. Building upon prior work in natural language processing for UML generation [120,121] and diagram similarity measurement [122,123], the authors developed a system that processed both use case and class diagrams. The approach employed Faster R-CNN for detecting actors, use cases, and relationships in use case diagrams, and a Single Shot Detector (SSD) model for identifying classes and relationships in class diagrams. For text extraction, the system used Tesseract OCR combined with Keras-OCR for preprocessing. A custom algorithm identified relationship endpoints by analyzing contour coordinates and bounding boxes to determine connectivity between diagram components. The extracted components were stored in a database as structured text, enabling both plagiarism detection (by comparing student submissions) and correctness calculation (by comparing against instructor-provided model answers). The system generated answers automatically from natural language question scenarios using heuristic rules and spaCy for noun/verb extraction. Evaluation was conducted on small custom datasets: 100 use case diagrams for the Faster R-CNN model and a separate set for class diagrams using the SSD model. The overall system achieved 90% accuracy for automated model answer generation. For plagiarism and correctness metrics, formulas based on component matching were proposed, though specific accuracy scores for these metrics were not reported. The authors acknowledged that future work should address hand-drawn diagrams, expand to additional UML diagram types (sequence, activity, component diagrams), and improve the handling of complex diagram structures.
Another UML sequence diagram extraction approach named Sequence Diagram Extraction (SDE), from [124], was inspired by [115]. The method first applied image preprocessing techniques, including grayscale conversion and morphological operations, to reduce noise. YOLOv5 was then employed for object detection. OpenCV was used to precisely localize, segment, and crop each detected region. EasyOCR was subsequently applied for text extraction. Finally, a semantic merging process integrated the extracted elements to reconstruct the comprehensive semantics of the sequence diagram. 50 sequence diagrams were used to evaluate the performance of the SDE architecture. The SDE method achieved nearly perfect detection for objects (100% precision, 98% recall, 99% F1-score) and strong performance for messages (87.27% precision, 86.03% recall, 87% F1-score), while detection of complex combined fragments was less reliable (73.33% precision, 70.13% recall, 72% F1-score). Overall, the method demonstrated robust performance for simpler diagram elements but highlighted challenges in accurately detecting more complex constructs. The authors noted that future work would focus on developing a more robust method to improve performance, particularly for complex fragments.
Additionally, Conrardy and Cabot [100] evaluated four vision-capable LLMs (GPT-4V, Gemini Pro, Gemini Ultra, and CogVLM) for converting handwritten UML class diagrams into PlantUML notation. Using four diagrams of varying complexity, they measured mistakes and syntax errors. GPT-4V significantly outperformed other models with zero syntax errors (0/36 attempts) compared to 44–56% error rates for other LLMs. The study found that diagram complexity negatively affected accuracy and that simpler prompts were more effective. Despite strong results, human validation remained necessary. Future work included extending to other diagram types and implementing automated validation.
Finally, Bates et al. [125] proposed a method for converting UML diagram images directly into PlantUML code, building on prior works such as [100,115]. Their approach leveraged LLaVA-1.5—a multimodal large language model (MM-LLM) [126]—for generating PlantUML code from activity and sequence diagrams. They evaluated four dataset sizes (small, medium, large, and extra-large) using two fine-tuning strategies: standard fine-tuning and Low-Rank Adaptation (LoRA) [127]. The models were configured with either 7B or 13B parameters. In evaluations on the extra-large synthetic dataset containing 29,998 sequence diagrams and 30,000 activity diagrams for testing, the LoRA-tuned LLaVA-13B model achieved peak performance metrics of 77.9 for BLEU and 94.2 for Structural Similarity Index Measure (SSIM) [128] on sequence diagrams. These results demonstrate that large-scale synthetic training effectively enhances the model’s ability to maintain syntactic and structural fidelity. Notably, sequence diagrams significantly outperform activity diagrams due to their lower structural complexity. The authors suggested that future research should focus on testing a broader range of models and architectures to further bridge the generalization gap observed in real-world applications.

4.4.4. UML Diagram Review Summary

Table 4 summarizes the UML diagram extraction methods discussed in this part of our survey. It is estimated that most of the methods demonstrate promising results for automated extraction of class diagrams, while some represent earlier efforts that laid the groundwork for more robust and accurate approaches. Across all methods, there is clear potential for further evaluation using larger and more diverse datasets to comprehensively assess performance and compare the effectiveness of different algorithms and machine learning techniques in this domain.

4.5. Electrical Circuit Diagram Analysis

4.5.1. Review of Identified Papers

While flowcharts and block diagrams are seen as closely related, electrical circuit diagrams and schematics are significantly different. Image content extraction from electrical circuit diagrams often targets circuit simulators via netlist generation, and thus demands very high extraction accuracy. Netlists are files that utilize a text representation to describe an electrical circuit, including its components, their parameters, and the connections between them.
In 2020, the work in [129] describes a circuit diagram approach that expands upon the works of [130,131]. Their approach starts by first binarizing the image and performing noise reduction. A morphological ‘close’ operator is then applied to transform circuit components into blobs. This is followed by localization, to extract circuit components without any of the diagram’s wires after applying the Run Length Smoothing Algorithm (RLSA) [132]. The authors also generated their own dataset of 60 hand-drawn circuit diagrams, as they were unable to locate any publicly accessible datasets applicable to their research. A localization accuracy evaluation was performed, yielding an overall accuracy of 91.28% in extracting circuit components.
The work in [133], referred to as Img2Sim and published in 2022, employs an Artificial Neural Network (ANN) approach [134] to convert circuit schematics into a netlist. This work builds upon a prior approach published in [135] that used deep learning to recognize circuit components, and [136], which involved identifying hand-drawn circuit images using OCR. The work published in [137] is also referenced. However, while these methods primarily focus on passive components, Img2Sim also aims to support active components. A dataset comprising 330 circuit diagrams was used for testing, utilizing YOLOv5 for element recognition, a Hough Transform for node detection, and OCR for text recognition, with the final results generated as a netlist. Their presented method detects circuit components with an accuracy of 98%, and generates correct netlists with an accuracy of 90%. This demonstrates that, while there is room for improvement in circuit diagram extraction from images, significantly more research is needed to accurately represent these diagrams using netlist files post-extraction, in order to support the intended downstream applications.
Another method, presented in 2022 [138], utilized a DNN to generate netlists from hand-drawn circuit diagrams, building upon the CNN-based classification approach published in [137] and other works such as [136,139,140,141]. YOLOv5 was utilized for component recognition, adaptive thresholding and bounding box extraction for terminal recognition, as well as k-means clustering for detecting intersections. The Hough Transform was applied for line detection and node identification. This approach was implemented using PyTorch and subsequently evaluated using a dataset of 154 hand-drawn circuits (augmented to 388 training images). It achieved a mAP score with 0.5 IoU of 98.2% for component detection, 92% accuracy for node recognition, and 80% overall circuit reconstruction accuracy. Their results indicated good extraction performance for simple circuit diagrams using passive components; however, further research was needed to improve the accuracy of more complex diagrams involving active components and integrated circuit components. Additionally, these methods required further evaluation using larger datasets spanning a wider range of circuit diagram representations.
The authors of [142], published in 2021, developed a method that leverages augmented reality techniques to convert hand-drawn circuit diagrams into other representations using a smartphone. The author’s work expands upon [143,144], which used an SVM approach for circuit recognition. Feature extraction is performed using a custom algorithm that combines region proposal using SURF, Eigen, and FAST. Dilation and Hough Transform are also incorporated as part of the processing workflow. A capsule network architecture (CapsNet) [145] is used instead of a CNN due to limitations with CNNs, as discussed by the authors in their paper, primarily related to the significantly higher training dataset size required for CNNs compared to CapsNets. The final step in their approach is circuit simulation, which determines whether the extraction produces a viable netlist, concluding with the export of the netlist generated by the previous steps. With a custom dataset comprising 800 circuit diagrams used for evaluation, and utilizing the mAP scoring metric with an IoU threshold of 0.3, the resulting score for this approach is 93.64%.
Circuit diagram extraction has attracted increasing attention in recent years, driven by advancements in machine learning that enable more accurate recognition and interpretation of complex schematics, as shown in Figure 10. Using Litmaps, this analysis illustrates the relationships and interdependencies among the reviewed papers.
The authors of [146,147,148] each developed their own circuit extraction techniques that build upon the work in [141] by expanding its scope, which previously focused exclusively on text extraction from hand-drawn diagrams. The techniques discussed in [146,149] also reference the research from [139], which focuses on recognizing hand-drawn schematics.
Published in 2022, the work in [146] presents a model that can analyze hand-drawn or computer-generated schematics, specifically of power converter circuits, generate netlists from them, and simulate them in real-time. It is inspired by older works, such as [133,135,138,139,140,141,142,150]. For evaluating their presented technique, they developed their own dataset. The images underwent noise filtering to help build a more robust system. A variant of YOLO called You Only Learn Once Representation (YOLOR) [151] was used to detect components. Hough Transform was used to detect lines. Edge detection is performed to improve the performance of the HT. Node recognition was conducted using a k-means clustering technique [152]. The resulting netlist is then evaluated and simulated using PySpice. The technique was trained on a dataset of 176 hand-drawn diagrams, achieving a mAP0.5 score was 91.6%. This work’s biggest shortcoming is in diagrams involving surface-mount components in Printed Circuit Board (PCB) schematics. The authors also compared their performance obtained using PySpice with performance metrics from LTSpice, which confirmed the accuracy of the generated netlists for diagrams where extraction was conducted successfully.
Figure 10. Citation graph visualization for circuit diagrams [129,133,136,139,140,142,146,148,149,150,153,154,155,156,157,158,159,160].
Information 17 00165 g010
In 2023, Bayer et al. published [148], which aimed to facilitate extracting component labels and junctions from circuit diagram extraction using keypoint extraction and instance segmentation. For evaluation, they extended the Circuit Graph Hand-Drawn (CGHD) dataset, which contains 2208 hand-drawn circuit diagrams, by creating 245 binary segmentation maps with 18,276 polygon annotations. Additionally, their approach is inspired by [136,138,141]. The presented approach first separates the background from objects using binarization maps, which are then further refined using the LabelME annotation tool to clean up the coarse polygon masks. The image was then simplified by layering coarse polygons with binarization maps. Contour detection was employed to enhance the precision of the polygons, reducing ambiguity in the annotations. Keypoint Generation precisely identifies connection points on electrical symbols after applying the morphological operator erosion to reduce the impact of noise. A technique called Keypoint Port Assignment is then performed to link detected connection points on electrical symbols to their correct terminals, with the final step being the creation of electrical circuit graph representations. A Mask R-CNN model trained on this extended dataset achieved a maximum training mask accuracy of 94%. This demonstrates that instance segmentation approaches can yield commendable results for circuit diagram analysis.
Closely related to the work in [146], the authors of [147] in 2023 published their technique that combines OCR, structured pattern extraction with regular expressions, and shape matching using geometric methods inspired by past work published by [136,141,148]. The aforementioned CGHD dataset, containing 2304 images, was used for their testing. During the text detection stage, Faster R-CNN was used. For handwritten recognition, the approach relies on a combination of CNN and LSTM, as well as Regular expressions (RegEx) for text label identification. The Euclidean distance was the metric employed by the authors for text symbol assignment, and prefix resolution was used for unit of measurement resolution. The work demonstrated promising results. It excels at resistors, capacitors, and voltage labels. However, subscript annotations and negation lines are not yet supported, and additional work is needed to address these and related capabilities. More work is also needed for the normalization of electrical values. Lastly, a consistency evaluation must be conducted to confirm the integrity of the graph’s generated output representation.
This 2024 research paper [153] proposed another technique for circuit diagram extraction, influenced by earlier techniques such as [161], which was created to help to recognize faulty analog circuits using neural networks, as well as [138,140,154]. Following the initial image acquisition, they first convert the image into a grayscale representation. YOLOv8 is leveraged for component recognition with high accuracy, whereas a CNN and Line Detection are used during image segmentation to classify the structure of the circuit components and their corresponding value labels. The resulting text representation of the circuit diagram is used in a subsequent analysis stage to evaluate the accuracy of current and voltage levels at each node present in the circuit. 50 diagrams were used for testing, performed on a NVIDIA RTX 4070 super GPU, and implemented using Python. This evaluation yielded an 84% success rate, with 42 out of 50 images extracted without errors. However, a more comprehensive evaluation using a significantly larger dataset is needed to properly assess this technique in comparison to others in this domain.
In 2024, Hemker et al. [155] presented another technique that aims to convert schematics into netlists, based on discussions from [133,137,138,140,150]. Their approach decomposes the problem into three subtasks: component detection using YOLOv7, line detection using a Lightweight convolutional neural network (L-CNN) [162], and text detection using EasyOCR with a CRAFT model. The dataset consists of 164 usable pages extracted from 67 PDFs from Altium Designer schematics. For OCR training, 124 images with 46,498 text boxes were used, with the CRAFT model fine-tuned from a checkpoint pre-trained on SynthText and ICDAR 2015. The component detection achieved an mAP@0.95 of at least 73% for most component classes. Although the obtained results were promising for component and line recognition, significant improvements are still needed, particularly in detecting small text labels, such as pin numbers used on integrated circuit components, and handling varying symbol orientations.
A similar effort, published in 2024 by Kelly and Cole [156], aimed to address the process of extracting information from digitized circuit diagram images by using a custom OCR model, improving on [163]. Here, Otsu’s method was used for binarization and skeletonization to gain a specific contour size of 1 pixel wide for the circuit. A Progressive Probabilistic Hough Transform (PPHT) [164] was then employed for recognizing lines in the circuit, and Tesseract OCR was used to train a custom model to identify component symbols. This approach was then implemented as a software solution and evaluated using a custom dataset of 15 schematics, with three being hand-drawn and 12 obtained from various publishers. Their pattern-recognition algorithm correctly identified the locations of 166 out of 194 components, achieving 85.6% accuracy. The custom OCR model achieved 99.6% accuracy on synthetic training data, though performance on real schematics varied significantly depending on image resolution and component variety.
In 2025, Gao et al. [149] presented a circuit diagram retrieval method using hierarchical graph representation. This was inspired by efforts on the automatic generation of detection rules for circuit identification published in [139,165,166], which leverage machine learning to recognize circuit components. Their approach first recognizes circuit components using GAM-YOLO [167] with Otsu’s method for preprocessing, then converts diagrams into hierarchical graph representations for retrieval. Graph Edit Distance (GED) [168] was employed as the graph matching metric, while IoU and mAP were used for component detection evaluation. The method was evaluated on a dataset of 2275 circuit diagrams (2048 training, 227 testing), achieving a component detection F1-Score of 91.0%. For circuit diagram retrieval, the hierarchical approach achieved an average precision of 88.1%, significantly outperforming traditional image-based retrieval methods. The results demonstrate that graph-based representation enables effective circuit diagram retrieval and supports various downstream tasks.
Additionally, a 2025 paper by Arun et al. [157] discussed using deep learning for circuit diagram extraction, referencing [129,133,138,141,150] as inspirations for their work. The study expanded the Kaggle dataset [169] from 12 to 25 component classes by adding operational amplifiers (OP-AMPs), BJTs, MOSFETs, JFETs, switches, and wires, totaling 4800 training images. The authors developed a custom multi-layer CNN model that achieved a training accuracy of 99% and a test accuracy of 96%, with precision and recall scores of 96.3% and 96.1%, respectively. The method significantly outperformed prior approaches shown in their comparative analysis. The authors also created a Flask-based web application that allowed users to upload hand-drawn circuit images and automatically generate LTspice-compatible netlist files (.asc format), demonstrating notable improvements in the automated extraction and interpretation of circuit diagrams.
Finally, building on [156], the authors of [158] conducted an experiment that individually extracted each layer of a circuit diagram, allowing for a more accurate extraction. It aims to improve upon prior efforts such as [156] for better support of digitizing circuit diagrams. It also incorporates efforts from [170], which specifically aims to improve the detection of small objects in circuit diagrams. YOLOv7 was used for element layer detection within a circuit diagram, PaddleOCR [171] and PaddleClas image classification [172] were used for text layer extraction. The author used a connection relationship algorithm to understand the relationship between each diagram. Their framework was implemented using Python 3.9, PyTorch 1.13, and OpenCV, running on a host with Ubuntu 20.04 LTS and a single NVIDIA RTX 3090 GPU. Using a dataset containing 5000 diagrams and an Element Feature Library (EFL), this method achieved an F1-Score of 99.6% with diagrams featuring various backgrounds. This highly promising result shows the significant advances made in this research domain in recent years. The authors noted that future work would focus on handling extremely low-quality diagrams and expanding the approach to other types of industrial diagrams.

4.5.2. Electrical Circuit Diagram Review Summary

Table 5 contains the 14 schematic diagram extraction papers that were discussed in this part of our survey. It is our estimation that 10 out of 14 methods are suitable for various application domains, whereas the remaining 4 papers demonstrate earlier efforts that paved the way for later significant advances in the accurate and detailed extraction of electrical circuit diagrams from images. All of these efforts, however, could benefit from further evaluation using larger benchmark datasets to better compare their individual performance across the variety of algorithms and ML techniques proposed and studied over the years for this application domain.

4.6. Timing Diagram Analysis

4.6.1. Review of Identified Papers

A category of technical illustrations that stands on its own is timing diagrams. Unlike many other diagram types, the importance of line positioning is significantly elevated, and thus it mandates highly accurate extraction to accurately represent signal change timing.
A study published in 2023 developed a method named TD-Magic [173], designed to translate timing diagram images into formal specifications using a neuro-symbolic approach. The method uses object detection for rising and falling edge detection, OCR for text label extraction, and image processing techniques to capture synchronization patterns. Their approach was inspired by signal digitization work from the biomedical domain, particularly ECG signal extraction from PDF documents [174]. Feature recognition was performed using a custom Signal-Edge Detector (SED) module with YOLOv5 for edge detection, and PaddleOCR for text detection and recognition. A Line-and-Arrow-Detection (LAD) module using image processing morphological operations was employed for identifying arrows and annotation lines. Semantic Interpretation (SEI) was used to generate Strict Partial Order (SPO) representations from the extracted features. To overcome the lack of labeled training data, the authors developed L-TD-G, a synthetic timing diagram generator that produced 15,000 labeled training images. The dataset for evaluation included 30 timing diagrams (29 from industry, one manually drawn). On synthetic validation data, the edge detection achieved near-perfect precision and recall, with mAP@0.5 of 99.5%. For industrial timing diagrams, 23 out of 30 (76.7%) were successfully extracted at the structural level, with 15 (50%) achieving complete accuracy at both structural and textual levels. The results demonstrate promise for the automated extraction of formal specifications from timing diagram images.
Another timing diagram extraction technique was introduced in 2025, called TD-Interpreter [175]. While it was inspired by TD-Magic [173], it differed in its approach and scope. TD-Magic focuses on extracting SPO relations as formal specifications, while TD-Interpreter leverages multimodal learning to interpret timing diagrams through a visual question-answering environment. The work was also inspired by LLaVA, a multimodal large language model. TD-Interpreter utilizes a ViT to process images and extract visual features, which are then processed by the LLaVA-based language model for reasoning and response generation. Low-Rank Adaptation (LoRA) was employed for efficient fine-tuning. To address the lack of labeled training data, the authors developed a synthetic data generation workflow, creating a training dataset comprising 4942 timing diagram images for caption-based tasks and 5292 images for reasoning-based tasks. The model was trained on 8 NVIDIA A800 GPUs and evaluated on a separate test set, achieving a BLEU-4 score of 95.9 and ROUGE-1 score of 96.7. The results demonstrate that fine-tuning lightweight multimodal LLMs on domain-specific synthetic data can achieve highly accurate timing diagram interpretation, significantly outperforming untuned models like GPT-4o.

4.6.2. Timing Diagram Review Summary

Table 6 shows the comparison of TD-Magic and TD-Interpreter. The applicability of TD-Magic is limited by its low score achieved over a comparatively small dataset. However, it did succeed on several test cases and thus warrants further research to improve its performance, especially for use cases with limited computational resources such as in edge devices. The TD-Interpreter, on the other hand, employs a significantly more advanced VLM-driven approach that includes reasoning capabilities and was tested on a much larger dataset. Thus, among the two, TD-Interpreter is a more promising approach that, given the required computational resources, will be able to achieve significantly better results for downstream applications depending on accurate timing diagram extraction.
Additionally, for this survey, we also considered and reviewed a research domain distinct from the technical diagrams that form the primary focus of this survey, but that may shed some light on related image content extraction approaches that have the potential to be applicable to some of the discussed technical diagram types: time series diagrams. Unlike timing diagrams, which specifically capture the discrete behavior of digital or analog signals for hardware verification, time series diagrams more broadly visualize quantitative data trends over time, and are commonly found in financial reports, scientific publications, and within a data analytics context. Recent work in this area [176,177,178,179,180,181] explored various approaches for extracting features and detecting anomalies from time series data. These methods typically employ convolutional neural networks for spatial feature extraction, recurrent networks such as LSTMs for modeling temporal dependencies, transformer-based architectures for attention mechanisms, and graph neural networks for capturing inter-variable relationships. While these approaches demonstrated effective solutions for time series analysis and anomaly detection, they target a different application domain, only distantly related to the types of technical diagrams examined in this survey, and are therefore included here as related work outside the primary scope of understanding technical diagrams.

4.7. Comparative Observations and Summary Across Illustration Types

Based on the reviewed research papers across all four technical diagram types, transformer-based approaches consistently demonstrate strong performance in terms of accuracy, adaptability, and robustness, regardless of diagram type. While these transformer-based approaches are computationally expensive, more lightweight models are available for application scenarios where efficiency outweighs accuracy, such as in edge computing or mobile applications. Object detection frameworks such as YOLO and LLMs such as the various GPT models also offer reliable performance across diverse scenarios. Traditional extraction methods remain useful for specific tasks, but combining them with modern techniques generally yields the most effective results across a wide range of situations.
It is important to note that different diagram types attract varying levels of research attention, which influences how rapidly performance improvements can be achieved. Flowcharts are the most extensively examined type of technical diagram, which has led to more advanced, fine-tuned, and higher-accuracy extraction techniques, along with publicly accessible benchmark datasets. Circuit diagrams have also received considerable research focus. However, progress in this area remains constrained by the reliance on small, domain-specific, custom-built datasets. In contrast, timing diagrams, block diagrams, and UML diagrams have received relatively limited attention, leading to slower methodological advancements and lower overall extraction performance.
A notable issue identified in the reviewed research is the scarcity of publicly available datasets that can be reliably used for testing and evaluating extraction methods. Most studies relied on custom datasets tailored to their specific needs, which may introduce bias and limit the generalizability of their results. The availability of a standard public dataset could enable more robust and applicable benchmarking, supporting fairness in comparing various image content analysis approaches.

5. Conclusions

With the rapid proliferation of LLMs and agentic AI in our everyday lives comes a resurgence in the need for multimodal data access to inform queries and produce accurate responses. As a result, we see growing research activities in image content analysis and extraction for complex technical illustrations, such as flowcharts, block diagrams, UML diagrams, schematics, and timing diagrams—illustrations where a significant portion of the information is represented not just by text, but by the contained shapes, their styling, and their relationships. To cope with increasingly complex diagrams and the need to reduce extraction errors, the techniques utilized for extracting information from these technical illustrations must also evolve. The rise of AI-powered techniques resulted in a number of highly promising image content analysis techniques, achieving higher accuracy and richer contextual representations than ever before, across a variety of diagram types.
Our survey found that the majority of recent research activities focused on flowcharts, while circuit schematics represent the second-most studied diagram type. In contrast, block diagrams, UML diagrams, and timing diagrams have received only limited interest, with only two studies dedicated to block diagrams and timing diagrams, and five studies dedicated to UML diagrams.
While the advancements made so far are promising, significant work remains as future research avenues to optimize extraction methods for various diagram types, reduce extraction errors, and improve the cost and complexity of these algorithms. Reducing complexity, in particular, is crucial for accelerating information extraction in an era where an ever-increasing amount of multimodal information is being generated. Similarly, for applications where accuracy is paramount, further research is necessary to enhance information extraction in terms of both completeness and accuracy. This is vital for reducing hallucinations and downstream generative errors in agentic AI systems. Finally, we also observed that the significant lack of benchmark datasets severely impedes objective comparisons across the various techniques. While several research works utilize larger datasets with thousands of images, others use much smaller datasets, sometimes comprised of only a few dozen images. Thus, there is a strong need to establish and publicly release benchmark datasets that span the full range of technical diagram types, with sufficient representation in terms of complexity, color usage, multilingual aspects, diagram correctness, and other features.
This survey aims to provide both a cross-section of research work related to information extraction from technical diagrams, as well as inspire researchers to pursue the various open research questions in this field, in an effort to advance the accuracy, fidelity, and efficiency of these techniques, because there are numerous applications that would be enabled by these capabilities.

Author Contributions

Conceptualization, N.B., M.H., M.B. and H.S.; Investigation, N.B. and M.H.; Writing—original draft preparation, N.B., M.H., M.B. and H.S.; Writing—review and editing, N.B., M.H., M.B. and H.S.; Supervision, M.H., M.B. and H.S.; Project administration, M.H. and H.S. All authors have read and agreed to the published version of the manuscript.

Funding

This research received no external funding.

Data Availability Statement

No new datasets were created or analyzed in this study. Data sharing is not applicable to this article.

Conflicts of Interest

The authors declare no conflicts of interest.

References

  1. Arslan, M.; Ghanem, H.; Munawar, S.; Cruz, C. A Survey on RAG with LLMs. Procedia Comput. Sci. 2024, 246, 3781–3790. [Google Scholar] [CrossRef] [Scilit]
  2. Haddaway, N.R.; Page, M.J.; Pritchard, C.C.; McGuinness, L.A. PRISMA2020: An R package and Shiny app for producing PRISMA 2020-compliant flow diagrams, with interactivity for optimised digital transparency and Open Synthesis. Campbell Syst. Rev. 2022, 18, e1230. [Google Scholar] [CrossRef] [Scilit]
  3. Jamieson, L.; Moreno-García, C.F.; Elyan, E. A review of deep learning methods for digitisation of complex documents and engineering diagrams. Artif. Intell. Rev. 2024, 57, 136. [Google Scholar] [CrossRef] [Scilit]
  4. Mittal, R.; Garg, A. Text extraction using OCR: A Systematic Review. In Proceedings of the 2020 Second International Conference on Inventive Research in Computing Applications (ICIRCA), Coimbatore, India, 15–17 July 2020; pp. 357–362. [Google Scholar] [CrossRef] [Scilit]
  5. Kumar, G.; Bhatia, P.K. A Detailed Review of Feature Extraction in Image Processing Systems. In Proceedings of the 2014 Fourth International Conference on Advanced Computing & Communication Technologies, Rohtak, India, 8–9 February 2014; pp. 5–12. [Google Scholar] [CrossRef] [Scilit]
  6. Yamashita, R.; Nishio, M.; Do, R.K.G.; Togashi, K. Convolutional neural networks: An overview and application in radiology. Insights Imaging 2018, 9, 611–629. [Google Scholar] [PubMed]
  7. Sherstinsky, A. Fundamentals of recurrent neural network (RNN) and long short-term memory (LSTM) network. Phys. D Nonlinear Phenom. 2020, 404, 132306. [Google Scholar] [CrossRef] [Scilit]
  8. Demiss, B.A.; Elsaigh, W.A. Application of novel hybrid deep learning architectures combining convolutional neural networks (CNN) and recurrent neural networks (RNN): Construction duration estimates prediction considering preconstruction uncertainties. Eng. Res. Express 2024, 6, 032102. [Google Scholar] [CrossRef] [Scilit]
  9. Han, K.; Wang, Y.; Chen, H.; Chen, X.; Guo, J.; Liu, Z.; Tang, Y.; Xiao, A.; Xu, C.; Xu, Y.; et al. A Survey on Vision Transformer. IEEE Trans. Pattern Anal. Mach. Intell. 2023, 45, 87–110. [Google Scholar] [CrossRef] [Scilit]
  10. Li, M.; Lv, T.; Chen, J.; Cui, L.; Lu, Y.; Florencio, D.; Zhang, C.; Li, Z.; Wei, F. Trocr: Transformer-based optical character recognition with pre-trained models. In Proceedings of the AAAI Conference on Artificial Intelligence, Washington, DC, USA, 7–14 February 2023; Volume 37, pp. 13094–13102. [Google Scholar]
  11. Shao, T.; Guo, Y.; Chen, H.; Hao, Z. Transformer-based neural network for answer selection in question answering. IEEE Access 2019, 7, 26146–26156. [Google Scholar] [CrossRef] [Scilit]
  12. Lin, C.Y. Rouge: A package for automatic evaluation of summaries. In Text Summarization Branches Out; Association for Computational Linguistics: Barcelona, Spain, 2004; pp. 74–81. [Google Scholar]
  13. Saadany, H.; Orasan, C. BLEU, METEOR, BERTScore: Evaluation of metrics performance in assessing critical translation errors in sentiment-oriented text. arXiv 2021, arXiv:2109.14250. [Google Scholar] [CrossRef] [Scilit]
  14. Reiter, E. A structured review of the validity of BLEU. Comput. Linguist. 2018, 44, 393–401. [Google Scholar] [CrossRef] [Scilit]
  15. Ren, S.; Guo, D.; Lu, S.; Zhou, L.; Liu, S.; Tang, D.; Sundaresan, N.; Zhou, M.; Blanco, A.; Ma, S. Codebleu: A method for automatic evaluation of code synthesis. arXiv 2020, arXiv:2009.10297. [Google Scholar] [CrossRef] [Scilit]
  16. Sellam, T.; Das, D.; Parikh, A.P. BLEURT: Learning robust metrics for text generation. arXiv 2020, arXiv:2004.04696. [Google Scholar] [CrossRef] [Scilit]
  17. Yang, M.; Zhu, J.; Li, J.; Wang, L.; Qi, H.; Li, S.; Daxin, L. Extending BLEU Evaluation Method with Linguistic Weight. In Proceedings of the 2008 The 9th International Conference for Young Computer Scientists, Zhang Jia Jie, China, 18–21 November 2008; pp. 1683–1688. [Google Scholar] [CrossRef] [Scilit]
  18. Henderson, P.; Ferrari, V. End-to-end training of object class detectors for mean average precision. In Proceedings of the Asian Conference on Computer Vision; Springer: Berlin/Heidelberg, Germany, 2016; pp. 198–213. [Google Scholar]
  19. Hicks, S.A.; Strümke, I.; Thambawita, V.; Hammou, M.; Riegler, M.A.; Halvorsen, P.; Parasa, S. On evaluation metrics for medical applications of artificial intelligence. Sci. Rep. 2022, 12, 5979. [Google Scholar] [CrossRef] [Scilit]
  20. Rezatofighi, H.; Tsoi, N.; Gwak, J.; Sadeghian, A.; Reid, I.; Savarese, S. Generalized intersection over union: A metric and a loss for bounding box regression. In Proceedings of the IEEE/CVF Conference on Computer Vision and Pattern Recognition, Long Beach, CA, USA, 15–20 June 2019; pp. 658–666. [Google Scholar]
  21. Leena, C.; Ganesh, M. Generating Graph from 2D Flowchart using Region-Based Segmentation. In Proceedings of the 2020 IEEE International Students’ Conference on Electrical, Electronics and Computer Science (SCEECS), Bhopal, India, 22–23 February 2020; pp. 1–5. [Google Scholar] [CrossRef] [Scilit]
  22. Vasudevan, B.G.; Dhanapanichkul, S.; Balakrishnan, R. Flowchart knowledge extraction on image processing. In Proceedings of the 2008 IEEE International Joint Conference on Neural Networks (IEEE World Congress on Computational Intelligence), Hong Kong, China, 1–8 June 2008; pp. 4075–4082. [Google Scholar] [CrossRef] [Scilit]
  23. Herrera-Camara, J.I.; Hammond, T. Flow2Code: From hand-drawn flowcharts to code execution. In Proceedings of the Symposium on Sketch-Based Interfaces and Modeling, Angeles, CA, USA, 29–30 June 2017; pp. 1–13. [Google Scholar]
  24. Bangare, S.L.; Dubal, A.; Bangare, P.S.; Patil, S. Reviewing Otsu’s method for image thresholding. Int. J. Appl. Eng. Res. 2015, 10, 21777–21783. [Google Scholar] [CrossRef] [Scilit]
  25. Gould, S.; Gao, T.; Koller, D. Region-based segmentation and object detection. In Advances in Neural Information Processing Systems; Bengio, Y., Schuurmans, D., Lafferty, J., Williams, C.K.I., Culotta, A., Eds.; Curran Associates, Inc.: Red Hook, NY, USA, 2009; Volume 22, pp. 655–663. [Google Scholar]
  26. Mohamad, M.; Saman, M.Y.M.; Hitam, M.S.; Telipot, M. A review on OpenCV. Teren. Univ. Malays. Teren. 2015, 3, 1. [Google Scholar]
  27. Cheng, L.; Yang, Z. GRCNN: Graph Recognition Convolutional Neural Network for synthesizing programs from flow charts. arXiv 2020, arXiv:2011.05980. [Google Scholar] [CrossRef] [Scilit]
  28. Gulwani, S. Automating string processing in spreadsheets using input-output examples. ACM Sigplan Not. 2011, 46, 317–330. [Google Scholar] [CrossRef] [Scilit]
  29. Gansner, E.R. Drawing Graphs with Graphviz; Technical Report; AT&T Bell Laboratories: Murray, Murray Hill, NJ, USA, 2009. [Google Scholar]
  30. Chakraborty, S.; Paul, S.; Masudul Ahsan, S.M. A Novel Approach to Rapidly Generate Document from Hand Drawn Flowcharts. In Proceedings of the 2020 IEEE Region 10 Symposium (TENSYMP), Dhaka, Bangladesh, 5–7 June 2020; pp. 702–705. [Google Scholar] [CrossRef] [Scilit]
  31. Vogel, M.; Warnecke, T.; Bartelt, C.; Rausch, A. Scribbler—Drawing models in a creative and collaborative environment: From hand-drawn sketches to domain specific models and vice versa. In Proceedings of the Fifteenth Australasian User Interface Conference-Volume 150, Auckland, New Zealand, 20–23 January 2014; pp. 93–94. [Google Scholar]
  32. Meng, W.K. Development of Program Flowchart Drawing Tool; Technical Report; Universiti Tunku Abdul Rahman: Kampar, Malaysia, 2016. [Google Scholar]
  33. Douglas, D.H.; Peucker, T.K. Algorithms for the reduction of the number of points required to represent a digitized line or its caricature. Ramer-douglas-peucker algorithm. Cartogr. Int. J. Geogr. Inf. Geovisualization 1973, 10, 112–122. [Google Scholar]
  34. Scheidl, H.; Fiel, S.; Sablatnig, R. Word beam search: A connectionist temporal classification decoding algorithm. In Proceedings of the 2018 16th International Conference on Frontiers in Handwriting Recognition (ICFHR), Niagara Falls, NY, USA, 5–8 August 2018; pp. 253–258. [Google Scholar]
  35. Chakraborti, A.; Naik, A.; Pansare, A.; Pant, U. Extracting Flowchart Features into a Structured Representation; Technical Report; Mukesh Patel School of Technology Management and Engineering: Mumbai, India, 2020. [Google Scholar]
  36. Chen, Q.; Shi, D.; Feng, G.; Zhao, X.; Luo, B. On-line handwritten flowchart recognition based on logical structure and graph grammar. In Proceedings of the 2015 5th International Conference on Information Science and Technology (ICIST), Changsha, China, 24–26 April 2015; pp. 424–429. [Google Scholar] [CrossRef] [Scilit]
  37. Supaartagorn, C. Web application for automatic code generator using a structured flowchart. In Proceedings of the 2017 8th IEEE International Conference on Software Engineering and Service Science (ICSESS), Beijing, China, 24–26 November 2017; pp. 114–117. [Google Scholar]
  38. Adarsh, P.; Rathi, P.; Kumar, M. YOLO v3-Tiny: Object Detection and Recognition using one stage improved model. In Proceedings of the 2020 6th International Conference on Advanced Computing and Communication Systems (ICACCS), Coimbatore, India, 6–7 March 2020; pp. 687–694. [Google Scholar] [CrossRef] [Scilit]
  39. Omar, Z.M.; Ibrahim, J. An overview of Darknet, rise and challenges and its assumptions. Int. J. Comput. Sci. Inf. Technol. 2020, 8, 110–116. [Google Scholar]
  40. Pebrianto, W.; Mudjirahardjo, P.; Pramono, S.H.; Setyawan, R.A. YOLOv3 with spatial pyramid pooling for object detection with unmanned aerial vehicles. arXiv 2023, arXiv:2305.12344. [Google Scholar] [CrossRef] [Scilit]
  41. Liu, Z.; Hu, X.; Zhou, D.; Li, L.; Zhang, X.; Xiang, Y. Code generation from flowcharts with texts: A benchmark dataset and an approach. In Proceedings of the Findings of the Association for Computational Linguistics: EMNLP 2022, Abu Dhabi, United Arab Emirates, 7–11 December 2022; pp. 6069–6077. [Google Scholar]
  42. Carlisle, M.C.; Wilson, T.A.; Humphries, J.W.; Hadfield, S.M. Raptor: Introducing programming to non-majors with flowcharts. J. Comput. Sci. Coll. 2004, 19, 52–60. [Google Scholar]
  43. Alizadegan, H.; Rashidi Malki, B.; Radmehr, A.; Karimi, H.; Ilani, M.A. Comparative study of long short-term memory (LSTM), bidirectional LSTM, and traditional machine learning approaches for energy consumption prediction. Energy Explor. Exploit. 2025, 43, 281–301. [Google Scholar] [CrossRef] [Scilit]
  44. Vrahatis, A.G.; Lazaros, K.; Kotsiantis, S. Graph attention networks: A comprehensive review of methods and applications. Future Internet 2024, 16, 318. [Google Scholar] [CrossRef] [Scilit]
  45. Yin, P.; Neubig, G. TRANX: A transition-based neural abstract syntax parser for semantic parsing and code generation. arXiv 2018, arXiv:1810.02720. [Google Scholar] [CrossRef] [Scilit]
  46. Khan, S.; Naseer, M.; Hayat, M.; Zamir, S.W.; Khan, F.S.; Shah, M. Transformers in vision: A survey. ACM Comput. Surv. (CSUR) 2022, 54, 1–41. [Google Scholar] [CrossRef] [Scilit]
  47. Shukla, S.; Gatti, P.; Kumar, Y.; Yadav, V.; Mishra, A. Towards making flowchart images machine interpretable. In Proceedings of the International Conference on Document Analysis and Recognition; Springer: Berlin/Heidelberg, Germany, 2023; pp. 505–521. [Google Scholar]
  48. Tannert, S.; Feighelstein, M.G.; Bogojeska, J.; Shtok, J.; Arbelle, A.; Staar, P.W.; Schumann, A.; Kuhn, J.; Karlinsky, L. FlowchartQA: The first large-scale benchmark for reasoning over flowcharts. In Proceedings of the 1st Workshop on Linguistic Insights from and for Multimodal Language Processing; Association for Computational Lingustics: Ingolstadt, Germany, 2023; pp. 34–46. [Google Scholar]
  49. Devlin, J.; Chang, M.W.; Lee, K.; Toutanova, K. Bert: Pre-training of deep bidirectional transformers for language understanding. In Proceedings of the 2019 Conference of the North American Chapter of the Association for Computational Linguistics: Human Language Technologies, Volume 1 (Long and Short Papers), Minneapolis, MN, USA, 2–7 June 2019; pp. 4171–4186. [Google Scholar]
  50. Montellano, C.D.B.; Garcia, C.; Leija, R.O.C. Recognition of handwritten flowcharts using convolutional neural networks. Int. J. Comput. Appl. 2022, 184, 37–41. [Google Scholar] [CrossRef] [Scilit]
  51. Mukhopadhyay, P.; Chaudhuri, B.B. A survey of Hough Transform. Pattern Recognit. 2015, 48, 993–1010. [Google Scholar] [CrossRef] [Scilit]
  52. Wang, Y.; Wang, W.; Joty, S.; Hoi, S.C. Codet5: Identifier-aware unified pre-trained encoder-decoder models for code understanding and generation. arXiv 2021, arXiv:2109.00859. [Google Scholar]
  53. Baek, Y.; Lee, B.; Han, D.; Yun, S.; Lee, H. Character region awareness for text detection. In Proceedings of the IEEE/CVF Conference on Computer Vision and Pattern Recognition, Long Beach, CA, USA, 15–20 June 2019; pp. 9365–9374. [Google Scholar]
  54. Darda, A.; Jain, R. Code Generation from Flowchart using Optical Character Recognition & Large Language Model. Authorea Prepr. 2024. [Google Scholar] [CrossRef] [Scilit]
  55. Ghosh, S.; Pratihar, S.; Chatterji, S.; Basu, A. Matching of hand-drawn flowchart, pseudocode, and english description using transfer learning. Multimed. Tools Appl. 2023, 82, 27027–27055. [Google Scholar] [CrossRef] [Scilit]
  56. Ray, S.; Herrera-Cámara, J.I.; Runyon, M.; Hammond, T. Flow2code: Transforming hand-drawn flowcharts into executable code to enhance learning. In Inspiring Students with Digital Ink: Impact of Pen and Touch on Education; Springer: Berlin/Heidelberg, Germany, 2019; pp. 79–103. [Google Scholar]
  57. Touvron, H.; Martin, L.; Stone, K.; Albert, P.; Almahairi, A.; Babaei, Y.; Bashlykov, N.; Batra, S.; Bhargava, P.; Bhosale, S.; et al. Llama 2: Open foundation and fine-tuned chat models. arXiv 2023, arXiv:2307.09288. [Google Scholar] [CrossRef] [Scilit]
  58. Reimers, N.; Gurevych, I. Sentence-bert: Sentence embeddings using siamese bert-networks. arXiv 2019, arXiv:1908.10084. [Google Scholar] [CrossRef] [Scilit]
  59. Sanh, V.; Debut, L.; Chaumond, J.; Wolf, T. DistilBERT, a distilled version of BERT: Smaller, faster, cheaper and lighter. arXiv 2019, arXiv:1910.01108. [Google Scholar]
  60. Miyao, H.; Maruyama, R. On-Line Handwritten flowchart Recognition, Beautification and Editing System. In Proceedings of the 2012 International Conference on Frontiers in Handwriting Recognition, Bari, Italy, 18–20 September 2012; pp. 83–88. [Google Scholar] [CrossRef] [Scilit]
  61. Yun, X.L.; Zhang, Y.M.; Yin, F.; Liu, C.L. Instance GNN: A Learning Framework for Joint Symbol Segmentation and Recognition in Online Handwritten Diagrams. IEEE Trans. Multimed. 2022, 24, 2580–2594. [Google Scholar] [CrossRef] [Scilit]
  62. Ye, J.; Dash, A.; Yin, W.; Wang, G. Beyond end-to-end vlms: Leveraging intermediate text representations for superior flowchart understanding. In Proceedings of the 2025 Conference of the Nations of the Americas Chapter of the Association for Computational Linguistics: Human Language Technologies (Volume 1: Long Papers), Albuquerque, NM, USA, 29 April–4 May 2025; pp. 3534–3548. [Google Scholar]
  63. Omasa, T.; Koshihara, R.; Morishige, M. Arrow-Guided VLM: Enhancing Flowchart Understanding via Arrow Direction Encoding. arXiv 2025, arXiv:2505.07864. [Google Scholar] [CrossRef] [Scilit]
  64. Soman, S.; Ranjani, H.; Roychowdhury, S.; Sastry, V.D.S.N.; Jain, A.; Gangrade, P.; Khan, A. A Graph-based Approach for Multi-Modal Question Answering from Flowcharts in Telecom Documents. arXiv 2025, arXiv:2507.22938. [Google Scholar]
  65. Pan, H.; Zhang, Q.; Caragea, C.; Dragut, E.; Latecki, L.J. Flowlearn: Evaluating large vision-language models on flowchart understanding. arXiv 2024, arXiv:2407.05183. [Google Scholar]
  66. Singh, S.; Chaurasia, P.; Varun, Y.; Pandya, P.; Gupta, V.; Gupta, V.; Roth, D. FlowVQA: Mapping multimodal logic in visual question answering with flowcharts. arXiv 2024, arXiv:2406.19237. [Google Scholar] [CrossRef] [Scilit]
  67. Anthropic. Introducing Claude 3.5 Sonnet. 2024. Available online: https://www.anthropic.com/news/claude-3-5-sonnet (accessed on 16 October 2024).
  68. OpenAI. Hello GPT-4o. 2024. Available online: https://openai.com/index/hello-gpt-4o/ (accessed on 16 October 2024).
  69. Wang, P.; Bai, S.; Tan, S.; Wang, S.; Fan, Z.; Bai, J.; Chen, K.; Liu, X.; Wang, J.; Ge, W.; et al. Qwen2-vl: Enhancing vision-language model’s perception of the world at any resolution. arXiv 2024, arXiv:2409.12191. [Google Scholar]
  70. Arbaz, A.; Fan, H.; Ding, J.; Qiu, M.; Feng, Y. GenFlowchart: Parsing and understanding flowchart using generative AI. In Proceedings of the International Conference on Knowledge Science, Engineering and Management; Springer: Berlin/Heidelberg, Germany, 2024; pp. 99–111. [Google Scholar]
  71. Wu, X.H.; Qu, M.C.; Liu, Z.Q.; Li, J.Z. A code automatic generation algorithm based on structured flowchart. Appl. Math. 2012, 6, 1S–8S. [Google Scholar]
  72. Raghu, D.; Agarwal, S.; Joshi, S.; Mausam. End-to-end learning of flowchart grounded task-oriented dialogs. arXiv 2021, arXiv:2109.07263. [Google Scholar]
  73. Kirillov, A.; Mintun, E.; Ravi, N.; Mao, H.; Rolland, C.; Gustafson, L.; Xiao, T.; Whitehead, S.; Berg, A.C.; Lo, W.Y.; et al. Segment anything. In Proceedings of the IEEE/CVF International Conference on Computer Vision, Paris, France, 1–6 October 2023; pp. 4015–4026. [Google Scholar]
  74. Mikolov, T.; Sutskever, I.; Chen, K.; Corrado, G.S.; Dean, J. Distributed representations of words and phrases and their compositionality. In Advances in Neural Information Processing Systems; Burges, C.J., Bottou, L., Welling, M., Ghahramani, Z., Weinberger, K.Q., Eds.; Curran Associates, Inc.: Red Hook, NY, USA, 2013; Volume 26. [Google Scholar]
  75. Sun, L.; Du, H.; Hou, T. FR-DETR: End-to-End Flowchart Recognition With Precision and Robustness. IEEE Access 2022, 10, 64292–64301. [Google Scholar] [CrossRef] [Scilit]
  76. Carion, N.; Massa, F.; Synnaeve, G.; Usunier, N.; Kirillov, A.; Zagoruyko, S. End-to-end object detection with transformers. In Proceedings of the European Conference on Computer Vision; Springer: Berlin/Heidelberg, Germany, 2020; pp. 213–229. [Google Scholar]
  77. Xu, Y.; Xu, W.; Cheung, D.; Tu, Z. Line segment detection using transformers without edges. In Proceedings of the IEEE/CVF Conference on Computer Vision and Pattern Recognition, Nashville, TN, USA, 20–25 June 2021; pp. 4257–4266. [Google Scholar]
  78. Bresler, M.; Prua, D.; Hlavác, V. Modeling flowchart structure recognition as a max-sum problem. In Proceedings of the 2013 12th International Conference on Document Analysis and Recognition, Washington, DC, USA, 25–28 August 2013; pp. 1215–1219. [Google Scholar]
  79. He, K.; Zhang, X.; Ren, S.; Sun, J. Deep residual learning for image recognition. In Proceedings of the IEEE Conference on Computer Vision and Pattern Recognition, Las Vegas, NV, USA, 27–30 June 2016; pp. 770–778. [Google Scholar]
  80. Awal, A.M.; Feng, G.; Mouchere, H.; Viard-Gaudin, C. First experiments on a new online handwritten flowchart database. In Proceedings of the Document Recognition and Retrieval XVIII, San Francisco, CA, USA, 23–27 January 2011; Volume 7874, pp. 81–90. [Google Scholar]
  81. Bresler, M.; Průša, D.; Hlaváč, V. Online recognition of sketched arrow-connected diagrams. Int. J. Doc. Anal. Recognit. (IJDAR) 2016, 19, 253–267. [Google Scholar] [CrossRef] [Scilit]
  82. Bresler, M.; Van Phan, T.; Prusa, D.; Nakagawa, M. Recognition system for on-line sketched diagrams. In Proceedings of the 2014 14th International Conference on Frontiers in Handwriting Recognition, Crete, Greece, 1–4 September 2014; pp. 563–568. [Google Scholar]
  83. Wang, H.; Gao, S.; Zhang, X. A method for analyzing handwritten program flowchart based on detection transformer and logic rules. Int. J. Doc. Anal. Recognit. (IJDAR) 2025, 28, 487–504. [Google Scholar] [CrossRef] [Scilit]
  84. Bresler, M.; Průša, D.; Hlaváč, V. Recognizing Off-Line Flowcharts by Reconstructing Strokes and Using On-Line Recognition Techniques. In Proceedings of the 2016 15th International Conference on Frontiers in Handwriting Recognition (ICFHR), Shenzhen, China, 23–26 October 2016; pp. 48–53. [Google Scholar] [CrossRef] [Scilit]
  85. Ye, M.; Zhang, J.; Zhao, S.; Liu, J.; Du, B.; Tao, D. Dptext-detr: Towards better scene text detection with dynamic points in transformer. In Proceedings of the AAAI Conference on Artificial Intelligence, Washington, DC, USA, 7–14 February 2023; Volume 37, pp. 3241–3249. [Google Scholar]
  86. Johri, A.; Sharma, S.; Chaudhary, V.; Raj, G.; Khurana, S. Analysis & Modeling of Deep Learning Techniques for Flowchart to Code Generation. In Proceedings of the 2025 International Conference on Networks and Cryptology (NETCRYPT), New Delhi, India, 29–31 May 2025; pp. 578–583. [Google Scholar] [CrossRef] [Scilit]
  87. Otto, B.; Aidarkhan, A.; Ristin, M.; Braunisch, N.; Diedrich, C.; van de Venn, H.W.; Wollschlaeger, M. Code and Test Generation for I4.0 State Machines with LLM-based Diagram Recognition. In Proceedings of the 2025 IEEE 21st International Conference on Factory Communication Systems (WFCS), Rostock, Germany, 10–13 June 2025; pp. 1–8. [Google Scholar] [CrossRef] [Scilit]
  88. Carton, C.; Lemaitre, A.; Coüasnon, B. Fusion of statistical and structural information for flowchart recognition. In Proceedings of the 2013 12th International Conference on Document Analysis and Recognition, Washington, DC, USA, 25–28 August 2013; pp. 1210–1214. [Google Scholar]
  89. Lemaitre, A.; Mouchere, H.; Camillerapp, J.; Coüasnon, B. Interest of syntactic knowledge for on-line flowchart recognition. In International Workshop on Graphics Recognition; Springer: Berlin/Heidelberg, Germany, 2011; pp. 89–98. [Google Scholar]
  90. Suri, M.; Mathur, P.; Lipka, N.; Dernoncourt, F.; Rossi, R.A.; Gupta, V.; Manocha, D. Follow the Flow: Fine-grained Flowchart Attribution with Neurosymbolic Agents. arXiv 2025, arXiv:2506.01344. [Google Scholar] [CrossRef] [Scilit]
  91. Vaswani, A.; Shazeer, N.; Parmar, N.; Uszkoreit, J.; Jones, L.; Gomez, A.N.; Kaiser, Ł.; Polosukhin, I. Attention is all you need. In Advances in Neural Information Processing Systems; Guyon, I., Von Luxburg, U., Bengio, S., Wallach, H., Fergus, R., Vishwanathan, S., Garnett, R., Eds.; Curran Associates, Inc.: Red Hook, NY, USA, 2017; Volume 30. [Google Scholar]
  92. Schäfer, B.; Keuper, M.; Stuckenschmidt, H. Arrow R-CNN for handwritten diagram recognition. Int. J. Doc. Anal. Recognit. 2021, 24, 3–17. [Google Scholar] [CrossRef] [Scilit]
  93. Xu, X.; Jiang, Y.; Chen, W.; Huang, Y.; Zhang, Y.; Sun, X. Damo-yolo: A report on real-time object detection design. arXiv 2022, arXiv:2211.15444. [Google Scholar]
  94. Lewis, D.; Agam, G.; Argamon, S.; Frieder, O.; Grossman, D.; Heard, J. Building a test collection for complex document information processing. In Proceedings of the 29th Annual International ACM SIGIR Conference on Research and Development in Information Retrieval, Seattle, WA, USA, 6–11 August 2006; pp. 665–666. [Google Scholar]
  95. Abu-Aisheh, Z.; Raveaux, R.; Ramel, J.Y.; Martineau, P. An exact graph edit distance algorithm for solving pattern recognition problems. In Proceedings of the 4th International Conference on Pattern Recognition Applications and Methods 2015, Lisbon, Portugal, 10–12 January 2015. [Google Scholar]
  96. Holm, H. Bidirectional Encoder Representations from Transformers (Bert) for Question Answering in the Telecom Domain: Adapting a Bert-like Language Model to the Telecom Domain Using the Electra Pre-Training Approach. Master’s Thesis, KTH Royal Institute of Technology, Stockholm, Sweden, 2021. Available online: https://urn.kb.se/resolve?urn=urn:nbn:se:kth:diva-301313 (accessed on 16 November 2025).
  97. Xiao, S.; Liu, Z.; Zhang, P.; Muennighoff, N.; Lian, D.; Nie, J.Y. C-pack: Packed resources for general chinese embeddings. In Proceedings of the 47th International ACM SIGIR Conference on Research and Development in Information Retrieval, Washington DC, USA, 14–18 July 2024; pp. 641–649. [Google Scholar]
  98. Guernsey, G. Harnessing Large Language Models for Automated Software Diagram Generation. Master’s Thesis, University of Cincinnati, Cincinnati, OH, USA, 2025. [Google Scholar]
  99. Fill, H.G.; Fettke, P.; Köpke, J. Conceptual modeling and large language models: Impressions from first experiments with ChatGPT. Enterp. Model. Inf. Syst. Archit. (EMISAJ) 2023, 18, 1–15. [Google Scholar]
  100. Conrardy, A.; Cabot, J. From image to uml: First results of image based uml diagram generation using llms. arXiv 2024, arXiv:2404.11376. [Google Scholar] [CrossRef] [Scilit]
  101. Thomas, R.; Webb, B. Architectural views, 2023. In Lecture Notes in Software Engineering; University of Queensland: Brisbane, Australia, 2023; Last updated 21 February 2025. [Google Scholar]
  102. Yan, X.; Liu, Y.; Chen, Z.; Wang, J. Challenges and advancements in recurrent neural networks for sequential data modeling. J. Mach. Learn. Res. 2023, 42, 123–145. [Google Scholar]
  103. Mann, B.; Ryder, N.; Subbiah, M.; Kaplan, J.; Dhariwal, P.; Neelakantan, A.; Shyam, P.; Sastry, G.; Askell, A.; Agarwal, S.; et al. Language models are few-shot learners. arXiv 2020, arXiv:2005.14165. [Google Scholar]
  104. Pawar, S.S. Automated Code Generation from Flowcharts: A Multimodal Deep Learning Framework for Accurate Translation and Debugging. Master’s Thesis, Texas Tech University, Lubbock, TX, USA, 2025. [Google Scholar]
  105. Yuan, Z.; Pan, H.; Zhang, L. A novel pen-based flowchart recognition system for programming teaching. In Proceedings of the Workshop on Blended Learning; Springer: Berlin/Heidelberg, Germany, 2008; pp. 55–64. [Google Scholar]
  106. Hussein, B.M.; Salah, A. A Framework for Model-Based Code Generation from a Flowchart. Int. J. Comput. Acad. Res. 2013, 2, 167–181. [Google Scholar]
  107. Bhushan, S.; Lee, M. Block diagram-to-text: Understanding block diagram images by generating natural language descriptors. In Proceedings of the Findings of the Association for Computational Linguistics: AACL-IJCNLP 2022, Taipei, Taiwan, 20–23 November 2022; pp. 153–168. [Google Scholar]
  108. Balaji, A.; Ramanathan, T.; Sonathi, V. Chart-text: A fully automated chart image descriptor. arXiv 2018, arXiv:1812.10636. [Google Scholar] [CrossRef] [Scilit]
  109. Lin, T.Y.; Dollár, P.; Girshick, R.; He, K.; Hariharan, B.; Belongie, S. Feature pyramid networks for object detection. In Proceedings of the IEEE Conference on Computer Vision and Pattern Recognition, Honolulu, HI, USA, 21–26 July 2017; pp. 2117–2125. [Google Scholar]
  110. Szegedy, C.; Ioffe, S.; Vanhoucke, V.; Alemi, A. Inception-v4, inception-resnet and the impact of residual connections on learning. In Proceedings of the AAAI Conference on Artificial Intelligence, San Francisco, CA, USA, 4–9 February 2017; Volume 31. [Google Scholar]
  111. Raffel, C.; Shazeer, N.; Roberts, A.; Lee, K.; Narang, S.; Matena, M.; Zhou, Y.; Li, W.; Liu, P.J. Exploring the limits of transfer learning with a unified text-to-text transformer. J. Mach. Learn. Res. 2020, 21, 1–67. [Google Scholar]
  112. Gardent, C.; Shimorina, A.; Narayan, S.; Perez-Beltrachini, L. The WebNLG challenge: Generating text from RDF data. In Proceedings of the 10th International Conference on Natural Language Generation. ACL Anthology, Santiago de Compostela, Spain, 4–7 September 2017; pp. 124–133. [Google Scholar]
  113. Bhushan, S.; Jung, E.S.; Lee, M. Unveiling the Power of Integration: Block Diagram Summarization through Local-Global Fusion. In Findings of the Association for Computational Linguistics ACL 2024; Ku, L.W., Martins, A., Srikumar, V., Eds.; Association for Computational Linguistics: Bangkok, Thailand, 2024; pp. 13837–13856. [Google Scholar] [CrossRef] [Scilit]
  114. Liu, Z.; Lin, Y.; Cao, Y.; Hu, H.; Wei, Y.; Zhang, Z.; Lin, S.; Guo, B. Swin transformer: Hierarchical vision transformer using shifted windows. In Proceedings of the IEEE/CVF International Conference on Computer Vision, Montreal, QC, Canada, 11–17 October 2021; pp. 10012–10022. [Google Scholar]
  115. Chen, F.; Zhang, L.; Lian, X.; Niu, N. Automatically recognizing the semantic elements from UML class diagram images. J. Syst. Softw. 2022, 193, 111431. [Google Scholar] [CrossRef] [Scilit]
  116. Karasneh, B.; Chaudron, M.R. Extracting UML models from images. In Proceedings of the 2013 5th International Conference on Computer Science and Information Technology, Amman, Jordan, 27–28 March 2013; pp. 169–178. [Google Scholar]
  117. Ho-Quang, T.; Chaudron, M.R.; Samúelsson, I.; Hjaltason, J.; Karasneh, B.; Osman, H. Automatic classification of UML class diagrams from images. In Proceedings of the 2014 21st Asia-Pacific Software Engineering Conference, Jeju, South Korea, 1–4 December 2014; Volume 1, pp. 399–406. [Google Scholar]
  118. El-Salamony, M.; Guaily, A. Enhanced modified-polygon method for point-in-polygon problem. In Proceedings of the Recent Advances in Engineering Mathematics and Physics: Proceedings of the International Conference RAEMP 2019; Springer: Berlin/Heidelberg, Germany, 2020; pp. 47–61. [Google Scholar]
  119. Weerasinghe, D.; Thiwanka, K.; Jayasith, H.; Natalie, P.O.; Rajapaksha, U.S.; Karunasena, A. Smart UML-Assignment Management Tool for UML Diagrams. In Proceedings of the 2022 4th International Conference on Advancements in Computing (ICAC), Colombo, Sri Lanka, 9–10 December 2022; pp. 114–119. [Google Scholar]
  120. Elallaoui, M.; Nafil, K.; Touahni, R. Automatic generation of UML sequence diagrams from user stories in Scrum process. In Proceedings of the 2015 10th International Conference on Intelligent Systems: Theories and Applications (SITA), Rabat, Morocco, 20–21 October 2015; pp. 1–6. [Google Scholar]
  121. Gulia, S.; Choudhury, T. An efficient automated design to generate UML diagram from Natural Language Specifications. In Proceedings of the 2016 6th International Conference-Cloud System and Big Data Engineering (Confluence), Noida, India, 14–15 January 2016; pp. 641–648. [Google Scholar]
  122. Fauzan, R.; Siahaan, D.; Rochimah, S.; Triandini, E. Class diagram similarity measurement: A different approach. In Proceedings of the 2018 3rd International Conference on Information Technology, Information System and Electrical Engineering (ICITISEE), Yogyakarta, Indonesia, 13–14 November 2018; pp. 215–219. [Google Scholar]
  123. Qiu, D.; Li, H.; Sun, J. Measuring software similarity based on structure and property of class diagram. In Proceedings of the 2013 Sixth International Conference on Advanced Computational Intelligence (ICACI), Hangzhou, China, 19–21 October 2013; pp. 75–80. [Google Scholar]
  124. Wang, K.; Liu, W.; Mu, Y.; Gao, S. Automatic extraction of sequence diagram semantic information. In Proceedings of the 2023 5th International Conference on Machine Learning, Big Data and Business Intelligence (MLBDBI), Hangzhou, China, 15–17 December 2023; pp. 315–318. [Google Scholar]
  125. Bates, A.; Vavricka, R.; Carleton, S.; Shao, R.; Pan, C. Unified modeling language code generation from diagram images using multimodal large language models. Mach. Learn. Appl. 2025, 20, 100660. [Google Scholar] [CrossRef] [Scilit]
  126. Liu, H.; Li, C.; Wu, Q.; Lee, Y.J. Visual instruction tuning. Adv. Neural Inf. Process. Syst. 2023, 36, 34892–34916. [Google Scholar]
  127. Hu, E.J.; Shen, Y.; Wallis, P.; Allen-Zhu, Z.; Li, Y.; Wang, S.; Wang, L.; Chen, W. Lora: Low-rank adaptation of large language models. ICLR 2022, 1, 3. [Google Scholar]
  128. Wang, Z.; Bovik, A.C.; Sheikh, H.R.; Simoncelli, E.P. Image quality assessment: From error visibility to structural similarity. IEEE Trans. Image Process. 2004, 13, 600–612. [Google Scholar] [CrossRef] [Scilit]
  129. Bhattacharya, A.; Roy, S.; Sarkar, N.; Malakar, S.; Sarkar, R. Circuit component detection in offline handdrawn electrical/electronic circuit diagram. In Proceedings of the 2020 IEEE Calcutta Conference (CALCON), Kolkata, India, 28–29 February 2020; pp. 80–84. [Google Scholar]
  130. Okazaki, A.; Kondo, T.; Mori, K.; Tsunekawa, S.; Kawamoto, E. An automatic circuit diagram reader with loop-structure-based symbol recognition. IEEE Trans. Pattern Anal. Mach. Intell. 1988, 10, 331–341. [Google Scholar] [CrossRef]
  131. De Jesus, E.O.; Lotufo, R.D.A. ECIR-an electronic circuit diagram image recognizer. In Proceedings of the Proceedings SIBGRAPI’98. International Symposium on Computer Graphics, Image Processing, and Vision (Cat. No. 98EX237), Rio de Janeiro, Brazil, 20–23 October 1998; pp. 254–260. [Google Scholar]
  132. Malakar, S.; Halder, S.; Sarkar, R.; Das, N.; Basu, S.; Nasipuri, M. Text line extraction from handwritten document pages using spiral run length smearing algorithm. In Proceedings of the 2012 International Conference on Communications, Devices and Intelligent Systems (CODIS), Kolkata, West Bengal, India, 28–29 December 2012; pp. 616–619. [Google Scholar]
  133. Sertdemir, A.E.; Besenk, M.; Dalyan, T.; Gokdel, Y.D.; Afacan, E. From Image to Simulation: An ANN-based Automatic Circuit Netlist Generator (Img2Sim). In Proceedings of the 2022 18th International Conference on Synthesis, Modeling, Analysis and Simulation Methods and Applications to Circuit Design (SMACD), Villasimius, Italy, 12–15 June 2022; pp. 1–4. [Google Scholar] [CrossRef] [Scilit]
  134. Zupan, J. Introduction to artificial neural network (ANN) methods: What they are and how to use them. Acta Chim. Slov. 1994, 41, 327. [Google Scholar]
  135. Wang, H.; Pan, T.; Ahsan, M.K. Hand-drawn electronic component recognition using deep learning algorithm. Int. J. Comput. Appl. Technol. 2020, 62, 13–19. [Google Scholar] [CrossRef] [Scilit]
  136. Rabbani, M.; Khoshkangini, R.; Nagendraswamy, H.; Conti, M. Hand drawn optical circuit recognition. Procedia Comput. Sci. 2016, 84, 41–48. [Google Scholar] [CrossRef] [Scilit]
  137. Günay, M.; Köseoğlu, M.; Yıldırım, Ö. Classification of hand-drawn basic circuit components using convolutional neural networks. In Proceedings of the 2020 International Congress on Human-Computer Interaction, Optimization and Robotic Applications (HORA), Ankara, Turkey, 25–27 June 2020; pp. 1–5. [Google Scholar]
  138. Rachala, R.R.; Panicker, M.R. Hand-drawn electrical circuit recognition using object detection and node recognition. SN Comput. Sci. 2022, 3, 244. [Google Scholar] [CrossRef] [Scilit]
  139. Roy, S.; Bhattacharya, A.; Sarkar, N.; Malakar, S.; Sarkar, R. Offline hand-drawn circuit component recognition using texture and shape-based features. Multimed. Tools Appl. 2020, 79, 31353–31373. [Google Scholar] [CrossRef] [Scilit]
  140. Dey, M.; Mia, S.M.; Sarkar, N.; Bhattacharya, A.; Roy, S.; Malakar, S.; Sarkar, R. A two-stage CNN-based hand-drawn electrical and electronic circuit component recognition system. Neural Comput. Appl. 2021, 33, 13367–13390. [Google Scholar] [CrossRef] [Scilit]
  141. Lakshman Naika, R.; Dinesh, R.; Prabhanjan, S. Handwritten electric circuit diagram recognition: An approach based on finite state machine. Int. J. Mach. Learn. Comput. 2019, 9, 374–380. [Google Scholar] [CrossRef] [Scilit]
  142. Alhalabi, M.; Ghazal, M.; Haneefa, F.; Yousaf, J.; El-Baz, A. Smartphone handwritten circuits solver using augmented reality and capsule deep networks for engineering education. Educ. Sci. 2021, 11, 661. [Google Scholar] [CrossRef] [Scilit]
  143. Liu, Y.; Xiao, Y. Circuit Sketch Recognition; Department of Electrical Engineering Stanford University: Stanford, CA, USA, 2013. [Google Scholar]
  144. Patare, M.D.; Joshi, M.S. Hand-drawn digital logic circuit component recognition using svm. Int. J. Comput. Appl. 2016, 143, 24–28. [Google Scholar] [CrossRef] [Scilit]
  145. Sabour, S.; Frosst, N.; Hinton, G.E. Dynamic routing between capsules. In Advances in Neural Information Processing Systems; Guyon, I., Von Luxburg, U., Bengio, S., Wallach, H., Fergus, R., Vishwanathan, S., Garnett, R., Eds.; Curran Associates, Inc.: Red Hook, NY, USA, 2017; Volume 30. [Google Scholar]
  146. Bohara, B.; Krishnamoorthy, H.S. Computer Vision based Framework for Power Converter Identification and Analysis. In Proceedings of the 2022 IEEE International Conference on Power Electronics, Drives and Energy Systems (PEDES), Jaipur, India, 14–17 December 2022; pp. 1–6. [Google Scholar] [CrossRef] [Scilit]
  147. Bayer, J.; Turabi, S.H.; Dengel, A. Text extraction for handwritten circuit diagram images. In Proceedings of the International Conference on Document Analysis and Recognition; Springer: Berlin/Heidelberg, Germany, 2023; pp. 192–198. [Google Scholar]
  148. Bayer, J.; Roy, A.K.; Dengel, A. Instance segmentation based graph extraction for handwritten circuit diagram images. arXiv 2023, arXiv:2301.03155. [Google Scholar] [CrossRef] [Scilit]
  149. Gao, M.; Qiu, R.; Chang, Z.H.; Zhang, K.; Wei, H.; Chen, H.C. Circuit Diagram Retrieval Based on Hierarchical Circuit Graph Representation. arXiv 2025, arXiv:2503.11658. [Google Scholar]
  150. Mohan, A.; Mohan, A.; Indushree, B.; Malavikaa, M.; Narendra, C. Generation of Netlist from a Hand drawn Circuit through Image Processing and Machine Learning. In Proceedings of the 2022 2nd International Conference on Artificial Intelligence and Signal Processing (AISP), Vijayawada, India, 12–14 February 2022; pp. 1–4. [Google Scholar]
  151. Wang, C.Y.; Yeh, I.H.; Liao, H.Y.M. You only learn one representation: Unified network for multiple tasks. arXiv 2021, arXiv:2105.04206. [Google Scholar] [CrossRef] [Scilit]
  152. Likas, A.; Vlassis, N.; Verbeek, J.J. The global k-means clustering algorithm. Pattern Recognit. 2003, 36, 451–461. [Google Scholar] [CrossRef] [Scilit]
  153. Komoot, N.; Mruetusatorn, S. An Analysis of Electronic Circuits Diagram Using Computer Vision Techniques. In Proceedings of the 2024 9th International Conference on Business and Industrial Research (ICBIR), Bangkok, Thailand, 23–24 May 2024; pp. 1581–1586. [Google Scholar] [CrossRef] [Scilit]
  154. Pavithra, S.; Shreyashwini, N.; Bhavana, H.; Nikhitha, G.; Kavitha, T. Hand-drawn electronic component recognition using orb. Procedia Comput. Sci. 2023, 218, 504–513. [Google Scholar] [CrossRef] [Scilit]
  155. Hemker, D.; Maalouly, J.; Mathis, H.; Klos, R.; Ravanan, E. From Schematics to Netlists–Electrical Circuit Analysis Using Deep-Learning Methods. Adv. Radio Sci. 2024, 22, 61–75. [Google Scholar] [CrossRef] [Scilit]
  156. Kelly, C.R.; Cole, J.M. Digitizing images of electrical-circuit schematics. APL Mach. Learn. 2024, 2, 016109. [Google Scholar] [CrossRef] [Scilit]
  157. Arun, A.; Patil, S.S.; Poduval, G.M.; Shah, A.; Patil, R.P. Hand-Drawn Electronic Component Detection and Simulation Using Deep Learning and Flask. Cureus J. 2025, 2, es44389-025-03676-4. [Google Scholar] [CrossRef] [Scilit]
  158. Cao, W.; Chen, Z.; Wu, C.; Li, T. A Layered Framework for Universal Extraction and Recognition of Electrical Diagrams. Electronics 2025, 14, 833. [Google Scholar] [CrossRef] [Scilit]
  159. Shi, C.; Beltran-Velez, N.; Nazaret, A.; Zheng, C.; Garriga-Alonso, A.; Jesson, A.; Makar, M.; Blei, D.M. Hypothesis testing the circuit hypothesis in LLMs. In Advances in Neural Information Processing Systems; Curran Associates, Inc.: Red Hook, NY, USA, 2024; Volume 37, pp. 94539–94567. [Google Scholar]
  160. Vasudeva Reddy, T.; Nareshkumar, B.; Anirudh Reddy, R.; Kavitha Reddy, P. Design of implantable cardioverter defibrillator using low power subthreshold digital circuit. In IOP Conference Series: Materials Science and Engineering; IOP Publishing: Bristol, UK, 2021; Volume 1074, p. 012029. [Google Scholar]
  161. Dieste-Velasco, M. Application of a Pattern-Recognition Neural Network for Detecting Analog Electronic Circuit Faults. Mathematics 2021, 9, 3247. [Google Scholar] [CrossRef] [Scilit]
  162. Zhou, Y.; Qi, H.; Ma, Y. End-to-end wireframe parsing. In Proceedings of the IEEE/CVF International Conference on Computer Vision, Seoul, Republic of Korea, 27–28 October 2019; pp. 962–971. [Google Scholar]
  163. Mishra, D.; Vinayak, C. Image based Circuit Simulation. In Proceedings of the 2013 International Conference on Control, Automation, Robotics and Embedded Systems (CARE), Jabalpur, India, 16–18 December 2013; pp. 1–4. [Google Scholar] [CrossRef] [Scilit]
  164. Matasyx, J.; Kittlery, C.G.J. Progressive probabilistic hough transform. In Proceedings of the British Machine Vision Conference, Southampton, UK, 14–17 September 1998; pp. 14–17. [Google Scholar]
  165. Neuner, M.; Abel, I.; Graeb, H. Library-free Structure Recognition for Analog Circuits. In Proceedings of the 2021 Design, Automation & Test in Europe Conference & Exhibition (DATE), Grenoble, France, 1–5 February 2021; pp. 1366–1371. [Google Scholar] [CrossRef] [Scilit]
  166. Vasudevan, S.K.; Venkatachalam, K.; Sundaram, R. A novel mobile application for circuit component identification and recognition through machine learning and image processing techniques. Int. J. Intell. Syst. Technol. Appl. 2017, 16, 342–358. [Google Scholar] [CrossRef] [Scilit]
  167. Pan, L.; Xue, Z.; Zhang, K. GAML-YOLO: A Precise Detection Algorithm for Extracting Key Features from Complex Environments. Electronics 2025, 14, 2523. [Google Scholar] [CrossRef] [Scilit]
  168. Sanfeliu, A.; Fu, K.S. A distance measure between attributed relational graphs for pattern recognition. IEEE Trans. Syst. Man Cybern. 2012, 3, 353–362. [Google Scholar]
  169. Gody, M. Hand-Drawn Electric Circuit Schematic Components. 2022. Available online: https://www.kaggle.com/datasets/moodrammer/handdrawn-circuit-schematic-components (accessed on 14 October 2022).
  170. Uzair, W.; Chai, D.; Rassau, A. ElectroNet: An Enhanced Model for Small-Scale Object Detection in Electrical Schematic Diagrams. Res. Sq. 2023. [Google Scholar] [CrossRef] [Scilit]
  171. Cui, C.; Sun, T.; Lin, M.; Gao, T.; Zhang, Y.; Liu, J.; Wang, X.; Zhang, Z.; Zhou, C.; Liu, H.; et al. Paddleocr 3.0 technical report. arXiv 2025, arXiv:2507.05595. [Google Scholar] [CrossRef] [Scilit]
  172. Bi, R.; Xu, T.; Xu, M.; Chen, E. Paddlepaddle: A production-oriented deep learning platform facilitating the competency of enterprises. In Proceedings of the 2022 IEEE 24th Int Conf on High Performance Computing & Communications; 8th Int Conf on Data Science & Systems; 20th Int Conf on Smart City; 8th Int Conf on Dependability in Sensor, Cloud & Big Data Systems & Application (HPCC/DSS/SmartCity/DependSys), Chengdu, China, 18–20 December 2022; pp. 92–99. [Google Scholar]
  173. He, J.; Ničković, D.; Bartocci, E.; Grosu, R. TD-Magic: From Pictures of Timing Diagrams To Formal Specifications. In Proceedings of the 2023 60th ACM/IEEE Design Automation Conference (DAC), Francisco, CA, USA, 9–13 July 2023; pp. 1–6. [Google Scholar] [CrossRef] [Scilit]
  174. Li, Y.; Qu, Q.; Wang, M.; Yu, L.; Wang, J.; Shen, L.; He, K. Deep learning for digitizing highly noisy paper-based ECG records. Comput. Biol. Med. 2020, 127, 104077. [Google Scholar] [CrossRef] [Scilit]
  175. He, J.; Kenbeek, V.T.W.; Yang, Z.; Qu, M.; Bartocci, E.; Ničković, D.; Grosu, R. TD-Interpreter: Enhancing the Understanding of Timing Diagrams with Visual-Language Learning. arXiv 2025, arXiv:2507.16844. [Google Scholar]
  176. Farag, M.M. Design and analysis of convolutional neural layers: A signal processing perspective. IEEE Access 2023, 11, 27641–27661. [Google Scholar] [CrossRef] [Scilit]
  177. Xiao, Z.; Xu, X.; Xing, H.; Luo, S.; Dai, P.; Zhan, D. RTFN: A robust temporal feature network for time series classification. Inf. Sci. 2021, 571, 65–86. [Google Scholar] [CrossRef] [Scilit]
  178. Cabrera, D.; Sancho, F.; Cerrada, M.; Sanchez, R.V.; Li, C. Knowledge extraction from deep convolutional neural networks applied to cyclo-stationary time-series classification. Inf. Sci. 2020, 524, 1–14. [Google Scholar] [CrossRef] [Scilit]
  179. Yin, C.; Zhang, S.; Wang, J.; Xiong, N.N. Anomaly detection based on convolutional recurrent autoencoder for IoT time series. IEEE Trans. Syst. Man Cybern. Syst. 2020, 52, 112–122. [Google Scholar] [CrossRef] [Scilit]
  180. Tuli, S.; Casale, G.; Jennings, N.R. Tranad: Deep transformer networks for anomaly detection in multivariate time series data. arXiv 2022, arXiv:2201.07284. [Google Scholar] [CrossRef] [Scilit]
  181. Wen, M.; Chen, Z.; Xiong, Y.; Zhang, Y. LGAT: A novel model for multivariate time series anomaly detection with improved anomaly transformer and learning graph structures. Neurocomputing 2025, 617, 129024. [Google Scholar] [CrossRef] [Scilit]
Figure 1. Comparison flowchart example.
Information 17 00165 g001
Figure 2. Computer block diagram example.
Information 17 00165 g002
Figure 3. UML vehicle diagram example.
Information 17 00165 g003
Figure 4. MCU circuit diagram example.
Information 17 00165 g004
Figure 5. Timing diagram example.
Information 17 00165 g005
Figure 6. PRISMA 2020 flow diagram illustrating the systematic literature search and selection process, generated using [2].
Information 17 00165 g006
Figure 7. VOSviewer keyword co-occurrence network visualization revealing thematic clusters in deep learning for technical diagram extraction research (N = 230 papers, minimum 5 occurrences per keyword).
Information 17 00165 g007
Table 1. Distribution of identified literature across diagram types (N = 48).
Diagram TypesPapersPercentage (%)
Core Technical Diagrams (42 papers)
Flowchart Diagram1939.58
Block and UML Diagram714.58
Electrical Schematic Diagram1429.17
Timing Diagram24.17
Related Work (6 papers)
Time Series Diagram612.50
Total48100.00
Bold formatting is used to distinguish category headers from individual diagram types.
Table 2. Table of flowchart schematic extraction scoring.
PaperPublication
Year
MethodDataset SizePerformance
[21]2020Otsu, ROI, OpenCV25(Accuracy)
90%
[27]2020GRCNN2490(Accuracy)
94.1%
[30]2020Otsu, Erosion, Dilation,
Beam Search, RDP
20(Accuracy)
86.52%
[35]2020OpenCV, Darknet, Tiny YOLOv3
Google Cloud Vision
161(mAP)
99.82%
[41]2022Bi-LSTM, GAT, TranX50(BLEU)
55.68
[61]2022InstGNN, DGL3245(Accuracy)
95.80%
[75]2022FR-DETR260(F1-Score)
98.4%
[47]2023HT, easyOCR, Code-T5
CRAFT, TrOCR
1188(BLEU)
67.4
[55]2023S-Distil-BERT50(Accuracy)
75.59%
[54]2024EasyOCR, OpenCV, Llama 2Unknown(Success Rate)
75%
[70]2024SAM, GPT-3.5, OCR, PSM550(BERT-F1)
86.49%
[62]2025Claude 3.5, GPT-4o, Qwen2-VLUnknown(F1-Score)
88.23%
[83]2025LS-DETR885(mAP)
99.18%
[98]2025Tesseract, GPT-4o6(Accuracy)
100%
[86]2025GPT-4o, Claude 3.5Unknown(Accuracy)
92%
[104]2025GNN, HT, RPN
R-CNN, Keras OCR
875(F1-Score)
95.8%
[63]2025OCR, DAMO-YOLO, GPT-4o30(Accuracy)
88.9%
[87]2025GPT-4o95(Accuracy)
63%
[64]2025Qwen2-VL, DIT, RAG105(Accuracy)
71.91%
Table 3. Table of block diagram extraction scoring.
PaperPublication
Year
MethodDataset SizePerformance
[107]2022Faster R-CNN, T5
EasyOCR, HLT
502(ROUGE-1)
81.29
[113]2024YOLOv5, Pororo OCR
BART, Swin, GPT-4V
83,394(ROUGUE-1)
88.9
Table 4. Table of UML diagram extraction scoring.
PaperPublication
Year
MethodDataset SizePerformance
[115]2022ReSECDI30(F1-Score)
91.63%
[119]2022Tesseract OCR, Keras-OCR
Faster R-CNN, SSD
100(Accuracy)
90%
[124]2023SDE50(F1-Score)
72%
[100]2024GPT-4V4(Accuracy)
100%
[125]2025LLaVA, LoRA59,998(BLEU)
77.9
Table 5. Table of circuit schematic extraction scoring.
PaperPublication
Year
MethodDatasetPerformance
[129]2020Morpholigcal
RLSA
60(Accuracy)
91.28%
[142]2021CapsNet, Dilation, HT800(mAP)
93.64%
[138]2022YOLOv5, HT, K-Means388(mAP)
98.2%
[150]2022OpenCV, OCR, HOG, SVMUnknown(Accuracy)
Unknown
[133]2022YOLOv5, OCR, HT330(Accuracy)
98%
[146]2022YOLOR, HT, K-Means176(mAP)
91.6%
[147]2023LSTM, Faster R-CNN, RegEx2304Unknown
[148]2023Keypoints, Mask R-CNN2208(Accuracy)
94%
[155]2024YOLOv7, EasyOCR,
L-CNN, CRAFT
164(mAP)
73%
[153]2024YOLOv8, CNN, OCR50(Accuracy)
84%
[156]2024Otsu, Tesseract OCR, PPHT15(Accuracy)
85.6%
[157]2025Custom CNN4800(Accuracy)
96%
[149]2025GAM-YOLO, GED227(Precision)
88.1%
[158]2025YOLOv7, PaddleClas,
PaddleOCR
5000(F1-Score)
99.6%
Table 6. Table of timing diagram extraction scoring.
PaperPublication
Year
MethodDatasetPerformance
[173]2023Paddle OCR, YOLOv5
SED, LAD
30(Success Rate)
76.7%
[175]2025LLaVA, ViT, LoRA10,234(ROUGE-1)
96.7
Disclaimer/Publisher’s Note: The statements, opinions and data contained in all publications are solely those of the individual author(s) and contributor(s) and not of MDPI and/or the editor(s). MDPI and/or the editor(s) disclaim responsibility for any injury to people or property resulting from any ideas, methods, instructions or products referred to in the content.