Article

A Novel Local Dimming Approach by Controlling LCD Backlight Modules via Deep Learning

by
Tsorng-Lin Chia
1,
Yi-Yang Syu
1 and
Ping-Sheng Huang
2,*
1
Department of Applied Artificial Intelligence, Ming Chuan University, Taoyuan 333, Taiwan
2
Department of Electrical Engineering, Ming Chuan University, Taoyuan 333, Taiwan
*
Author to whom correspondence should be addressed.
Information 2025, 16(9), 815; https://doi.org/10.3390/info16090815
Submission received: 3 June 2025 / Revised: 7 September 2025 / Accepted: 17 September 2025 / Published: 19 September 2025
(This article belongs to the Section Artificial Intelligence)

Abstract

The display contrast and efficiency of power consumption for LCDs (Liquid Crystal Displays) continue to attract attention from both industry and academia. Local dimming approaches for direct-type backlight modules (BLMs, also referred to as backlight units, BLUs) are regarded as a potential solution. The purpose of this study is to explore how to optimize the local dimming method of LCD to achieve higher contrast and lower power consumption through deep learning techniques. In this paper, we propose a local dimming approach with dual modulation for LCD-LED displays based on VGG19 and UNet models. Experimental results have shown that this method not only reconstructs the input image into an HDR (High Dynamic Range) image but also automatically generates a control image for the backlight module and LCD panel. In addition, the proposed method can effectively improve the contrast and reduce the power consumption of the LCD in the absence of a public training dataset. Our method can achieve the best performance in MSE and HDR-VDP-2 among eight different combinations of mask and pre-training. Using deep learning techniques, this study has successfully optimized the local dimming approach of LCDs and demonstrated its benefits in improving contrast and reducing power consumption.

1. Introduction

Liquid crystal displays (LCDs) dominate the market of large to small displays due to their ease of manufacture and cost-effectiveness. The main components of each LCD consist of an LCD panel and a backlight module. Since the LCD panel is not self-illuminating, the light source supply of the backlight module becomes necessary. However, traditional LCDs use a constant and uniform global backlight, resulting in the backlight continuing to operate when displayed in full white or black. This not only increases power consumption but also further reduces the display contrast caused by the distortion of the black parts due to the light leakage effect of liquid crystals [1,2,3].
Recently, with the advancement of backlight module control techniques and the development of mini-LED and micro-LED manufacturing technology, backlight modules have changed from global lighting to a way that can independently control a small number of LEDs. Therefore, many local dimming approaches have been proposed to solve the problems of power consumption and light leakage [4,5,6,7,8,9]. This strategy adjusts the brightness of the backlight based on the local characteristics of the image, allowing for dynamic adjustment of the image area. For example, when an image block is brighter, its backlight is also brightened. Conversely, the backlight brightness in the darker part of the image is reduced. This method can effectively lower power consumption and light leakage of the LCD and improve the display contrast ratio. Figure 1 illustrates two types of backlight sources for LCD panels. LCD panels with local dimming are also known as “zone dimming” or “Full Array Local Dimming” (FALD). This technique allows the LEDs in the backlight module to adjust brightness independently to provide better contrast and deeper blacks. In the FALD backlight module of LCD panels, the number of LEDs can vary depending on the panel size, resolution, and target market.
For images with LDR (Low Dynamic Range) characteristics, various image processing techniques have been applied to produce corresponding HDR (High Dynamic Range) images. In view of the HDR display capability of LCDs, HDR conversion of input images has been an effective technical approach. However, existing HDR image reconstruction methods still mainly rely on heuristics or expert knowledge. Therefore, using deep learning algorithms to capture more image features and achieve HDR conversion from a single LDR image is a more resilient method.
In the LCD structure, the LED light needs to pass through the backlight layer and the liquid crystal layer, and then the light is blocked by the polarizer. However, the control of the liquid crystal layer does not completely prevent the light from penetrating. This results in the black appearance on the LCD not being true pure black, which in turn affects the contrast. Furthermore, traditional global LED backlight modules continue to operate at high brightness, resulting in high power consumption. To solve the above problems, this study aims to convert the traditional global LED backlight into a local dimming LED backlight. The brightness is adjusted by partitioning the backlight layer to optimize the interaction between the LED backlight and the liquid crystal layer. This approach can reduce power consumption and achieve a display effect closer to pure black. Also, the halo effect can be reduced at the same time.
According to the literature on the local dimming algorithms of direct-type LCD backlight modules, the purpose of this study is to investigate the following issues and propose a better solution:
(1)
To develop a method of directly generating HDR images from a single image for LDR images, traditional methods, such as relying on expert experience or heuristics, often fail to fully process the multiple exposed pixels in the image, resulting in artifacts. Therefore, this study plans to achieve higher image reproduction performance through deep learning models.
(2)
Most of the existing BLD (Backlight Local Dimming) algorithms are not designed for HDR images. Therefore, these algorithms will be optimized to make them more suitable for the display needs of HDR images.
(3)
The best balance between image quality and power consumption will be achieved to reduce image distortion, improve contrast, and reduce overall power consumption.
(4)
Considering the key factors of local dimming techniques, an LCD-LED software simulation platform will be developed to quickly evaluate the improvement effect of image contrast without the need to modify the actual hardware structure.
(5)
A set of local dimming algorithms based on deep learning will be designed to generate backlight images with LED brightness distribution and LCD pixel images more quickly and effectively.
In summary, the main contributions of this paper are:
(1)
Develop a software simulator for a backlight module to reduce the cost of hardware modifications.
(2)
Propose an algorithm to directly generate HDR images from a single LDR image to overcome the limitation that multiple exposure images cannot be obtained.
(3)
Use a deep learning method to generate backlight module images and LCD panel images, and halo artifacts are optimized.

2. Related Work

LCDs are traditionally designed with global backlight modules. With this approach, the backlight module is always turned on, regardless of whether the screen is displayed in full white or black. This design not only leads to excessive power consumption but also produces obvious light leakage since the light transmittance of the LCD panel cannot be completely turned off [1,6,10]. To optimize the dynamic range and image contrast, the display technique of LCD-LED dual modulation combining an LED array backlight module and an LCD panel, has been proposed in recent years. In this approach, the LED backlight module adopts a low-resolution LED array that can independently adjust the brightness of the corresponding part of the image. The LCD panel, on the other hand, maintains high resolution and enables precise control of the color channels of the image. Theoretically, the dynamic range of an LCD-LED dual-modulation display is determined by the brightness product of the LCD panel and the backlight module [11]. Using local dimming can not only improve image quality but also enhance image contrast and reduce power consumption [12], making it a core component of next-generation LCD.
In the technique of LCD-LED dual-modulation display, local dimming algorithms are widely regarded as the key image processing methods [13]. The brightness of the LED elements in the backlight module can be dynamically adjusted by analyzing the content of the displayed image in real time, and at the same time, the light transmittance of the LCD panel can be optimize. Specifically, the brightness of each LED element in the backlight module is adjusted independently according to its corresponding image block. This method can not only lower energy consumption but also effectively reduce the light leakage of the LCD panel, thereby improving the contrast of the overall display.
In the current development of LCD methods, there are two main research directions. First, from the hardware design of the backlight module, the focus is on improving the LCD contrast, which involves enhancing the brightness and reducing light leakage. In this category, the light-emitting mechanism of the backlight module is mainly divided into two types: direct illumination (direct-type) and edge illumination (edge-type). Secondly, the local dimming approach is implemented through the precise control of multiple light-emitting elements in the backlight module. The core of this technology is to generate the corresponding image of the backlight module and LCD panel image based on the original input image. Then the operations of the backlight module and LCD panel are individually controlled based on those two images. In view of the requirement to improve image contrast and reduce the power consumption of backlight modules, various local dimming algorithms have been proposed [3,4,5,6,7,8,9]. However, the brightness control of the backlight module and the light transmittance control of the LCD panel can have a significant impact on the display effect. Therefore, to ensure that LCD-LED dual-modulation displays can display high contrast and detailed image details, it is important to select an appropriate algorithm of local dimming.
The main challenge in the local dimming implementation is the halo effect. This effect is mainly due to light leakage from the LCD panel, especially around bright objects on a dark background. The main cause of this problem is that there is a significant difference between the number of LEDs in the backlight module and the number of pixels in the image resolution. As a result, a single LED light source must hit on a large area of the image rather than on a specific pixel. When the image within these areas is of high contrast, the halo effect is more likely to occur. In addition, checkerboard-like artifacts may occur between adjacent LED control areas. Common local dimming algorithms include the maximum method, the average method [14], the square root method [11], the inverse function of the mapping function [15], and the CDF threshold method [16]. However, these heuristic or threshold-based approaches still struggle to adequately address the problems of low contrast, high power consumption, and halo effects.
Recently, deep learning techniques have been widely applied in a variety of problems related to brightness adjustment due to their promising performance in image feature analysis. Jo et al. [17] proposed a backlight local dimming method using a Convolutional Neural Network (CNN), which aims to overcome the problem of insufficient generalization ability due to artificially set features in traditional BLD algorithms. Zhang et al. [3] proposed a deep CNN-based approach for local dimming of LCD dual-modulated displays to improve contrast and reduce power consumption. However, it is important to note that these two CNN-based techniques primarily target LDR images rather than HDR images [9].
Due to the limitations of their sensors and lenses, digital cameras can only capture a limited range of brightness in the real scene and often generate images with saturated brightness. Since the dynamic range of traditional displays is limited and cannot fully produce the full brightness range of the real world, it is necessary to perform a luminance mapping conversion to compress the wide dynamic range of reality to the narrow dynamic range of the display. This mapping is applied during the camera’s image-capturing process and often results in under- or overexposed areas in the image. This makes it difficult for HDR displays to fully display their high brightness peaks and deep dark details after receiving the LDR image input [18,19].
It is an effective method to solve this problem by converting LDR images into corresponding HDR images and integrating them into the pre-processing process of LCD systems through image processing techniques. Currently, most methods are based on synthesizing HDR images from multi-exposure LDR image sets [20]. However, these methods often face the challenge of changing scenes when collecting LDR and HDR images or rely on specialized and expensive optical equipment. This dilemma can be avoided by using dynamic range extension with only one single image to reconstruct HDR images. This technique is suitable for images captured with any standard camera and has the potential to fully restore the dynamic range of traditional LDR images. As a result, this method has received a lot of attention in recent years.
Recently, the approaches to HDR reconstruction using deep learning networks have gradually attracted attention [21]. The deep model can transform style, allowing it to simulate images under different environments and exposure conditions from a single LDR image. In addition, there is also a technique of using multiple LDR images for model training, which aims to enhance the generalization performance of deep learning models. As shown in Table 1, the literature can be categorized according to their learning approaches and the number of LDR images used. It is worth noting that methods based on deep learning and using a single image have become the mainstream research direction in recent years.

3. Proposed Scheme

LCD is a widely used display device today, and its core operating principle is based on the orientation control of liquid crystal molecules. An LCD is mainly composed of a liquid crystal panel, a backlight module, a polarizer, and other control circuits [7]. The direct-type backlight module consists of an LED matrix neatly arranged by multiple Mini-LEDs or Micro-LEDs. The light diffusion layer contains many layers of light shields and polarizers so that the light emitted from the LED can be evenly diffused to the diffusion layer.
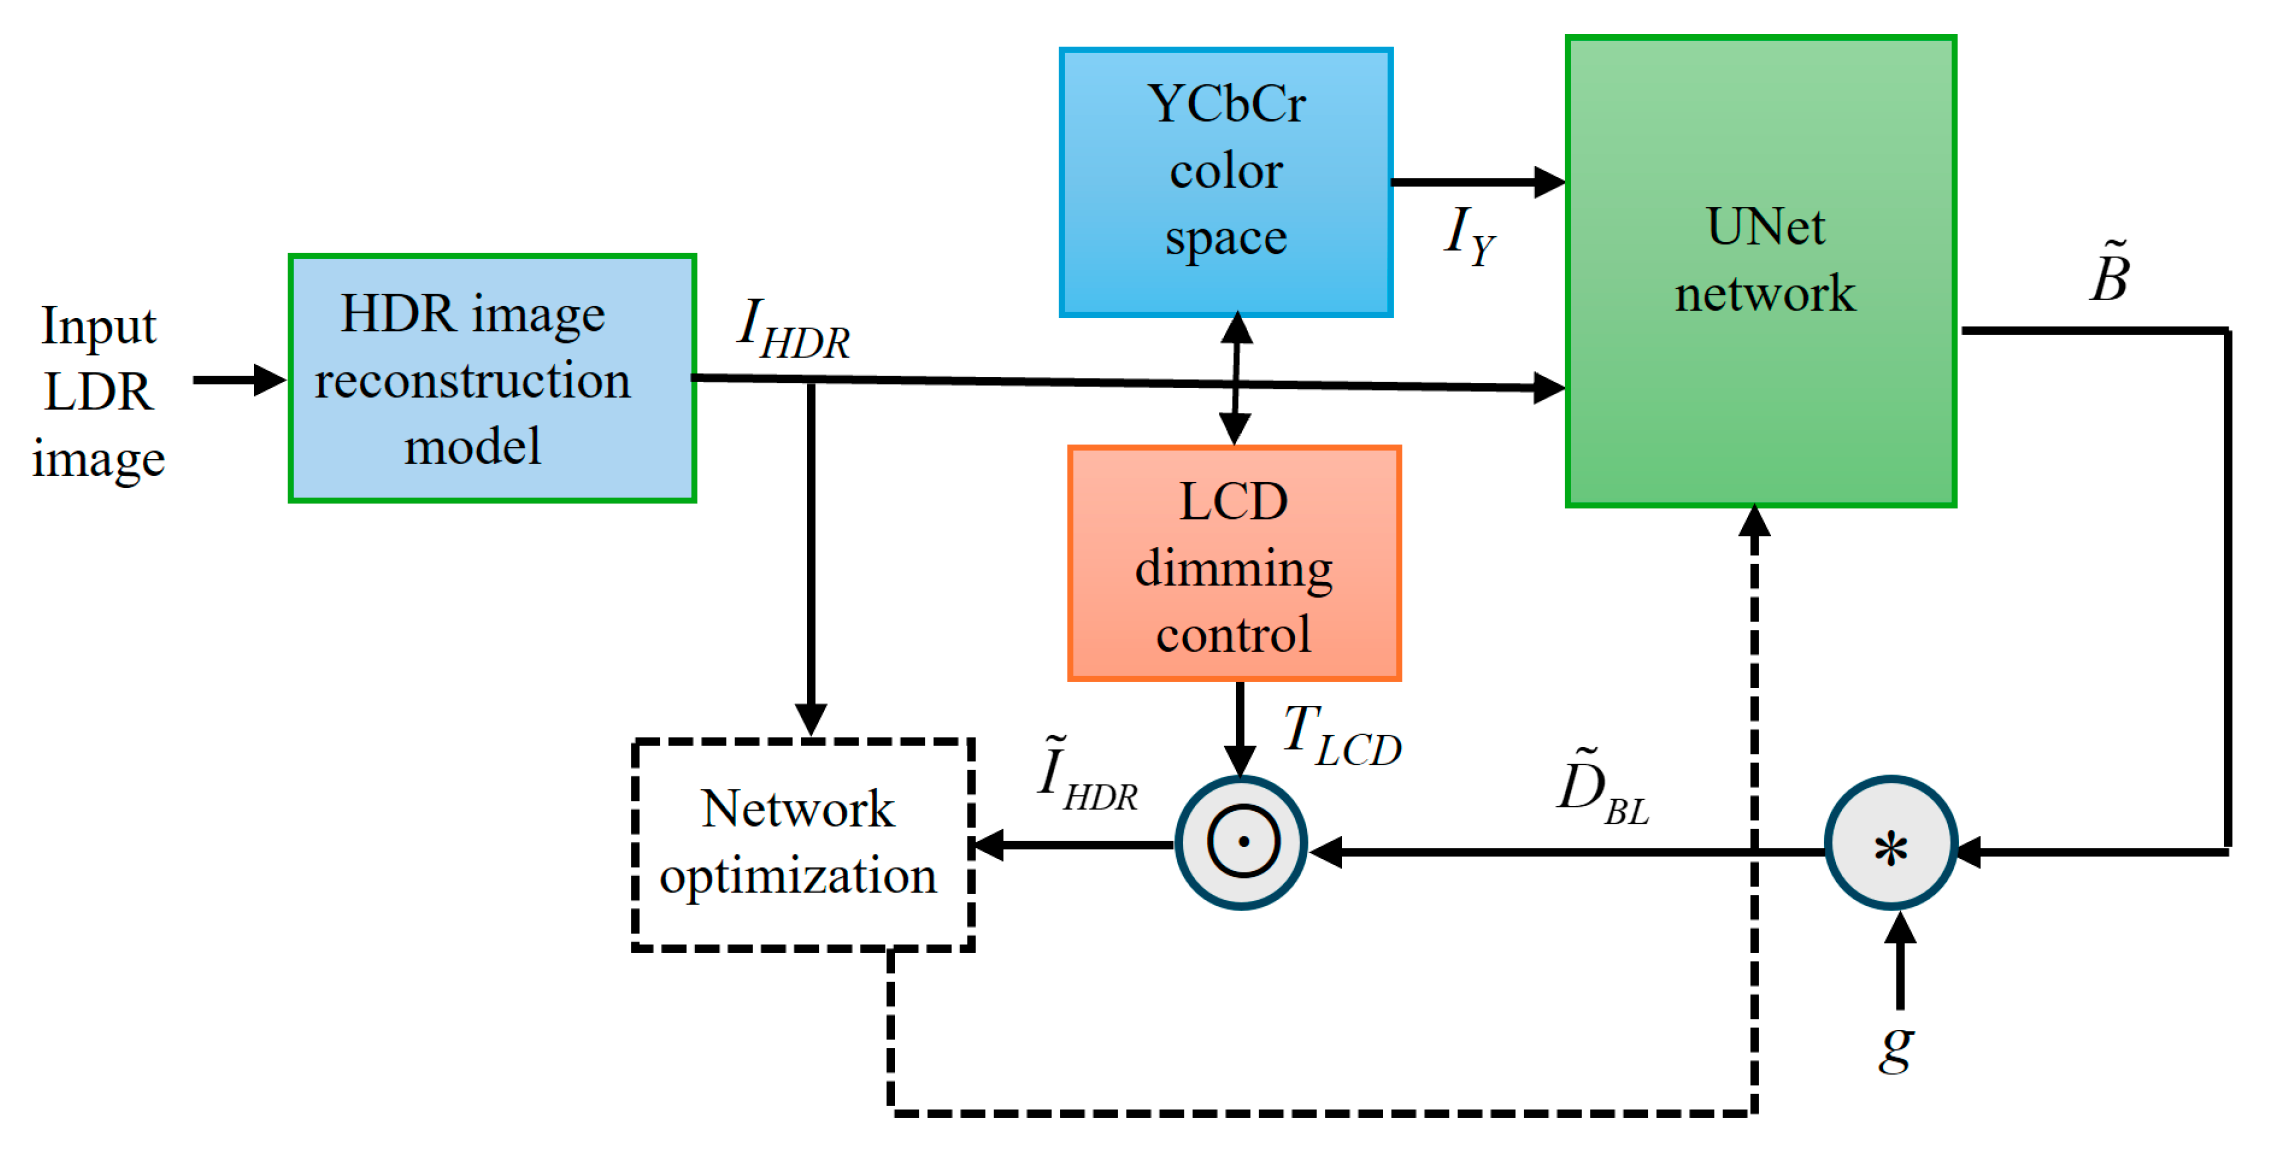
The architecture of this study is divided into two core parts: firstly, the input LDR image is converted into an HDR image through the HDR reconstruction model. Secondly, the local dimming model is applied to generate image instructions to control the backlight module and the LCD module. This is to ensure that the image output with high contrast can be displayed under the synergy between the backlight module and the LCD module. Figure 2 illustrates the overall system architecture used in this study.

3.1. HDR Image Reconstruction

At present, the mainstream of HDR image generation approaches is mainly based on short, medium, and long shooting of the same target with different exposure durations and then accurately aligning these image data to synthesize an HDR image that retains both bright parts and dark details. In this study, we chose to use a deep learning method to generate HDR images, which means that only one LDR image is needed, and the corresponding HDR image output can be obtained without multiple exposures.

3.1.1. Principle of Image Reconstruction

The HDR image reconstruction approach used in this study is based on the following observations:
(1)
There may be a lack of direct correlation between successive LDR image inputs, so HDR reconstruction must rely entirely on a single LDR image. Our technique focuses on recovering the lost information in the saturated part of the LDR image to achieve the reconstruction of the corresponding HDR image.
(2)
On most correctly exposed or saturated pixels, the use of traditional convolutional filters may introduce ambiguity during training, resulting in checkerboard or halo-like artifacts. To solve this problem, the feature masking method of Santos et al. [43] was adopted in this study to reduce the effect of features generated from saturated regions.
(3)
Inspired by image restoration techniques, this study considered using the perceived loss function proposed by Gatys et al. [44] and adjusting this function to meet the requirements of HDR image reconstruction. By minimizing this perceptual loss during the training phase, the deep learning model can synthesize visually realistic textures in saturated regions.
Based on the concept of gamma correction, the input LDR image L (color range defined at [0, 1]) can be converted to adjust the brightness of the pixels. The masking weight M obtained from the deep learning network (the numerical range is defined at [0, 1]) can be used to effectively suppress the influence of saturated pixels in the image, so the reconstructed HDR image can be represented as follows:
H ^ = M L γ + ( 1 M ) ( Y ^ 1 )
where L γ is the input LDR image (normalized to [0, 1]), γ is the gamma correction factor (γ > 1), ⊙ represents the pixel-wise product (Hadamard product), M is the feature mask generated by the deep learning network with values in [0, 1], and Y ^ is the predicted HDR image reconstructed by the deep learning network. The first term and the second term on the right side of Equation (1) define the contribution from the normal exposure area and the saturated area, respectively.

3.1.2. Deep Learning Model

Standard convolutional layers use the same filters to capture a set of features for the entire image, and this will achieve the same effect on all pixels. However, in our problems, this is invalid for those pixels in the saturated region of the input LDR image, and the ambiguity leads to visible artifacts. Therefore, the feature mask is proposed in this study to solve this problem. The mask can be applied to reduce the effect and the number of features generated from the invalid content of saturated areas.
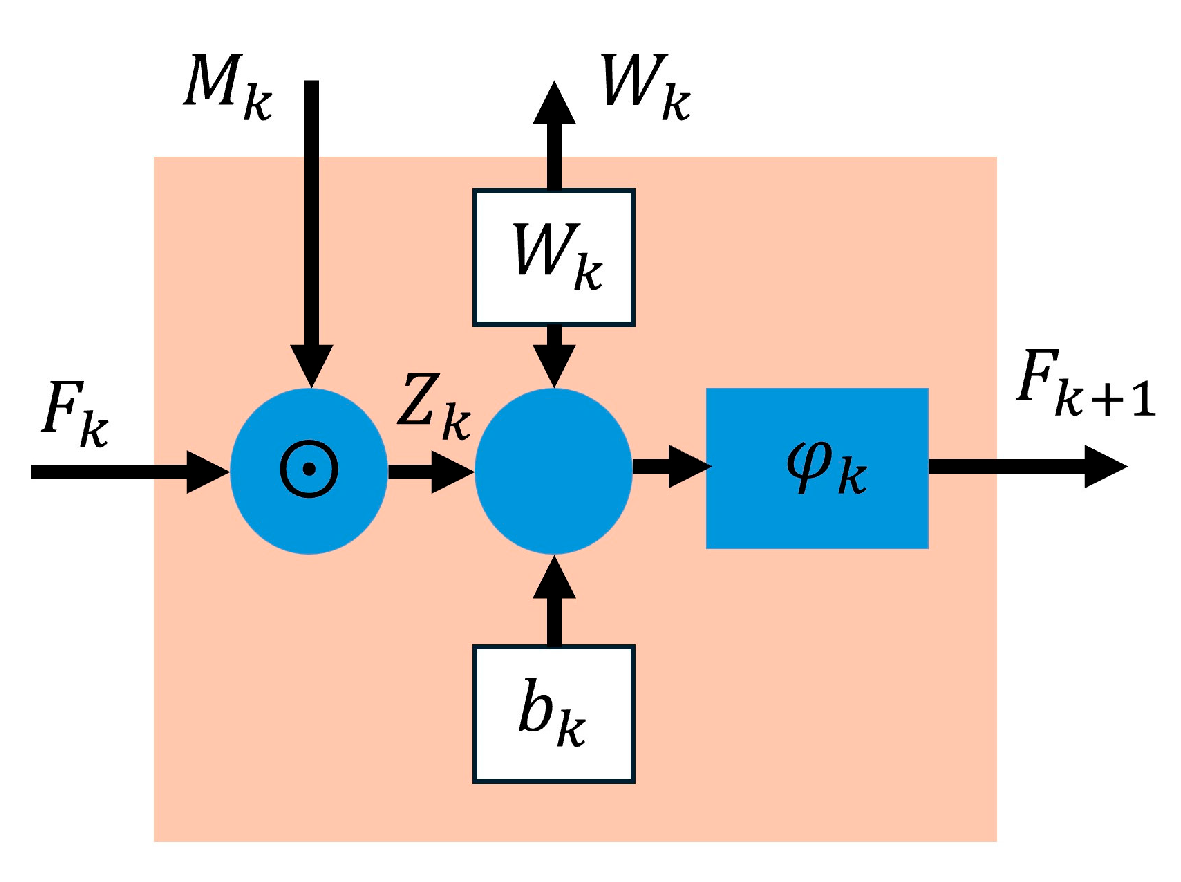
As shown in Figure 3, this can be implemented by a model architecture with K layers. For each layer of the feature map in the deep model, a weight mask is designed for multiplication given by the following:
Z k = F k M k
here, FkR Ck×Hk×Wk is the feature map of the k-th layer of the network model, and C, H, and W represent the number of channels, height, and width of the feature map, respectively. Mk ∈ [0, 1] C×Hk×Wk is the mask of the k-th layer with a value between [0, 1]. In M, the value “1” indicates that the feature is considered reasonably exposed, while the value “0” indicates that the feature is considered invalid. k represents the layer number of the model and k = 1 refers to the input layer. Hence, F1 is the input LDR image, and so on. M1 is the initial input mask, and the content is defined as follows:
M 1 ( S ) = 1 , S < t S 1 t 1 , S t
where S is the pixel brightness value of the input image, and t is the preset threshold value to define the range of brightness saturation. In addition, since the mask value is between [0, 1], the weak mask value in the saturated region is not completely discarded. In fact, by suppressing invalid pixels, these weak signals can pass through the network more efficiently.
According to the operation of the network, the next layer Fk+1 produced by the feature map generation module is as follows:
F k + 1 = ϕ k ( W k Z k + b k )
in which Wk and bk represent the network weights and biases of layer k, respectively. ϕk is the activation function, and * is the standard convolution operation, as shown in Figure 4. The feature map generation module will use the traditional VGG19 model to learn the conversion function parameters of the input LDR image to HDR image layer by layer.
The features are obtained by applying a series of the above convolutions and masking calculations so that the same filter can be used to compute the contribution of the effective pixels in the features. Since the mask used is during the [0, 1] range and only the contribution percentage is needed to compute, it is unrelated to the size of the filter. Furthermore, after each convolution calculation, the normalization is applied to filter weights and masks by the following:
M k + 1 = W k W k 1 + ε M k
where |Wk| is the tensor of R Ck×Hk×Wk. A constant ε is a very small value to avoid dividing by 0.
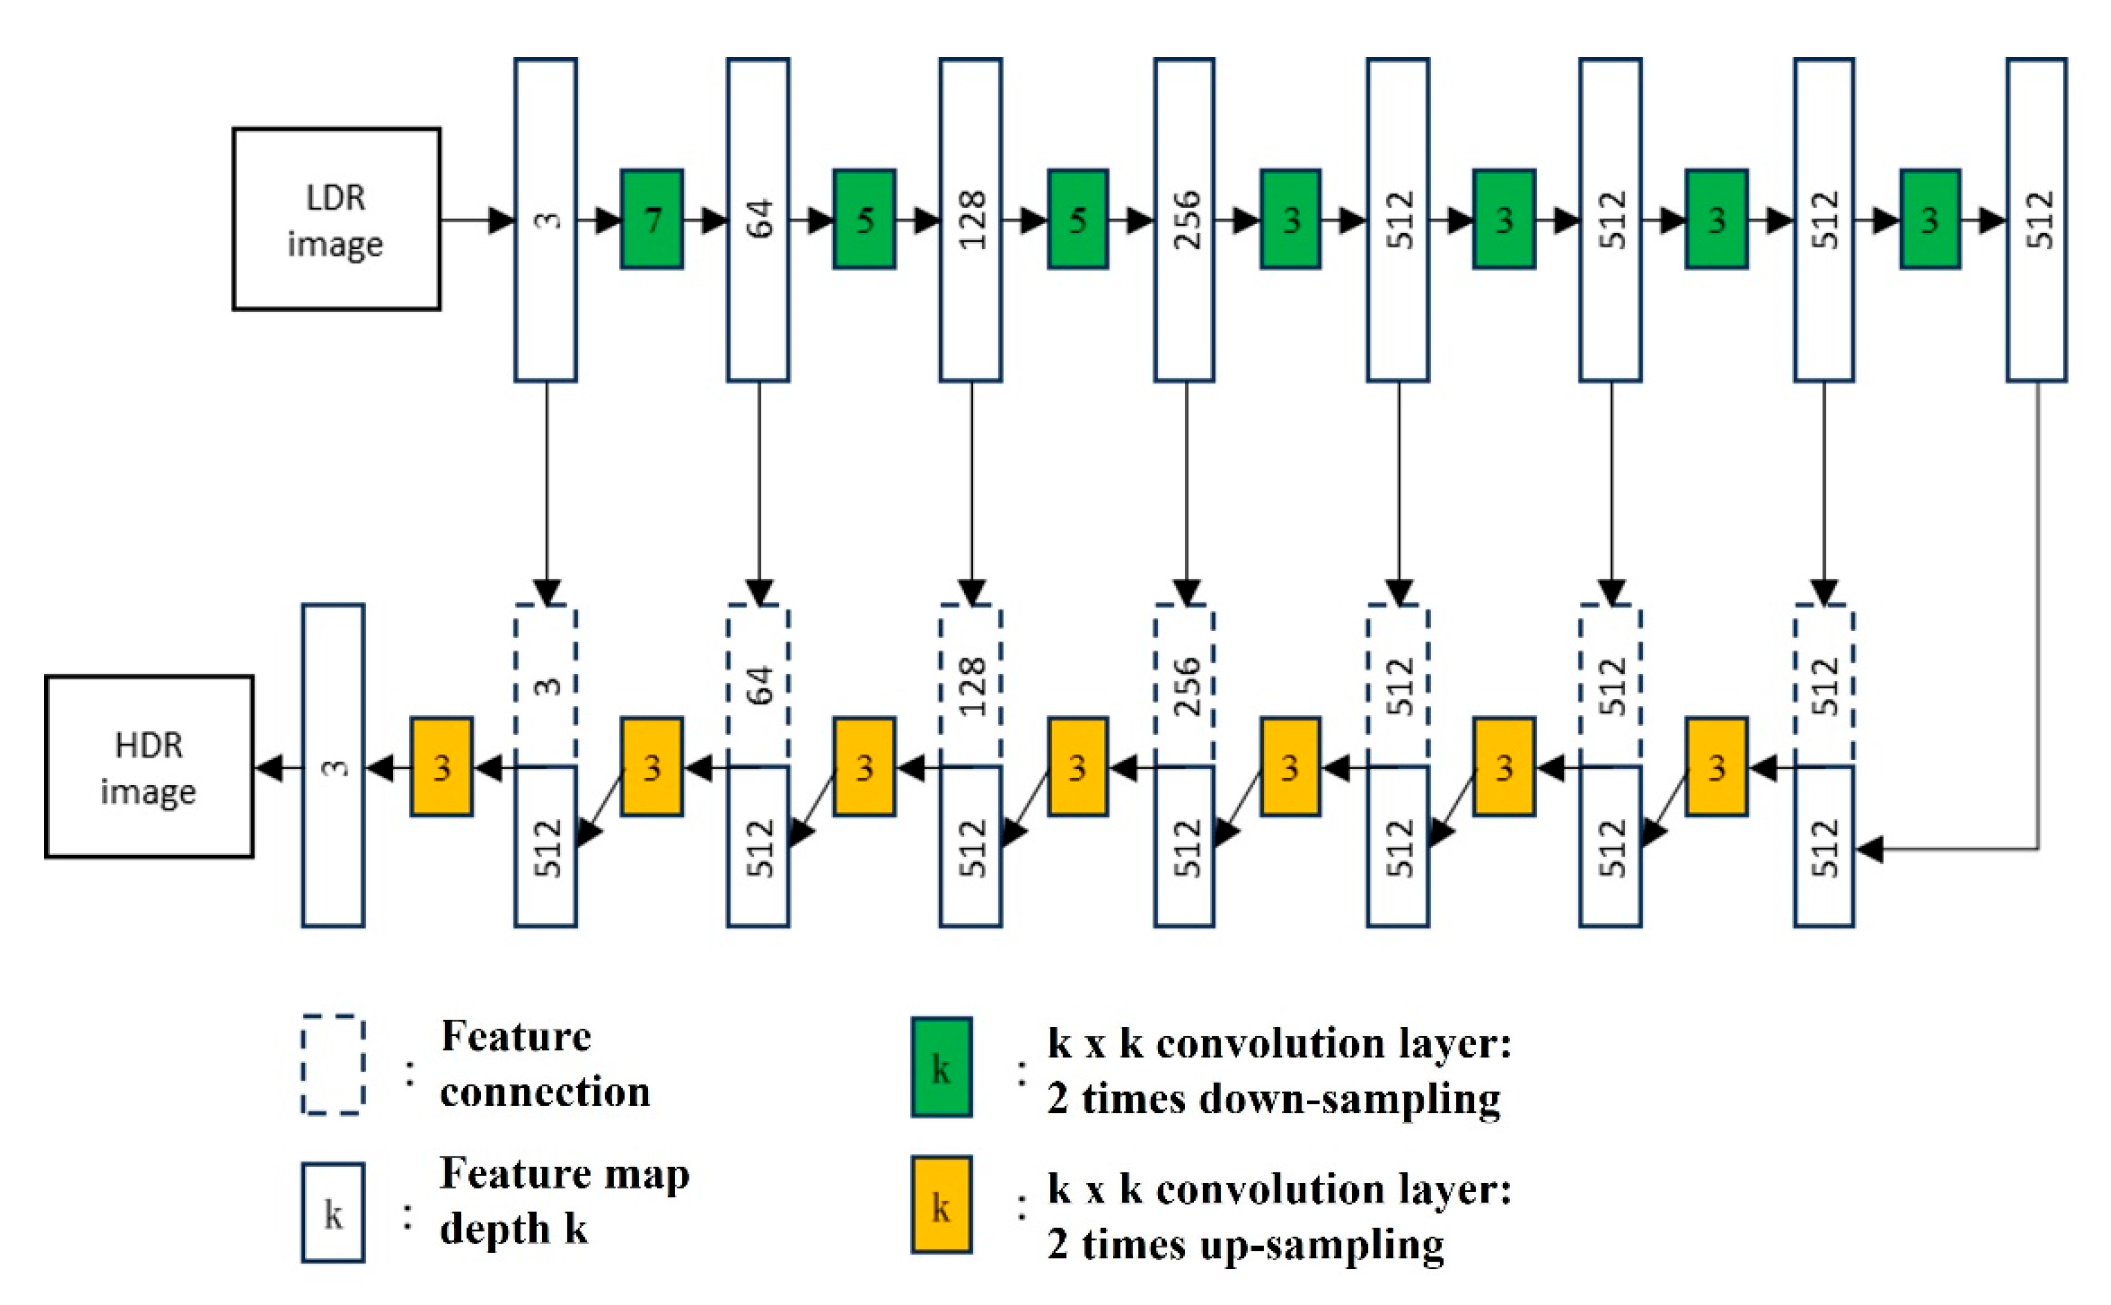
In this paper, a network structure based on the U-Net architecture is adopted, and the detailed structure can be shown in Figure 5. In all convolutional layers, feature masking is implemented, and feature up-sampling is performed by the nearest neighbor method in the decoder part. For the encoder layer, Leaky ReLU was chosen as the activation function. At the decoder layer, the widely used ReLU activation function is used, but the last layer uses a linear activation function. In addition, to enhance the learning capacity of the network, a skip connection is established between all encoder layers and the corresponding decoder layers.

3.1.3. Loss Function

The selection of loss functions is crucial in every deep learning system. This study defines the overall loss function by using a combination of HDR Reconstruction Loss LR and Perceptual Loss LP by the following:
L t a t o l = α 1 L R + α 2 L P
in which α 1 and α 2 represent the weights of these two types of losses, respectively.
HDR reconstruction loss is defined as the L1 distance of pixels between the saturated region in the output image and the corresponding area of the Ground Truth. Because HDR images can contain larger values, the loss is defined in the logarithmic field by the following:
L R = ( 1 M ) ( log ( Y ^ + 1 ) log ( H + 1 ) ) 1
Multiplying here by (1 − M) means that the loss is calculated in the saturated region.
Based on the approach proposed by Wang and Cheolkon [2], Perceptual Loss is defined as the combination of deep network (VGG19 is used in this study) loss LVGG and style loss LS given by the following:
L P = α 3 L V G G + α 4 L S
where α 3 and α 4 represent the weightings of these two types of losses, respectively.
(a)
Loss function LVGG: This is used to evaluate the degree of matching between the features captured from the reconstructed image and the real image, respectively. This induces the model to generate a texture that is like the real image at the perceptual level. The loss term is defined as follows:
L V G G = k F k ( R ( H ˜ ) ) F k ( R ( H ) ) 1
where Fk represents the k-th layer feature map of the VGG 19 network and R( ) is a numeric range compression function that compresses the value of each variable to between [0, 1]. Moreover, the image H ˜ is obtained by combining the content of the well-exposed areas in the real image and the saturated areas in the network output image Y ^ represented by the following:
H ˜ = M H + ( 1 - M ) Y ^
(b)
Style loss LS: For the color style and texture of the whole image, the Gram matrix is used to calculate the features [45], which is defined as follows:
L s = k G k ( R ( H ˜ ) ) G k ( R ( H ) ) 1
in which Gk is a Gram matrix representing the features of k-th layer of the VGG 19 network, defined by the following:
G k ( X ) = 1 N k F k ( X ) T F k ( X )
where Nk represents the normalization constant of the feature map Fk (CkHkWk). In addition, the feature map Fk is treated as an array of (HkWk) × Ck, so the size of Gk is Ck × Ck.

3.1.4. Training Dataset

Supervised learning is used in this paper for training the deep model, and two image datasets from NTIRE 2021 [46] and LDR-HDR-pair Dataset [47] with LDR and HDR image pairs are adopted in the experiments. NTIRE 2021 is an image dataset for applications of HDR image reconstruction from one single LDR image that consists of approximately 1500 training image pairs, 60 validation image pairs, and 201 test image pairs. Exemplary images are shown in Figure 6.
Each set of images in the image dataset comprises three types of LDR images (i.e., short exposure, medium exposure, and long exposure) as well as true HDR images. The content of these images includes natural and challenging HDR scenes, such as moving light sources, brightness changing over time, high-contrast skin tones, specular highlights, and bright, saturated colors. The LDR-HDR-pair dataset provides 176 HDR images, as well as three LDR counterparts for short, medium, and long exposures. The HDR images with different exposures are shown in Figure 7.
For model training, we adopted the Adam optimizer with an initial learning rate of 1 × 10⁻⁴ and applied a learning rate decay of 0.5 every 20 epochs. The batch size was set to 16, and training was performed for 200 epochs. Data augmentation techniques such as random cropping, horizontal flipping, and brightness jittering were applied to increase robustness. The perceptual and style loss weights (α1–α4) and luminance regularization parameter (β) were empirically tuned. These parameter settings are provided in Table 2 to ensure reproducibility of the proposed approach.

3.2. Local Dimming

In the traditional techniques of global dimming, the LEDs of the backlight module are constantly bright, and the liquid crystal layer is relied on to regulate the transmission of LED light. However, due to the physical properties of the liquid crystal layer, it cannot completely block all LED light, resulting in a dark state that is not deep enough. In this study, the LED backlight array and its light source are simulated by using computer software, and the local dimming image is generated by using deep learning techniques combined with a U-net network. In addition, the proposed method can also successfully solve the common halo artifact problem in local dimming.

3.2.1. Principle of Local Dimming

The Deep Backlight Local Dimming (DBLD) method proposed in this paper uses a deep learning model to directly predict the corresponding backlight LED output value of the input HDR image. This is used to achieve the goal of displaying HDR images with local dimming. However, under supervised deep learning, there needs to be corresponding data between the input and output for training. Obviously, this is not possible when there is a lack of directly available hardware (LCD) to generate input images (for backlight modules and LCD panels) and corresponding output images (for visual viewing). Also, supervised learning cannot proceed for lack of available public training sets. To overcome this difficulty, according to the principle of light source diffusion of the backlight module, a software simulation matching the diffuser function is established. Based on the simulation results, the input image of the backlight module established could correctly present the diffusion of the light source, and the output image with HDR quality can be displayed under the operations of the liquid crystal panel.

3.2.2. Deep Learning Model

To coincide with the existing standard LCD structure, the operation architecture of backlight local dimming is to produce a matched backlight module and the input image of the LCD panel by using the original input image (the HDR image is reproduced by the previous stage of the system). The backlight module is used to control the luminous brightness of each LED element in the module, and the input image of the LCD panel is to control the light passing ratio (light transmittance) of each liquid crystal element in the LCD panel. The goal is to make the displayed image consistent with the HDR image input.
Motivated by the method proposed by Duan et al. [48], the selected deep learning model adopts the UNet as the backbone network. First, the input HDR RGB image IHDR and the “ideal” backlight module image IY are combined into a input data with the size of H × W × 4. The “ideal” backlight module image is defined as a 1-to-1 correspondence with the input image pixels. Therefore, each pixel has its own usable LED element as a light source. Through the encoding and decoding of UNet, the output images of the backlight module can support the display of HDR images. Furthermore, after passing through the diffuser module defined by the dot spread function, the image of the backlight module can be simulated to match the backlight output image generated by the hardware. Moreover, after the training and optimization using the HDR image dataset input, the display fidelity of HDR images is improved. Since the deep learning model is optimized directly based on the input data, the personal experience and heuristics of traditional BLD methods are avoided. At the same time, the module that simulates the operations of the diffusion panel can generate the required control image of local dimming, and the problem of lack of training dataset can be tackled.
As shown in Figure 8, the proposed DBLD system consists of three parts: UNet architecture, BLD image reconstruction, and HDR image reconstruction, which can perform loss function calculation and network optimization for the input HDR image and the reconstructed HDR image.
(1)
UNet network
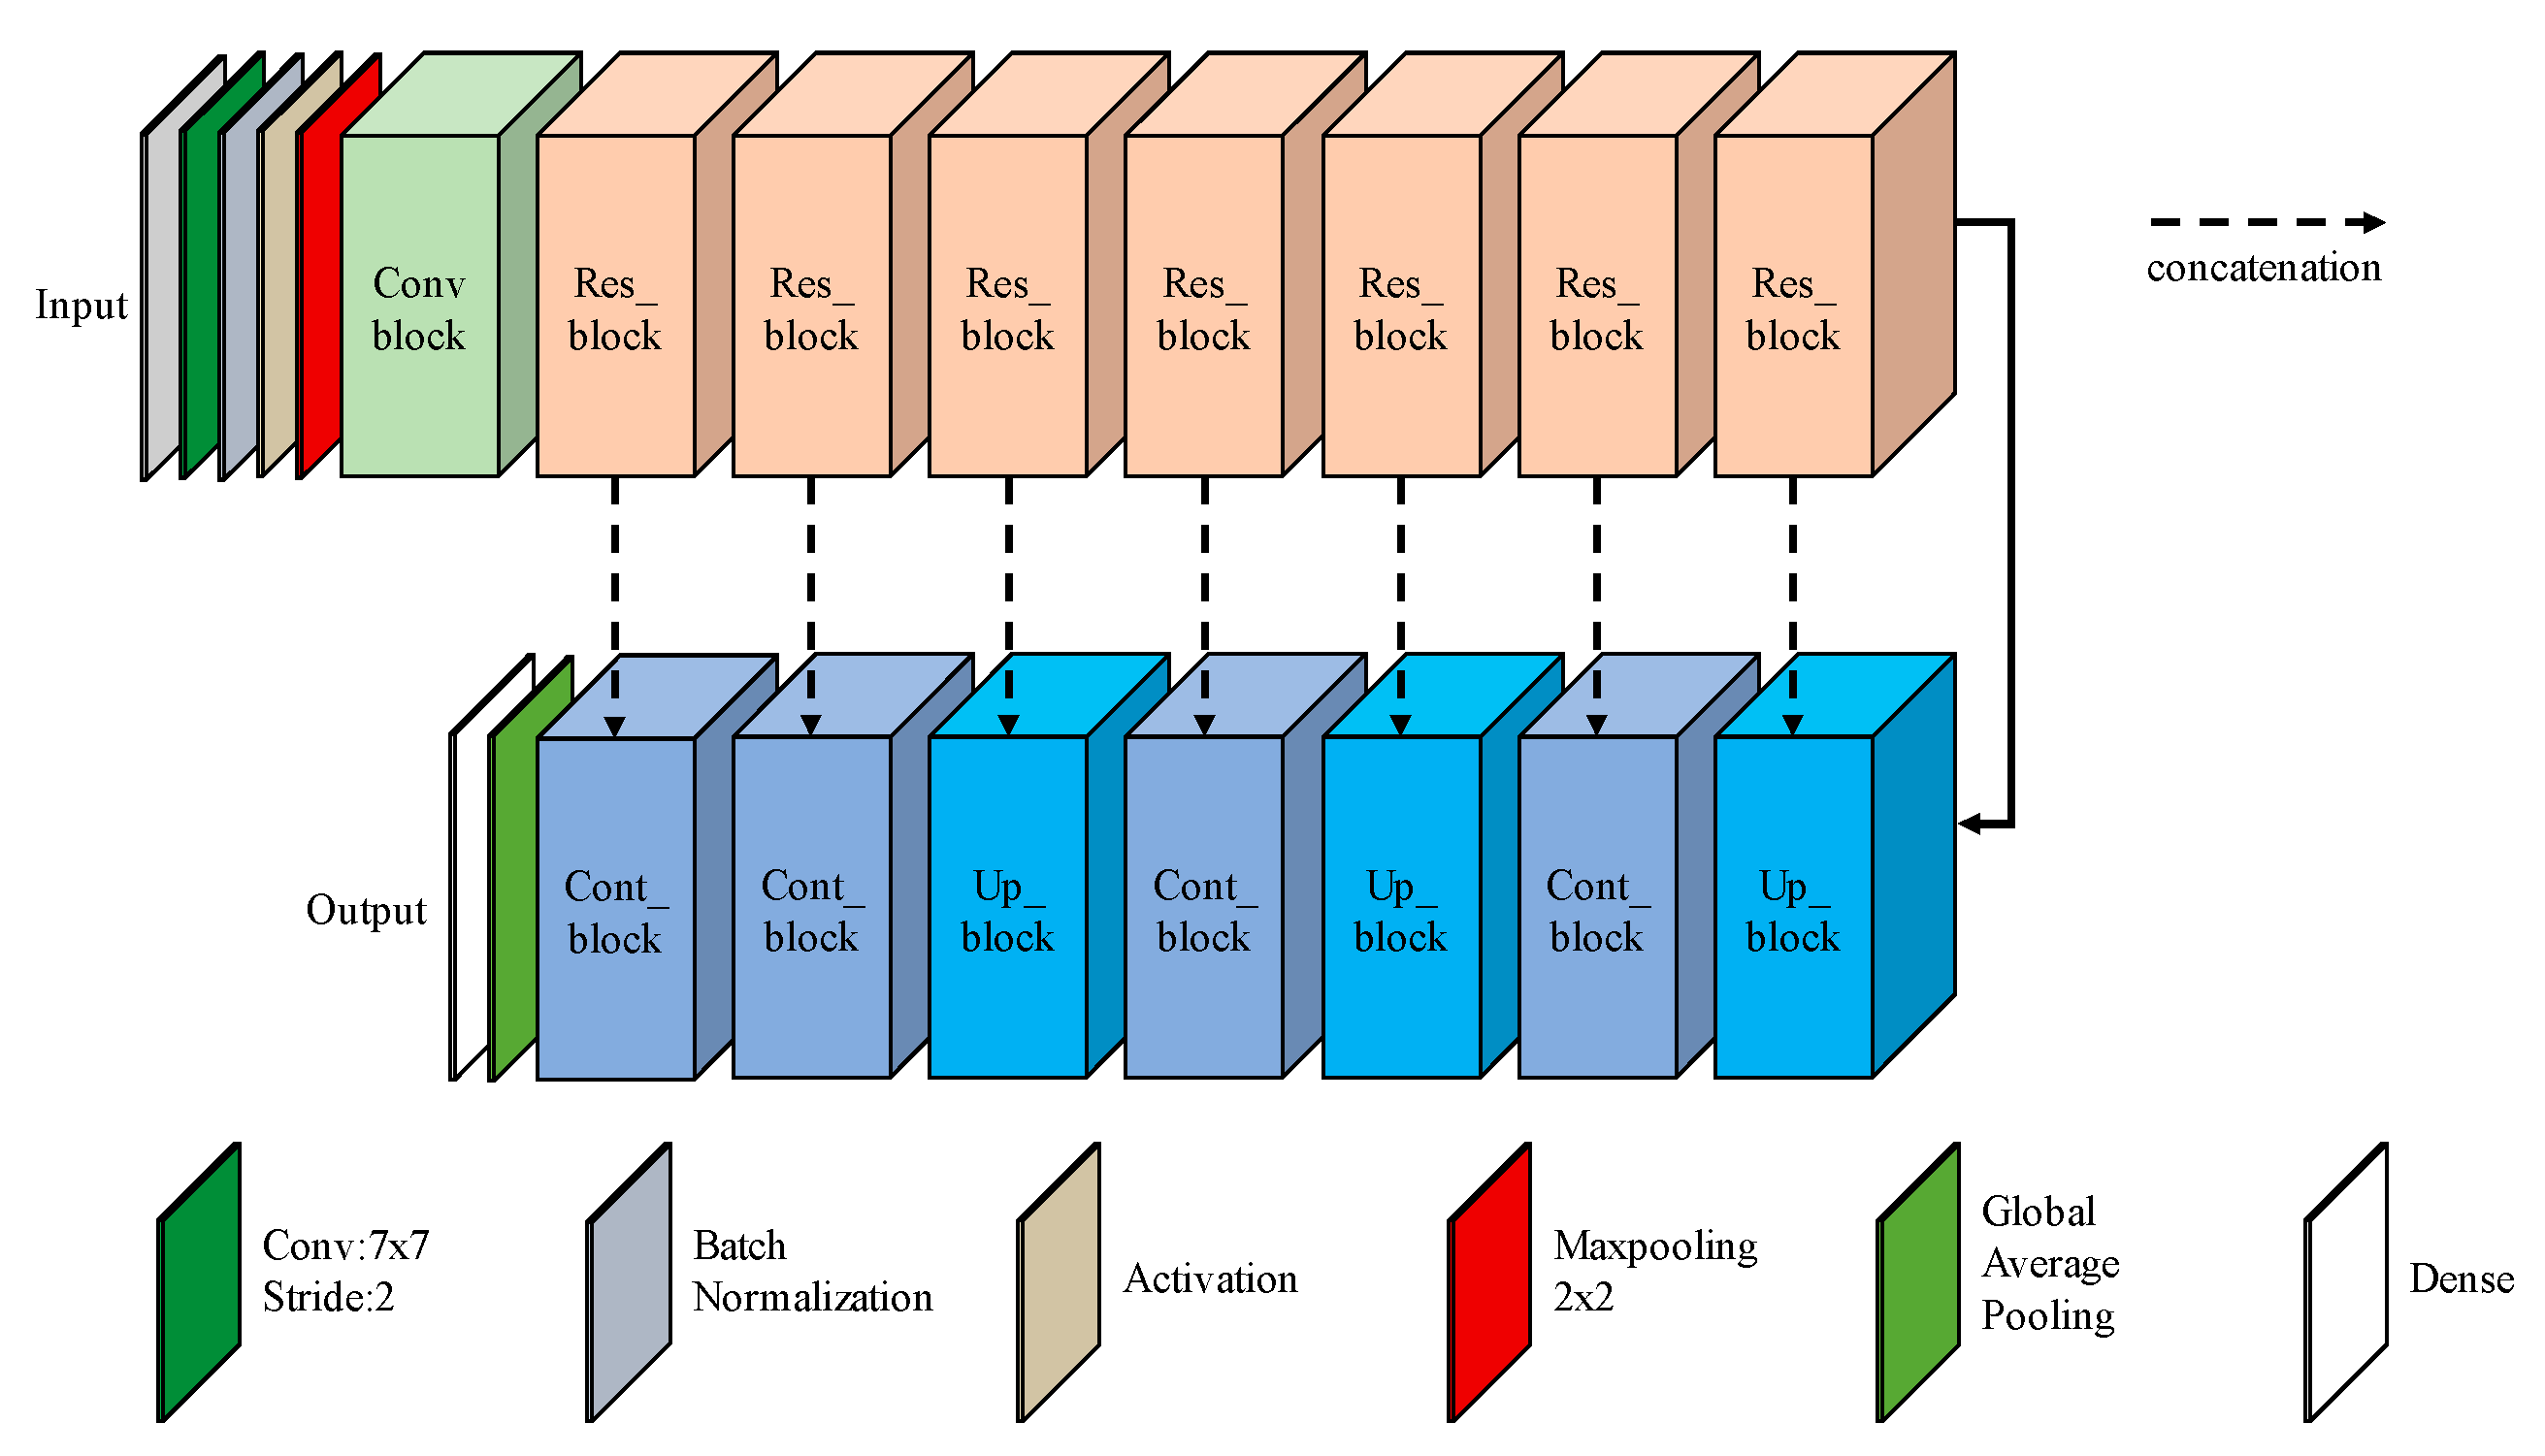
As shown in Figure 9, the purpose of UNet is to combine and optimize the BLD features of HDR images by minimizing the loss function. The UNet architecture consists of two main parts, an encoder and a decoder, both of which are made up of multiple convolutional layers. The encoder down-samples features stage by stage until a low-resolution threshold is reached, and then the decoder starts upsampling the features stage by stage. Under each resolution, features from the encoder are propagated directly to the decoder, which can effectively combine image information at multiple scales and accelerate the convergence of optimization. UNet can process image information at multiple scales; therefore, a large field of perception can be obtained. At the same time, due to the use of downsampling, most of the computation can be performed under lower resolution. Therefore, only lower computing power is in need of being compared to other architectures.
The encoder adopted in this study is a residual network with 18 convolutional layers [49]. The residual network consists of residual blocks in which the computational output of each block is added to its inputs, allowing for better gradient flow and improved training of deeper networks. Apart from the first layer with a convolutional kernel size of 7 × 7 and stride = 1 for residual-connection convolutions, all other convolutional layers use a convolutional kernel of 3 × 3. The decoder includes five upsampling layers that use bilinear upsampling followed by the process of three deconvolution kernels, normalization, and activation functions. At the same time, the features spanned from the encoder are matched and connected on each layer. ReLU activation is used for encoders and decoders, as well as normalization to help optimize convergence.
The network input is composed of three RGB channels and one brightness channel of the HDR image, and the color brightness I of all channels is in the range of [0, 1]. The network output is a full-resolution single-channel image of backlight prediction B ˜ ∈ [0, 1], which is the result of the sigmoid function after the final convolution operation. Since the training of the depth model only relies on the input HDR images, the HDR image pairs of the NTIRE 2021 and LDR-HDR-pair datasets can be directly used.
(2)
BLD image reconstruction
Based on the backlight value of the backlight image B ˜ , the simulated backlight intensity of the diffuser can be further estimated. The effect of diffusion panel g is defined using the Point Spread Function (PSF), and the BLD image can be written as follows:
D ˜ B L ( i , j ) = g B ˜ = x = W g / 2 W g / 2 y = H g / 2 H g / 2 g ( x , y ) B ˜ ( i + x , j + y )
where Wg and Hg are the width and height of the PSF filter, respectively. The final backlight prediction D ˜ B L needs to match the number of LEDs in the backlight module of the target LCD. The backlight image is evenly divided into many rectangular blocks according to the number and position of LEDs, and the pixel brightness in each block is replaced by an average value.
(3)
HDR image reconstruction
The purpose is to reconstruct the HDR image to be displayed from the backlight image and the LCD panel image. Theoretically, the display image I ˜ H D R produced by LCD can be defined as follows:
I ˜ H D R = T L C D D B L
in which TLCD is the light transmittance of the LCD panel driven by the grayscale of each pixel of each color channel on the LCD panel image.

3.2.3. Loss Function

The total loss function LLCD for network optimization consists of two parts: Lreg and Lmag. Lmag is the regression loss and Lmag is an additional brightness regularization term. LLCD can be written as follows:
L L C D = L r e g ( I H D R , I ˜ H D R ) + β L m a g ( B ˜ )
Here, β is a hyperparameter that adjusts the size of the regression loss, helping to balance the gradient contribution of the two partial losses to improve convergence. The luminance regularization term is defined as follows:
L m a g ( B ˜ ) = 1 B max ( i , j ) B ˜ ( i , j )
where Bmax represents the maximum output value of the backlight module. The luminance regularization term limits power consumption by penalizing large backlight values.

4. Experiments and Evaluation

4.1. HDR Image Reconstruction

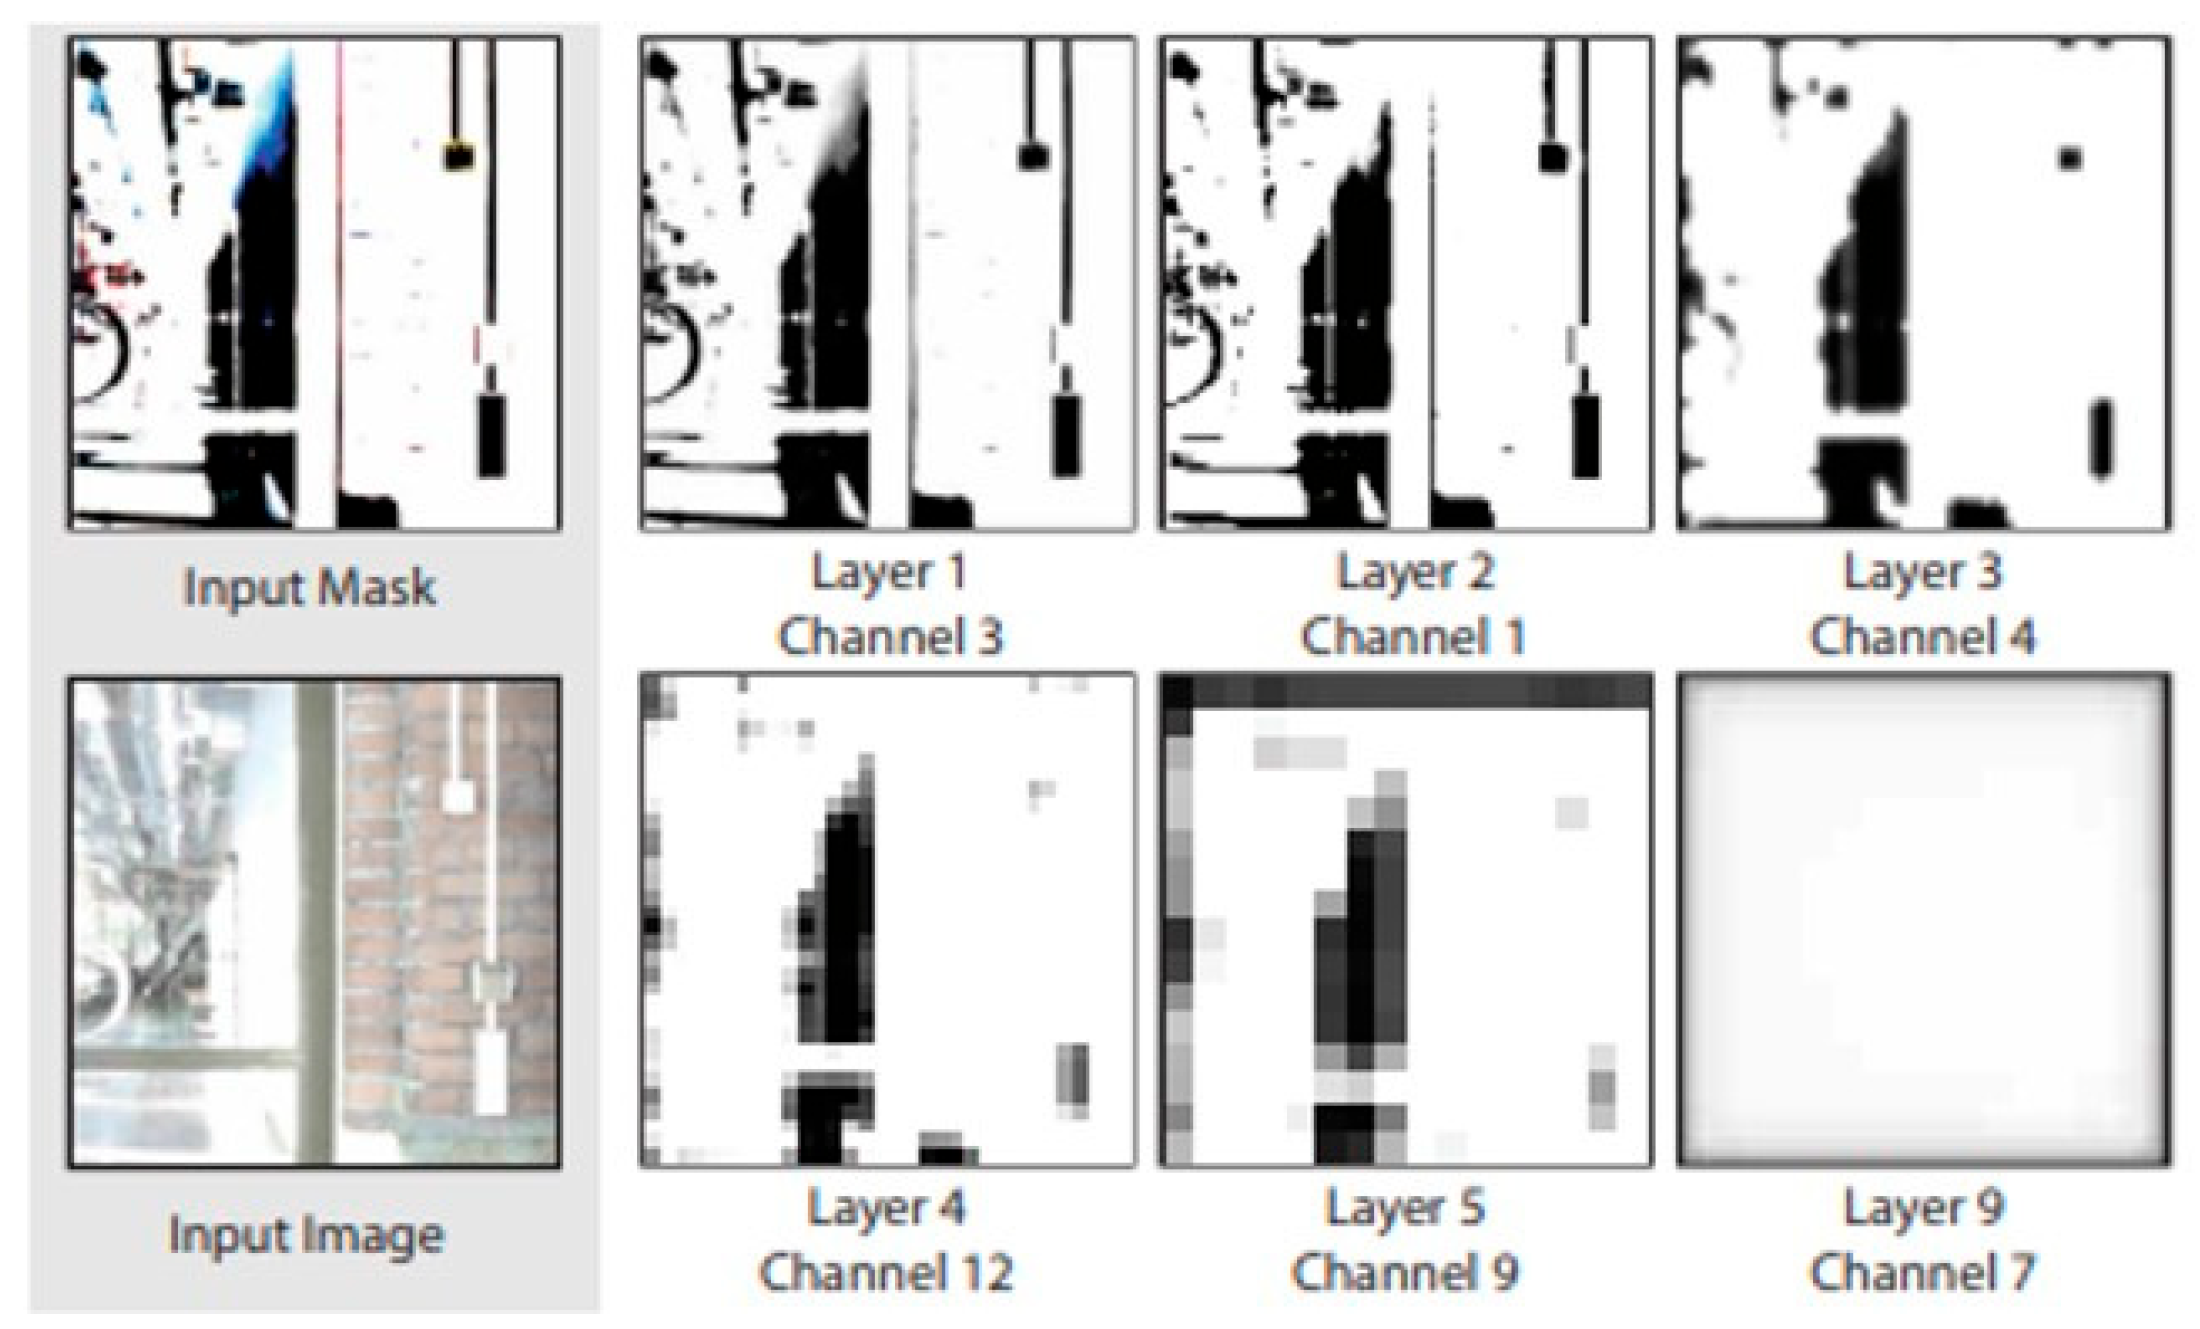
The traditional LDR image can only be represented by 8 bits for the components in the RGB color space, and the number of colors and image contrast are limited. In contrast, the HDR image generated by the model can be increased to 32 bits for the components in the RGB color space. Not only does it increase the number of color representations, but it also improves the contrast in the image. According to the image masking principle proposed in Section 3.1, the areas with too high brightness in the original LDR image can be masked to obtain better resolution representation in the other brightness areas. These layer-by-layer masks will work in the higher layers of the network. Figure 10 shows the display results of output images at different network layers after an input mask is applied to an input image.

4.1.1. Preserving Image Display Details with HDR Quality

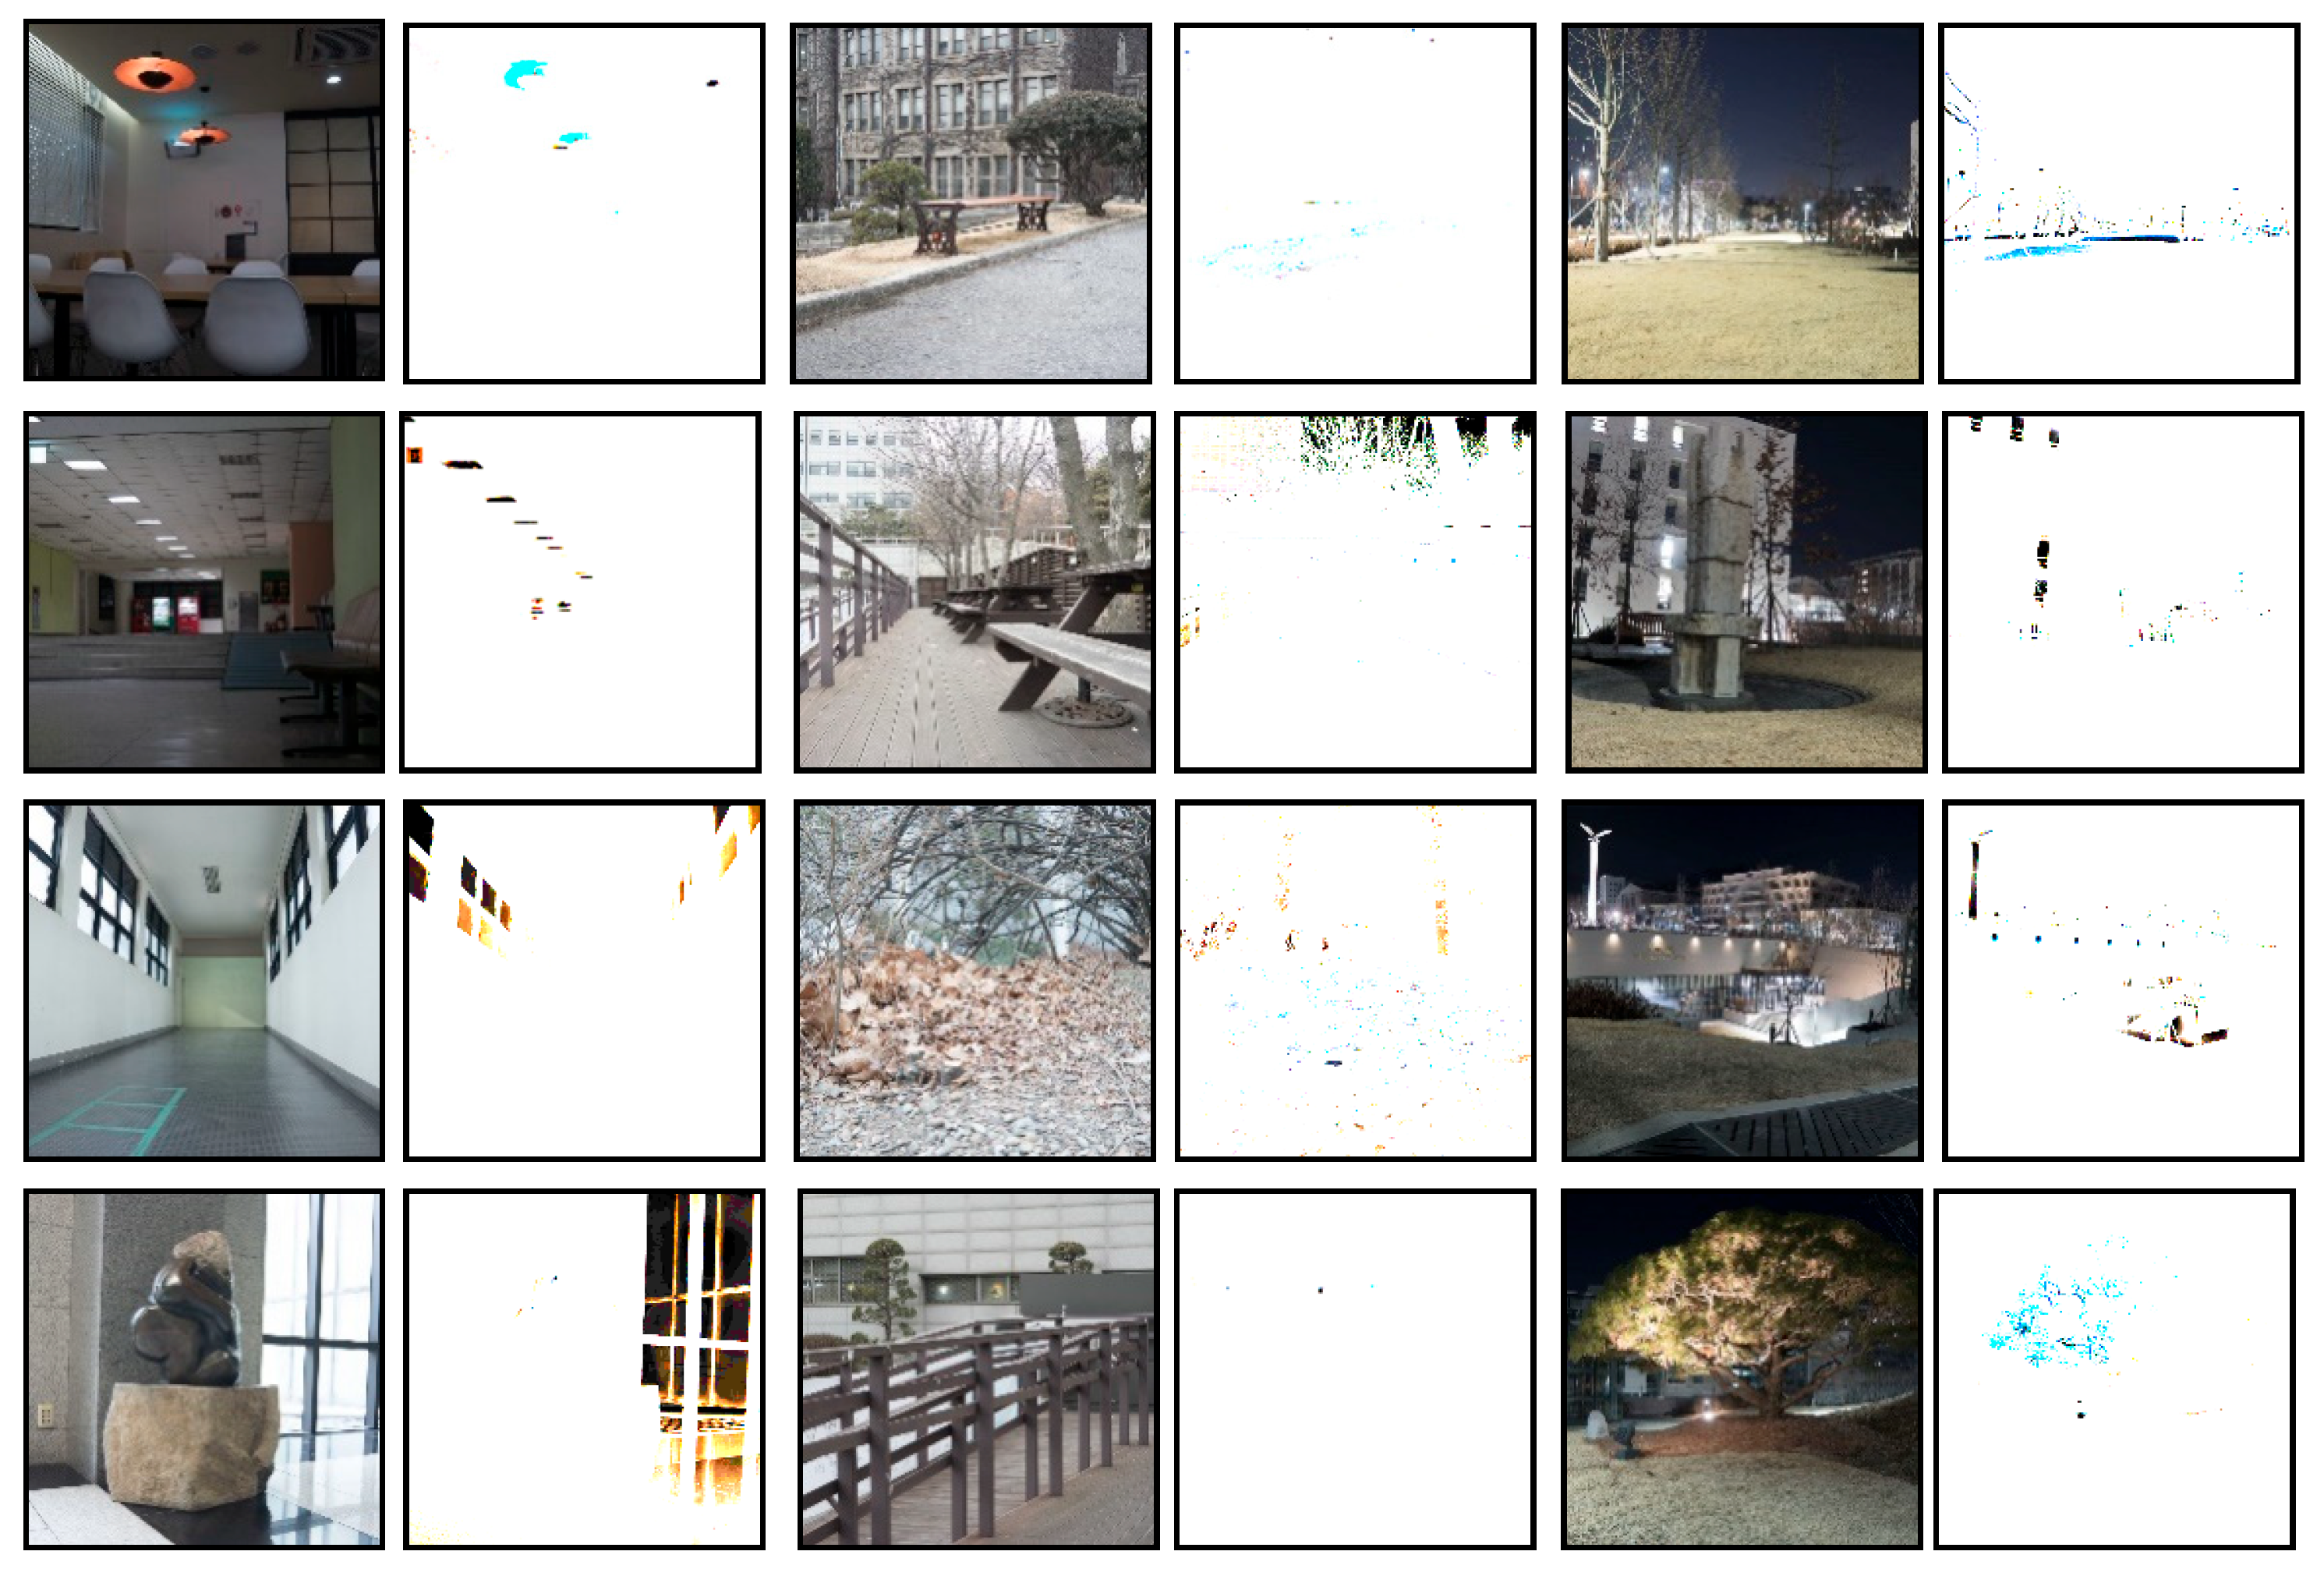
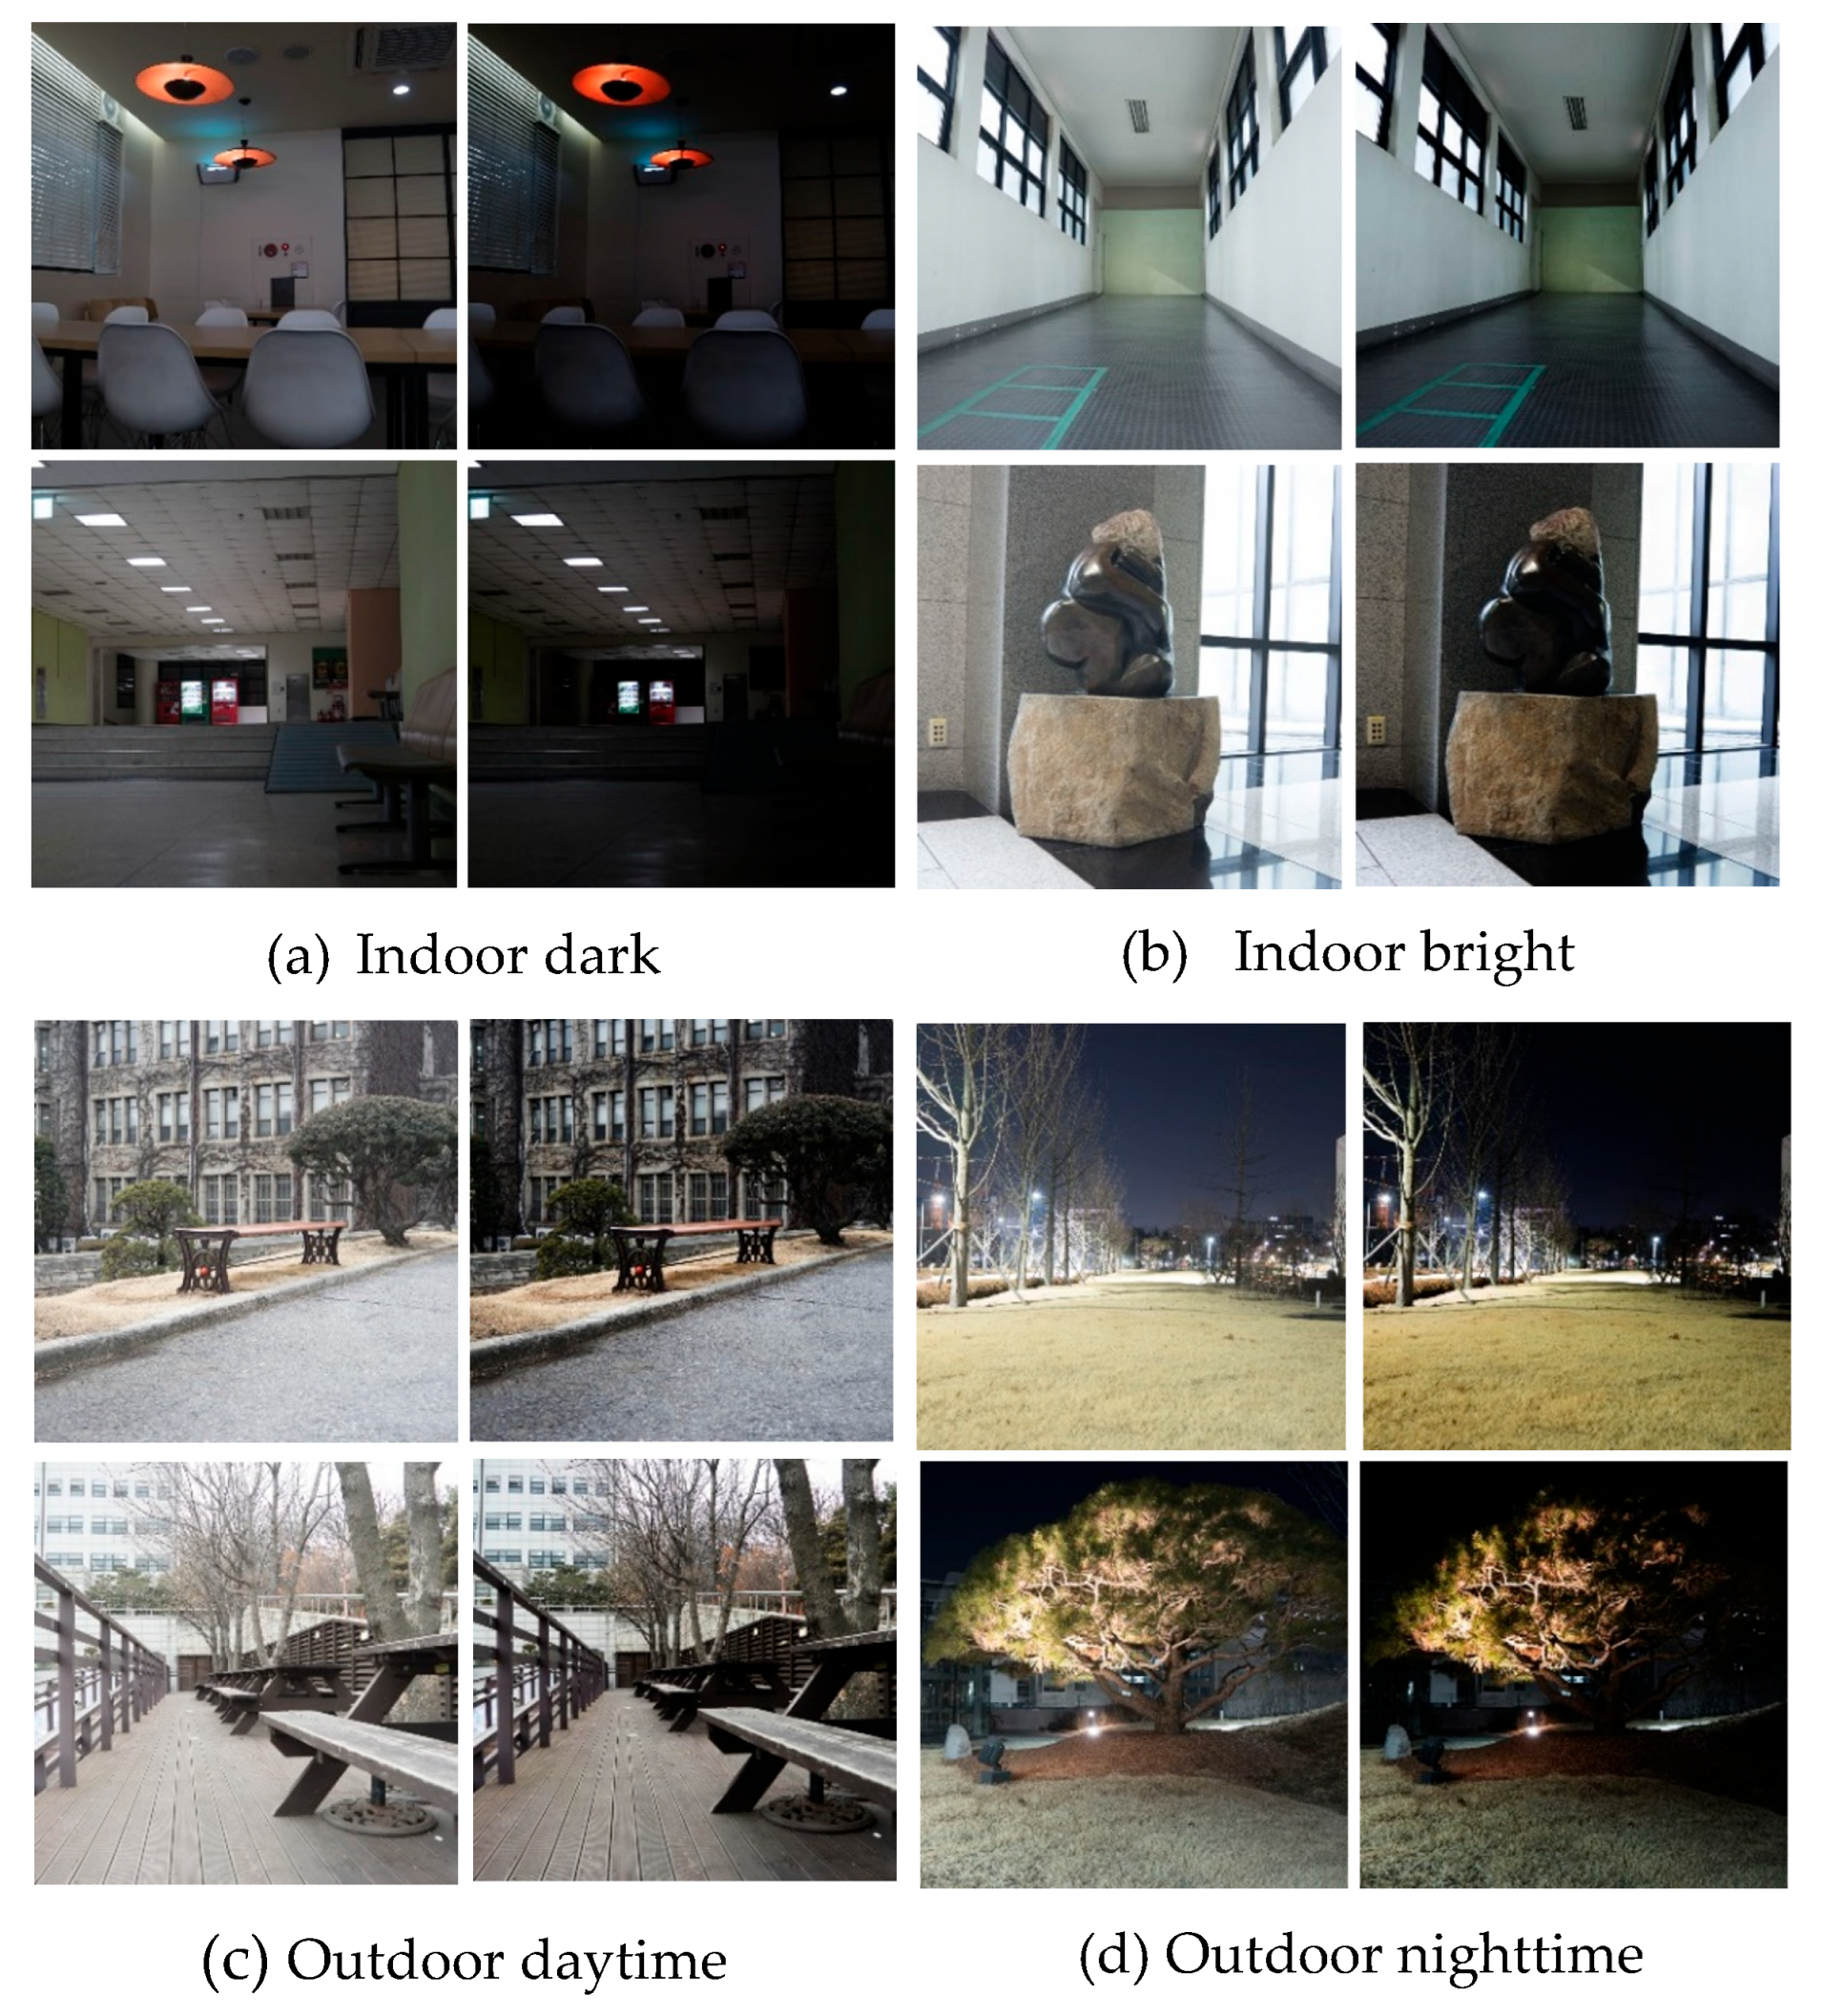
In this paper, LDR images are mainly divided into four categories: indoor dark, indoor bright, outdoor daytime, and outdoor night. After applying the masking operations to the brightness-saturated areas of the image (see Figure 11), the comparison between the HDR image and the LDR image is shown in Figure 12. As can be seen from Figure 12, the resulting HDR image can still clearly see the details in the brightly saturated area, and the image contrast is improved. This means that the model performs well for preserving details in the brightness-saturated block image.

4.1.2. The Credibility of the Reconstructed HDR Image

Here, HDR images generated from multiple exposures are considered as the standard answer for comparison with HDR images generated by the model. The difference between input and output is determined using the Mean-Square Error (MSE) method defined by the following:
MSE = 1 n i = 1 n ( Y i Y i ^ ) 2
where Y i and Y i ^ represent the ground truth and the predicted image. Table 3 shows that the mean square error is 0.0356.
On the other hand, HDRVDP-2 (High Dynamic Range Visual Difference Predictor 2), proposed by Mantiuk et al. [31], is a model used to evaluate the quality of HDR images or videos. This model is mainly used to predict the visual differences that a human observer may perceive when viewing HDR images and can be used to evaluate the effectiveness of different HDR image processing algorithms. HDRVDP-2 considers the perceptual characteristics of the human eye for brightness and color and simulates the response of the human visual system to provide an objective assessment of HDR image quality. The model can predict the magnitude and direction of visual differences and provide a quantitative score to represent image quality. It is defined as follows:
Q = 1 F · O f = 1 F o = 1 O w f log ( 1 I i = 1 I D 2 f , o ( i ) + ε )
in which D f , o is defined by the following:
D f , o = B T [ f , o ] B R [ f , o ] p N n C S F 2 p [ f , o ] + N m a s k 2 [ f , o ]
where Q is the HDR-VDP normalized value, multiplied by 100% to achieve a rating of 63.18. The above results show that the model is a highly reliable depth model used to generate HDR images.
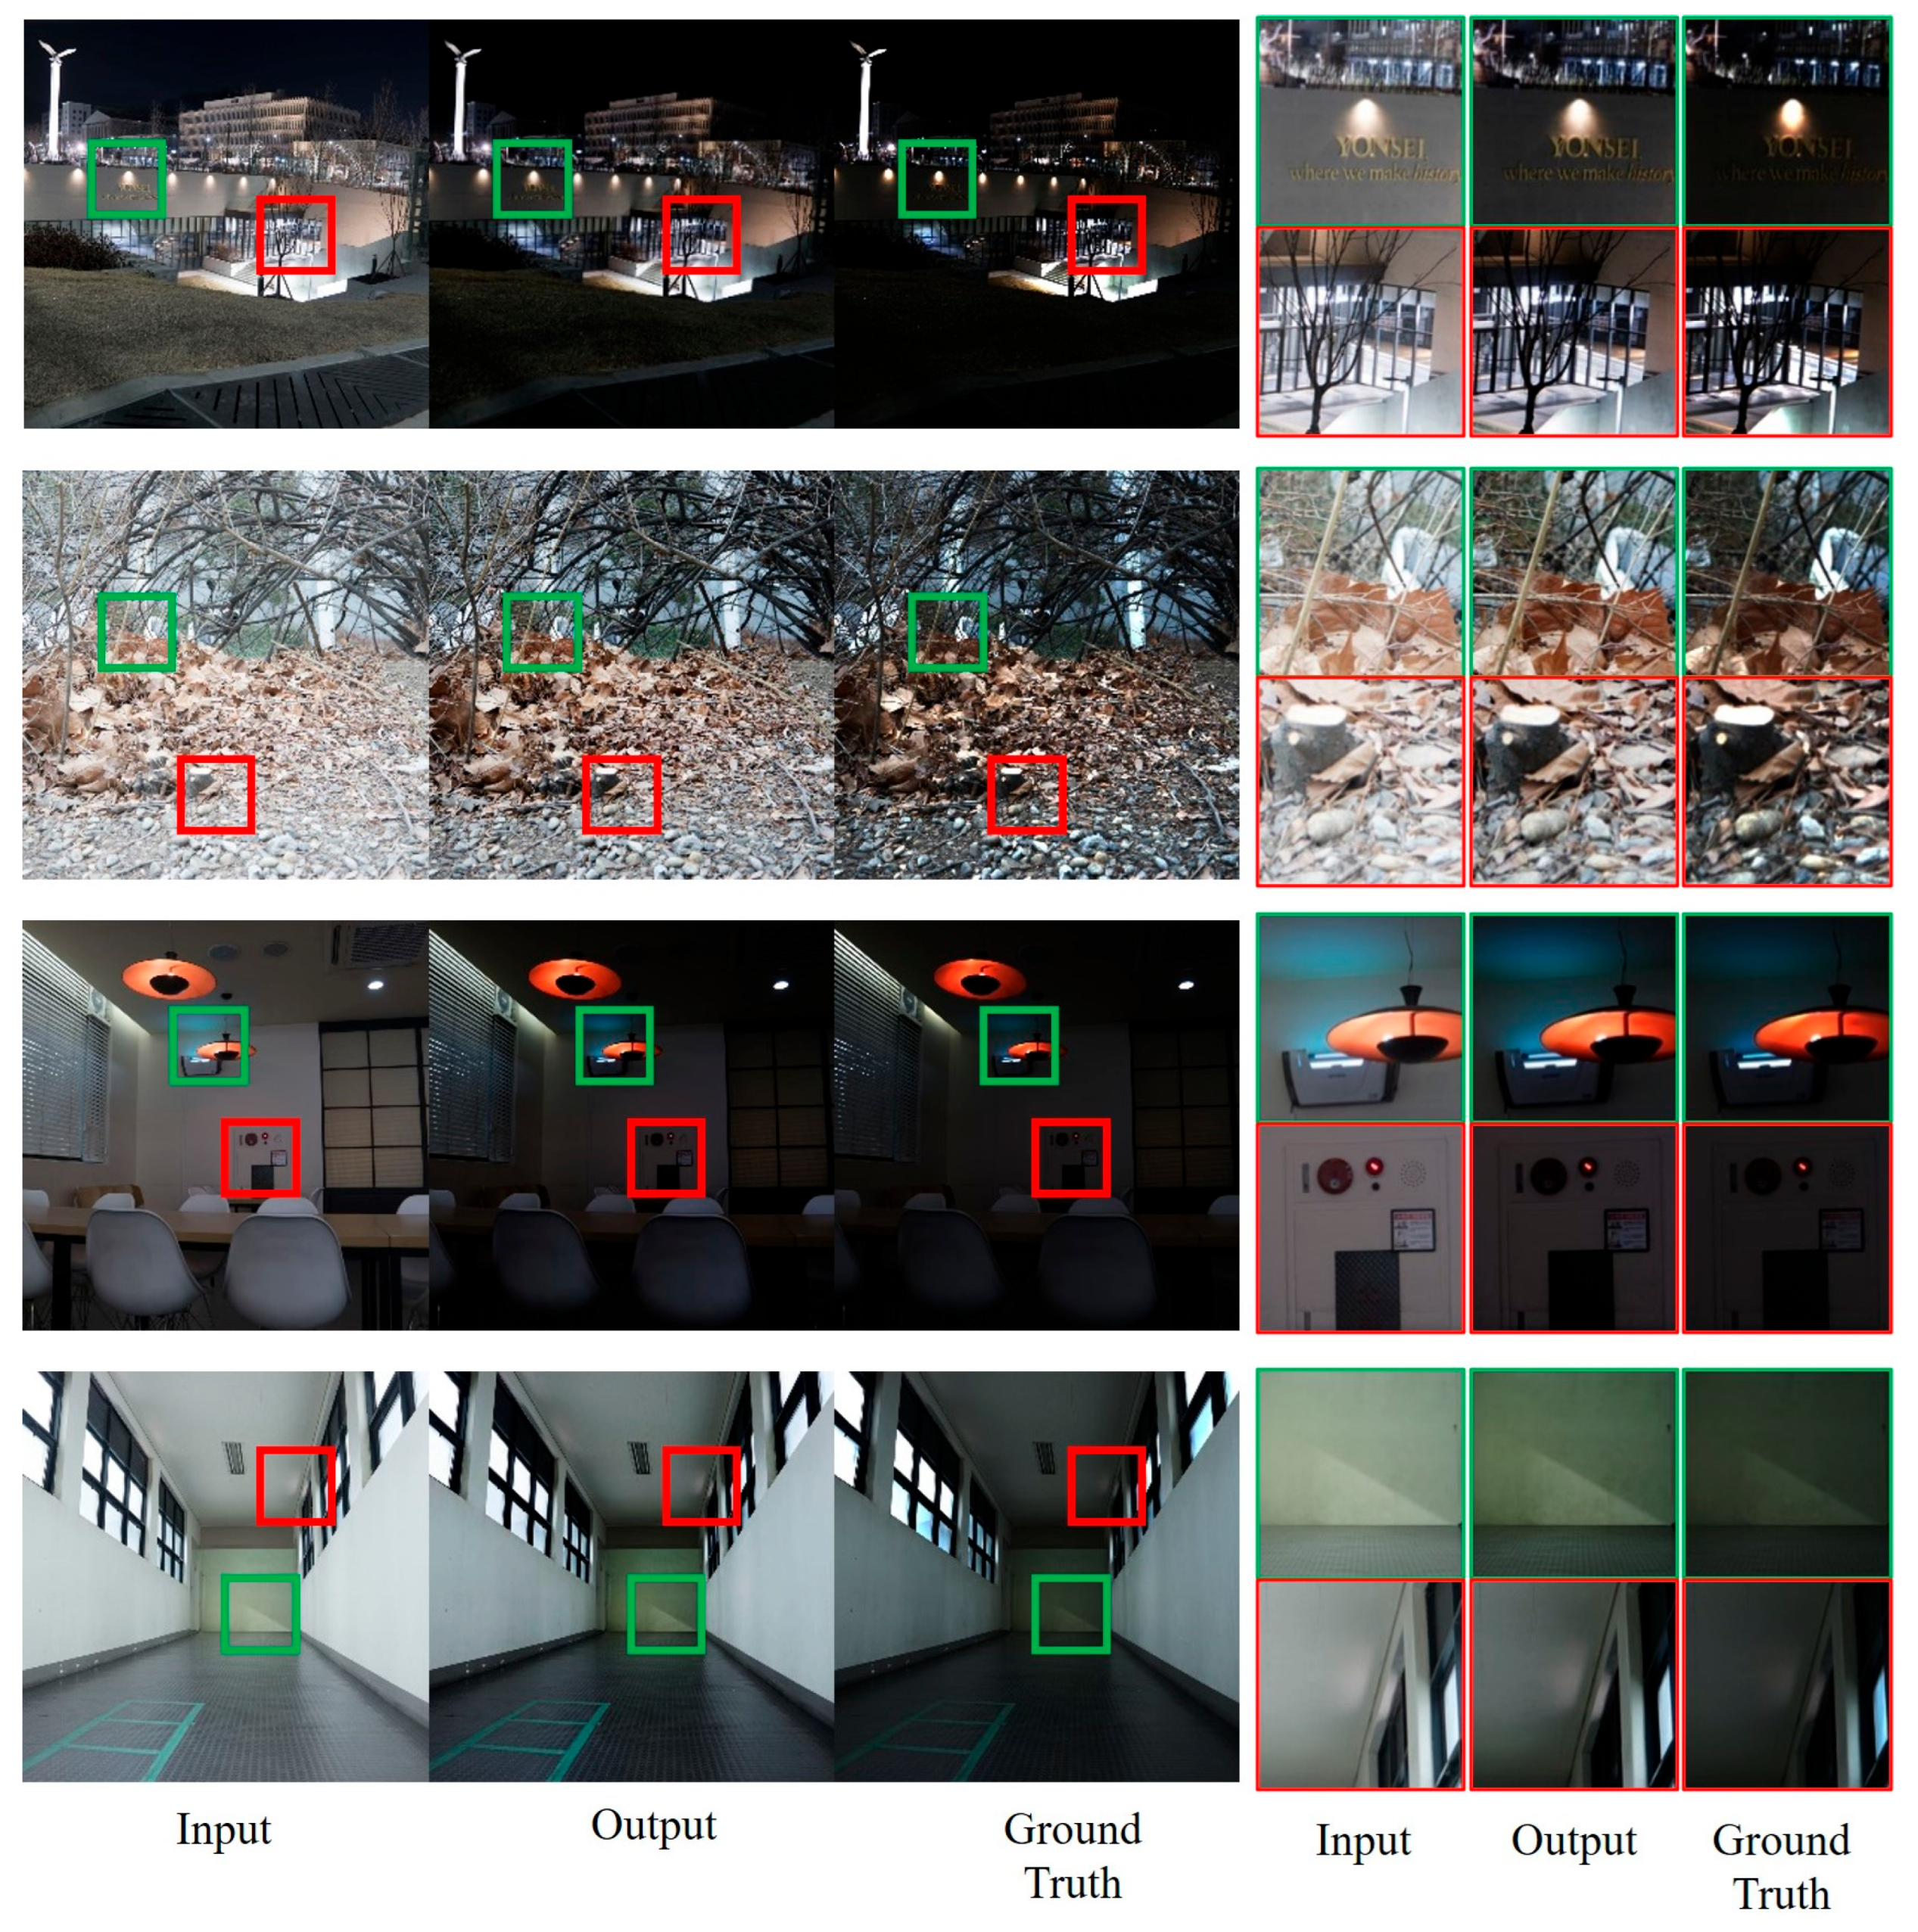
In Table 3, the effectiveness of our masking and pre-training approaches is evaluated by comparing the evaluations of MSE and HDRVDP-2. Here, SConv, GConv, IMask, and FMask refer to standard convolution, gated convolution, masking input images only, and our full feature masking method, respectively. In addition, the Inp. pre-training and HDR pre-training correspond to the pre-training of the repair and HDR reconstruction tasks that we propose, respectively. Figure 13 further compares the input LDR image with the generated HDR image to show the degree of improvement in image details. Obviously, the output HDR image area is closer to the corresponding area of the HDR ground truth image, and the scope of this improvement is consistent across all four types of imagery.

4.2. Backlight Local Dimming

4.2.1. Simulation of Local Dimming of Backlight Module

The LED array of a backlight module with a local dimming function needs to have a control image that determines the brightness of each LED. However, to observe the image quality displayed by the LCD module under different LED array sizes, it is impossible to build the relative backlight hardware separately, but we can only produce a locally dimmed backlight in the way of software simulation. First, without considering the input image, the backlight simulation system is a backlight image generator, as shown in Equation (13).
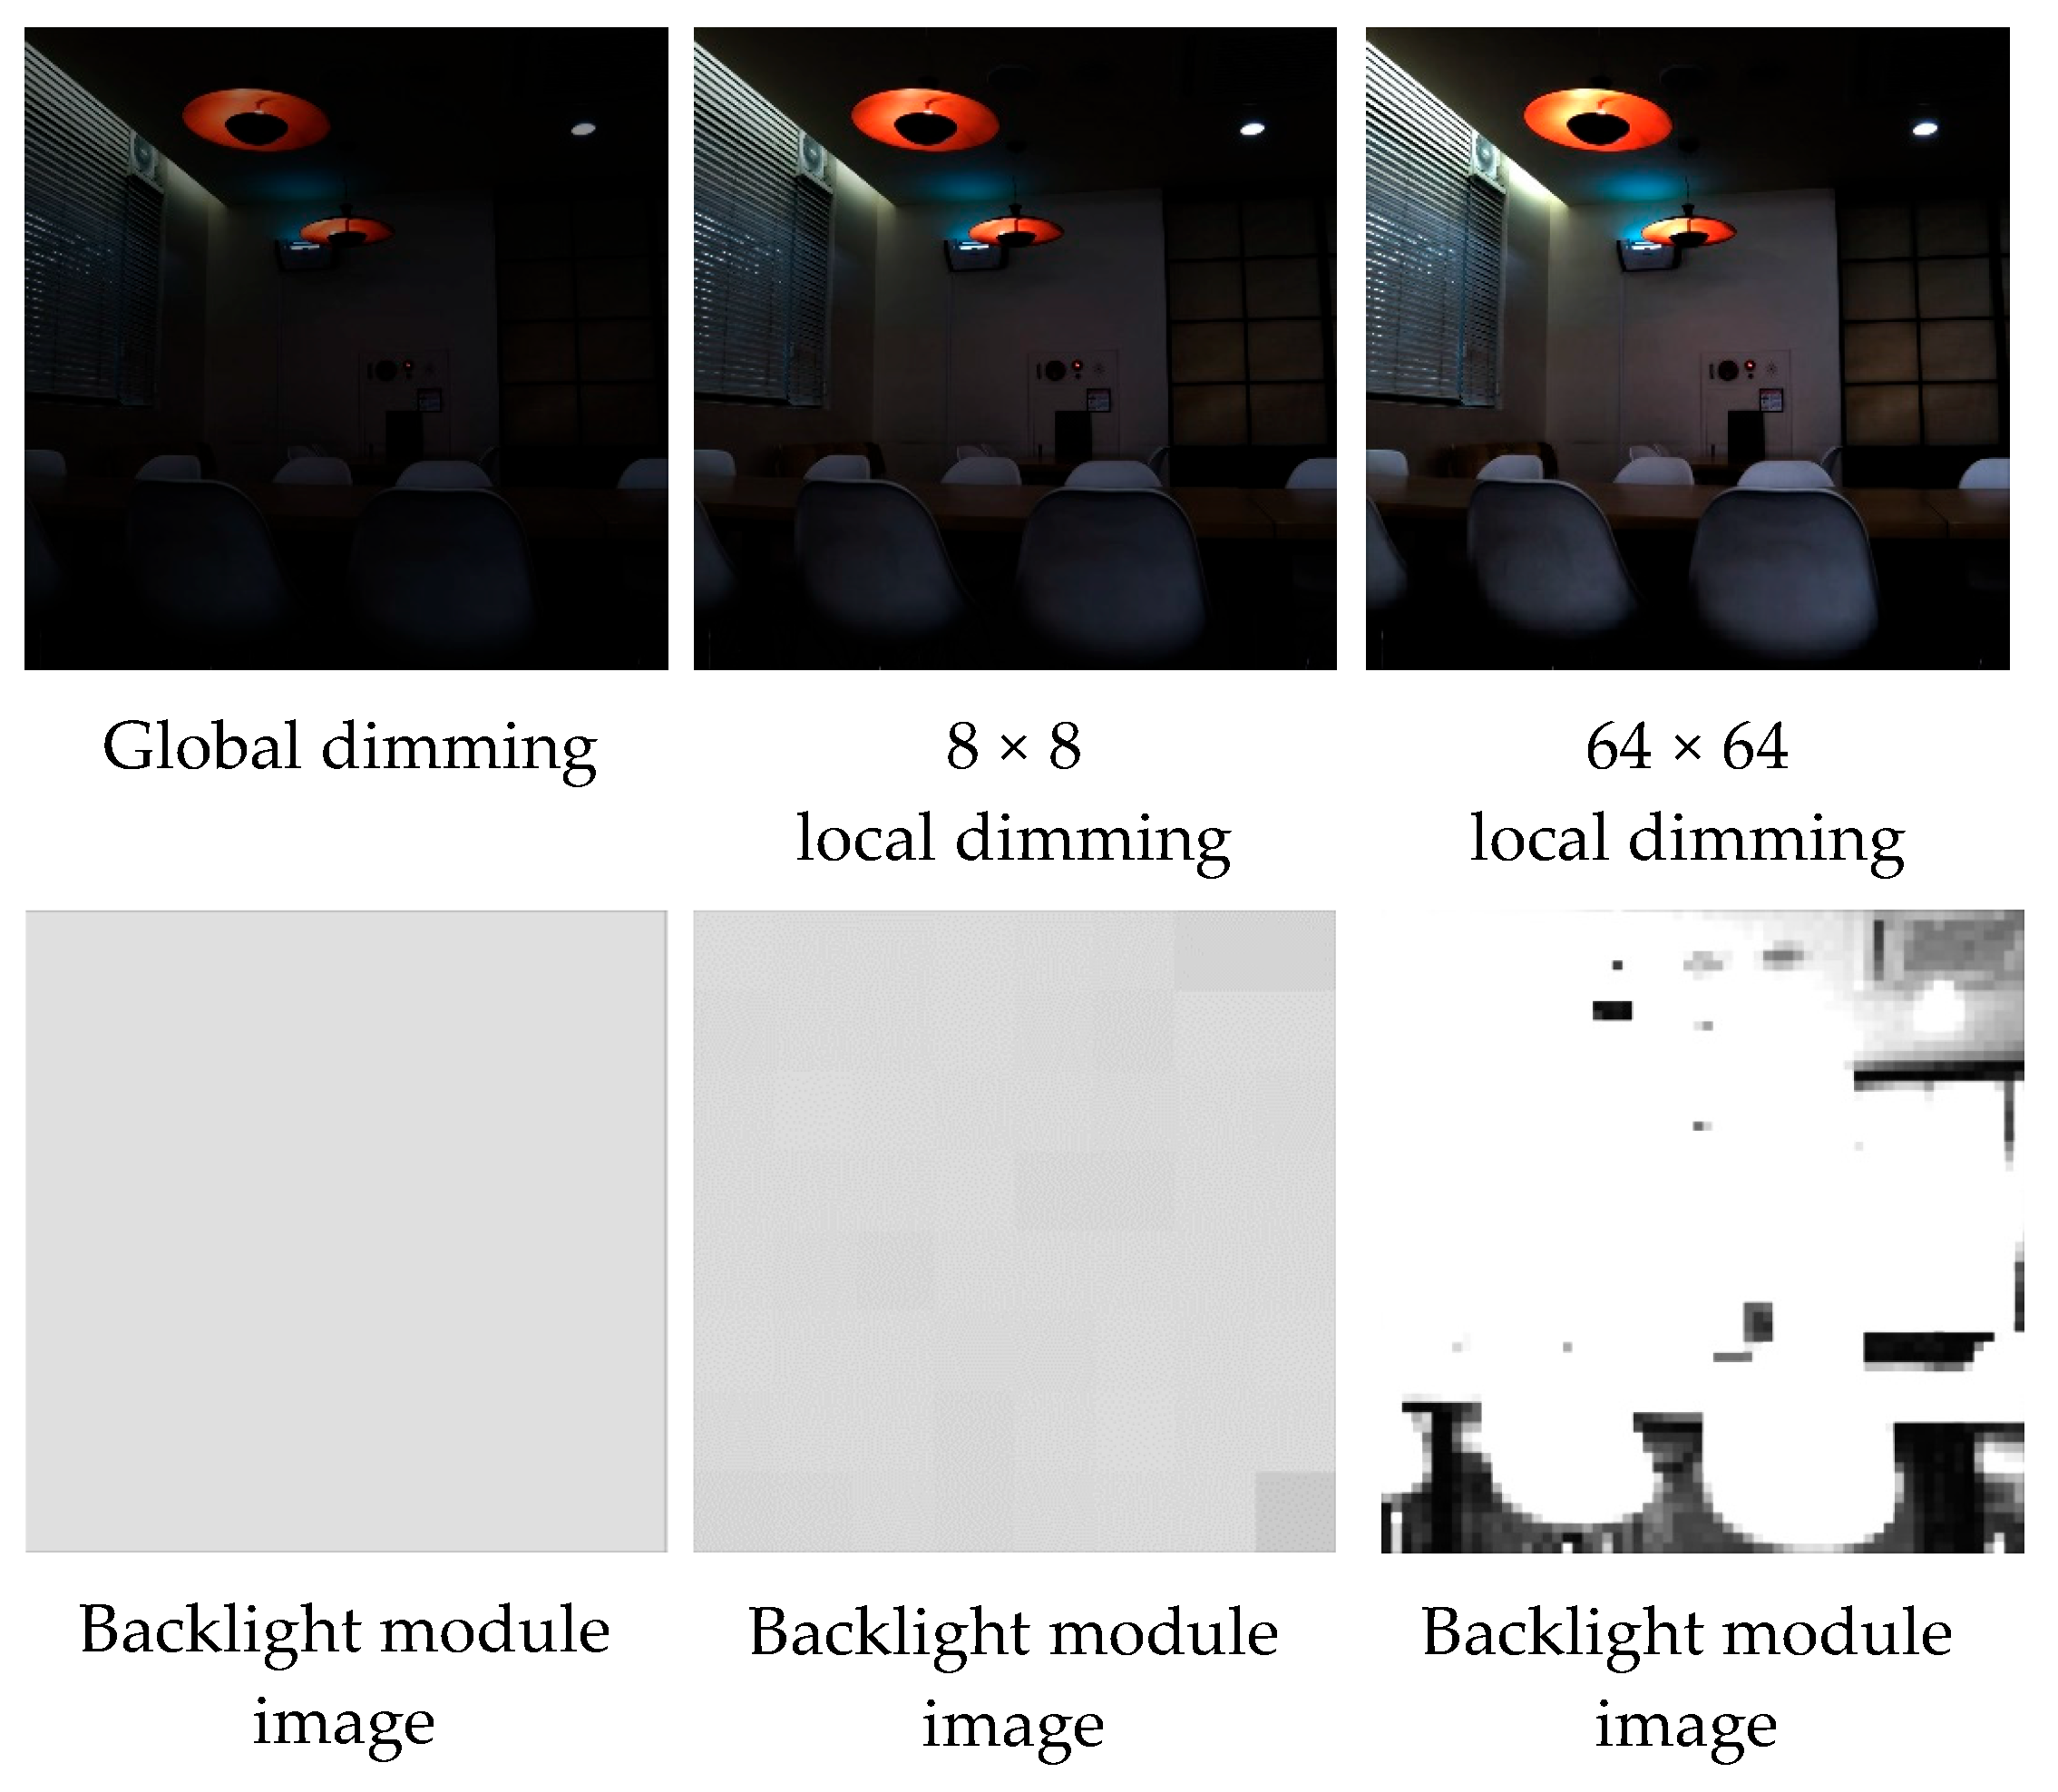
A conventional backlight image can be viewed as a global white image generated by a fully open LED that occupies the entire image range, as shown in Figure 14a. When a backlight module with a local dimming function is used, each LED in the LED array will be responsible for providing the backlight for the corresponding block in the output image. Figure 14b–e show the simulated backlight images with partial dimming under different LED array sizes of 8 × 8 (64 LEDs) and 16 × 16 (256 LEDs) corresponding to the low-to-medium LCD panels, 32 × 32 (1024 LEDs) to high-end LCD panels, and 64 × 64 (4096 LEDs) for professional-level LCD panels.

4.2.2. Local Dimming Function

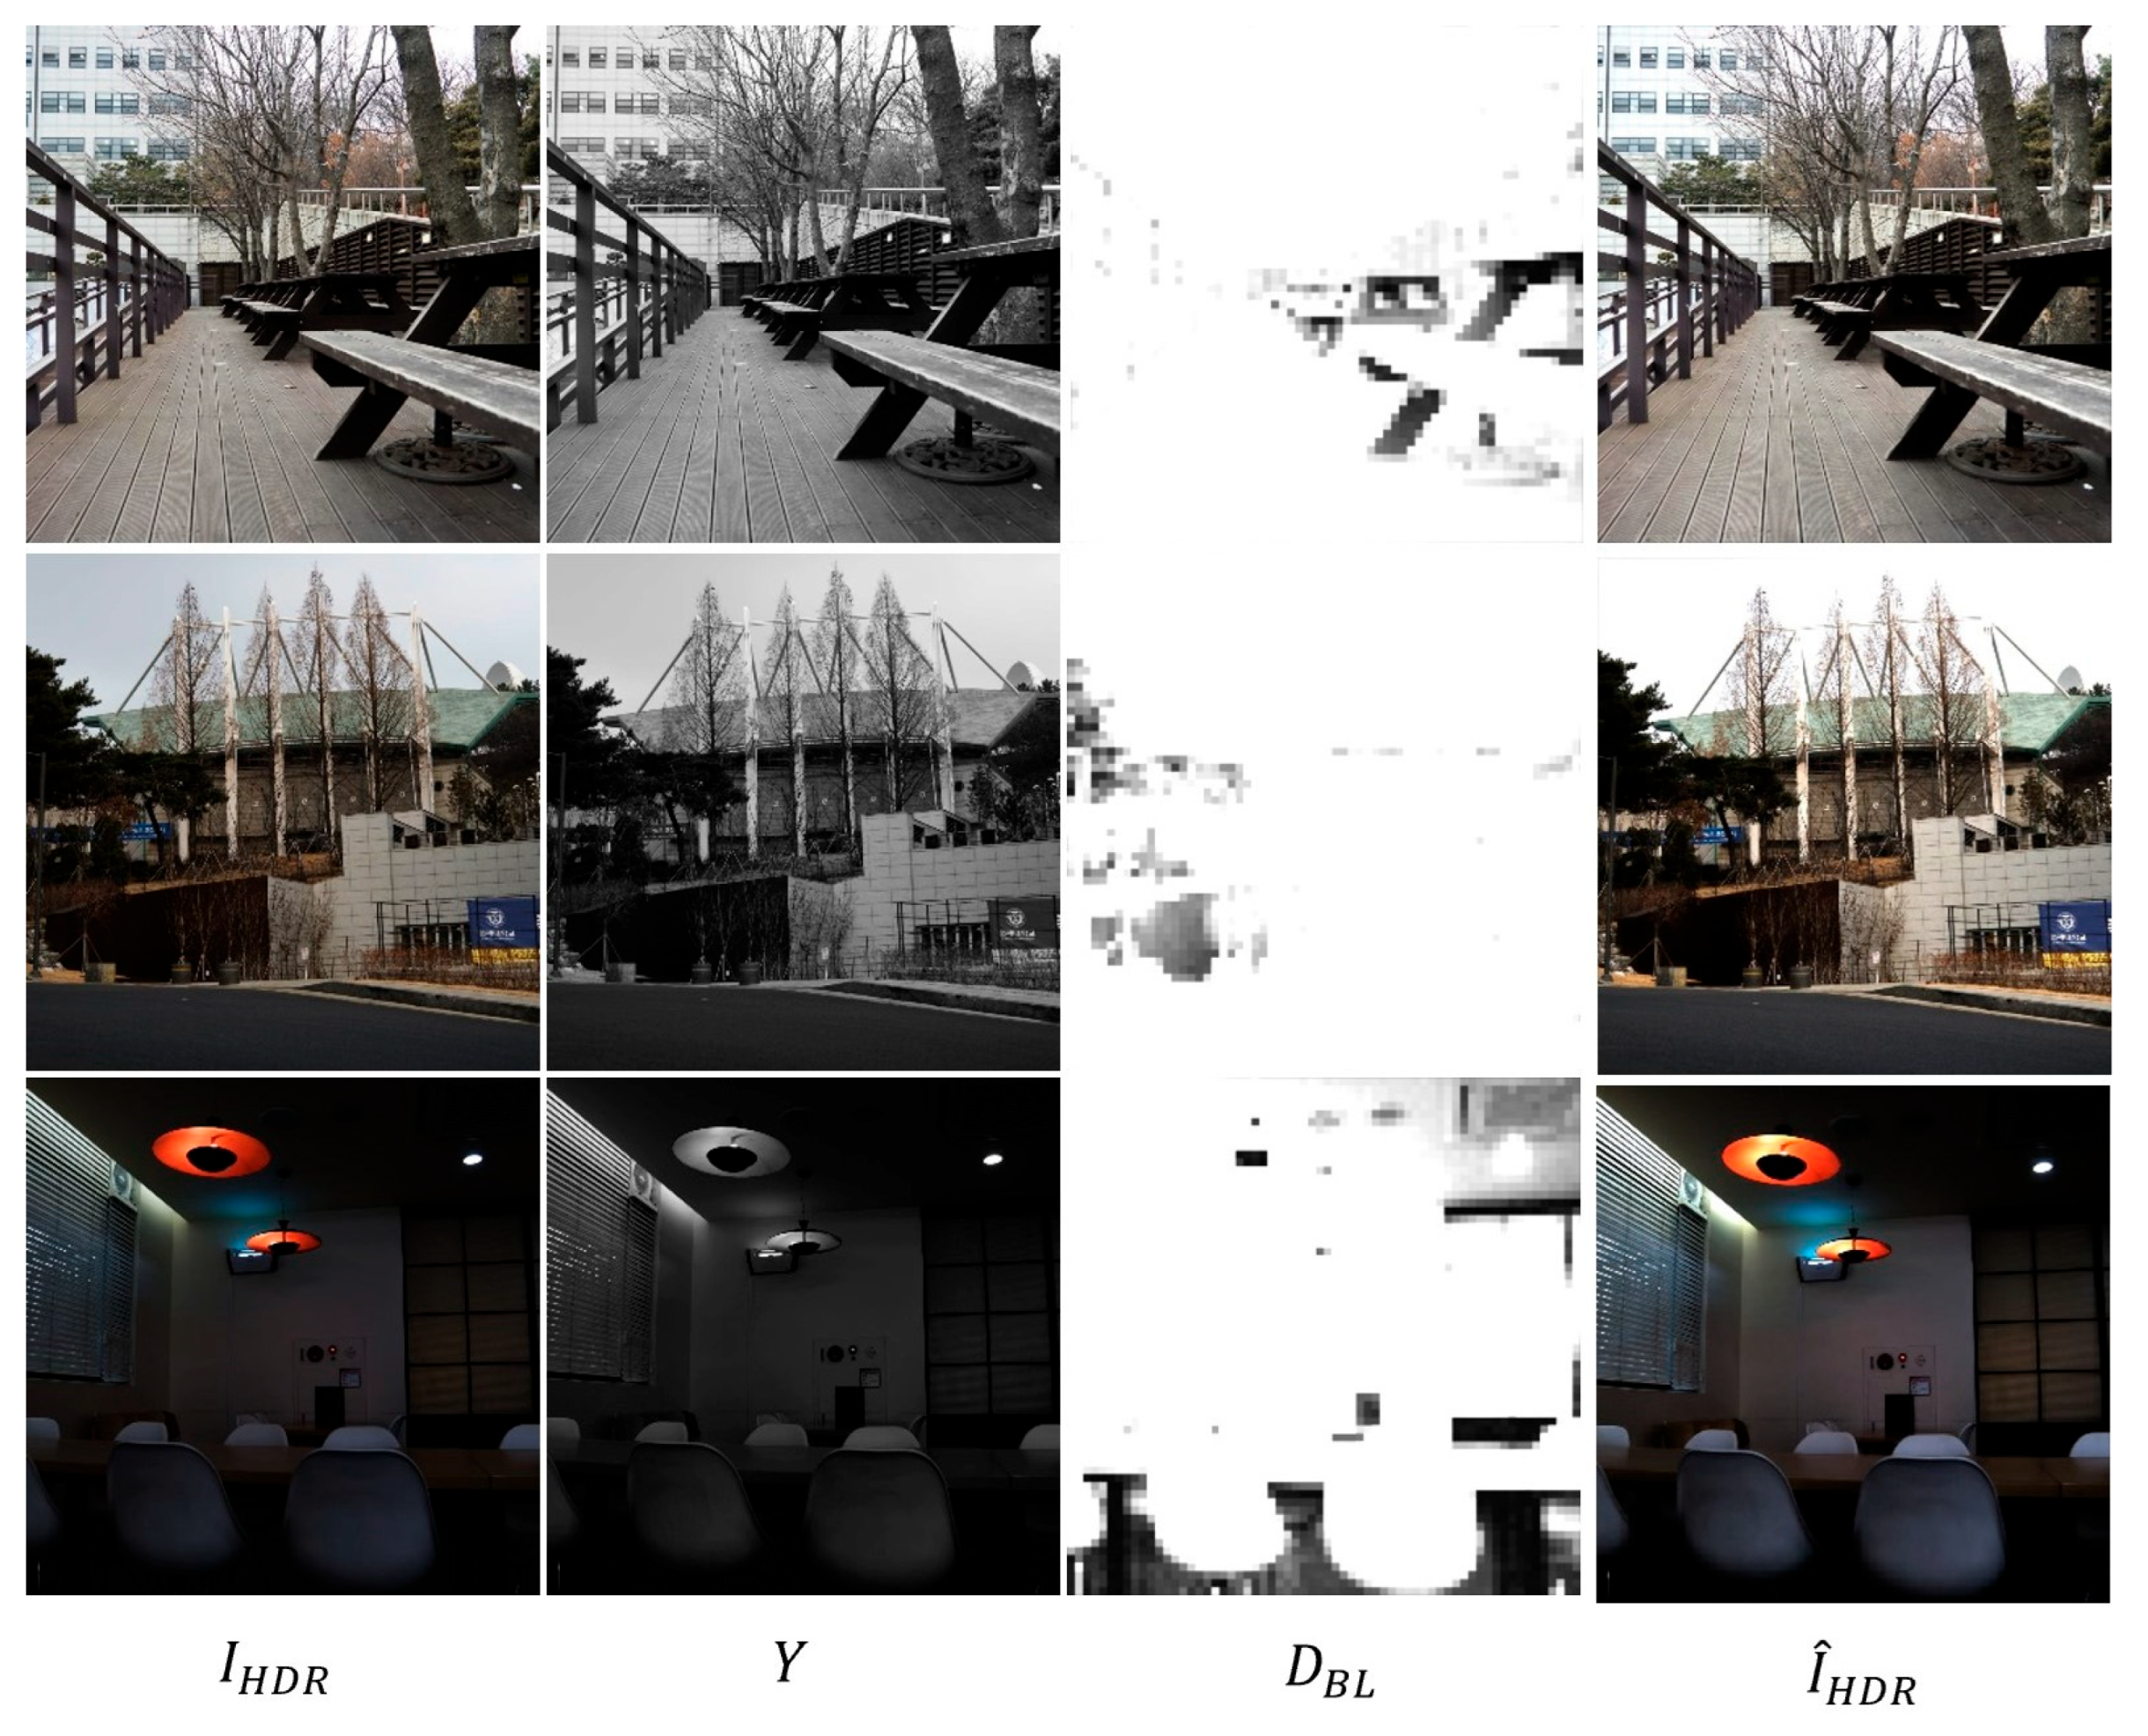
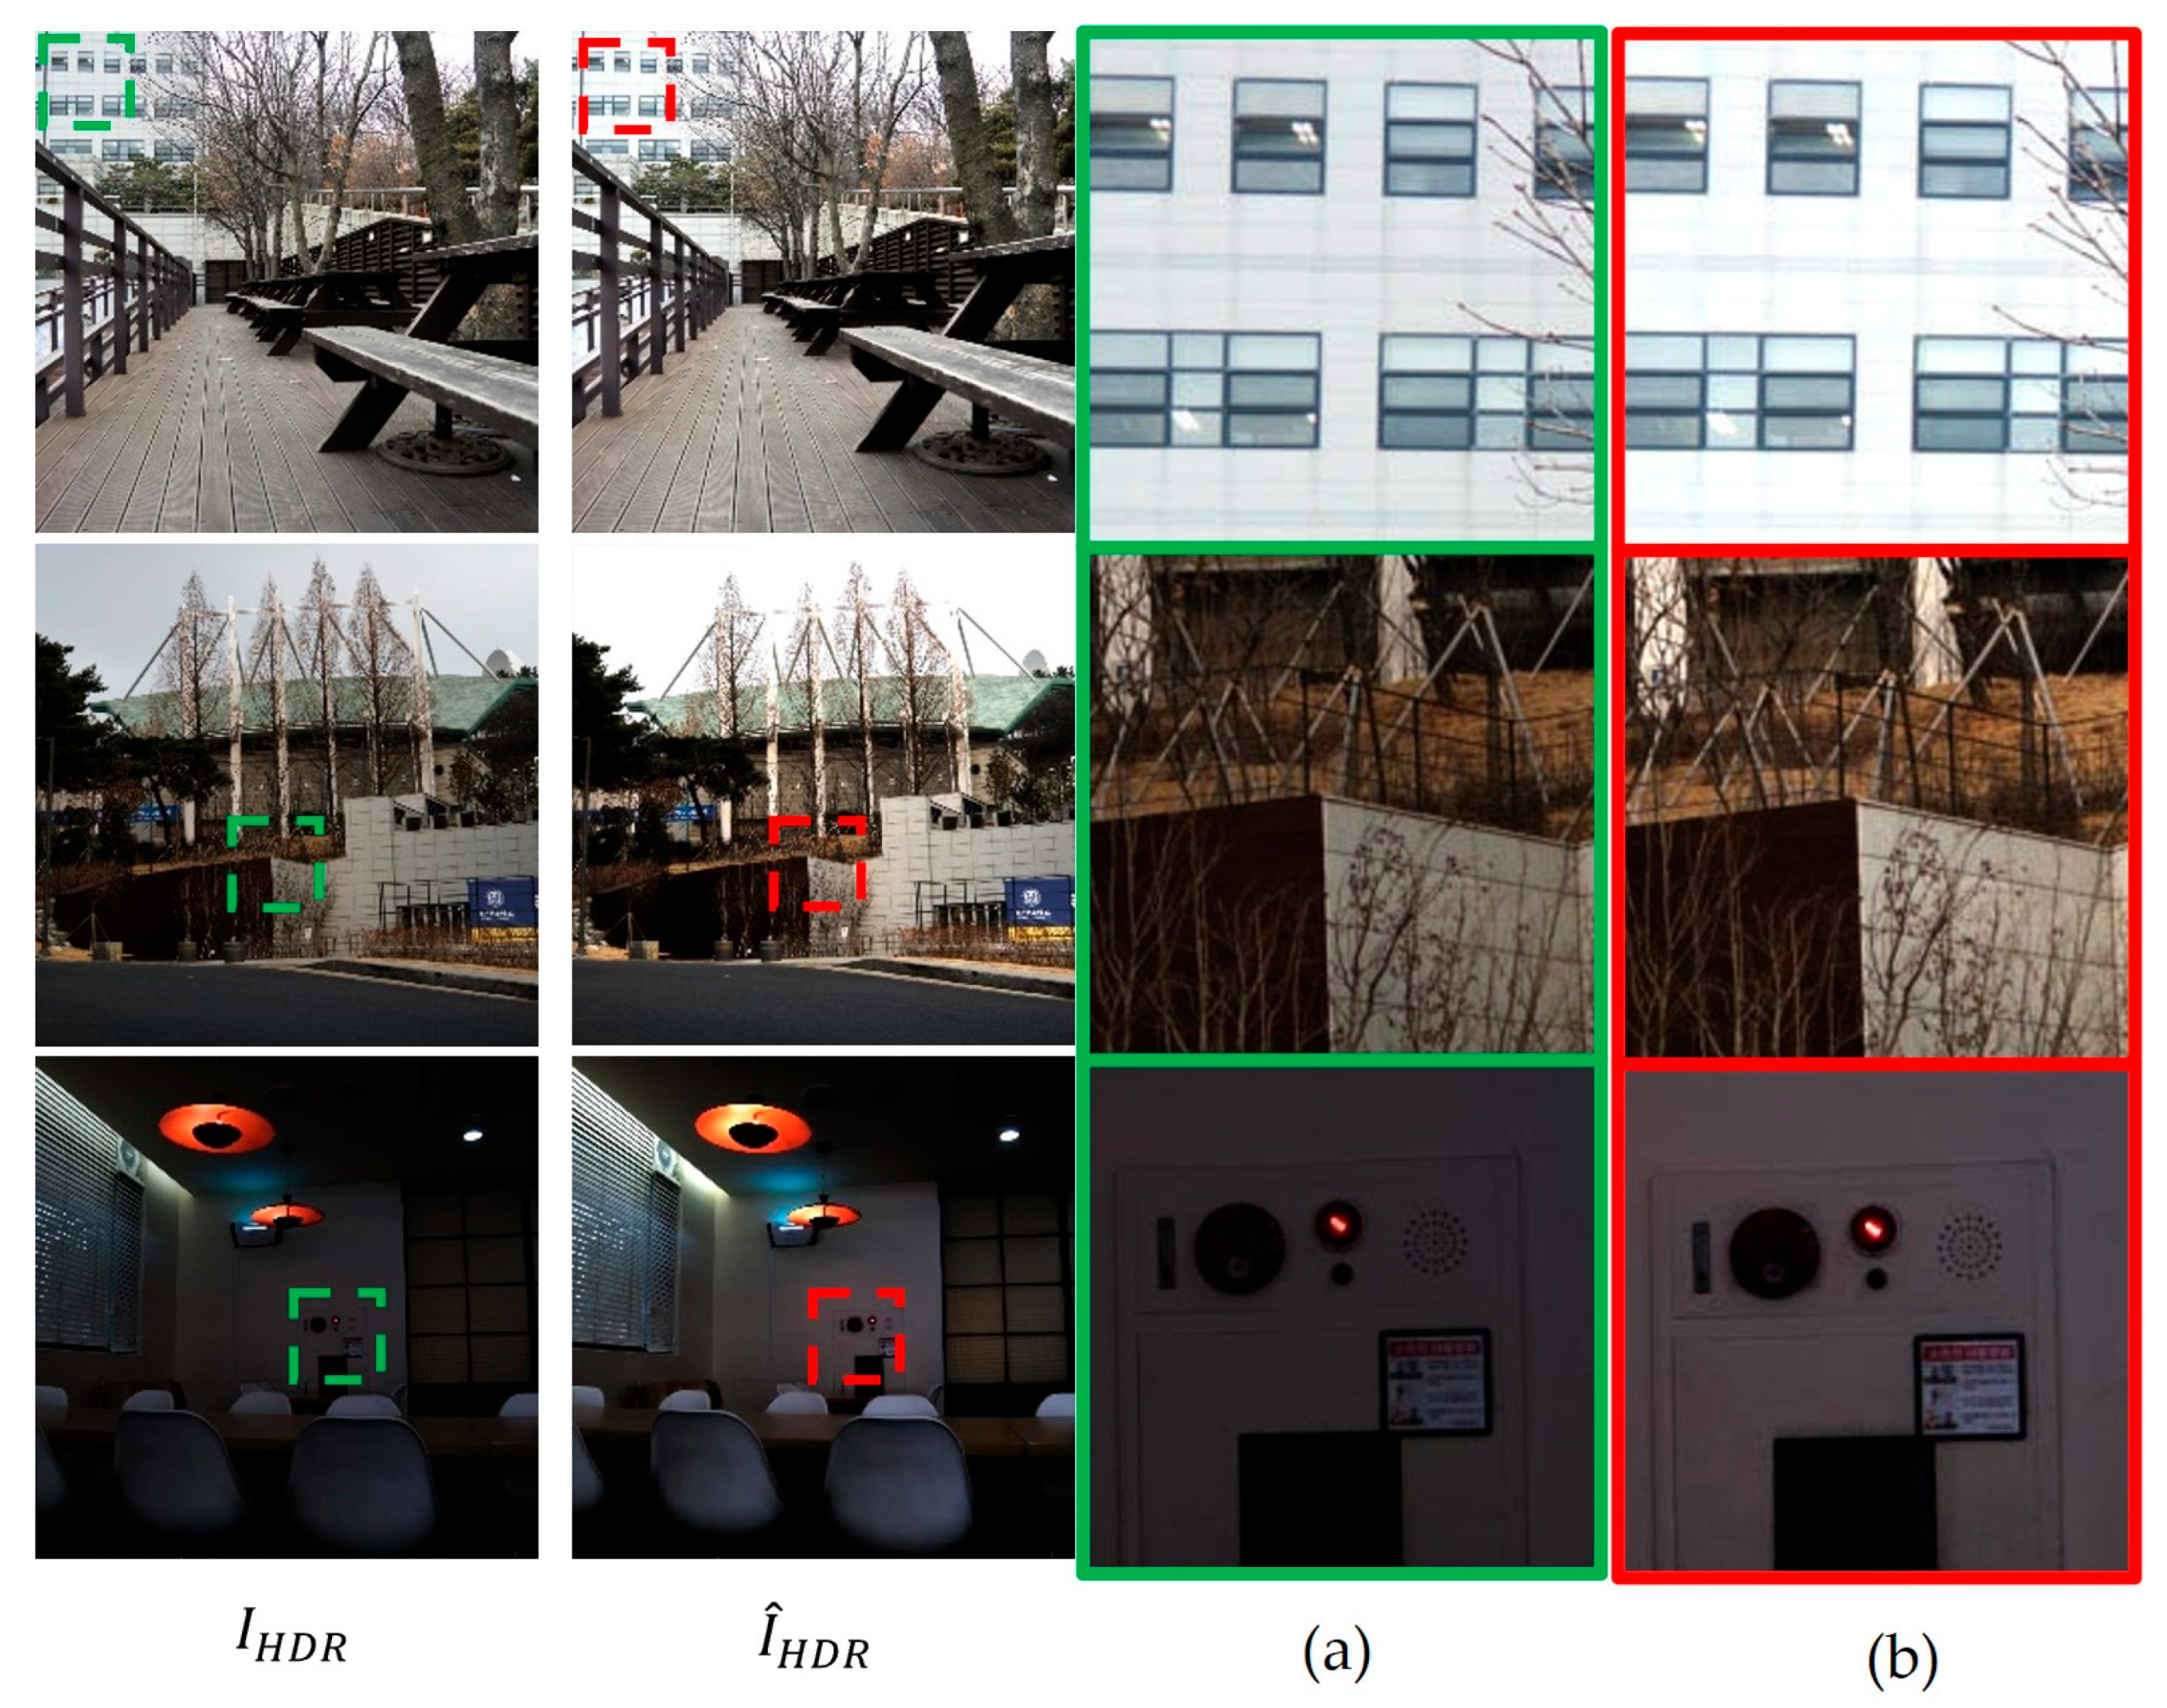
The backlight image generated by the UNet module is combined with the LCD module to generate the final output image after the actual backlight brightness distribution is produced by the backlight module simulator. After the local dimming of LED arrays with various sizes, different image quality will be generated. In addition to the input and output HDR images, the output images of each intermediate unit are displayed in accordance with the process flow in Figure 8, as shown in Figure 15. To observe the details of input and output HDR images, local area comparisons of the input HDR image and the LCD image are shown in Figure 16.
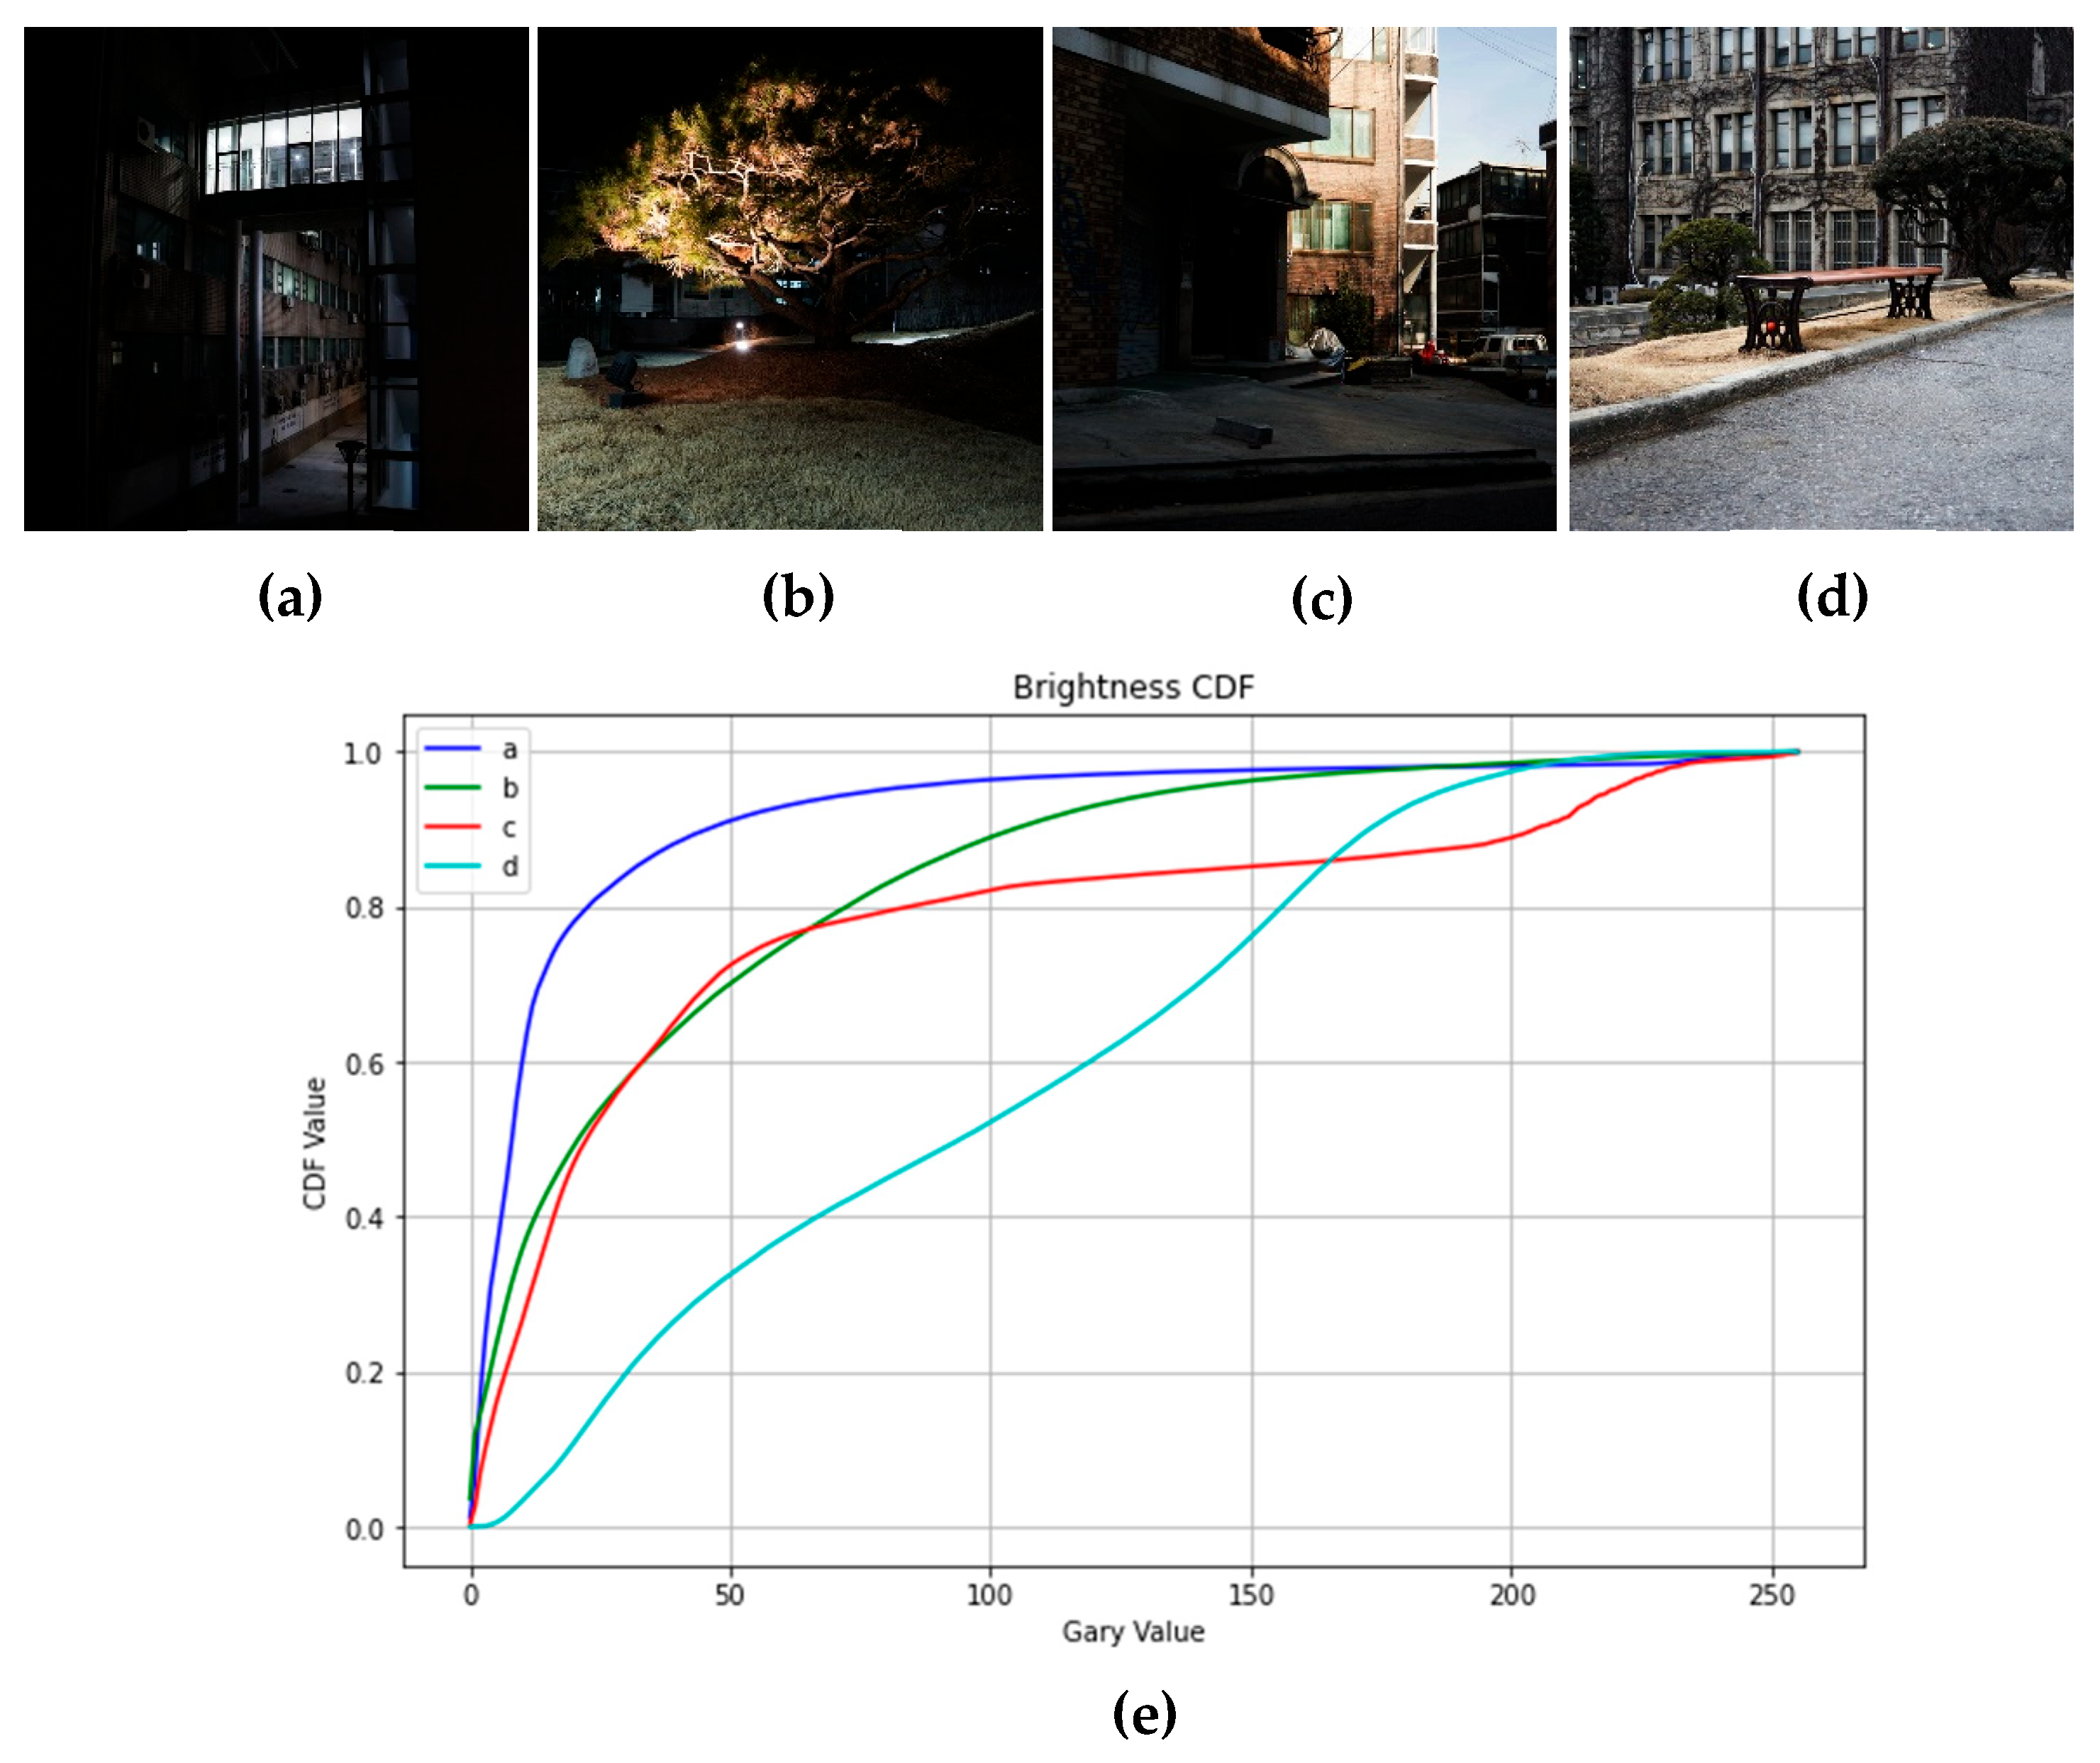
To illustrate the ability of the local dimming approach to improve the contrast of the images in the dark display area, Figure 17a–d shows four images with different characteristics of luminance distribution to be compared: dark background, low brightness, high contrast, and uniform brightness distribution images, respectively, and their brightness CDF (Cumulative Distribution Function) distributions are shown in Figure 17e. In this experiment, CDF is used to describe the distribution of image brightness. The CDF distribution in Figure 17e demonstrates the brightness distribution of four images with different characteristics. With this graph, we can observe the brightness cumulative distribution of the image to understand the distribution of different brightness values in the image:
(1)
The CDF of the image with a dark background (Figure 17a) may show that most of the pixels are concentrated at the low luminance value, and there is a section that rises rapidly to 1, indicating a small number of high-brightness pixels.
(2)
The CDF for the low-luminance image (Figure 17b) may be concentrated in the low-luminance region, but the rise to 1 will be smoother than in the dark background image.
(3)
The CDF of the high-contrast image (Figure 17c) may have one or more distinct jumps, indicating a significant contrast in the image.
(4)
CDF in the image with a uniform distribution of brightness (Figure 17d) may exhibit a gently rising curve to indicate that the brightness values in the image are evenly distributed.
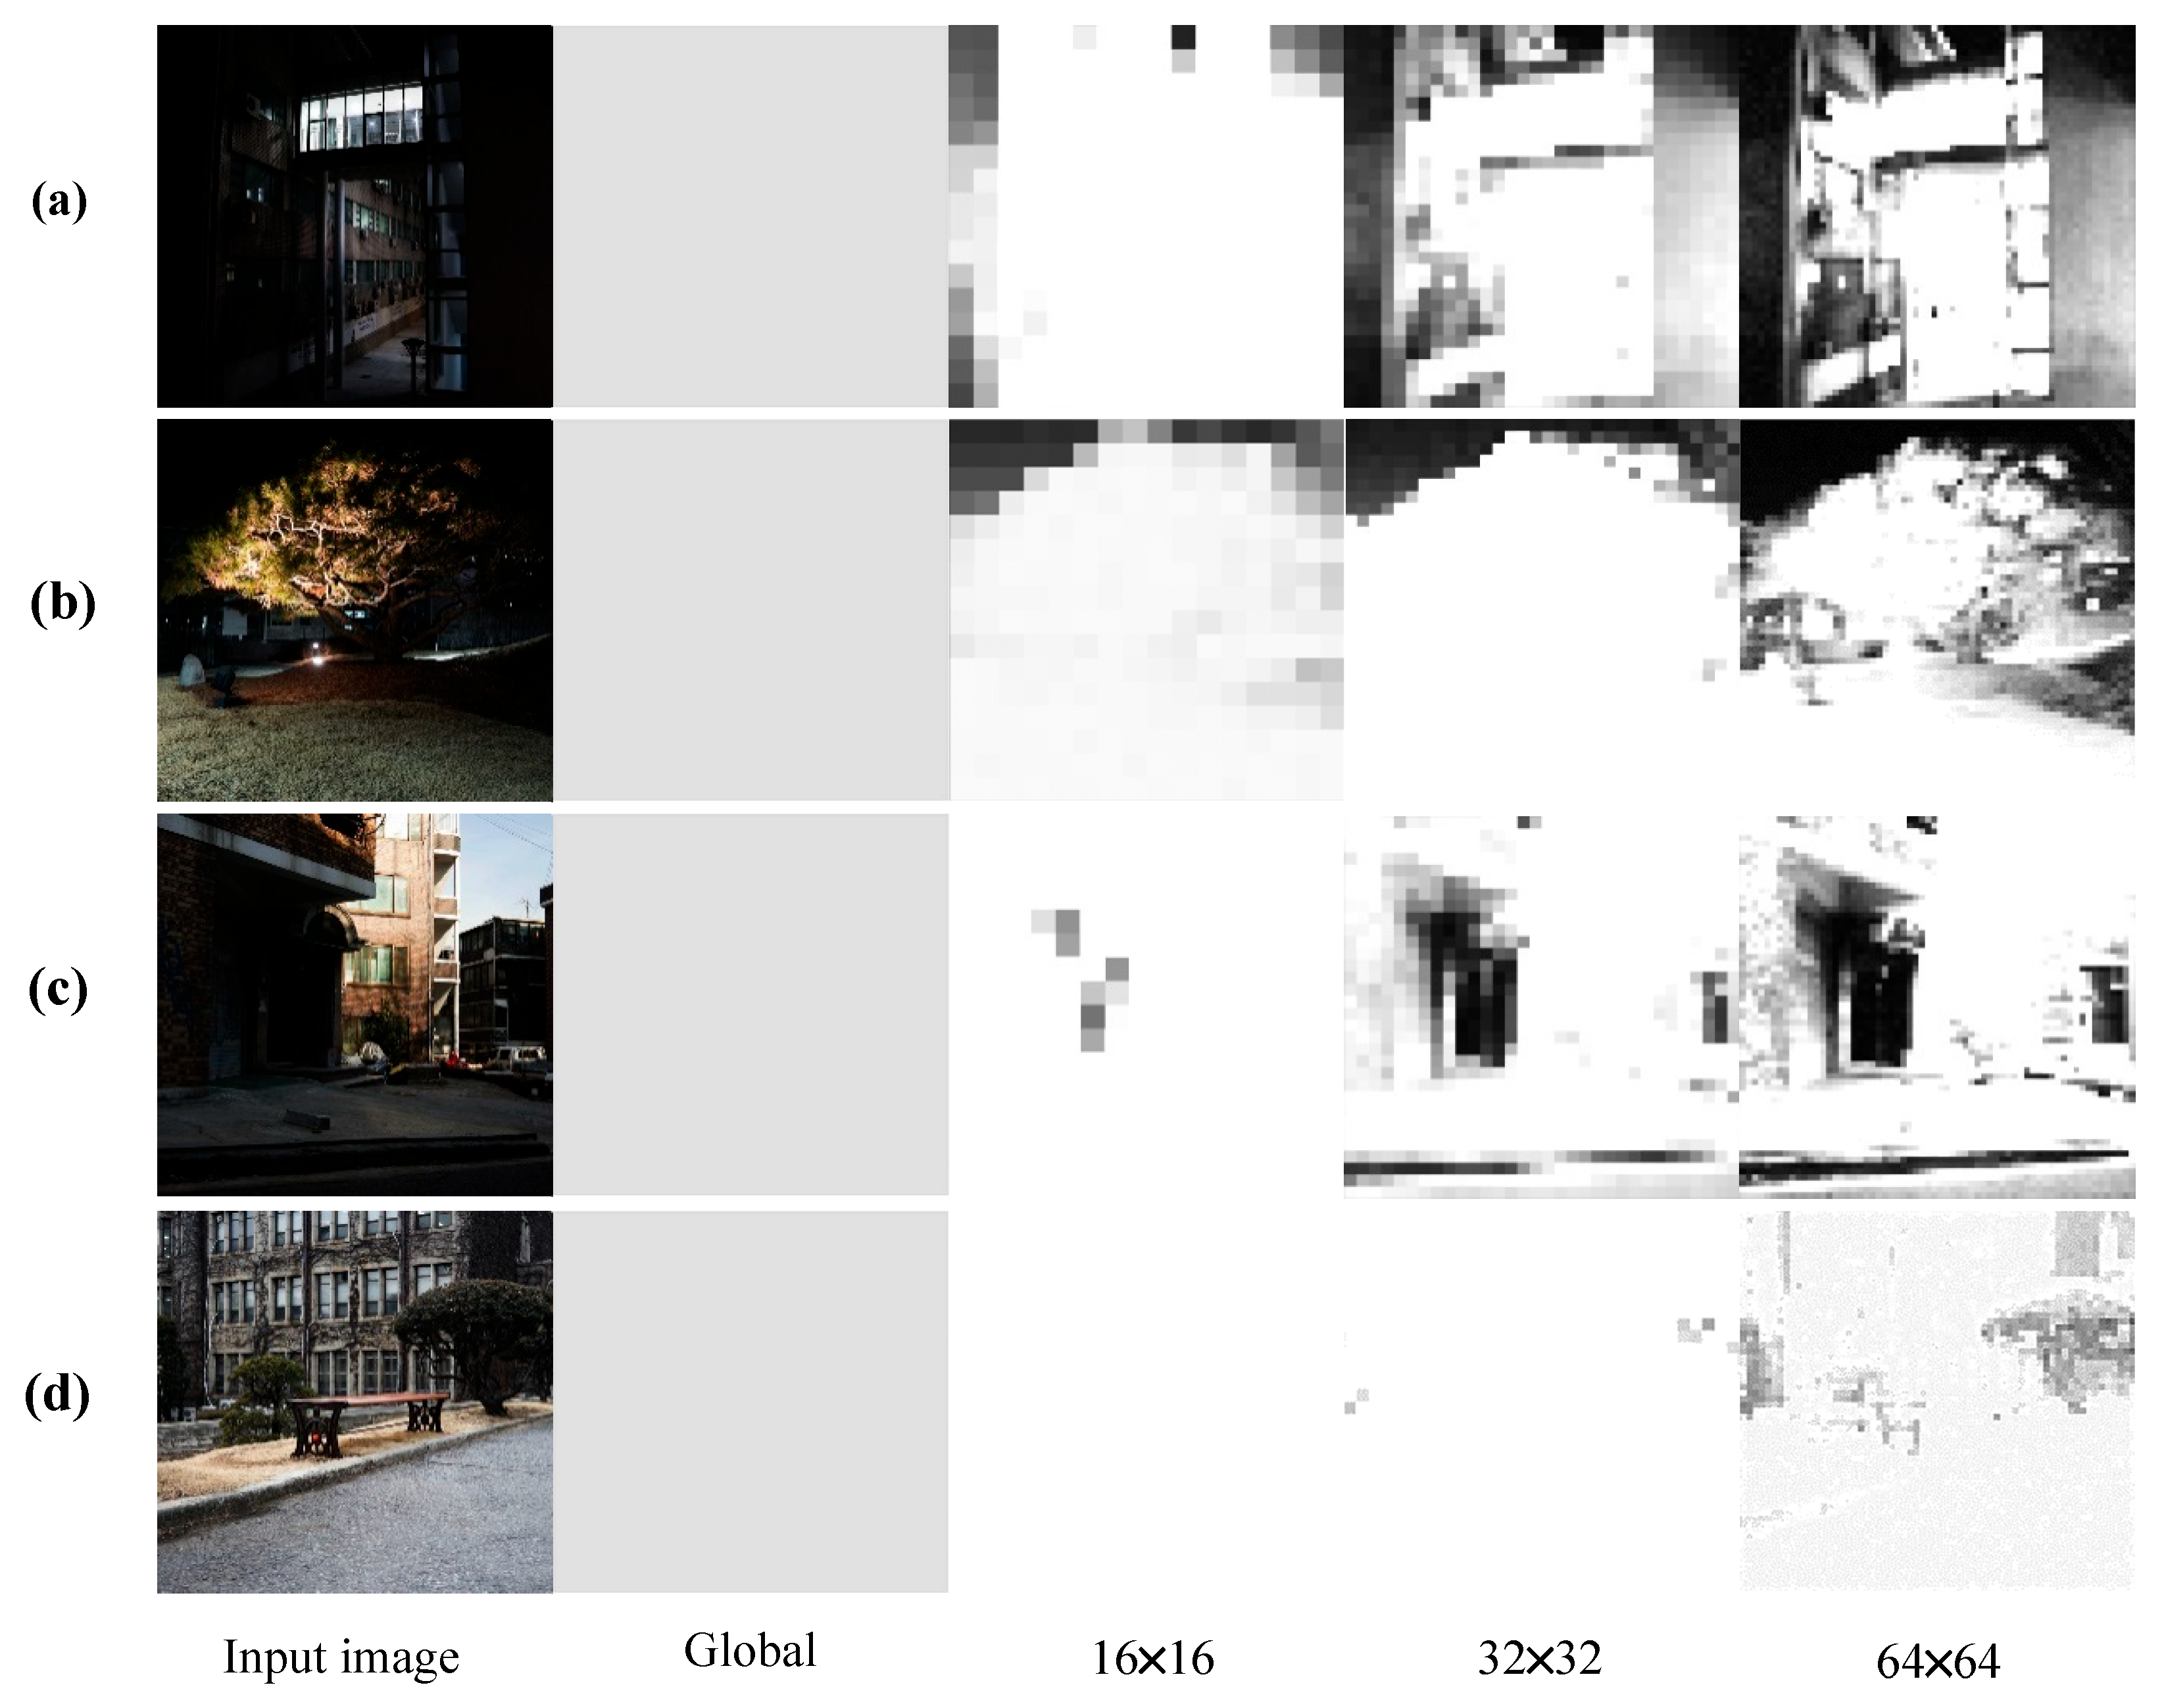
By analyzing these CDF curves, the effect of local dimming on dark display and image contrast improvement can be evaluated. To compare the local dimming effect on different levels of LCD panels, experimental results for four types of images in Figure 17 are presented in Figure 18 after local dimming by 16 × 16 arrays (low and medium), 32 × 32 arrays (high), and 64 × 64 arrays (professional level). To compare the display difference between LDR and HDR images, Figure 19 shows the possible image styles of HDR images achieved in dark image areas.

4.2.3. Performance Evaluation Results

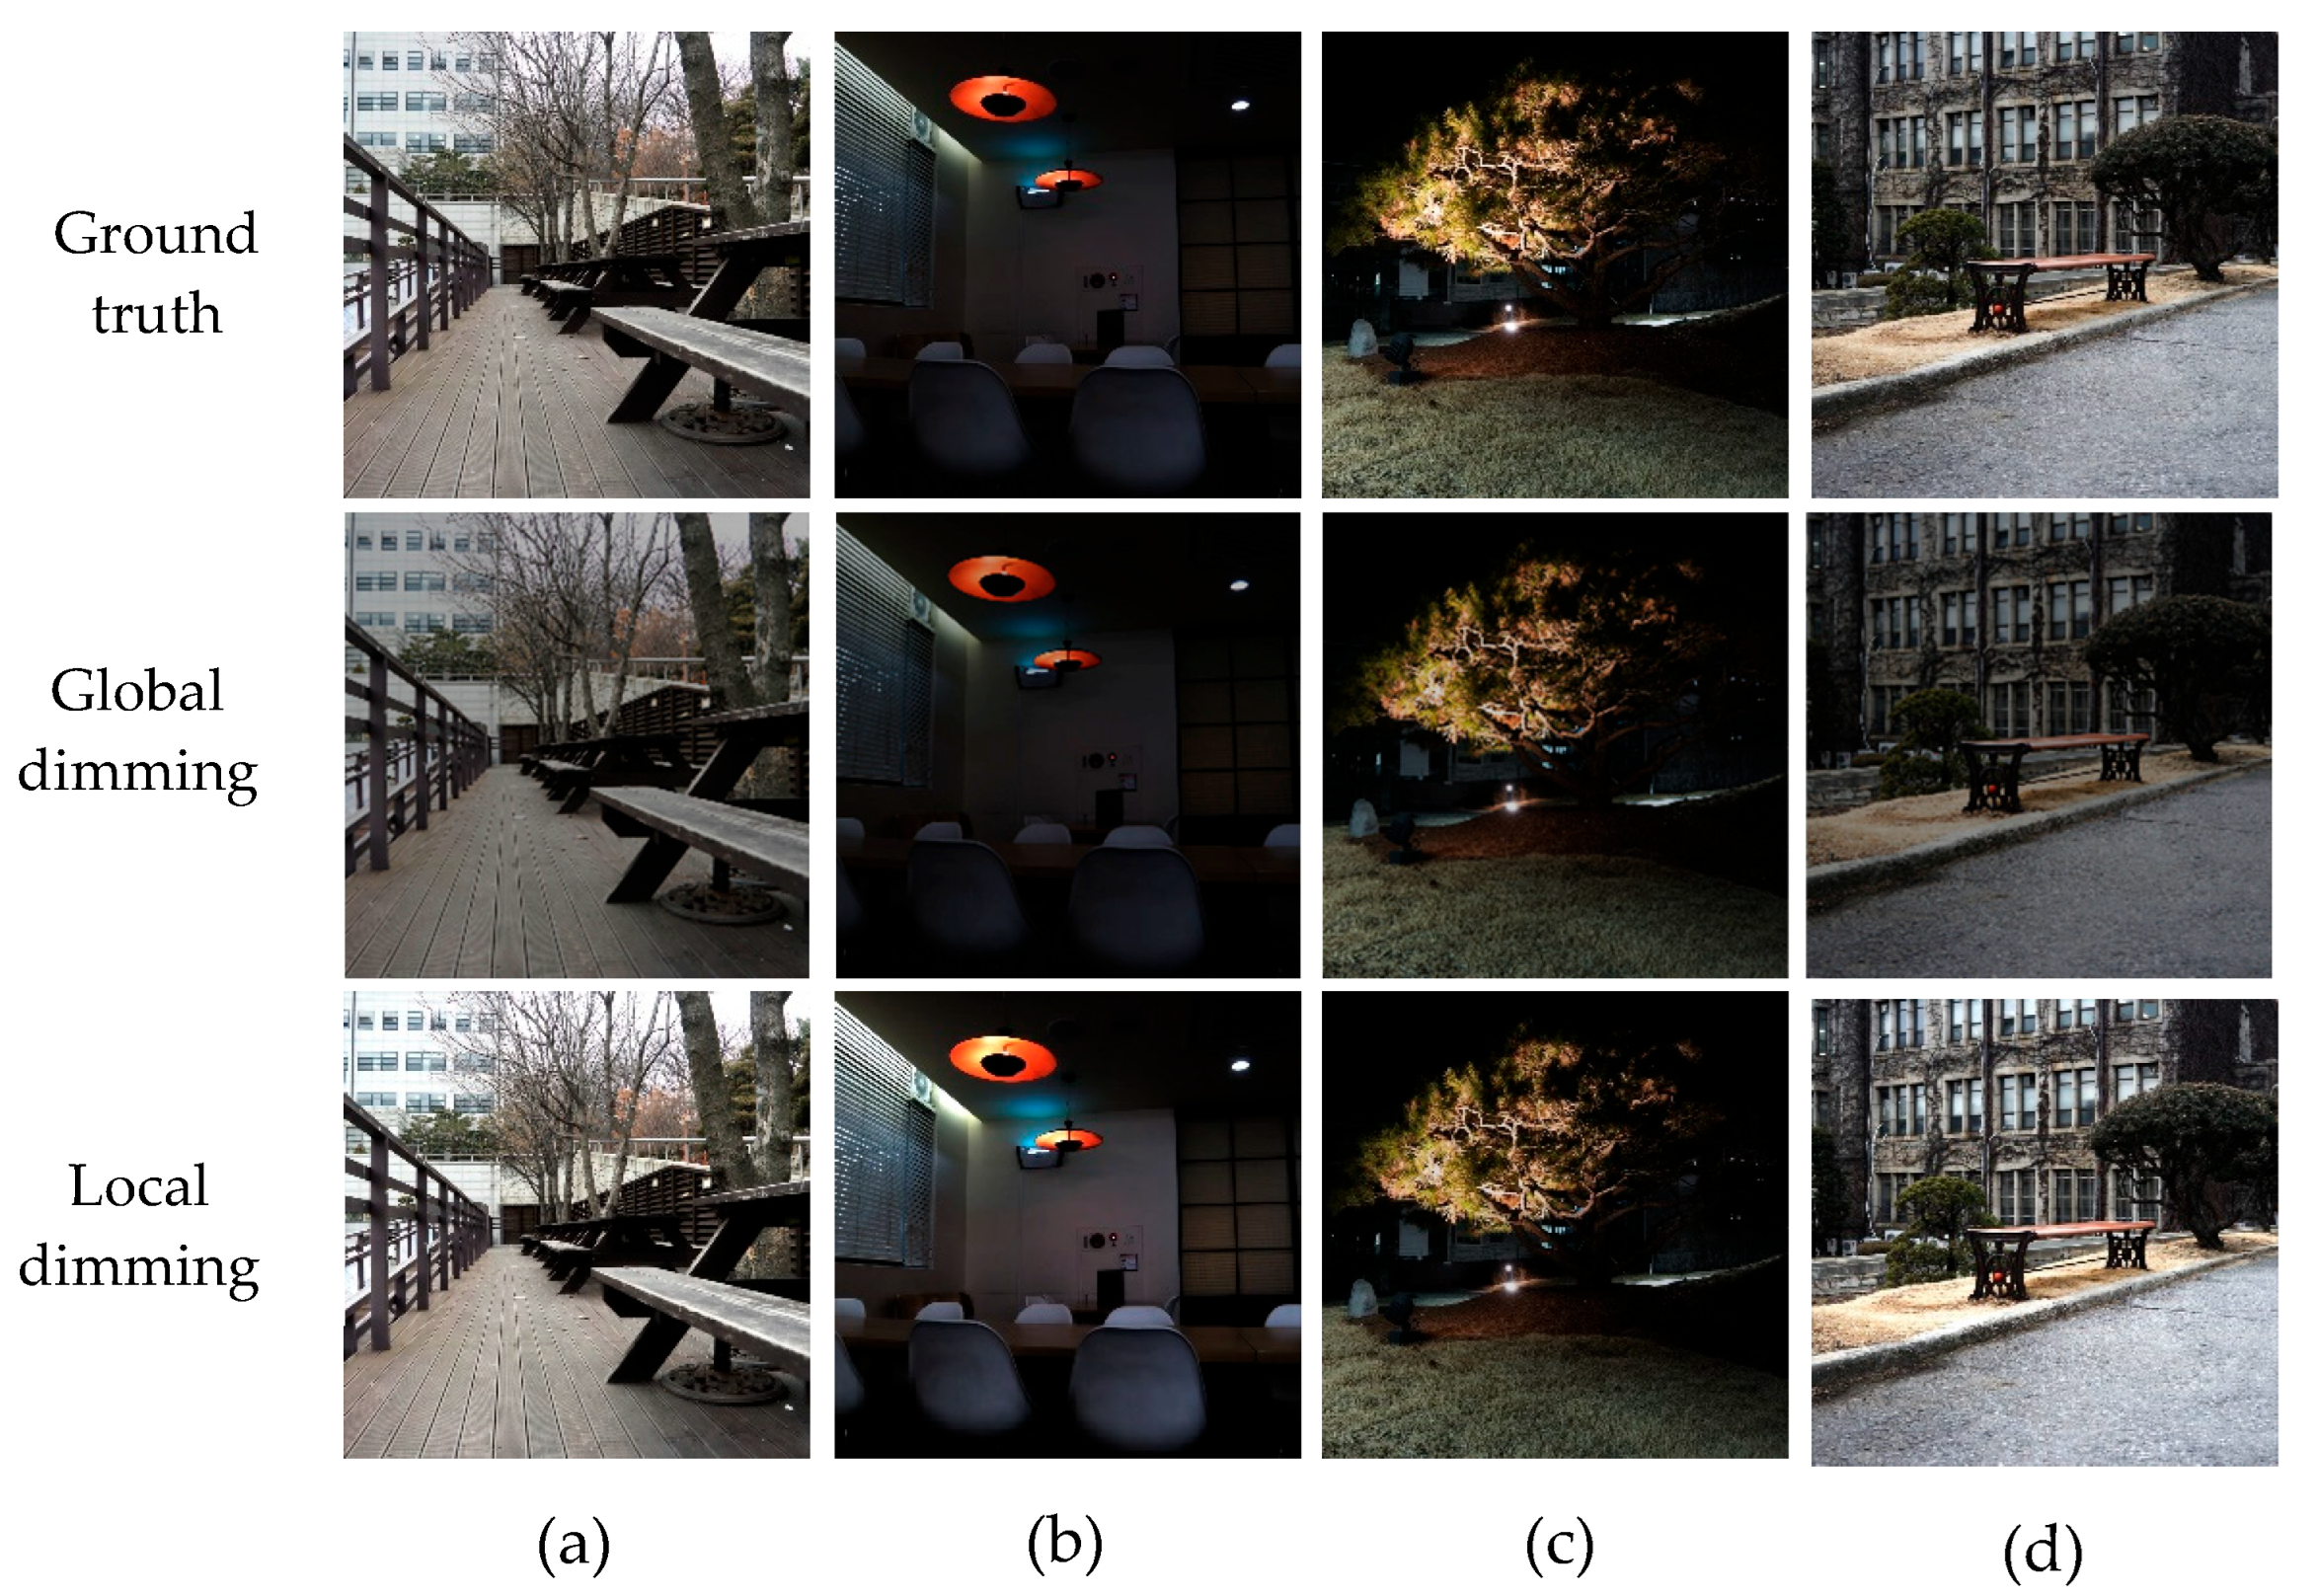
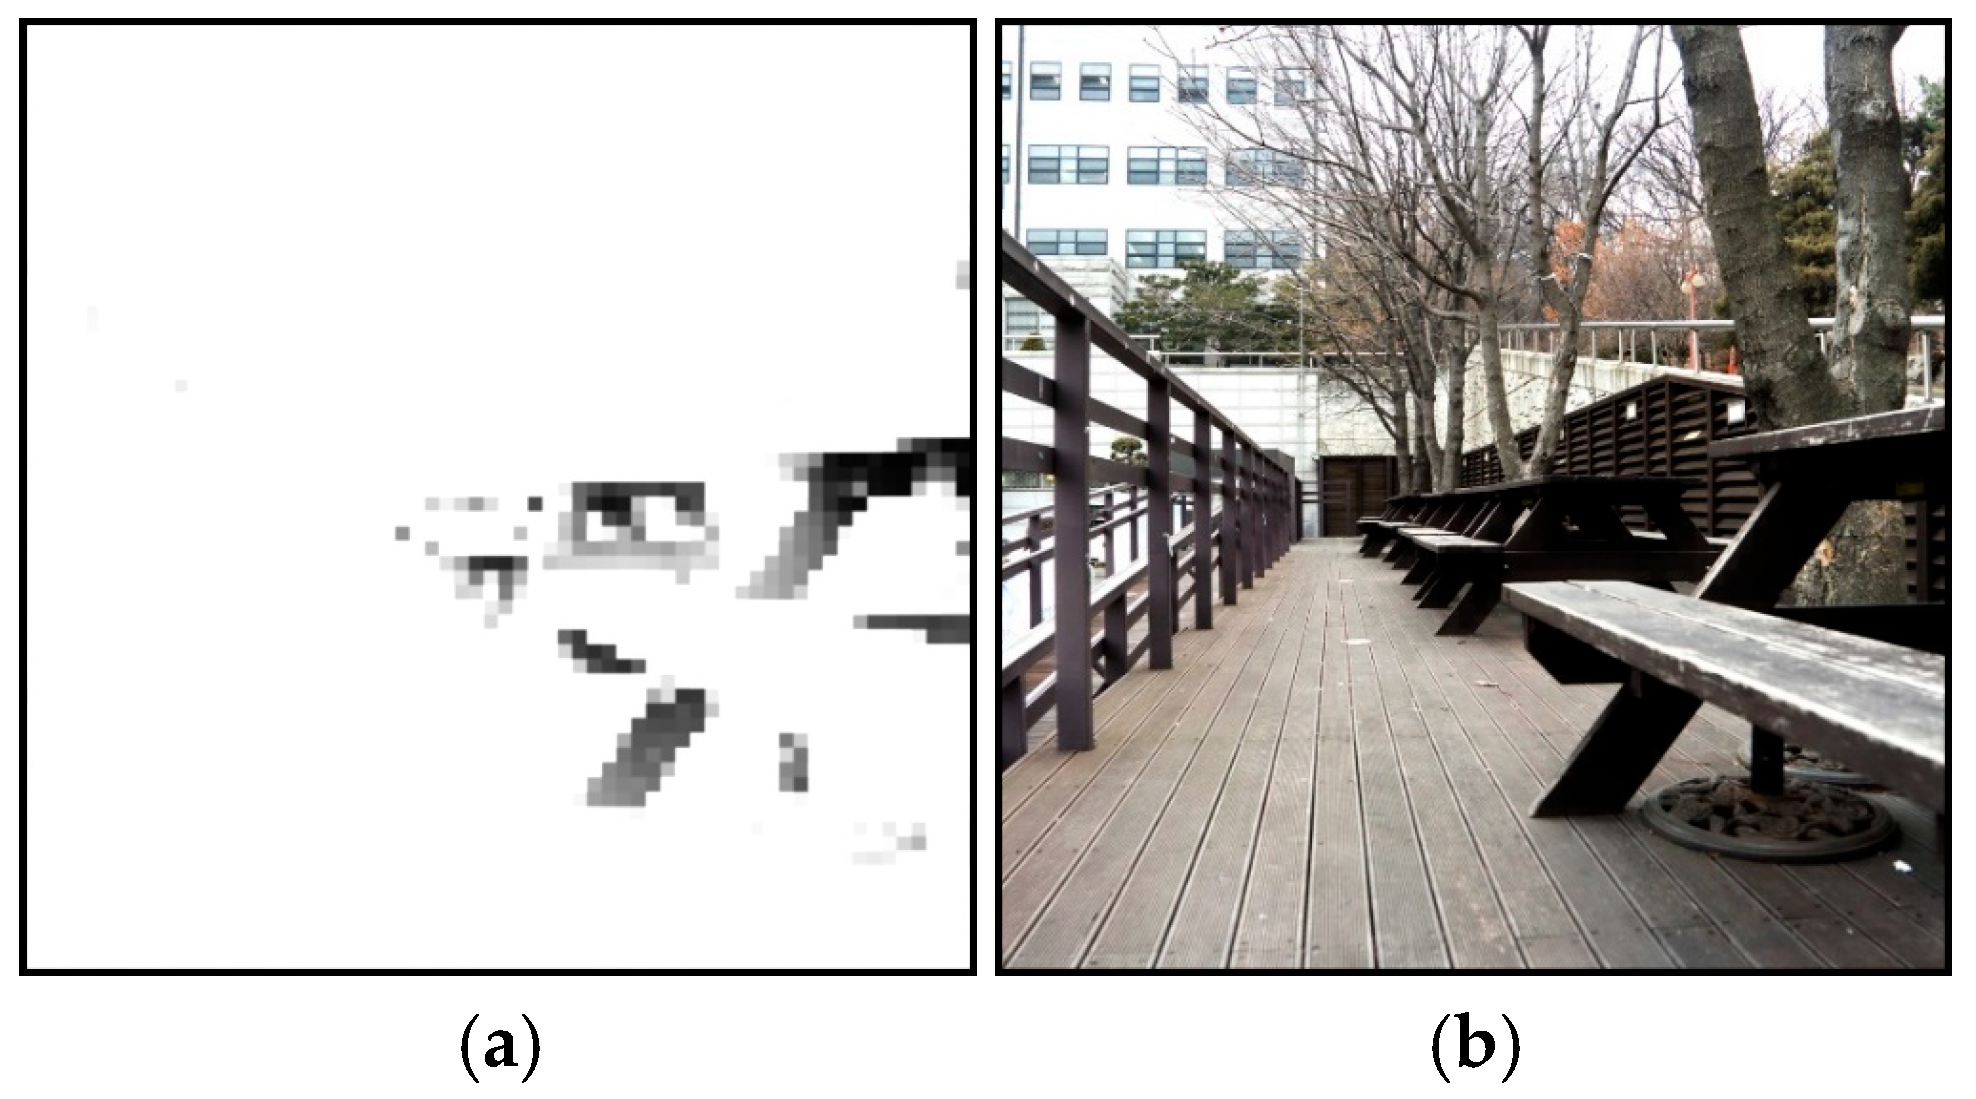
To quantitatively evaluate the performance of the proposed method, three quality indices, PSNR (peak signal-to-noise ratio), SSIM (Structural SIMilarity index), and CD (color difference), are adopted to compare with the global dimming method [50]. CD is calculated from the Euclidean distance of the a* and b* color components between the input and output images in the CIELAB color space. BLU (backlight unit) power refers to the power consumption of the backlight source, and this value is converted from the brightness of the corresponding pixels of the backlight source. GroundTruth stands for true value. Figure 20 shows four types of images used for comparing the performance between global dimming and local dimming.
The metric values calculated are listed in Table 4.
(1)
The higher the PSNR value, the lower the distortion and the better the image quality. Here, three PSNR values of the local dimming are higher than those of the global dimming method among the four image types. Only the PSNR value of image (b) using global dimming is higher than that of local dimming. However, local dimming can achieve more details than global dimming in image (b), which is an advantage for HDR images.
(2)
SSIM is an index used to measure the similarity of two images, especially to assess distortion during image compression or other applications of image processing. Unlike PSNR, SSIM considers the characteristics of the human visual system and is more reflective of the subjective perception of image quality by the human eye. Here, the SSIM values of the local dimming technique are closer to 1 than the global dimming method among the four image types.
(3)
CD is a measure used to describe the difference between two colors. It is usually calculated within a specific color space, such as the CIELAB color space. The smaller the value of the color difference, the more similar the two colors are. In this case, the CD values of the local dimming technique were slightly higher than those of the global dimming method among the four image types on average. The reason for this is that the contrast of the HDR image is increased by local dimming, which causes the color to change.
(4)
BLU Power refers to the power consumption of the backlight source, and the higher the value, the greater the power consumption. Here, the BLU values of local dimming are lower than those of the global dimming method among the four image types.
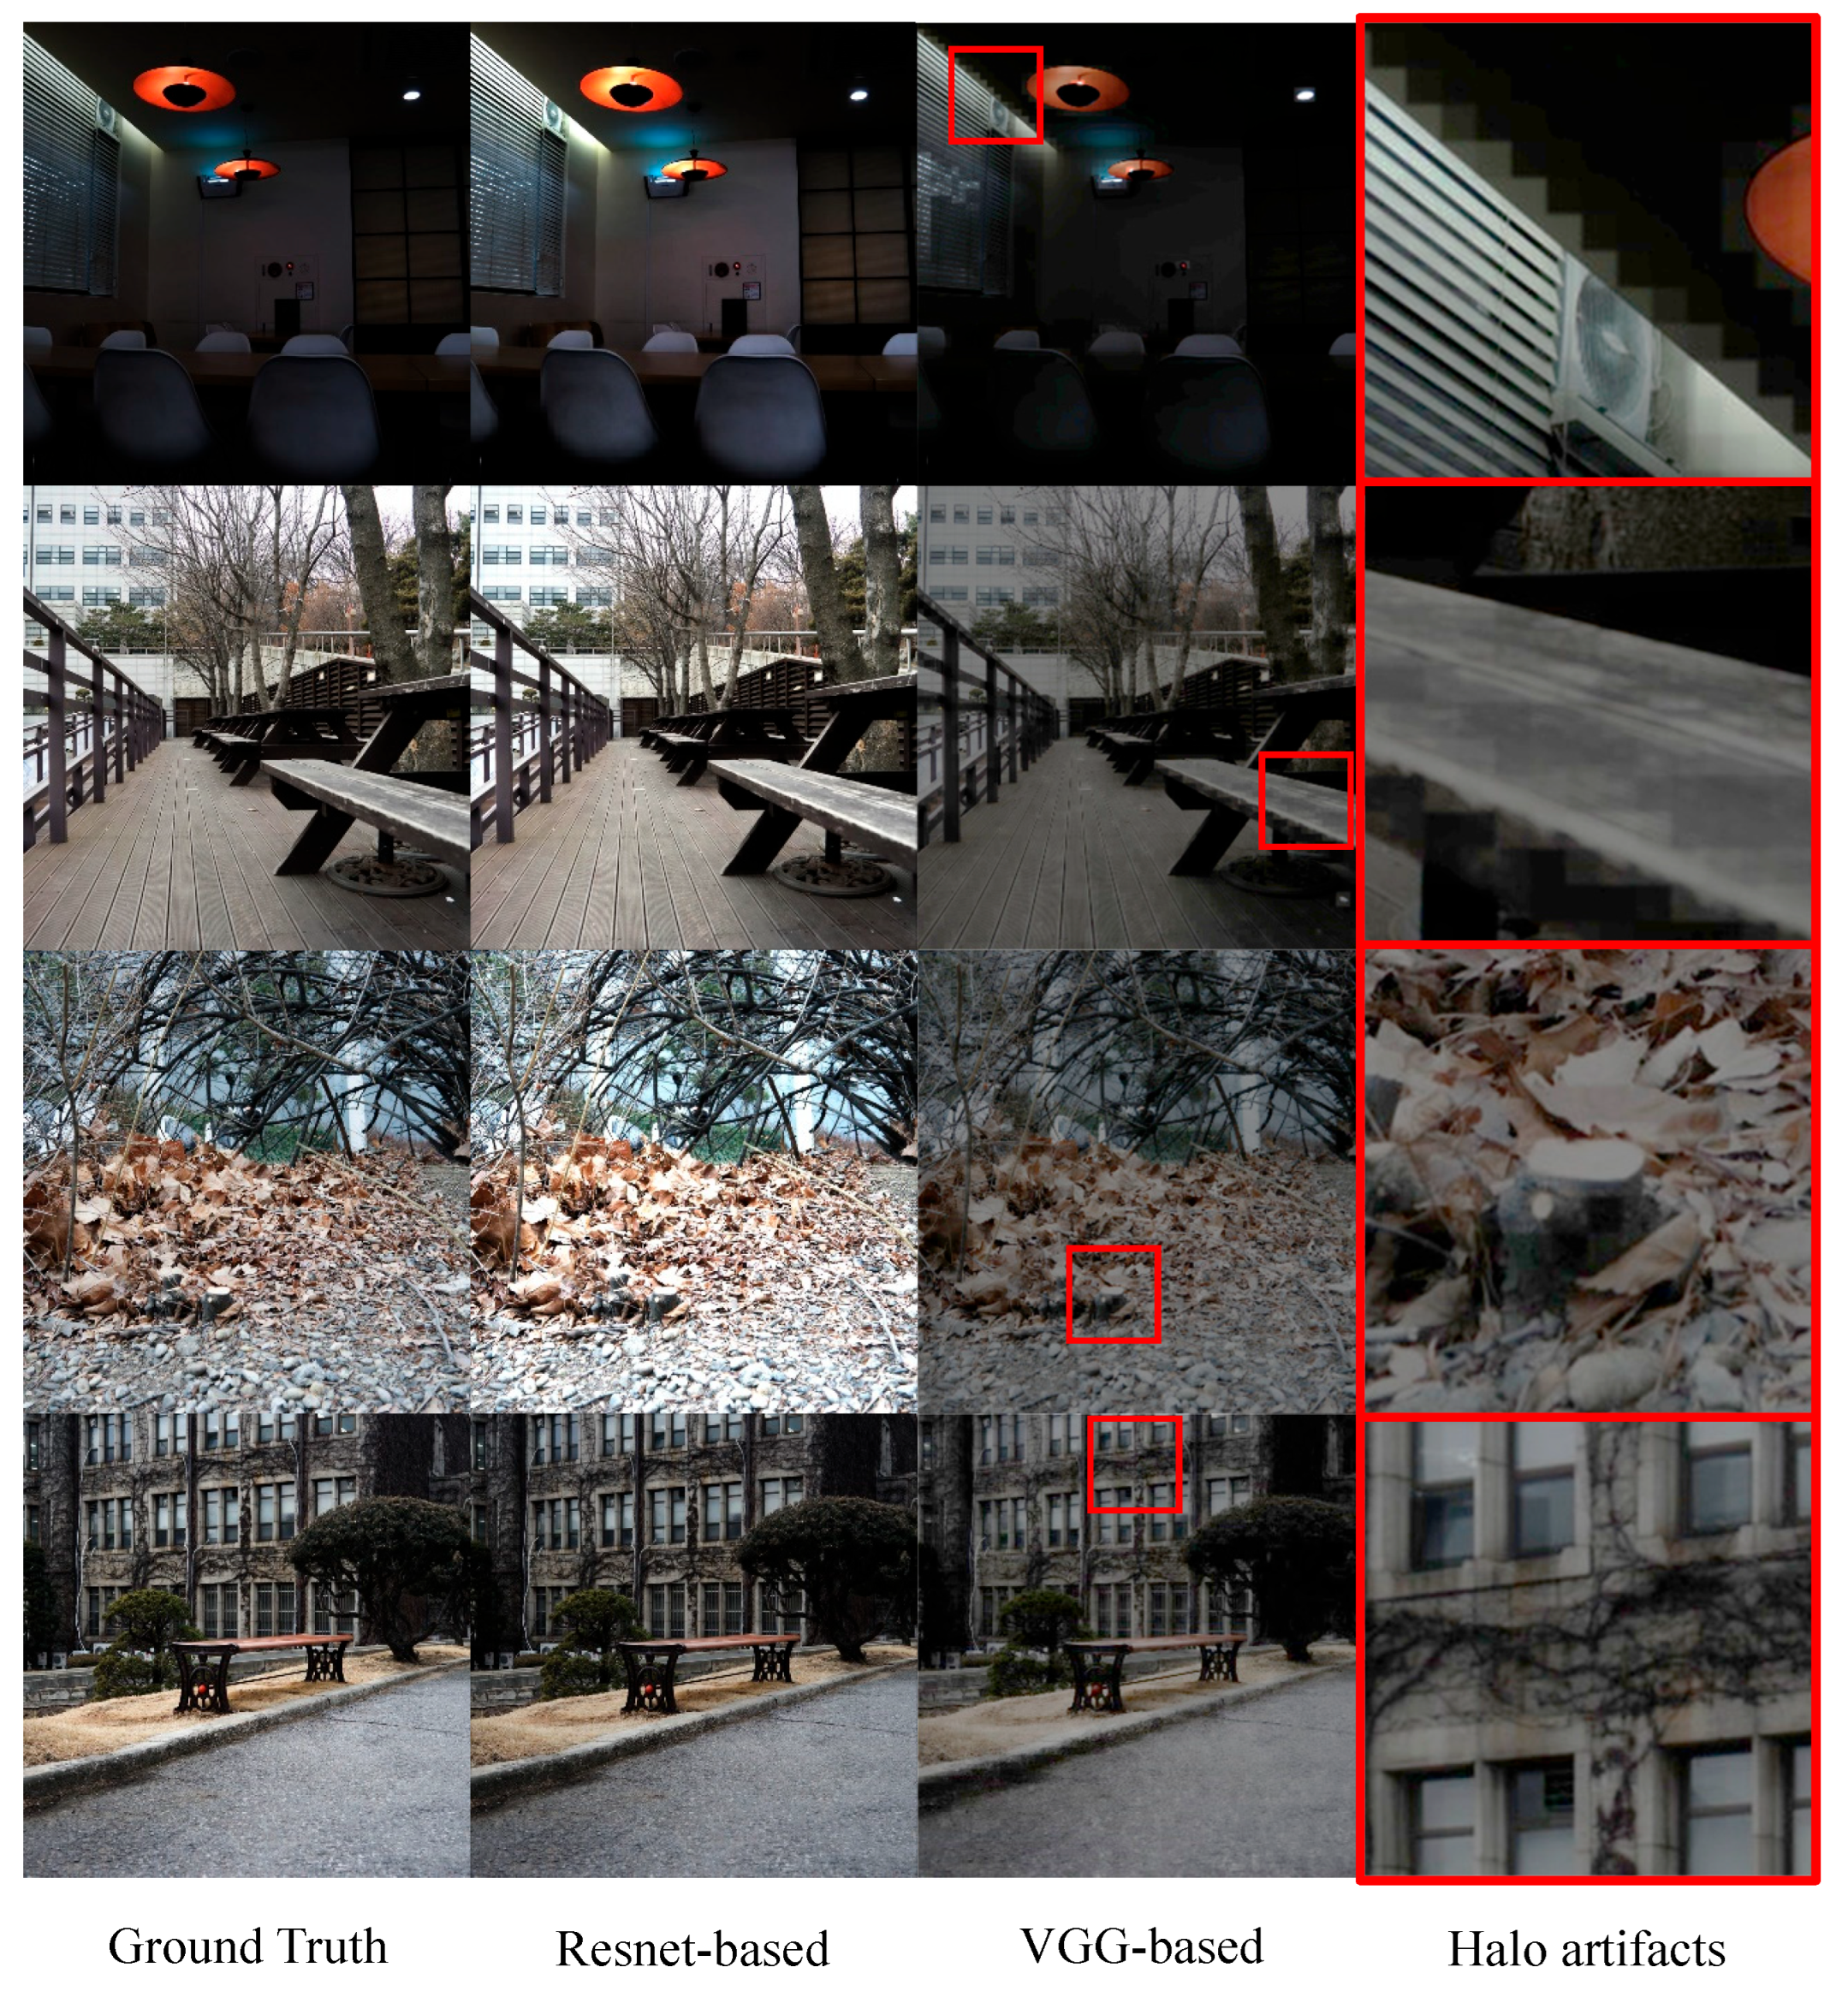
On the other hand, the Resnet-based Unet used in the experiment is compared with the VGG-based Unet. After training with the same dataset and data volume, it is found that the displayed image quality of the VGG-based Unet is inferior to that of the Resnet-based Unet, and there is a checkerboard-like halo shadow problem in the image (Figure 21). Table 5 lists the comparison results of similarity quality for the Resnet-based Unet and the VGG-based Unet. In summary, Resnet-based Unet performs better than VGG-based Unet in three similarity measures.
Furthermore, as can be seen from Figure 22, local dimming can improve the contrast of LCD images. And with the increase in the number of local blocks, the image contrast is also increased. In the past, the method of backlight local dimming using the threshold value was easy to produce a checkerboard-like halo artifact on the LCD image displayed. However, this problem can be effectively mitigated by using the approach of backlight local dimming generated by the deep model. In Figure 23, the area with a large brightness difference on the backlight image of local dimming and the LCD is shown and compared, and there is truly no checkerboard-like halo artifact present.

4.3. Discussion: Dataset Size and Generalization

Although the experimental results demonstrate the effectiveness of our proposed HDR reconstruction and local dimming framework, the relatively small size of the available training datasets may limit the generalization ability of the model. Specifically, the NTIRE 2021 dataset contains approximately 1500 image pairs, and the LDR-HDR-pair dataset includes only 176 pairs. These dataset sizes are considerably smaller than typical large-scale benchmarks used for training deep networks, which may constrain the robustness of the learned representations. To mitigate these limitations, extensive data augmentation strategies have been adopted during training, including random cropping, horizontal flipping, rotation, scaling, and color jittering. These operations increase the diversity of training samples and improve the ability of the model to generalize across different scenes. In addition, transfer learning from larger image datasets and the integration of multiple HDR-related datasets are potential future directions to further enhance model robustness. Overall, while our framework achieves competitive results under current training conditions, future work should focus on expanding the dataset scale and diversity to ensure stronger generalization across varied real-world scenarios.

4.4. Algorithm Complexity Analysis

To further evaluate the feasibility of deploying the proposed framework in real-time or embedded systems, we provide an analysis of both computational and memory complexity. Computational complexity is measured in floating-point operations (FLOPs), and the space complexity is represented by the total number of trainable parameters. For the ResNet-UNet variant of our model, the total number of parameters is approximately 12.4 M, with a corresponding computational complexity of 45.6 GFLOPs per 1080p image input. In comparison, the lighter VGG-UNet variant contains 9.1 M parameters and requires 32.7 GFLOPs under the same conditions.
In terms of memory requirements, both models can be trained on a single NVIDIA RTX 3090 GPU with 24 GB of memory, where the peak training memory usage is around 14 GB. During inference, memory consumption drops to below 4 GB, making the models suitable for mid-range GPUs. To assess practical feasibility, we also measured inference speed. On an RTX 3090 GPU, the ResNet-UNet variant achieves an average inference time of 38 ms per 1080p frame, equivalent to 26 frames per second (FPS). The VGG-UNet variant further reduces inference time to 25 ms per frame (40 FPS). While these speeds are acceptable for offline and some real-time scenarios, further optimization techniques such as model pruning, quantization, or lightweight backbone networks could improve efficiency for embedded devices.
These results indicate that the proposed framework is computationally more intensive than traditional local dimming algorithms but still feasible for deployment in high-performance systems. For deployment of embedded devices, further optimizations such as pruning, quantization, or efficient backbone substitution are necessary.

5. Conclusions

In this paper, we concentrate on the display performance of LCDs, especially the contrast ratio and power efficiency, both of which have also been the focus of industry and academia. The method of local dimming for direct-type backlight modules is investigated, and this is considered as a potential solution to improve LCD performance. The main goal of this study is to optimize the local dimming method of LCD through deep learning models to achieve higher contrast and lower power consumption. To solve this problem, a local dimming approach based on VGG19 and UNet models for LCD-LED dual-modulated display is proposed. This approach not only reconstructs the input LDR image into a HDR image but also automatically generates a control image of the backlight module and LCD panel. In addition, this study has successfully achieved the following objectives:
(1)
A software simulator for backlight modules is developed to reduce the cost of hardware modifications.
(2)
An algorithm is proposed to directly generate a corresponding HDR image from a single LDR image, overcoming the limitation that multiple exposure images cannot be obtained.
(3)
The deep learning method is used to generate the backlight module image and the LCD panel image, and the halo artifact is optimized and mitigated.
Through these techniques proposed, not only is the LCD contrast improved, but also the power consumption is successfully reduced, which proves the effectiveness of deep learning in optimizing the local dimming of the LCD. This lays a solid foundation for future research and application in this field, demonstrating the great potential of deep learning to improve display technology.
Nevertheless, several limitations of this study should be acknowledged. First, although the proposed method can effectively enhance image contrast, its performance in very dark regions still requires further improvement. Second, the datasets used (NTIRE 2021 and LDR-HDR-pair) are relatively limited in scale, which may constrain the generalization capability of the model. Third, the experiments were conducted using a software-based simulation platform without validation on an actual LCD hardware prototype, which may introduce uncertainties when applied in real-world systems. Moreover, the current model architecture, while effective, remains computationally intensive, posing challenges for real-time or embedded deployment.
To address these limitations, future research could explore more advanced masking techniques for preserving details in extremely dark and bright regions, expand or diversify the training datasets to improve robustness, and perform hardware-based validations on multi-zone backlight LCD panels. In addition, model compression and optimization strategies will be investigated to enhance efficiency and feasibility for real-time applications.
In the experiments, we noticed that the image processing of dark details when generating HDR images still needs to improve. Future directions can explore the masking operations for areas with insufficient brightness and saturated brightness to better preserve the dark and bright details in the image. For the applications of the backlight local dimming model, we should seek a dataset that is more suitable for model training and fine-tune the model parameters to find a simpler deep learning model with better simulation effects. This will help to shorten the time to generate local dimming images of backlight and ease the future problems in the field of backlight local dimming of videos.
Nevertheless, we acknowledge that the present study is based on a software simulation platform without direct validation on a physical LCD panel with multi-zone backlight hardware. Hardware validation is inherently challenging, as it requires dedicated equipment, customized driver circuits, and carefully controlled experimental conditions. In addition, the lack of widely accessible benchmark platforms for hardware testing makes direct comparison across different studies difficult. Since the focus of this work is on algorithmic innovation and reproducible software simulation, we leave the hardware implementation and benchmarking for the next stage of our research.
In our future work, comparisons with state-of-the-art approaches in the experiments will be performed to demonstrate the advantages of the proposed method. Also, we plan to extend the current framework toward hardware validation, particularly by collaborating with hardware developers to integrate the proposed approach into prototype LCD panels. Such validation will allow us to address possible performance discrepancies between simulated and real-world systems and to further assess practical issues such as response time, calibration accuracy, and integration with commercial backlight driving schemes.

Author Contributions

T.-L.C.: Conceptualization, methodology, and supervision. Y.-Y.S.: software and experiments, writing—original Chinese draft. P.-S.H.: data curation, visualization, writing—review and editing. All authors have read and agreed to the published version of the manuscript.

Funding

This research received no external funding.

Institutional Review Board Statement

Not applicable.

Informed Consent Statement

Not applicable.

Data Availability Statement

The datasets generated and/or analyzed during the current study are available from the corresponding author on reasonable request.

Acknowledgments

The authors would like to thank the editors and reviewers for their valuable work.

Conflicts of Interest

The authors declare no conflicts of interest to report regarding the present study.

References

  1. Kang, S.J. Image-quality-based power control technique for organic light emitting diode displays. J. Disp. Technol. 2015, 11, 104–109. [Google Scholar] [CrossRef]
  2. Wang, X.; Jang, C. Backlight scaled contrast enhancement for liquid crystal displays using image key-based compression. In Proceedings of the IEEE International Conference on Visual Communications and Image Processing (VCIP), Chengdu, China, 27–30 November 2016; pp. 1–4. [Google Scholar] [CrossRef]
  3. Zhang, T.; Wang, H.; Du, W.; Li, M. Deep CNN-based local dimming technology. Appl. Intell. 2022, 52, 903–915. [Google Scholar] [CrossRef]
  4. Liao, L.Y.; Chen, C.W.; Huang, Y.P. Local blinking HDR LCD systems for fast MPRT with high brightness LCDs. J. Disp. Technol. 2010, 6, 178–183. [Google Scholar] [CrossRef]
  5. Tan, G.; Huang, Y.; Li, M.C.; Lee, S.L.; Wu, S.T. High dynamic range liquid crystal displays with a mini-LED backlight. Opt. Express 2018, 26, 16572–16584. [Google Scholar] [CrossRef]
  6. Cho, H.; Kwon, O.K. A backlight dimming algorithm for low power and high image quality LCD applications. IEEE Trans. Consum. Electron. 2009, 55, 839–844. [Google Scholar] [CrossRef]
  7. Zhang, T.; Qi, W.; Zhao, X.; Yan, Y.; Cao, Y. A local dimming method based on improved multi-objective evolutionary algorithm. Expert Syst. Appl. 2022, 204, 117468. [Google Scholar] [CrossRef]
  8. Rahman, M.A.; You, J. Human visual sensitivity based optimal local backlight dimming methodologies under different viewing conditions. Displays 2023, 76, 102338. [Google Scholar] [CrossRef]
  9. Duan, L.; Marnerides, D.; Chalmers, A.; Lei, Z.; Debattista, K. Deep controllable backlight dimming. arXiv 2020, arXiv:2008.08352. [Google Scholar] [CrossRef]
  10. Chen, N.J.; Bai, Z.; Wang, Z.; Ji, H.; Liu, R.; Cao, C.; Wang, H.; Jiang, F.; Zhong, H. Low cost perovskite quantum dots film based wide color gamut backlight unit for LCD TVs. SID Symp. Dig. Tech. Pap. 2018, 49, 1657–1659. [Google Scholar] [CrossRef]
  11. Kunkel, T.; Spears, S.; Atkins, R.; Pruitt, T.; Daly, S. Characterizing high dynamic range display system properties in the context of today’s flexible ecosystems. SID Symp. Dig. Tech. Pap. 2016, 47, 880–883. [Google Scholar] [CrossRef]
  12. Zhang, T.; Wang, H.; Chen, Y.Z.; Liu, Q.; Li, M.; Lei, Z.C. A rapid local backlight dimming method for interlaced scanning video. J. Soc. Inf. Disp. 2018, 26, 438–446. [Google Scholar] [CrossRef]
  13. Huang, Y.; Hsiang, E.L.; Deng, M.Y.; Wu, S.T. Mini-LED, Micro-LED and OLED displays: Present status and future perspectives. Light Sci. Appl. 2020, 9, 105. [Google Scholar] [CrossRef]
  14. Zerman, E.; Valenzise, G.; Dufaux, F. A dual modulation algorithm for accurate reproduction of high dynamic range video. In Proceedings of the 2016 IEEE 12th Image, Video, and Multidimensional Signal Processing Workshop, Bordeaux, France, 11–12 July 2016; pp. 1–5. [Google Scholar] [CrossRef]
  15. Lin, F.C.; Huang, Y.P.; Liao, L.Y. Dynamic backlight gamma on high dynamic range LCD TVs. J. Disp. Technol. 2008, 4, 139–146. [Google Scholar] [CrossRef]
  16. Chen, J. Dynamic backlight signal extraction algorithm based on threshold of image CDF for LCD-TV and its hardware implementation. Chin. J. Liq. Cryst. Disp. 2010, 25, 449–453. [Google Scholar]
  17. Jo, J.; Soh, J.W.; Park, J.S.; Cho, N.I. Local backlight dimming for liquid crystal displays via convolutional neural network. In Proceedings of the Asia-Pacific Signal Information Processing Associate Annual Summit Conference (APSIPA ASC), Auckland, New Zealand, 7–10 December 2020; pp. 1067–1074. [Google Scholar]
  18. Hatchett, J.; Toffoli, D.; Melo, M.; Bessa, M.; Debattista, K.; Chalmers, A. Displaying detail in bright environments: A 10,000 nit display and its evaluation. Signal Process. Image Commun. 2019, 76, 125–134. [Google Scholar] [CrossRef]
  19. Gao, Z.; Ning, H.; Yao, R.; Xu, W.; Zou, W.; Guo, C.; Luo, D.; Xu, H.; Xiao, J. Mini-LED backlight technology progress for liquid crystal display. Crystals 2022, 12, 313. [Google Scholar] [CrossRef]
  20. Guha, A.; Nyboer, A.; Tiller, D.K. A review of illuminance mapping practices from HDR images and suggestions for exterior measurements. J. Illum. Eng. Soc. 2022, 19, 210–220. [Google Scholar] [CrossRef]
  21. Wang, L.; Yoon, K.J. Deep learning for HDR imaging: State-of-the-art and future trends. IEEE Trans. Pattern Anal. Mach. Intell. 2021, 44, 8874–8895. [Google Scholar] [CrossRef] [PubMed]
  22. Sun, N.; Mansour, H.; Ward, R. HDR image construction from multi-exposed stereo LDR images. In Proceeding of the 2010 IEEE International Conference on Image Processing, Hong Kong, China, 26–29 September 2010; pp. 2973–2976. [Google Scholar] [CrossRef]
  23. Park, W.J.; Ji, S.W.; Kang, S.J.; Jung, S.W.; Ko, S.J. Stereo vision-based high dynamic range imaging using differently-exposed image pair. Sensors 2017, 17, 1473. [Google Scholar] [CrossRef]
  24. Gupta, S.S.; Hossain, S.; Kim, K.-D. HDR-like image from pseudo-exposure image fusion: A genetic algorithm approach. IEEE Trans. Consum. Electron. 2021, 67, 119–128. [Google Scholar] [CrossRef]
  25. Luzardo, G.; Kumcu, A.; Aelterman, J.; Luong, H.; Ochoa, D.; Philips, W. A display-adaptive pipeline for dynamic range expansion of standard dynamic range video content. Appl. Sci. 2024, 14, 4081. [Google Scholar] [CrossRef]
  26. Niu, Y.; Wu, J.; Liu, W.; Guo, W.; Lau, R.W. HDR-GAN: HDR image reconstruction from multi-exposed LDR images with large motions. IEEE Trans. Image Process. 2021, 30, 3885–3896. [Google Scholar] [CrossRef] [PubMed]
  27. Chen, Y.; Jiang, G.; Yu, M.; Yang, Y.; Ho, Y.S. Learning stereo high dynamic range imaging from a pair of cameras with different exposure parameters. IEEE Trans. Comput. Imaging 2020, 6, 1044–1058. [Google Scholar] [CrossRef]
  28. Yan, Q.; Gong, D.; Shi, Q.; Hengel, A.V.D.; Shen, C.; Reid, I.; Zhang, Y. Attention-guided network for ghost-free high dynamic range imaging. In Proceedings of the IEEE Conference on Computer Vision and Pattern Recognition (CVPR), Long Beach, CA, USA, 15–20 June 2019; pp. 1751–1760. [Google Scholar] [CrossRef]
  29. Kalantari, N.K.; Ramamoorthi, R. Deep high dynamic range imaging of dynamic scenes. ACM Trans. Graph. 2017, 36, 144. [Google Scholar] [CrossRef]
  30. Singh, K.; Pandey, A.; Agarwal, A.; Agarwal, M.K.; Shankar, A.; Parihar, A.S. FRN: Fusion and recalibration network for low-light image enhancement. Multimed. Tools Appl. 2024, 83, 12235–12252. [Google Scholar] [CrossRef]
  31. Didyk, P.; Mantiuk, R.; Hein, M.; Seidel, H.P. Enhancement of bright video features for HDR displays. Comput. Graph. Forum 2008, 27, 1265–1274. [Google Scholar] [CrossRef]
  32. Huo, Y.; Yang, F.; Dong, L.; Brost, V. Physiological inverse tone mapping based on retina response. Vis. Comput. 2014, 30, 507–517. [Google Scholar] [CrossRef]
  33. Wang, T.H.; Chiu, C.W.; Wu, W.C.; Wang, J.W.; Lin, C.Y.; Chiu, C.T.; Liou, J.J. Pseudo-multiple-exposure-based tone fusion with local region adjustment. IEEE Trans. Multimed. 2015, 17, 470–484. [Google Scholar] [CrossRef]
  34. Lu, K.; Zhang, L. TBEFN: A two-branch exposure-fusion network for low-light image enhancement. IEEE Trans. Multimed. 2020, 23, 4093–4105. [Google Scholar] [CrossRef]
  35. Li, R.; Wang, C.; Wang, J.; Liu, G.; Zhang, H.Y.; Zeng, B.; Liu, S. Uphdr-gan: Generative adversarial network for high dynamic range imaging with unpaired data. IEEE Trans. Circuits Syst. Video Technol. 2022, 32, 7532–7546. [Google Scholar] [CrossRef]
  36. Liu, Y.L.; Lai, W.S.; Chen, Y.S.; Kao, Y.L.; Yang, M.H.; Chuang, Y.Y.; Huang, J.B. Single-image HDR reconstruction by learning to reverse the camera pipeline. In Proceedings of the IEEE/CVF Conference on Computer Vision and Pattern Recognition, Seattle, WA, USA, 13–19 June 2020; pp. 1651–1660. [Google Scholar] [CrossRef]
  37. Chen, X.; Liu, Y.; Zhang, Z.; Qiao, Y.; Dong, C. Hdrunet: Single image HDR reconstruction with denoising and dequantization. In Proceedings of the IEEE/CVF Conference on Computer Vision and Pattern Recognition, Seattle, WA, USA, 13–19 June 2021; pp. 354–363. [Google Scholar] [CrossRef]
  38. Sharif, S.M.; Naqvi, R.A.; Biswas, M.; Kim, S. A two-stage deep network for high dynamic range image reconstruction. In Proceedings of the IEEE/CVF Conference on Computer Vision and Pattern Recognition, Seattle, WA, USA, 13–19 June 2021; pp. 550–559. [Google Scholar] [CrossRef]
  39. Wu, G.; Song, R.; Zhang, M.; Li, X.; Rosin, P.L. LiTMNet: A deep CNN for efficient HDR image reconstruction from a single LDR image. Pattern Recognit. 2022, 127, 108620. [Google Scholar] [CrossRef]
  40. Lecouat, B.; Eboli, T.; Ponce, J.; Mairal, J. High dynamic range and super-resolution from raw image bursts. ACM Trans. Graph. 2022, 41, 1–21. [Google Scholar] [CrossRef]
  41. Lee, S.; Jo, S.Y.; An, G.H.; Kang, S.J. Learning to generate multi-exposure stacks with cycle consistency for high dynamic range imaging. IEEE Trans. Multimed. 2020, 23, 2561–2574. [Google Scholar] [CrossRef]
  42. de Paiva, J.F.; Mafalda, S.M.; Leher, Q.O.; Alvarez, A.B. DDPM-Based Inpainting for Ghosting Artifact Removal in High Dynamic Range Image Reconstruction. In Proceedings of the 9th International Conference on Image, Vision and Computing (ICIVC), Suzhou, China, 15–17 July 2024; pp. 28–33. [Google Scholar] [CrossRef]
  43. Santos, M.S.; Ren, T.I.; Kalantari, N.K. Single image HDR reconstruction using a CNN with masked features and perceptual loss. ACM Trans. Graph. 2020, 39, 80. [Google Scholar] [CrossRef]
  44. Gatys, L.A.; Ecker, A.S.; Bethge, M. Image style transfer using convolutional neural networks. In Proceedings of the IEEE Conference on Computer Vision and Pattern Recognition (CVPR), Las Vegas, NV, USA, 27–30 June 2016; pp. 2414–2423. [Google Scholar] [CrossRef]
  45. Sreeram, V.; Agathoklis, P. On the properties of Gram matrix. IEEE Trans. Circuits Syst. I Fundam. Theory Appl. 1994, 41, 234–237. [Google Scholar] [CrossRef]
  46. Trending Papers of Hugging Face. Available online: https://huggingface.co/papers/trending (accessed on 31 August 2025).
  47. Jang, H.; Bang, K.; Jang, J.; Hwang, D. Dynamic range expansion using cumulative histogram learning for high dynamic range image generation. IEEE Access 2020, 8, 38554–38567. [Google Scholar] [CrossRef]
  48. Duan, L.; Marnerides, D.; Chalmers, A.; Lei, Z.; Debattista, K. Deep controllable backlight dimming for HDR displays. IEEE Trans. Consum. Electron. 2022, 68, 191–199. [Google Scholar] [CrossRef]
  49. He, K.; Zhang, X.; Ren, S.; Sun, J. Deep residual learning for image recognition. In Proceedings of the IEEE Conference on Computer Vision and Pattern Recognition, Las Vegas, NV, USA, 27–30 June 2016; pp. 770–778. [Google Scholar] [CrossRef]
  50. Song, S.; Kim, Y.I.; Bae, J.; Nam, H. Deep-learning-based pixel compensation algorithm for local dimming liquid crystal displays of quantum-dot backlights. Opt. Express 2019, 27, 15907–15917. [Google Scholar] [CrossRef] [PubMed]
Figure 1. Two types of backlight sources for liquid crystal display (LCD) panels. (a) Traditional global dimming, in which the backlight unit (BLU) illuminates the entire LCD uniformly, often leading to high power consumption and low contrast. (b) Local dimming, also called Full Array Local Dimming (FALD), where the BLU is divided into independently controlled zones, allowing better contrast and reduced power consumption.
Information 16 00815 g001
Figure 2. System architecture.
Information 16 00815 g002
Figure 3. Model of HDR image reconstruction.
Information 16 00815 g003
Figure 4. Feature map generation module.
Information 16 00815 g004
Figure 5. Model structure (The HDR images are generated from the RGB LDR images by the model, and a feature masking module is used in each convolutional layer).
Information 16 00815 g005
Figure 6. Exemplary images in the NTIRE 2021 dataset. (a) Overexposed LDR image; (b) HDR image corresponding to (a); (c) underexposed LDR image; (d) HDR image corresponding to (c).
Information 16 00815 g006
Figure 7. Four exemplary images including the HDR image and images with different exposures in the training set of LDR-HDR-pair Dataset.
Information 16 00815 g007
Figure 8. Deep model structure of DBLD.
Information 16 00815 g008
Figure 9. U-net structure.
Information 16 00815 g009
Figure 10. Display results of output images on various network layers of the proposed HDR (High Dynamic Range) image reconstruction network. Different masks are applied to the input LDR (Low Dynamic Range) image to suppress saturated pixels. The progressive effect across layers illustrates how the feature-masking strategy helps recover details in overexposed regions.
Information 16 00815 g010
Figure 11. LDR image with the corresponding initial masking. The first two images in the first column are dark images in the room, and the last two images are bright images in the room. The second column is an outdoor daytime image; the third column is an outdoor nighttime image.
Information 16 00815 g011
Figure 12. Every image pair shows the original LDR image (left) and the HDR image generated at different ambient brightness (right).
Information 16 00815 g012
Figure 13. Comparisons of the input LDR image, the output generated HDR image, and the ground truth HDR image (Red and green squares are used to show the changes of corresponding blocks).
Information 16 00815 g013
Figure 14. Simulated backlight images with partial dimming under different LED array sizes: (a) Global dimming; (b) 8 × 8 array; (c) 16 × 16 array; (d) 32 × 32 array; (e) 64 × 64 array.
Information 16 00815 g014
Figure 15. Output images from the process flow: IHDR (input); Y (image brightness); D B L (local dimming of backlight); I ^ H D R (LCD image).
Information 16 00815 g015
Figure 16. Local area comparison of I H D R (input HDR image) and I ^ H D R (LCD image): (a) local area of I H D R image; (b) local area of I ^ H D R image. (Red and green squares are used to show the changes of corresponding blocks).
Information 16 00815 g016
Figure 17. Images and corresponding Cumulative Distribution Function (CDF) curves for objective experiments: (a) dark background image; (b) low-brightness images; (c) high-contrast images; (d) high-brightness images; and (e) CDF curves of the images.
Information 16 00815 g017
Figure 18. Backlight image displays with global dimming and different levels of local dimming: (a) Building at night; (b) The tree at night; (c) Building in the dusk; and (d) Outdoor scene.
Information 16 00815 g018
Figure 19. The effect of HDR images shown in dark blocks.
Information 16 00815 g019
Figure 20. Four types of images used for comparing the performance between global dimming and local dimming: (a) Outdoor scene with a bench; (b) Indoor scene; (c) The tree at night; and (d) Day scene outside a building.
Information 16 00815 g020
Figure 21. The display results based on different deep models. (Each large red square is used to show the details of the small red square).
Information 16 00815 g021
Figure 22. The image contrast affected by the number of different local dimming blocks.
Information 16 00815 g022
Figure 23. (a) Backlight image of local dimming; (b) LCD image; areas with large brightness differences in the backlight panel are displayed on the LCD panel without halo artifacts.
Information 16 00815 g023
Table 1. Literature classification of HDR image reconstruction.
Non-Learning-Based MethodLearning-Based Method
Multiple LDR Images[22] (2010)
[23] (2017)
[24] (2021)
[25] (2024)
[26] (2021), [27] (2020)
[28] (2019), [29] (2017)
[30] (2024)
Single LDR Image[31] (2008)
[32] (2014)
[33] (2015)
[34] (2020)
[35] (2022), [36] (2020)
[37] (2021), [38] (2021)
[39] (2022), [40] (2022)
[41] (2020), [42] (2024)
Table 2. Hyperparameter settings.
Hyperparameter NameValue Settings
OptimizerAdam, initial learning rate 1 × 10⁻⁴, decay factor 0.5 every 20 epochs
Batch size16
Epochs200
Network channels[64, 128, 256, 512, 1024] in encoder, symmetric decoder
Feature mask thresholdt = 0.8
Loss weightsα1 = 1.0, α2 = 0.1, α3 = 0.2, α4 = 0.05
Luminance regularizationβ = 0.01
PSF kernel sizeWg = 15, Hg = 15
Table 3. Comparison between MSE and HDRVDP-2.
Method (Mask + Pre-Training)MSEHDR-VDP-2
SConv + HDR pre-training0.040258.43
SConv + Inp. pre-training0.037460.03
GConv + HDR pre-training0.039853.32
GConv + Inp. pre-training0.101743.13
IMask + HDR pre-training0.039858.39
IMask + Inp. pre-training0.036961.27
FMask + HDR pre-training0.039358.81
FMask + Inp. pre-training (Our method)0.035663.18
Table 4. Quality comparison of similarity to ground truth image using global and local dimming.
ImageMethodPSNRSSIMColor DistortionBLU
(a)Global dimming27.940.810.0841.54
Local dimming29.440.910.1720.09
(b)Global dimming32.380.880.07119.24
Local dimming29.430.960.0778.93
(c)Global dimming30.560.860.13113.36
Local dimming30.740.860.1656.75
(d)Global dimming27.890.770.1032.15
Local dimming28.620.940.1228.67
Table 5. Similarity quality comparison results of the Resnet-based Unet and the VGG-based Unet.
SimilarityAverage PSNRAverage SSIMAverage Color Distortion (CIE76)
Model
Resnet29.50 dB0.877.53
VGG28.36 dB0.289.39
Disclaimer/Publisher’s Note: The statements, opinions and data contained in all publications are solely those of the individual author(s) and contributor(s) and not of MDPI and/or the editor(s). MDPI and/or the editor(s) disclaim responsibility for any injury to people or property resulting from any ideas, methods, instructions or products referred to in the content.